
Inflation, the Tanker and the Server: How the Economy Carries a War Premium
The CAVU Compass
Inflation, the Tanker and the Server
How the Economy Carries a War Premium
Inflation owns the headlines, but growth is the story. The cyclical rebound is broadening beyond AI. With the economy at full employment, the next Fed move is a hike, but well out into 2027 or beyond.
The cyclical rebound is real and broadening well beyond AI. ISM Manufacturing rose to 54.0 in May, a four-year high, with new orders at 56.8 and all six of the largest manufacturing industries expanding. Nondefense capital goods orders excluding aircraft surged 24.2% in April. Unfilled orders are up twenty-one of the last twenty-two months. The manufacturing recession of 2024-2025 is over. This cyclical inflection point is the foundation of our above-consensus 2.5% full-year U.S. growth call, well ahead of the World Bank’s 2.2%.
172k payrolls against a breakeven rate near zero — the labor market is at full employment. May payrolls of 172,000 beat the 80,000 consensus, with March and April revised up by a combined 93,000. Unemployment held at 4.3%. Voluntary attrition has slowed to unprecedented lows. Critically, Fed staff research estimates the labor force is growing by fewer than 10,000 workers per month, a pace without precedent in 65 years. Breakeven payrolls have collapsed toward zero, meaning May’s 172k vastly overshoots what’s needed to keep unemployment steady. Growth accelerating into a labor market this tight is the textbook dynamic that forces a central bank’s hand.
Inflation owns the headlines, but the underlying breadth is moderating. Headline CPI rose 0.5% on the month and 4.2% year over year in May, a three-year high. Energy accounted for better than 60% of the gain. Strip out the war and core rose only 0.2%, the mildest reading in months, with core goods actually falling. The Cleveland Fed median and 16% trimmed-mean CPI both eased to 0.3% m/m from 0.4% in April — the very gauges Chairman Warsh emphasized in confirmation testimony. The tariff pass-through that many braced for is not showing up at the register. So while the headline is loud, the underlying signal is still moderating.
PPI shows producer-price pressures that are real but not the spiral the headline suggests. Wholesale prices rose 1.1% on the month and 6.5% year over year, the steepest annual climb since late 2022, with goods posting their largest monthly gain on record. Diesel lifted freight and fertilizer ran up sharply. Core goods climbed above 5% as memory chips and electronics tightened on AI demand. The war piece will ease when tankers move. The technology piece reflects a building boom largely financed by private capital and rewarded by generous public valuations — the kind of price pressure that comes from real demand, not from a wage-price feedback loop. The pass-through to consumers will be limited by sluggish income growth.
Most see the Fed forced to hike by inflation. We see growth into full employment driving the next move — a hike, well out 2027 or beyond. Chairman Warsh chairs his first FOMC on June 16-17 and will hold. The growing consensus sees the next Fed move as a hike because inflation is running so far above the 2% target. We agree on the direction but for a different and more durable reason: inflation is moderating beneath the headline, while growth is accelerating into a labor market already at full employment. That dynamic, not the war-driven price spike, is what ultimately forces the Fed’s hand, as the labor market strengthens off its full employment base. The move comes well out into late 2027 or 2028. We may have to stand alone on this distinction.
Our scenario probabilities: 60 / 20 / 20. Base Case (60%): the June 14 agreement holds and Hormuz traffic normalizes under the framework, the cyclical broadening sustains, Brent settles near $80 by year-end as inventory restocking firms the floor, trimmed CPI gauges ease, the Warsh Fed holds with a tightening lean. The 10-Year holds near 4.40% with 4.70% upside on term-premium pressure. Benign (20%): faster reopening, Brent toward $70, the cyclical pickup runs even hotter. Adverse (20%): the deal unravels or a fresh incident reshuts the strait, Brent back above $110, the Fed is pinned between war-driven inflation and the cyclical rebound.
Market Snapshot
| Indicator | Level | Context |
|---|---|---|
| Brent Crude | ~$86 / bbl | Off ~25% from the March peak; the June 14 reopening agreement points lower still, with our base case near $80 by year-end as restocking firms the floor |
| 10-Year Treasury | ~4.55% | Sticky on deficit, heavy issuance, and a term premium near 0.70%; consensus looks for drift lower, we see less room |
| 30-Year Fixed Mortgage | ~6.55% | Holding above 6.5% on the 10-Year level and a wider MBS spread; cooler-for-longer for housing |
| Fed Funds Target | 3.50–3.75% | Hold expected June 17; the dot plot is the focus; next move a hike, well out 2027/2028 |
| ECB Deposit Rate | 2.25% | Hiked 25 bp June 11, the first major central bank to tighten into the war’s inflation; more may follow |
| PCC Full-Year U.S. GDP | 2.5% | Capital spending and resilient services consumption leading; risks roughly balanced |
| May Payrolls | +172k | Beat 80k consensus; March/April revised up 93k combined; unemployment 4.3% |
| Headline CPI (May) | 4.2% YoY | Three-year high; energy drove >60% of the gain; gasoline +40% YoY |
| Core CPI (May) | 2.9% YoY | Down from 3.1% in April; underlying trend resumed its drift lower |
| Headline PPI (May) | 6.5% YoY | Steepest annual climb since late 2022; AI hardware now a second engine alongside oil |
| EUR/USD | ~1.158 | ECB hike priced in advance; rate gap narrowed but dollar firm on safety bid |
| World Bank 2026 Global | 2.5% | Cut from 2.7% in April; the weakest since the pandemic |
| World Bank 2026 U.S. | 2.2% | Held in place; far ahead of euro area at 0.5% and Japan at 0.4% |
| Q1 S&P 500 Net Margin | 14.7% | Record since FactSet began tracking in 2009; Q2 estimated 14.1%; FY estimated 13.9% |
Sources: BLS, BEA, EIA, AAA, CME Group, Freddie Mac, ECB, Federal Reserve Board, FactSet, World Bank. As of close Friday June 12, 2026.
“The hiring rebound reflects genuine strength, while the inflation spike is essentially an imported tax. The way to deal with a supply shock is to allow supply to increase, not to raise rates and implement a slowdown the economy does not need. The capital cycle is too valuable to break to fight a price impulse monetary policy did not cause.”
— Mark P. Vitner, Chief Economist, Piedmont Crescent Capital
The Macro Backdrop: A Capital Cycle That Compounds
Three threads ran through the past month and frame the June outlook. Inflation reports owned the headlines, with the May CPI print at 4.2% the loudest single number; but the trimmed gauges actually eased. The labor market ran hotter than nearly anyone expected, with payrolls well above breakeven against a labor force that is barely growing.
The war piece of the economy is beginning to take a back seat to the cyclical piece. On June 14 the United States and Iran reached an agreement that calls for a ceasefire on all fronts, a toll-free reopening of the Strait of Hormuz, and the lifting of the U.S. naval blockade, with a signing set for June 19 in Switzerland and a sixty-day window after that to take up sanctions relief and the nuclear file. The terms are not yet public, Iran has signaled it may still levy fees despite the toll-free language, and an open strait under continued Iranian management is not a clean return to the pre-war status quo, so we treat the deal as a genuine de-escalation rather than a settled peace.
The May ISM Manufacturing print rose to a four-year high of 54.0, new orders to 56.8, with all six of the largest manufacturing industries expanding. Nondefense capital goods orders surged 24.2% in April. Unfilled orders are up twenty-one of the last twenty-two months. The manufacturing recession of 2024-2025 is over, and the cyclical rebound is broadening well beyond AI. The economy beyond the war’s price shocks is strengthening, not weakening, and the next Fed move is ultimately a function of that, not of the inflation headline.
Our 2.5% full-year U.S. real GDP forecast sits on the constructive end of the Wall Street consensus, which has clustered in a 1.8% to 2.4% range, with most majors raising their numbers through May and June. The Atlanta Fed’s GDPNow is tracking Q2 at 3.1% as of mid-June, the upside marker. The World Bank cut its 2026 global growth forecast to 2.5%, the weakest reading since the pandemic, with the euro area barely positive and Japan softer still, while holding the U.S. at 2.2%. The war is a tax on everyone. The American economy, with its outsized energy sector, its 100% bonus depreciation restored under OBBBA, deep capital markets and riding the largest single capex cycle in a generation, is simply better built to pay it, sustaining growth throughout the war and setting up the second half of 2026 for stronger growth.
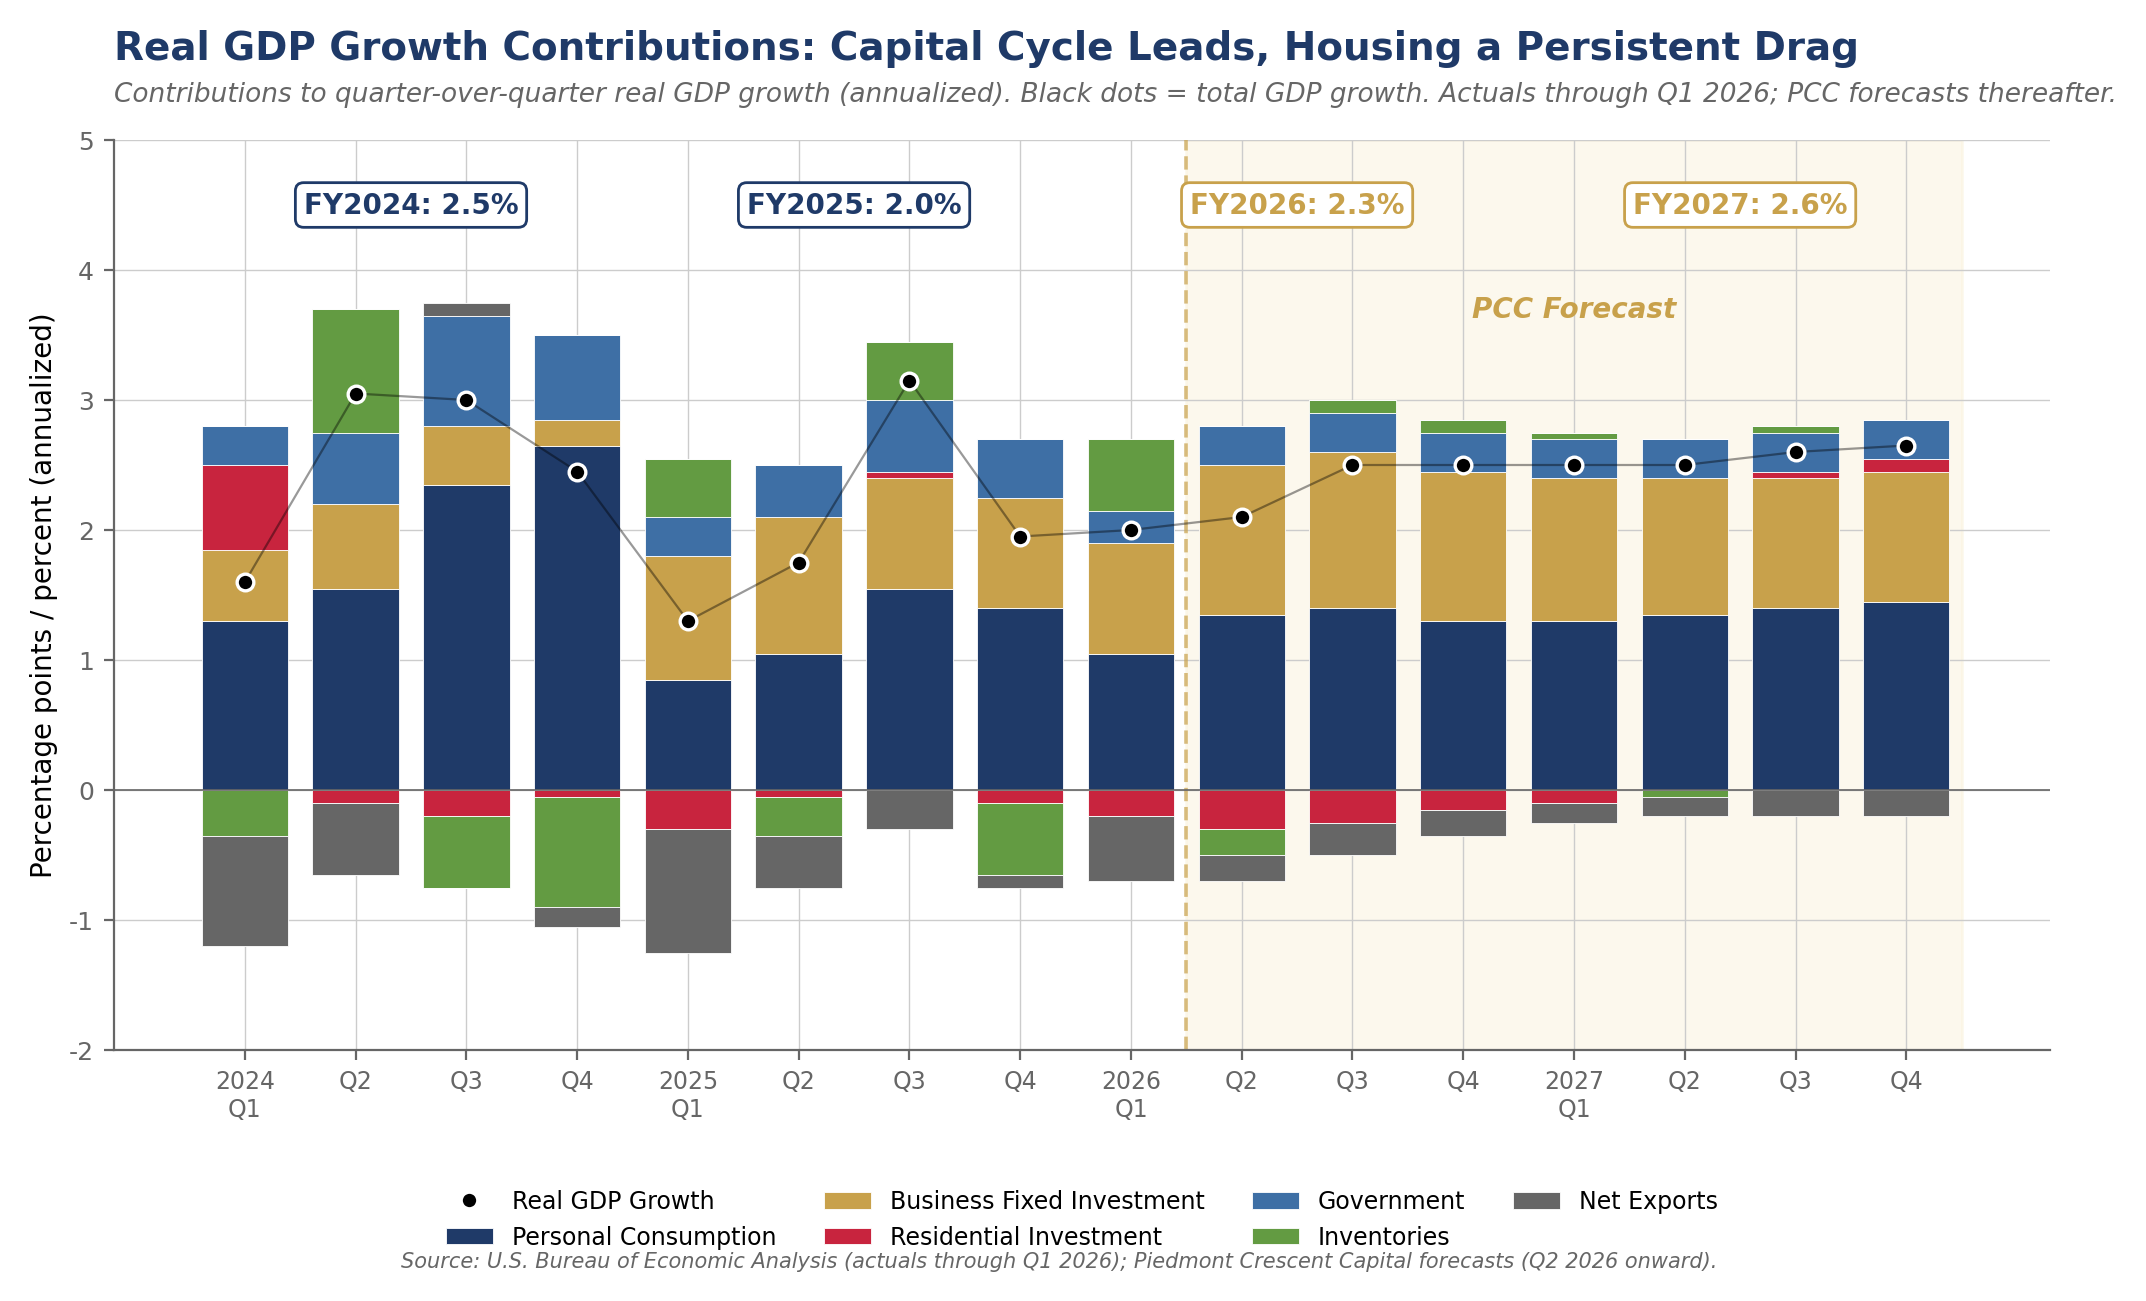
The Consumer: Squeezed but Cushioned, with Rate-Sensitive Sectors Lagging
Real hourly pay slipped again in May as prices outran wages, and two-thirds of Americans now call inflation a very big problem. The personal savings rate has slipped to roughly 3.5% from 4.5% a year ago. The New York Fed’s Q1 2026 Household Debt and Credit Report showed 4.8% of outstanding balances in some stage of delinquency, with credit card delinquencies at 2.92%. These are real signs of stress, but they reflect a stretched lower-income consumer pressed against still-elevated rates and a war-driven energy bill, not the early stages of a broad downturn.
Aggregate consumer spending continues to grow. Bank of America’s internal card data through May shows discretionary spending ex-gasoline still growing roughly 3% year over year. Household equity wealth sits near records as the S&P 500 grinds higher on earnings. The K-shape we have described for two years is showing in two distinct ways: a sturdy upper-half consumer doing the heavy lifting in spending, and a set of rate-sensitive sectors — housing, light vehicles, and other consumer durables — not yet participating in the broader cyclical pickup. We read those laggards as the next leg of the recovery rather than a warning sign. They turn when the war premium fades from the curve and discretionary purchasing power recovers, which only tightens the labor market further. We expect consumer spending of about 2.1% for the full year, slower than 2025 but firmer than the global consumer.
Business Fixed Investment and Corporate Profits
The strongest single endorsement of the capital-cycle thesis comes from the firms financing it. Q1 2026 S&P 500 earnings closed with blended growth of 15.1% year over year, the sixth consecutive quarter of double digits, and the blended net profit margin set a record 14.7%, the highest reading since FactSet began tracking in 2009. Analysts project Q2 margins at 14.1% and a full-year 2026 margin of 13.9%, also a record on an annual basis.
The composition of investment underneath is the more interesting story. Hyperscalers will spend roughly $725 billion on AI infrastructure this year alone, a 69% year-over-year increase, with Morgan Stanley putting the global AI infrastructure figure closer to $740 billion. But the cycle is broadening well beyond data centers. April’s 24.2% jump in nondefense capital goods orders excluding aircraft was the broadest single-month surge outside the pandemic, with strength in machinery, electrical equipment, fabricated metals, and primary metals. The OBBBA’s restoration of 100% bonus depreciation, effective January 2026, has unleashed wait-and-see capex that had been pent up in the high-rate years. Boeing is climbing back toward full production, the defense base is replenishing depleted stocks on multiyear contracts, the Space economy is in full force, and reshoring of pharma, steel, and semiconductors is adding plant and payroll in places that had spent a generation losing both. The server drives power demand, power demand drives the grid, and the grid and the data center together drive the wellhead. What looks like a technology story is better understood as a broad re-industrialization.
Send the hosted PNG URL and I’ll wire it here.
Caption ready: “Chart 3. S&P 500 quarterly net profit margin, Q1 2009 through Q1 2026, plus FactSet estimates for Q2–Q4 2026. Q1 record at 14.7%; Q2 estimated at 14.1%; full-year estimated at 13.9%. Source: FactSet Earnings Insight.”
The Labor Market: Firm, with a World Cup Asterisk
Employers added 172,000 jobs in May, more than double the 80,000 consensus, with March and April revised up by a combined 93,000. Unemployment held at 4.3%. Average hourly earnings rose 0.3% on the month and 3.8% year over year, slightly above headline core inflation. The level of payrolls is impressive, but the breakeven dynamic underneath matters more. Fed staff research published this spring estimates that the labor force is now growing by fewer than 10,000 workers per month — a pace without precedent in 65 years — as demographics and a sharp reversal in immigration both work against supply. With breakeven payrolls near zero, a 172,000 monthly print does not just keep unemployment steady. It tightens an already-tight market. Voluntary attrition has slowed to unprecedented lows, which reduces the need to hire and likely lifts productivity. The headline 4.3% unemployment rate, by the Fed’s own measures, is below most estimates of full employment. The broader U-6 reading at 8.1% is higher than U-3 always is, but it has not moved decisively in either direction for months. By the gauges the FOMC actually weighs, we are at or beyond full employment.
Some of the May strength is borrowed. Memorial Day fell early this year, pulling hospitality hiring into May, and the World Cup is now adding to payrolls in the host metros. Business services hiring in those metros has run well ahead of the national rate as cities staff up for the tournament. We expect the boost to build through June and July before giving back in September (Labor Day comes late this year). The World Cup, the nation’s 250th anniversary alongside it, and the Los Angeles Olympics in 2028 give hospitality and travel a multi-year runway of marquee demand that few other parts of the consumer economy can claim. None of this changes the underlying read: a labor market that is gradually firming after a winter of softness, against a labor force that is no longer growing, into a cyclical broadening that is adding to demand rather than subtracting from it. That is the path we see ultimately forcing the Fed’s hand.
Inflation: Imported, Not a Spiral
May CPI rose 0.5% on the month and 4.2% year over year, the fastest annual pace in three years and the kind of headline that captures attention. The level of concern fades when the report is opened up. Energy rose nearly 4% in a single month and accounted for better than 60% of the all-items gain, with gasoline up more than 40% from a year ago on the Hormuz disruption. Strip the war out and core prices rose only 0.2%, the mildest reading in months. Core goods actually fell. Core services ex-housing held the disinflation it had through the spring. The tariff pass-through that many braced for is not showing up at the register. What is showing up is a fuel surcharge on the whole economy, and fuel surcharges are not what monetary policy is built to fight. The Fed can’t print oil or make cattle magically appear.
The producer report adds a second engine. Wholesale prices rose 1.1% on the month and 6.5% year over year, the steepest annual climb since late 2022, with goods posting their largest monthly gain on record. The breadth runs wider than oil. Diesel lifted freight, fertilizer ran up sharply and will eventually extend to the grocery aisle, but only partially and with a lag. Core goods climbed above 5% as memory chips and electronics tightened on AI demand. We expect the Fed to treat the war-related runup as close to cresting and to view the technology line as more durable. The first will ease when the tankers move again. The second is the price of a building boom we would rather have than not, largely financed by private capital and generous public valuations.
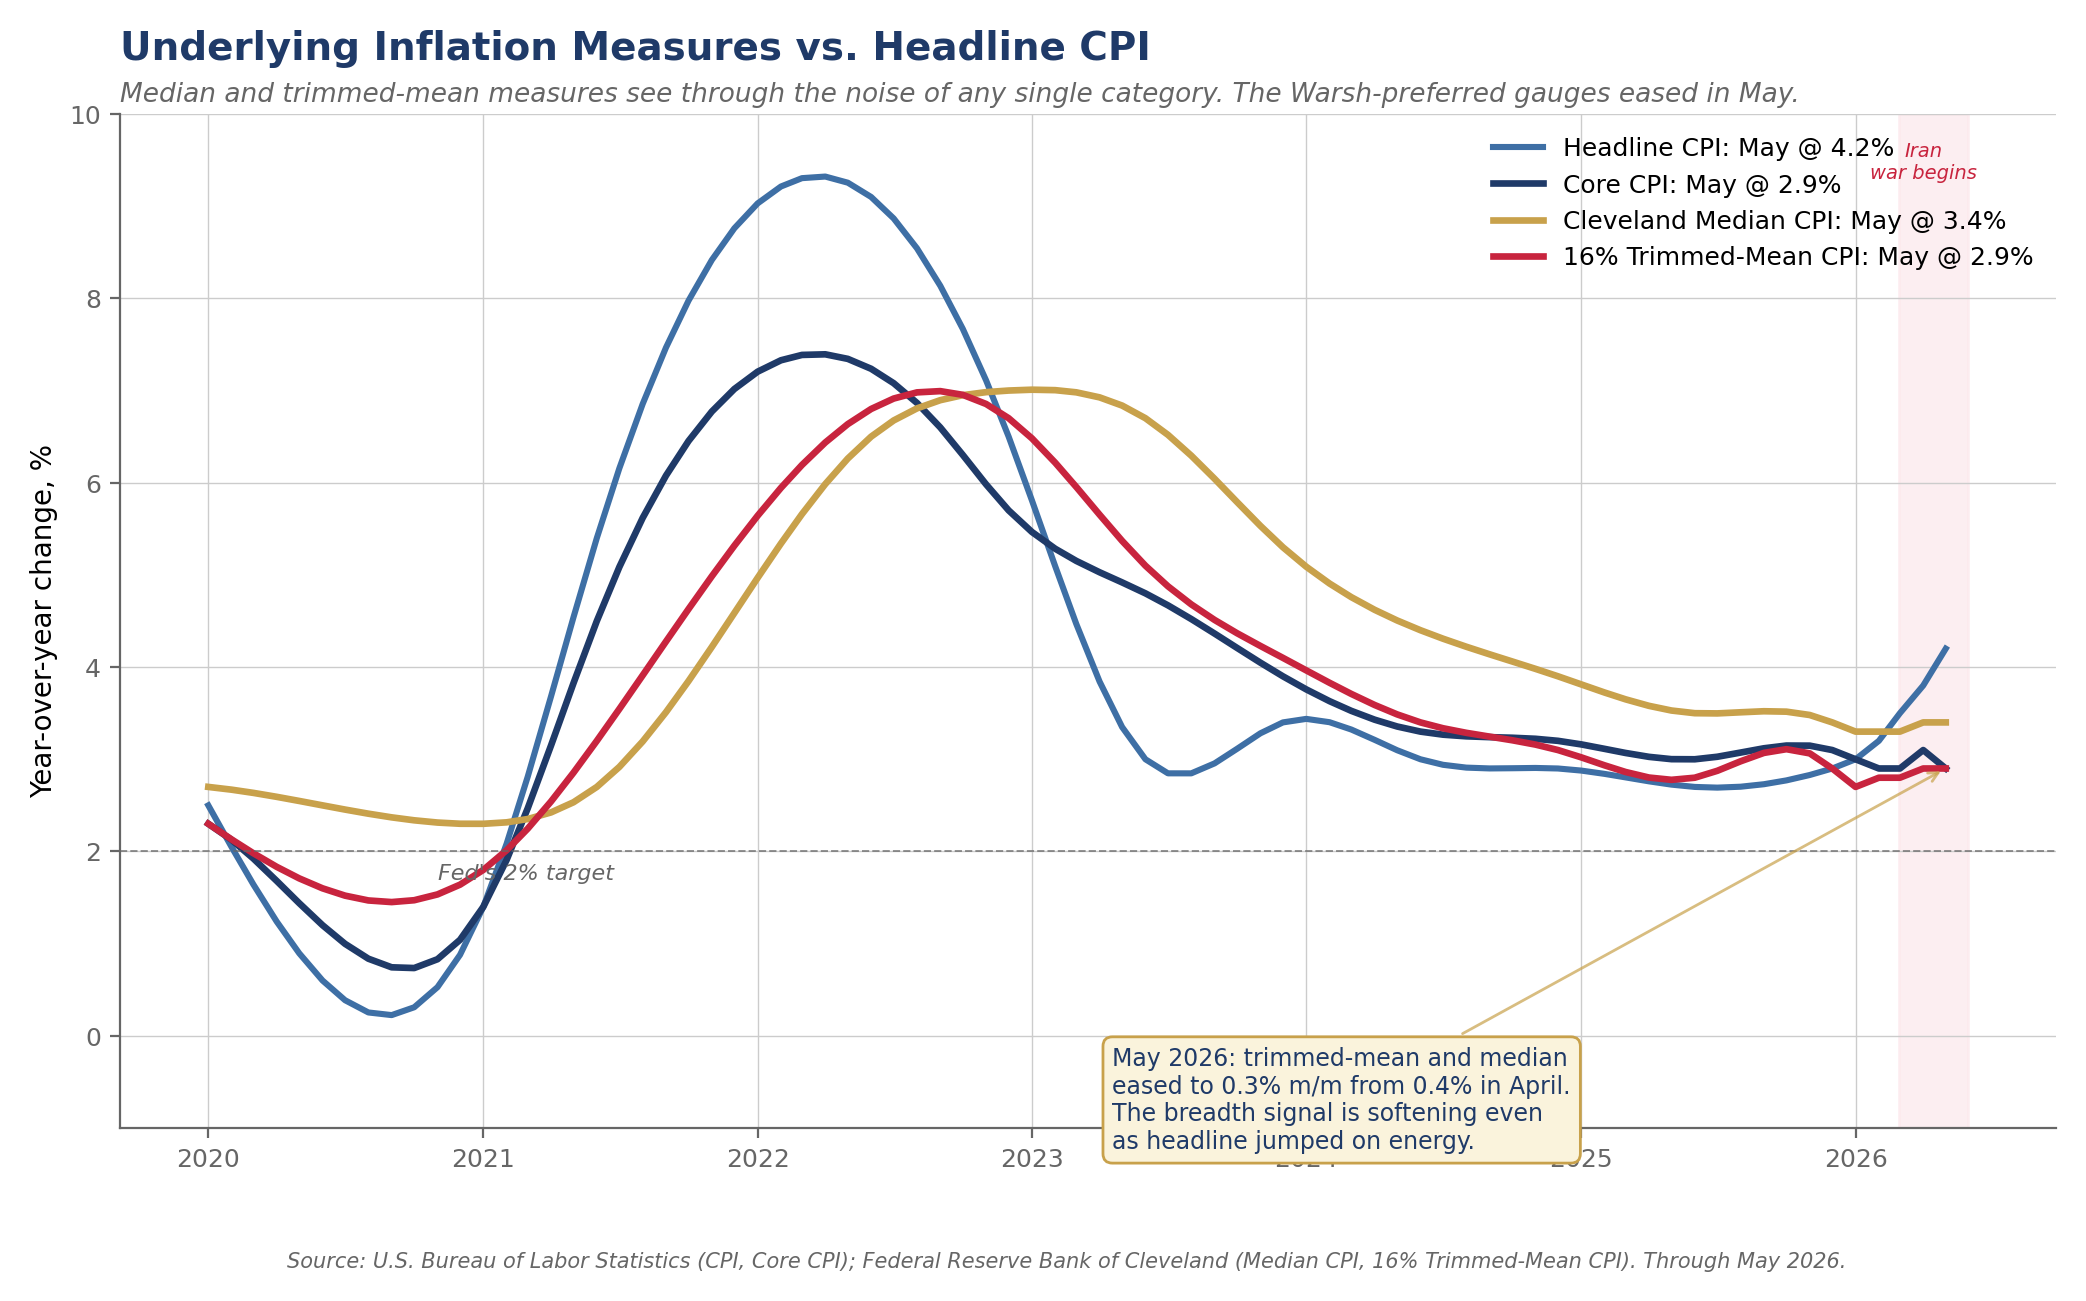
We continue to believe May represents the likely peak for top-line inflation. Lower oil takes the sting out of the headline. Underlying measures eased: Cleveland median and 16% trimmed-mean both rose 0.3% on the month, below April’s 0.4% pace, and core CPI declined to 2.9% year over year from 3.1% in April. These are the very measures Chairman Warsh emphasized in his confirmation testimony, and their softening in May is the most important single data point for the inflation outlook. The May PCE release on June 27 will be the cleanest test of whether the trimmed gauges continue to drift lower. None of this pulls the Fed toward a cut. Our case for a hold now and a hike next rests not on the inflation overshoot but on the part of the economy that has nothing to do with the strait: the cyclical rebound broadening well beyond AI, with the ISM at a four-year high, capital goods orders surging, the manufacturing recession over, and the broadest expansion of capital spending in years. A growing economy meeting a labor market already at full employment is the textbook dynamic that ultimately forces the Fed to tighten. Most observers expect a hike for the wrong reason — the inflation overshoot, which will fade as the war premium clears. We expect it from a more traditional reason — growth accelerating into full employment. Timing is the looser variable: we see the move well out into late 2027 or 2028. The war and the trimmed-mean moderation give the Fed cover to stay patient through the price spike. The broadening cyclical recovery, particularly in the labor market, deprives it the cover to ease.
Markets, Rates, and the ECB
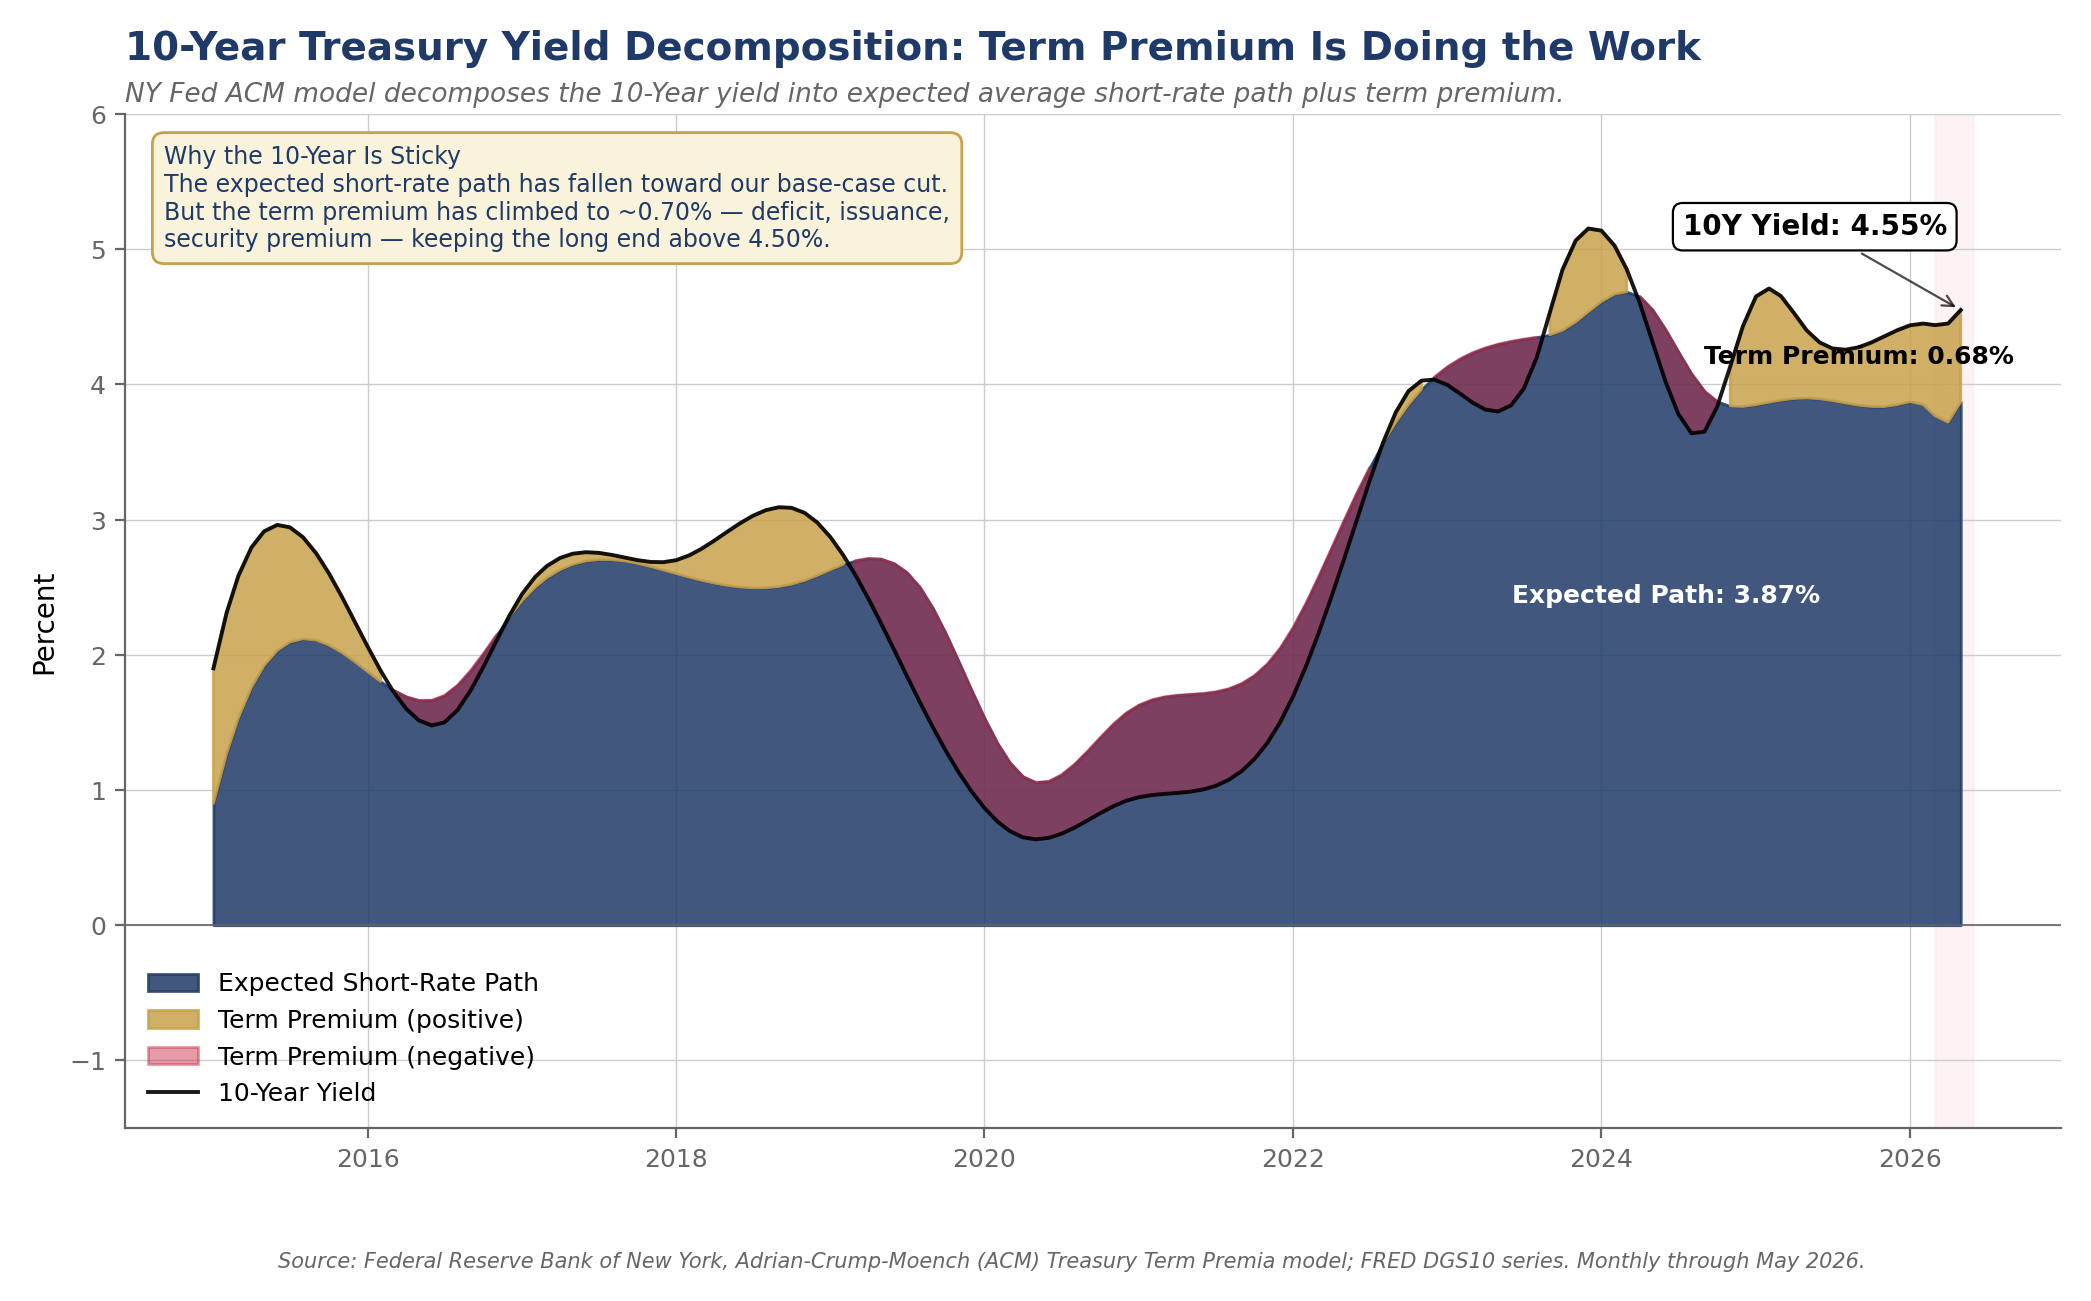
The 10-Year at 4.55% and the Term-Premium Story
The 10-Year Treasury closed June 12 at 4.55%, holding above 4.50% on a term premium that has climbed to roughly 0.70% under the NY Fed ACM model. The 30-Year sits near 5.05%. The 2-Year traded near 4.17%. The June long-bond reopening tailed by the widest margin since late 2024, with dealers left holding more than they wanted. The prevailing view looks for the 10-Year to drift lower into year-end as the energy spike fades. We are only partially in that camp. The bond market’s elevated term premium reflects exactly the dynamic we see in the data: a deficit that is not going down, a heavy issuance calendar that is not going away, and a cyclical rebound that is making investors demand more compensation for holding duration when the Fed’s next move is more likely up than down. We see the 10-Year holding near 4.40% in the base case with a 4.70% upside, and an adverse path higher than that if the June 14 agreement unravels.
The mortgage market is amplifying the move. The 30-year fixed sits near 6.55%, with the MBS spread at its widest since December and offsetting the spread tightening that followed the early-2026 GSE retained-portfolio directive. Housing stays cooler-for-longer, but mortgage spreads should tighten pulling mortgage rates down to 6.30%, slightly below their long-run norm. For corporate borrowers, the fixed-rate issuance window is open but no longer improving. Floating-rate borrowers should stress coverage on a 10-Year at or above 4.50% and a policy rate unchanged through at least the November midterms.
Equities: Earnings-Led, Not Yet at a Peak
This year’s gains have tracked earnings revisions rather than expanding multiples, a healthier footing than a melt-up on hope. The S&P 500 sits near record highs and will likely rally if the war is truly over. The features that mark past market tops — speculative mania, deteriorating growth, a flood of new issuance, a tightening Fed — are mostly absent today, even if a little closer than at the start of the year. The better gauges of speculative trading sit well below their 2000 and 2021 extremes. SpaceX completed its long-anticipated IPO last week to strong demand. The broad index has further to run on profits rather than euphoria, with a path consistent with the S&P near 8,000 by year-end on earnings. What we watch is not the level but the breadth. The leadership is narrow, the volatility is real, and a market this concentrated in one theme can correct hard without the economy doing anything wrong.
The ECB Joins the Hawks: Implications for the Dollar
Send the hosted PNG URL and I’ll wire it here.
Caption ready: “Chart 5. ECB deposit rate vs. Fed funds target rate, with EUR/USD on the right scale. The ECB lifted its deposit rate to 2.25% on June 11; the Fed is expected to hold June 17 with a tightening lean. The rate gap has narrowed but the dollar remains firm on the safety bid and the diverging cyclical paths. Source: ECB, Federal Reserve Board, Bloomberg.”
The European Central Bank lifted its deposit rate by 25 basis points to 2.25% on June 11, the first major central bank to tighten into the war’s inflation. Eurozone headline CPI accelerated to 3.2% in May from 1.9% in February, with core at 2.5%, and the ECB revised its 2026 headline inflation forecast up to around 3.0% from 2.6% in March. Lagarde left the door open for additional moves. The Bank of Japan is widely expected to follow in July or September. EUR/USD slipped after the decision, with the dollar trading near 99 on the DXY, because the rate gap with the U.S. has not narrowed by as much as the ECB action alone implies — the Friday labor beat pushed CME odds of a Fed hike back toward 40%, and the June 14 agreement, with signing set for June 19, left a residual safety bid in the dollar. We see EUR/USD in a 1.13 to 1.20 range through year-end, with the lower end most consistent with our base case in which the Fed holds while the broadening U.S. cycle keeps the dollar firm. For U.S. multinationals, the FX tailwind that lifted Q1 reported earnings will fade only modestly from here. For European exporters, a firmer euro raises the bar on profitability. A central bank that stands pat while its peers tighten is, at the margin, importing a softer currency and a little more inflation — a backdrop that supports our view that the eventual Fed move is more likely up than down.
CFO & Treasurer Corner: What This Means for Corporate Finance
Funding and Liquidity. With the 10-Year near 4.55% and the cyclical rebound pushing in the direction of eventual Fed tightening, the case for opportunistic fixed-rate issuance is strong. Lock fixed-rate funding where the tradeoff allows and pull forward 2027 maturities. Floating-rate borrowers should stress coverage on a policy rate unchanged through at least the November midterms, with hike risk live in the 2027 horizon.
Energy and Input Costs. Crude has broken to three-month lows on the June 14 agreement to reopen Hormuz and lift the U.S. blockade, but the relief builds gradually. The physical reopening looks like late summer rather than the timeline implied by the June 19 signing, Iran has signaled it may still levy transit fees despite the toll-free language, and a security premium is likely to keep a floor under oil even after it clears. Our base case carries Brent near $80 by year-end, with inventory restocking firming the floor so the deal-holds path does not drift well below it even as near-term reopening optimism softens prices. Firms exposed to freight, logistics, or petrochemical inputs should plan for energy costs that ease through Q3 rather than collapse.
Capital Allocation. The capital-cycle thesis holds and is broadening. ISM new orders, capital goods orders, and unfilled-order backlogs all confirm an investment cycle that extends well beyond data centers. Commitments tied to AI, power, grid, defense, and reshoring remain on plan. Q1 corporate net profit margins set a 14.7% record. With the broadening accelerating into a tight labor market, the bar on productivity-led capex is rising, not falling. Discipline on hurdle rates protects against the late-cycle temptation to chase capacity that may not pay back if and when the Fed eventually leans against it.
FX and International Exposure. The ECB has joined the hawks. EUR/USD slipped after the June 11 hike on the still-wider U.S. rate gap, and the dollar sits near a year-to-date high on the DXY. With our base case carrying a Fed that holds and ultimately tightens against an ECB and BoJ already tightening, the dollar’s footing remains firmer than the consensus expects. The Q1 FX tailwind to U.S. multinational earnings will fade only modestly. European exporters face a firmer euro on the margin. Treasurers with multi-currency hedge programs should reassess as the Bank of Japan moves toward its own tightening this summer.
Labor and Wages. Discount the next two payroll and retail reports for the World Cup, hot in summer and soft in the fall. The deeper reality is that the labor force has stopped growing while the cyclical rebound is broadening. Plan for tight conditions in skilled labor to persist and to spread to the categories you have been able to staff up cheaply. The K-shaped labor market is bending the way of workers in scarce categories, and wage pressure in those slots will not ease as cleanly as the headline aggregates suggest.
Planning Assumption. Our base case is a prolonged Fed hold giving way to a hike well out into late 2027 or 2028, the June 14 agreement reopening Hormuz by late summer, Brent settling near $80 into year-end as inventory restocking firms the floor, and full-year U.S. growth near 2.5% led by a cyclical broadening that extends well beyond AI. With downside probability at 20%, boards should keep a deal-collapse case, with oil back toward triple digits and a hike on the table much sooner, live for Q3.
Looking Ahead
| Day | Release / Event | Why It Matters |
|---|---|---|
| Mon Jun 15 | Empire State (June); G7 Summit agenda | First read on whether the manufacturing turn extends into June. Iran tops the G7 agenda after the June 14 agreement, with formal signing in Switzerland set for June 19; that signing is the confirmation marker for the oil-down, risk-on read. |
| Tue Jun 16 | Retail Sales (May); FOMC begins | Energy will distort the headline. Watch the control group ex-autos-gas-building-materials for the clean read on the consumer. |
| Wed Jun 17 | FOMC decision; Industrial Production (May); Housing Starts (May) | A hold is near-certain. The story is the dot plot and whether the language leans toward a hike given the cyclical broadening. IP is the cleanest read on the manufacturing turn. |
| Thu Jun 18 | Philly Fed; Initial Claims; LEI | Second regional manufacturing read after Empire State. Claims test whether the recent uptick is seasonal noise or a trend. |
| Fri Jun 19 | Existing Home Sales (May); Flash PMIs; U.S.–Iran signing (Switzerland) | Higher mortgage rates and weaker buyer traffic should weigh on sales. Flash PMIs are the first June read on capital-cycle momentum. The Switzerland signing formalizes the June 14 agreement and starts the sixty-day clock on sanctions and the nuclear file. |
| Fri Jun 27 | PCE Deflator (May); Dallas Trimmed-Mean PCE | The cleanest test of whether the CPI breadth softening in May carries into the Fed’s preferred index. The Dallas trimmed-mean reading is the focus. |
Scenario Framework
| Scenario | Macro and Market Implications | Corporate Finance Action |
|---|---|---|
| Base Case (60%) | The cyclical rebound broadens further. The June 14 agreement holds and Hormuz traffic normalizes under the framework; Gulf exports rebuild through late summer; Brent settles near $80 by year-end, with inventory restocking firming the floor so the deal-holds path does not drift well below it, and near-term softness on reopening optimism is likely. The trimmed CPI gauges continue to drift lower. The labor force keeps shrinking while payrolls run above breakeven, and rate-sensitive sectors begin participating as the war premium fades. The Warsh Fed holds in June with a tightening lean; the next move is a hike, well out into late 2027 or 2028. The 10-Year holds near 4.40% with a 4.70% upside on term-premium pressure. ECB delivers one more hike; EUR/USD in a 1.13–1.20 range. | Lock fixed-rate funding opportunistically. Stay with productivity-led capex but tighten hurdle rates. Model a Fed hold through 2026 and a hike risk live in 2027. Treat equity concentration as a conditions risk. Reassess multi-currency hedges as the Fed-ECB-BoJ paths diverge. |
| Benign (20%) | Faster reopening; Brent eases toward $70. The cyclical pickup runs hotter as energy costs ease and discretionary spending recovers. Labor force participation ticks higher. The Fed gets cover to stay on hold longer; the case for a hike still builds but is pushed further out. EUR/USD pushes toward 1.20 on softer dollar. | Step up productivity-led capex against an extended Fed hold. Open the refinancing window now. Lean into an energy-sensitive demand recovery. Add U.S. multinational exposure on softer dollar. |
| Adverse (20%) | The agreement unravels or a fresh incident, of the kind the June 14 Beirut flare-up showed is still live, reshuts the strait into the autumn. Brent averages above $110, and a closure dragging through 2027 points toward $140. Headline CPI re-accelerates and the trimmed gauges follow. The Fed is pinned between war-driven inflation and the cyclical rebound, with a hike back on the table much sooner than our base case. Narrow equity leadership unwinds. | Stress-test floating-rate exposure and covenant headroom. Build liquidity. Defer non-essential capex. Hedge energy and freight aggressively. Reassess working-capital cycles. |
Forecast Update
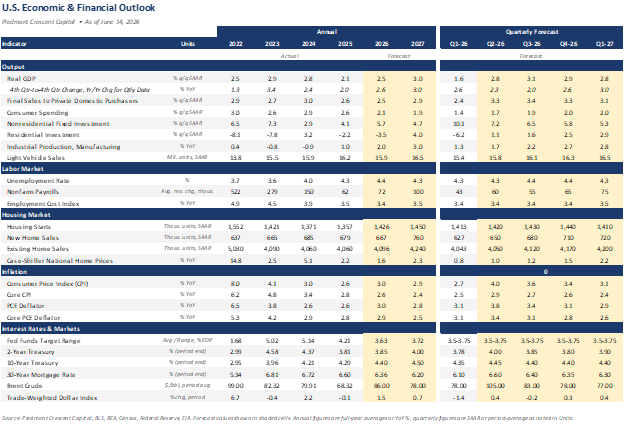
Piedmont Crescent Capital | As of June 12, 2026
Strategic Takeaway
Inflation reports own the headlines, and most observers see the Fed forced to hike because prices are running so far above target. We see something different. Beneath the war-driven headline, the trimmed-mean and Cleveland median gauges Warsh emphasized actually eased in May. The story that matters more is the one barely visible in the financial press: a cyclical rebound that has finally broadened well beyond AI. The ISM Manufacturing index rose to a four-year high in May, with all six of the largest manufacturing industries expanding. Nondefense capital goods orders surged 24.2% in April. Q1 corporate margins set a 14.7% record. The manufacturing recession is over, the labor force is barely growing while payrolls run above breakeven, and rate-sensitive sectors are positioned to be the next leg of the recovery rather than its warning.
We carry a 2.5% full-year U.S. growth call, well ahead of the World Bank’s 2.2%, and we see the next Fed move as a hike — well out into late 2027 or 2028 — not because the inflation overshoot forces it, but because growth accelerating into a labor market already at full employment ultimately does. Most observers expect a hike for the wrong reason. We expect it for the right one. We may have to stand alone on this distinction. For CFOs, four priorities: lock fixed-rate funding while the issuance window is open; continue committing to productivity-led capex with tighter hurdle rates; reassess FX exposure as the Fed-ECB-BoJ paths diverge; and build the deal-collapse downside, oil back toward triple digits and a hike on the table much sooner, into Q3 board discussions.
Mark P. Vitner, Chief Economist, Piedmont Crescent Capital | June 18, 2026
Questions? Email: CompassReport@cavusecurities.com
For informational purposes only. Not investment advice.
This publication has been prepared for informational purposes only and is not intended as a recommendation, offer, or solicitation with respect to the purchase or sale of any security or other financial product nor does it constitute investment advice. Any forward-looking statements or forecasts are not guaranteed and are subject to change at any time. Information from external sources has not been verified but is generally considered reliable.
© 2026 CAVU Securities, LLC / Piedmont Crescent Capital.


A View from the Piedmont: The Tanker and the Server
A View from the Piedmont
Our Weekly Commentary on Money, Credit, Exchange Rates and Geopolitics
Highlights of the Week
- Inflation: May CPI rose 0.5% on the month and 4.2% over the year, a three-year high. Soaring energy prices drove better than sixty percent of the gain, while core rose only 0.2%. Imported.
- Pipeline: Producer prices climbed 6.5% year on year, the most since 2022, with goods posting a record monthly jump. AI hardware is now a second engine.
- Labor: Payrolls rose 172,000 versus 80,000 expected, with 93,000 in upward revisions. Part of the beat might be pre-World Cup hiring that reverses in August.
- Capital cycle: Manufacturing has turned up and the build-out is broadening from AI to Boeing, defense replenishment, and reshored pharma, steel, and chips.
- Geopolitics: A reported fourteen-point draft would reopen the Strait of Hormuz, though a full physical reopening looks more like late summer than the thirty days. Crude is down about a quarter from its March peak with the strait still shut.
- Global: The World Bank cut 2026 world growth to 2.5%, the weakest since the pandemic, while holding the US at 2.2%, far ahead of Europe and Japan.
- Fed: Warsh chairs his first FOMC June 16 to 17. We expect a hold, no 2026 cut, and the next Fed move to be a hike. The consensus is now converging on the no-cut call, while the ECB hikes and the Bank of Japan looks set to follow.
- Our view: Stay constructive on the expansion, cautious on duration, and selective on the capital-investment trade driving both growth and volatility.
The Tanker and the Server
The hiring rebound reflects genuine strength, and the inflation spike is essentially an imported tax. The way to deal with a supply shock is to allow supply to increase, not implement a slowdown the economy does not need.
— Vitner, on an economy strong enough to carry a war premium
Three threads ran through the week. Two inflation reports that looked alarming on the surface but milder underneath; which followed reports of a labor market that ran hotter than almost anyone expected; and a war that, after a hundred days, may have finally started its turn toward a deal. The economy is absorbing two supply shocks at once. The first is transmitted via tanker traffic, or the lack thereof, as a closed strait keeps Gulf crude bottled up and explains most of a 4.2 percent headline CPI spike. The second is transmitted over optical fiber via servers, as the build-out of artificial-intelligence infrastructure tightens the market for chips and electronics the way a war tightens the market for diesel. The first is a supply shock, which monetary policy can do little about. The second is a demand shock, driven primarily by the relative ease with which AI firms are raising capital in the private and public markets. Higher interest rates would dampen this trend but would also weigh heavily on other parts of the economy where demand is not nearly as strong. What is new in our view is a focus on the latter. The economy beyond these price shocks is strengthening, not weakening, and that changes the direction of the next policy move. We expect a hold in June and at least through the midterms. After that, and we now see the next move as more likely a hike.
What follows walks through the May price reports, the labor beat, which was flattered by a big surge in hospitality hiring, the broadening capital cycle, Chairman Warsh’s first FOMC meeting, the reported Iran framework and the Hormuz hangover behind it, and another volatile week in the financial markets, which included the long anticipated SpaceX IPO. We close with the CFO corner, the scenario framework, and our forecast update.
The Inflation Reports: Imported, Not a Spiral
The CPI report looks worse than it is. Headline inflation rose half a percent in May and sits at 4.2 percent over the past year, the fastest pace in three years. Open it up and the level of concern fades a bit. Energy rose nearly four percent in a single month and accounted for more than sixty percent of the all-items gain, with gasoline up better than forty percent from a year ago. Strip the war out and core prices rose two-tenths of a percent, the mildest reading in months, and core goods actually fell. The tariff pass-through that so many braced for is not showing up at the register. What is showing up is a fuel surcharge on the whole economy, and fuel surcharges are not what monetary policy is built to fight.
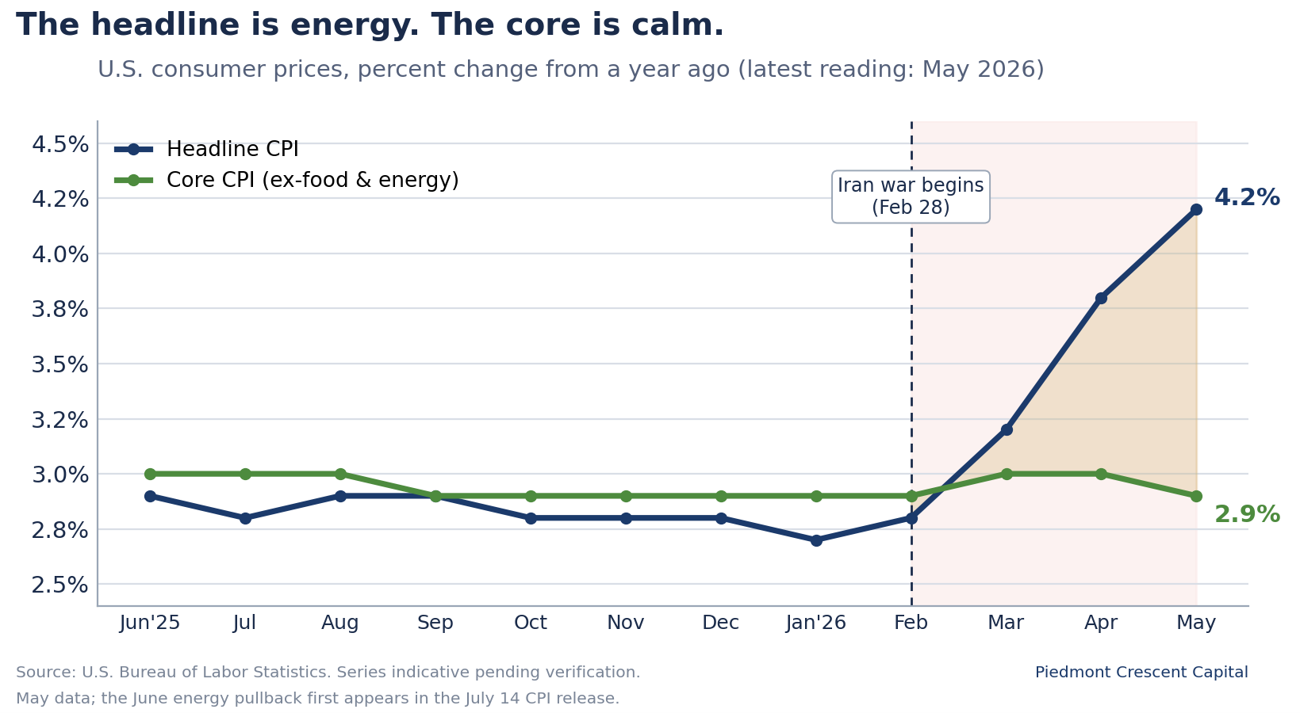
The producer report adds a second engine. Wholesale prices jumped 1.1 percent on the month and 6.5 percent over the year, the steepest annual climb since late 2022, with goods posting their largest monthly gain on record. The breadth runs wider than oil. Diesel lifted freight, fertilizer ran up sharply and will eventually extend to the grocery aisle, but only partially and with a lag. Core goods climbed above five percent as memory chips and electronics tightened on AI demand. We feel the Fed will treat the war-related runup as close to cresting and view the technology line as more durable. The first will ease when the tankers move again. The second is the price of a building boom we would rather have than not, that is largely being financed by private capital and generous public valuations.
The Labor Market: Firm, with a World Cup Asterisk
The beat was real but partly borrowed. Employers added 172,000 jobs in May, more than double what was penciled in, and March and April were revised up a combined ninety-three thousand. The unemployment rate held at 4.3 percent. Some of that strength, though, reflects an earlier than usual Memorial Day, which likely pulled summertime hiring forward. The World Cup also likely bolstered hospitality payrolls. Business-services hiring in the host metros ran well ahead of the rest of the country as cities staffed up for the tournament, and the leisure and hospitality lift will build through June and July before giving back in August. We read the underlying trend as genuinely improving, but modestly so, and we would discount the next two payroll reports and warn readers not to mistake an early summer and packed sporting calendar for an acceleration.
The distortion cuts both ways, and the runway is long. The eleven host metros span the country and account for about a third of national output, so the lift shows up in the national aggregates, hot in the summer and soft in the fall. Some of these markets could use the lift. Atlanta is a clear example, hit hard this year by federal job cuts, and its hospitality sector has made significant investments ahead of the games, so the tournament arrives there as a welcome offset rather than a distortion to discount. The events are not a one-summer affair. The World Cup this year, the nation’s two hundred fiftieth anniversary alongside it, and the Los Angeles Olympics in 2028 give the hospitality and travel sector a multiyear runway of marquee demand that few other parts of the consumer economy can claim. Moreover, Memorial Day fell early this year, while Labor Day will come relatively late. The calendar works nicely for an economy where Americans are staying close to home this year and larger numbers of international travelers are coming to the U.S. for the World Cup and Olympics.
The Real Economy: A Broadening Capital Cycle
The productive core is gaining strength. Manufacturing has turned the corner, with the factory diffusion index back above the waterline and payrolls in the sector adding rather than shedding, the kind of cyclical impulse that tends to lead rather than lag broader economic strength. The capital cycle behind it is broadening well beyond the data centers. Boeing is ramping production in the Pacific Northwest and South Carolina, the defense base is replenishing munitions stocks on multiyear contracts across a dozen states, the Space race is in full force, driving economies across the South, and the reshoring of pharmaceuticals, steel, and semiconductors is putting shovels in the ground from Arizona and central Texas to Ohio, Georgia, and the Carolinas. Business fixed investment is running better than six percent with equipment in double digits. The economy is getting its calories primarily from protein and vegetables, which should keep it lean. Persistent inflation comes from easy money that fuels consumer spending, something that is not in place today.
The consumer is squeezed but cushioned. Real hourly pay slipped again in May as prices outran wages, which is why two-thirds of Americans now call inflation a very big problem. Yet the consumer has not buckled. Tax refunds are still flowing, including the tariff refunds reaching companies and households after last winter’s court ruling, household equity wealth sits near records, and a restocking inventory cycle is adding to growth. Step back and the contrast is stark. The World Bank cut its 2026 world growth forecast this week to the weakest since the pandemic, with the euro area barely positive and Japan softer still, while holding the United States near its prior pace. The war is a tax on everyone. The American economy, with its outsized energy sector, is simply better built to pay it.
The Warsh Fed: A Hold, and a Tilt Toward a Hike
The center holds and watches. Chairman Warsh chairs his first meeting on the seventeenth, and the Committee will in all likelihood stand pat. The case for holding is now nearly unanimous among officials who describe themselves as well positioned and content to watch how the conflict and the data evolve. Cutting rates into a four-percent CPI print with payrolls running this hot would invite the one outcome a central bank cannot tolerate, which is a public that comes to expect higher prices as a matter of course.
The minority has turned toward tightening. A widening group worries that inflation is not heading the right way, that price pressures outside housing have been stuck for two years where neither tariffs nor energy is the obvious cause, and that waiting for proof of embedded inflation only guarantees a larger adjustment later. President Collins put it best when she described her patience for looking through yet another supply shock as worn thin after five years of above-target inflation, and this from an official who still hopes to ease before year-end. Europe’s central bank raised rates the same week, the first major authority to tighten into the war’s inflation. We see no cut in 2026, a hold next week, and the next move, when it comes, more likely a hike than a cut. That hike might not come until late 2027 or early 2028, by when conditions could very well change.
We were early, and the consensus is catching up. We removed the last 2026 cut from our base case two weeks ago, when the prevailing forecast still carried a September move. Since then, the major houses have fallen into line, either calling for hikes or pushing their final cuts deep into 2027 and conceding that core inflation will sit above target all year. We are comfortable a step ahead of that crowd, and a notch more hawkish than where it has landed, because the resilient activity data and a core still north of three percent tilt the risk toward a hike rather than a cut. We do not expect any move this year, however. It is worth adding that the Fed is now the outlier among major central banks, holding while Europe raises rates and Japan prepares to. A central bank that stands pat while its peers tighten is, at the margin, importing a softer currency and a little more inflation, which only reinforces the case against easing.
Geopolitics: A Draft Deal, and the Hormuz Hangover
The tanker may be turning toward home, but slowly. The escalation was real at midweek, a second round of strikes and counterstrikes against Gulf bases and then a threat to seize Iran’s oil. Then the tone changed. Iranian state media circulated a reported fourteen-point draft that would lift oil sanctions, release frozen funds, withdraw US forces, commit Tehran to forgo a nuclear weapon, and reopen the strait within thirty days, with the President suggesting it could be signed at the summit of major economies in Europe this weekend. Crude broke lower in a big way, with both benchmarks closing at three-month lows. We would read the thirty-day timeline as a diplomatic number rather than a physical one. Getting Gulf exports back to normal looks more like a mid- to late summer endeavor, and even that requires flows through the strait to climb back toward seventy percent of their pre-war level alongside the workarounds already running through Yanbu, Fujairah, and Ceyhan. Some of the more extreme takes on this have oil prices elevated well into 2027, as facilities are repaired and oil importers rebuild stockpiles. All of that can happen with lower oil prices, however, as production limits will likely be ignored and non-OPEC gains in output are likely to remain in place.
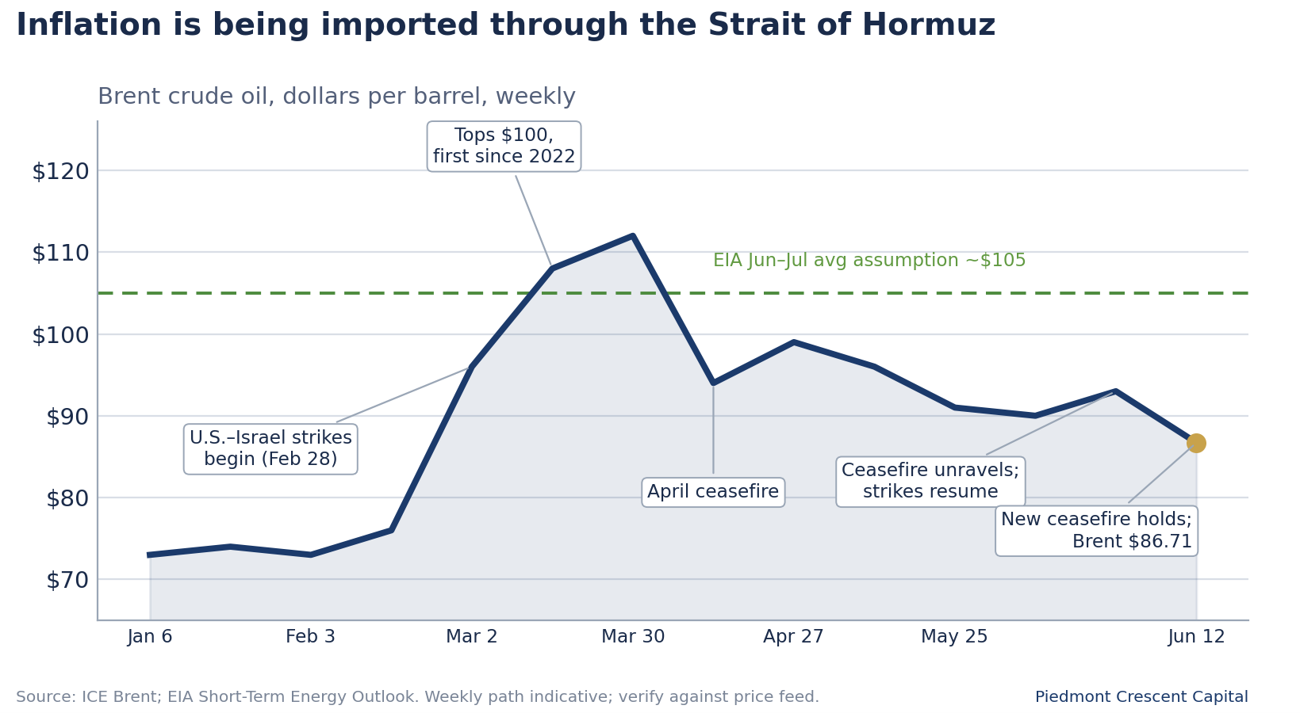
The more telling fact is why crude fell at all. Oil is down about a quarter from its March peak with the strait still largely shut, which should not happen if the price were only a war premium waiting on a ceasefire. The deficit during the disruption has been far smaller than feared, on the order of five to six million barrels a day against a hit to Gulf production more than twice that size, and the gap has been filled by demand that simply went away. Much of it is China, where the shift into electric vehicles has accelerated since the war began. That is the part the cheering misses. Lower oil is a genuine relief for the American consumer, but the reason it is falling is weak global demand as much as the prospect of peace, and weak demand is not an unmixed blessing. More supply also appears to be reaching markets around the world, including increased shipments from the U.S. and Latin America as well as tankers clandestinely escorted out of the Persian Gulf.
Even a reopening leaves a higher floor. Clearing the mines, repositioning the hundreds of stranded tankers, restarting shut-in production, and refilling the inventory hole the closure dug takes months, not days, and runs well into the autumn. And when it is done, the war will have left a mark. Depleted stockpiles and a market that now prices a premium for the risk of the next disruption keep a floor under crude even against a record surplus building for next year. The surplus caps the ceiling. The security premium lifts the floor. We are nudging our own base case up, toward Brent near ninety dollars into year-end rather than the mid-eighties we had carried, with a long tail toward triple digits if the draft falls apart. We are still calling for lower oil prices than the current consensus. Markets do a good job of deciphering all the conflicting information and are more attuned to new supply developments.
None of it changes the policy call. Lower oil takes the sting out of the headline and makes May the likely peak for top-line inflation, the closest thing to a tax cut this economy has had all year. It does not pull the Fed toward a cut. Our case for a hold now and a hike next rests on the part of the economy that has nothing to do with the strait, the firming labor market, the manufacturing turn, the broadening capital cycle, and a core that has been stuck for two years. On the relief, yields slipped and the market pared a little of its hawkishness, the reflex on every de-escalation day. We would fade that move and keep our duration short until the tankers actually move.
Markets & Financial Conditions
The bond market keeps duration short, and here we part ways with the consensus. The long-bond reopening drew soft demand and tailed by the widest margin since late 2024, with dealers left holding more than they wanted amid worries about the deficit, inflation, and oil all at once. The two-year sits at its highest in sixteen months and the ten-year near four and a half percent. The prevailing view looks for the ten-year to drift lower into year-end as the energy spike fades. We are not in that camp. The term premium, fed by the deficit, heavy issuance, a tightening bias, and an energy security premium, keeps the long end sticky, and the asymmetry in long yields is to the upside. A price shock with no clear end date, set against a central bank whose next step is more likely up than down, is not the backdrop for reaching out the curve in search of yield.
Equities are earnings-led, and not yet at a peak. This year’s gains have tracked earnings revisions rather than expanding multiples, a healthier footing than a melt-up on hope. The features that marked past market tops, speculative mania, a deteriorating growth backdrop, a flood of new issuance, and a tightening Fed, are mostly absent today, even if a little closer than at the start of the year, and the better gauges of speculative trading sit well below their 2000 and 2021 extremes. That argues the bull market has further to run, with the broad index able to grind higher into year-end on profits rather than euphoria. What we watch is not the level but the breadth. Not at a peak is not the same as without air pockets. The leadership is narrow, the volatility is real, and a market this concentrated in one theme can correct hard without the economy doing anything wrong.
Piedmont Perspective: The Capital Cycle Comes Home
There is a temptation, when a single category of spending grows large enough to bend a national price index, to call it a bubble and move on. We think that misreads what is happening, and the misreading matters because it would steer capital away from the most productive investment cycle the country has seen in a generation. We find it instructive to remember that capital always seeks its highest risk-adjusted rate of return. Right now, that is in AI and all things associated with the AI buildout. Will it get overdone? Microeconomic theory says yes. Just when, however, is nearly impossible to tell just yet.
The hyperscalers are on course to spend on the order of three-quarters of a trillion dollars on AI infrastructure this year, and the consensus for next year may still be too low. This is a capital cycle in the older and more honest sense of the term, the kind that lays down physical plant, draws on real power and steel and labor, and leaves behind productive capacity rather than a pile of marked-up paper. And AI is the largest strand but not the only one. Boeing is climbing back toward full production, the defense base is replenishing depleted stocks, there is boom in the Space industry and the reshoring of pharma, steel, and semiconductors is adding plant and payroll in places that spent a generation losing both. What looks like a technology story is better understood as a broad re-industrialization.
The cycle is now reaching the wellhead. After a decade of starving themselves of reinvestment in order to return cash to shareholders, oil and gas producers are being rewarded for spending again, and energy capex looks set to return to double-digit growth next year. This is not a coincidence sitting beside the AI story. It is the same story. The server drives power demand, power demand drives the grid, and the grid and the data center together drive the wellhead. Even the coal industry is looking more promising, boosting prospects for railroads and utilities that now have an extended window to operate depreciated facilities. The capital cycle that began in the data center now runs through the energy patch, the transmission line, and the turbine yard, which is one more reason we think it has staying power.
The closest analog is the late 1990s, and it is instructive in both directions. That decade’s investment in fiber was real and raised productivity for years, and it also outran near-term demand badly enough to punish the firms that financed it on credit. The lesson is that the capital cycle and the equity cycle are different animals. Today’s spending is funded largely out of the deepest cash flows in corporate America, a sturdier base than the telecom debt of twenty-five years ago, but the valuations have run and the dispersion of returns is enormous. Some of these companies are building the railroad. Others are selling tickets to a destination that may not generate the traffic the price implies.
The footprint is national, reshaping regional economies that had little to do with technology a decade ago, from Northern Virginia and central Texas to Arizona, Ohio, Georgia, and the Carolina Piedmont, with grid strain from the PJM mid-Atlantic to the Texas interconnection. The particulars differ by region. The pattern does not. It is protein, not carbohydrates. It compounds. We would own the cycle but would be choosy about how.
CFO & Treasurer Corner: What This Means for Corporate Finance
Funding and liquidity. With the ten-year near 4.55 percent and the next policy move more likely up than down, the case for opportunistic fixed-rate issuance is stronger, not weaker. Floating-rate borrowers should stress coverage on a ten-year at or above 4.50 percent and a policy rate unchanged through at least the November midterms.
Energy and input costs. Crude has broken to three-month lows, but the relief builds gradually. The physical reopening of the strait looks like late summer, not thirty days, and a security premium is likely to keep a floor under oil even after it clears. Firms exposed to freight, logistics, or petrochemical inputs should plan for energy costs that ease through the third quarter rather than collapse and should not bank on a deal that is not signed and lived up to.
Labor and wages. Discount the next two payroll and retail reports for the World Cup, hot in summer and soft in the fall. World Cup watching parties will provide a lift to bars across the country. The underlying hiring trend is improving, and wage pressure is easing at the margin, which helps the cost line. Firms relying on slack to refill roles cheaply should not assume it.
Cost of capital. Gains are earnings-led, but leadership is narrow and volatility is real. Treasurers planning equity-linked issuance or buybacks should assume more two-way volatility and a higher cost of equity than the spring’s calm implied. The fixed-rate funding case is stronger now that the near-term cut is off the table.
Capital allocation. The capital-cycle thesis holds. Commitments tied to AI, power, grid, and reshoring remain on plan, and the market continues to reward credible productivity narratives over undisciplined spending. The bar for capex without a clear margin path keeps rising.
Planning assumption. Our base case is a prolonged Fed hold with no cut in 2026 and the next move a hike, an Iran framework that reopens Hormuz by late summer rather than in thirty days, Brent settling near ninety dollars into year-end with a security premium under it, and full-year US growth near 2.5 percent led by capital spending. Boards should model the no-cut case as central and keep a deal-collapse case, with oil back toward triple digits, live for the third quarter.
Looking Ahead
| When | Release / Event | Why It Matters for CFOs & Markets |
|---|---|---|
| Mon–Wed | Summit of major economies (France) | Iran tops the agenda. Watch for a signed framework and a firm Hormuz reopening timeline. A signing would confirm the oil-down, risk-on read; a collapse would reverse it. |
| Tuesday | FOMC begins; Retail Sales (May) | Energy will distort the sales headline, and the World Cup will begin to pad the numbers in June. Watch the control group for the true consumer read. |
| Wednesday | FOMC decision; Industrial Production (May) | A hold is near-certain. The story is the dot plot and whether the language tilts toward a hike. IP is a clean look at the manufacturing turn. |
| Thursday | Housing Starts (May); Initial Claims; LEI | Starts test how four-and-a-half-percent yields bite. We will be looking for confirmation that the recent rise in claims is seasonal noise, not a trend. |
Scenario Framework
| Scenario | Macro & Market Implications | Corporate Finance Action |
|---|---|---|
| Base Case55% | The framework holds and Gulf exports normalize by late summer; Brent settles near ninety dollars into year-end as inventories slowly refill, with a security premium under the price. Labor stays firm and broadening once the World Cup noise clears. The Warsh Fed holds in June with no cut in 2026 and a tightening bias. The 10-year holds 4.40% but trades as high as 4.70%. | Lock fixed-rate funding opportunistically. Stay with productivity-led capex. Model a no-cut-in-2026 path. Treat equity concentration as a conditions risk. |
| Benign20% | Exports normalize by late July, demand stays soft, and supply runs strong; Brent eases toward seventy dollars. Energy disinflation lets the trend gauges resume their drift lower and pulls displaced workers back in. The Fed gains room for one late-year cut. | Step up productivity-led capex. Open the refinancing window. Lean into an energy-sensitive demand recovery. |
| Adverse25% | The draft collapses or a fresh incident keeps the strait shut into the autumn; Brent averages above $110, and a closure dragging through 2027 points toward $140. Headline CPI re-accelerates and the better gauges follow, validating the hike bet. The Warsh Fed weighs a hike into a falling market; narrow equity leadership unwinds. | Stress-test floating-rate exposure and covenant headroom. Build liquidity. Defer non-essential capex. Hedge energy and freight. |
Forecast Update
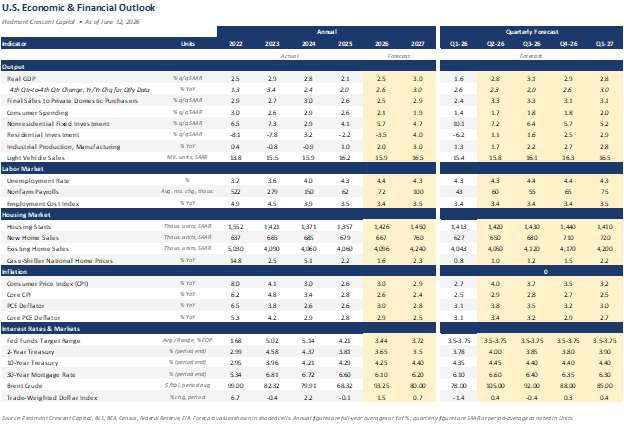
Our full US economic and financial outlook is below, updated for this week’s data and the revised policy path. The headline change remains the rate trajectory: with the labor market firmer, the capital cycle broadening, and core inflation sticky, we carry no 2026 cut in the base case and see the next move as a hike, a call the broader consensus has now moved toward. We mark the oil track to a late-summer reopening, with Brent near ninety dollars into year-end and a security premium beneath it, a benign path toward seventy dollars on faster normalization, and an adverse path above one hundred ten dollars if the strait stays shut. We hold the line where we differ from consensus, looking for the ten-year to stay near four and a half percent rather than drift lower. Cross-checks worth noting: US growth near 2.5 percent, a broad-equity path consistent with an S&P 500 near 8,000 on earnings, and gold marked sharply higher on the same security bid. Forecast values are shown in the shaded cells.
This commentary reflects the views of the author as of the date noted and is provided for informational purposes only. It does not constitute investment advice or a recommendation to buy or sell any security. Information has been obtained from sources believed to be reliable, but accuracy and completeness are not guaranteed. Past performance is not indicative of future results. © 2026 Piedmont Crescent Capital.
Piedmont Crescent Capital | A View from the Piedmont
May 2026 CPI: An Energy Headline, a Paycheck Problem

An Energy Headline, a Paycheck Problem
Early Signals
- Energy did the damage. Headline CPI rose 0.5% in May, with energy contributing more than sixty percent of the increase. Gasoline jumped 7.0% on the month and is up 40.5% over the year.
- Core stayed contained. The 0.2% core gain kept the annual rate at 2.9%, and the trend stripped of shelter and energy is running near 2.4%.
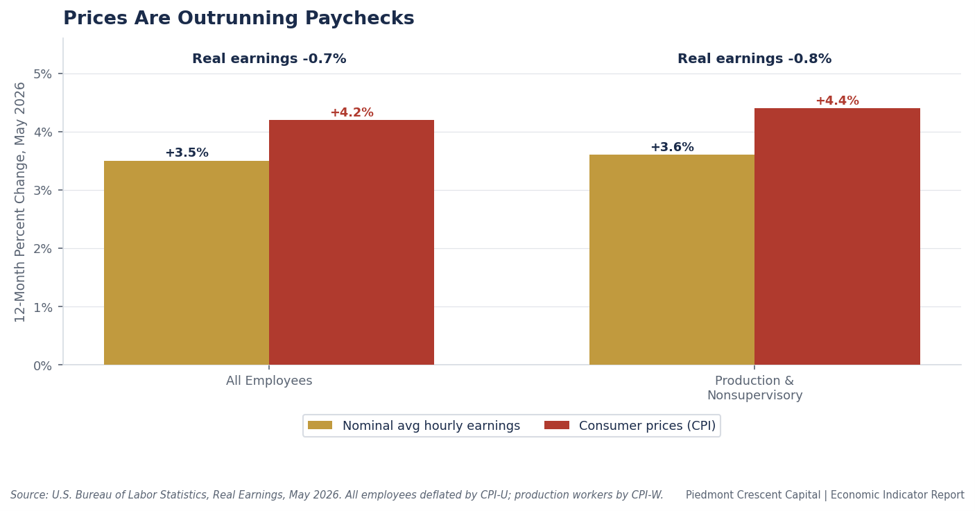
- Paychecks lost ground. Real average hourly earnings fell 0.1% in May and are down 0.7% over twelve months, with production workers off 0.8%.
- Expectations held, but high. The New York Fed’s one-year inflation expectation eased to 3.5%, while household finances and labor confidence deteriorated.
Key Takeaways
| Key Concept | Findings |
|---|---|
| Headline CPI | Rose 0.5% in May after 0.6% in April, lifting the 12-month rate to 4.2% from 3.8%. The third straight month in which energy did most of the lifting. |
| Energy | Up 3.9% on the month and 23.5% over the year, with gasoline alone up 7.0% in May and 40.5% over twelve months. Energy accounted for more than sixty percent of the monthly increase. |
| Core CPI | A contained 0.2% monthly gain held the core rate at 2.9%. Stripping shelter and energy, the underlying trend is running near 2.4%. The breadth of inflation is not widening. |
| Shelter | Up 0.3% as owners’ equivalent rent and primary rent each advanced gradually. Year-over-year shelter has eased to 3.4% and remains the slow-moving anchor under core. |
| Real Earnings | Real average hourly earnings fell 0.1% on the month and are down 0.7% over the year. For production workers the annual decline is 0.8%. Paychecks are losing ground to prices. |
| Policy Signal | A fourth consecutive firm headline keeps a 2026 cut off the table. We hold our no-cut base case, with the risk skewed toward a hike rather than an ease. |
The Overview
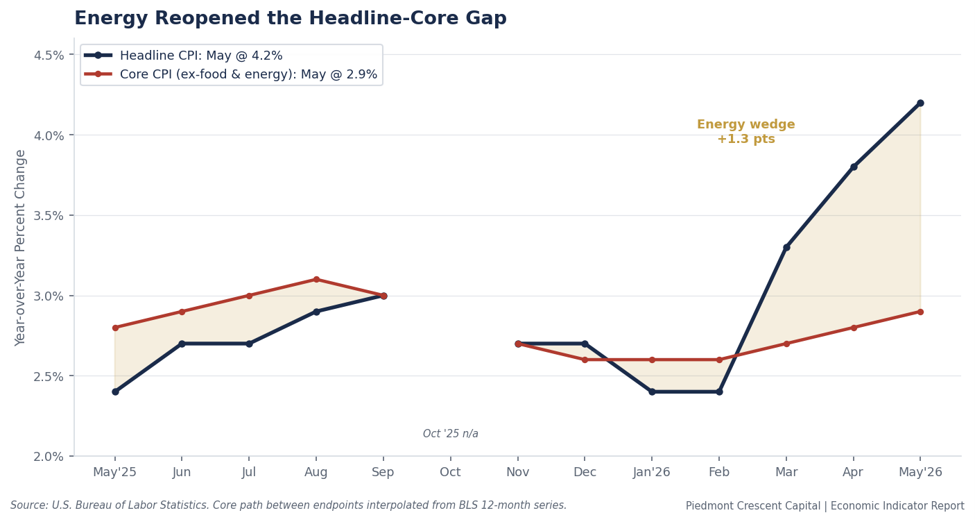
The May inflation report is best read as the third installment of a single story. For three consecutive months, a swing in energy prices has done most of the work in the headline, while the underlying trend has changed far less. The Consumer Price Index rose 0.5% in May after gains of 0.6% in April and 0.9% in March, and the twelve-month rate has climbed from 2.4% as recently as February to 4.2% in May. That is a meaningful move, and it is almost entirely an energy move.
We would caution against reading the four handle as evidence that inflation is reigniting across the economy. The pieces of the index that the Federal Reserve watches most closely behaved well. Core prices advanced a modest 0.2%, and the measures that strip out the noisiest categories point to an underlying pace closer to the high twos than the low fours. What changed in May was the price of a gallon of gasoline, not the price of services.
Energy Did the Lifting
The energy index rose 3.9% in May and is up 23.5% over the year, the steepest twelve-month pace since 2022. Gasoline did most of the work, climbing 7.0% on a seasonally adjusted basis and 40.5% over the trailing year. Energy alone accounted for more than sixty percent of the monthly all-items increase, which is why the headline can run hot while the core sits quietly underneath it.
This is the most regressive form of inflation. Households do not get to substitute away from the commute or the grocery run, and the bill lands hardest on the families that can least absorb it. That distributional reality matters more for the consumer outlook than the headline number itself, and it frames much of what follows.
Core Inflation Stayed Contained
Core CPI, which excludes food and energy, rose 0.2% in May and held its annual rate at 2.9%. The internals were reassuring. Communication prices jumped 1.3%, airline fares rose 2.7%, and personal care advanced 1.0%, but those gains were offset by outright declines in motor vehicle insurance, down 1.7%, household furnishings, off 0.6%, and new vehicles, lower by 0.3%. Medical care firmed 0.3% as hospital services rose, while prescription drugs fell. The give and take is the signature of an inflation pulse that is normalizing rather than broadening.
The cleanest read on the underlying trend is the index that removes food, shelter, and energy together. It rose just 0.1% in May and is running near 2.4% over the year. Strip away the volatile and the lagging, and what remains looks like an economy whose price pressures are close to target, not one accelerating away from it.
Shelter Keeps Cooling, Slowly
Shelter rose 0.3% in May, with owners’ equivalent rent up 0.3% and primary rent up 0.4%. The twelve-month shelter rate has eased to 3.4%, continuing a patient descent that has further to run as new-lease data flows through the index with its customary lag. Because shelter carries the largest weight in the core, its gradual moderation remains the most important disinflationary force in the report, quietly doing more for the trend than any single month of energy can undo.
Food Was Quiet, With Familiar Crosscurrents
Food rose 0.2% on the month and 3.1% over the year. Groceries were nearly flat, up 0.1%, as cheaper dairy and a continued collapse in egg prices, down more than thirty percent from a year ago, offset gains in beef and coffee. Food away from home rose 0.3%. There is little here to alarm, and the category is no longer the source of pressure it was two years ago, though the cumulative price level still weighs on household budgets.
Real Earnings: The Paycheck Problem
The companion release tells the part of the story that the headline obscures. Real average hourly earnings fell 0.1% in May and are down 0.7% over the past year, as a 0.3% nominal wage gain was overwhelmed by the 0.5% rise in consumer prices. Real weekly earnings fell 0.2%. For production and nonsupervisory workers, the squeeze is sharper still, with real hourly pay down 0.3% on the month and 0.8% over the year.
When prices outrun paychecks, the cost-of-living gain is not a statistic on a page. It is a smaller cart at the register and a thinner cushion at the end of the month. This is the mechanism behind the strain we have flagged all year, and it is why we treat the composition of this report as more consequential than its headline.
What Households Expect: The New York Fed Survey
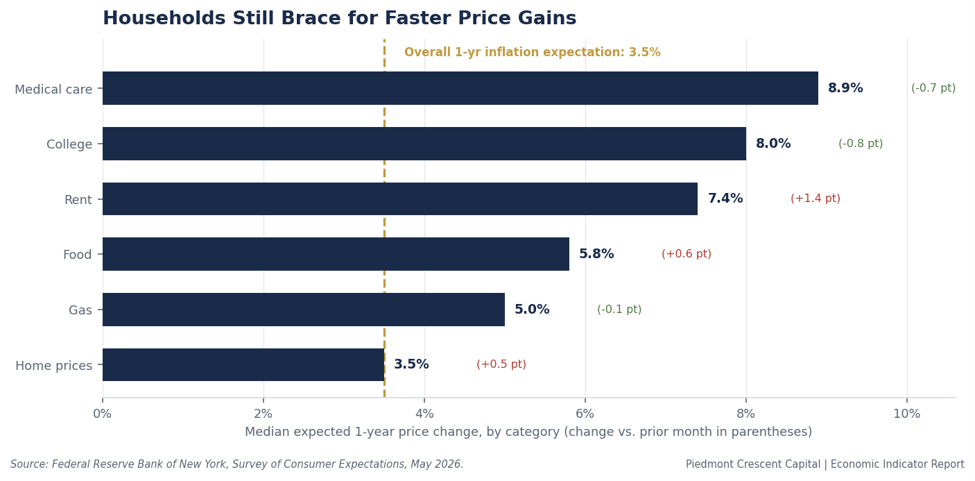
The New York Fed’s May Survey of Consumer Expectations, released June 8, offers a useful read on whether the energy shock is changing the way households think about the future. The encouraging signal is that it is not, at least not yet. The median one-year inflation expectation eased a tenth to 3.5%, and the three- and five-year expectations were steady at 3.1% and 3.0%. Expectations remain anchored, which is exactly what the Fed needs to see when the pump price is doing what it did in May.
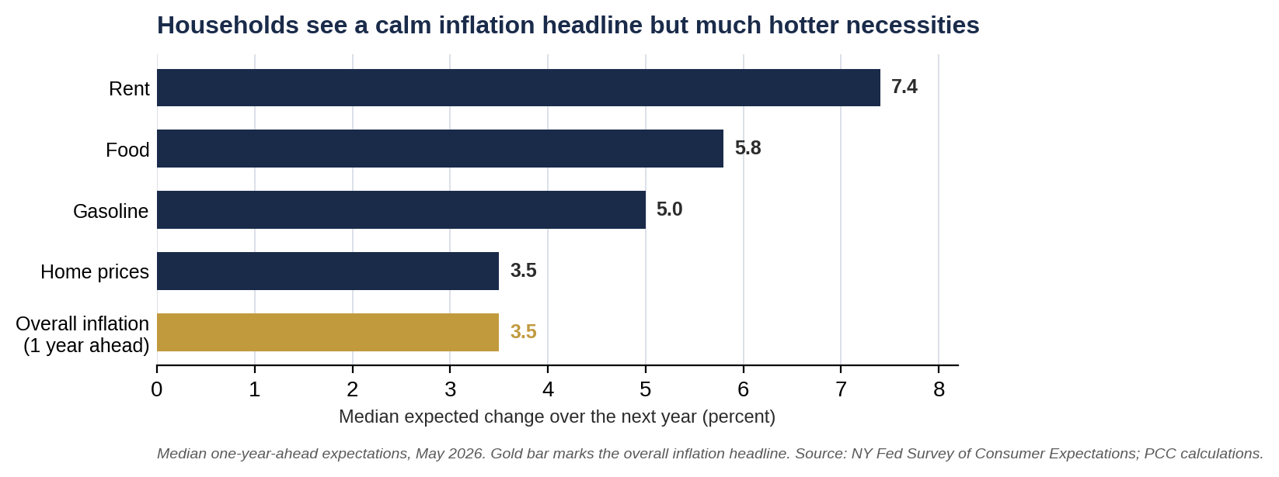
The less encouraging signal is the texture beneath that number. Households now expect rent to rise 7.4% over the year ahead, up more than a point, and food to climb 5.8%. Home price growth expectations jumped to 3.5%, the highest reading since 2022. Just as telling, the survey’s measures of household finances deteriorated broadly. The share of households reporting a worse financial situation than a year ago reached its highest level since early 2023, the perceived odds of missing a debt payment rose, and labor market confidence softened as layoff fears increased and the perceived ease of finding a new job fell. Expectations are holding, but the ground beneath them is less steady.
Four point two percent is an energy headline, not a broadening of inflation. Strip out the gasoline surge and the underlying trend is firmer than it was in the winter but still a long way from a reacceleration. Core sits at 2.9%, and the cleanest cut of the data, all items less food, shelter, and energy, is running near 2.4%. The breadth of price pressure is not widening, and shelter, the largest and slowest-moving piece of core, continues its patient descent toward 3%.
The composition is where the discomfort lives. An energy and grocery bill is a regressive tax, and it is landing on households whose real paychecks just turned negative. Real hourly earnings are down 0.7% over the year, and the squeeze is deeper for production workers. This is the two-Americas economy we have described all year: asset holders are insulated, while wage earners absorb the cost of living through the gas pump and the checkout line. Consumer expectations confirm the strain, with the New York Fed’s measures of household finances and labor market confidence both deteriorating in May.
For the Warsh Fed, this is a credibility test rather than a reacceleration scare. Longer-run inflation expectations remain anchored, but they are anchored at three percent, not two. A fourth consecutive firm headline removes any remaining case for a 2026 cut, and the second-round risk, energy bleeding into airfares, transport, and services, argues for patience over generosity. We retain our no-cut base case for the year, with the tail skewed toward a hike, and we continue to favor caution on duration as the term premium rebuilds.
Frozen and Pricier: Hiring Frozen at Spring-2020 Lows as Selling Prices Reaccelerate
ECONOMIC INDICATOR REPORT · SMALL BUSINESS OPTIMISM, MAY 2026
Frozen and Pricier
Hiring Frozen at Spring-2020 Lows as Selling Prices Reaccelerate: A Cost Squeeze That Keeps the Fed Boxed In
EARLY SIGNAL
- Optimism eased to 95.3, slipping 0.6 point to a third straight month below the 52-year average of 98.0. The headline move is small; the internals are not.
- Hiring plans fell to a net 9% and unfilled openings to 29%, both the lowest since May 2020. These are recession-grade labor readings in an economy that is not in recession and is experiencing solid top-line growth.
- The binding labor constraint has flipped. Labor cost is now the top labor complaint at a record 14% of owners, while labor quality fell to 13%, its lowest since December 2016.
- Selling-price increases jumped to a net 36%, the most since March 2023, with price plans at a net 34%, the most since July 2022. The NFIB price reading has led core inflation through this cycle and is turning back up.
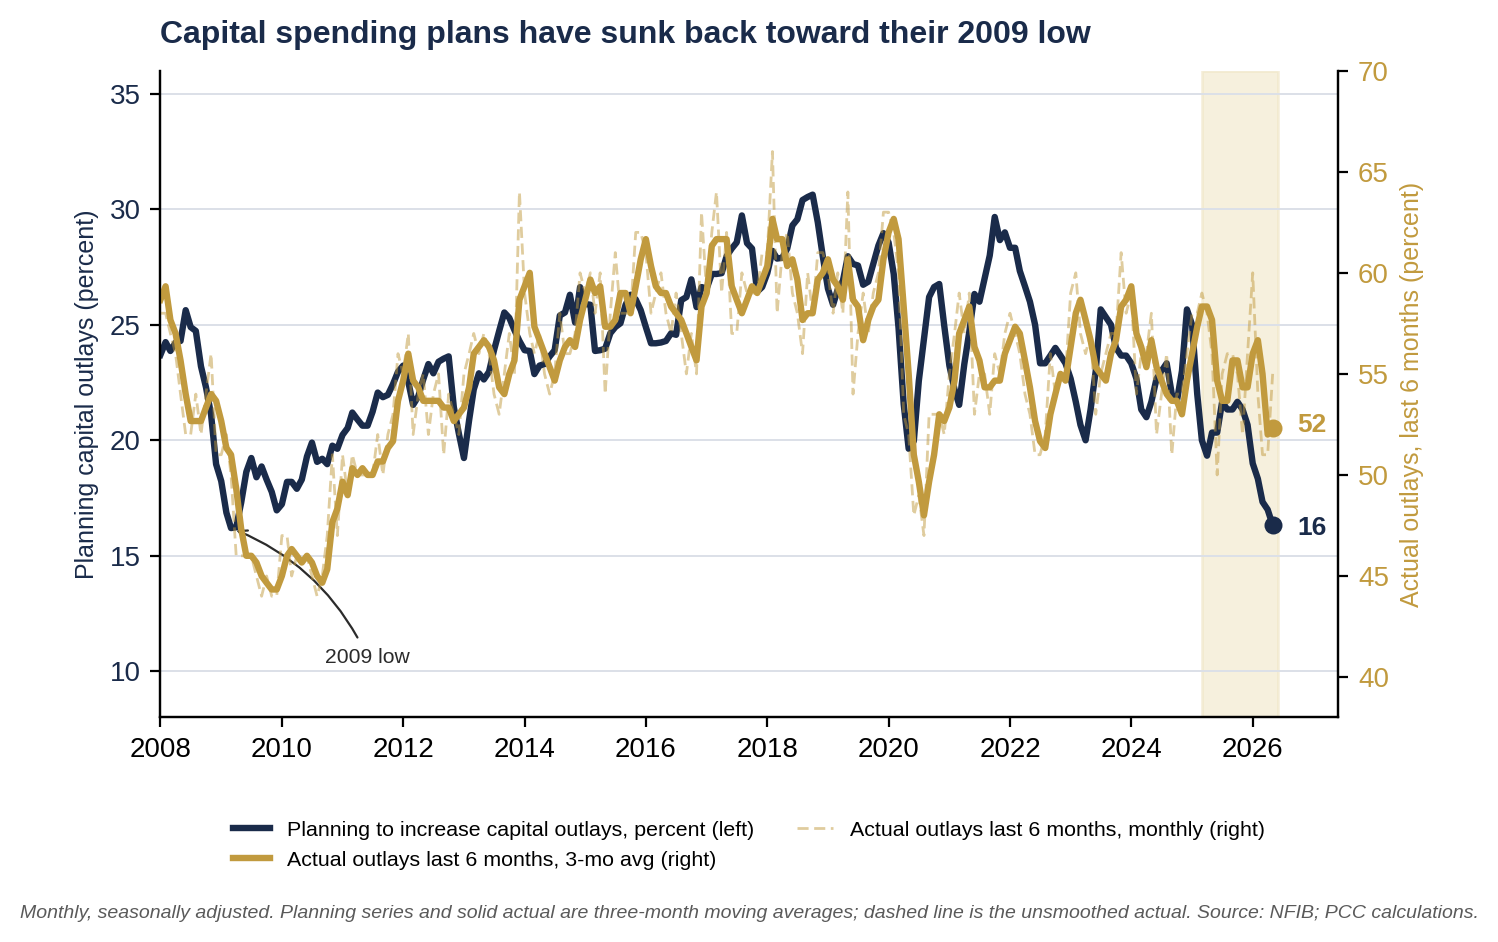
- Capital spending plans slipped to 16%, the weakest since March 2009, while the Uncertainty Index rose to 91, far above its norm near 68.
- Households are sending the same signal. The May New York Fed consumer survey shows three- and five-year inflation expectations stuck near 3%, the job-finding rate down to 43.7%, and the share feeling much worse off than a year ago at a three-year high.
A QUIET HEADLINE OVER A WIDENING SPLIT
Much like headline GDP growth and overall employment growth, the Small Business Optimism Index is doing a good job of hiding the action beneath it. May’s 0.6-point decline to 95.3 looks like a quiet month, and at the index level it was. Three of the ten components rose, six fell, and one held flat, leaving the composite roughly where it has sat all spring. We would caution against reading the calm headline as a calm survey.
The interesting development is the divergence inside the report. Labor demand is sliding toward levels typically associated with downturns, while pricing power is turning back up. That combination is not what a single optimism number can convey, and it is the small-business confirmation of the two-speed economy we have been describing for months. NFIB’s own commentary makes the same point in plainer terms, contrasting an investment-led upper tier of the economy with a lower tier that is absorbing higher costs.
A LABOR MARKET THAT READS LIKE A RECESSION
Hiring plans fell four points to a net 9%, and the share of owners with openings they cannot fill dropped five points to 29%. Both are the lowest readings since May 2020, and hiring plans now sit below their long-run average of a net 11%. Taken at face value, these are recession-type numbers.
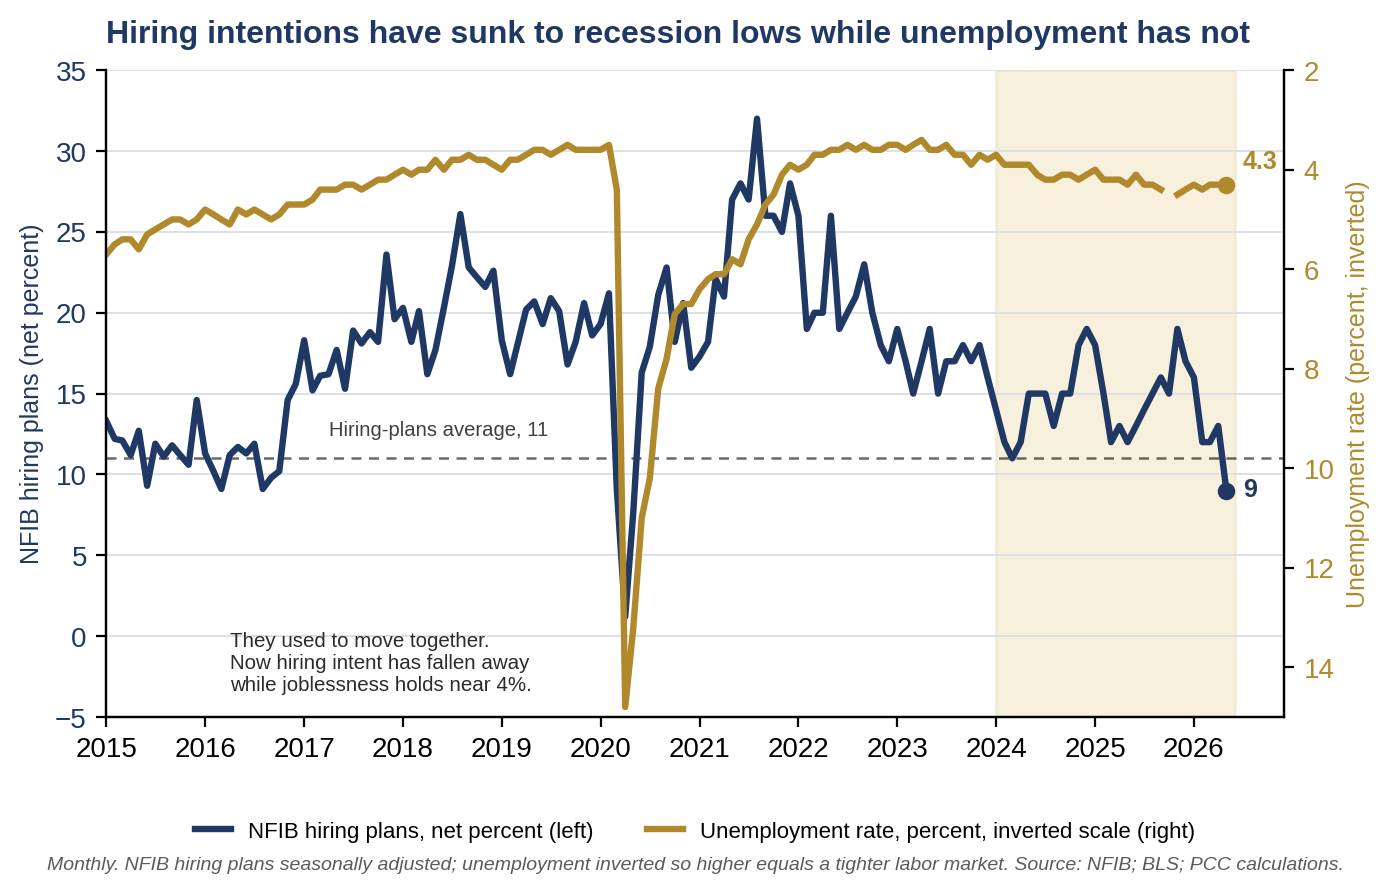
They are not, however, recession numbers, and the contrast with the unemployment rate is the proof. Hiring intentions have collapsed to levels we normally see only in downturns, yet the jobless rate currently sits at just 4.3%. The two have pulled apart. This is the low-hire, low-fire market we have flagged repeatedly: firms are not cutting staff, they are declining to add, and churn has frozen rather than reversed. Workers are also less apt to leave their current jobs. A frozen labor market is a genuine loss of momentum, but it is a different animal from one that is shedding workers, and it argues for patience rather than alarm.
FROM FINDING WORKERS TO AFFORDING THEM
The most telling rotation in the survey is in what owners identify as their single most important problem. Labor cost rose five points to 14%, the highest reading in the survey’s history. Labor quality fell five points to 13%, its lowest since December 2016. For the better part of three years, the binding labor constraint was scarcity, the inability to find qualified workers. That constraint has eased. What remains is the embedded cost of the workers already on the payroll.
Compensation behavior confirms it. A net 31% of owners raised pay over the past three months, up a point, and a net 18% plan further increases, unchanged from April. Wage growth at the small-business level is decelerating only slowly, and it is doing so from an elevated base. For the inflation outlook, that stickiness matters more than any single openings figure, because it speaks to the cost structure owners are now operating in and trying to pass through.
PRICING POWER IS RISING, NOT FALLING
And pass it through they are. The net share of owners raising average selling prices climbed six points to 36%, the highest since March 2023, with planned increases up seven points to a net 34%, the highest since July 2022. That matters well beyond the survey, because the NFIB selling-price reading has been a dependable leading indicator of realized inflation.
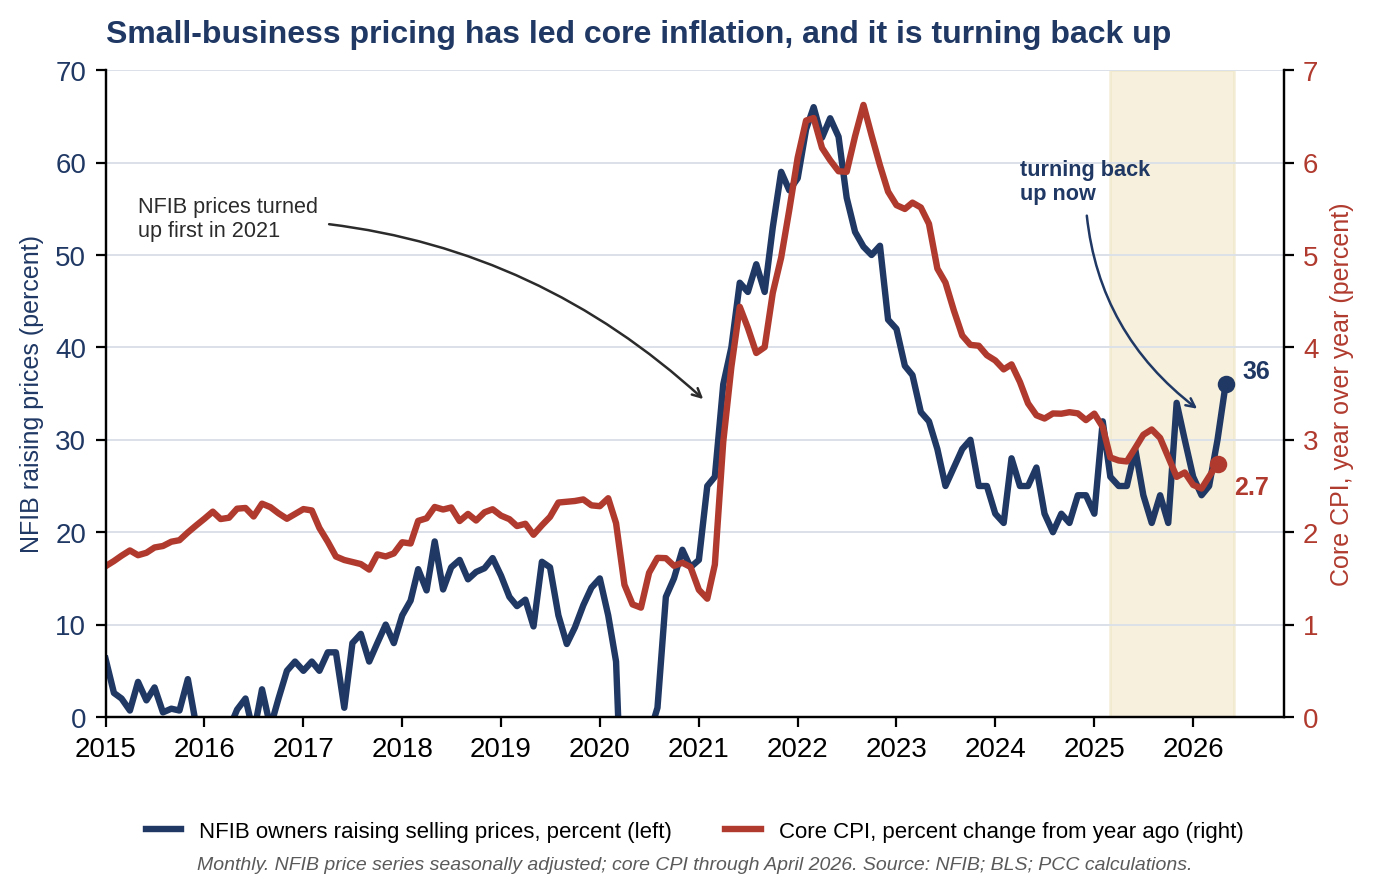
The relationship holds across the cycle. Small-business pricing surged months ahead of the 2021 to 2022 core CPI spike, then led the disinflation that followed. It is now turning back up, with the May reading jumping to 36 while core CPI sits near 2.8%. We read the renewed climb in selling prices as the confirming signature of cost-push, not demand-pull. Firms are lifting prices to defend margins against rising input costs, not because customers are clamoring for more goods and services. NFIB ties the impulse to energy, with gasoline reflecting both a tighter global oil supply and a war risk premium, layered on top of the wage pressure already in the system. Supply-chain friction is feeding it too, with 70% of owners now reporting some disruption, up six points. Reports of inflation as a top problem rose for a third straight month to 18%, the highest since December 2024.
INVESTMENT INTENTIONS AND THE COST OF CAUTION
The cautious posture extends to the balance sheet. Plans to make capital outlays eased to 16%, the weakest reading since March 2009, and the Uncertainty Index rose three points to 91, far above its long-run norm near 68. Only 7% of owners called it a good time to expand, the lowest since October 2024, and expected business conditions fell for a fifth consecutive month. Borrowing costs are no help: a net 6% reported paying a higher rate on their most recent loan, up four points, even as the average short-term rate edged down to 7.8%. When uncertainty is this high and pricing is this defensive, deferring investment is the rational choice, and that is what owners are doing.
HOUSEHOLDS ARE SENDING THE SAME SIGNAL
The case does not rest on small-business owners. The New York Fed released its May Survey of Consumer Expectations on June 8, and it paints the household side of the same picture. On inflation, the headline looks benign and the detail does not. Median expectations for the year ahead slipped a tenth to 3.5%, but the three- and five-year horizons held at 3.1% and 3.0%, still well clear of the 2% goal. Underneath the headline, households expect food prices to rise 5.8% over the next year and rent to climb 7.4%, and they marked up expected home-price growth by half a point to 3.5%, the highest reading since July 2022. All are well above our expectations.
On the labor market, the survey echoes the low-hire, low-fire dynamic from the owner side. The mean perceived probability of finding a job after a layoff fell to 43.7%, below its twelve-month average of 46.8% and the lowest since December, even as expectations of a layoff rose. Workers, like owners, sense that hiring has cooled while joblessness has not climbed.
On household finances, the lower tier of the two-speed economy comes into focus. The share of households reporting they are much worse off than a year ago rose more than two points to 13.3%, the highest since July 2022, and net optimism about the year ahead fell to its weakest since October 2022. Expectations for credit availability deteriorated, and the average perceived chance of missing a minimum debt payment in the next three months rose to 12.6%. This is the same squeeze the NFIB commentary describes, now visible in the family budget rather than the income statement.
WHAT IT MEANS FOR THE FED
For the Federal Reserve, the May surveys are an unwelcome combination. The labor data offer the kind of softening that might normally argue for patience tilting toward easing, but the price data refuse to cooperate. Selling-price increases are accelerating, owners and households both expect more inflation, and the NFIB pricing signal that has led realized core inflation through this cycle is turning back up. A frozen labor market that is not actually shedding workers gives the Fed no growth scare to respond to, while re-accelerating prices give it every reason to wait. That is the definition of boxed in. Chair Kevin Warsh, sworn in on May 22, chairs his first meeting on June 16 and 17, with cover to hold but no clean path to cut.
BOTTOM LINE
The May NFIB survey is not a recession signal but remains uncomfortably consistent with a low altitude stagflation. Hiring intentions and job openings have fallen to levels we normally see only in downturns, yet unemployment sits at 4.3% and owners are not cutting staff. At the same time, selling prices are reaccelerating, capital spending plans are the weakest since 2009, and the New York Fed’s consumer survey shows households feeling the same squeeze. This is a small-business sector, and a household sector, caught between a frozen labor market and renewed cost pressure. For the Fed, that mix removes the easy case for easing and keeps the central bank boxed in.
WHAT WE ARE WATCHING
- NFIB price plans and selling prices: Whether the May upturn to a net 36% extends, which would point to renewed pressure in core inflation over the following months.
- The labor-cost complaint: Whether labor cost holds at or above its record 14% share of owners as the single most important problem, a sign that embedded wage pressure is sticky.
- Hiring plans and openings: Whether the spring-2020 lows mark a floor or give way to actual job cuts, which would turn low-hire, low-fire into something worse.
- Capital spending plans: Whether the weakest reading since 2009 stabilizes once uncertainty around the Iran conflict and energy prices recedes.
- The household side: New York Fed inflation expectations, the job-finding rate, and delinquency expectations, for confirmation that the consumer squeeze is or is not deepening.
Mark P. Vitner
Chief Economist, Piedmont Crescent Capital
mark.vitner@piedmontcrescentcapital.com · (704) 458-4000
Sources: NFIB Research Center, Small Business Economic Trends, May 2026; Federal Reserve Bank of New York, Survey of Consumer Expectations, May 2026 (June 8, 2026); U.S. Bureau of Labor Statistics, core CPI and unemployment rate; FRED. Historical series and chart calculations by Piedmont Crescent Capital.
Disclaimer: This publication has been prepared for informational purposes only and is not intended as a recommendation, offer, or solicitation with respect to the purchase or sale of any security or other financial product, nor does it constitute investment advice. Views are those of the author as of the date of publication and are subject to change.
Strong Jobs, a Fraying Truce, a Boxed-In Fed
Our Weekly Commentary on Money, Credit, Exchange Rates and Geopolitics
A View from the Piedmont
Strong Jobs, a Fraying Truce, a Boxed-In Fed
Highlights of the Week
- Jobs: May payrolls rose 172,000 versus 88,000 expected, with prior months revised up 93,000. Unemployment held at 4.3%, and U6 slipped to 8.1%.
- Beneath the surface: Hiring broadened: the employment diffusion index improved again, including in manufacturing. Yet the long-term unemployment share rose to 27.5%, a cycle high.
- Manufacturing: ISM rose to 54.0, a four-year high. With factory breadth turning up, the cyclical impulse is improving; prices paid near 82 keep the cost squeeze in view.
- Markets: A chip-led rout hit Friday: the Nasdaq fell 4.2%, its worst day since April 2025, as strong jobs lifted yields (10-year 4.54%) and the market began pricing a hike.
- Geopolitics: Iran fired missiles at Israel on Sunday night, the first such strike in two months; President Trump urged Netanyahu not to retaliate to keep the Iran talks alive.
- Fed: Warsh chairs his first FOMC on June 16 to 17; a hold is expected, with a hawkish tone.
- Our view: We push the first cut out; no 2026 cut in our base case, the market has begun to price a hike, and we stay cautious on duration.
Market Snapshot
Three threads ran through the week and into the weekend: a May employment report that came in far stronger, and broader, than the consensus feared; a Middle East truce that frayed through the week and cracked on Sunday night; and a stock and bond market that repriced hard for a Fed that is not cutting. The jobs data did the most work. Payrolls rose 172,000 against expectations near 88,000, the prior two months were revised up 93,000, and the breadth of hiring improved, with the employment diffusion index rising again, including in manufacturing. The capital-cycle thesis we have carried all year remains intact, and the cyclical signal is, if anything, firmer. What the report does not fix is the bottom. The share of the long-term unemployed rose to a cycle high, and the workers losing jobs are not the ones the new hiring is reaching.
The geopolitical track deteriorated. The tentative memorandum we described last week stalled, U.S. and Iranian forces exchanged fire near the strait, and on Sunday night Iran fired a volley of missiles at northern Israel, its first such strike in two months, after an Israeli operation against Hezbollah in Beirut. No one was hurt, and the more telling development was Washington’s response. President Trump moved to restrain Israel, pressing Netanyahu not to retaliate so as not to derail the Iran talks. The truce is back on the brink, but the United States is actively holding Israel back to protect it.
Markets had already turned before the weekend. After a run of records, Friday brought a violent, chip-led selloff. The Nasdaq fell 4.2%, its worst day since the tariff turmoil of early 2025, as the strong jobs report spiked Treasury yields, the market cut its rate-cut bets, and high-multiple technology took the brunt. Investors sold stocks, bonds, gold, and bitcoin together. The weekend escalation sets up a risk-off open. What follows walks through the May employment report and the improving breadth beneath it, what the high share of long-term unemployed tells us, what to expect from Chairman Warsh’s first FOMC on June 16 and 17, the renewed escalation with Iran, and the Friday selloff and the repricing behind it. We close with the CFO corner, the scenario framework, and our forecast revisions.
The May Jobs Report: A Blowout, and a Broadening
The May employment report was the week’s main event, and it was a blowout. Nonfarm payrolls rose 172,000, roughly double the 88,000 the consensus had penciled in, and the prior two months were revised up by a combined 93,000, lifting March to 214,000 and April to 179,000. The three-month average is now 188,000, well ahead of the six- and twelve-month trends of 92,000 and 42,000, and the firmest stretch in over two years. The unemployment rate held at 4.3%, but the detail ran hotter than the round number: the unrounded rate ticked down, and the broader U6 underemployment rate fell to 8.1% from 8.2% even with participation steady. With payrolls now running well above the most recent estimates of the employment breakeven rate, which has dropped sharply as labor-force growth has slowed, the report points to labor-market slack dissipating rather than building.
Leisure and hospitality led, but the World Cup is a side story. Leisure and hospitality added 70,000, five times its trailing-year pace, with food services and drinking places contributing 48,000. The easy explanation is the World Cup, which opens June 11, and we think it is the wrong one. The tournament falls after the May survey week, so its hiring will mostly land in June, and we judge it a minor factor in May. Two more prosaic forces did more of the work. Memorial Day fell unusually early this year, only about a week after the survey reference week, which likely pulled seasonal hiring into the May count that would normally show up in June. And more travelers appear to be vacationing closer to home, which lifts hiring at the drive-to destinations that account for a large share of domestic leisure employment. The strength is real; the driver is seasonal timing and a shift in travel patterns more than a one-off sporting event.
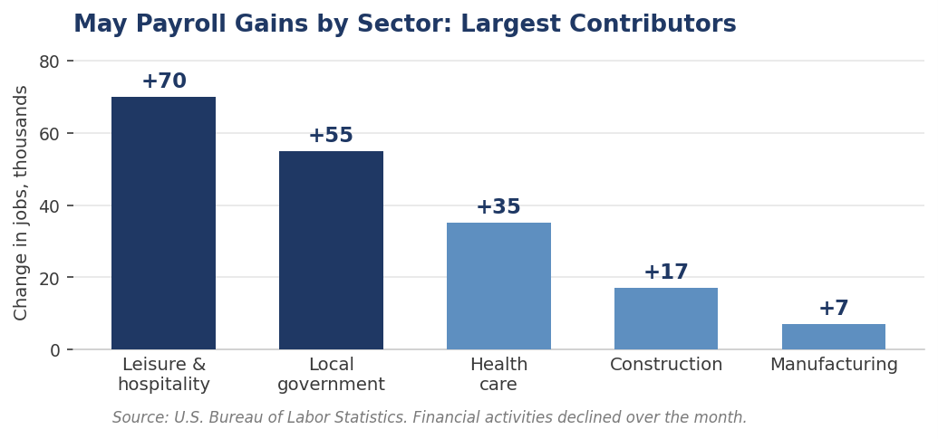
The breadth improved, and it is the cyclical kind. The more important measure than which sector was largest is how widely hiring was spread, and breadth improved. The employment diffusion index, which tracks the share of industries adding to payrolls, rose again in May for total private employment and, notably, within manufacturing. A cleaner way to see it is to strip out the two most acyclical engines that have carried payrolls for the past year. Employment excluding health care and social assistance has now risen for three straight months, after falling through the winter. That is the signature of an upswing in the more economically sensitive parts of the economy, not just the steady, demographically driven hiring in health care and social assistance.
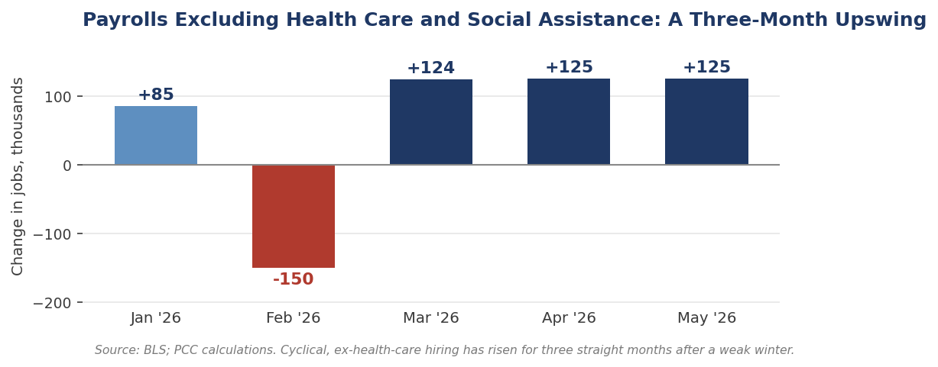
Manufacturing is the cyclical tell. The factory sector punches above its payroll weight because it supplies the cyclical impulse to the rest of the economy; goods production turns first, and services follow. The signals there are turning up. Construction added 17,000 and manufacturing 7,000 in May, modest in level but a clear improvement after a prolonged soft patch, and manufacturing overtime rose to its highest since early 2023, the kind of leading signal that shows up before firms commit to new headcount. Read alongside the ISM factory index at 54.0, a four-year high with new orders expanding for a fifth straight month, the improving manufacturing diffusion points to strengthening conditions ahead, even if it is showing up so far as only marginally stronger job growth. The one caveat is price: the ISM prices-paid index sits near 82, its second-highest reading since 2022, so the factory recovery is arriving with a cost, and that cost is the inflation story in miniature.
The high share of long-term unemployed is the harder signal underneath. For all the improvement in breadth and the dip in broader underemployment, one series is moving the wrong way. The share of the unemployed out of work for 27 weeks or longer rose to 27.5%, the highest of this cycle, and the count is up 524,000 over the year. This is what a low-hire, low-fire labor market looks like from the inside. The aggregate is tightening, slack is dissipating and U6 fell, but that is because fewer people are being let go, not because the jobless are being rehired quickly, and the broadening in hiring is reaching new entrants and job-switchers rather than those already stranded, hinting at a skills mismatch. The longer someone is out, the harder the return becomes, as skills atrophy and employers screen on recent experience, which is how a cyclical problem hardens into a structural one and the natural rate of unemployment drifts up. It also feeds the consumer-credit stress we flagged last week, because the long-term unemployed exhaust savings and lean on revolving credit. So the labor market is strengthening at the margin and scarring at the core at the same time, and the long-term-unemployment share is the single series we would watch to know which force is winning.
Wages cooled, but the policy risk did not. Average hourly earnings rose 0.3% on the month and 3.4% from a year earlier, down from 3.6% in April, so the wage line is contained for now. The problem is the combination. A labor market that is tightening, with slack dissipating and the breakeven rate this low, sitting on top of the broad inflation pressures still in the pipeline, is exactly the mix that can force a central bank to consider hikes rather than cuts. That is why the blowout report reinforces our caution on duration. The asymmetry in long yields is increasingly to the upside, and we would not be extending duration into it.
Piedmont Perspective: Two Americas, One Labor Market
Last week we wrote about the K-shape in the consumer-credit data: record S&P 500 margins on one side, the highest credit-card delinquency since 2011 on the other. This week the same split showed up inside the jobs report, but with a twist. The top line is not just strong, it is broadening: more industries are hiring, the cyclical impulse from manufacturing is improving, and the asset-owning, capital-deploying economy is doing well. The break is no longer about whether the labor market is broad enough. It is about who the breadth reaches. The new hiring is going to entrants and job-changers, while the workers already stranded, the long-term unemployed, are not being pulled back in. The labor market is the hinge between the two Americas, and for now its low-hire, low-fire setting keeps the average looking steady while the stranded cohort grows.
That is the more durable version of the K-shape. A broadening expansion that leaves a hardening core of long-term jobless behind is exactly the configuration that lets headline growth and household distress coexist for quarters at a time. The capital cycle will eventually feed through into wages and into demand for harder-to-place workers, as it has in past investment booms, but that transmission takes time, and the bottom half of the distribution has to hold on through elevated living costs until it does.
The risk we are watching is not the breadth of hiring, which is improving, but whether the long-term unemployed get reabsorbed before their detachment becomes structural. A labor market can broaden at the margin and scar at the core at the same time. The long-term-unemployment share is the single series we would watch to know which force is winning, and right now it is still drifting the wrong way.
The Warsh Fed: A Hawkish Debut in Prospect
Chairman Warsh, sworn in May 22 and elected by the Committee the same day, chairs his first FOMC meeting on June 16 and 17. Last week brought the opening round of commentary from the new Board under his lead; this week’s data did most of the work in shaping what that first meeting is likely to deliver. The setup is not friendly to easing. Payrolls reaccelerated, the better inflation gauges have not yet reached target, and energy is pushing the headline higher. Markets now price roughly a two-thirds probability of a hold, and we agree.
What to expect. We look for a hold, a hawkish tone, and the removal of any residual easing bias from the statement language. Warsh has been explicit in leaning on the trimmed-mean measures as the cleaner read on underlying pressure, and on that gauge the Dallas series at 2.3% argues the trend is contained and pointed lower. But a Chair in his first meeting, with payrolls running near 190,000 on a three-month basis and oil elevated, has every reason to wait. The risk to our hold call is not a cut; it is a more hawkish framing of the inflation risks than the market is positioned for. That hawkish inflation framing might be coupled with some skepticism on the recent run of stronger payroll numbers, preserving optionality.
The revision to our path. This is the week we move our own forecast. We had carried a September cut as the base case. After the May report, and with the energy-driven price impulse still live, we no longer treat a 2026 cut as the base case. We now look for a prolonged hold, with the first move pushed toward year-end at the earliest and conditional on energy disinflation and shelter moderation, and with a small but no longer trivial probability of a hike if price pressures broaden. The market has run further than we have, swinging on Friday toward pricing a hike by year-end as the more likely outcome. We think that overstates the case, but the direction is right. We would rather be early in flagging the shift than caught describing a September cut the data has already taken off the table. We have removed any cuts from our forecast and still see a cut in December as possible.
Geopolitics: The Truce Cracks, and Washington Steps In
The week’s de-escalation did not hold. The tentative U.S.–Iran memorandum we described last week, a 60-day ceasefire extension, a toll-free reopening of the Strait of Hormuz, and a restart of nuclear talks, stalled within days. Tehran suspended the indirect channel, tying any resumption to an Israeli withdrawal from Lebanon and a halt to operations there and in Gaza, and U.S. and Iranian forces exchanged fire near the strait. A mid-week Israel–Lebanon ceasefire briefly looked like a way back. It did not survive the weekend.
Iran struck Israel directly. On Sunday night Iran fired a volley of roughly ten ballistic missiles at northern Israel, its first direct strike in two months, in response to an Israeli operation against a Hezbollah stronghold in Beirut. Israeli air defenses engaged the barrage and no casualties were reported, but the attack pushed the region back toward the brink of the wider war that the spring ceasefire had paused. Israel’s military signaled it was ready to retaliate but was asked by President Trump to hold off. Iran’s move was likely aimed at their domestic audience and was intentionally light and well-telegraphed so that Israel would intercept it.
The more important move came from Washington. President Trump intervened to keep the situation from spiraling, pressing Prime Minister Netanyahu not to strike back and making clear that the United States, not Israel, would set the terms of any agreement with Tehran. He acknowledged the missile attack does not help the negotiations but said it had not changed his intent to reach a deal. The signal for markets is twofold. Near-term escalation risk is real and two-sided, but the United States is now openly restraining its closest ally to protect the diplomatic track and, with it, the path to a Hormuz reopening. That is a meaningful cap on the tail, even as the headline risk rises.
Oil. Brent eased toward $93 by Friday’s close, down from the mid-May high near $119, on softer Chinese demand and a record-long string of U.S. product draws. That was before the weekend strike, which should reassert a risk premium at the Monday open. The two-sided setup is unchanged in character but sharper in degree: a contained outcome with Washington holding Israel back points Brent toward the mid-$80s by year-end, while a retaliation spiral that puts Hormuz in play puts the May highs, and a fresh leg of headline inflation, back on the table.
Markets & Financial Conditions
The bond market repriced first. The 10-year Treasury backed up to about 4.54% after the jobs report, its highest since late May, and the 2-year jumped to 4.16%, its highest since early 2025, as traders pushed cut expectations out and began to price the opposite. The front end led, flattening the 2s10s curve toward 38 basis points from above 60 a week earlier, and the dollar firmed. By Friday the market had swung to pricing a rate hike by year-end as more likely than not, a striking reversal from the September cut it had assumed only days before. We think that is an overshoot. Our base case remains a prolonged hold with no cut in 2026; the hike risk is real but not yet the central path. If inflation cools, as we expect, then real rates will rise and implement any tightening that is needed. Term premium, not the policy rate, continues to do the heavier lifting at the long end, where heavy issuance and a growth backdrop the market increasingly accepts keep a floor under yields. We stay cautious on duration into that mix.
Equities did not hold up. After a run of records earlier in the week, Friday brought a violent, chip-led selloff. The Nasdaq fell 4.18% for its worst day since the tariff turmoil of early 2025, the S&P 500 lost 2.64% and snapped a nine-week winning streak, and the Dow gave back nearly 700 points a day after closing at a record. Semiconductors were the epicenter, with the largest names down high-single to mid-double digits, the unwind of a crowded, concentrated trade that a soft Broadcom outlook had already started midweek. The proximate trigger was rates: a stronger labor market means the economy needs less monetary support, which lifts the discount rate and presses hardest on high-multiple technology whose profits sit furthest in the future. Notably, the usual pattern broke. Yields and oil had been moving together on the war; on Friday yields rose on the jobs data even as oil fell, a sign the driver has shifted from energy-driven inflation to a growth-and-rates repricing. Investors sold stocks, bonds, gold, and bitcoin together, the signature of a rates shock rather than a growth scare. The AI trade is bruised, not broken, and its concentration is now the market’s main vulnerability into a hot CPI and the weekend’s escalation.
Credit has stayed comparatively calm, with investment grade tight and high yield only modestly wider on the consumer story we flagged last week. For all the equity drama, financial conditions have merely come off an extreme; nothing here forces the Fed’s hand, and the spring’s easy conditions are part of why the Committee can afford to wait.
CFO & Treasurer Corner: What This Means for Corporate Finance
Funding and liquidity. The back-up in yields reopens the question of timing. With the 10-year near 4.54% and the front end repricing, the case for opportunistic fixed-rate issuance is stronger, not weaker, because the near-term cut that might have lowered funding costs has been pushed out. Floating-rate borrowers should stress coverage on a 10-year holding at or above 4.50% and a policy rate unchanged through at least the third quarter.
Energy and input costs. Brent near $93 is off its peak but still elevated, and the ISM prices data says the cost pressure is broad on the factory floor. Firms exposed to freight, logistics, or petrochemical inputs should keep 2026 cost stress tests in place and should not assume relief from a deal that is not signed.
Labor and wages. The planning signal is the split inside the report. Hiring is broadening and the cyclical impulse from manufacturing is improving, which supports demand-side plans, but the long-term-unemployed share is rising, so a broad reabsorption of displaced workers is not yet underway. Firms relying on slack to refill roles cheaply should not assume it; firms exposed to lower- and middle-income demand should keep modeling the stress on that cohort. Wage pressure is easing at the margin, which helps the cost line.
Equities and the cost of capital. Friday’s repricing is a reminder that the discount rate, not just earnings, drives high-multiple valuations, and that the index is concentrated in a handful of chip and AI names. Treasurers planning equity-linked issuance or buybacks should assume more two-way volatility and a higher cost of equity than the spring’s calm implied. The fixed-rate funding case is, if anything, stronger now that the near-term cut has been pushed out.
Capital allocation. The capital-cycle thesis holds. Commitments tied to AI, power, grid, and reshoring remain on plan, and the market continues to reward credible productivity narratives over undisciplined spending. The bar for capex without a clear margin path keeps rising.
Planning assumption. Our base case is a prolonged Fed hold with no cut in 2026, a fragile truce that holds because Washington is actively restraining Israel, Brent drifting toward the mid-$80s by year-end once the strait normalizes, and full-year GDP near 2.5% led by capital spending. Boards should now model a no-cut-in-2026 case as the central path rather than the risk case, keep a war-escalation case live for the third quarter given the weekend’s strikes, and treat the equity-concentration risk as a financial-conditions variable in its own right.
Looking Ahead
| Day | Release / Event | Why It Matters for CFOs & Markets |
|---|---|---|
| Monday | NY Fed Survey of Consumer Expectations (May); Wholesale Inventories (April) | The expectations survey is the cleanest read on whether the energy spike is unanchoring household inflation views. Watch the one- and three-year series. |
| Tuesday | NFIB Small Business Optimism (May) | Small-business hiring and price plans are the best early read on whether the narrow payroll base is broadening or thinning further. |
| Wednesday | Consumer Price Index (May) | The main event. We expect a gasoline-driven headline with core firmer than comfortable. The print sets the tone for Warsh’s first meeting the following week; watch core services and shelter. |
| Thursday | Producer Price Index (May); Initial Claims | PPI confirms or complicates the CPI read on pipeline pressure. Claims remain the highest-frequency labor signal and sit near historic lows. |
| Friday | Import Prices (May); Univ. of Michigan Sentiment (June, prelim.) | Import prices capture tariff and dollar pass-through. The Michigan inflation expectations are the market’s preferred sentiment gauge into the FOMC. |
The open questions for the week are whether the May CPI confirms that the energy impulse is staying in the headline rather than broadening into core, whether the small-business and claims data corroborate the firmer, broader labor read, and whether the weekend escalation with Iran is contained by Washington’s pressure on Israel or spirals into the strait. A hot CPI on top of the strong jobs print would harden the market’s new bet on a hike and frame an uncomfortable first meeting for the Warsh Fed the following week.
Scenario Framework
| Scenario | Macro & Market Implications | Corporate Finance Action |
|---|---|---|
| Base Case 55% |
Sunday’s missile exchange stays contained because Washington restrains Israel; the indirect channel reopens and Hormuz normalizes by late summer; Brent drifts toward the mid-$80s. Labor stays firm and broadening, though the long-term-unemployed share keeps rising. Warsh Fed holds in June with a hawkish tone; no cut in 2026, first move pushed to 2027 and conditional. The market’s hike bet fades as oil eases. 10-year holds 4.40–4.70%. | Lock fixed-rate funding opportunistically. Stay with productivity-led capex. Model a no-cut-in-2026 base path. Treat equity concentration as a conditions risk. |
| Upside 15% |
De-escalation sticks and the U.S.–Iran MOU is signed; Hormuz reopens cleanly; Brent toward $75. Energy disinflation lets the trend measures resume their drift lower and pulls the long-term unemployed back in. Fed gains room for one cut late in the year. | Step up productivity-led capex. Open the refinancing window. Lean into an energy-sensitive demand recovery. |
| Downside 30% |
Israel retaliates despite U.S. pressure, or a fresh incident closes the strait; Brent back above $115. Headline CPI re-accelerates and the better gauges follow, validating the market’s hike bet. The Warsh Fed is forced to weigh a hike into a falling stock market. Equity concentration unwinds further; consumer-credit and long-term-unemployment stress deepen together. | Stress-test floating-rate exposure and covenant headroom. Build liquidity. Defer non-essential capex. Hedge energy and freight. |
Forecast Update
Our full U.S. economic and financial outlook is below, updated for this week’s data and the revised policy path. The headline change is the rate trajectory: with the labor market firmer, slack dissipating, and inflation pressures intact, we no longer carry a 2026 cut in the base case and have nudged up the near-term yield profile. Forecast values are shown in the shaded cells.
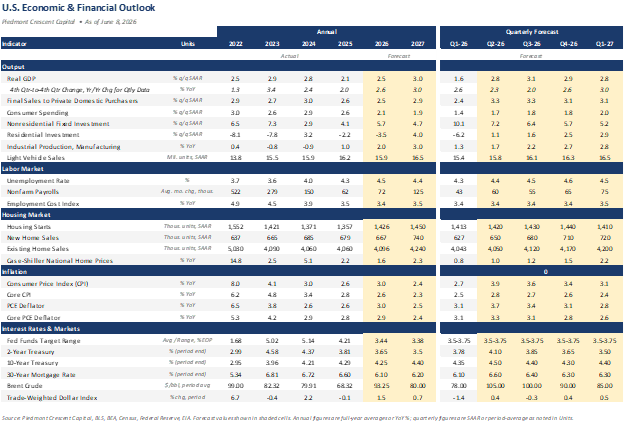
This commentary reflects the views of the author as of the date noted and is provided for informational purposes only. It does not constitute investment advice or a recommendation to buy or sell any security. Information has been obtained from sources believed to be reliable, but accuracy and completeness are not guaranteed. Past performance is not indicative of future results. © 2026 Piedmont Crescent Capital.
May Payrolls: Resilient and Broadening

ECONOMIC INDICATOR REPORT · EMPLOYMENT SITUATION, MAY 2026
Resilient and Broadening
Hiring Firms Across More Industries: Good for Growth, but Awkward for a Fed Boxed In by Inflation
EARLY SIGNAL
- May payrolls surprised sharply to the upside, rising 172,000, roughly double the consensus call of around 85,000 net new jobs and the third consecutive outsized monthly gain, the first such streak in about a year.
- March and April were revised up a combined 93,000 (to 214,000 and 179,000), reversing the persistent downward-revision pattern of late 2025.
- The unemployment rate held at 4.3% for a fourth straight month, with household employment growth outpacing labor force growth.
- Job growth is broadening, not narrowing. Although the bulk of the gain came in leisure and hospitality, local government, health care, and social services, the one-month diffusion index rose on both a total private and a manufacturing basis, confirming the firmer ISM manufacturing survey.
- Manufacturing is turning, and energy is ramping. The May ISM Manufacturing PMI hit a four-year high of 54.0% with 16 of 18 industries expanding, and oil and gas extraction added jobs again (up 5,000, and up 10,000 since February).
- Aggregate hours are rising. With the workweek steady at 34.3 hours and payrolls climbing, aggregate hours worked are tracking at roughly a 2% annualized pace in Q2 over Q1, consistent with our forecast for 2.8% real GDP growth for the quarter.
- Financial services is the one clear weak link, down 22,000, reflecting sluggish housing, rising consumer-credit delinquencies, slower light-vehicle sales, and cost-cutting pressure. Insurance, which lost 10,700 jobs, was a notable soft spot in May.
- Wage growth of 3.4% remains below inflation, leaving real average hourly earnings negative and the household squeeze intact.
A HEADLINE THE FED CANNOT IGNORE
May payroll growth blew past expectations. Employers added 172,000 net new jobs, roughly twice the consensus of around 85,000 and the third straight monthly gain, the first such streak in about a year. Coming on the heels of an upwardly revised 179,000 in April, the report reinforces a theme we have flagged repeatedly this spring, namely that the labor market appears to be firming amid a modest broadening in job growth. While the same group of industries (health care, social services, and leisure and hospitality) accounts for the bulk of the gain, the number of industries reducing employment has fallen, and manufacturing, logistics, and even some technology areas thought to be weighed down by AI are now seeing hiring firm up.
As is often the case, the revisions to prior months matter as much as the headline. The revisions run to the upside now, which is consistent with the firmer Q4 QCEW data reported earlier this week. March was revised up by 29,000 to 214,000 and April by 64,000 to 179,000, leaving the prior two months a combined 93,000 stronger than first reported. That is a clean break from the downward-revision pattern that dogged the data through late 2025, and it tells the Federal Reserve that the underlying pace of hiring has been firmer than real-time prints suggested. The private payroll processor ADP corroborated the direction, reporting 122,000 private jobs added, just above the 120,000 increase that had been anticipated.
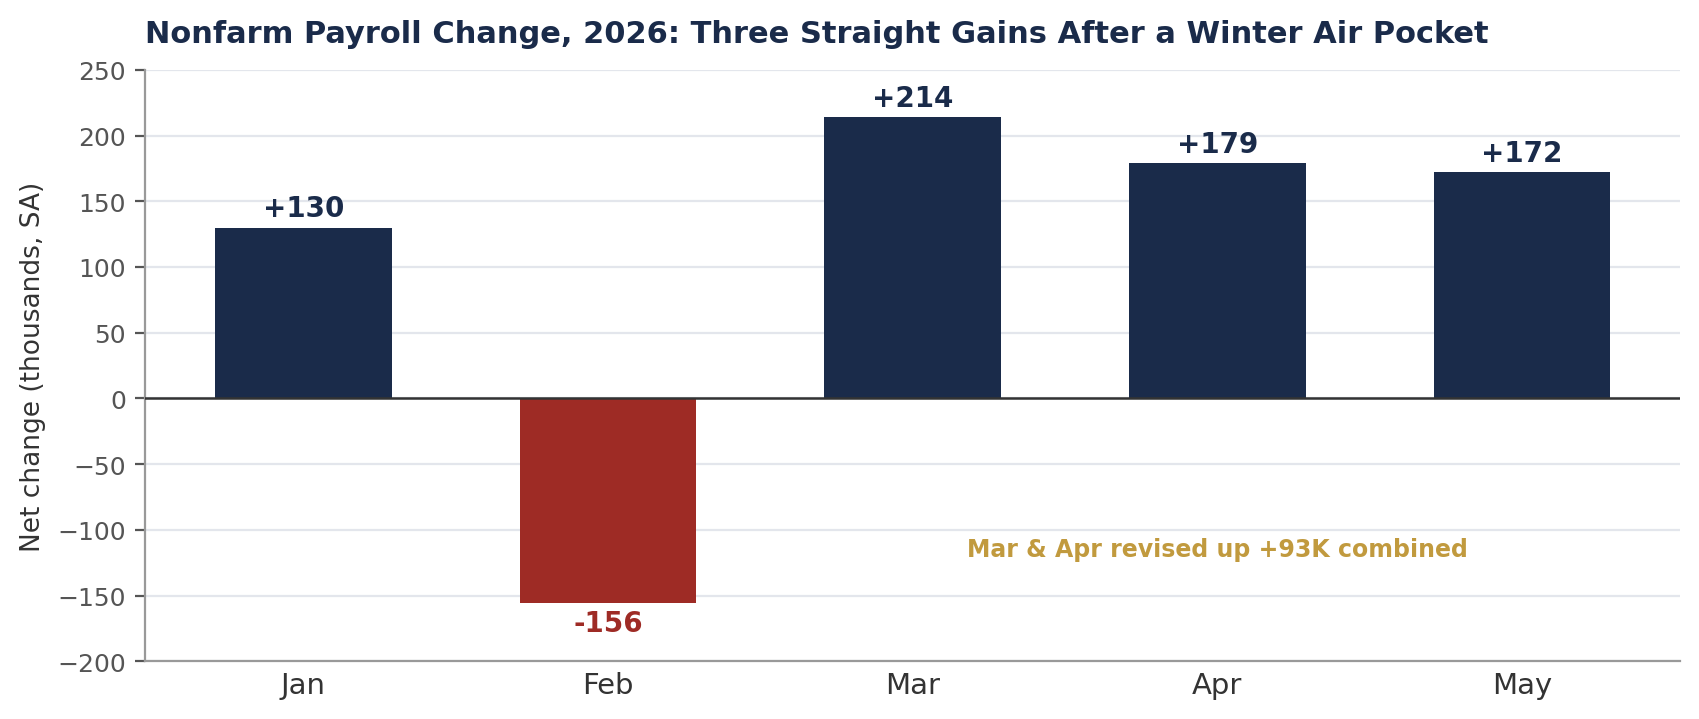
CONCENTRATED BY VOLUME, BROADENING BY BREADTH
The bulk of the May gain came from a familiar set of sectors. Leisure and hospitality added 70,000 jobs, local government 55,000 (almost entirely outside education), health care 35,000, and social assistance another 12,000. On their own, those categories more than account for the headline. But the more important story this month is what is happening beneath that concentration, where hiring is beginning to broaden. The one-month employment diffusion index rose on both a total private and a manufacturing basis, meaning a wider share of industries added workers than in recent months, and that improvement lines up with a firming ISM manufacturing survey.
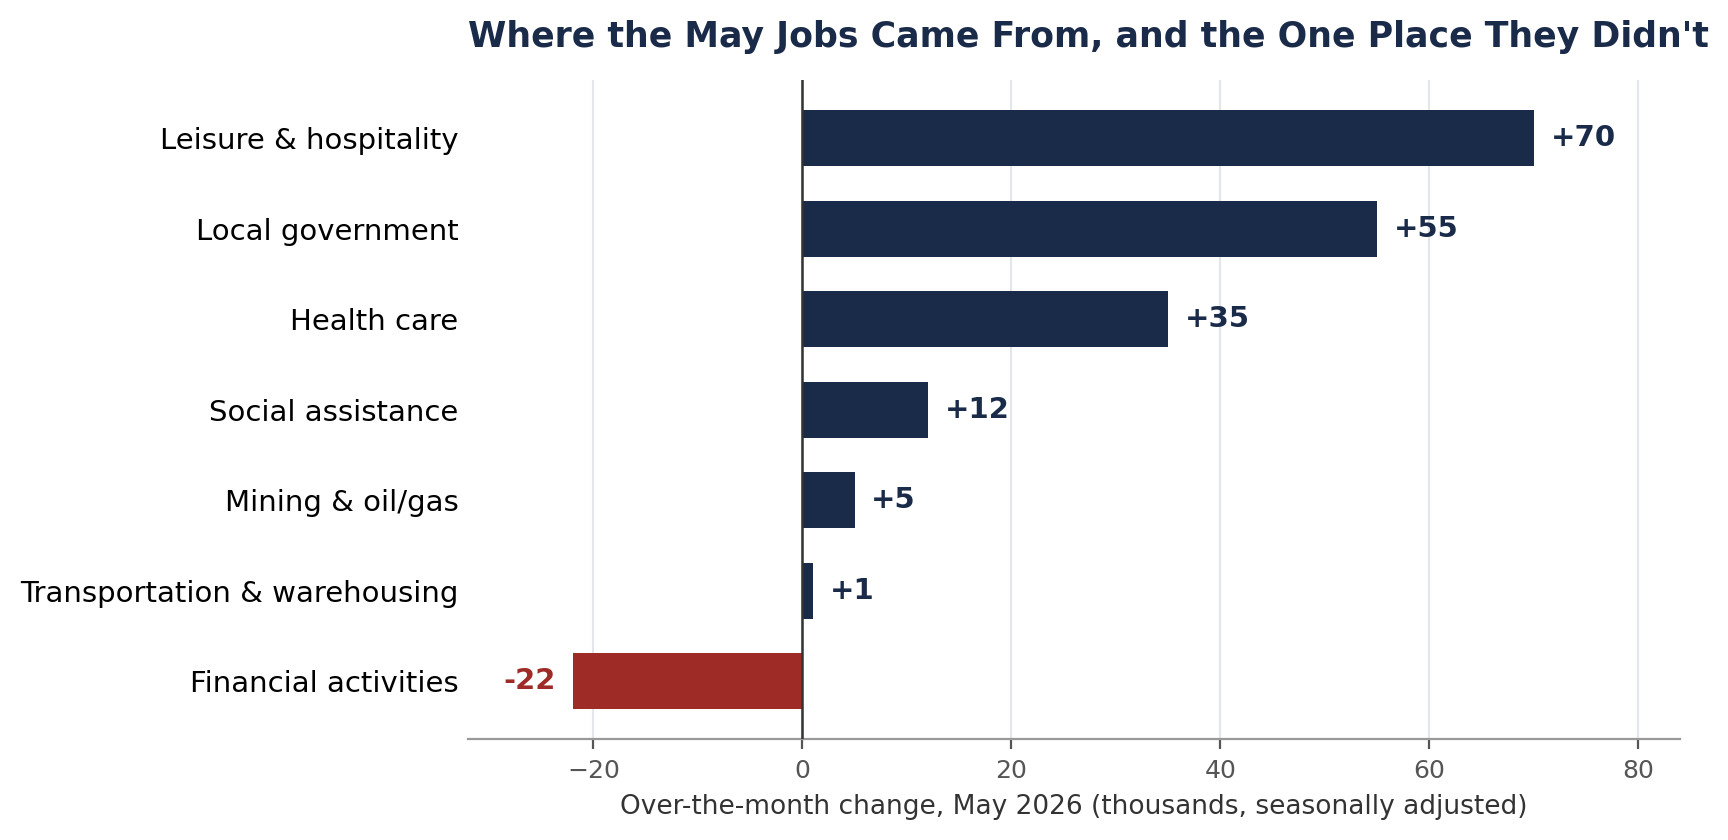
The manufacturing signal is the clearest evidence. The May ISM Manufacturing PMI climbed to 54.0%, its highest reading in four years, with new orders jumping to 56.8% and 16 of 18 industries reporting expansion. Factory employment within the survey rose more than two points. Manufacturing payrolls in the establishment data have not yet caught up, but employment historically follows sustained improvement in new orders and production with a lag of one to three months, precisely the sequence we described in January. Energy is adding to the breadth as well. Mining, quarrying, and oil and gas extraction added 5,000 jobs in May and is up 10,000 since February, a rational supply response to elevated crude and a sector that touches industrial activity across the Gulf Coast and Mountain West.
Manufacturing is a small share of total payrolls, but it punches well above its weight as a cyclical bellwether. Factory activity tends to turn before the broader economy, and it provides the cyclical impulse that pulls services hiring along behind it. Chart 3 shows the employment diffusion index moving in step with the ISM manufacturing gauge, with the factory survey turning up first and the broader labor market following.
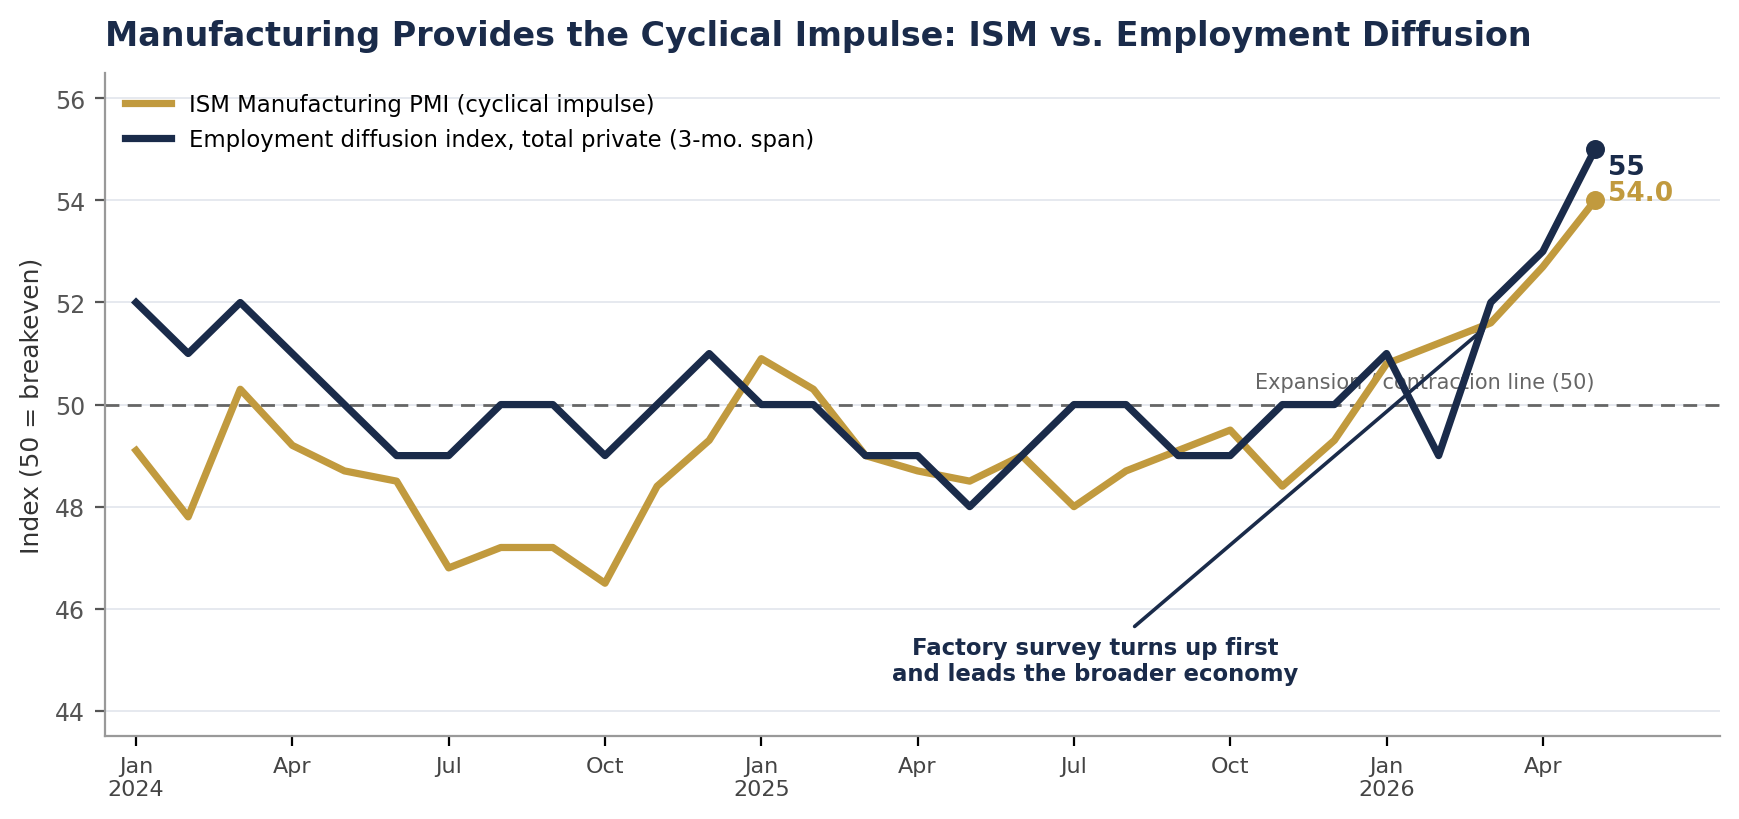
AGGREGATE HOURS: THE GROWTH SIGNAL
Average hourly earnings rose 12 cents, or 0.3%, to $37.53, while the average workweek held at 34.3 hours and manufacturing held at 40.4 hours. A steady workweek combined with a rising headcount means aggregate hours worked, the broadest real-time gauge of labor input into the economy, continued to climb in May. Employers typically lengthen the workweek before adding to payrolls, so firm hours alongside firmer hiring is an encouraging sign for the months ahead.
That matters for the growth outlook. By our tracking, aggregate hours worked are running at roughly a 2% annualized rate in the second quarter relative to the first, and when paired with the strong productivity trend underlying this capital-intensive expansion, that pace is consistent with solid real GDP growth. The Atlanta Fed's GDPNow model has been tracking Q2 real GDP around a 3% annual rate. Rising aggregate hours support household income and consumption even without a wage-growth acceleration, and they argue against any narrative of an economy losing momentum heading into the summer. Q2 real GDP could bring an upside surprise, and we will likely bump up our 2.8% forecast for the quarter.
THE ONE WEAK LINK: FINANCIAL SERVICES
If the breadth of hiring is encouraging, financial activities is the conspicuous exception. The sector shed 22,000 jobs in May and is now down 107,000 from its May 2025 peak, with May's losses concentrated in insurance carriers, down 11,000, and commercial banking, down 3,000. In our view, this is not random noise. It reflects a cluster of interest-rate-sensitive pressures bearing down on the industry at once. Housing activity remains sluggish, holding down mortgage origination and related employment. Consumer-credit delinquencies are rising, pushing lenders toward caution and loss mitigation rather than expansion. Light-vehicle sales have slowed, weighing on auto-finance volumes. And across the industry, firms are under visible pressure to cut costs as net interest margins and fee income come under strain.
Transportation and warehousing tells a milder version of the same story, essentially flat in May and still 92,000 below its February 2025 peak. Together, these pockets are a reminder that the rate-sensitive corners of the economy are still absorbing the cost of restrictive policy, even as the broader hiring picture firms. Beneath the steady 4.3% unemployment rate, there is also a subtle lengthening of jobless spells. The long-term unemployed are up 524,000 over the year and now make up 27.5% of all unemployed, even as short-duration unemployment fell sharply in May. The increase is consistent with some skill obsolescence tied to the rollout of AI.
WAGES AND THE REAL-INCOME SQUEEZE
The critical wage comparison is to prices. Nominal average hourly earnings rose 3.4% over the year, below the most recent 3.8% headline CPI reading for April, which means real average hourly earnings remain negative, continuing the squeeze we documented in detail following the April inflation reports. We will not have the cleanest read until the May CPI lands on June 11, but the direction is clear, as workers' paychecks are still losing ground to the cost of living. Crucially, wage growth running below inflation is the strongest evidence that this is not a wage-price spiral. Workers are not driving inflation by extracting outsized raises. An energy- and supply-driven cost shock is eroding their real incomes.
WHAT IT MEANS FOR THE FED
This is the report the hawks wanted and the doves feared. With inflation reaccelerating, with April core CPI at 0.4%, the Cleveland Fed's trimmed mean near 4.4% annualized, and producer prices up 6.0% year over year, the labor market was the one piece of the puzzle that might have argued for patience tilting toward easing. It did not cooperate. A third straight solid payroll gain, upward revisions, broadening industry breadth, a four-year high in the ISM, and a steady 4.3% unemployment rate remove any labor-market justification for a near-term cut and strengthen the hand of the two FOMC members who dissented in favor of a tightening bias on April 29. While we do not see a rate hike this year, we are warming to the idea that the next Fed move will likely be in that direction.
Incoming Chair Kevin Warsh inherits this configuration at his first meeting on June 16 and 17. The data give him cover to hold without appearing to bow to either side, but they do nothing to resolve the deeper tension. Inflation is demanding patience at minimum, the economy and labor market are offering no offsetting weakness, and the White House is demanding cuts. Markets that briefly flirted with pricing a year-end hike will read this report as validating that risk rather than retiring it.
We continue to expect a hold at the June meeting, with the statement shifting toward explicitly two-sided risk language. Our base case still allows for a 25 basis-point cut in September, but that path remains conditional on Hormuz normalization, energy prices receding materially by mid-summer, and shelter disinflation reasserting itself. A strong, broadening jobs report does not advance that timeline. If anything, it removes the labor-market urgency that would have argued for moving sooner. The live risk we flagged after the April inflation data, that the FOMC debate shifts from when to cut to whether to hike, is not retired by this report. It is reinforced, and we are warming to the idea that the next Fed move, at some point in 2027, will be a rate hike. There is an awful lot of economic and geopolitical ground to cover before then, however.
BOTTOM LINE
May's employment report is strong where it is easy to see and, for the first time in a while, encouraging beneath the surface as well. The headline, the upward revisions, the steady unemployment rate, broadening industry breadth, a four-year high in the ISM, and rising aggregate hours together describe a labor market that is not just holding up but firming. This is the cyclical lift we anticipated in January, now beginning to supplement the structural, capital-intensive expansion. The one genuine soft spot is financial services, where sluggish housing, rising credit delinquencies, slower vehicle sales, and cost pressures are converging.
For the Fed, that strength is a double-edged sword. A broadening, resilient labor market is good for growth and for households' nominal incomes. But against a backdrop of reaccelerating inflation and still-negative real wages, it removes the last excuse for easing and keeps the central bank boxed in. The June meeting will be one of the most consequential in years.
WHAT WE ARE WATCHING
- May CPI (June 11): The most important print before the FOMC. A second consecutive firm core reading would materially raise the hike probability and confirm the real-wage squeeze.
- Warsh's first FOMC and press conference (June 16 and 17): Watch his framing on whether the spring inflation is a supply shock or a broadening trend, and what conditions he sets for any future cut.
- Manufacturing follow-through: Whether the four-year-high ISM and improving diffusion translate into actual factory payroll gains over the next one to three months, confirming the breadth signal.
- Financial services and the rate-sensitive complex: Housing activity, consumer-credit delinquencies, and light-vehicle sales, the channels driving the sector's job losses.
- Aggregate hours and real wages: Whether hours sustain their Q2 pace and whether nominal wage growth can close the gap with inflation into the summer.
Chief Economist, Piedmont Crescent Capital
mark.vitner@piedmontcrescentcapital.com · (704) 458-4000
Sources: U.S. Bureau of Labor Statistics, Employment Situation, May 2026 (June 5, 2026), and employment diffusion indexes (3-month span, total private); ADP National Employment Report; Institute for Supply Management, Manufacturing PMI, May 2026; Federal Reserve Bank of Atlanta, GDPNow; CME FedWatch; Dow Jones consensus surveys; Federal Reserve Bank of Cleveland; Piedmont Crescent Capital, April Inflation Reports Top Expectations (May 13, 2026).
Disclaimer: This publication has been prepared for informational purposes only and is not intended as a recommendation, offer, or solicitation with respect to the purchase or sale of any security or other financial product, nor does it constitute investment advice.
Two Markets, Two Americas, One Unsigned Deal
 June 1, 2026
A View from the Piedmont
Our Weekly Commentary on Money, Credit, Exchange Rates and Geopolitics
Two Markets, Two Americas, One Unsigned Deal
Three things defined the week: a data-heavy run that mostly confirmed our priors, a burst of US–Iran diplomacy that has yet to close, and the opening days of the Warsh Fed. The data showed a Q1 that was softer than first reported and a Q2 shaping up considerably stronger, with capital spending again carrying the load. While headline measures have spiked, underlying inflation keeps drifting sideways. The labor market is still in its low-hire, low-fire holding pattern. The capital-cycle thesis remains intact.
The week’s most uncomfortable number came from the New York Fed’s Q1 Household Debt and Credit Report, and it landed on the front page of the Wall Street Journal. Credit card delinquency of 90 days or more rose to 13.1%, the highest since 2011. Serious auto-loan delinquency is running near 5.4%, not far from financial-crisis levels. Aggregate delinquency, at 4.8%, looks calm, but the average hides the split underneath. The recovery, the capital cycle, and record margins now sit next to a lower-tier consumer who is falling behind. Both are true at once. The market is pricing only the first.
On geopolitics, the week ended unresolved but closer to a deal. The U.S. and Iran reached a tentative memorandum of understanding on Thursday to extend the ceasefire 60 days, reopen the Strait of Hormuz, and restart nuclear talks. President Trump left a two-hour Situation Room meeting on Friday without a final call, citing language on uranium disposition and Hormuz tolling. The deal is close. It is not signed.
What follows walks through the week’s data, the New York Fed credit picture, the Warsh Fed’s first public comments, the state of the Iran talks, a short Ukraine update, and Treasury Secretary Bessent’s Reagan Forum speech on reshoring. We close with the scenario framework and an updated forecast table.
The Macro Backdrop: Revisions Down, Nowcast Up
It was a busy week for economic data. The second estimate of Q1 GDP landed, April durable goods orders printed, the April Personal Income and Outlays report carried the PCE inflation read, and the Consumer Confidence Index for May rounded out the week. The Atlanta Fed cut its Q2 GDPNow estimate to 3.0% in today’s update, down sharply from 3.8% last week and now within two-tenths of our own forecast. The picture is familiar: weaker in the rearview mirror, stronger through the windshield, with the capital cycle still in the driver’s seat.
Q1 GDP revised down to 1.6%. The Bureau of Economic Analysis (BEA) cut its Q1 2026 growth estimate to a 1.6% annual rate on Thursday, May 28, down from the 2.0% advance reading, mostly on softer investment and consumer spending. The PCE price index held at 4.5% for the quarter; core PCE was nudged up a tenth to 4.4%. Real gross domestic income rose 0.9%, and the average of GDP and GDI, which some view as a steadier signal than either alone, came in at 1.3%. Corporate profits from current production rose $40.4 billion, a sharp slowdown from the $246.9 billion fourth-quarter gain. The revision itself matters less than the timing: the Q1 softness was front-loaded into the weeks before the war intensified, and the energy shock runs mainly through Q2 and beyond.
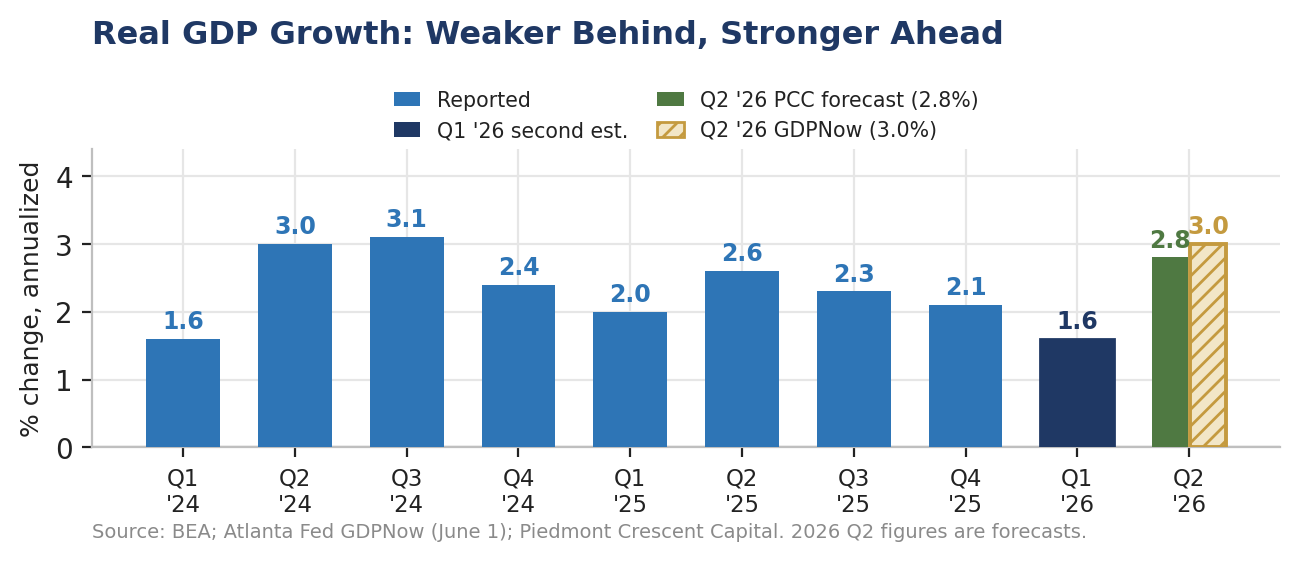
Durable goods jumped on aircraft; core capex slipped following strong earlier gains. April durable goods orders surged 7.9% to $346.0 billion, well past the 4.0% consensus and the largest monthly gain since last May, with new orders up 17.2% from a year earlier. Transportation drove it, rising 21.5% on a wave of nondefense aircraft orders. Excluding transportation, orders rose 1.1%. Core capital goods orders, which strip out defense and aircraft and are a proxy for business investment, fell 1.1% in nominal terms and 1.45% after adjusting for prices. Shipments rose 0.5%, unfilled orders 1.7%, inventories 0.3%. The aircraft surge will flatter second-quarter investment in the GDP accounts even as the underlying capex signal cooled. Whether that cooling is the war weighing on investment decisions or simply payback for earlier strength should show up in the May and June data. We lean toward the former and expect the capex trend to remain in place.
April PCE inflation came in about as expected. Core PCE rose 0.2% on the month and 3.3% from a year earlier, in line with consensus and a tenth below the prior monthly pace. Headline PCE rose 0.4% and 3.8% year over year, the energy pass-through doing the work. Personal income was roughly flat. The Dallas Fed’s trimmed-mean PCE rate, which Chairman Warsh singled out in his Senate testimony as a cleaner gauge of underlying pressure, held at 2.3% over twelve months. The read is unchanged: oil is pushing the headline around while the trend measures stay contained and point lower. Treating the war as a one-time supply shock rather than a new inflation regime remains the most defensible interpretation, although price increases appear to us to be a bit broader than the trimmed-mean PCE deflator suggests.
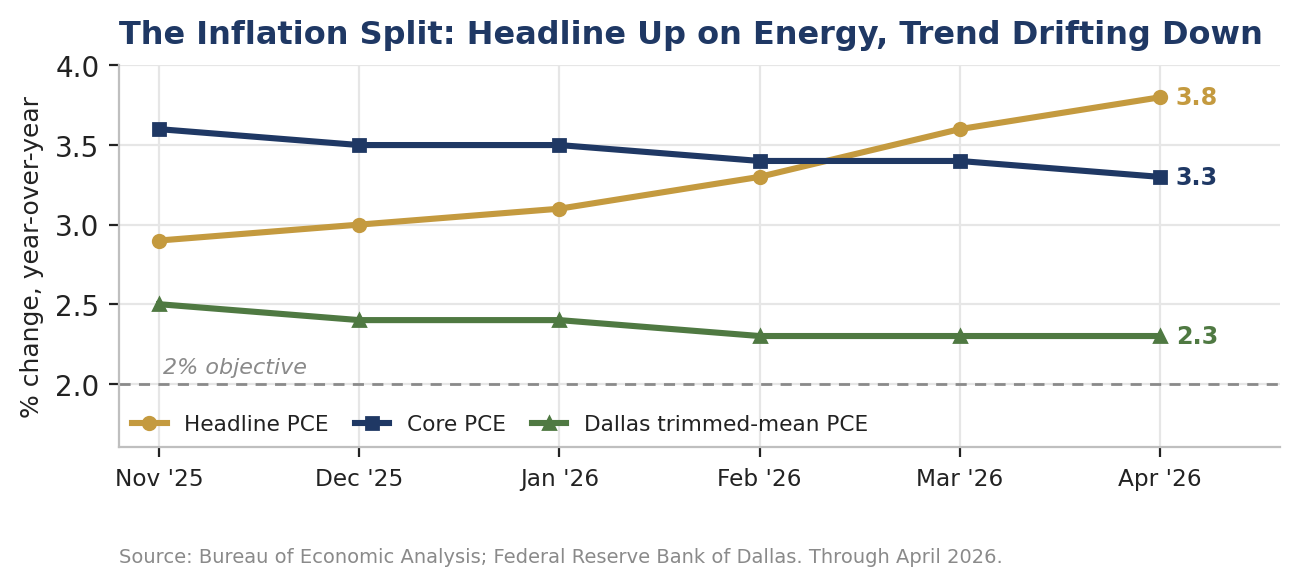
Atlanta GDPNow cut to 3.0% for Q2; our call is 2.8%. The Atlanta Fed’s nowcast was cut to 3.0% in today’s update, down from 3.8% last week and a 4.3% peak on May 21. The path tells the story: 3.7% at the start of May, 4.3% mid-month, 3.8% after the GDP revision and durable goods print, and now 3.0% as the model digests the softer underlying data. That move brings the nowcast within two-tenths of our own 2.8% forecast, which we have held for weeks. We had argued the higher prints were flattered by the aircraft-driven jump in durable goods and a likely inventory build, while the cleaner signal from core capital goods orders softened and consumer spending lost momentum. Today’s revision is the model catching down to that view rather than the other way around. Either way the message holds: capital spending and government outlays are running hot, the top of the income distribution is steady, and the bottom is softening. The still-firm Q2 headline conceals that split.
Consumer credit, plainly. The New York Fed’s Q1 2026 Household Debt and Credit Report is the most uncomfortable read we have seen in a while. Total household debt edged up 0.1% to $18.8 trillion. Credit card balances fell seasonally by $25 billion to $1.25 trillion, yet the serious delinquency rate, which are accounts 90 days or more past due, rose to 13.1%, the highest since 2011. Auto balances climbed to $1.69 trillion with serious delinquency near 5.4%, close to financial-crisis levels. Student loan balances were flat at $1.66 trillion, with serious delinquency up to 10.3% from 9.6% in Q4 as repayment strains persist. Mortgages remain in good shape: HELOC balances keep expanding and overall mortgage delinquencies sit near historic lows. Aggregate delinquency, at 4.8%, is little changed. But the K-shape is now obvious, and the stress is concentrated among lower- and middle-income households. This is not a recession signal by itself; the mortgage book is too clean and the labor market too steady for that. It is, though, a real constraint on discretionary spending as the year wears on, and the first place to watch if hiring falters.
Piedmont Perspective: Two Americas, One Economy
S&P 500 net profit margins hit 13.4% in Q1, the highest since FactSet began tracking the series in 2009. Information Technology led at 29.1%, up from 25.4% a year earlier. Across the index, 84% of companies beat EPS estimates, and earnings ran 18.2% above forecasts against a five-year average of 7.3%. Capital deployed well is earning returns at a breadth we have not seen since the late 1990s.
Over the same stretch, credit card delinquency reached 13.1%, also a post-2011 high, and auto stress is brushing financial-crisis levels. Aggregate delinquency looks stable at 4.8% only because the mortgage book is so clean and roughly two-thirds of household debt sits in mortgages, where the prevalence of low fixed-rate mortgages and equity cushions are providing a powerful offset. The rise in auto delinquency rates is another headwind for light vehicle sales, which remain under pressure from payback for the COVID-era surge sales that occurred at or above the sticker price then and have left many car owners with negative equity now.
Two nearly identical numbers, pointing in opposite directions. The asset-owning, equity-holding economy is having a banner year. The wage-dependent, revolving-credit economy is sinking. The labor market sits in between, in its low-hire, low-fire stall, masking the gap for as long as layoffs stay low. The risk we care most about is not inflation, the war, or the Fed. It is whether the bottom half of the income distribution can hold on long enough for the capital cycle to feed through into wages. That has historically taken several quarters of sustained capital deepening, and it is the reason we stay constructive on the medium term even as we flag the near-term risks to household finances.
The timing of the dampening near-term effects on employment and income and intermediate to long-term productivity-enhancing effects puts the Fed in a bind. Cutting harder might ease the strain on indebted households, but the better inflation gauges are not yet at target, and the capital cycle does not need help. Remaining restrictive keeps inflation moving the right way but allows the credit stress to compound. The Warsh framework, leaning on trimmed-mean measures and a structural optimism about productivity, can sit still for a while. The political pressure to cut, already building before the war, will be back as soon as the war recedes.
The Warsh Fed’s First Week of Commentary
Chairman Warsh was sworn in on May 22 and elected FOMC chairman by the Committee the same day, succeeding Chair Powell, whose term as chair ended May 15. Minutes of the April 28–29 meeting, released May 20 ahead of the handover, showed the 8–4 split we covered last week. This week brought the first substantive remarks under Warsh, from Vice Chair Jefferson, Governor Cook, and Vice Chair for Supervision Bowman, plus Governor Waller and Powell himself in his final public appearance.
Jefferson (May 27, Tokyo). Speaking at a Bank of Japan conference, Jefferson said the global inflation impulse from the Iran shock is large but so far concentrated in energy and energy-adjacent categories, with longer-run expectations still anchored across major economies. His tone was measured, with no near-term policy signal. What stood out was his focus on the cross-border transmission of the shock and the implications for the trade-weighted dollar, an increasing concern for the Treasury market as deficits stay wide.
Cook (May 27, Stanford). Cook addressed AI, the economy, and the financial system. She acknowledged that AI is delivering measurable productivity gains today and is likely to compound, while flagging the financial-stability risks of the capex boom, particularly the private-credit channels funding data-center and power buildout. The mix of optimism on potential and caution on financing tracks Warsh’s framework closely. The Fed looks increasingly comfortable with the productivity story and increasingly attentive to how it is being financed.
Bowman (May 29, Reykjavík). Bowman focused on conducting policy under uncertainty, arguing that any easing should be gradual and data-dependent, with attention to whether the trend measures keep drifting lower despite the energy-driven headline. No near-term preference, but a reinforcement of the Committee consensus: patience, data dependence, and explicit caution about the war’s distortion of the headline.
Waller (May 22 Frankfurt, May 31 Dubrovnik). Waller spoke on the outlook in Frankfurt and on stablecoins in Dubrovnik on Sunday. The Frankfurt remarks were the week’s most substantive: the labor market is roughly in balance, the war’s inflation impulse should fade through the back half of the year, and the run-rate of underlying inflation, on the Dallas trimmed mean, is consistent with the Fed’s longer-run goal. That reads more dovish than the rest, though Waller stopped short of calling for cuts.
Powell (May 31, Boston). Powell delivered acceptance remarks for the John F. Kennedy Profile in Courage Award on Sunday, reflective rather than forward-looking on policy. His term as Governor runs through January 2028, and he has not said whether he will stay on the Board. The market assumes he will, which matters for the internal balance of the Committee even with Warsh in the chair.
Net read. The opening week was patient and data-dependent, consistent with our view that the next move is more likely a cut than a hike, with the timing firmly in the back half of the year. We still expect the first cut in September if the trend on inflation cooperates and the labor market holds. A second cut in December is plausible but increasingly hinges on the consumer-credit picture not deteriorating.
Geopolitics: Iran Close, Not Done; Ukraine Attritional
Iran and Hormuz: a tentative MOU awaiting signature. The week’s biggest development was a tentative U.S.–Iran memorandum of understanding to extend the ceasefire 60 days, reopen the Strait of Hormuz, end the U.S. blockade of Iranian ports, and reopen nuclear talks. Trump sketched the outline on May 23, saying a deal had been “largely negotiated” pending sign-off from several Gulf states and Israel. The two sides reached the tentative framework on Thursday, May 28, with Treasury Secretary Bessent calling it the “makings of a deal.” On Friday, Trump entered the Situation Room to make a final determination, attaching two key conditions: Iran’s highly enriched uranium “unearthed by the United States” and destroyed, the strait reopening with no tolls. He left after two hours without an announcement. As of Sunday, no signature is confirmed.
The mechanics matter. The framework sets a 60-day ceasefire window: the strait reopens toll-free, Iran clears deployed mines within 30 days, the U.S. lifts the blockade, and nuclear talks resume. Sanctions relief and the unfreezing of certain assets are flagged for negotiation during the window, contingent on the strait operating normally. Kazakhstan has publicly offered to take Iran’s enriched-uranium stockpile, one route to settling the disposition question. The IRGC, Hezbollah, and Iranian hardliners continue to object to the main terms. The administration says Iran reneged on earlier uranium commitments, and the Pentagon reported Thursday that Iran fired a ballistic missile toward Kuwait and moved drones around the strait. So we are closer to a deal but not done.
Markets have moved. Brent eased toward $95 by Friday, well off the mid-May high near $119, on deal optimism. U.S. retail gasoline has retraced toward $4.20 a gallon, still above pre-war levels but off the peak. The World Bank, IMF, and IEA issued a joint statement Friday warning that if shipping does not normalize soon, the continued rapid drawdown of global oil inventories ahead of peak summer demand would raise risks to fuel security and broader resilience. The timing was deliberate: the institutions want closure before the driving season.
Our read: the deal probably gets done, with edits. The framework is close enough that both sides can sell it as a win. Trump can say Iran’s nuclear program will be dealt with over the next 60 days; Iran can point to sanctions relief and a lifted blockade in exchange for safe passage. The sticking points: the uranium-destruction and Hormuz-tolling language are exactly the pieces each side needs for its domestic story. We expect an announcement this week, possibly with further textual edits or side letters that paper over the gaps. The risk is that hardliners or the IRGC derail it first, or that another incident kills the moment. We raise our base-case probability that the strait reopens by mid-summer to 55% from 50% and hold the downside at 30% because the deal is not done.
Ukraine: attritional, with new NATO friction. The Institute for the Study of War describes a grinding rather than turning conflict. Russia is preparing another large aerial strike. Ukrainian forces hit a Russian Iskander system in Rostov Oblast overnight on May 29–30 and continue to remote-mine supply lines in occupied territory. The more consequential event for NATO was a Russian Geran-2 drone strike on an apartment building in Galati, Romania, on the night of May 28–29. Moscow is running a two-track response, deflecting blame onto Ukraine while laying groundwork to absolve itself of future strikes against Moldova (read our previous research on Moldova). The pattern is familiar, and the implications for the Article 4 and Article 5 thresholds are material. Ukraine continues to burn through Russian materiel faster than Moscow can replace it, though when that constraint binds is still unclear. Putin’s approval slipped again in state polling, a series we treat skeptically, and Russia is reportedly letting private firms buy air-defense and counter-drone systems, a sign the federal supply squeeze is real.
Policy: Bessent at the Reagan Forum and the Reshoring Trade
Treasury Secretary Scott Bessent used the Reagan National Economic Forum in Simi Valley on Friday to lay out the administration’s economic-security doctrine in an address titled “While America Slept,” followed by a fireside chat with Larry Kudlow. The title is a nod to Churchill’s 1940 wartime address “While England Slept.” We flag it because the framing provides insight into the priority the Administration places on this issue and provides an idea where tariffs, procurement, and investment are headed. This matters more for the medium-term capital cycle than any single data point this week.
Bessent’s thesis is that decades of optimizing supply chains for cost and efficiency hollowed out domestic capacity in the industries that matter most in a crisis: semiconductors, rare earths, pharmaceuticals, and defense goods; and that this is a national-security problem, not merely an economic one. “We mistook comfort for strength,” Bessent said, faulting a generation of policy that treated efficiency as a substitute for resilience and consumption as the measure of prosperity. He organized the agenda around three pillars: industrial dominance, domestic investment, and preparedness. The bottom line, however, is building resilience.
What it implies for trade policy. The direction is clear. Expect tariffs aimed specifically at imports from adversarial nations rather than uniformly across partners, paired with a willingness to use the federal balance sheet directly: Bessent floated taking equity stakes in strategic sectors such as rare earths and pharmaceuticals to offset what he framed as non-market competition from state-subsidized foreign producers. The throughline is selective decoupling from rivals, China in particular, and a tighter weld between trade policy and national security, with semiconductors and U.S. reliance on Taiwan singled out as the priority vulnerability. This is a more surgical, more interventionist trade posture than a simple tariff wall, and a less predictable one for firms whose supply chains run through targeted countries.
What it implies for reshoring. Continuity, with acceleration. The speech reinforces the capital-cycle thesis at the center of this report: federal policy is now actively subsidizing and protecting domestic capacity in chips, critical minerals, pharma, and defense, which underwrites multi-year capex in exactly those areas. The cost is a structurally higher price level, as resilience is more important than efficiency, and more supply-chain friction for import-dependent businesses. Net, it is constructive for domestic industrial capex and the companies building it, and a margin-and-complexity headwind for firms sourcing through rival nations. It also fits the week’s other threads: the same logic that wants chips and minerals onshore is the logic behind the financial pressure on Iran that Bessent and Kudlow discussed.
Markets & Financial Conditions
Equities still take the constructive view. The S&P 500 finished near record highs on deal optimism and the breadth of Q1 earnings. The 10-year Treasury yields about 4.45%, the 2-year 3.84%, and the curve is positively sloped by roughly 61 basis points. The long end has eased on de-escalation hopes, but term premium keeps rebuilding on heavy issuance, and a growth backdrop the bond market increasingly accepts.
Brent settled near $95 Friday, off the $119 mid-May peak but still well above pre-war levels. Commercial stocks are tight: the IEA puts Persian Gulf production losses near 14 million barrels a day, and U.S. refined-product stocks have drawn for thirteen straight weeks on gasoline and ten on distillates. The supply math stays tight even with the diplomacy. A clean strait reopening in June would point Brent toward $80 by year-end, risks two-sided. A collapse puts $120 back in play.
Credit has widened modestly over the past two weeks on the consumer story, with high-yield spreads roughly 25 basis points wider to Treasuries and BB paper a bit more. It is not yet stressful, but it shows the market starting to absorb the New York Fed report. Investment grade remains tight.
CFO & Treasurer Corner: What This Means for Corporate Finance
Funding & liquidity. The fixed-rate window is open but unlikely to improve much soon. With the 10-year near 4.45% and term premium rebuilding, keep locking fixed-rate funding opportunistically, and pull forward 2027 and 2028 maturities where the trade-off allows. Floating-rate borrowers should stress interest coverage assuming the 10-year holds at or above 4.40% through year-end.
Energy & input costs. Brent at $95 beats $119 but is still elevated, and diesel and middle distillates remain the choke point. Firms exposed to freight, logistics, or petrochemical inputs should keep stress tests on 2026 cost assumptions in place. The hedging window may widen if the deal closes cleanly, but do not count on it.
Consumer exposure. The New York Fed credit data belongs in board discussions, particularly with the recent weakness in real incomes. Businesses serving lower- and middle-income households should model demand sensitivity to rising card delinquencies; auto-related firms should model further weakness in lower-tier credit; and anyone in subprime-adjacent lines should revisit reserve assumptions.
Capital allocation. The capital-cycle thesis continues to hold. Commitments tied to AI, power generation, grid, and reshoring are on plan or accelerating, and the market keeps rewarding credible productivity narratives; the Alphabet-versus-Meta divergence earlier this season is the cleanest illustration. The bar for capex without a clear margin path is rising.
Planning assumption. Our base case has the strait reopening by mid-summer, the MOU signed within two weeks, and Brent retracing toward $80 by year-end. Full-year GDP near 2.5%, led by capital spending. The Warsh Fed cuts 25 bps in September, with a December cut conditional on labor and credit holding up. With the downside at 30% and consumer credit a fresh risk, boards should model both a war-escalation case and a deepening-consumer-credit case for Q3.
Looking Ahead
| Day | Release / Event | Why It Matters for CFOs & Markets |
|---|---|---|
| Monday | ISM Manufacturing (May); Construction Spending (April); Atlanta Fed GDPNow update | ISM is the cleanest read on whether the energy-cost impulse is still squeezing margins; watch the prices and employment indices. The GDPNow update folds in the durable goods and PCE prints and resets the Q2 picture. |
| Tuesday | JOLTS (April); Factory Orders (April); Total Vehicle Sales (May) | Job openings have drifted lower for months; another step down strengthens the case for a September cut. Vehicle sales will reveal more about dealer mindsets. |
| Wednesday | ADP Employment (May); ISM Services (May); Beige Book | ADP provides the best private-payroll assessment ahead of Friday. ISM Services has now expanded for 23 straight months. The Beige Book adds regional color on labor and prices. Look for signs of resilience or firming demand. |
| Thursday | Trade Balance (April); Initial Claims; Productivity & Unit Labor Costs (Q1 revised) | Trade has been volatile throughout the war. Claims remain the highest-frequency labor signal and remain near historic lows. The productivity revision speaks to the AI story that anchors the Warsh framework. |
| Friday | Employment Situation (May) | The main event. Consensus is roughly 90,000 payrolls with unemployment at 4.3%. Watch wage growth, breadth (which has been improving), and revisions. A clean print holds the low-hire, low-fire read; a soft one with rising unemployment pulls rate cuts forward. |
The open questions for the week: whether the Iran deal closes, whether the May payroll print holds or breaks the low-hire, low-fire equilibrium, and whether the consumer-credit stress in the Q1 New York Fed data kept building through April and May. How the numbers are read will matter more than the headlines.
Scenario Framework
| Scenario | Macro & Market Implications | Corporate Finance Action |
|---|---|---|
| Base Case55% | US–Iran MOU signed in early June; Hormuz reopens by mid-summer; Brent retraces toward $80 by Q4. Capital cycle runs on; Q2 GDP near 2.8% (in line with the 3.0% nowcast), full year around 2.5%. Labor stays low-hire, low-fire with unemployment 4.3–4.5%. Consumer credit stress is contained but persistent. Warsh Fed cuts 25 bps in September, possibly again in December. 10-year holds 4.30–4.60%. | Lock fixed-rate funding opportunistically. Stay with productivity-led capex. Build modest buffers on energy-sensitive inputs. Model lower-tier consumer softness in revenue. |
| Upside15% | Deal signs cleanly; Hormuz reopens faster than expected with mines cleared by July. Brent back to $70–75 by Q3. Capital cycle accelerates. Consumer credit stabilizes as gasoline slips below $3.50. Fed cuts 50 bps in H2. | Step up productivity-led capex. Shift working capital toward growth. Open the refinancing window wider. |
| Downside30% | Deal collapses or stalls in implementation; hardliners or the IRGC trigger a fresh Hormuz incident; Brent back above $120. Headline CPI re-accelerates above 4%. Consumer credit stress deepens. Fed on hold indefinitely. Credit spreads widen 50–100 bps. GDP slows toward 1.5% in H2. | Stress-test floating-rate exposure. Build liquidity. Defer non-essential capex. Hedge energy and freight. Review covenant headroom. |
Forecast Update
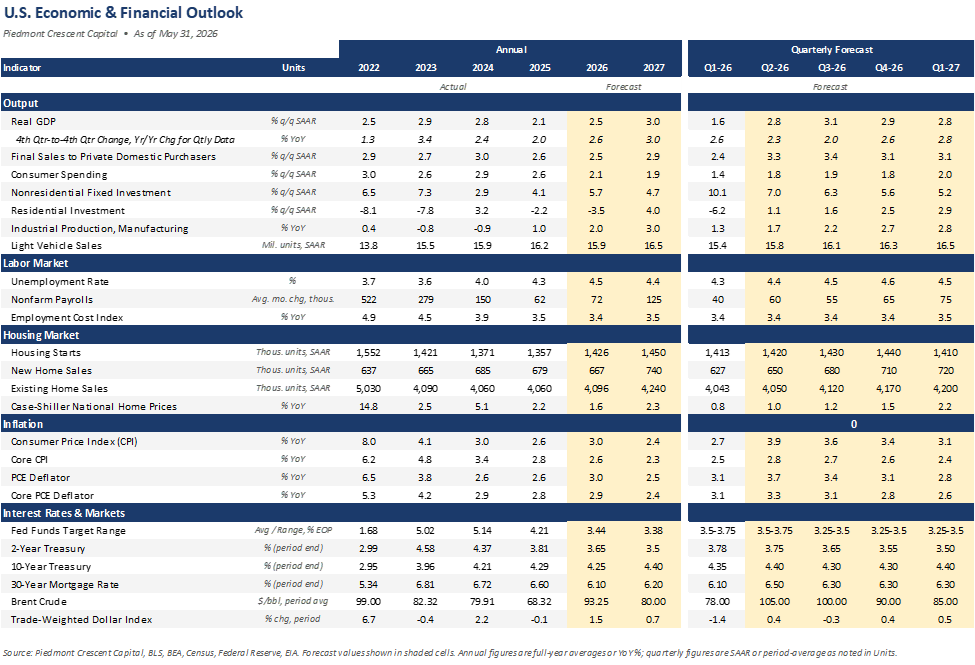
This commentary reflects the views of the author as of the date noted and is provided for informational purposes only. It does not constitute investment advice or a recommendation to buy or sell any security. Information has been obtained from sources believed to be reliable, but accuracy and completeness are not guaranteed. Past performance is not indicative of future results. © 2026 Piedmont Crescent Capital.
Piedmont Crescent Capital | A View from the Piedmont | June 1, 2026
The Capital Cycle Holds the Line as Inflation's Breadth Sends Yields Higher
The CAVU Compass · Monthly Macroeconomic Insights
The Capital Cycle Holds the Line as Inflation’s Breadth Sends Bond Yields Higher
Our 2.8% Q2 Forecast Holds. The April Inflation Breadth Is the Real Story. The 10-Year at 4.60% Is the Market’s Response.
By Mark P. Vitner, Chief Economist, Piedmont Crescent Capital · May 19, 2026
Download the Full PDF Report ↓
At a Glance
The capital-led expansion is real and broadening. Our Q2 real GDP forecast is 2.8%, unchanged for two months and supported by capital spending and resilient services consumption. April retail sales rose 0.5% on both headline and control, the third consecutive monthly increase and the data point most directly responsible for the Atlanta Fed’s GDPNow tracking estimate moving to 4.0% as of May 14, up from 3.7% on May 8. The composition matches the thesis we have been making since the start of the year: AI infrastructure, power, reshored pharma, an aerospace resurgence, and defense replenishment.
Industrial production posted its strongest gain in fourteen months. April industrial production rose 0.7% and manufacturing output rose 0.6%, the largest gain since February 2025. Motor vehicle production jumped 3.7% and high-tech output rose 1.0% for a second consecutive month. Capacity utilization moved up to 76.1%. The Empire State manufacturing index jumped to 19.6 in May, a four-year high.
Q1 GDP confirmed the bridge. Real GDP rose 2.0% in Q1, slightly below the 2.3% consensus, with investment the largest contributor. The bridge to a stronger Q2 runs through capital spending, inventory rebuilding, and a consumer that is resilient outside of durable goods.
The labor market did exactly what we thought it would. April nonfarm payrolls rose 115,000, well above the 55,000 consensus, with ADP corroborating at 109,000. Unemployment held at 4.3%. February payrolls were revised down again, to a net loss of 156,000. The low-hire, low-fire equilibrium continues. It is stable without being good, with the risks stacked to the downside and hiring confined to a narrow set of industries.
The underlying inflation picture received a major wake-up call in April. The breadth of the increase is the story. Headline April CPI rose 0.6% m/m and 3.8% YoY, the highest annual reading since May 2023. More consequentially, the Cleveland Fed median CPI and 16% trimmed-mean CPI both rose 0.4% m/m, double the March pace. When measures designed to see through any single category move in lockstep with the headline, the impulse is no longer confined to gasoline. This is the measurement issue Kevin Warsh raised in his confirmation testimony, and the very measures he chose to highlight. He will have to address that at the first meeting he presides over in June.
The April PPI surge points to margin compression more than substantial final-price acceleration. Headline PPI rose 1.4% m/m, the largest monthly gain since March 2022, with the year-over-year rate at 6.0%. Services PPI rose 1.2%, with two-thirds of the move coming from trade services. PPI at 6.0% YoY against headline CPI at 3.8% is the cleanest measure we have of margin compression in the producer pipeline. Firms without pricing power are absorbing the energy and tariff impulse rather than passing it through.
The 10-Year at 4.60% is the market’s read on the inflation debate. The 10-Year Treasury closed May 15 at 4.60%, the highest since January 2025. The 30-Year closed at 5.12%. The 30-year fixed mortgage rate has pushed to roughly 6.46%, well above where it sat at the end of February. The bond market has now ruled out a rate cut through 2026 and is pricing better than a 1-in-3 chance of a hike before year-end.
The Fed is genuinely divided, and the room to cut has narrowed. The 8-4 April 29 hold was the most dissents since 1992. Miran preferred a cut; Hammack, Kashkari, and Logan supported holding but objected to the easing bias. That move appears prescient today. Markets have moved from pricing roughly 8 basis points of cuts through year-end at our April 26 weekly to pricing essentially no cuts through 2026, with hike probability at roughly 39% post-PPI.
Powell stays on the Board through January 2028; Warsh chairs from June 17. Powell’s continued presence is a stabilizing factor for institutional continuity but is still unnerving. Warsh’s framework calls for restrictive policy until inflation is anchored, continued balance sheet normalization, stronger price discovery, and explicit recognition of Treasury-Fed interdependence. His structural optimism about productivity is the underappreciated element and is consistent with our capital-cycle thesis.
The Trump-Xi summit was a win, not just a non-harm. The May 14 Beijing meeting produced joint language that the Strait of Hormuz must remain open, H200 chip clearances for ten Chinese firms, Chinese commitments to purchase up to 200 Boeing aircraft and billions of dollars of U.S. agricultural products, and the restoration of Chinese imports of American beef. Xi’s framing of Taiwan as the “most important issue” in U.S.-China relations, with the warning that mishandling it risks “collision or conflict,” is the more consequential signal for CFOs with East Asia exposure.
Our scenario probabilities. Base Case (50%): outline agreement on Iran by late May or early June, with some additional military action likely along the way; Hormuz reopens by mid-summer; Brent retraces toward $80 by year-end; capital cycle drives Q2 and Q3 GDP at 2.5 to 3.0%; the Warsh Fed delivers one cut in September. Upside (15%): the summit’s Hormuz language translates into actual Chinese leverage on Tehran; agreement closes faster than expected; Brent returns to $75–$80 by Q3. Downside (35%): negotiations stall; Brent re-accelerates above $130; headline CPI re-accelerates above 4%; the consumer cracks visibly in lower-income segments; the Fed is pinned indefinitely.
Market Snapshot
| Indicator | Level | Context |
|---|---|---|
| Brent Crude | ~$107 / bbl | Off the May 4 mid-week peak above $114 after the UAE attack and Project Freedom launch; pulled back further post Trump-Xi |
| WTI | ~$102 / bbl | Net 7% higher on the week despite the Trump-Xi pullback |
| 10-Year Treasury | ~4.60% | Friday close; highest since January 2025; sharp move post CPI and PPI |
| 2-Year Treasury | ~3.88% | Curve steepening; markets pricing essentially no cuts through 2026 |
| 30-Year Treasury | ~5.12% | Term premium continuing to rebuild; through 5% for the first time since 2024 |
| Yield Curve (2s10s) | +72 bps | Bear-steepened materially on growth firmness and rate-cut repricing |
| 30-Year Fixed Mortgage | ~6.46% | Up from 5.98% on Feb 26; MBS spread now widest since December |
| Fed Funds Target | 3.50–3.75% | Held April 29 on an 8-4 vote; most dissents since 1992 |
| PCC Q2 Real GDP Forecast | 2.8% | Capital spending and resilient consumer leading; risks balanced |
| Atlanta GDPNow Q2 | 4.0% | Up from 3.7% on May 8; latest as of May 14; upside risk to our forecast |
| April Retail Sales | +0.5% m/m | Third consecutive monthly increase; control group also +0.5% |
| April Industrial Production | +0.7% m/m | Strongest in 14 months; manufacturing +0.6%; motor vehicles +3.7% |
| Empire State (May) | 19.6 | Highest reading in over four years |
| Headline CPI (April) | 3.8% YoY | Highest since May 2023 |
| Core CPI (April) | 2.8% YoY | Highest since September; m/m at 0.4% |
| Cleveland Median CPI | 0.4% m/m | Doubled from March’s 0.2%; the most consequential single data point |
| 16% Trimmed-Mean CPI | 0.4% m/m | Also doubled from March; the disinflation comfort narrowed |
| Dallas Trimmed-Mean PCE (Mar) | 2.4% YoY | 12-month rate; 1-month annualized 2.9% |
| Headline PCE Deflator (Mar) | 3.5% YoY | Pre-April CPI breadth; May 28 release captures more of the impulse |
| Core PCE Deflator (Mar) | 3.2% YoY | Same caveat as headline |
| Headline PPI (April) | 6.0% YoY | Largest annual increase since December 2022 |
| Brent vs. Pre-War | +47% | Pre-war reference: ~$73/bbl |
| Retail Gasoline | $4.54 / gal | National average; up from $4.30 a month ago |
| S&P 500 | ~7,440 | Record close above 7,500 on Thursday’s Cisco-led rally before Friday profit-taking |
| Hike Odds (CME) | ~39% | First meaningful hike probability since the 2023-24 cycle |
Sources: BLS, BEA, EIA, AAA, CME Group, Freddie Mac, Atlanta Fed, Cleveland Fed, Dallas Fed, Federal Reserve Board, FRBNY ACM, FactSet, U.S. Census Bureau. As of close Friday May 15, 2026.
The Macro Backdrop
The data since the April 19 Compass has clarified the picture along the lines we anticipated. The capital cycle is real and broadening. The labor market is cooling gradually without breaking. Underlying inflation took a meaningful step in the wrong direction. The geopolitical situation, which we sketched as approaching the brink last month, has shifted toward cautious optimism. We treat each on its own terms below.
Q1 GDP at 2.0% confirmed the bridge from a soft Q1 to a stronger Q2. April retail sales at +0.5% on headline and control, the third consecutive monthly increase, defied the consensus that the energy drag would begin to bite into discretionary categories. The April industrial production print at +0.7% headline, with manufacturing at +0.6%, was the most direct piece of evidence to date that the capital cycle is showing up in the hard data. Capacity utilization moved to 76.1%. Empire State at 19.6 in May, a four-year high, suggests the May data will keep this picture intact. The Atlanta Fed’s GDPNow at 4.0% as of May 14, lifted from 3.7% on May 8 by the retail sales and industrial production releases, is the upside marker we are watching. Risks to our 2.8% Q2 forecast are roughly balanced.
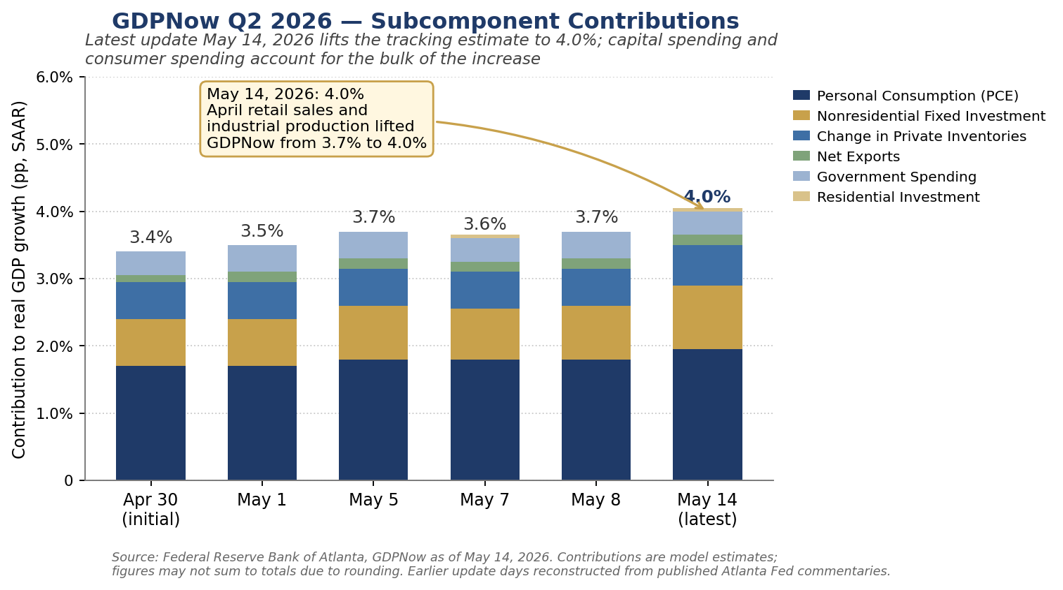
This remains a capital-led expansion of a sort the post-2008 economy rarely produced. Hyperscaler 2026 capex commitments now total roughly $725 billion across Microsoft, Meta, Alphabet, and Amazon, up from $416 billion in 2025, a 74% year-over-year increase. A meaningful share of the buildout is being met through imports of semiconductors and computing equipment, so the gross capex figure overstates the net contribution to measured GDP. We estimate that net contribution at 0.3 to 0.5 percentage points this year. The productivity story underneath the headline capex number is what matters most for the medium term. Pharmaceutical reshoring, aerospace assembly ramps, and defense replenishment reinforce the same theme. The economy is being fueled by protein, capital investment and intellectual capital, rather than by carbohydrates, consumer spending.
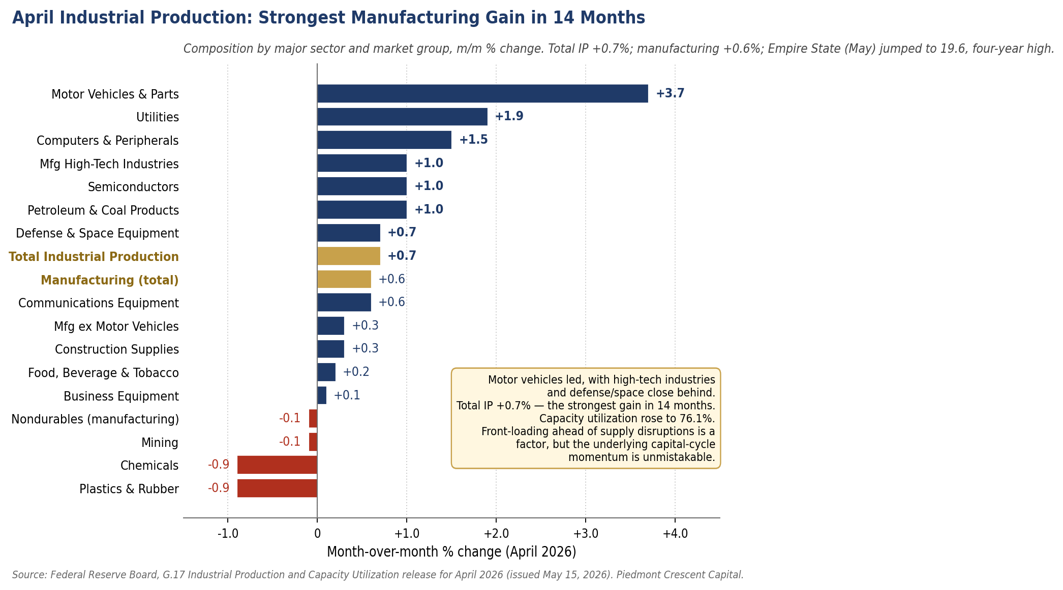
The Q1 earnings season corroborates the macro signal. With 92% of the S&P 500 reporting, blended earnings growth stands at 15.1% year-over-year, the sixth consecutive quarter of double-digit growth. Eighty-four percent of companies beat EPS estimates. The single most striking data point is the blended net profit margin of 13.4%, the highest reading on record since FactSet began tracking the metric in 2009 and a step up from the prior record of 13.2% set just one quarter ago. Information Technology led at 29.1%, up from 25.4% a year earlier. Firms that allocated capital toward automation, productivity, and AI-enabled process redesign during the post-pandemic period are now translating modest revenue growth into outsized earnings growth.
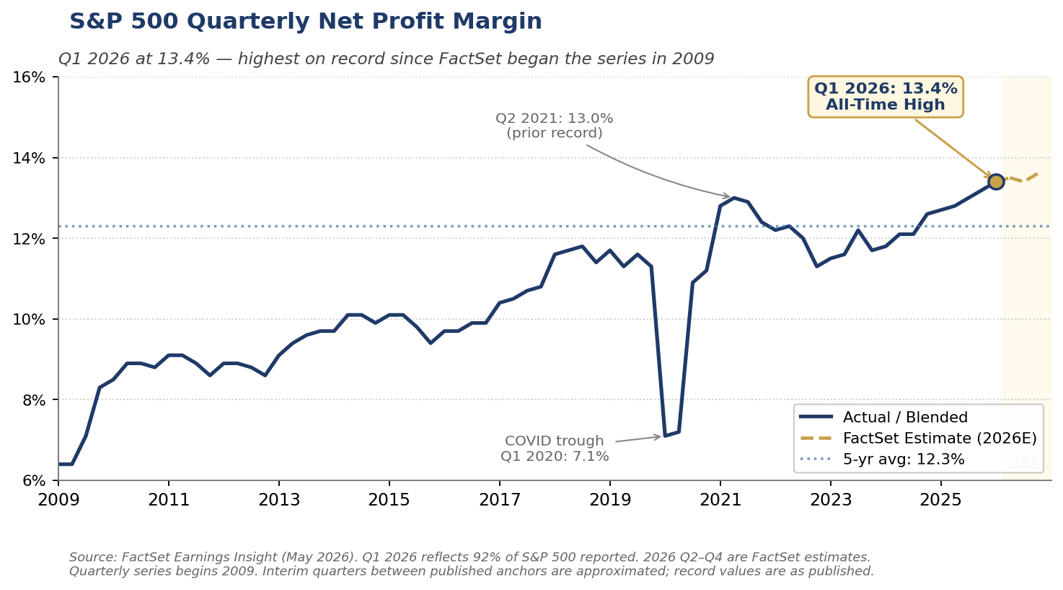
A new differentiation has emerged within mega-cap tech that bears watching. Alphabet rose roughly 34% in April after a Q1 beat across cloud, advertising, and Waymo. Meta Platforms fell roughly 9% despite beating earnings, after raising its 2026 capex guidance to $125 to $145 billion. The market is no longer rewarding the scale of AI commitment alone; it is demanding evidence of returns. That is healthy for the cycle and distinguishes the current capex boom from earlier ones, where spending itself was treated as a positive signal regardless of the back-end economics.
The consumer side of the story remains more nuanced than the aggregate data suggests. The split we flagged in the April Compass between services (holding up) and durables (soft) sharpened in April. Bars and restaurants rose 0.6% in the April retail sales report and broad services consumption is firm, while motor vehicle and parts sales fell 0.5%, furniture fell 2.0%, clothing fell 1.5%, and department stores fell 3.2%. The pattern reflects higher financing costs, the energy-shock lag on real income, and pull-forward of demand during 2024 and early 2025. The April Beige Book, bank credit card data, and the New York Fed Consumer Survey all document the same split by income, with higher-income households continuing to spend while middle- and lower-income households pull back.
The Milken Institute Global Conference at the end of April put a punctuation mark on the constructive view we have been making. The largest pools of capital in the world are leaning into this cycle. Blackstone President Jon Gray reminded the audience that markets have powered through pandemic, inflation, regional conflict, and now war with Iran, and saw no reason to expect anything different. Private credit got plenty of attention, both as enabler and as a source of nascent concern; the largest sponsors sounded constructive on direct lending volumes while acknowledging that the easy returns of 2022 to 2024 are behind them and that selectivity is back.
Where We Sit in the Consensus
Our 2.8% Q2 forecast and 2.5% full-year view sit on the constructive end of the Wall Street consensus. The range of major Wall Street forecasts published in the past two weeks runs from roughly 1.0% to 2.8% for Q2, with most clustering between 1.7% and 2.3%. The full-year range runs from roughly 1.6% to 2.6%, with the median near 2.2%. The Atlanta Fed’s Q2 GDPNow at 4.0% sits above the entire published range and is the upside marker. The dispersion is wider than at any point since the war began. The reason we are on the constructive side comes down to consumer composition. The bears anchor on the real-income hit from gasoline. We hold our view because the services-strong, durables-soft split is more nuanced than aggregate real income captures. If real income less transfers deteriorates further into Q2 and the durables weakness broadens into services, the 2.8% becomes harder to sustain.
The Labor Market: Low-Hire, Low-Fire Confirmed
The April employment report did not change the labor market story so much as confirm it. The 115,000 payroll gain was well above the 55,000 consensus, although February was revised lower by another 23,000, to a net loss of 156,000. Gains concentrated in healthcare, transportation and warehousing, and retail trade. Federal government employment fell another 9,000 in the month and roughly 348,000 since October 2024. Manufacturing payrolls edged down 2,000 even as industrial production posted its strongest gain in over a year, which is the productivity story in microcosm.
Questions about the quality of the April payroll gain have circulated, since the BLS birth-death model added 386,000 jobs in the unadjusted data, more than accounting for the entire reported increase. ADP’s independent read of +109,000 puts most of those concerns to rest. ADP’s sample is much larger than the BLS establishment survey and has historically aligned closely with BLS annual revisions. Wage growth for job-stayers in the ADP data held steady at 4.4% year-over-year. Our read is a bit more cautious. Most of the job gains within healthcare were in low-paying parts of the sector, most notably home health care and nursing homes. The gains in transportation and warehousing also look suspect, with an inexplicable spike in couriers and messengers more than accounting for all of that sector’s job gains.
Average hourly earnings rose 0.2% m/m and 3.6% YoY, slightly below headline inflation. That is the texture of a labor market in the equilibrium Powell, Waller, and Goolsbee have described. Hiring is slow, layoffs are limited, and the mix continues to skew toward lower-paying service sectors. Voluntary attrition has slowed to unprecedented lows, which reduces the need to hire new staff and likely lifts productivity. It also pushes wage and benefit expense higher as annual increases land on a more experienced workforce.
What growth there has been in manufacturing is concentrated in capital-intensive industries: semiconductors, machinery, chemicals, and related high-tech durables, where surging investment in equipment, automation, and AI-related infrastructure is driving output gains and value-added while delivering only modest net employment increases. The April industrial production breakdown reinforces that read. The ISM surveys do the same. Manufacturing held at 52.7, the fourth consecutive month of expansion. New orders strengthened to 54.1. Services rose to 53.6, the 22nd consecutive month of expansion. The two warning lights were the Prices Index, which surged at the fastest pace since April 2022, and the Employment Index, which fell to 46.4, the sharpest contraction in four months.
Inflation: The Breadth of the April Increase Is the Story
We argued in the April 26 weekly that the headline CPI spike was noise and the underlying trend was the signal. Through the March data, that framing held: Cleveland median and 16% trimmed-mean both ran at 0.2% m/m alongside core CPI, and the Dallas Fed trimmed-mean PCE for March came in at 2.4% YoY (1-month annualized 2.9%) against headline PCE at 3.5% and core PCE at 3.2%. The April CPI data complicates that read materially.
One month of bad inflation news would not generally change the narrative. What stands out with April is the breadth. Cleveland median and 16% trimmed-mean both rose 0.4% m/m, double the March pace and running at roughly a 5% annualized rate. The whole point of those measures is to exclude the largest moves at both tails of the distribution. When they jump in lockstep with the headline, the problem is no longer narrow. The middle of the price-change distribution moved higher in April. That is the signal that the energy and tariff impulse is spilling into the broader basket. This is precisely the measurement issue Warsh raised in his confirmation testimony, and the very measures he chose to highlight then turned higher in the first print he will have to address. The May 28 PCE release will be the first read on whether the breadth signal carries into the FOMC’s preferred index. The Dallas trimmed-mean reading for April will be the single data point to watch.
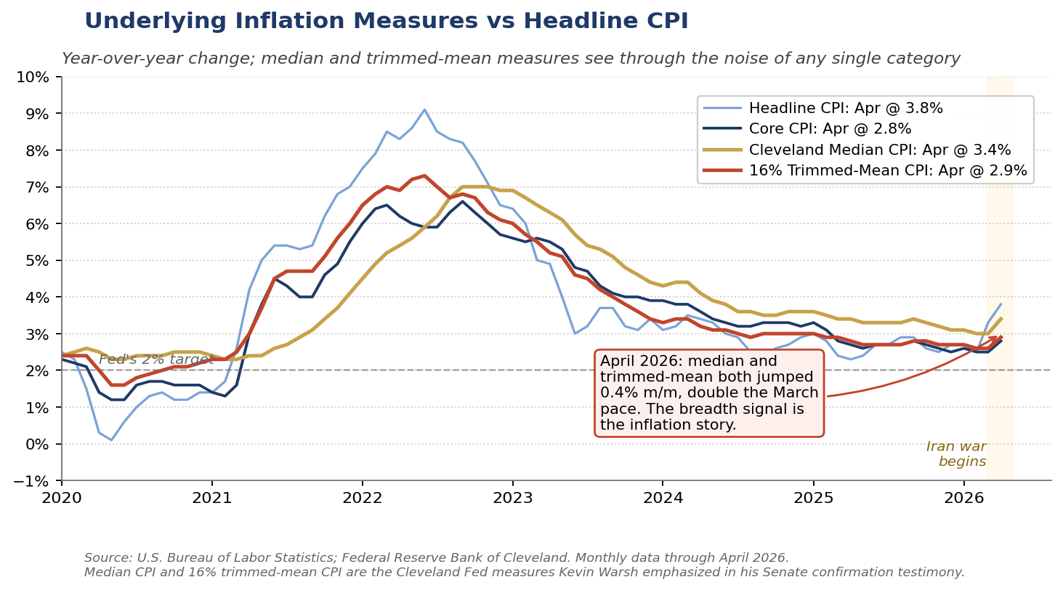
We continue to believe the bulk of the April move reflects pass-through from energy and from trade-services margins, rather than a broad re-acceleration driven by wages or demand. Three reasons. First, the labor market is not generating wage pressure consistent with sustained services inflation; AHE at 3.6% YoY is roughly consistent with the underlying trend in productivity growth. Second, longer-run inflation expectations remain reasonably anchored. The NY Fed three-year and five-year measures held at 3.1% and 3.0% in April, and the five-year forward TIPS breakeven sits near 2.1%. Third, the small-business data shows firms absorbing costs rather than passing them through cleanly. That brings us back to the PPI.
The April PPI’s 1.4% monthly gain, the largest since March 2022, alongside the 6.0% year-over-year rate, is the producer-pipeline signal. The composition is more revealing than the headline. Services PPI rose 1.2%, with two-thirds of that move coming from trade services, the wholesale and retail margin component. Producer prices at 6.0% YoY against headline CPI at 3.8% is as clean a measure of margin compression as we get. Pricing power has narrowed for firms without a clear productivity story. The Q1 net profit margin record of 13.4% disguises meaningful dispersion underneath, and the second derivative is moving in the wrong direction for firms whose costs are rising faster than their ability to raise prices. The Q1 Duke-Richmond Fed CFO Survey corroborates at the larger-firm level: tariffs the top concern for the fifth consecutive quarter, median own-product price expectation at 3.5% for 2026, lower expected employment and unit cost growth than the prior quarter. The Q1 NFIB data tell the same story at the small-business level. Sustained at current input costs through Q3, this becomes a hiring and capital investment constraint. The ISM Manufacturing Employment Index at 46.4 is already telling us that.
The implication is that April is more likely to give way to margin compression and slower hiring than to broad final-price acceleration, particularly if energy normalizes on our base-case timeline. But the path is not as clean as it was through March. The April readings narrow the room for cuts. We continue to expect one quarter-point cut in September if war risk subsides and the trimmed measures return to softer monthly readings. A second cut in December remains possible but only if the labor market weakens more materially than our forecast assumes. If the May CPI release does not show median and trimmed-mean measures returning to the 0.2 to 0.3 percent range, the September timetable shifts later this year, into next year, or off the table altogether.
Markets and Financial Conditions
The 10-Year at 4.60% and the Mortgage Spread Story
The 10-Year Treasury closed Friday at 4.60%, the highest since January 2025 and roughly 15 basis points higher than where it sat at the time of our April 26 weekly. The 30-Year cleared 5% for the first time since 2024 and closed at 5.12%. The 2-Year traded near 3.88% at mid-month, leaving the curve bear-steepened by roughly 72 basis points. Tuesday’s $52 billion 10-Year auction cleared at 4.468%, replacing $28 billion of notes issued in May 2016 at 1.71%, a textbook illustration of the term-premium and supply story that is becoming harder for the bond market to absorb. The bond market has effectively ruled out a Fed cut through 2026 and is pricing better than a 1-in-3 chance of a hike before year-end.
The sharp sell-off in the 10-Year acknowledges that the center has shifted in the inflation debate. The broader acceleration in the underlying measures, particularly the breadth signal in the Cleveland median and 16% trimmed-mean CPI, has lifted the hurdle for any near-term cut. The Wall Street Journal editorial board’s pointed view that the Trump administration’s Iran strategy has not produced the rapid resolution markets had hoped for is a real part of the picture. The WSJ has been blunt about the gap between the administration’s framing of the conflict and the reality on the ground. But that is not the whole picture. The larger part is the data. The April CPI and PPI together made the case that the inflation impulse is no longer narrow, and the 10-Year priced that in within 48 hours.
The mortgage market is amplifying the move in ways that matter for the housing sector and for any CFO whose business model depends on housing turnover. The 30-year fixed mortgage rate has pushed to roughly 6.46% from 5.98% on February 26, the day before the Iran war began. Some of that move is the 10-Year. The rest is the MBS spread, which has widened back to its widest level since December, more than offsetting the January spread tightening that had followed the administration’s directive for the GSEs to add $200 billion of MBS to their retained portfolios. Two channels are pulling in the same direction: a higher 10-Year and a wider spread. The combination has unwound the early-2026 mortgage-rate progress in roughly two months and is keeping housing in the cooler-for-longer environment we have been describing since the start of the year.
For corporate borrowers the message is the same as the message for households, in slightly different language. The fixed-rate issuance window is not closed but is no longer improving. Term premium is rebuilding on heavy issuance, fiscal deficits, and a growth picture that may be running structurally above the post-2008 framework. The bond market is pricing the war as a duration risk rather than a flight-to-quality story, which is unusual and worth flagging. The right move is to lock in fixed rates opportunistically rather than wait for the long end to improve.
Equities and the Equity-Bond Gap
Equities continue to take the constructive view. The S&P 500 closed above 7,500 on Thursday on a Cisco-led rally and is on track for a seventh consecutive weekly gain, the longest streak since 2024. Q1 earnings strength has broadened beyond a handful of mega-cap names, and cyclicals tied to power, grid, defense, and reshoring are leading. Caterpillar’s +10% reaction to its Q1 print on April 30 captured the broader read on the industrial complex. Higher rates that reflect stronger growth are different from higher rates that reflect inflation worries, and the current move reads closer to the former. But the gap between the two has narrowed since our April Compass.
The equity-bond gap remains wider than the data justifies in both directions. The bond market’s caution looks well grounded given the April inflation prints. The equity market’s strength looks well grounded given the capital cycle, the Q1 earnings, and the resilient consumer. Both can be right at the same time if the war resolves on the time frame our base case assumes. They cannot both be right if the war stretches into Q3 and the breadth of inflation persists.
Oil and the War Path
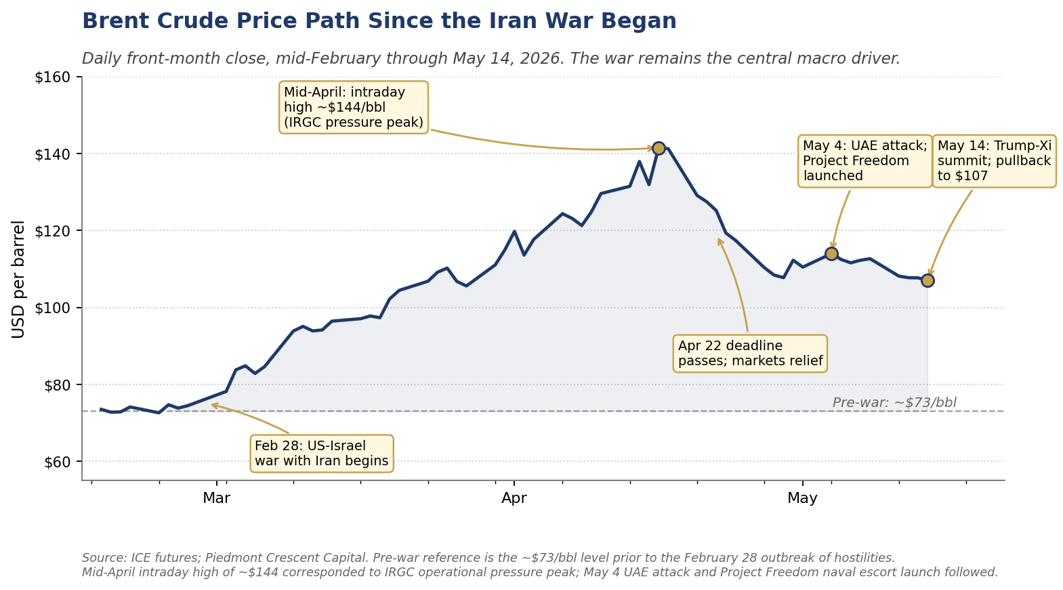
Brent settled near $107 in mid-May, off the May 4 wartime peak above $114 after Iran’s attack on the United Arab Emirates and the launch of Project Freedom. The Strait of Hormuz remains effectively closed. The IEA’s May Oil Market Report characterized cumulative supply losses from Gulf producers since late February at over one billion barrels, with 14 million barrels per day shut in. Saudi Arabia’s production is at its lowest level since 1990. The UAE departed OPEC on May 1 as scheduled. Saudi Aramco CEO Amin Nasser told investors on the company’s Q1 call that even if the Strait reopens today, normalization could extend into 2027.
The Trump-Xi Summit and What It Tells Us About U.S.–China
The Trump-Xi summit on May 14 produced more than the modal expectation and less than the bullish case. The two readouts deserve to be put alongside each other. The White House readout stated that the two sides “agreed that the Strait of Hormuz must remain open to support the free flow of energy” and that Xi “made clear China’s opposition to the militarization of the Strait and any effort to charge a toll for its use,” while expressing interest in purchasing more American oil to reduce China’s dependence on the Strait. Both countries agreed that Iran can never have a nuclear weapon. The U.S. cleared H200 chip shipments to ten Chinese firms. The Trump administration claimed Chinese commitments to purchase up to 200 Boeing aircraft and billions of dollars of U.S. agricultural products. China allowed the resumption of American beef imports at the outset of the summit as a goodwill gesture.
The Chinese readout described the meeting differently. The two sides “agreed to develop a constructive China-U.S. relationship of strategic stability,” and Beijing is treating that as the guiding framework for the next three years and beyond. The Chinese readout was notably quieter on Iran specifically, and Beijing characterized the trade outcomes as “an overall balanced and positive result, which is good news for the people of the two countries and the world.” Xi’s own framing of the moment was more philosophical and arguably more revealing. He invoked the “Thucydides Trap” and called for a new paradigm for great-power relations. He described 2026 as a “historic and landmark year.” He also noted that the international landscape is “chaotic and intertwined” and that the two countries had reached a “new crossroads.” The 43 hours of state visit, lengthy meetings, and a private lunch and tea at Xi’s residence in the Forbidden City compound were themselves the message.
One element of the summit has not yet been widely picked up in the coverage. The Iran war delayed the original meeting, which had been on track for a March bilateral. By the time the two presidents met on May 14, the agenda was operating against a tighter shot clock than either side wanted. The Hormuz language, the H200 clearance, the beef restoration, the Boeing commitments, and the agricultural and crude oil purchase pledges are the deliverables that survived that compression. The war shaping the timing meant the summit could not be the comprehensive reset some had hoped for in late 2025.
Within that constraint, the summit improved the relationship from where it stood a month ago. The most pointed critique we have heard from market participants and from China watchers we respect is that it did no harm, that nothing was lost and not much was gained. There is a particular version of that argument worth engaging with directly: the Chinese commitment to oppose Iran’s nuclear weaponization is “nothing new,” a reiteration of months-old Beijing policy rather than a fresh concession. That reading is technically accurate. China has held that position publicly since the start of the war. But the assessment understates what the summit produced. Doing no harm in the current environment is a low bar that markets had reason to fear could be missed. Moving the U.S.-China relationship forward, even modestly, against the backdrop of an ongoing regional war is constructive in its own right. The Hormuz language gives China a public commitment to point to, which gives Beijing something to lose if Iran tests the open-strait principle. The H200 clearance gives U.S. semiconductor firms an incremental opening in their largest external market. The Boeing and agricultural commitments give U.S. aerospace, ranchers, soybean farmers, and energy producers visibility into the back half of the year. Those are real outcomes.
The broader U.S.-China relationship is evolving and difficult to predict at any single moment in time. Three vectors are worth tracking for CFOs and treasurers in 2026 and beyond. The first is technology and export controls. The H200 clearance is real but narrow (ten firms, not the broader market), and Washington’s posture on advanced chip exports has tightened and loosened several times in the past three years. The direction of travel is unclear. The second vector is trade and tariffs. The current administration has used tariffs as both a revenue tool and a negotiating tool. The IEEPA tariffs have produced more than $100 billion of refunds in Q2 already, and Section 122 authority expires in July. The Q3 USMCA renegotiation and any further bilateral trade language with China sit alongside that backdrop. The third vector is Taiwan.
The Taiwan question sits inside the same evolving picture, and U.S. intentions in the event of a Chinese attempt on Taiwan are themselves moving in ways markets have only recently begun to discount. Xi made the point unambiguously at the summit. Per multiple readouts, he established Taiwan as China’s red line at the outset of the closed-door meeting, calling it “the most important issue in U.S.-China relations” and warning that “handle it well, the relationship holds; handle it badly, the two countries risk collision or conflict.” That is the sharpest language any senior Chinese official has used on Taiwan in the post-COVID period. The strategic ambiguity that has anchored U.S. policy for decades has been tested rhetorically by multiple administrations and is being tested operationally now by the Iran war’s demands on U.S. naval assets. CFOs whose supply chains run through Taiwan, which is most CFOs in technology, autos, and consumer electronics, whether they know it or not, have a Taiwan exposure that does not show up cleanly on a balance sheet. Our job is to help CFOs think through scenarios that materially affect their cost of capital, supply continuity, and hedging posture. The Taiwan question belongs on that list, even if the modal expectation remains continued ambiguity. The fact that 92% of advanced semiconductor production runs through Taiwan and that U.S. semiconductor capacity expansion is still measured in years rather than months means the contingent exposure is large enough to plan against.
The summit is a step forward in a complicated relationship that will continue to shape the macro and corporate-finance landscape for the balance of the decade. It is a modest, real improvement in a difficult environment. The broader trajectory will be determined by data and events still ahead of us.
The Warsh Transition
Powell’s tenure as Chair ended May 15. Warsh cleared Senate Banking on April 29 and will chair the June 17 FOMC meeting. Powell will remain on the Board of Governors through January 2028, a stabilizing factor for institutional continuity that is still unnerving.
Warsh’s framework, as laid out in confirmation testimony and subsequent commentary, rests on several core ideas: policy restrictive until inflation is anchored, continued balance sheet normalization, stronger price discovery, and explicit recognition of Treasury-Fed interdependence given the scale of current fiscal deficits. The most underappreciated element is his structural optimism about productivity. He has argued that AI is materially boosting the supply side and that the Fed needs additional work to assess the productivity boom in real time. A central banker who believes potential output is rising should, in principle, tolerate higher measured growth without raising rates. The implication is that the gap between Warsh’s stance and Powell’s may be narrower than markets are currently pricing, particularly if the labor market stays in its low-hire, low-fire equilibrium.
Warsh has also been a sharp critic of how the Fed measures inflation. He has called core PCE “a rough swag” and pointed to the Cleveland median CPI and Dallas trimmed-mean PCE as better filters. The April uptick in those very measures will sharpen the question of what the Fed is targeting in the early Warsh months. Our base case is a patient Warsh Fed through June, followed by a 25 basis-point cut in September if the war risk subsides and the trimmed measures return to a softer trend.
CFO & Treasurer Corner: What This Means for Corporate Finance
Looking Ahead
| Day | Release / Event | Why It Matters |
|---|---|---|
| Mon May 18 | NAHB Housing Market Index | Signals whether higher long rates are weighing further on residential investment. With the 30-year fixed back to 6.46%, NAHB will be the cleanest near-term read. |
| Tue May 19 | Building Permits, Housing Starts (April); EIA weekly | Starts signal whether the spring season has stabilized. EIA inventories are the cleanest read on supply-side math. |
| Wed May 20 | Target earnings; retailer commentary | Target and the wider retail complex will speak to consumer response to higher gasoline. Walmart’s May 14 print suggests the larger consumer is holding. |
| Thu May 21 | Initial jobless claims; Existing home sales; Philly Fed; LEI; Nvidia earnings (after close) | Philly Fed is the second regional manufacturing read after the four-year-high Empire State print. Nvidia’s data-center commentary, particularly on China re-access following H200 clearance, is the most important earnings release of Q2. |
| Fri May 22 | New home sales (April); May flash PMIs; FOMC May minutes (Wed) | Flash PMIs are the first May read on whether capital-cycle momentum is sustaining. May FOMC minutes will be parsed for the depth of the dissent on the easing bias. |
| Wed May 28 | April PCE release | The April PCE deflator and the Dallas trimmed-mean PCE for April are the cleanest test of whether the CPI breadth signal carries into the FOMC’s preferred index. |
The interpretation will matter more than the headlines. The capital-cycle thesis has been validated by GDPNow, ISM, the strong April industrial production print, the four-year-high Empire State reading, and Q1 earnings. The labor market is in equilibrium. The underlying-inflation question is now the live one. A return to 0.2 to 0.3% monthly readings in median and trimmed-mean CPI would restore the disinflation comfort. A second consecutive 0.4% print requires a more material revision. The April PCE release on May 28 is the cleanest single test.
Scenario Framework
| Scenario | Macro and Market Implications | Corporate Finance Action |
|---|---|---|
| Base Case (50%) | Outline agreement on Iran by late May or early June; Hormuz reopens by mid-summer; Brent retraces toward $80 by year-end. Capital cycle drives Q2 and Q3 GDP at 2.5 to 3.0%. Labor market stays in low-hire, low-fire equilibrium with unemployment at 4.3 to 4.5%. Warsh Fed delivers a 25 bp cut in September, holds in November and December. 10-Year retraces to a 4.30 to 4.60% range. Cleveland median and trimmed-mean CPI return to 0.2 to 0.3% monthly readings by June. | Lock fixed-rate funding opportunistically. Continue capex investment in productivity-enhancing projects. Use any back-up in long rates above 4.70% as an issuance window. Build moderate inventory buffers on energy-sensitive inputs. |
| Upside Case (15%) | Trump-Xi Hormuz language translates into actual Chinese leverage on Tehran; Iran agrees to verifiable concessions by early June; Hormuz reopens faster than expected. Brent returns to a $75 to $80 range by Q3. Capital cycle accelerates. Warsh Fed cuts 50 bp over H2. 10-Year retraces toward 4.25%. | Step up productivity-led capex. Reassess working capital toward growth. Refinancing window opens further. |
| Downside Case (35%) | Negotiations collapse or escalate through Q3; Brent moves to $130-plus. Headline CPI re-accelerates above 4% and median and trimmed-mean CPI hold at 0.4% monthly for a second print. Consumer cracks visibly in lower-income segments. Fed pinned indefinitely with hike odds rising. 10-Year pushes through 4.75% on inflation reacceleration. Credit spreads widen 50 to 100 bp. GDP slows to 1.0 to 1.5% in H2. | Stress-test floating-rate exposure. Build liquidity buffers. Defer non-essential capex. Hedge energy and freight inputs aggressively. Review covenant headroom on leveraged credits. Lengthen working-capital cycles. |
Note on revisions vs. the April 26 weekly
(1) The 2.8% Q2 GDP forecast has been steady for two months; the upside risk from GDPNow at 4.0% is real but not yet adopted. Durables remain a soft spot offsetting strength in capital spending, industrial production, and inventory rebuild. (2) Inflation trajectory revised modestly higher to reflect the April CPI and PPI breadth; March PCE (3.5% headline, 3.2% core, 2.4% Dallas trimmed-mean YoY) was in line with the prior trajectory before the April surprise. (3) Fed path unchanged in direction from April, with one cut in September and a possible second in December, but room for both has narrowed materially given the 10-Year move and the April breadth readings. (4) Brent annual average revised down to $92 from $95 as we increase the probability weight on a mid-summer Hormuz reopening following the Trump-Xi summit. (5) 10-Year forecast revised up to reflect Friday’s close at 4.60% and the term-premium and supply dynamics on display in this week’s auction.
Strategic Takeaway
The capital cycle held the line in April, and the May data has reinforced it. Our forecast sits on the constructive end of the Wall Street consensus, in line with the optimists and well above the bears. GDPNow at 4.0% remains the upside marker. The April inflation prints narrowed the room. Breadth in the Cleveland median and trimmed-mean measures is the development that matters most, while the PPI surge points to margin compression rather than final-price acceleration. The 10-Year at 4.60% is the bond market’s acknowledgment of both points at once. The path to a September cut now runs through softer monthly readings in the May and June trimmed-mean data and the April PCE release on May 28.
The geopolitical picture has shifted from the dangerous one we sketched in the April Compass. The April 22 deadline came and went. Project Freedom is operational. The Trump-Xi summit produced the strongest joint Hormuz language to date, real deliverables on Boeing and U.S. agricultural purchases, and an improved bilateral footing. The broader U.S.-China relationship and the Taiwan question both sit inside an evolving and complicated picture that will keep shaping the cost of capital and supply chain calculus for the balance of the decade. Our scenario probabilities have moved back to the April 26 weekly distribution: Base 50%, Upside 15%, Downside 35%. The downside risk remains real because the IRGC has not credibly stood down and the negotiating gap on enriched uranium and the U.S. port blockade remains structural. The trajectory is constructive, not deteriorating.
For CFOs and treasurers, four priorities. Lock fixed-rate funding while the window is open; year-to-date hyperscaler IG issuance has already exceeded all of last year, a reminder that the long end will be crowded for the balance of 2026. Continued capex investment in productivity-enhancing projects; the market is rewarding firms that deliver productivity gains, and the Q1 earnings data validates that allocation. Build the war-escalation downside into Q2 board discussions explicitly. A 35% probability is not a tail risk, and the operational hedge is more durable than the financial hedge. And add the China-Taiwan question to standing scenario work; the post-Trump-Xi-summit picture is modestly better, but the underlying relationship and the contingent Taiwan exposure are evolving in ways that warrant continued attention.
April Inflation Reports Top Expectations
Consumer Price Index — April 2026
Key Takeaways
| Key Concept | Findings |
|---|---|
| Headline CPI | +0.64% MoM (+0.6% rounded); +3.81% YoY. Beat consensus of +0.60% MoM and +3.70% YoY. Year-over-year rate jumped 55 bps in a single month — fastest acceleration since mid-2024. |
| Core CPI | +0.38% MoM (+0.4% rounded); +2.75% YoY. Beat consensus of +0.30% MoM. Shelter catch-up (government shutdown) added ~13 bps; without it, clean core was closer to +0.25%. First upward acceleration in the annual core rate since 2025. |
| April PPI | +1.4% MoM; +6.0% YoY. Largest monthly advance since March 2022. Nearly 3× the consensus of +0.5%. Services PPI +1.2% (biggest since Mar 2022); goods PPI +2.0%; energy +7.8%. Stage 1 intermediate demand up 8.9% YoY — pipeline still filling. |
| Real Earnings | Real average hourly earnings fell 0.5% MoM in April. AHE of $37.41 rose just 0.2% (nominal), while CPI rose 0.6%. Year-over-year, real AHE are down 0.3%. For production workers, real AHE fell 0.3% on the month. Inflation is eating all wage gains. |
| Energy | +3.8% MoM; +17.9% YoY. Gasoline +5.4% following March’s record +21.2%. Fuel oil +54.3% YoY. Electricity +6.1% YoY. Energy pass-through into transportation, logistics, and food is the key second-round story. |
| Shelter | +0.6% MoM; +3.3% YoY. Distorted by BLS catch-up for missed October 2025 shutdown data. One-time effect. Structural disinflation in market rents remains intact. OER and rent will revert to 0.2–0.3% monthly pace in May. |
| Food | +0.5% MoM; +3.2% YoY. Restarted after March’s flat reading. Grocery prices +0.7%; beef +2.7%; fruits & vegetables +1.8%. Fertilizer and freight cost pass-through on 2–3 month lag. The food pipeline is full. |
| Trimmed Mean CPI | Cleveland Fed 16% Trimmed Mean: ~+0.5% MoM, ~4.4% annualized — accelerating sharply from March’s ~3.0% annualized. Incoming Fed Chair Warsh’s stated preferred signal. A second consecutive print at this pace would shift the FOMC debate from ‘when to cut’ to ‘whether to hike.’ |
| The Next Fed Move | Markets now price ~30% probability of a rate HIKE by year-end (CME FedWatch). FOMC voted 8-4 on April 29 — closest since 1992. Warsh confirmed as Fed Chair today. He will chair the June 16–17 meeting. We still see a narrow path to a September cut if Hormuz normalizes and energy prices recede materially by mid-summer. |
A Three-Report Inflation Indictment
Three BLS releases hit this morning, and all three pointed in the same direction. Consumer prices beat on both headline and core. The Producer Price Index came in nearly three times the consensus forecast. And real average hourly earnings fell 0.5% — the sharpest monthly real wage drop since the 2022 inflation surge. Rarely do CPI, PPI, and real earnings line up this cleanly. This morning they did, and none of it was good news.
April’s CPI is a more consequential print than March’s. March was ugly but explicable: a single energy shock from a record gasoline price surge drove three-quarters of the monthly increase. April is different. Headline CPI rose 0.6% month-over-month and 3.8% year-over-year, beating consensus. But the concerning story is beneath the headline: core inflation accelerated for the first time since 2025, the pass-through from energy into goods and services has begun, and food prices restarted after five months of flat or declining readings.
The Producer Price Index for final demand surged 1.4% in April — the largest single-month advance since March 2022, nearly three times the 0.5% consensus forecast, and an acceleration from March’s upwardly revised 0.7% gain. On a 12-month basis, wholesale prices are up 6.0% — the biggest increase since December 2022. Nearly 60% of the April PPI advance came from services, not goods — which makes it more persistent, not less. A services-led PPI surge is a leading indicator for future CPI services inflation, which is already firming. The goods component rose 2.0%, with energy up 7.8% and gasoline up 15.6%.
The 2-year Treasury note crossed 4% after these releases. The bond market has stopped pricing cuts and started pricing hikes. That is not a subtle shift — it is a repricing of the entire policy outlook, with direct implications for corporate borrowing costs, working capital, and how companies think about capital allocation for the rest of the year.
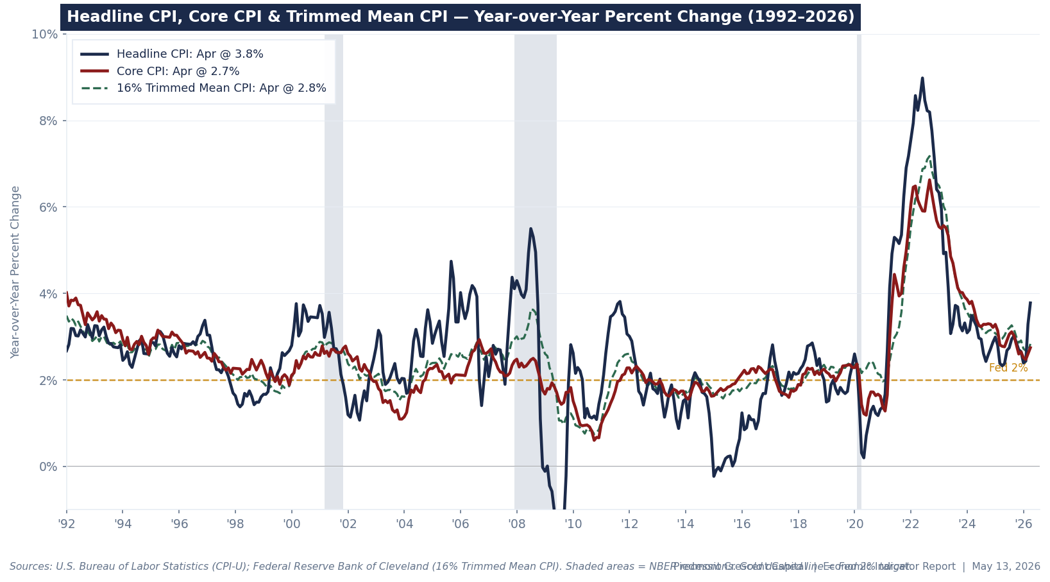
Inside the Numbers: Where Prices Are Moving
Energy remained the largest single contributor, though its role has shifted from dominating to compounding. Gasoline rose 5.4% in April after March’s extraordinary 21.2% surge, keeping energy’s year-over-year rate at +17.9%. Fuel oil — a critical input for heating, manufacturing, and freight — now stands 54.3% above a year ago. Electricity rose 2.1%. The energy pass-through into transportation, logistics, and manufacturing costs is accelerating on a lag, and the PPI confirms it is flowing upstream to downstream.
Shelter’s 0.6% monthly gain warrants careful interpretation. The BLS made a catch-up adjustment in April to compensate for the missed October 2025 report during the government shutdown. This is a one-time statistical correction, not a new trend. OER and rent each rose 0.5% — approximately twice the underlying run rate. The structural disinflation trend in market rents and the Home Price Index leading indicator shown in Chart 2 remains intact. The OER and rent components will revert toward their 0.2–0.3% monthly pace in May. Do not extrapolate April’s shelter print.
Food prices are the most concerning new development in this report. After five consecutive months of moderation or flat readings, grocery prices jumped 0.7% in April. Beef prices rose 2.7%. Fruits and vegetables jumped 1.8%. Non-alcoholic beverages rose 1.1%. The transmission from elevated fertilizer costs, higher freight rates, and energy-intensive food processing is flowing through the supply chain on the expected 2–3 month lag. The Purdue Center for Commercial Agriculture’s pipeline analysis — published publicly at ag.purdue.edu — places the food cost wave at Stage 3 intermediate demand, one node from retail, with consumer-level grocery price acceleration projected to continue through the May–August window.
Core goods were essentially flat on the month, providing one genuine point of relief. Used vehicles stabilized after a long deflation run, new car prices edged down 0.2%, and car rentals fell 3.7%. Computer software and accessories rose another 5% in April, driven by AI-related memory chip demand, but this category has almost no weight in core CPI. It matters more in the PCE deflator — where analysts have flagged it as likely overstating genuine consumer price pressure due to measurement difficulties the BLS has acknowledged around AI-driven product categories.
Services firmed across several categories. Airline fares rose 2.8% — carriers passing on jet fuel costs. Transportation services added 0.3%. Lodging rose 2.4%. Apparel continues to climb, reflecting tariff effects that appear to be winding down rather than broadening. On the other side of the ledger: internet services fell 1.4%, and medical care declined 0.1% for the second consecutive month. Those offsets are real but are not large enough to change the overall services trajectory.
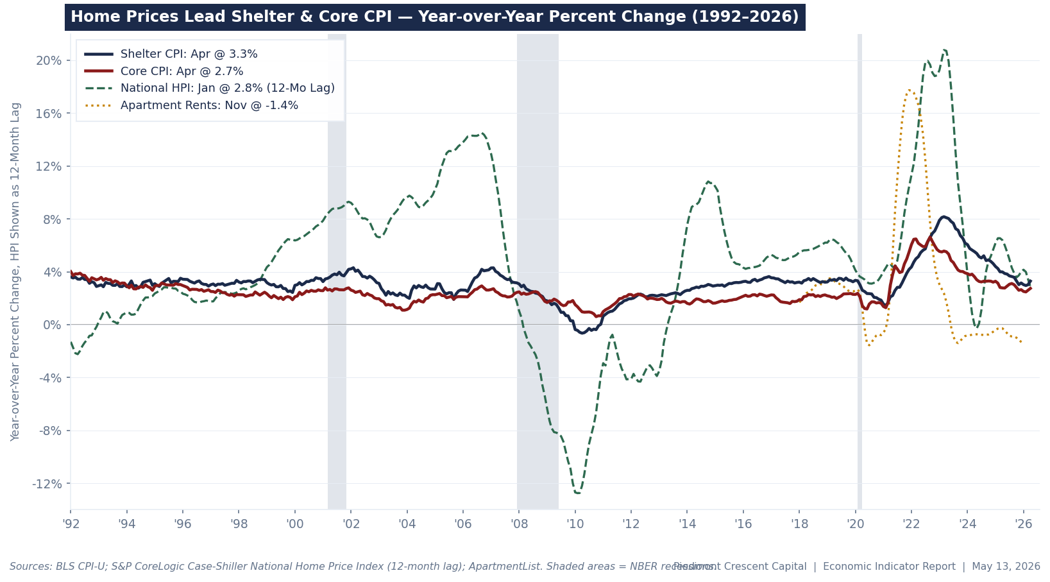
The Producer Price Index: The Pipeline Is Still Full
Today’s PPI data compounds the CPI message rather than contradicting it. Final demand prices rose 1.4% in April, the largest single-month advance since March 2022. The prior month was revised upward from +0.5% to +0.7%. On a 12-month basis, wholesale prices are up 6.0%, marking the largest increase since December 2022 and nearly 1 percentage point above the March reading.
The composition is what matters. Nearly 60% of the PPI advance came from services, which rose 1.2% — the largest monthly gain since March 2022. This is the number that should trouble the Fed most. Services PPI leads CPI services inflation by one to three months, which means the services price acceleration already visible in April’s CPI is likely to continue into May and June. Two-thirds of the services gain was driven by a 2.7% jump in trade services margins, suggesting tariff costs are flowing through distribution channels more aggressively than earlier data indicated. Machinery and equipment wholesaling rose 3.5%, and truck freight, chemicals, legal services, and fuels retailing all contributed.
Final demand goods rose 2.0%, with energy driving roughly three-quarters of that gain — gasoline up 15.6%, energy overall up 7.8%. Jet fuel, diesel, fresh vegetables, and industrial chemicals also rose. Strip out energy and the underlying goods picture is still not clean: Stage 1 intermediate demand prices are up 8.9% over the past 12 months, the largest such increase since October 2022. Industrial chemicals, diesel, and truck freight — inputs that touch virtually every manufactured good and delivered product — are all climbing.
The PPI-to-CPI pass-through has weakened in recent years, and we are not forecasting a one-for-one translation. Consumers are already pushing back on price increases for discretionary goods, and with job growth concentrated in lower-wage sectors — nursing homes, home health care, social services — the wage-push channel is limited. The more immediate risk is a margin squeeze: companies absorbing higher input costs rather than passing them through, particularly in goods where pricing power is thin. But when wholesale inflation is running at 6.0% annually, it is naive to assume consumer prices will be fully insulated.
Wall Street Reaction: The Rate-Cut Consensus Has Collapsed
Hopes for a rate cut took a big hit this week. The back-to-back CPI and PPI reports appear to have been the tipping point. Before these releases, the debate was about the timing of cuts. Afterward, the debate shifted to whether the next Fed move is a cut at all. CME FedWatch now shows a nearly 30% probability of a rate increase by year-end 2026 — a probability that was essentially zero as recently as early April.
Several economists put it plainly. Joe Brusuelas, chief economist at RSM (Yahoo Finance, May 13): “We’re not getting rate cuts this year, guys. What you’re going to be doing is talking about changing the risk bias inside the statement, setting up two-sided risks, and building a bridge in case you do have to hike rates.” Heather Long, chief economist at Navy Federal Credit Union (CNBC, May 12): “For the first time in three years, inflation is eating up all wage gains. This is a setback for middle-class and lower-income households.” Chris Zaccarelli, chief investment officer at Northlight Asset Management (CNBC, May 12): “It’s very unlikely that the Fed will be able to lower interest rates any time soon, and it’s possible that we may start pricing in rate hikes for next year.”
| Firm | Fed Call | Key Takeaway (public source) |
|---|---|---|
| Goldman Sachs | First cut: Dec 2026 | Pushed cut forecast from Sep to Dec 2026 citing PCE near 3% through 2026. Sees AI-driven software prices temporarily overstating PCE inflation. Two total cuts in 2026–27, contingent on Hormuz normalization. Source: TheStreet, May 11 — thestreet.com/investing/goldman-sachs-sends-blunt-message-on-fed-interest-rate-cuts |
| Bank of America | No cuts 2026; first Jul 2027 | Aditya Bhave: "The data simply don’t warrant cuts this year. Core inflation is too high and moving up. The solid April jobs report was the last straw." Source: TheStreet, May 11 — thestreet.com/fed/bofa-drops-blunt-warning-about-fed-rate-cuts-for-remaining-of-2026 |
| JPMorgan | On hold; next move may be a hike | Jamie Dimon (Apr 28, public Norges Bank speech): "There are a lot of inflationary things out there, including the Iran War, the re-militarization of the world, the infrastructure needs of the world, and our deficits." JPM sees Fed on hold all year; next move possibly a hike. |
| Barclays | No cuts 2026; first Mar 2027 | Dropped Sep 2026 cut; first cut moved to Mar 2027. Energy, tariffs, and supply chain disruption compounding simultaneously. Source: TheStreet, May 11 — thestreet.com/investing/goldman-sachs-sends-blunt-message-on-fed-interest-rate-cuts |
| Morgan Stanley | Extended pause; monitoring | Ellen Zentner (MS Wealth Mgmt, quoted in Yahoo Finance): "The increase in the core CPI suggests high energy prices are making themselves felt throughout the economy. New Fed leadership won’t result in an immediate dovish shift." Source: Yahoo Finance, May 13 — finance.yahoo.com/economy/article/hot-cpi-report-likely-to-put-fed-on-guard-141806600.html |
| Citigroup | 2026 cut still possible | Contrarian view: a before-year-end cut remains possible if Hormuz normalizes and long-run inflation expectations stay anchored. The lone holdout among major banks. Source: Yahoo Finance, May 7 — finance.yahoo.com/economy/policy/articles/goldman-sachs-drops-cautious-signal-043700912.html |
| Wells Fargo | No cuts 2026; Fed on hold | Dropped 2026 cut forecast on April 6: "The balance of risks has shifted to incentivize patience from the Fed." U.S. Economic Outlook, Apr 8: "Oil shock revives consumer inflation, delays Fed easing." April CPI/PPI data confirms the call. Source: TheStreet, Apr 6 — thestreet.com/crypto/fed/wells-fargo-revises-its-forecast-for-fed-rate-cuts |
All sources publicly accessible. See URLs in table.
The Next Fed Move: Warsh’s Predicament
A New Chair, the Worst Possible First Week
Kevin Warsh was confirmed as the 17th Chair of the Federal Reserve today — the same morning the Bureau of Labor Statistics delivered the worst twin inflation reading in four years. The timing is brutally precise. Warsh has called for “regime change” at the Fed, has said he believes the central bank’s benchmark interest rate can be lower, and was nominated specifically because President Trump wanted a chair who would ease monetary policy. He is now the leader of an institution where two members have already voted to raise rates, where wholesale prices are up 6% year-over-year, and where markets are pricing a hike before a cut.
Warsh’s first FOMC meeting is scheduled for June 16–17. His confirmed 51–45 Senate vote was mostly party-line, with only Democrat John Fetterman of Pennsylvania crossing the aisle. Jerome Powell, whose term as chair ends Friday, is staying on as a governor in response to what he called “a series of legal attacks on the Fed which threaten our ability to conduct monetary policy without considering political factors.” An unusual but not unprecedented act that raises questions about Warsh’s independence. We feel this concern is overstated.
Warsh’s predicament is analytically clean but politically excruciating. Trump is on record demanding rate cuts. The data is demanding patience at minimum and potentially a hike. Warsh has said he “welcomes a family fight” at the Fed as policymakers work out the right response to economic conditions. His first press conference on June 17 will be among the most closely watched Fed communications in years. Mark Zandi, chief economist at Moody’s Analytics, told CNBC on May 12: “I just don’t see how he’s going to get any kind of support for cutting interest rates in the current environment.” That is a fair assessment. But Warsh is unlikely to pursue rate cuts in the current environment. Conditions on both sides of the Fed mandate — inflation and the labor market — will likely change considerably by Labor Day.
The September Scenario: Narrow but Alive
The path to a September cut is narrow but real. Our base case: a ceasefire framework emerges by Memorial Day; Hormuz traffic normalizes through June and July; energy prices recede materially by mid-summer; and shelter disinflation reasserts itself as the dominant trend in the May and June CPI prints. Under that scenario, headline CPI retreats toward 2.8–3.0% by August, core stabilizes at 2.5–2.7%, and the trimmed mean decelerates to 3.0–3.5% annualized. None of those assumptions require the economy to perform beyond its recent trend — only that the war's worst supply disruptions ease over the summer.
That would create just enough cover for Warsh to deliver a 25 basis point cut in September — framed not as capitulating to White House pressure but as recalibrating policy as a transitory supply shock passes. Such a cut would not be a response to a weakening economy. It would be insurance — a recognition that negative real wages are already creating demand destruction that will show up in the data over the summer. With real average hourly earnings now down 0.3% year-over-year, the consumer has already absorbed a real income cut. The question for September is whether the energy shock that caused it has materially subsided. Oxford Economics’ base case projects core CPI to trend sideways through 2026, not accelerate further. That sideways view is the necessary condition for September.
We do not yet view a rate hike as the base case. We view it as a live risk that was not on the table 60 days ago. The June 16–17 FOMC is, in our assessment, the most consequential meeting since the March 2022 liftoff.
Our Call: Hold in June; September Cut Scenario Conditional on Hormuz
Our base case: June — hold, with language shifting to acknowledge two-sided risks. September — 25bp cut, conditional on Hormuz normalization by end of July, energy prices below $95/bbl, and at least one more month of shelter disinflation re-establishing the trend. If the ceasefire fails and energy remains elevated, the September cut is off the table and the June hiking discussion becomes the policy mainstream. The 30% market probability of a year-end hike is no longer theoretical.
Real Income, the Midterms, and the Iran Incentive
The Consumer Is Being Squeezed in Real Time
The BLS Real Earnings report, released alongside today’s CPI data, delivers the starkest single number in the morning’s data cascade: real average hourly earnings fell 0.5% month-over-month in April. Nominal wages rose 0.2%, to $37.41, but the 0.6% CPI increase outpaced that gain entirely. On a year-over-year basis, real average hourly earnings are down 0.3%. For production and nonsupervisory workers — approximately 80% of the private-sector workforce — real hourly earnings fell 0.3% in April and are down 0.2% year-over-year, deflated by the CPI-W which gives more weight to energy and food, the two fastest-rising categories.
The April jobs report added context that matters. The 115,000 payroll gain looked solid on the headline but was driven almost entirely by health care — nursing homes and home health aides — and social services. These are important sectors, but they are not the high-wage, productivity-driven jobs that feed consumer spending and tax revenue. Transportation and warehousing also posted an outsized gain of 30,000 jobs, with more than all of that increase (38,000) coming in couriers and messengers, which looks to us as a seasonal quirk. Federal employment continued to shrink. The composition tells a story of an economy that is still generating jobs but not as fast as the past two month’s headlines suggests and not the kind of jobs that meaningfully expand purchasing power. Nominal wage growth at 3.6% is running below headline CPI at 3.8%. That means there is no wage-price spiral here. Workers are not driving this inflation by extracting outsized pay increases. This is a supply shock — energy and food costs imposed from outside the domestic economy — squeezing real incomes. The distinction matters enormously for Fed policy, though it offers no practical comfort to the household that spent $4.16 a gallon this month.
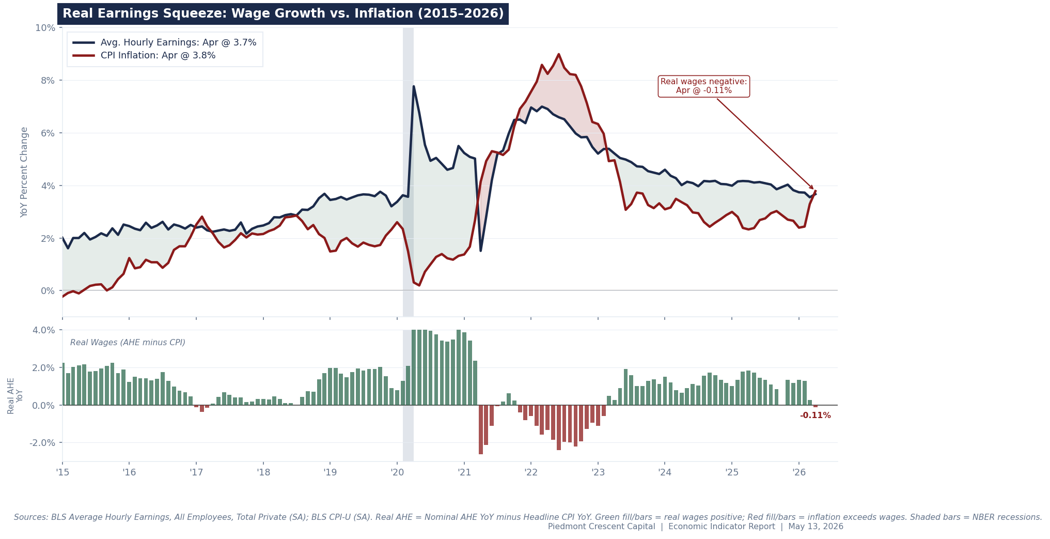
The Midterm Calculus: The Political Clock Is Running
The inflation story converges with the political story in a way that should focus the White House’s attention. A CNN/SSRS poll conducted April 30–May 4 found that 55% of Americans identify the economy and cost of living as the most important issue facing the country — more than double any other issue. Trump’s approval rating on the economy stands at 30% (CNN/SSRS) and on inflation specifically at just 26% (Newsweek/YouGov). A Brookings Institution analysis published in May found that approval for the president’s handling of inflation stood at 30% and the overall economy at 37%, levels that political analysts say endanger Republican House candidates in swing districts.
The YouGov weekly tracker shows the share of Americans saying the economy is “getting worse” has risen from 25% in January 2025 to 61% in May 2026. Only 18% say it is getting better. Critically, 77% of Americans — including a majority of Republicans — say Trump’s policies have increased the cost of living in their own communities (CNN/SSRS). Democrats now lead Republicans by 4 points on the generic House ballot, with the largest swings among independents, suburban voters, and households earning $50,000–$100,000 per year, precisely the people spending the most on gasoline and groceries as a share of income.
The Brookings analysis (William Galston, May 2026) finds that for the first time since 2010, Democrats are more trusted than Republicans to handle the economy. Democrats lead by double digits on trust to handle inflation, the cost of living, income inequality, and healthcare costs. Historically, economic conditions in the 12 months before a midterm are among the strongest predictors of House seat changes. The 2026 midterms are six months away. Gasoline prices that remain above $4.00, grocery bills that continue climbing, and real wages that are negative year-over-year represent an acutely difficult environment for the incumbent party’s congressional candidates.
The Iran Deal Incentive: Connecting the Dots
The political pressure to resolve the Iran war is not subtle, and Trump understands the economic mechanism as well as anyone. A ceasefire deal with Hormuz normalization before Memorial Day sets off a chain reaction that is favorable on every dimension that matters for the midterms: Hormuz traffic recovers over June and July; Brent crude retreats from the $95–110 range toward $75–85; gasoline falls below $3.50 by August; headline CPI retreats toward 2.5–3.0% in the August–September window; real wages turn positive before November; and Warsh delivers a September cut framed as insurance against demand destruction, not capitulation to the White House.
A deal with Iran also unlocks the Saudi spigot. It removes the primary constraint on Riyadh and the other Gulf producers. The Saudis and UAE have signaled, publicly and through diplomatic channels, that they are ready to increase production materially once Hormuz normalizes and sanctions relief is on the table. OPEC+ has roughly 5 million barrels per day of spare capacity that could come to market quickly. Cheaper gasoline before November is worth more to Republican House incumbents in competitive districts than any other policy outcome Trump can deliver.
Iran's incentives are just as visible. The country faces severe economic pressure and military degradation. The Islamabad talks produced no deal but did produce 21 hours of direct engagement — the most substantive U.S.–Iran diplomacy since 1979 — and both sides left written proposals on the table. Iran’s leverage lies precisely in the political and economic pain that the continued disruption inflicts on the U.S. economy. Every month of elevated oil prices, negative real wages, and deteriorating Trump approval ratings is leverage for Tehran. The ceasefire expiration on April 22 passed; the war has not resumed. That is not an accident. Both sides have something to gain from a deal before summer.
Perspectives from Piedmont Crescent Capital
— Mark P. Vitner, Chief Economist, Piedmont Crescent Capital
— Mark P. Vitner, Chief Economist, Piedmont Crescent Capital
— Mark P. Vitner, Chief Economist, Piedmont Crescent Capital
Bottom Line: The Inflation Thesis Has Changed
April’s CPI is not a repeat of March. March was a single-category shock. April is the early evidence of second-order effects: energy costs flowing through food, transportation, and services; core CPI accelerating; the trimmed mean moving in the wrong direction; and PPI confirming the pipeline is still full. Real wages have turned negative year-over-year for the first time in three years.
The disinflation story is not finished. Shelter is still slowing structurally. Goods prices are subdued. Tariff pass-through is winding down. If Hormuz normalizes, the energy pass-through should peak in Q2. None of that is trivial. But the margin for error has narrowed considerably. The disinflation path that looked gradual and nearly confirmed in Q1 is now in dispute.
For investors and policymakers alike, the operative framework must shift: from ‘when will the Fed cut’ to ‘how long can the Fed hold out before inflation breadth forces its hand’ — and from ‘will there be a good deal with Iran’ to ‘how quickly can it happen.’ The next twelve weeks will answer both questions.
Key Data Releases to Monitor
April PCE Deflator (May 30): The Fed’s preferred measure. Our estimate: core PCE +0.30% MoM, +3.2% YoY; headline PCE +0.45% MoM. AI-driven software prices may temporarily boost YoY PCE core by an estimated 0.17pp — likely a measurement artifact. Watch the “super core” PCE (services ex-housing ex-energy) for the cleanest underlying signal.
Warsh’s First Public Remarks as Chair: The most consequential Fed communication in years. Watch for his framing on: (a) whether April is a supply shock or a broadening trend; (b) whether he shifts the communication framework away from the dot plot; and (c) what conditions he sets for rate cuts. His answer to (c) is the September scenario’s critical variable.
May CPI (June 11): The most important inflation print of the summer, arriving six days before Warsh’s first FOMC meeting. Energy base effects should provide some headline relief if oil stays near current levels. The critical question: does core stabilize or continue climbing? A second consecutive +0.35%+ core print would materially raise the June hiking probability.
Hormuz Ship Traffic (Daily): The real-time indicator that underpins every scenario. USS Frank E. Peterson and USS Michael Murphy completed mine-clearing transit May 11. Iran has not resumed kinetic operations. But with only 15 vessels per day versus a pre-war average of 138, the economic blockage is still essentially complete. Watch EIA and Reuters daily shipping data for the first signs of commercial normalization.
Iran Ceasefire / Deal Timeline (Ongoing): Our base case projects deal outlines around Memorial Day, implementation over June, and Hormuz normalization by end of summer. This is the necessary condition for the September cut scenario, the reversal of real wage declines before November, and the political narrative Trump needs for the midterms. Every week of delay narrows all three windows.
mark.vitner@piedmontcrescentcapital.com · (704) 458-4000
May 13, 2026
© 2026 Piedmont Crescent Capital. Sources: BLS CPI-U, PPI, Real Earnings (May 12–13, 2026); Federal Reserve Bank of Cleveland; CME FedWatch; Brookings Institution; CNN/SSRS (Apr 30–May 4, 2026); CNBC; Yahoo Finance; TheStreet; Oxford Economics. For informational purposes only. Not investment advice.
Capital Cycle Carries the Day, Even as the Labor Market Cools
| PIEDMONT CRESCENT CAPITAL | May 10, 2026 |
|
Highlights of the Week
• Economic Pulse: Capital cycle is real. Labor market softening at the margin. War remains the dominant risk. • ISM Manufacturing: Held at 52.7 in April, fourth straight month of expansion. Prices surged on the oil shock; employment fell to 46.4. • ISM Services: Rose to 53.6, the 22nd consecutive month in expansion. • Employment: April payrolls +115K, beating the 55K consensus; unemployment held at 4.3%. ADP at +109K corroborated the BLS read. Low-hire, low-fire continues. • NY Fed Survey: One-year inflation expectations rose to 3.6%; longer-run remained anchored at 3.0–3.1%. • GDPNow: Atlanta Fed Q2 nowcast at 3.7% as of May 8 — driven by investment, not consumption. • Markets: 10-year near 4.41%. Brent ~$101 after touching $119. FOMC held 8-4, the most dissents since 1992. • Geopolitics: Ceasefire on “massive life support” after Trump rejects Iran proposal. Trump-Xi summit May 14–15. Market Snapshot
Brent Crude: ~$101 / bbl WTI: ~$95 / bbl 10-Yr Treasury: 4.41% 2-Yr Treasury: 3.81% Yield Curve (2s10s): +60 bps Fed Funds Target: 3.50–3.75% Atlanta GDPNow Q2: 3.7% |
Capital Cycle Carries the Day,
|
The Macro Backdrop
The period since our last weekly report has been unusually rich in key economic data. The April employment report, ADP, both ISM surveys, the New York Fed Survey of Consumer Expectations, the UMich survey, and the latest Atlanta Fed GDPNow nowcast all landed in close succession. Taken together, they sketch a clearer picture than any single release. The capital cycle is real and is driving topline growth. The labor market is cooling gradually but is not breaking. Underlying inflation is contained, though headline measures are being pushed around by the oil shock. And the war with Iran remains the central risk to the expansion.
Begin with growth. After rising at a solid 2% pace in Q1, the Atlanta Fed's GDPNow projects real GDP to rise at a 3.7% pace during the current quarter, up from 3.5% a week earlier. Nonresidential fixed investment is expected to contribute roughly 0.8 percentage points to headline growth and real personal consumption another 1.8 points. Government spending, trade, and inventory building account for another 0.8. This is a capital-led expansion of a sort the post-2008 economy rarely produced. AI infrastructure, power generation, grid expansion, reshoring, and defense investment are no longer talking points; they are pushing measured growth into territory we have not seen in any meaningful stretch since the late 1990s. The war is a real drag, but business investment is more than offsetting it, pulling the headline higher rather than letting it slip. AI is also beginning to deliver productivity gains, modest this year and likely to compound in future years. The economy is being fueled more by protein, that is, capital investment and intellectual capital, than by carbohydrates.
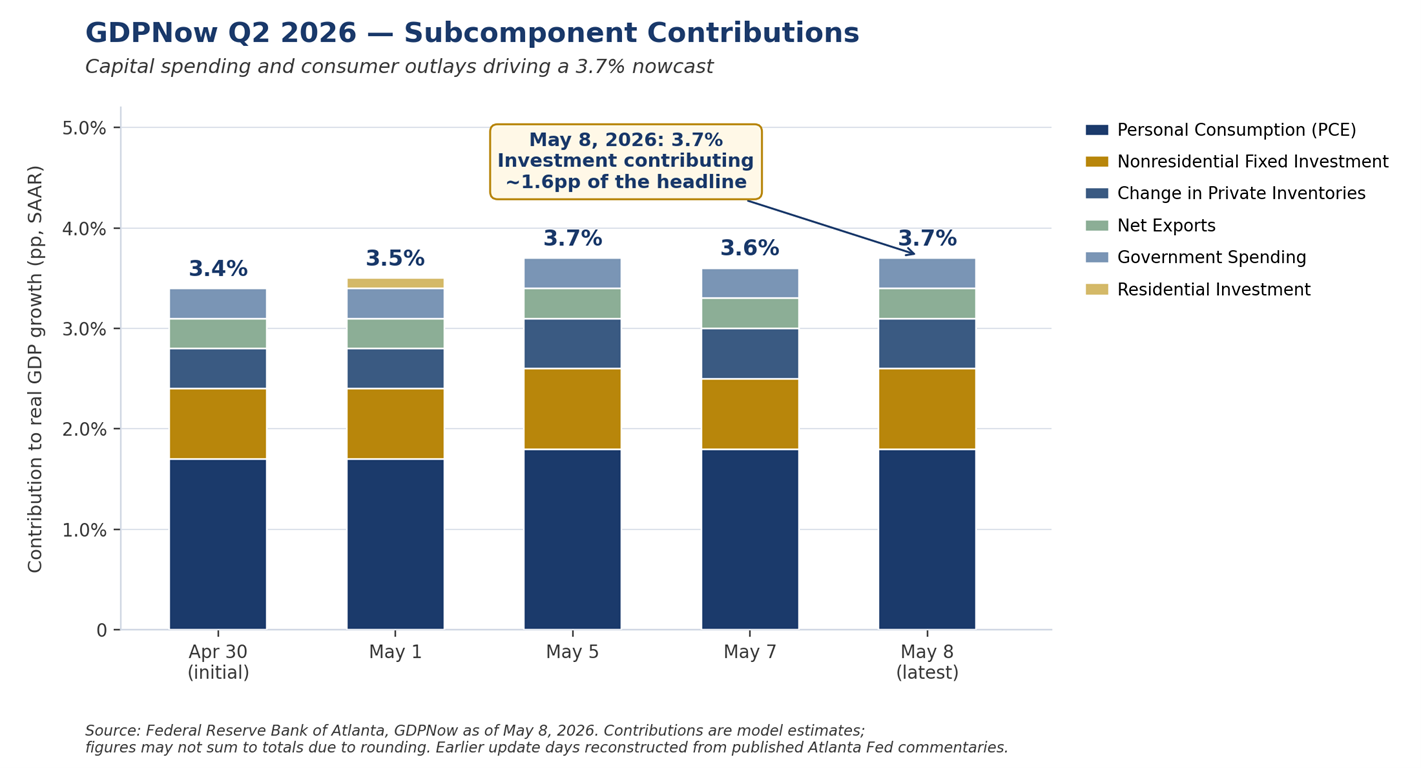
The ISM surveys reinforced the same picture. Manufacturing held at 52.7 in April, a fourth consecutive month of expansion. New orders, the most forward-looking component of the survey, strengthened to 54.1. Production decelerated but stayed in expansion at 53.4. Two warning lights flashed. The Prices Index surged at the fastest pace since April 2022, driven by oil and diesel costs, and the Employment Index fell to 46.4, the sharpest contraction in four months and a rare countersignal in an otherwise firming jobs picture. Services rose to 53.6, the 22nd consecutive month in expansion. Demand is holding up, but costs are climbing — a strain that became increasingly visible in Q1 earnings commentary. Where the surveys go from here depends largely on how the Iran conflict plays out. Most business owners we hear from are not expecting the disruption to drag into the summer; if it does, the softer-tier data will likely give way first, and firms whose margins have been squeezed for any sustained period will need to begin cutting costs in earnest.
Labor Market: Low-Hire, Low-Fire Continues
Friday's employment report did not change the labor market story so much as confirm it. Nonfarm payrolls rose 115,000 in April, well above the 55,000-consensus estimate, although February was revised sharply lower by another 23,000 to a net loss of 156,000. The gains were concentrated in healthcare (+37,000), transportation and warehousing (+30,000), and retail trade (+22,000). Federal government employment continued to contract, falling another 9,000 in the month and roughly 348,000 since October 2024. Manufacturing payrolls edged down 2,000, consistent with the ongoing weakness signaled by the ISM employment index. The unemployment rate ticked up modestly, but the rounded figure held at 4.3%.
What growth there has been in the manufacturing sector remains concentrated in the capital-intensive industries — semiconductors, machinery, chemicals, and related high-tech durables — where surging fixed investment in equipment, automation, and AI-related infrastructure is driving robust output and value-added gains but delivering only modest net employment increases. That mix tells us most of what we need to know about why nominal payrolls and the underlying productive economy can diverge for an extended period.
Questions about the quality of April's payroll gain persist, as the BLS birth-death model added 386,000 jobs in the unadjusted data — more than accounting for the entire reported increase. ADP's independent read should largely put those concerns to rest. The ADP National Employment Report, which covers a much larger sample of private payrolls and has historically aligned closely with BLS annual revisions, showed a solid +109,000 private-sector gain in April, the strongest reading since January 2025. Education and health services again led the way. Wage growth for job-stayers remained steady at 4.4% year-over-year.
Average hourly earnings in the BLS report rose a modest 0.2% month-over-month and 3.6% year-over-year, below the pace of inflation. This is the texture of a labor market that has settled into the “stable but not strong” equilibrium Chair Powell, Governor Waller, and Chicago Fed President Goolsbee have been describing for some months. Hiring is slow, layoffs are limited, and the gains continue to skew toward lower-paying service sectors, weighing on the average hourly earnings figure. At the same time, voluntary attrition has slowed to unprecedented lows across most industries — reducing training and onboarding costs but pushing up wage and benefit expenses, as annual increases are now applied across a more experienced and higher-paid workforce.
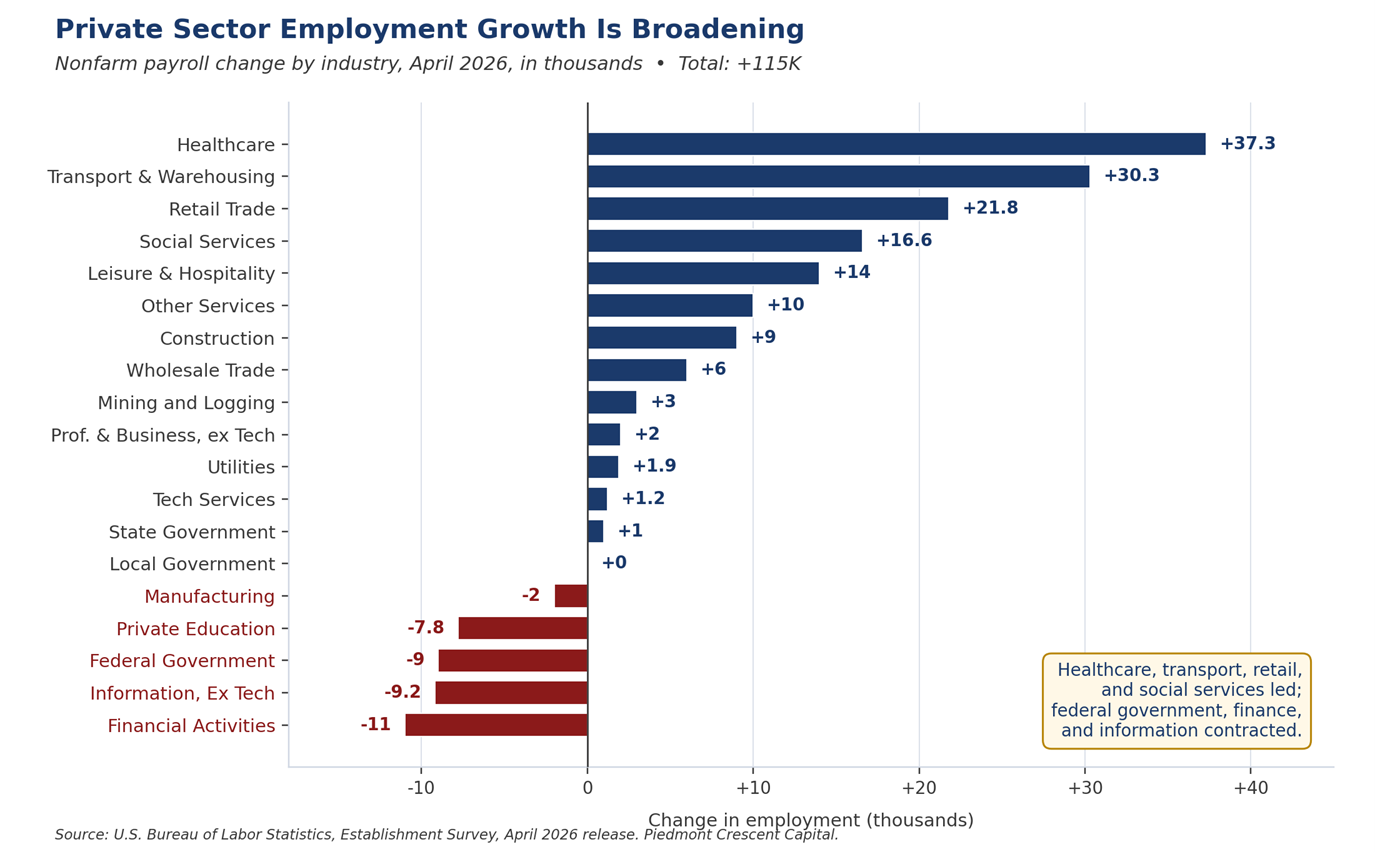
The New York Fed's April Survey of Consumer Expectations added important context. One-year inflation expectations rose to 3.6%, but the three-year and five-year measures held steady at 3.1% and 3.0%. Longer-run expectations remain well anchored even as headline inflation gets pushed around by gasoline, which is a quietly encouraging signal that household psychology has not yet shifted. The mean perceived probability of a higher unemployment rate one year out — the other side of the Fed's dual mandate — rose to 43.9%, the highest reading since April 2025. Households are uneasy about jobs but have not yet adjusted their spending plans materially.
By contrast, the University of Michigan preliminary May reading plunged to a record low of 48.2, far more pessimistic than the New York Fed survey and driven heavily by gasoline prices and tariff concerns. The divergence reflects the Michigan survey's greater sensitivity to immediate pocketbook and political strains. The New York Fed data are reassuring in that longer-term inflation expectations remain contained. We put more weight on the New York Fed series, as longer-run expectations are what matter most for the Fed's policy calculus.
The Capital Cycle in the Numbers: Milken and Earnings Season
First-quarter earnings continued to validate the capital-intensity story that permeated the Milken Institute Global Conference in Beverly Hills this past week. The 29th annual conference made one thing clear: the largest pools of capital in the world are leaning into this cycle rather than stepping back from it. Blackstone President Jon Gray captured the prevailing sentiment when he reminded the audience that the U.S. economy and global markets have powered through pandemic, inflation, regional conflict, and now the war with Iran, and he saw no reason to expect anything different this time. Most of the panel speakers we heard echoed that view. The mood was constructive in a way it has not been at Milken in some time.
A few of the more substantive themes from this year's panels we feel deserve emphasis. AI has moved decisively from a software story to an industrial buildout, and the financing is following suit. Panels featuring Macquarie, Actis, ECP, and DataVolt discussed how institutional capital is being deployed across power generation, grid, storage, and data centers, increasingly through private credit and insurance balance sheets rather than traditional bank channels. The AI–energy backbone in particular is shaping up as the dominant new driver of infrastructure capital formation, with reliability, duration, and regulatory constraints, and importantly not capital availability, emerging as the binding constraints on the pace of deployment.
Private credit got plenty of attention as well, both as an enabler of the cycle and as a source of nascent concern. The stress signals at Tricolor and First Brands came up repeatedly in hallway conversations, but the largest sponsors — Apollo, Ares, Blackstone, Blue Owl, and Golub — sounded notably constructive on direct lending volumes overall, while acknowledging that the easy returns of 2022 to 2024 are behind us. The asset class continues to grow, but selectivity is back.
The earnings data backed up the conference rhetoric. With 89% of the S&P 500 having reported, blended Q1 earnings growth stands at 15.1% year-over-year, the sixth consecutive quarter of double-digit growth. Eighty-four percent of companies beat EPS estimates, the highest beat rate since Q2 2021, and in aggregate companies are reporting earnings 18.2% above estimates against a five-year average of 7.3%. By any conventional measure these are exceptional numbers.
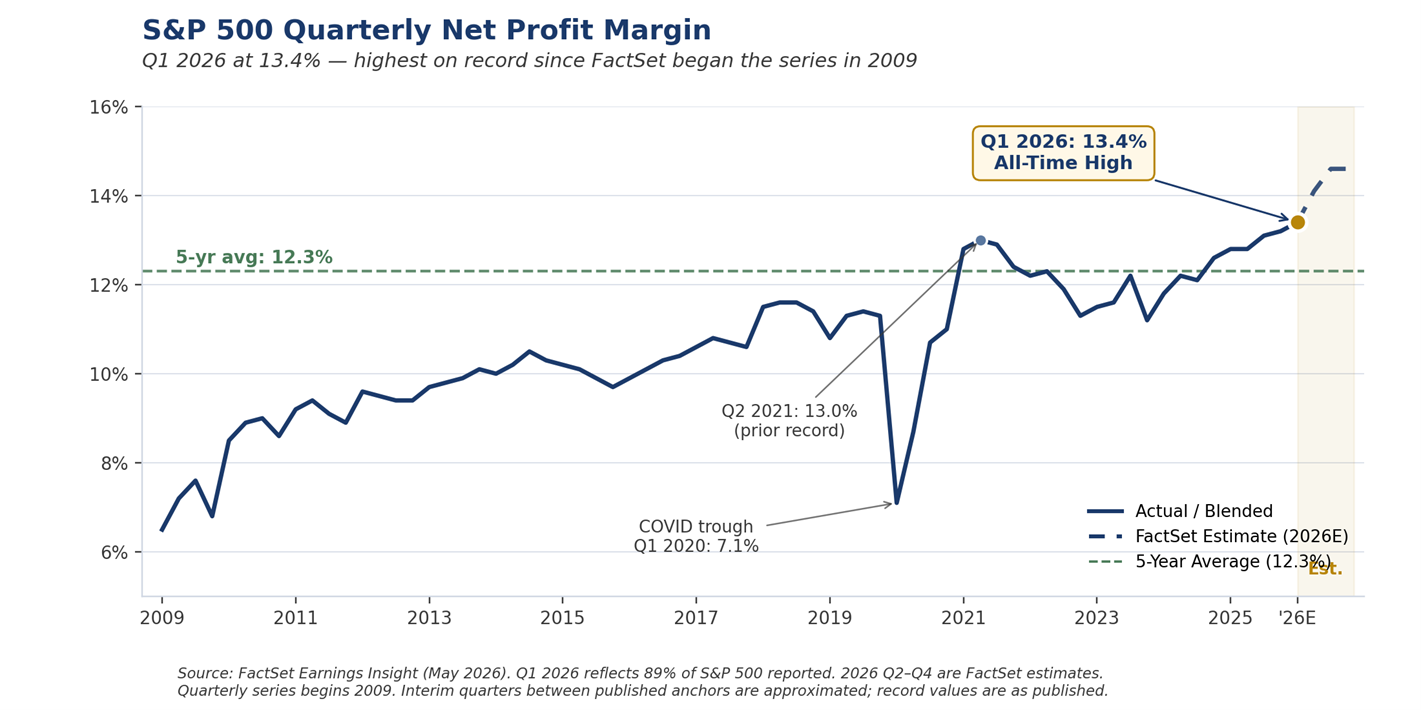
The single most striking data point is the blended net profit margin of 13.4% for Q1 2026, the highest reading on record since FactSet began tracking the metric in 2009 and a step up from the prior record of 13.2% set just one quarter ago. Information Technology led at 29.1%, up from 25.4% a year earlier. The capital-intensity thesis is showing up where it ultimately matters most — in the bottom line. Firms that allocated capital toward automation, productivity, and AI-enabled process redesign during the post-pandemic period are now translating modest revenue growth into outsized earnings growth, and the operating leverage runs throughout the income statement.
A genuinely new differentiation emerged within the Mega-cap technology complex this earnings season. Alphabet rose roughly 34% in April, its strongest monthly gain since 2004, after a Q1 beat across cloud, advertising, and Waymo. Meta Platforms fell roughly 9% despite beating earnings, after raising their 2026 capex guidance to a range of $125 to $145 billion. The market is no longer rewarding the scale of AI commitment alone; it has begun demanding evidence of returns, or at least a credible path to wider margins. This is a healthy development for the cycle, and it distinguishes the current capex boom from earlier ones in which spending itself was treated as a positive signal regardless of the back-end economics.
Two caveats are worth highlighting alongside the strength. AI-related capex is beginning to crowd out other investment categories in certain segments, a shift that bears watching even as aggregate investment continues to rise. And the private credit stress signals are real, even if overall flows remain ample. Tricolor and First Brands have generated headlines, and we expect more idiosyncratic accidents in the asset class in coming quarters. Neither caveat undermines the broader thesis. Both argue for selectivity. Pricing power has narrowed but not disappeared. Firms with genuine productivity gains can still hold price; firms without them cannot.
The composition of growth has lasting benefits beyond the immediate cycle. The most important implication is that it supports stronger potential GDP. It raises long-run electricity demand in ways that will require sustained investment for a decade or more. It rewards firms that allocate capital well. And it likely contributes to the upward drift in long-term interest rates. The transmission mechanism to higher rates is the competition for capital, not higher underlying inflation. The economy should be capable of growing more rapidly than it has during the bulk of the post-2008 period, to something closer to what occurred in the late 1990s.
Markets & Financial Conditions
Bonds and equities remain at odds with one another. The 10-year Treasury yield held near 4.41% this week, the 2-year near 3.81%, and the curve sits positively sloped by roughly 60 basis points. The long end is being pushed higher by three forces working in the same direction: oil-driven inflation expectations, persistent term premium rebuilding on heavy Treasury issuance, and a structural growth rate that may be meaningfully higher than the post-2008 framework assumed. The bond market is pricing the war as a duration risk rather than a flight-to-quality story, which is unusual and worth flagging.
Equities continue to take the constructive view. The Q1 earnings strength has broadened beyond a handful of mega-cap names, and the capital-cycle theme is supporting cyclicals tied to power, grid, defense, and reshoring. Higher rates that reflect stronger growth are very different from higher rates that reflect inflation worries, and we read the current move as much closer to the former. That said, the gap between equity and bond pricing is wider than the underlying data justify in both directions. The bond market's caution looks well grounded.
Brent settled near $101 after touching $119 earlier in the week on fresh clashes between U.S. and Iranian forces in the Strait. WTI sat near $95. The Strait of Hormuz remains effectively closed, and the IEA continues to characterize the disruption as removing roughly 14 million barrels per day from global supply. U.S. retail gasoline is over $4 per gallon. Refined product stocks have drawn for twelve consecutive weeks for gasoline and nine for distillates. The supply-side math is considerably starker than the headline crude price would suggest.
Piedmont Perspective: A Divided Fed and the Warsh Transition
The April 29 FOMC meeting was Chair Powell's last and one of the most consequential in years. The Committee held the federal funds target at 3.50 to 3.75% on an 8-4 vote, the most dissents the Committee has recorded since 1992. Unsurprisingly, Governor Miran preferred a 25 basis-point cut. Cleveland's Hammack, Minneapolis's Kashkari, and Dallas's Logan all supported holding rates steady but objected to including an easing bias in the statement. The split is real and reflects a growing concern among the hawks that the easing cycle may already be over and that the next move, if there is one, could just as plausibly be a hike as a cut. The path to consensus inside the Committee has narrowed considerably.
Kevin Warsh's nomination cleared the Senate Banking Committee on Wednesday, with final Senate confirmation now imminent. Warsh is on track to chair the June 17 FOMC meeting. Futures markets are pricing roughly a 93% probability of a hold in June, and we agree with that probability. Warsh's framework, as he laid it out in his confirmation testimony and in his subsequent commentary, rests on a handful of core ideas. Policy should remain restrictive until inflation is fully anchored. Balance sheet normalization should continue. Markets need stronger price discovery. And the Treasury and the Fed must acknowledge their growing interdependence, particularly with fiscal deficits running at the current scale.
The most underappreciated element of the Warsh framework is his structural optimism about productivity. He has argued that AI is materially boosting the supply side of the economy and that the Fed needs to do considerable additional work to assess the productivity boom in real time. A central banker who believes potential output is rising should, in principle, tolerate higher measured growth without raising rates. The implication is that the gap between Warsh's stance and Powell's may be narrower than markets are currently pricing, particularly if the labor market stays in its current low-hire, low-fire equilibrium.
Our base case is a patient Warsh Fed through the June meeting, followed by a 25 basis-point cut in September if the war risk subsides and the underlying inflation trend continues to drift lower. We see a possible second cut at the December meeting, but only if the labor market weakens meaningfully. The first real test arrives once the economy moves past the Iran-related distractions and growth firms as inflation moderates. If growth firms more decisively than we expect, the second cut becomes considerably less likely.
Geopolitics: Iran Hits a Wall as Trump Heads to Beijing
The Iran picture has deteriorated meaningfully in the last several days. President Trump rejected Tehran's most recent counterproposal as “totally unacceptable” and declared on Monday that the conditional ceasefire is on “massive life support.” The administration has accused Iran of reneging on commitments around the disposition of its enriched uranium stockpile, and Trump aides have been describing the President as more seriously considering a resumption of major combat operations than at any point in recent weeks. The Strait of Hormuz remains effectively closed. The U.S. naval blockade of Iranian ports is in its fourth week. Operation Project Freedom, the Navy escort mission for outbound merchant ships that Trump launched on May 4 and paused two days later on reports of progress, may not stay paused much longer but would provide only minimal relief. Brent traded as high as $119 earlier in the week before settling back near $101 as the diplomatic temperature kept changing.
Our reading is that further military action is now more likely than not, simply because there is no other way to bridge the gulf between what each side currently views as an acceptable outcome. Tehran wants compensation for war damage, the release of frozen assets, and the lifting of sanctions before yielding control of nuclear material. Washington wants the uranium out, the Strait fully open, and a binding curtailment of Iran's ballistic and missile programs before serious sanctions relief is on the table. Beyond these specifics, Washington would also like to see an Iranian regime less openly hostile to the West.
The Iranian negotiating position has hardened further in recent weeks under pressure from hardliners critical of Parliamentary Speaker Ghalibaf's lead role. A short, sharp escalation aimed at infrastructure rather than population centers may be the only mechanism available to the administration to reset expectations and unstick the talks. The risk is that even a calibrated escalation could trigger a less calibrated response, particularly from elements of the Iranian Revolutionary Guard with their own incentives. For the IRGC, a deal along U.S. guidelines is an unacceptable existential risk.
That backdrop frames the Trump-Xi summit on May 14 and 15 in Beijing, the first state visit to China by a sitting U.S. president since Trump's own visit in 2017. The summit was originally scheduled for March and pushed back after the Israeli and U.S. strikes on Iran. The principal agenda items are trade, rare earths, semiconductors, AI, Taiwan, and Iran. Treasury Secretary Bessent and Vice Premier He Lifeng meet in Seoul on Wednesday to finalize the trade groundwork. Trump is traveling with a large delegation of U.S. CEOs including Musk, Cook, Fink, Schwarzman, Solomon, Mehrotra, and Amon, signaling that the administration wants tangible purchase commitments to point to ahead of the November midterms. The new “Board of Trade” mechanism, intended to police follow-through on Chinese purchase commitments, will be the centerpiece of any announcement.
Iran is the wild card in Beijing. China is Iran's largest crude buyer, and the U.S. Navy is currently intercepting tankers bound for Chinese ports. Beijing hosted Iranian Foreign Minister Araghchi last week and is publicly positioning itself as a potential broker on Hormuz, an awkward but useful role given how few governments have working relationships with both Tehran and the Gulf states. Concrete progress on Iran at the summit is unlikely. The optics matter regardless. If the two leaders signal even modest alignment on freedom of navigation through Hormuz, oil markets could give back $10 to $15 a barrel of crisis premium very quickly. If the summit produces nothing on Iran, or if it coincides with renewed U.S. strikes, oil will move sharply the other way.
Our base case remains that an outline agreement on Iran comes together by late May or early June, with the political pressure of Memorial Day and the summer driving season weighing on both sides. We have moved the downside probability up to 35% from 30%, reflecting both the deterioration in the negotiating tone over the past several days and the increased likelihood of additional U.S. military action. Markets remain priced considerably closer to the base case than the risk case, particularly in equities. The supply-chain consequences of the conflict continue to extend well beyond crude. Fertilizers, industrial gases, ammonia, and freight insurance are all exposed. Disruptions of this kind typically appear first in corporate margins and only later in consumer prices, with a one to two quarter lag. The April surge in the ISM Manufacturing Prices Index is the leading edge of that adjustment.
CFO & Treasurer Corner
What This Means for Corporate Finance
Funding & Issuance: The fixed-rate window remains open but is no longer improving. Term premium continues to build as markets digest the war, the deficits, and the structural growth picture. Borrowers should lock in fixed-rate funding opportunistically and pull forward 2027 and 2028 maturities where the trade-off allows. Floating-rate borrowers should stress-test interest coverage assuming the 10-year remains at or above 4.40% through year-end.
Energy & Input Costs: Brent has settled near $101 after touching $119 mid-week. The April ISM Manufacturing Prices Index surged at its fastest pace since 2022, and diesel and middle distillates remain the choke point. Firms exposed to freight, logistics, or petrochemical inputs should be stress-testing 2026 cost assumptions now, and the hedging window may be shorter than usual.
Capital Allocation: Capex guidance from Q1 earnings has continued to rise. The cycle is being driven by AI infrastructure, power generation, grid expansion, and reshoring, and it is showing up in the early Q2 GDP forecasts. AI is delivering measurable productivity gains today, with the bigger payoff likely to compound over the coming years. Firms with credible productivity stories are being rewarded; those without are not. This is a moment to commit, not to wait.
Planning Assumption: Our base case has the Strait of Hormuz reopening by mid-summer, Brent retracing toward $80 by year-end, GDP growing around 2.5% driven by capital spending, and the Warsh Fed delivering one cut in September. With the downside probability now at 35% and rising, we recommend explicitly building the war-escalation case into Q2 board discussions and ensuring liquidity buffers can withstand a 60-day run at $130 Brent alongside materially slower global growth.
Looking Ahead
| Day | Release / Event | Why It Matters for CFOs & Markets |
|---|---|---|
| Tuesday | CPI (April); NFIB Small Business Optimism | Headline CPI is the cleanest read on how much of the oil shock is flowing into the broader price basket. The Cleveland Fed median and trimmed-mean prints embedded in this report will tell us whether the underlying trend is still drifting lower or has stalled. |
| Wednesday | PPI (April); Senate floor vote on Warsh confirmation expected; Bessent meets Vice Premier He Lifeng in Seoul | PPI will speak to margin pressure for goods producers. The Warsh confirmation vote could come this week, with markets attentive to any commentary on the timing of the first Warsh Fed meeting in June. The Seoul meeting between Treasury and China's economic czar sets the table for the Trump-Xi summit later in the week. |
| Thursday | Retail Sales (April); Initial Claims; Industrial Production; Trump-Xi summit (Day 1, Beijing) | First read on whether the consumer is responding to higher gasoline prices. Claims continue as the highest-frequency labor signal. IP will track manufacturing momentum after the soft ISM employment print. The summit's opening session is the most consequential event of the week for trade, technology, and the path of the Iran negotiations. |
| Friday | Housing Starts & Permits (April); UMich Sentiment (preliminary, May); Trump-Xi summit (Day 2, joint readout) | Starts will signal whether higher long rates are weighing on residential investment. UMich sentiment has run well below the hard data; convergence in either direction is the question. The summit's joint readout and any commitments on rare earths, technology, agriculture, and Iran will close out the week. |
Markets will focus on next week's CPI and PPI as the cleanest read on how much of the oil shock is flowing through to the broader price basket, on Thursday's retail sales as a real-time check on consumer behavior, on the Senate confirmation vote for Kevin Warsh, and on the Trump-Xi summit. The interpretation of these prints will matter more than the headline numbers themselves. The unsettled questions are whether the better measures of underlying inflation continue drifting lower despite headline pressure, whether the Powell-to-Warsh transition introduces fresh volatility at the long end, whether Beijing offers anything meaningful on Hormuz, and whether the Iran negotiations require another round of military action to get unstuck.
Scenario Framework
| Scenario | Macro & Market Implications | Corporate Finance Action |
|---|---|---|
| Base Case (50%) | Outline agreement on Iran by late May or early June; Hormuz reopens by mid-summer with U.S. military reinforcement of the timetable; Brent retraces toward $80 by year-end. Capital cycle continues to drive Q2/Q3 GDP at 2.5–3.0%. Labor market stays in low-hire, low-fire equilibrium with unemployment at 4.3–4.5%. Warsh Fed delivers a 25 bps cut in September, holds in November and December. 10-year holds a 4.30–4.60% range. | Lock fixed-rate funding opportunistically; long end no longer improving. Continue capex investment in productivity-enhancing projects. Use any back-up in long rates above 4.60% as an issuance window. Build moderate inventory buffers on energy-sensitive inputs. |
| Upside Case (15%) | Trump-Xi summit produces meaningful alignment on Hormuz; Iran agrees to verifiable nuclear concessions by early June; Hormuz reopens faster than expected. Brent returns to a $75–80 range by Q3. Capital cycle accelerates as input cost pressure recedes. Equity earnings broaden further. Warsh Fed cuts 50 bps over H2. | Step up productivity-led capex. Reassess working capital toward growth. Communicate margin trajectory clearly. Refinancing window opens further. |
| Downside Case (35%) | Negotiations collapse or escalate through Q3; Brent moves to $130+. Headline CPI re-accelerates above 4%. Consumer cracks visibly in lower-income segments. Fed paused indefinitely. Credit spreads widen 50–100 bps. GDP slows to 1.0–1.5% in H2. | Stress-test floating-rate exposure. Build liquidity buffers. Defer non-essential capex. Hedge energy and freight inputs aggressively. Review covenant headroom on leveraged credits. Lengthen working-capital cycles. |
Forecast Update
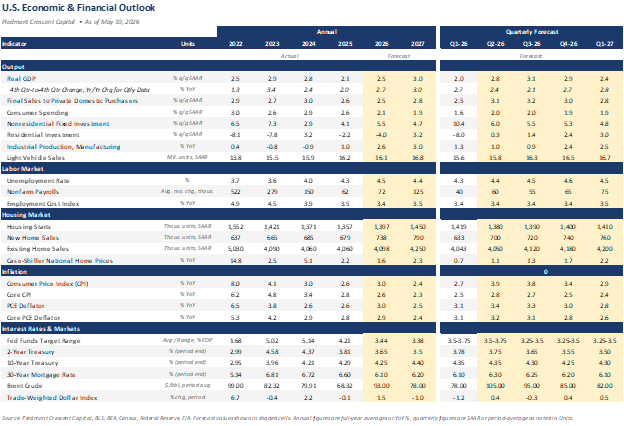
Disclaimer
This commentary reflects the views of the author as of the date noted and is provided for informational purposes only. It does not constitute investment advice or a recommendation to buy or sell any security. Information has been obtained from sources believed to be reliable, but accuracy and completeness are not guaranteed. Past performance is not indicative of future results. © 2026 Piedmont Crescent Capital.