The CAVU Compass
Inflation, the Tanker and the Server
How the Economy Carries a War Premium
Inflation owns the headlines, but growth is the story. The cyclical rebound is broadening beyond AI. With the economy at full employment, the next Fed move is a hike, but well out into 2027 or beyond.
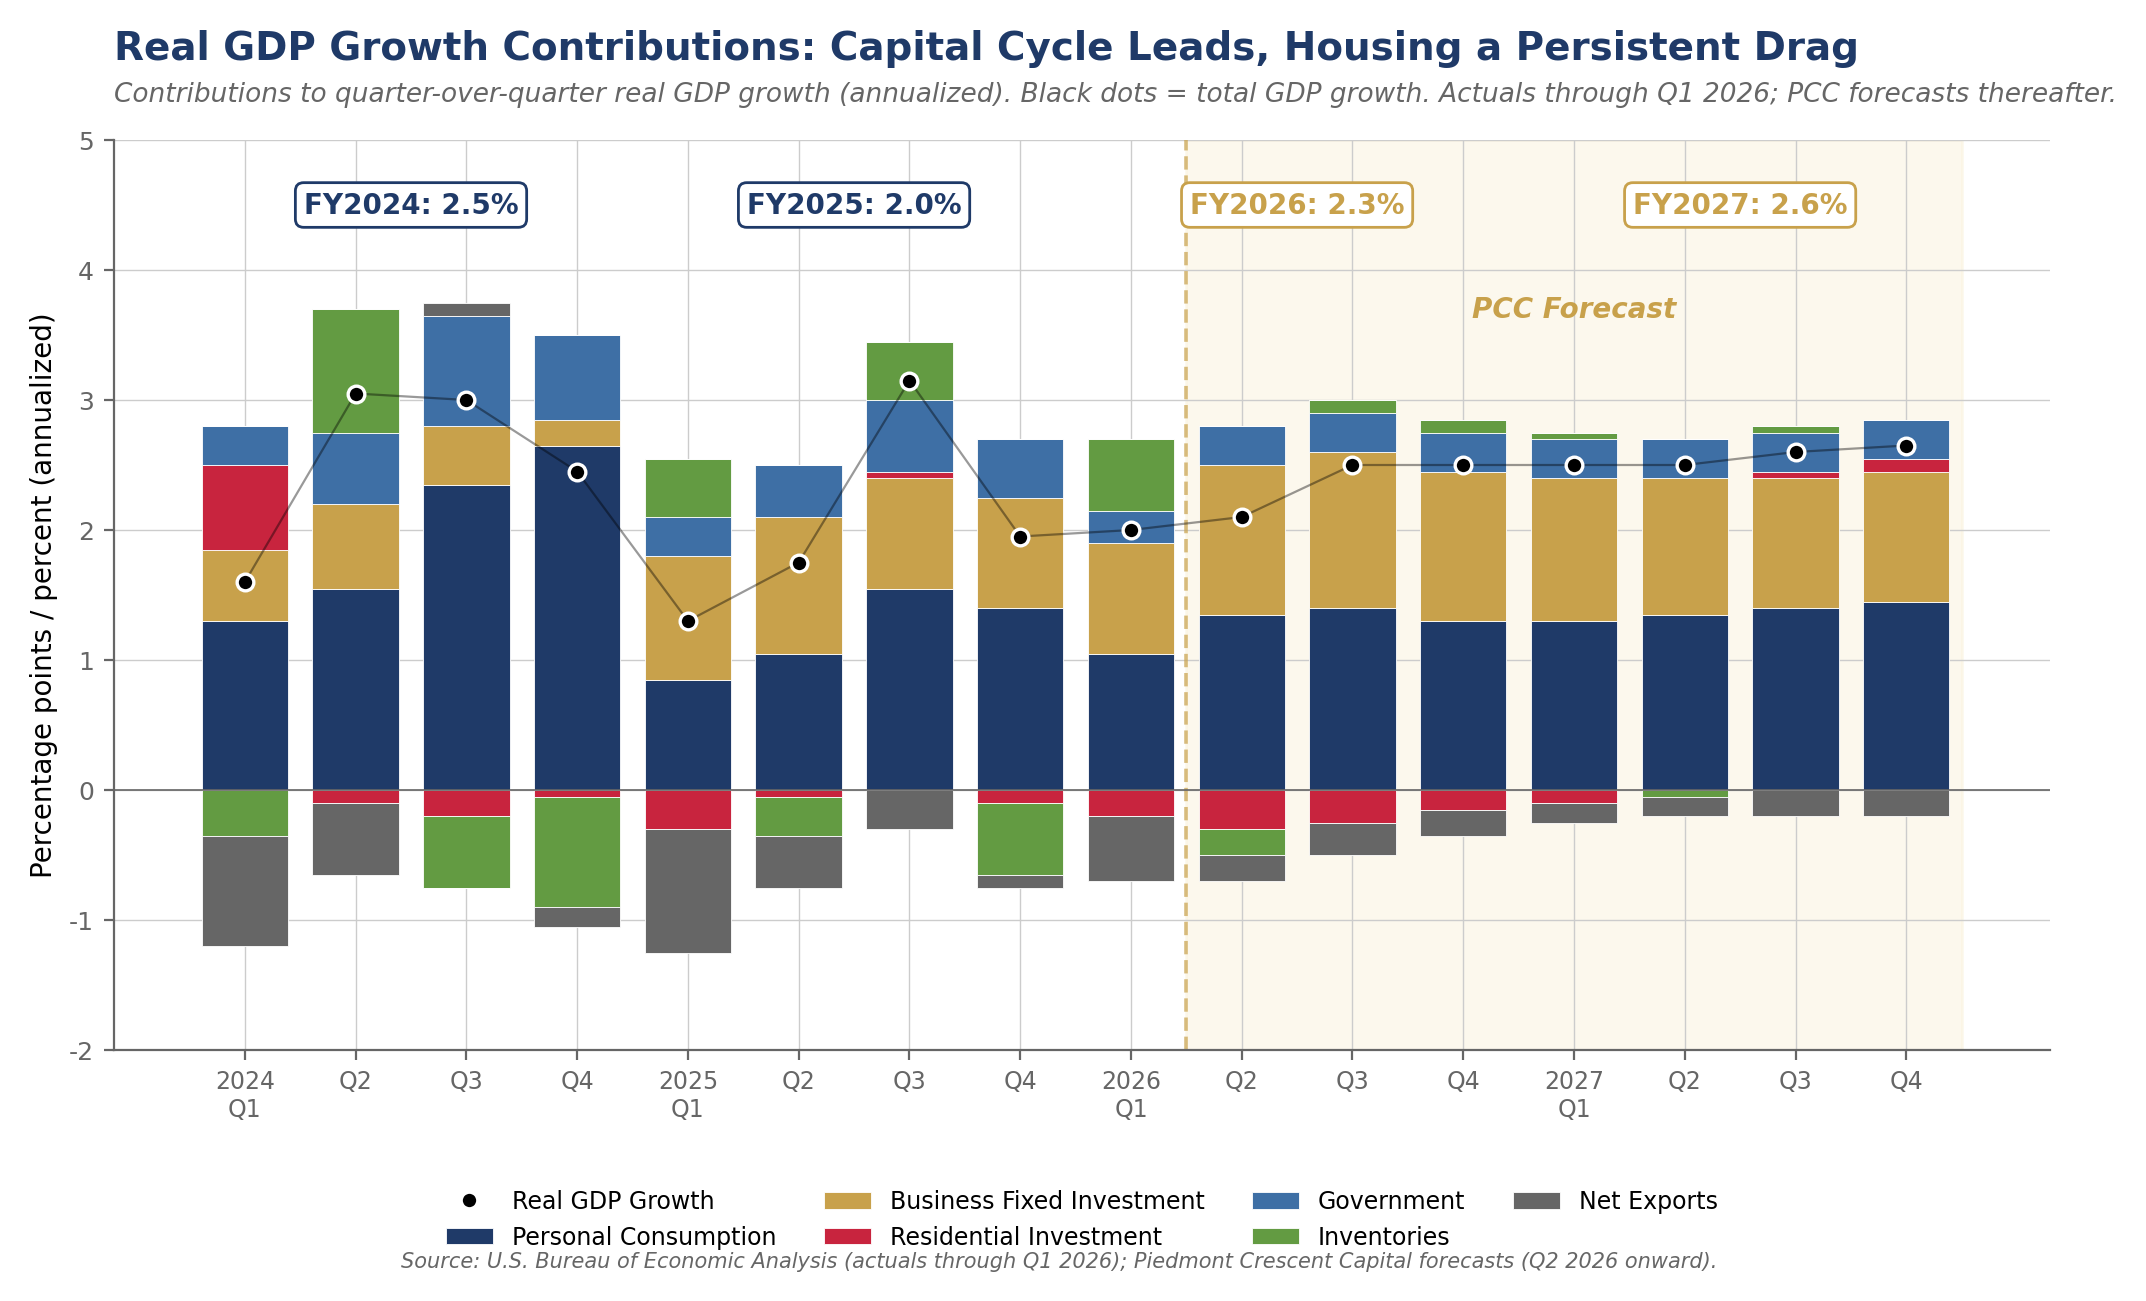
The cyclical rebound is real and broadening well beyond AI. ISM Manufacturing rose to 54.0 in May, a four-year high, with new orders at 56.8 and all six of the largest manufacturing industries expanding. Nondefense capital goods orders excluding aircraft surged 24.2% in April. Unfilled orders are up twenty-one of the last twenty-two months. The manufacturing recession of 2024-2025 is over. This cyclical inflection point is the foundation of our above-consensus 2.5% full-year U.S. growth call, well ahead of the World Bank’s 2.2%.
172k payrolls against a breakeven rate near zero — the labor market is at full employment. May payrolls of 172,000 beat the 80,000 consensus, with March and April revised up by a combined 93,000. Unemployment held at 4.3%. Voluntary attrition has slowed to unprecedented lows. Critically, Fed staff research estimates the labor force is growing by fewer than 10,000 workers per month, a pace without precedent in 65 years. Breakeven payrolls have collapsed toward zero, meaning May’s 172k vastly overshoots what’s needed to keep unemployment steady. Growth accelerating into a labor market this tight is the textbook dynamic that forces a central bank’s hand.
Inflation owns the headlines, but the underlying breadth is moderating. Headline CPI rose 0.5% on the month and 4.2% year over year in May, a three-year high. Energy accounted for better than 60% of the gain. Strip out the war and core rose only 0.2%, the mildest reading in months, with core goods actually falling. The Cleveland Fed median and 16% trimmed-mean CPI both eased to 0.3% m/m from 0.4% in April — the very gauges Chairman Warsh emphasized in confirmation testimony. The tariff pass-through that many braced for is not showing up at the register. So while the headline is loud, the underlying signal is still moderating.
PPI shows producer-price pressures that are real but not the spiral the headline suggests. Wholesale prices rose 1.1% on the month and 6.5% year over year, the steepest annual climb since late 2022, with goods posting their largest monthly gain on record. Diesel lifted freight and fertilizer ran up sharply. Core goods climbed above 5% as memory chips and electronics tightened on AI demand. The war piece will ease when tankers move. The technology piece reflects a building boom largely financed by private capital and rewarded by generous public valuations — the kind of price pressure that comes from real demand, not from a wage-price feedback loop. The pass-through to consumers will be limited by sluggish income growth.
Most see the Fed forced to hike by inflation. We see growth into full employment driving the next move — a hike, well out 2027 or beyond. Chairman Warsh chairs his first FOMC on June 16-17 and will hold. The growing consensus sees the next Fed move as a hike because inflation is running so far above the 2% target. We agree on the direction but for a different and more durable reason: inflation is moderating beneath the headline, while growth is accelerating into a labor market already at full employment. That dynamic, not the war-driven price spike, is what ultimately forces the Fed’s hand, as the labor market strengthens off its full employment base. The move comes well out into late 2027 or 2028. We may have to stand alone on this distinction.
Our scenario probabilities: 60 / 20 / 20. Base Case (60%): the June 14 agreement holds and Hormuz traffic normalizes under the framework, the cyclical broadening sustains, Brent settles near $80 by year-end as inventory restocking firms the floor, trimmed CPI gauges ease, the Warsh Fed holds with a tightening lean. The 10-Year holds near 4.40% with 4.70% upside on term-premium pressure. Benign (20%): faster reopening, Brent toward $70, the cyclical pickup runs even hotter. Adverse (20%): the deal unravels or a fresh incident reshuts the strait, Brent back above $110, the Fed is pinned between war-driven inflation and the cyclical rebound.
Market Snapshot
| Indicator | Level | Context |
|---|---|---|
| Brent Crude | ~$86 / bbl | Off ~25% from the March peak; the June 14 reopening agreement points lower still, with our base case near $80 by year-end as restocking firms the floor |
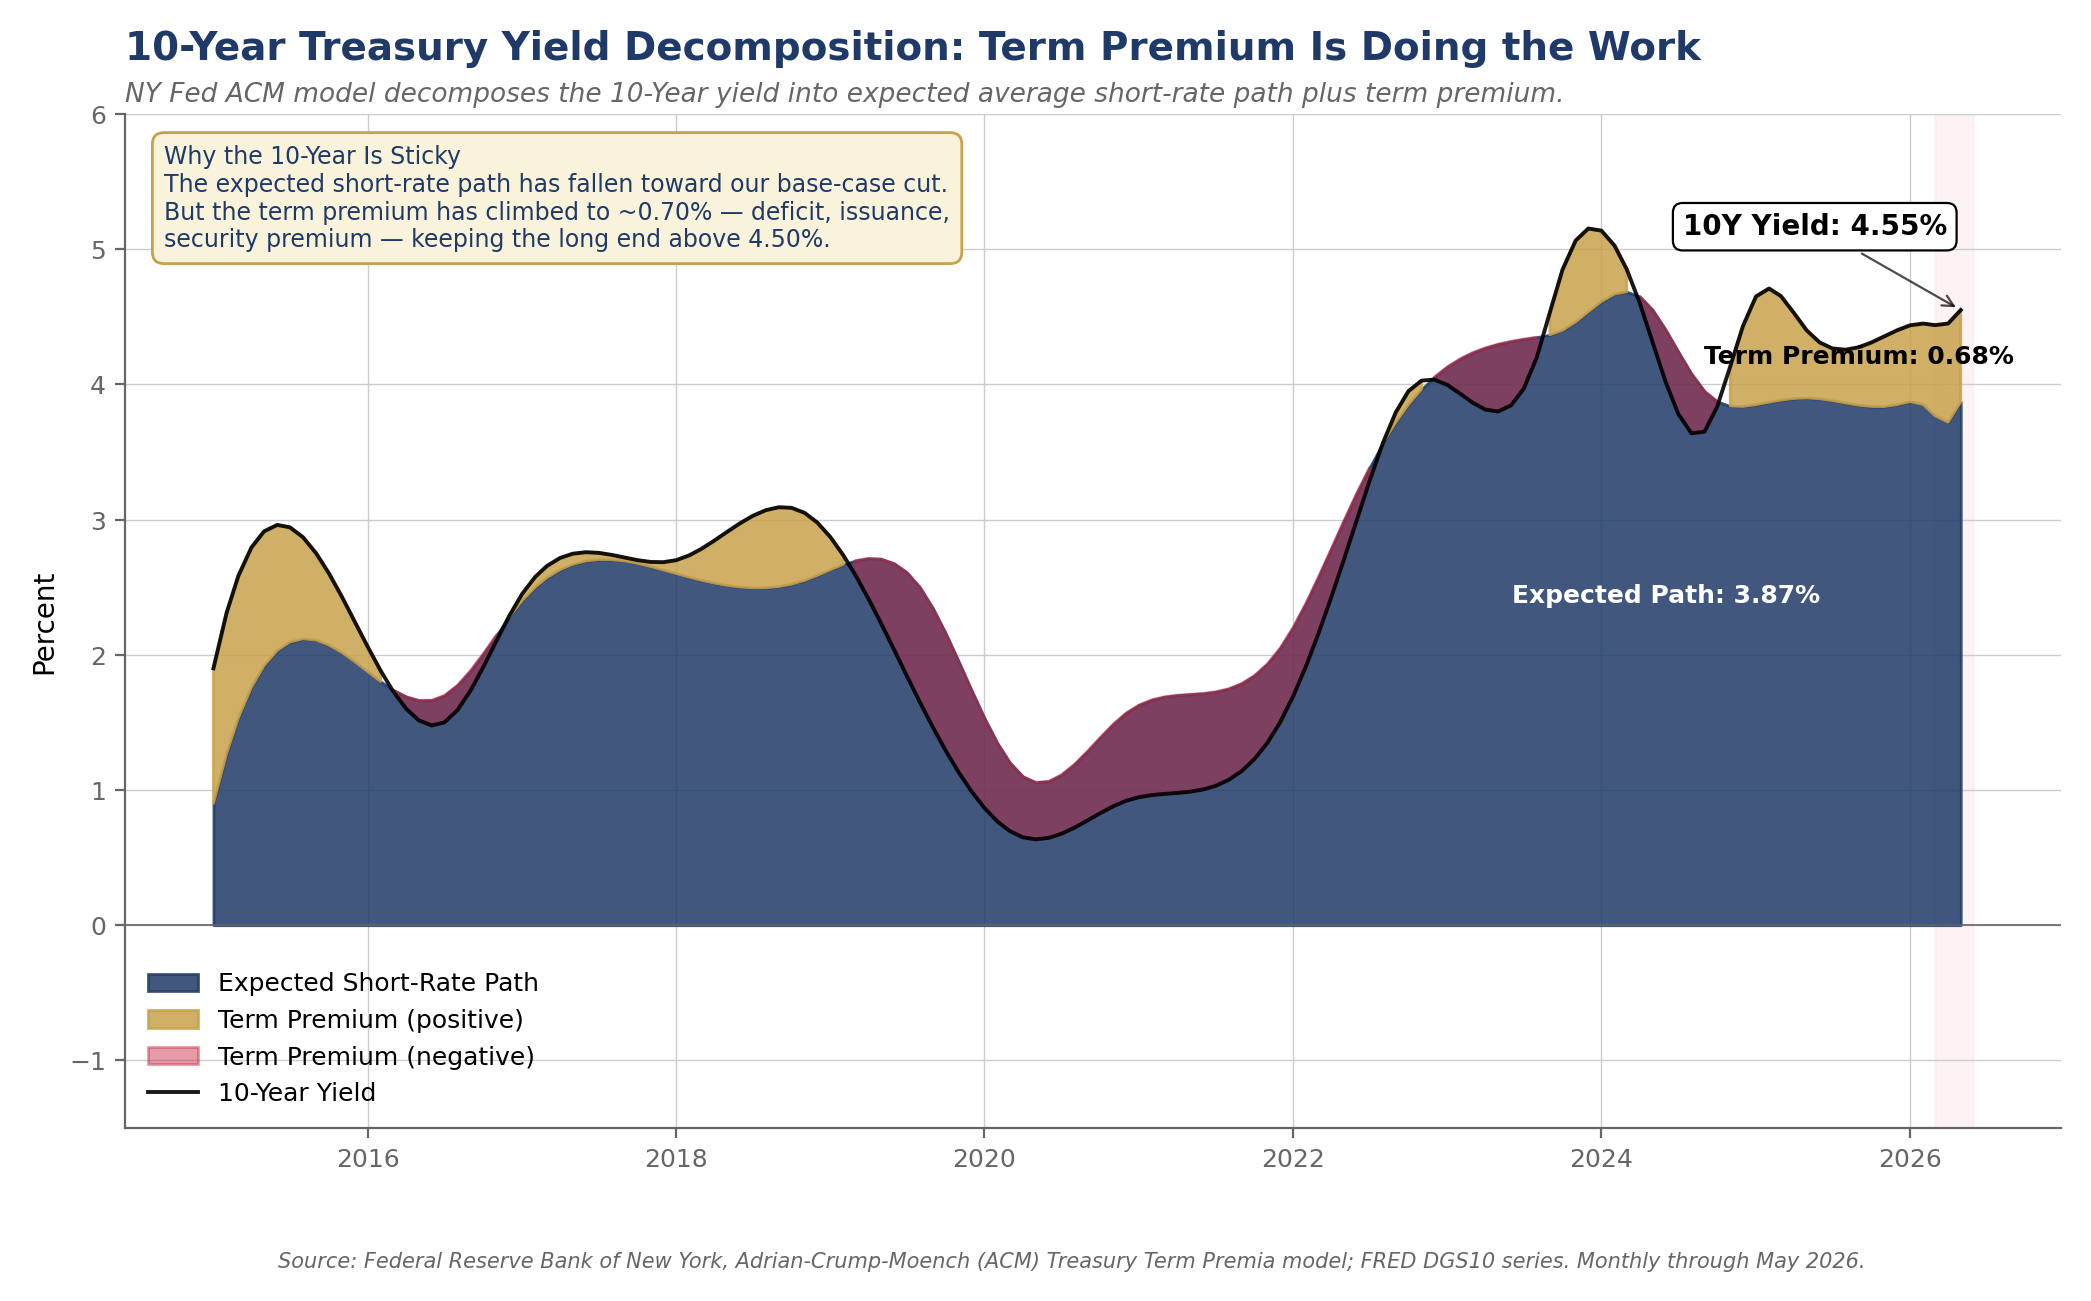
| 10-Year Treasury | ~4.55% | Sticky on deficit, heavy issuance, and a term premium near 0.70%; consensus looks for drift lower, we see less room |
| 30-Year Fixed Mortgage | ~6.55% | Holding above 6.5% on the 10-Year level and a wider MBS spread; cooler-for-longer for housing |
| Fed Funds Target | 3.50–3.75% | Hold expected June 17; the dot plot is the focus; next move a hike, well out 2027/2028 |
| ECB Deposit Rate | 2.25% | Hiked 25 bp June 11, the first major central bank to tighten into the war’s inflation; more may follow |
| PCC Full-Year U.S. GDP | 2.5% | Capital spending and resilient services consumption leading; risks roughly balanced |
| May Payrolls | +172k | Beat 80k consensus; March/April revised up 93k combined; unemployment 4.3% |
| Headline CPI (May) | 4.2% YoY | Three-year high; energy drove >60% of the gain; gasoline +40% YoY |
| Core CPI (May) | 2.9% YoY | Down from 3.1% in April; underlying trend resumed its drift lower |
| Headline PPI (May) | 6.5% YoY | Steepest annual climb since late 2022; AI hardware now a second engine alongside oil |
| EUR/USD | ~1.158 | ECB hike priced in advance; rate gap narrowed but dollar firm on safety bid |
| World Bank 2026 Global | 2.5% | Cut from 2.7% in April; the weakest since the pandemic |
| World Bank 2026 U.S. | 2.2% | Held in place; far ahead of euro area at 0.5% and Japan at 0.4% |
| Q1 S&P 500 Net Margin | 14.7% | Record since FactSet began tracking in 2009; Q2 estimated 14.1%; FY estimated 13.9% |
Sources: BLS, BEA, EIA, AAA, CME Group, Freddie Mac, ECB, Federal Reserve Board, FactSet, World Bank. As of close Friday June 12, 2026.
“The hiring rebound reflects genuine strength, while the inflation spike is essentially an imported tax. The way to deal with a supply shock is to allow supply to increase, not to raise rates and implement a slowdown the economy does not need. The capital cycle is too valuable to break to fight a price impulse monetary policy did not cause.”
— Mark P. Vitner, Chief Economist, Piedmont Crescent Capital
The Macro Backdrop: A Capital Cycle That Compounds
Three threads ran through the past month and frame the June outlook. Inflation reports owned the headlines, with the May CPI print at 4.2% the loudest single number; but the trimmed gauges actually eased. The labor market ran hotter than nearly anyone expected, with payrolls well above breakeven against a labor force that is barely growing.
The war piece of the economy is beginning to take a back seat to the cyclical piece. On June 14 the United States and Iran reached an agreement that calls for a ceasefire on all fronts, a toll-free reopening of the Strait of Hormuz, and the lifting of the U.S. naval blockade, with a signing set for June 19 in Switzerland and a sixty-day window after that to take up sanctions relief and the nuclear file. The terms are not yet public, Iran has signaled it may still levy fees despite the toll-free language, and an open strait under continued Iranian management is not a clean return to the pre-war status quo, so we treat the deal as a genuine de-escalation rather than a settled peace.
The May ISM Manufacturing print rose to a four-year high of 54.0, new orders to 56.8, with all six of the largest manufacturing industries expanding. Nondefense capital goods orders surged 24.2% in April. Unfilled orders are up twenty-one of the last twenty-two months. The manufacturing recession of 2024-2025 is over, and the cyclical rebound is broadening well beyond AI. The economy beyond the war’s price shocks is strengthening, not weakening, and the next Fed move is ultimately a function of that, not of the inflation headline.
Our 2.5% full-year U.S. real GDP forecast sits on the constructive end of the Wall Street consensus, which has clustered in a 1.8% to 2.4% range, with most majors raising their numbers through May and June. The Atlanta Fed’s GDPNow is tracking Q2 at 3.1% as of mid-June, the upside marker. The World Bank cut its 2026 global growth forecast to 2.5%, the weakest reading since the pandemic, with the euro area barely positive and Japan softer still, while holding the U.S. at 2.2%. The war is a tax on everyone. The American economy, with its outsized energy sector, its 100% bonus depreciation restored under OBBBA, deep capital markets and riding the largest single capex cycle in a generation, is simply better built to pay it, sustaining growth throughout the war and setting up the second half of 2026 for stronger growth.
The Consumer: Squeezed but Cushioned, with Rate-Sensitive Sectors Lagging
Real hourly pay slipped again in May as prices outran wages, and two-thirds of Americans now call inflation a very big problem. The personal savings rate has slipped to roughly 3.5% from 4.5% a year ago. The New York Fed’s Q1 2026 Household Debt and Credit Report showed 4.8% of outstanding balances in some stage of delinquency, with credit card delinquencies at 2.92%. These are real signs of stress, but they reflect a stretched lower-income consumer pressed against still-elevated rates and a war-driven energy bill, not the early stages of a broad downturn.
Aggregate consumer spending continues to grow. Bank of America’s internal card data through May shows discretionary spending ex-gasoline still growing roughly 3% year over year. Household equity wealth sits near records as the S&P 500 grinds higher on earnings. The K-shape we have described for two years is showing in two distinct ways: a sturdy upper-half consumer doing the heavy lifting in spending, and a set of rate-sensitive sectors — housing, light vehicles, and other consumer durables — not yet participating in the broader cyclical pickup. We read those laggards as the next leg of the recovery rather than a warning sign. They turn when the war premium fades from the curve and discretionary purchasing power recovers, which only tightens the labor market further. We expect consumer spending of about 2.1% for the full year, slower than 2025 but firmer than the global consumer.
Business Fixed Investment and Corporate Profits
The strongest single endorsement of the capital-cycle thesis comes from the firms financing it. Q1 2026 S&P 500 earnings closed with blended growth of 15.1% year over year, the sixth consecutive quarter of double digits, and the blended net profit margin set a record 14.7%, the highest reading since FactSet began tracking in 2009. Analysts project Q2 margins at 14.1% and a full-year 2026 margin of 13.9%, also a record on an annual basis.
The composition of investment underneath is the more interesting story. Hyperscalers will spend roughly $725 billion on AI infrastructure this year alone, a 69% year-over-year increase, with Morgan Stanley putting the global AI infrastructure figure closer to $740 billion. But the cycle is broadening well beyond data centers. April’s 24.2% jump in nondefense capital goods orders excluding aircraft was the broadest single-month surge outside the pandemic, with strength in machinery, electrical equipment, fabricated metals, and primary metals. The OBBBA’s restoration of 100% bonus depreciation, effective January 2026, has unleashed wait-and-see capex that had been pent up in the high-rate years. Boeing is climbing back toward full production, the defense base is replenishing depleted stocks on multiyear contracts, the Space economy is in full force, and reshoring of pharma, steel, and semiconductors is adding plant and payroll in places that had spent a generation losing both. The server drives power demand, power demand drives the grid, and the grid and the data center together drive the wellhead. What looks like a technology story is better understood as a broad re-industrialization.
Send the hosted PNG URL and I’ll wire it here.
Caption ready: “Chart 3. S&P 500 quarterly net profit margin, Q1 2009 through Q1 2026, plus FactSet estimates for Q2–Q4 2026. Q1 record at 14.7%; Q2 estimated at 14.1%; full-year estimated at 13.9%. Source: FactSet Earnings Insight.”
The Labor Market: Firm, with a World Cup Asterisk
Employers added 172,000 jobs in May, more than double the 80,000 consensus, with March and April revised up by a combined 93,000. Unemployment held at 4.3%. Average hourly earnings rose 0.3% on the month and 3.8% year over year, slightly above headline core inflation. The level of payrolls is impressive, but the breakeven dynamic underneath matters more. Fed staff research published this spring estimates that the labor force is now growing by fewer than 10,000 workers per month — a pace without precedent in 65 years — as demographics and a sharp reversal in immigration both work against supply. With breakeven payrolls near zero, a 172,000 monthly print does not just keep unemployment steady. It tightens an already-tight market. Voluntary attrition has slowed to unprecedented lows, which reduces the need to hire and likely lifts productivity. The headline 4.3% unemployment rate, by the Fed’s own measures, is below most estimates of full employment. The broader U-6 reading at 8.1% is higher than U-3 always is, but it has not moved decisively in either direction for months. By the gauges the FOMC actually weighs, we are at or beyond full employment.
Some of the May strength is borrowed. Memorial Day fell early this year, pulling hospitality hiring into May, and the World Cup is now adding to payrolls in the host metros. Business services hiring in those metros has run well ahead of the national rate as cities staff up for the tournament. We expect the boost to build through June and July before giving back in September (Labor Day comes late this year). The World Cup, the nation’s 250th anniversary alongside it, and the Los Angeles Olympics in 2028 give hospitality and travel a multi-year runway of marquee demand that few other parts of the consumer economy can claim. None of this changes the underlying read: a labor market that is gradually firming after a winter of softness, against a labor force that is no longer growing, into a cyclical broadening that is adding to demand rather than subtracting from it. That is the path we see ultimately forcing the Fed’s hand.
Inflation: Imported, Not a Spiral
May CPI rose 0.5% on the month and 4.2% year over year, the fastest annual pace in three years and the kind of headline that captures attention. The level of concern fades when the report is opened up. Energy rose nearly 4% in a single month and accounted for better than 60% of the all-items gain, with gasoline up more than 40% from a year ago on the Hormuz disruption. Strip the war out and core prices rose only 0.2%, the mildest reading in months. Core goods actually fell. Core services ex-housing held the disinflation it had through the spring. The tariff pass-through that many braced for is not showing up at the register. What is showing up is a fuel surcharge on the whole economy, and fuel surcharges are not what monetary policy is built to fight. The Fed can’t print oil or make cattle magically appear.
The producer report adds a second engine. Wholesale prices rose 1.1% on the month and 6.5% year over year, the steepest annual climb since late 2022, with goods posting their largest monthly gain on record. The breadth runs wider than oil. Diesel lifted freight, fertilizer ran up sharply and will eventually extend to the grocery aisle, but only partially and with a lag. Core goods climbed above 5% as memory chips and electronics tightened on AI demand. We expect the Fed to treat the war-related runup as close to cresting and to view the technology line as more durable. The first will ease when the tankers move again. The second is the price of a building boom we would rather have than not, largely financed by private capital and generous public valuations.
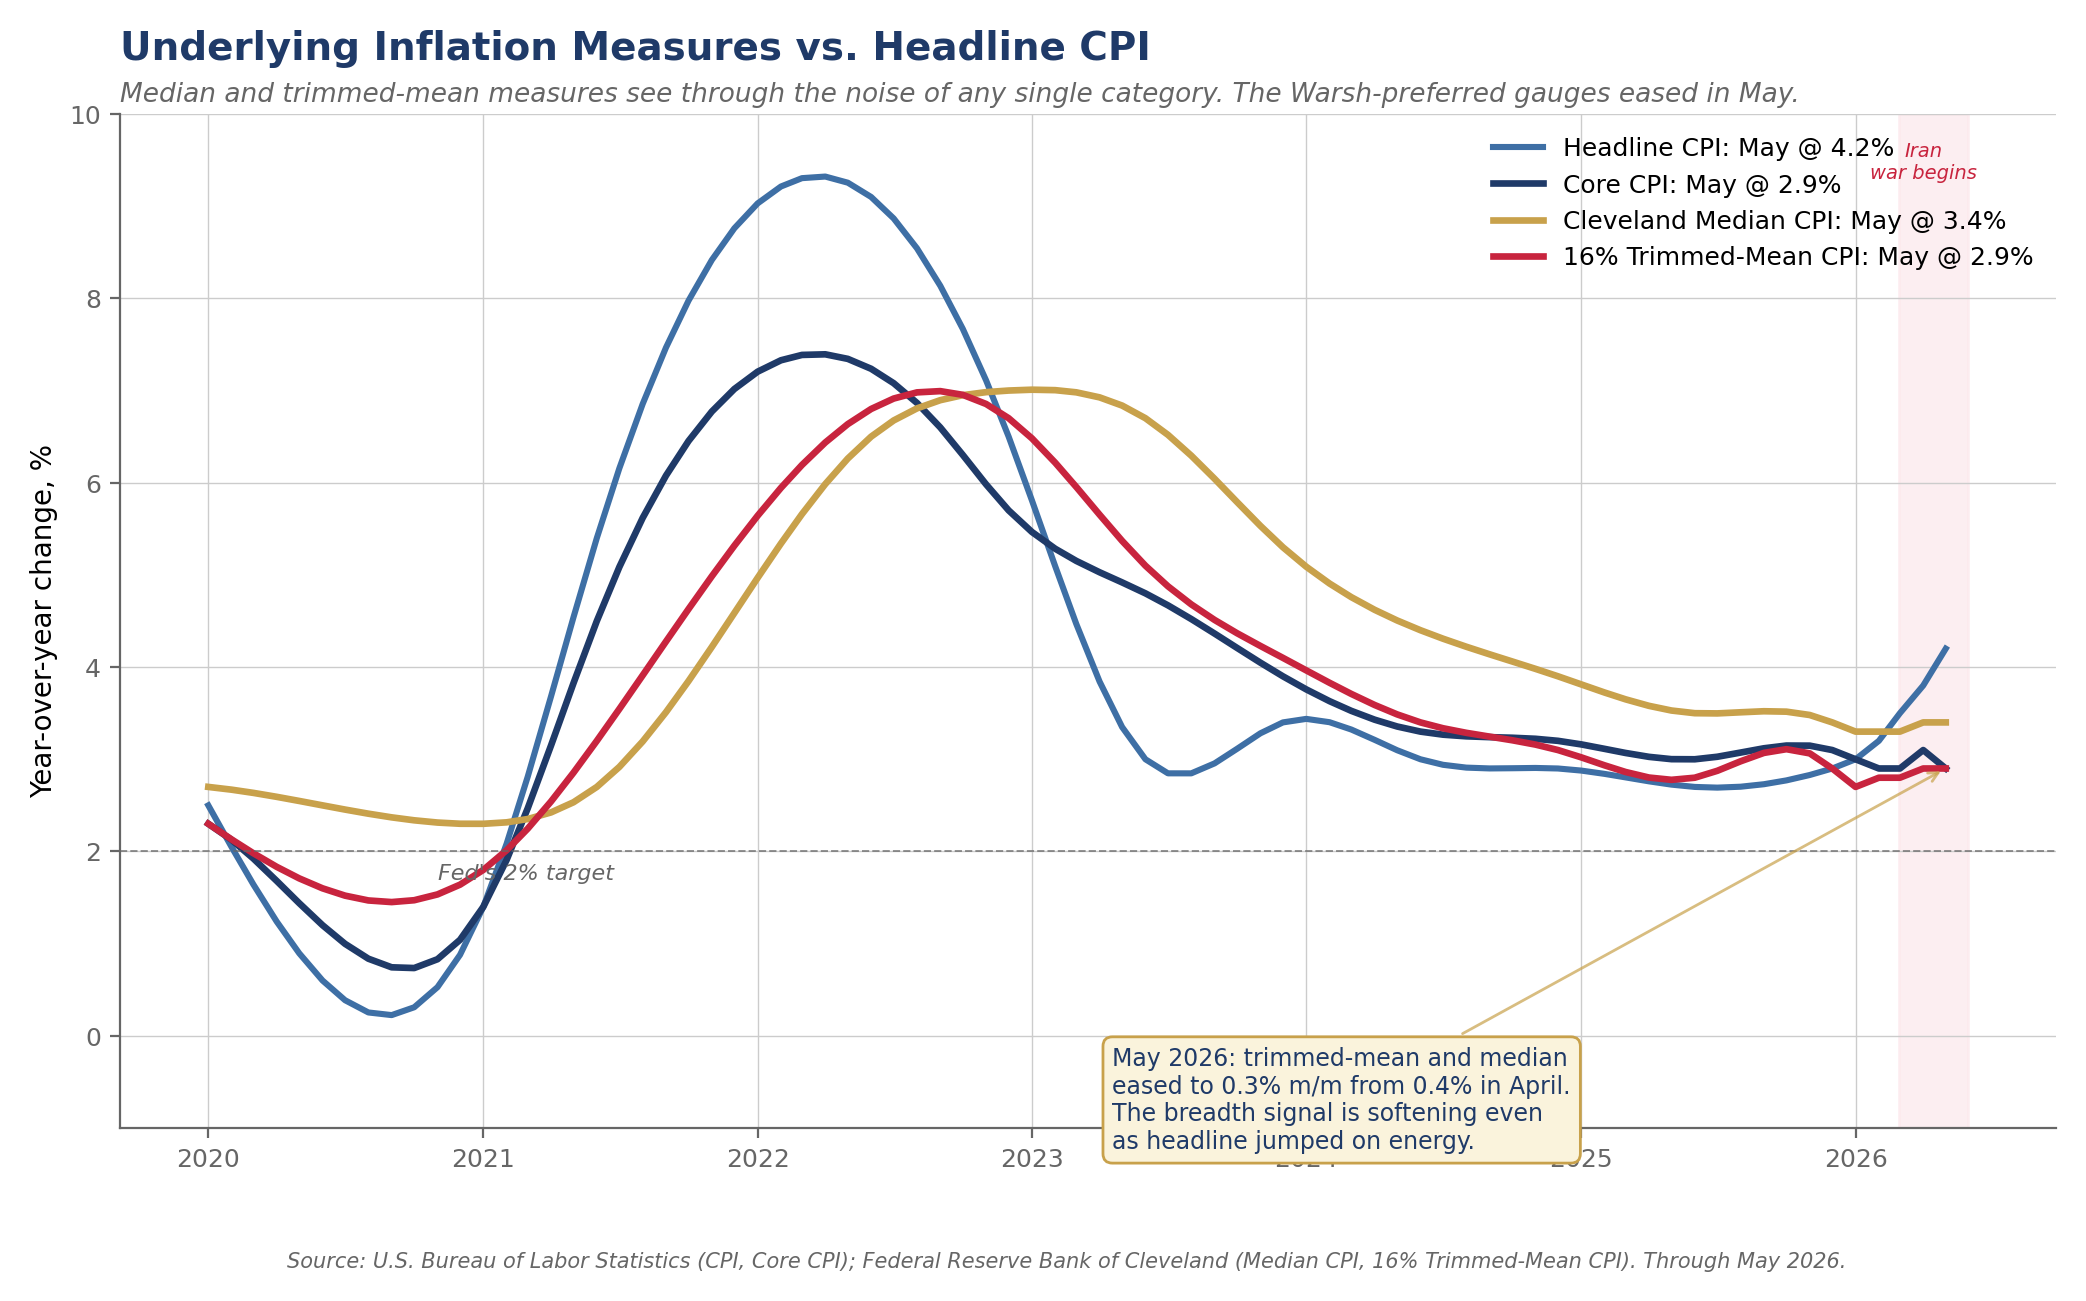
We continue to believe May represents the likely peak for top-line inflation. Lower oil takes the sting out of the headline. Underlying measures eased: Cleveland median and 16% trimmed-mean both rose 0.3% on the month, below April’s 0.4% pace, and core CPI declined to 2.9% year over year from 3.1% in April. These are the very measures Chairman Warsh emphasized in his confirmation testimony, and their softening in May is the most important single data point for the inflation outlook. The May PCE release on June 27 will be the cleanest test of whether the trimmed gauges continue to drift lower. None of this pulls the Fed toward a cut. Our case for a hold now and a hike next rests not on the inflation overshoot but on the part of the economy that has nothing to do with the strait: the cyclical rebound broadening well beyond AI, with the ISM at a four-year high, capital goods orders surging, the manufacturing recession over, and the broadest expansion of capital spending in years. A growing economy meeting a labor market already at full employment is the textbook dynamic that ultimately forces the Fed to tighten. Most observers expect a hike for the wrong reason — the inflation overshoot, which will fade as the war premium clears. We expect it from a more traditional reason — growth accelerating into full employment. Timing is the looser variable: we see the move well out into late 2027 or 2028. The war and the trimmed-mean moderation give the Fed cover to stay patient through the price spike. The broadening cyclical recovery, particularly in the labor market, deprives it the cover to ease.
Markets, Rates, and the ECB
The 10-Year at 4.55% and the Term-Premium Story
The 10-Year Treasury closed June 12 at 4.55%, holding above 4.50% on a term premium that has climbed to roughly 0.70% under the NY Fed ACM model. The 30-Year sits near 5.05%. The 2-Year traded near 4.17%. The June long-bond reopening tailed by the widest margin since late 2024, with dealers left holding more than they wanted. The prevailing view looks for the 10-Year to drift lower into year-end as the energy spike fades. We are only partially in that camp. The bond market’s elevated term premium reflects exactly the dynamic we see in the data: a deficit that is not going down, a heavy issuance calendar that is not going away, and a cyclical rebound that is making investors demand more compensation for holding duration when the Fed’s next move is more likely up than down. We see the 10-Year holding near 4.40% in the base case with a 4.70% upside, and an adverse path higher than that if the June 14 agreement unravels.
The mortgage market is amplifying the move. The 30-year fixed sits near 6.55%, with the MBS spread at its widest since December and offsetting the spread tightening that followed the early-2026 GSE retained-portfolio directive. Housing stays cooler-for-longer, but mortgage spreads should tighten pulling mortgage rates down to 6.30%, slightly below their long-run norm. For corporate borrowers, the fixed-rate issuance window is open but no longer improving. Floating-rate borrowers should stress coverage on a 10-Year at or above 4.50% and a policy rate unchanged through at least the November midterms.
Equities: Earnings-Led, Not Yet at a Peak
This year’s gains have tracked earnings revisions rather than expanding multiples, a healthier footing than a melt-up on hope. The S&P 500 sits near record highs and will likely rally if the war is truly over. The features that mark past market tops — speculative mania, deteriorating growth, a flood of new issuance, a tightening Fed — are mostly absent today, even if a little closer than at the start of the year. The better gauges of speculative trading sit well below their 2000 and 2021 extremes. SpaceX completed its long-anticipated IPO last week to strong demand. The broad index has further to run on profits rather than euphoria, with a path consistent with the S&P near 8,000 by year-end on earnings. What we watch is not the level but the breadth. The leadership is narrow, the volatility is real, and a market this concentrated in one theme can correct hard without the economy doing anything wrong.
The ECB Joins the Hawks: Implications for the Dollar
Send the hosted PNG URL and I’ll wire it here.
Caption ready: “Chart 5. ECB deposit rate vs. Fed funds target rate, with EUR/USD on the right scale. The ECB lifted its deposit rate to 2.25% on June 11; the Fed is expected to hold June 17 with a tightening lean. The rate gap has narrowed but the dollar remains firm on the safety bid and the diverging cyclical paths. Source: ECB, Federal Reserve Board, Bloomberg.”
The European Central Bank lifted its deposit rate by 25 basis points to 2.25% on June 11, the first major central bank to tighten into the war’s inflation. Eurozone headline CPI accelerated to 3.2% in May from 1.9% in February, with core at 2.5%, and the ECB revised its 2026 headline inflation forecast up to around 3.0% from 2.6% in March. Lagarde left the door open for additional moves. The Bank of Japan is widely expected to follow in July or September. EUR/USD slipped after the decision, with the dollar trading near 99 on the DXY, because the rate gap with the U.S. has not narrowed by as much as the ECB action alone implies — the Friday labor beat pushed CME odds of a Fed hike back toward 40%, and the June 14 agreement, with signing set for June 19, left a residual safety bid in the dollar. We see EUR/USD in a 1.13 to 1.20 range through year-end, with the lower end most consistent with our base case in which the Fed holds while the broadening U.S. cycle keeps the dollar firm. For U.S. multinationals, the FX tailwind that lifted Q1 reported earnings will fade only modestly from here. For European exporters, a firmer euro raises the bar on profitability. A central bank that stands pat while its peers tighten is, at the margin, importing a softer currency and a little more inflation — a backdrop that supports our view that the eventual Fed move is more likely up than down.
CFO & Treasurer Corner: What This Means for Corporate Finance
Funding and Liquidity. With the 10-Year near 4.55% and the cyclical rebound pushing in the direction of eventual Fed tightening, the case for opportunistic fixed-rate issuance is strong. Lock fixed-rate funding where the tradeoff allows and pull forward 2027 maturities. Floating-rate borrowers should stress coverage on a policy rate unchanged through at least the November midterms, with hike risk live in the 2027 horizon.
Energy and Input Costs. Crude has broken to three-month lows on the June 14 agreement to reopen Hormuz and lift the U.S. blockade, but the relief builds gradually. The physical reopening looks like late summer rather than the timeline implied by the June 19 signing, Iran has signaled it may still levy transit fees despite the toll-free language, and a security premium is likely to keep a floor under oil even after it clears. Our base case carries Brent near $80 by year-end, with inventory restocking firming the floor so the deal-holds path does not drift well below it even as near-term reopening optimism softens prices. Firms exposed to freight, logistics, or petrochemical inputs should plan for energy costs that ease through Q3 rather than collapse.
Capital Allocation. The capital-cycle thesis holds and is broadening. ISM new orders, capital goods orders, and unfilled-order backlogs all confirm an investment cycle that extends well beyond data centers. Commitments tied to AI, power, grid, defense, and reshoring remain on plan. Q1 corporate net profit margins set a 14.7% record. With the broadening accelerating into a tight labor market, the bar on productivity-led capex is rising, not falling. Discipline on hurdle rates protects against the late-cycle temptation to chase capacity that may not pay back if and when the Fed eventually leans against it.
FX and International Exposure. The ECB has joined the hawks. EUR/USD slipped after the June 11 hike on the still-wider U.S. rate gap, and the dollar sits near a year-to-date high on the DXY. With our base case carrying a Fed that holds and ultimately tightens against an ECB and BoJ already tightening, the dollar’s footing remains firmer than the consensus expects. The Q1 FX tailwind to U.S. multinational earnings will fade only modestly. European exporters face a firmer euro on the margin. Treasurers with multi-currency hedge programs should reassess as the Bank of Japan moves toward its own tightening this summer.
Labor and Wages. Discount the next two payroll and retail reports for the World Cup, hot in summer and soft in the fall. The deeper reality is that the labor force has stopped growing while the cyclical rebound is broadening. Plan for tight conditions in skilled labor to persist and to spread to the categories you have been able to staff up cheaply. The K-shaped labor market is bending the way of workers in scarce categories, and wage pressure in those slots will not ease as cleanly as the headline aggregates suggest.
Planning Assumption. Our base case is a prolonged Fed hold giving way to a hike well out into late 2027 or 2028, the June 14 agreement reopening Hormuz by late summer, Brent settling near $80 into year-end as inventory restocking firms the floor, and full-year U.S. growth near 2.5% led by a cyclical broadening that extends well beyond AI. With downside probability at 20%, boards should keep a deal-collapse case, with oil back toward triple digits and a hike on the table much sooner, live for Q3.
Looking Ahead
| Day | Release / Event | Why It Matters |
|---|---|---|
| Mon Jun 15 | Empire State (June); G7 Summit agenda | First read on whether the manufacturing turn extends into June. Iran tops the G7 agenda after the June 14 agreement, with formal signing in Switzerland set for June 19; that signing is the confirmation marker for the oil-down, risk-on read. |
| Tue Jun 16 | Retail Sales (May); FOMC begins | Energy will distort the headline. Watch the control group ex-autos-gas-building-materials for the clean read on the consumer. |
| Wed Jun 17 | FOMC decision; Industrial Production (May); Housing Starts (May) | A hold is near-certain. The story is the dot plot and whether the language leans toward a hike given the cyclical broadening. IP is the cleanest read on the manufacturing turn. |
| Thu Jun 18 | Philly Fed; Initial Claims; LEI | Second regional manufacturing read after Empire State. Claims test whether the recent uptick is seasonal noise or a trend. |
| Fri Jun 19 | Existing Home Sales (May); Flash PMIs; U.S.–Iran signing (Switzerland) | Higher mortgage rates and weaker buyer traffic should weigh on sales. Flash PMIs are the first June read on capital-cycle momentum. The Switzerland signing formalizes the June 14 agreement and starts the sixty-day clock on sanctions and the nuclear file. |
| Fri Jun 27 | PCE Deflator (May); Dallas Trimmed-Mean PCE | The cleanest test of whether the CPI breadth softening in May carries into the Fed’s preferred index. The Dallas trimmed-mean reading is the focus. |
Scenario Framework
| Scenario | Macro and Market Implications | Corporate Finance Action |
|---|---|---|
| Base Case (60%) | The cyclical rebound broadens further. The June 14 agreement holds and Hormuz traffic normalizes under the framework; Gulf exports rebuild through late summer; Brent settles near $80 by year-end, with inventory restocking firming the floor so the deal-holds path does not drift well below it, and near-term softness on reopening optimism is likely. The trimmed CPI gauges continue to drift lower. The labor force keeps shrinking while payrolls run above breakeven, and rate-sensitive sectors begin participating as the war premium fades. The Warsh Fed holds in June with a tightening lean; the next move is a hike, well out into late 2027 or 2028. The 10-Year holds near 4.40% with a 4.70% upside on term-premium pressure. ECB delivers one more hike; EUR/USD in a 1.13–1.20 range. | Lock fixed-rate funding opportunistically. Stay with productivity-led capex but tighten hurdle rates. Model a Fed hold through 2026 and a hike risk live in 2027. Treat equity concentration as a conditions risk. Reassess multi-currency hedges as the Fed-ECB-BoJ paths diverge. |
| Benign (20%) | Faster reopening; Brent eases toward $70. The cyclical pickup runs hotter as energy costs ease and discretionary spending recovers. Labor force participation ticks higher. The Fed gets cover to stay on hold longer; the case for a hike still builds but is pushed further out. EUR/USD pushes toward 1.20 on softer dollar. | Step up productivity-led capex against an extended Fed hold. Open the refinancing window now. Lean into an energy-sensitive demand recovery. Add U.S. multinational exposure on softer dollar. |
| Adverse (20%) | The agreement unravels or a fresh incident, of the kind the June 14 Beirut flare-up showed is still live, reshuts the strait into the autumn. Brent averages above $110, and a closure dragging through 2027 points toward $140. Headline CPI re-accelerates and the trimmed gauges follow. The Fed is pinned between war-driven inflation and the cyclical rebound, with a hike back on the table much sooner than our base case. Narrow equity leadership unwinds. | Stress-test floating-rate exposure and covenant headroom. Build liquidity. Defer non-essential capex. Hedge energy and freight aggressively. Reassess working-capital cycles. |
Forecast Update
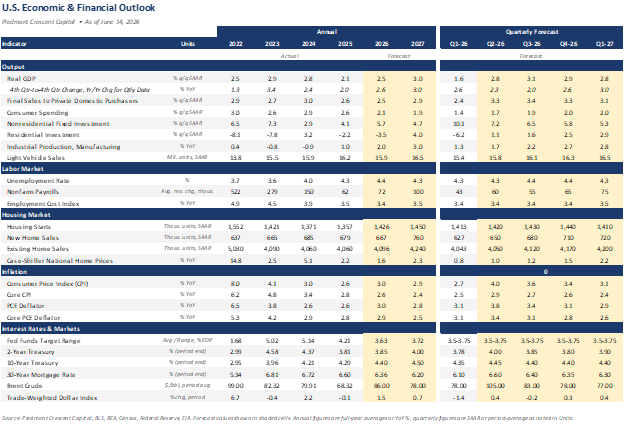
Piedmont Crescent Capital | As of June 12, 2026
Strategic Takeaway
Inflation reports own the headlines, and most observers see the Fed forced to hike because prices are running so far above target. We see something different. Beneath the war-driven headline, the trimmed-mean and Cleveland median gauges Warsh emphasized actually eased in May. The story that matters more is the one barely visible in the financial press: a cyclical rebound that has finally broadened well beyond AI. The ISM Manufacturing index rose to a four-year high in May, with all six of the largest manufacturing industries expanding. Nondefense capital goods orders surged 24.2% in April. Q1 corporate margins set a 14.7% record. The manufacturing recession is over, the labor force is barely growing while payrolls run above breakeven, and rate-sensitive sectors are positioned to be the next leg of the recovery rather than its warning.
We carry a 2.5% full-year U.S. growth call, well ahead of the World Bank’s 2.2%, and we see the next Fed move as a hike — well out into late 2027 or 2028 — not because the inflation overshoot forces it, but because growth accelerating into a labor market already at full employment ultimately does. Most observers expect a hike for the wrong reason. We expect it for the right one. We may have to stand alone on this distinction. For CFOs, four priorities: lock fixed-rate funding while the issuance window is open; continue committing to productivity-led capex with tighter hurdle rates; reassess FX exposure as the Fed-ECB-BoJ paths diverge; and build the deal-collapse downside, oil back toward triple digits and a hike on the table much sooner, into Q3 board discussions.
Mark P. Vitner, Chief Economist, Piedmont Crescent Capital | June 18, 2026
Questions? Email: CompassReport@cavusecurities.com
For informational purposes only. Not investment advice.
This publication has been prepared for informational purposes only and is not intended as a recommendation, offer, or solicitation with respect to the purchase or sale of any security or other financial product nor does it constitute investment advice. Any forward-looking statements or forecasts are not guaranteed and are subject to change at any time. Information from external sources has not been verified but is generally considered reliable.
© 2026 CAVU Securities, LLC / Piedmont Crescent Capital.