
July Employment Report: Out of Season
July Employment Report: Out of Season
A weak July headline rests on two seasonally distorted categories. Manufacturing is hiring again, and the slide in labor force participation is mostly a retirement story.
Early Signal
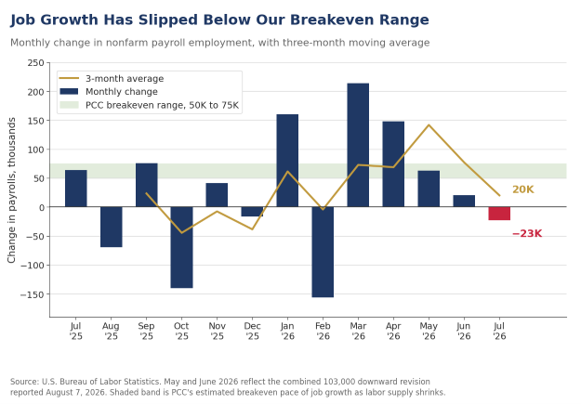
- Nonfarm payrolls fell 23,000 in July, the first outright decline since February, against a consensus call of 83,000. May was revised down 66,000 to 63,000 and June down 37,000 to 20,000, leaving job growth at an average of 20,000 a month over the past three months and 34,000 over the prior twelve.
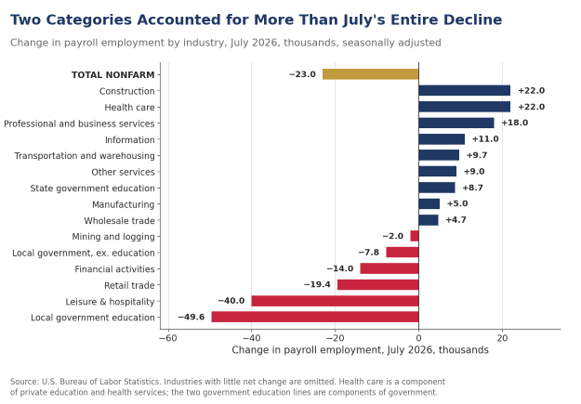
- Local government education and leisure & hospitality subtracted a combined 89,600 jobs, more than the entire decline in overall payrolls. The school calendar and the World Cup appear to explain both. Setting the two aside, payrolls rose roughly 67,000.
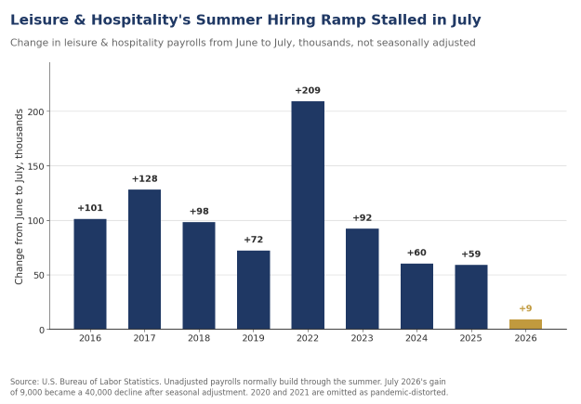
- Leisure & hospitality has now fallen in back-to-back months, by 43,000 in June and 40,000 in July. Before seasonal adjustment, however, the industry still added 9,000 jobs in July, against gains of 59,000 last July and 60,000 the year before.
- The entire midsummer shortfall sits in arts, entertainment & recreation, where unadjusted payrolls added 4,900 jobs against 56,200 last July, while accommodation and food services staffed a normal summer. The World Cup ran from June 11 through July 19, and much of the staffing around it appears to have been hired ahead of the tournament.
- Local government education fell 49,600, its largest seasonally adjusted July decline in at least a decade. Unadjusted, school districts shed 1,037,700 workers as the school year ended, the largest July exit since 2019 and more than the 969,000 average of the past five years. Measured against the same month last year, unadjusted school employment was down just 28,500.
- Manufacturing payrolls rose 5,000 and are up 31,000 since December, after falling 56,000 over the second half of last year. Durable goods added 18,000 jobs, led by transportation equipment (+11,900), reflecting motor vehicles and parts (+7,900) with the balance in aerospace and other transportation equipment, and construction added 22,000, nearly all of it nonresidential.
- The unemployment rate fell to 4.1%, its lowest reading since June of last year, but the labor force shrank another 264,000 and the participation rate slipped to 61.4%, the lowest since February 2021. The labor force is 1.3 million smaller than a year ago even though the adult population is 1.5 million larger.
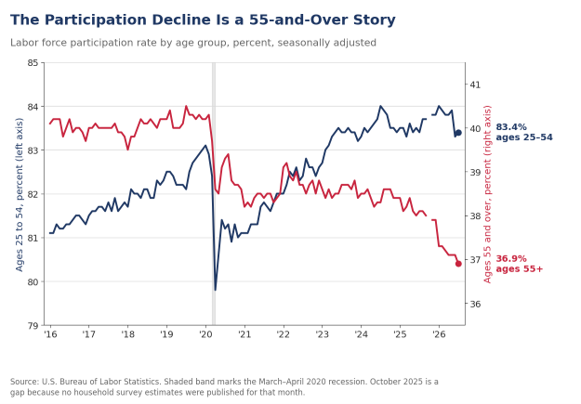
- The labor force participation decline is concentrated among older workers. The 55-and-over rate fell to 36.9%, the lowest since March 2005, while prime-age participation rose to 83.4%, matching its year-ago reading. Average hourly earnings rose 2 cents and are up 3.2% over the past year, down from 3.5% in June.
A Headline Made in Two Categories
July’s employment report was the weakest of the year, but its composition is far less troubling than the headline. Nonfarm payrolls fell 23,000, the first decline since February and well short of the 83,000 gain the consensus expected. Private payrolls rose 30,000 while government fell 53,000. The revisions did more damage to the trend than the July figure itself, with May marked down 66,000 to 63,000 and June marked down 37,000 to 20,000. Job growth has now averaged 20,000 a month over the three months ending in July and 34,000 a month over the prior twelve, against a three-month pace of 111,000 as the data stood a month ago. Revisions have run in one direction for most of the past year, and we expect that pattern to matter more than any single month’s print. We will get a preview of the annual revisions later this month, when first quarter QCEW data are released on August 28.
Two categories account for more than the entire decline. Local government education fell 49,600 and leisure & hospitality fell 40,000, a combined 89,600 against an overall drop of 23,000. Retail trade lost 19,400 jobs, with warehouse clubs, supercenters and other general merchandise retailers down 20,600 and gasoline stations down 4,600, partly offset by a 9,500 gain at sporting goods, hobby, book and miscellaneous retailers. Financial activities fell 14,000 and is now down 121,000 from its May 2025 peak. On the other side of the ledger, construction added 22,000 jobs, health care 22,000, professional and business services 18,000, information 11,000 and transportation and warehousing 9,700.
Hiring breadth held up better than the headline suggests. The one-month diffusion index for private industries slipped to 51.8 from 53.2 in June, but the three-month measure rose to 55.0 from 51.6, and both stand well above the 45.8 reading of a year ago. More industries are adding workers than cutting them, and more of them are doing so consistently. The factory diffusion index slipped to 50.0 from 56.9, which we read as noise around a turn, since the three-month factory measure held at 50.7.
Health care’s contribution keeps shrinking, and that matters more for the trend than either seasonal quirk. The industry added 22,000 jobs in July against an average of 36,000 a month over the prior twelve, with ambulatory care services accounting for 18,100 of the gain and hospitals essentially flat. Health care has added 391,900 jobs over the twelve months through July, more than the 316,000 the economy added in total over the same span, which means every other industry in aggregate has shed workers over the year. A slower pace in health care pulls down the economy’s whole run rate even when the cyclical industries are improving.
The Cup Empties Out, and So Do the Schools
Leisure & hospitality has declined in back-to-back months, by 43,000 in June and 40,000 in July, and the two-month drop matches the industry’s entire gain over the past twelve months. Leisure & hospitality employs roughly one worker in ten, and a decline of that size would ordinarily be a warning. Before seasonal adjustment, the industry added 9,000 jobs in July, against gains of 59,000 last July, 60,000 in July 2024 and 92,000 in July 2023. Payrolls kept climbing, well short of the pace the seasonal factors expect in the middle of the summer, and the factors turned a shortfall of roughly 50,000 hires into a 40,000-job decline.
The entire shortfall sits in arts, entertainment & recreation. That group added 4,900 jobs on an unadjusted basis in July against 56,200 last July and 59,400 the year before. Within it, amusement, gambling and recreation added 23,400 against a four-year average of 57,800, and performing arts and spectator sports lost 21,500 against a four-year average decline of 2,800. Accommodation added 39,100 unadjusted jobs, almost exactly its 40,100 gain a year ago, and food services and drinking places shed 34,900, in line with declines of 37,100 and 36,900 in the prior two Julys. Hotels and restaurants staffed a normal summer. Stadiums, arenas and the venues around them did not.
The World Cup appears to be the largest single cause, though it is likely not the only one. The tournament ran from June 11 through the final at MetLife Stadium on July 19, and the establishment survey counts the pay period including the twelfth of the month. Venues, concessionaires, security firms and the hospitality businesses around the eleven American host cities staffed up before the opening match, which put those hires into the May and June counts, and there was little left to add by July even with the tournament still underway. What reads as a July decline is more likely the unwinding of hiring that came early. The calendar is working the same way at the other end of the summer, with Labor Day falling on September 7, the latest date it can fall, which will keep summer staff on payrolls into the September survey week. The seasonal factors were also re-estimated with this release, and the revised factors raised the bar in June as well, when leisure & hospitality added 388,000 unadjusted jobs, more than the 378,000 it added a year earlier, and still printed a seasonally adjusted decline of the same size.
Local government education produced the report’s largest single decline, and it is the same kind of artifact. Public school payrolls fell 49,600 on a seasonally adjusted basis, the largest July decline in the series in at least a decade and a sharp break from gains of 4,600 last July and 34,200 in July 2024. Unadjusted, districts shed 1,037,700 workers between June and July as the school year ended, the largest July exit since 2019 and more than the 969,000 average of the past five years, and June’s unadjusted decline of 379,000 was the largest since at least 2018. The seasonal factors are estimated off the recent norm, so a summer exit that ran larger than that norm in both months came out the other side as a seasonally adjusted decline. It was still well short of the 1.14 million July exit that was routine from 2016 through 2019, which suggests school staffing calendars are drifting back toward their pre-pandemic shape. Measured against the same month a year ago, unadjusted local government education employment was down just 28,500, and we would not read a staffing retrenchment into that.
The Factory Sector Is Hiring
Manufacturing payrolls rose 5,000 in July and have added 31,000 jobs since December, after shedding 56,000 over the second half of last year. The gains are landing where the cycle says they should. Durable goods added 18,000 jobs, led by transportation equipment (+11,900), within which motor vehicles and parts added 7,900, and by computer and electronic products (+2,900), machinery (+2,600) and fabricated metal products (+2,500). Nondurables lost 13,000 jobs, with food processing down 6,200. Factory hiring is running ahead of what a still-soft nondurable side would suggest, and it is the durable, capital-goods end that is doing the work.
The sequence we described in Monday’s ISM report is playing out on schedule. Orders improve, order backlogs lengthen, hours worked increase and hiring follows. New orders turned up in January, backlogs lengthened decisively in July, the production-worker factory workweek stretched from 41.1 hours in December to 41.7 hours in July, and the ISM’s own employment index crossed 50 in July for the first time in 33 months. The all-employee manufacturing workweek held at 40.4 hours and overtime edged down a tenth to 3.1 hours, so July’s gain came through headcount, which is the last step in that sequence.
Construction added 22,000 jobs, nearly all of it in nonresidential work. Nonresidential specialty trade contractors added 15,400 and nonresidential building construction 4,200. Residential building construction slipped 500 and residential specialty trades added 2,600. Data centers, power projects and manufacturing plants are driving construction payrolls while housing treads water, the same split we described in the summer construction forecast. Manufacturing and construction together added 27,000 jobs in July, against a 23,000 decline for the economy as a whole.
A Smaller Labor Force, Mostly by Birthday
The unemployment rate fell a tenth to 4.1%, its lowest reading since June of last year, and once again it fell for unflattering reasons. Household employment declined 87,000 and the labor force contracted 264,000. The number of unemployed fell 178,000 and the number of people not in the labor force rose 381,000. The participation rate slipped to 61.4%, the lowest since February 2021 and, outside the pandemic months, the lowest since early 1976. The labor force is 1.3 million smaller than it was a year ago even though the civilian noninstitutional population is 1.5 million larger. The jobless rate has held between 4.1% and 4.5% for the past year, with hiring and layoffs both running weak.
Initial claims were 199,000 in the week ended August 1 and continuing claims 1.80 million a week earlier, so layoffs remain scarce. The long-term unemployed fell 166,000 to 1.8 million and now account for 25.5% of the jobless, down from 27.3% in June, reversing the deterioration we flagged last month. The number of people on temporary layoff rose 153,000 to 921,000 while permanent job losers were little changed at 1.7 million, a mix that fits a month dominated by seasonal separations. These data support our cyclical acceleration thesis.
Prime-age participation went the other way. Participation among 25-to-54-year-olds rose a tenth to 83.4% in July, matching its year-ago reading and standing about half a point above the 82.9% recorded in February 2020. Prime-age men held at 89.2% and prime-age women rose to 77.8%, within six-tenths of the record 78.4% set in August 2024. The 25-to-34 cohort, whose 1.6 percentage point drop in June we flagged as the number to watch, recovered 0.7 point to 83.1%. That is not a full rebound and leaves the cohort nine-tenths below its May level, but it does argue that June’s move was largely a measurement problem.
The decline is almost entirely a story about workers 55 and over. Their participation rate fell to 36.9% in July from 37.1% in June and 38.1% a year ago, the lowest since March 2005 and 3.3 percentage points below the 40.2% average of 2019. For those 65 and over, participation is 18.5% unadjusted against 19.0% a year ago. This is where Peak 65 appears in the data, though most of the falloff is likely among the first half of the Baby Boomers, now well into their seventies. The retiree tide is still rising. The Alliance for Lifetime Income counts more than 4.1 million Americans reaching 65 each year from 2024 through 2027, over 11,200 a day, exceeding any prior retirement wave. The 55-and-over population has grown by 633,000 in the six months since January alone. A cohort with a participation rate near 37% continues taking a larger share of the adult population from cohorts whose rates exceed 83%, so the aggregate rate falls even if no one changes their mind about working.
Two qualifications. The January 2026 population controls raised the estimated 55-and-over population by 1.25 million and lowered the 25-to-54 population by 1.48 million, largely on revised immigration assumptions, so year-over-year comparisons of labor force levels overstate how many people actually withdrew. The St. Louis Fed attributed 0.35 percentage point of the 0.82 percentage point participation decline between December and June to that revision alone. Aging also does not explain all of the rest. The Atlanta Fed attributes 57% of the 2.9 percentage point decline in older-worker participation since the eve of the pandemic to retirement behavior the pandemic changed and 43% to demographics, with the behavioral share alone worth roughly 1.7 million missing workers.
A shrinking labor force lowers the bar for what counts as adequate job growth. The Federal Reserve Board’s staff put breakeven payroll growth for 2026 at under 10,000 a month, the Dallas Fed puts it near zero and the St. Louis Fed’s range runs from 15,000 to 87,000 depending on the immigration assumption. Our own working range has been 50,000 to 75,000, and we have been skeptical that breakeven has fallen as far as the Fed banks suggest. The past year is harder to square with our range than with theirs, however. Payrolls grew an average of 34,000 a month over the twelve months through June and the unemployment rate still fell two-tenths of a point over the year through July, which is difficult to produce if the economy needs 50,000 a month simply to hold the rate steady. We are inclined to mark our own estimate lower. BLS’s own long-run projections, for their part, have the participation rate falling to 61.1% by 2034 and the 55-and-over rate to 36.9%, and the 55-and-over rate printed 36.9% in July.
Wages, Hours and the Fed
Wage growth cooled more than the payroll figures did. Average hourly earnings rose 2 cents to $37.62, a gain of less than 0.1%, and are up 3.2% over the past year, down from 3.5% in June and below the 3.5% the consensus expected. Earnings for production and nonsupervisory workers rose 4 cents to $32.40. The average workweek held at 34.3 hours for a fourth consecutive month, so aggregate hours were roughly flat. Core PCE inflation ran at 3.3% in June and core CPI at 2.6%, which puts pay slightly behind the broader price measure and slightly ahead of the narrower one, and leaves little argument that the labor market is generating cost pressure.
The report landed in a market that had been debating a rate hike, not a cut. The FOMC voted 9 to 3 last week to leave rates unchanged, with all three dissents favoring a quarter-point increase, and several officials have argued for a move higher as soon as September if inflation does not cool. Futures pricing after the release cut the odds of a September hike to 44%, with October at 58%, while equity futures rallied and Treasury yields fell.
Our Call · Wait for the Benchmark Before Rewriting the Trend
Bond yields fell and equity futures rallied within minutes of the release. We would not extrapolate this. Strip out local government education and leisure & hospitality, both of which were shaped more by the school calendar and the World Cup than by the demand for workers, and payrolls rose roughly 67,000 in July, close to where the underlying trend has run all year. Manufacturing and nonresidential construction are both hiring, and the three-month diffusion index rose to 55.0 from 51.6. Even with the headline this soft, however, the binding constraint on this labor market is on the supply side, where Peak 65 and a sharp slowdown in immigration are both subtracting from labor supply, and monetary policy has little to offer against either. We continue to look for no cut in 2026 and still believe the next move is more likely to be a hike than a cut, arriving in the first half of 2027. The August report, due September 4, will be noisy in the other direction as the late Labor Day holds summer staff on payrolls through the survey week. The date that matters more is August 28, when BLS publishes the preliminary benchmark revision to the past year’s payroll estimates, and we would want to see that revision before changing our forecast for the second half.
Mark P. Vitner – Chief Economist, Piedmont Crescent Capital
mark.vitner@piedmontcrescentcapital.com · (704) 458-4000
Disclaimer: This report is provided for informational purposes only and does not constitute investment, legal, tax, or accounting advice, nor an offer or solicitation to buy or sell any security. Information is drawn from sources believed to be reliable, including the U.S. Bureau of Labor Statistics, the U.S. Department of Labor, the Board of Governors of the Federal Reserve System and the Federal Reserve Banks of Atlanta, Dallas and St. Louis, but its accuracy and completeness are not guaranteed. Views expressed are those of the author as of the date of publication and are subject to change without notice. Past performance is not indicative of future results.

Israel's Economy: Growth, Tech, and the Haredi Labor Shortfall
Israel’s Economy: Growth, Tech, and the Haredi Labor Shortfall
A young, tech-led economy has re-rated as the war wound down. The question with the longest bearing on its growth, whether the ultra-Orthodox go to work, is only half settled, and the October 27 election decides the rest.
The Call
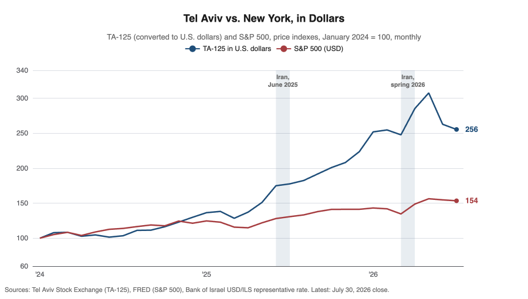
Israeli assets have re-rated sharply as the war wound down. The TA-35 returned roughly 73 percent to a dollar-based investor in 2025, and January’s sovereign issue priced at 102 basis points over comparable Treasuries against 154 on the 2024 deal. We expect Israel to outgrow both the United States and Europe over the balance of the decade, and we lean toward the Bank of Israel’s forecast of 4.0 percent GDP growth in 2026 over the IMF’s 3.5 percent. Equities have run ahead of the earnings, however: nearly all of the gains through May came from multiple expansion, which leaves the TA-125, the exchange’s broader index, priced about 52 percent above its ten-year average earnings multiple.
What the re-rating has not resolved is the question with the longest bearing on Israeli growth, which is whether the ultra-Orthodox go to work. Barely half of Haredi men hold jobs, the community is the fastest-growing in the country, and the state pays many of those who do not work to study full time instead. Two things keep them out of the labor force. The first is the army exemption, and the High Court has already stripped its legal basis; enlistment has more than doubled since the war began, and we expect the exemption to end whichever bloc wins. The second is the money, and that is what is actually on the ballot on October 27. The two front-runners sit on opposite sides of it: Gadi Eisenkot, the retired army chief, would cut the subsidies that support full-time study, while Benjamin Netanyahu depends on the ultra-Orthodox parties for his majority and would keep paying them. The Bank of Israel puts the saving from drafting 7,500 more men per cycle at 0.4 percent of GDP a year, rising to 0.7 percent if those men also find work.
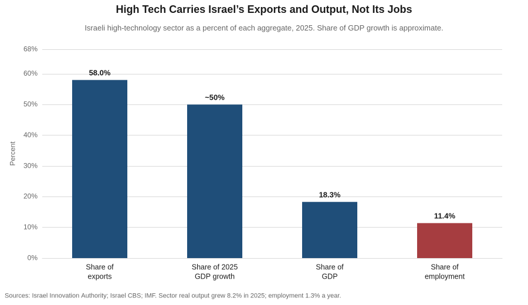
We would change this view if the ceasefires broke, or if the capital now flowing into technology worldwide turned around. High tech produces 18.3 percent of Israel’s GDP and 58 percent of its exports, and only Ireland runs a comparable concentration in the OECD.
At a Glance
| Indicator | Latest | Comparison | Source (as of) |
|---|---|---|---|
| Real GDP growth | 2.9% (2025) | 2026F: 3.5% IMF, 4.0% BoI | IMF Art. IV, Jul 2026 |
| GDP per capita, USD / PPP | $54,217 / $57,278 | EU $43,314 / $63,808 | World Bank WDI, 2024 |
| CPI inflation, y/y | 1.6% (June 2026) | 3.0% avg. 2025 | CBS; BoI, Jul 2026 |
| Policy rate | 3.50% | 4.25% end-2025 | Bank of Israel, Jul 2026 |
| Unemployment rate | 2.8% (May 2026) | US 4.2%; euro area 6.3% | CBS, 2026 |
| Deficit, % of GDP | 5.2% (2025) | 6.2% (2026F) | IMF Art. IV, Jul 2026 |
| Debt, % of GDP | 68.4% (2025) | 60.5% (2022) | IMF; Bank of Israel |
| Defense, % of GDP | 7.8% (2025) | 8.5% (2024 peak); 4.3% (2022) | SIPRI, Apr 2026 |
| Current account | $8.5bn surplus (2025) | $15.4bn (2024) | Bank of Israel |
| FX reserves | $238.7bn, end-June | 37% of GDP | Bank of Israel, Jun 2026 |
| Shekel per USD | 3.07 (Jul 30) | 4.08 (Oct 2023 low) | Market, Jul 30 2026 |
| New-issue spread | 102 bp (Jan 2026) | 154 bp (2024 issue) | Market, Jan 2026 |
| Ratings: M / S&P / F | Baa1 / A / A | Stable / stable / negative | Moody’s Jan 2026; S&P May 2026; Fitch Mar 2026 |
| TA-125 index | 4,022 | +10.0% YTD | TASE, Jul 30 2026 |
Market data as of the close on Thursday, July 30, 2026, unless otherwise noted. Economic indicators are dated to their reference period.
What We Are Watching
- The Bank of Israel’s (BOI) easing cycle has room left. Four cuts since November have taken the policy rate to 3.50 percent, and the BOI signals roughly 3.00 percent within a year with inflation at 1.6 percent, the low end of the 1 to 3 percent target band.
- The balance sheet absorbed the war. Public debt rose from 60.5 percent of GDP in 2022 to about 68 percent in 2025 with the deficit near 5 percent, against 124 percent in the United States and 88 percent in the euro area, and roughly 86 percent of it is held at home in shekels.
- Households have not felt the repricing yet. The public’s assets rose 15.5 percent in 2025, about double the decade average, but consumption per person remains about 16 percent below its pre-war trendline and economy-wide real wages gained only half a percent to one percent over the past year.
Between America and Europe
Israel is a hard economy to place. Its population of 10.2 million is almost exactly Michigan’s, and income per person sits above the European Union average in dollar terms ($54,217 against $43,314 in 2024) though below it at purchasing-power parity ($57,278 against $63,808), which is the comparison that takes Israel’s high cost of living into account. Its growth model, however, is closer to America’s than to Europe’s. Israel spends 6.8 percent of GDP on research and development, the highest share in the OECD, against 3.4 percent in the United States and 2.2 percent across the European Union.
Where Israel lags is output per hour, which runs about 17 percent below the OECD average and nearly 40 percent below the United States. Israelis close part of that gap with time on the job, working 1,881 hours a year against 1,751 in the United States and 1,606 across the European Union, which narrows the shortfall against the OECD average to about 9 percent per worker. The Bank of Israel’s research department traces most of the hourly gap to physical capital and the rest to the quality of workforce skills. Neither shortfall is spread evenly. The gap sits in the domestic, sheltered industries rather than in the export-facing technology sector, which is why a country at the top of the OECD on research spending sits well below its average on output per hour.
The Demographic Opposite of Europe
Israel’s population pyramid has no counterpart among wealthy industrial economies. Israeli women average 2.9 children against an OECD average of 1.5, the median Israeli is 29 years old against 39 in the United States and 45 in the European Union, and an old-age dependency ratio of 21 retirees per 100 working-age adults is projected to reach only 26 by 2050, still below America’s 28 today. Israel’s workforce is still arriving rather than shrinking, and growing faster than any other advanced economy’s.
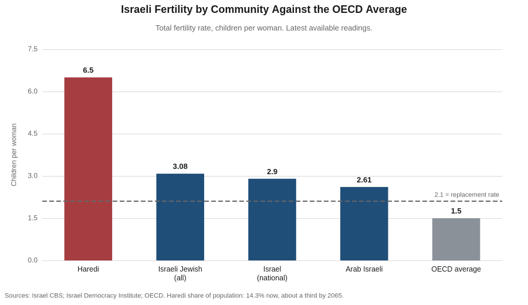
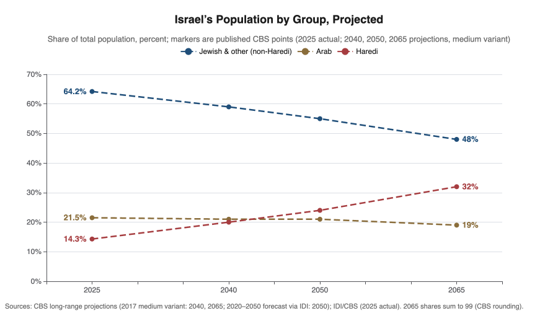
The advantage carries an asterisk, however, since population growth runs fastest in the least-employed communities. Ultra-Orthodox women average 6.5 children, and the Haredi share of the population, 14.3 percent today, is on track to roughly double by 2065. Haredi men’s employment stands near 53 percent and has not improved in a decade, and Haredim are 14 percent of the Jewish working-age population but account for about 4 percent of direct tax revenue. Arab fertility, by contrast, has fallen below the Jewish rate, to 2.61 children against 3.08, so that community holds near a fifth of the population. Roughly a third of Haredi households and 38 percent of Arab households live below the poverty line, which is why a national poverty rate of 20.7 percent ranks among the highest in the OECD even with unemployment under 3 percent.
The Start-Up Nation at the AI Frontier
Israel’s growth runs through one sector, and it is a large one. High tech produced 18.3 percent of GDP and 58 percent of exports ($85 billion) in 2025, employs about 400,000 people at wages nearly triple those of other workers, and accounted for roughly half of all Israeli GDP growth. Output in the sector grew 8.2 percent in real terms in a year when the rest of the economy grew below 2 percent. The IMF’s own 2026 staff analysis ranks Israel 18th globally on its AI Preparedness Index, ahead of Spain, France and Italy, and 39 percent of Israeli firms were already using AI as of early 2026. Venture funding reached $15.6 billion last year and exits set a record of about $84 billion, led by Google’s $32 billion purchase of Wiz and Palo Alto’s $25 billion purchase of CyberArk.
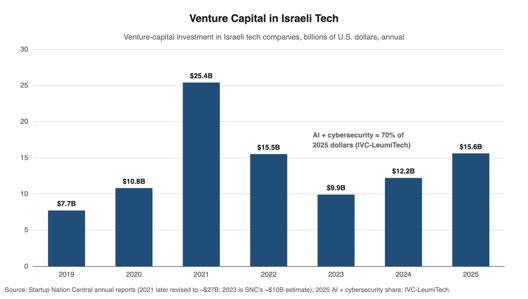
The boom has been far better at producing output than at producing jobs, however. Employment in the sector has grown 1.3 percent a year over the past three years against 1.8 percent economy-wide, which leaves the gains with the people already inside. In the OECD only Ireland runs a comparable export concentration, and a repricing of the global AI trade would land on Israeli output, foreign investment and household wealth at once, a risk the IMF now lists among the country’s largest.
Cheap at the Plug, Global at the Pump
Israel has reached American-style energy security by an entirely different route. Three offshore gas fields (Leviathan, Tamar and Karish) produced about 27 billion cubic meters in 2024, supplying roughly 70 percent of electricity under long-term domestic contracts, and pipeline sales to Egypt and Jordan have made gas an export business as well. Israeli households pay about $0.22 per kilowatt-hour against $0.33 across the European Union, an advantage that helped hold inflation inside the Bank of Israel’s 1 to 3 percent target band through a war and a global energy shock. The road is the exception, since Israel imports more than 90 percent of its petroleum and pump prices jumped nearly 15 percent in a single month during the spring conflict.
That energy position is part of why the easing cycle has room to run. We expect the Bank of Israel to keep cutting while output sits about 9 percent below its pre-war trend, unless the shekel or a renewed supply shock forces it to stop.
The Ledger
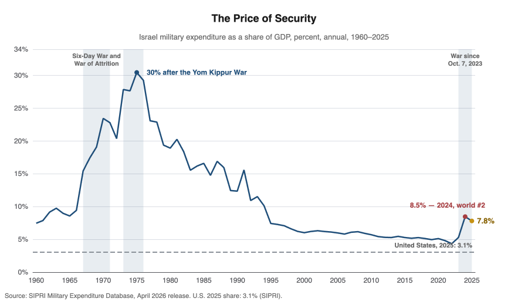
The war has been expensive, and Israel could afford it. Defense spending rose from 4.3 percent of GDP in 2022 to 8.5 percent in 2024, the second-highest share in the world that year, and is easing toward 7.6 percent in 2026 and a planned 5 percent or so by decade’s end. Broad estimates put the cumulative cost of the wars since October 2023 near 700 billion shekels (about $205 billion, roughly a third of a year’s GDP).
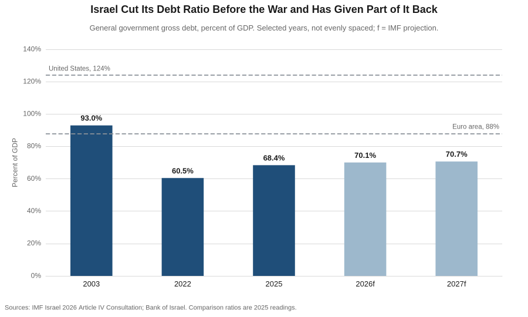
Israel went into the war having cut public debt from 93 percent of GDP in 2003 to 60.5 percent in 2022, which is what gave it the room to borrow. The current account runs a surplus and the reserve cushion, $238.7 billion at the end of June, or 37 percent of GDP, is intact.
The Vote and the Draft
Israelis vote October 27. An American reader would read all three front-running tickets, Prime Minister Benjamin Netanyahu’s Likud, the retired army chief Gadi Eisenkot’s Yashar and the joint slate of Naftali Bennett and Yair Lapid, as market and security-oriented conservatives who differ little on economics. What divides them is the ultra-Orthodox arrangement, and only half of it is still on the ballot.
The draft is all but settled. The High Court ruled unanimously in June 2024 that the blanket exemption has no legal basis, enlistment has already risen from about 1,800 ultra-Orthodox men a year before the war to more than 4,000, and with some 80,000 draft-eligible men still unserved and the army short 12,000 soldiers we expect the exemption to end whichever bloc wins. The Bank of Israel calculated in December that drafting 7,500 more per cycle saves the economy at least 9 billion shekels a year, 0.4 percent of GDP.
What the vote decides is the subsidies, and that is the larger number. The same calculation rises to 14 billion shekels a year, 0.7 percent of GDP, if employment rises alongside enlistment, and employment will not rise while the state pays men to study full time rather than work. Eisenkot would make an obligation to serve a condition of any coalition he leads, exempting only the top 3 percent of each cohort, and Bennett would end support for anyone who neither serves nor works, while another Netanyahu coalition would owe its majority to the ultra-Orthodox parties and keep paying.
The long-run figure is larger still. The Bank of Israel projects the loss of output per capita at about 6 percent by 2065 if Haredi employment and education levels never converge on those of non-Haredi Jews. Netanyahu himself cut the child allowances as finance minister from 2003 to 2005 and Haredi men’s employment climbed from 37 percent to 52 percent by 2015, so the lever is known to work.
The American Anchor
American sentiment toward Israel has been souring for years, and the shift has accelerated since 2023. Gallup’s favorability reading fell to 46 percent this February, just above its 1989 record low of 45 percent and down from 75 percent as recently as 2021, and the drift is deepest among Democrats, at 80 percent unfavorable in Pew’s reading, though Republican favorability has slipped to 58 percent as well. Actual policy has not shifted with the mood, however. The April 2024 aid package passed the House 366 to 58 and the Senate 79 to 18, and every resolution to block an arms sale has failed. The economics underneath the politics have also changed, since the memorandum of understanding provides $3.8 billion a year through fiscal 2028 but now equals about 0.6 percent of Israeli GDP against 10 to 15 percent in the decade through the mid-1990s, and two-way goods trade of $34.4 billion in 2025 runs nine times the aid check. Successor talks were meant to start at the beginning of 2026 and have slipped repeatedly since. We expect American support to continue at similar value well past 2028, likely as the technology partnership Netanyahu has proposed in place of direct financing, and we read the risk as generational rather than immediate.
What It Means for Markets
Equities
Investors have already rendered a verdict. The TA-35, Israel’s version of the S&P 500, rose 51.6 percent in shekels in 2025 and returned roughly 73 percent to a dollar-based investor as the currency strengthened, against 16 percent for the S&P 500. Nearly all of the gains through May, however, came from expanding valuation multiples rather than earnings, which leaves the TA-125 priced about 52 percent above its ten-year average earnings multiple. The index closed at 4,022 on July 30, up 10.0 percent for the year in shekels and 10 percent below the record it set in May. The exchange may be about to get more supply. The government is weighing the sale of 25 to 30 percent of Israel Aerospace Industries and of Rafael, the Iron Dome maker, though only the aerospace listing rests on a ministerial decision and the Finance Ministry has objected to the framework drawn up for Rafael. Rafael’s chief executive said in July that he was optimistic about an offering by year end while adding that neither the size of the stake nor the listing venue had been settled. We expect the repricing to continue, though a market that has re-rated this far on multiple expansion leaves little room for disappointment.
Currency
The shekel moved from 4.08 per dollar at its October 2023 low to under 3.00 in April 2026, the first time it had traded below that level since 1995, and 3.07 on July 30. Non-residents put a net $5.7 billion into Israeli shares in 2024 and $4.9 billion in 2025, after selling more than they bought in four of the six years before the war. The flow story and the current-account surplus both point the same way, and the constraint on further appreciation is the central bank’s easing path rather than the balance of payments.
Rates and Sovereign Credit
The bond market ratified the equity move. Israel raised $6 billion in January at 102 basis points over comparable Treasuries against 154 basis points on its 2024 issue, on $36 billion of demand. Roughly 21 basis points of that 52 was a market-wide move, since the ICE BofA single-A corporate index tightened by the same amount between the two pricing dates, which leaves about 30 basis points Israel earned on its own. Moody’s and S&P have restored stable outlooks, while Fitch affirmed its A rating with a negative outlook in March 2026. With 86 percent of the debt held at home in shekels and reserves at 37 percent of GDP, the funding position is not the vulnerability. The ratings risk is political, and Moody’s has named a weakening of the courts by legislation as one of three downgrade triggers.
The Household Transmission
The repricing lifted the value of what Israelis own well ahead of anything it did for what they earn, and the Bank of Israel’s own model attributes 1.7 percentage points of last year’s 2.6 percent consumption growth to the gain. Exposure runs unusually wide, since pension enrollment has been compulsory for every salaried employee since 2008 at contribution rates now above 15 percent of pay, so a Tel Aviv rally reaches ordinary retirement accounts and not only the portfolios of the wealthy. Pay has moved far more slowly, however. Economy-wide real wages gained about half a percent to one percent over the past year against roughly 4 percent in technology, and the Taub Center calculates that the high-tech premium over the rest of the workforce widened from about 120 percent in 2012 to 180 percent in 2024. We expect consumer sentiment, spending and wage growth to follow over the coming year as the rate cuts work through, though pay will be the last place it shows up.
The Outlook at a Glance
| 2025 (actual) | 2026F | 2027F | |
|---|---|---|---|
| Real GDP growth, % (IMF) | 2.9 | 3.5 | 4.4 |
| Real GDP growth, % (Bank of Israel) | 2.9 | 4.0 | 5.5 |
| CPI inflation, % annual avg. (IMF) | 3.0 | 2.3 | 2.1 |
| Bank of Israel policy rate, % | 4.25 | 3.50 | 3.0 |
| Government deficit, % of GDP (IMF) | 5.2 | 6.2 | 5.1 |
| Public debt, % of GDP (IMF) | 68.4 | 70.1 | 70.7 |
Source: IMF, Israel: 2026 Article IV Consultation, July 1, 2026, Tables 1 to 3 and the downside scenario at paragraph 10; Bank of Israel, Research Department Staff Forecast, July 2026. The policy-rate row is not a single forecast series: the 2025 cell is the end-period actual, the 2026 cell is the rate prevailing today and the 2027 cell is the Bank of Israel’s projected average for the second quarter of 2027.
Scenarios
| Scenario | What Happens | Market Implication |
|---|---|---|
| Base case | Ceasefires hold and supply constraints keep easing. Growth lands nearer the Bank of Israel’s 4.0 percent than the IMF’s 3.5 percent, and the policy rate reaches roughly 3.00 percent. The election ends the exemption but leaves the subsidies broadly intact. | Repricing continues but slows, and further gains have to come from earnings rather than a higher multiple. Shekel firm. Sovereign spreads grind tighter. |
| Upside | A coalition that ends payments for full-time study alongside the draft. The Bank of Israel’s saving rises from 0.4 to 0.7 percent of GDP a year, and the 2065 output gap begins to close. | Ratings outlooks improve toward upgrade. Curve bull-steepens. A faster growth path gives the multiple more to stand on, though it stays rich against its own history. |
| Downside | Renewed fighting, a reversal of the capital flowing into technology, or both. On the IMF’s downside scenario, which pairs renewed hostilities with a severe global recession, growth runs near 2.75 percent this year and 1.5 percent next and defense spending returns toward 9 percent of GDP. | The multiple is the first thing to go, at 52 percent above its ten-year average earnings multiple. Shekel retraces. Fitch’s negative outlook becomes a downgrade. |
Signposts
| Date | Event | Why It Matters |
|---|---|---|
| Oct 27, 2026 | Knesset election | Decides the ultra-Orthodox subsidies. The Bank of Israel’s saving rises from 0.4 to 0.7 percent of GDP a year if employment rises alongside enlistment. |
| Sep 1, 2026 | Next Bank of Israel rate decision | Tests the path to roughly 3.00 percent that the July decision signaled. |
| By year-end 2026 | Rafael partial offering; Israel Aerospace approved, timing not set | New supply to a market trading 52 percent above its ten-year average earnings multiple. Listing venue not settled. |
| Ongoing | Successor MOU talks, began June 2026 | The current $3.8 billion a year runs through fiscal 2028, and a technology partnership in place of direct financing is the likeliest successor shape. |
| Ongoing | Next Fitch review | Fitch is the one agency still on negative outlook, affirmed at A in March 2026; a downgrade would break the stable-outlook run at the other two. |
| After the vote | Judicial legislation | Moody’s names weakening the courts by legislation as one of three downgrade triggers. |
Our Call
We expect Israel to outgrow both America and Europe over the balance of the decade in percentage terms. The Bank of Israel and the IMF differ mainly on how fast the supply constraints that have held output about 9 percent below its pre-war trend unwind, and we lean toward the Bank of Israel’s side of the range. Inflation sits at the low end of the target band, the current account runs a surplus and the reserve cushion is intact.
Two risks would spoil the story, and the market has largely priced neither of them. The first is renewed fighting, where the IMF’s downside scenario cuts growth to about 2.75 percent this year and 1.5 percent next and pushes defense spending toward 9 percent of GDP. The second is the AI trade itself, since a technology sector this dominant transmits any global correction directly home. A market that has re-rated this far on multiple expansion has little room for either.
What the market has not paid for is the half of the ultra-Orthodox labor question the October vote decides. Ending the payments for full-time study is what lifts the Bank of Israel’s figure from 0.4 percent to 0.7 percent of GDP a year in the near term, and it is what closes the far larger gap the bank projects by 2065. Israeli coalitions rarely last a four-year term, however. This is the first Israeli government since 1973 to complete one and the first election held on schedule since 1988, and Israelis voted five times between April 2019 and November 2022, so no single result is final.
Chase Greenberg – Research Analyst, Piedmont Crescent Capital
Mark P. Vitner – Chief Economist, Piedmont Crescent Capital
mark.vitner@piedmontcrescentcapital.com · (704) 458-4000
Disclaimer: This report is provided for informational purposes only and does not constitute investment, legal, tax, or accounting advice, nor an offer or solicitation with respect to the purchase or sale of any security or other financial product. Information has been obtained from sources believed to be reliable, including the Tel Aviv Stock Exchange, the Bank of Israel, the Israel Central Bureau of Statistics, the International Monetary Fund, the OECD, the World Bank, the Israel Innovation Authority, the Taub Center, the Israel Democracy Institute and the SIPRI Military Expenditure Database, but Piedmont Crescent Capital does not warrant its accuracy or completeness. Opinions and estimates are as of the date of this report and are subject to change without notice.
ISM Manufacturing Report: Output Is Ramping Up, and Hiring Should Follow
Output Is Ramping Up, and Hiring Should Follow
The Manufacturing PMI reached its highest level in more than four years, and the Employment Index broke a 33-month losing streak, while a prices gauge still above 70 leaves the Fed no room to answer.
Early Signals
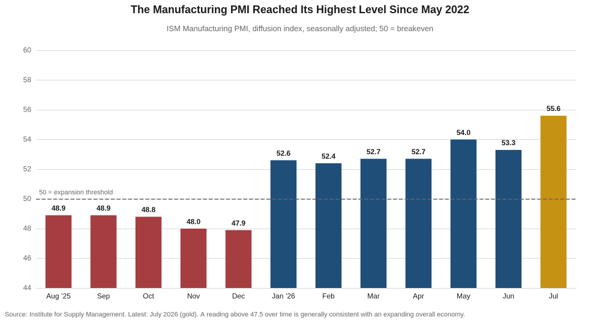
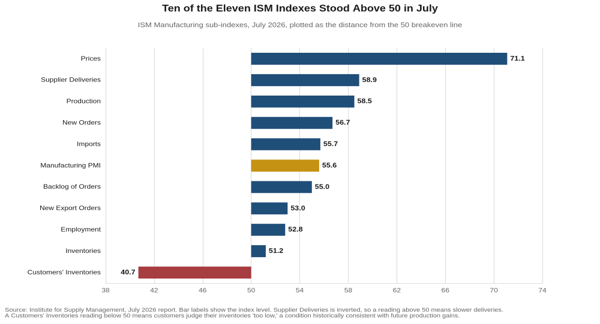
- The factory sector broke out. The Manufacturing PMI rose 2.3 points to 55.6 in July, its highest reading since May 2022 and its seventh consecutive month above 50. ISM’s own mapping puts that reading at roughly 2.8 percent real GDP growth on an annualized basis, which lines up with the stronger second half our full-year forecast has been leaning on.
- Production did most of the lifting. The Production Index jumped 6.3 points to 58.5, its strongest reading since November 2021, and the Backlog of Orders Index rose 4.5 points to 55.0 after nearly stalling out in June.
- Employment finally crossed over. The Employment Index rose 3.1 points to 52.8, its first reading above 50 in 33 months and its highest since August 2022. Sixty percent of panelists reported that their companies are hiring.
- Trade moved in both directions. New export orders returned to expansion at 53.0 and the Imports Index rose to 55.7, its highest since June 2021, an unusual pairing with tariffs still in force across much of the goods basket.
- Price relief continued, and prices remain the problem. The Prices Index slipped 1.9 points to 71.1, its third straight monthly decline, but it has now signaled rising input costs for 22 consecutive months.
Key Takeaways
| Key Concept | Findings |
|---|---|
| Manufacturing PMI | Rose to 55.6 from 53.3, the highest reading since May 2022 (55.9) and the seventh straight month of expansion following a ten-month contraction. The overall economy has now grown for 21 consecutive months on ISM’s mapping. |
| Production | Up 6.3 points to 58.5, its highest level since November 2021. Twelve industries reported higher output and no industry reported a decline in production in July. |
| New Orders and Backlogs | New orders edged up 0.7 point to 56.7 for a seventh month of growth, while backlogs jumped 4.5 points to 55.0. Customers’ inventories fell further into “too low” territory at 40.7, a 22nd month, which historically points to future production. |
| Employment | Up 3.1 points to 52.8, the first expansion reading in 33 months and the highest since August 2022. The ratio of panelists hiring to those managing head counts was 1.5 to 1. |
| Prices | Down 1.9 points to 71.1, a third consecutive decline, with 50.2 percent of respondents reporting higher prices against 55.1 percent in June. Steel and aluminum tariffs and the Middle East oil premium are still exerting pressure. |
| Trade | New export orders returned to expansion at 53.0, the highest since March 2022, and imports rose to 55.7, the highest since June 2021. Both indexes gained more than 2.5 points. |
| Breadth | Fifteen of 18 industries grew, with Chemical Products the lone industry in contraction. By GDP weight, however, the contracting share widened to 20 percent from 5 percent in June. |
| Policy Signal | A firming industrial economy paired with input costs still in the 70s argues for patience, not a pivot. We hold our no-cut base case for 2026, with the next move more likely up than down, in 2027. |
The Overview
We have argued for some time now that the factory recovery was real, and that new orders and production were carrying it. The missing piece was hiring. July supplied it, as the Manufacturing PMI rose 2.3 points to 55.6, the highest reading in more than four years, and the Employment Index moved into expansion for the first time in 33 months. Four of the five components that feed the headline accelerated, and the only exception, inventories, slipped by two tenths.
The sequence is the part worth holding onto, because a factory recovery tends to run in a familiar order, with new orders improving first, order backlogs lengthening next, the workweek stretching after that, and hiring arriving last. This cycle has now completed all four steps. New orders turned in January and backlogs edged above 50 the same month, the factory workweek stretched from 41.1 hours in December to 41.6 by February, backlogs then lengthened decisively in July, to 55.0 from 50.5, and the Employment Index crossed 50 in the same report. The chain took an unusually long time to run its course this cycle, however, because tariff and geopolitical uncertainty gave employers every reason to add hours before they added staff.
What July did not deliver was any relief on costs. The Prices Index eased for a third month and still sits at 71.1, a level it has held since at least April. Pricing volatility turned up in 57 percent of the negative panel comments and the Iran war in 43 percent, so the two forces working against the recovery are the same two we flagged earlier, only now they sit alongside an acceleration instead of a stall.
Production Did the Lifting
The Production Index rose 6.3 points to 58.5, its highest reading since November 2021, and the composition beneath it is as clean as the headline. Twelve industries reported higher output, six reported no change, and none reported a decline. Of the six largest manufacturing industries, four expanded production, including Chemical Products, the only industry that contracted on the composite.
Demand kept pace without accelerating. New orders rose seven tenths to 56.7 and have now held the 54 to 57 band for four months, a firm reading well short of a boom. The more interesting move was in backlogs, which rose 4.5 points to 55.0 after sitting at 50.5 in June. Order books lengthening while production runs at a four-year high is the combination that pulls hiring forward. Customers’ inventories, meanwhile, fell to 40.7 and have been judged too low for 22 straight months, a condition that historically precedes restocking. That the restocking has not yet arrived likely reflects continued uncertainty about the Iran war and U.S. tariff policy, and more clarity on either front would probably set it off.
Supplier deliveries slowed for an eighth consecutive month, at 58.9, and the buying-policy detail says why. The average commitment lead time for production materials stretched to 87 days in July from 81 days in April, and capital expenditure lead times edged up to 172 days. Slower deliveries usually accompany firming demand, and they can also signal genuine scarcity. Panelists named electronics, critical minerals and printed circuit boards, so both readings apply this month.
The 33-Month Streak Ends
The Employment Index registered 52.8 in July, up 3.1 points and in expansion for the first time in 33 months. Six industries added workers and six cut them, with six unchanged, and 60 percent of panelists reported that their companies are hiring against 40 percent still managing head counts. ISM’s own guidance is that an Employment Index above 50.3 is generally consistent with rising manufacturing payrolls in the Bureau of Labor Statistics data, which makes the July employment report on Friday the first real test of the signal.
The payroll data have been waiting for this. Manufacturing employment bottomed at 12.58 million in December and has added just 18,000 workers in the six months since, leaving the sector 38,000 jobs below where it stood a year ago. Even with the flat head count, however, manufacturing output has climbed 1.1 percent over the past year and 1.8 percent since December, so the recovery to date has been produced by the workers already on the payroll.
The workweek is where that shows up, and it is the step that comes just before hiring. Average weekly hours in manufacturing reached 41.6 in June, up from 41.1 in December and 41.0 a year earlier, and the highest reading in at least five years. Half an hour sounds trivial, and it is worth roughly 150,000 workers at December’s workweek, more than eight times the head count the sector has actually added. Employers stretch hours rather than hire when they doubt a recovery will last, because hours can be unwound quickly and hires cannot. July suggests a good number of manufacturers are now confident enough to boost hiring.
What the Capital Was Doing
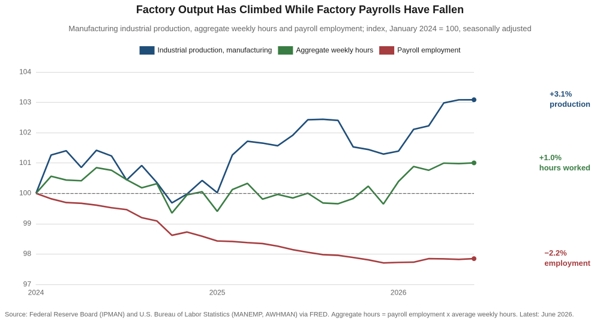
The capital side of this recovery has been visible in the hard data for a year. Orders for nondefense capital goods excluding aircraft reached $85.1 billion in June, up 12.5 percent from a year earlier and up 7.4 percent since December alone. Manufacturing labor productivity rose 1.5 percent over the year through the first quarter. Since the start of 2024 factory output is up 3.1 percent while aggregate hours are up 1.0 percent and payrolls are down 2.2 percent, the signature of a cycle that deepened capital before it added workers.
What the panel comments add is where the capital is going. A machinery producer described products going into data centers at full procurement and manufacturing ramp-up, with semiconductor, power, networking and photonics demand booming and orders for medical, industrial and consumer products markedly lower. A computer and electronic products panelist cited semiconductor, AI, advanced packaging and high-performance computing markets. A transportation equipment panelist reported aerospace and defense backlogs growing while the firm competed for scarce electronics and critical minerals. The recovery has a narrow set of end markets behind it, which is the conditional capital argument we made in our data center work.
Prices, Tariffs and the War Premium
The Prices Index fell 1.9 points to 71.1, a third consecutive monthly decline from April’s 84.6, and the share of respondents paying more fell to 50.2 percent from 55.1 percent. The direction is right and the level is not. Twenty-two consecutive months of rising input costs have compounded into a number that is visible in the official data, where the producer price index for processed goods for intermediate demand is up 11.1 percent over the past year, though it did fall 0.7 percent in June, its first monthly decline since December.
Three forces are holding the index up, and they are separable. Tariffs on steel and aluminum raise costs through the entire value chain, and they are a policy choice. The Middle East conflict has put a premium on petroleum-based products and freight, and it is a live variable rather than a settled one, since panelists reported fuel costs falling while the war was paused and rising again once skirmishes resumed. The third force is scarcity in the categories the AI buildout is consuming, and an electrical equipment panelist put numbers on it, citing price increases of 5 to 25 percent for printed circuit board assembly components and 15 to 45 percent for bare boards. The first two can reverse on a headline, while the third will not ease materially until the buildout does.
For the Federal Reserve, this report cuts against easing rather than toward it. A factory sector growing at its fastest rate in four years, hiring for the first time in nearly three years, and paying up for inputs is not the profile of an economy that needs help. The Committee has spent the year waiting for confirmation that the spring energy shock was not becoming a wage-price problem. It did not get that confirmation in July.
Our Call
The manufacturing recovery is now broad enough to be self-reinforcing. Orders improved, backlogs lengthened, the workweek stretched and payrolls have now turned, which is the complete chain and not just the front half of one. We look for manufacturing employment to post modest gains through the fall, and we would treat a soft July payroll print on Friday as timing rather than as a refutation, since the ISM Employment Index has led the payroll data at every prior turn.
The recovery is broad by industry and narrow by end market, and that distinction will matter. Fifteen of 18 industries grew in July, yet the share of manufacturing GDP in contraction widened to 20 percent from 5 percent, because Chemical Products carries real weight. The panel comments point the same way, with data centers, semiconductors, aerospace and defense running at capacity while consumer, medical and general industrial orders lag. This is a capital goods recovery riding an investment cycle, and it will stay vulnerable to anything that interrupts that cycle.
We hold our call that the next Fed move is more likely up than down. Nothing in the July report argues for easing, and the Prices Index at 71.1 alongside an accelerating industrial economy argues mildly against it. The risk to that view is not a weaker factory sector. It is a wider Middle East conflict that pushes energy and freight costs high enough to stall the very improvement in demand this report is measuring, and the panel comments suggest firms are still pricing that possibility into their planning.
Mark P. Vitner – Chief Economist, Piedmont Crescent Capital
mark.vitner@piedmontcrescentcapital.com · (704) 458-4000
Disclaimer: This report is provided for informational purposes only and does not constitute investment, legal, tax, or accounting advice, nor an offer or solicitation to buy or sell any security. Information is drawn from sources believed to be reliable, including the Institute for Supply Management, the U.S. Bureau of Labor Statistics, the U.S. Census Bureau and the Federal Reserve Board, but its accuracy and completeness are not guaranteed. Views expressed are those of the author as of the date of publication and are subject to change without notice. Past performance is not indicative of future results.
The Piedmont Perspective -- The Wrong Number and the Right Worry
The Wrong Number and the Right Worry
The Piedmont Perspective
The Argument in Brief
- The case for holding rates in September rests on the inflation rate we can measure today. The case for worrying about 2027 rests on the demand growth that will set the rate we measure then. Both are ours, and they do not conflict.
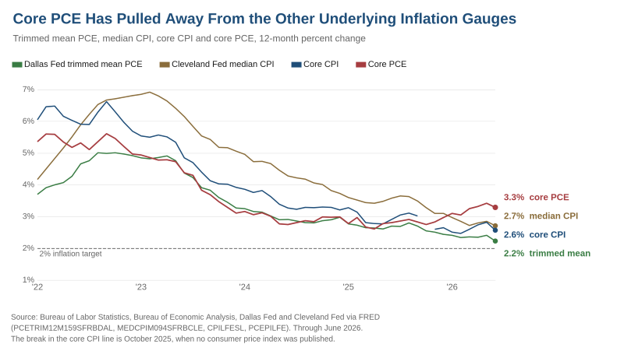
- On today’s number the case for tightening is weak. Trimmed mean PCE at 2.23%, median CPI at 2.7%, core CPI at 2.6%, wages decelerating to 3.1%, payrolls at 57,000 a month.
- Our trend estimates now run across three price indexes, and they have pulled apart. Core CPI 2.73%, core PCE 3.30%, producer prices 4.12%. The range across the three is the widest of the cycle.
- The worry is demand, not price. Private domestic demand grew 3.9% against a labor force that has shrunk by roughly a million people over the past year.
- The test prints Thursday. If second-quarter productivity is running 2.5% or better, the 2027 worry weakens materially, and we would say so.
We are inflation hawks and we have never minded the label. It is precisely because we hold that view that we do not think the Federal Reserve should raise rates in September, and it is precisely because we hold it that we are more worried about 2027 than most of the people currently arguing for a hike. Three officials dissented on July 29 in favor of a quarter point and the commentary since has been close to unanimous that the Committee is behind. We part company with it, and the reason is not that we have gone soft on inflation. It is that the number the hawks are pointing at and the number that should worry them are not the same number.
Everything below rests on one distinction: between the inflation rate you can measure today and the demand growth that determines the inflation rate you will measure in eighteen months. Monetary policy acts with a lag that every practitioner accepts in principle and almost nobody honors in practice. A committee that tightens because today's print is uncomfortable is treating a lagging indicator as a leading one. A committee that tightens because demand growth is inconsistent with its target is doing the job. On today's print the case for tightening is weak. On demand growth the case for being ready to tighten is strong. Holding both positions at once is what the lag structure requires.
Start with the measurable rate, because that is where the September argument lives and where it fails. The Dallas Fed's trimmed mean measure of personal consumption expenditures, which is not a fitted trend and does not get revised, fell in June to 2.23%, its lowest since July 2021. The Cleveland Fed's median consumer price index is up 2.7% over the past twelve months, down from 3.6% a year earlier. Core consumer prices are running at 2.6%. The employment cost index shows wages decelerating to 3.1% from 3.3%, and payroll growth has slowed to 57,000 a month. Michigan's inflation expectations eased. Producer prices are the honest counter-argument and we do not wave them off, with final demand up 5.5% and running between 5.5% and 6.0% since the spring, but a war-driven energy shock passing through a supply chain is the textbook relative price change and the textbook answer is to look through it unless it reaches wages or expectations. It has reached neither.
A second central bank facing a larger version of the same problem read it the same way last week. The Bank of England held Bank Rate at 3.75% on July 29 on a six to three vote and recorded in its minutes that there had been little evidence of material second-round effects so far, while noting that pass-through lags mean this cannot be taken as a strong signal about their future emergence. That is close to our own position, caveat included. Britain imports more of its energy than we do and its committee still concluded that an energy shock is not a wage-price spiral until it shows up in wages. We would not lean on an outside committee for our own view, but when two independent bodies looking at different economies reach the same reading of the same class of shock, that is worth a paragraph.
Our own estimate of underlying inflation is built to answer a question the published gauges cannot, and this month we widened it. We apply a one-sided Hodrick-Prescott filter to monthly annualized inflation, refit each month on the data available through that month, so the published estimate never revises. The point of it is that the Cleveland and Dallas measures work across the cross-section, discarding outlier categories in a single month, while a filter works across time, using the full run of data to separate a slow-moving trend from transitory noise. They are answering different questions and we would rather have both answers than argue about which one is better. Until now we ran it on the consumer price index alone. We have extended it to the personal consumption expenditures deflator and the producer price index for final demand, on the same sample and the same smoothing parameter, and the result is the most interesting thing in this note.
Run the same filter across all three price indexes and they have pulled apart, which has not happened since the war began. Our trend estimate for core consumer prices is 2.73%. For core personal consumption expenditures it is 3.30%. For producer prices it is 4.12%. The median of the three, which we would now treat as the house reading, is 3.30%. At the end of last year those three trends sat within 0.36 percentage points of one another. Today the range is 1.40 points, the widest of the cycle. A single index would not have told us that. Publishing off core consumer prices alone would have had us describing underlying inflation as being in the mid-twos and converging, when the fuller reading is low threes and diverging. We would rather be corrected by our own methodology than by a data release.
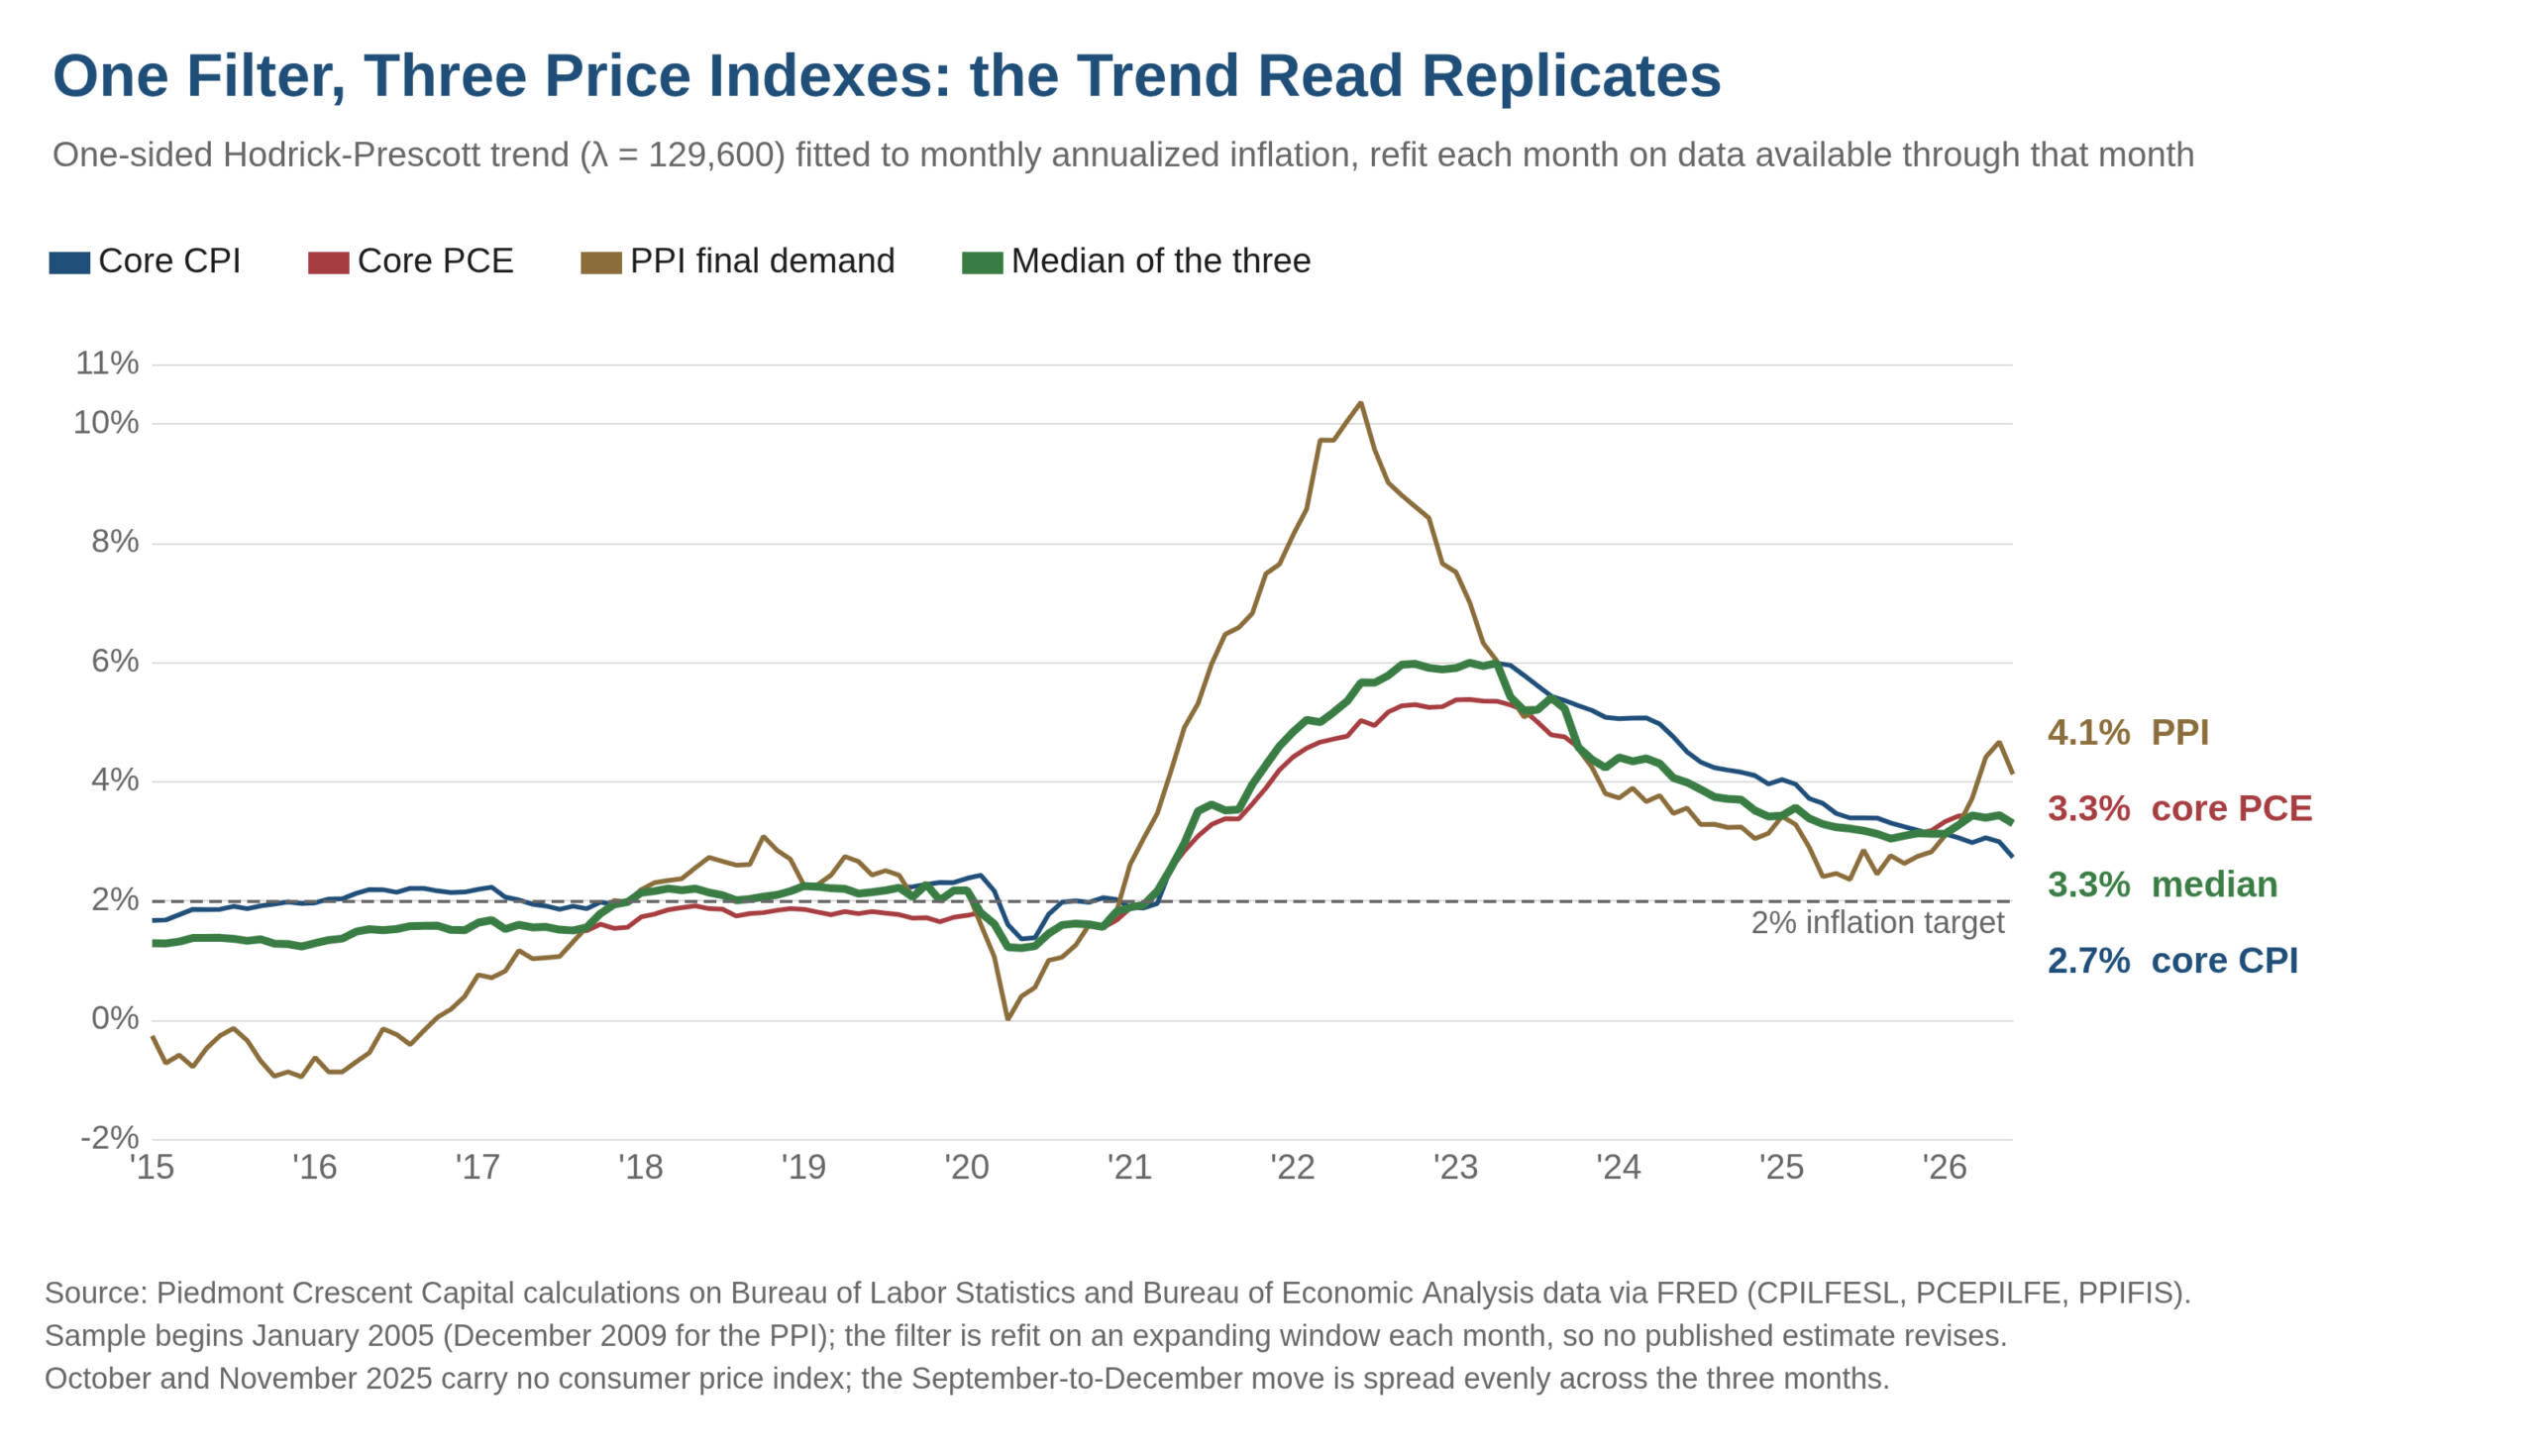
The producer index is the leading leg of that panel and it is moving first again. It rose fastest and furthest in 2021 and 2022, ahead of both consumer measures, and it has moved first again this year, up roughly 1.3 points since December while our core consumer trend fell 0.4. That is the pass-through channel showing up in a trend estimate rather than in a monthly print. It does not mean consumer inflation follows mechanically, and the pass-through from producer to consumer prices has been weaker and slower this cycle than the textbook would have it. It does mean that the reassurance people are taking from core consumer prices at 2.6% is resting on the one gauge of the three that is behaving best.
The gap between the two consumer measures is not a rounding difference and it is not monetary. Core personal consumption expenditures inflation is running 0.7 points above core consumer price inflation, which inverts the normal relationship. Part of that is shelter weights. A larger part is health care. The personal consumption index measures medical care by what providers are actually paid regardless of who pays it, and the producer price index for hospital services is up 3.6%. The consumer price index measures health insurance by a retained-earnings method currently printing minus 7.4%. The gauge the Federal Reserve targets is picking up the retiree services boom. The gauge the press quotes is not. On our reading that measurement gap, more than the shelter weights, accounts for most of the wedge, and its source is demographic.
Now the part that worries us, which has nothing to do with any of those numbers. Real final sales to private domestic purchasers grew 3.9% in the second quarter, up from 1.7% in the first and more than double that pace. The headline growth rate of 1.5% is a distraction; every part of the shortfall was inventories, imported capital goods, or a federal spending line depressed by petroleum reserve sales. Business fixed investment grew 8.4% on top of 10.6% in the first quarter, with equipment up 15.2%, which is a good deal broader than data centers. Set that against a labor force that has shrunk by roughly a million people over the past twelve months and it is not a sustainable configuration. Fed staff research puts trend labor force growth below 10,000 a month. We would not defend that estimate to the decimal, and an estimate several times larger would leave the same conclusion standing.
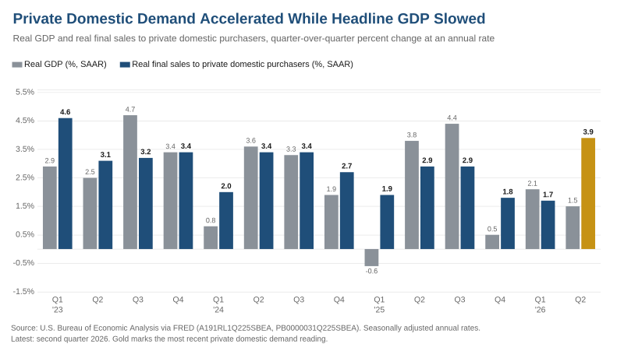
An economy cannot grow domestic demand at close to 4%, at full employment, with no growth at all in available workers, and expect inflation to settle at 2% for long. That is the whole of the worry, and it is arithmetic rather than forecasting. The question is not whether it is inflationary. The question is where and when.
The where is already visible and it is not diffuse. Five very large programs are running at once and each is pressing on a distinct physical constraint. The artificial-intelligence buildout, where conventional memory contract prices rose 93 to 98% in the first quarter and another 58 to 63% in the second, and where Governor Cook counts more than $1.5 trillion of announced data center projects with only a fraction realized. Electrification, where the PJM Interconnection's capacity auction has now cleared at its price cap three times running and still fell 6,831 megawatts short of its own reliability requirement, and where Lazard's nineteenth Levelized Cost of Energy study puts unsubsidized gas combined-cycle generation at $51 to $129 a megawatt-hour against a fifteen-year high for gas-fired power. Generator step-up transformer lead times run to four years with prices up about 80% over five years.
Two of the five have not moved a price index yet, and we regard that as the argument's strongest point rather than its weakest. Defense replenishment and pharmaceutical onshoring are still announcements to a greater extent than actual spending. The fiscal 2027 request for missiles and munitions is $70.5 billion against $24.4 billion enacted for 2026, an increase of 188%, with requested Tomahawk quantities rising from 55 to 785. Fourteen pharmaceutical manufacturers have pledged better than $480 billion of United States production across 22 sites. Meanwhile producer prices for ordnance are up 1.6% over the year, shipbuilding 0.7% and pharmaceutical preparations 1.1%, and construction spending on manufacturing structures is down 22% from a year ago, though the level is still more than twice the 2019 average. The money has been appropriated and pledged but not yet obligated, poured or paid. That pressure is ahead of us, not behind us.
The fifth program is not a capital program at all, and it behaves like the most durable one. Peak 65 runs from 2024 through 2027, with more than 11,200 Americans turning 65 every day, roughly 12% above the prior decade's pace, and Medicare enrollment now past 70 million. It converts a cohort's accumulated wealth into a permanent claim on services that cannot be imported and cannot be automated quickly: hospital services up 5.5% in the consumer price index, airline fares up 26.5%, lodging up 4.7%, food away from home up 3.4%. A data center can be cancelled. A turbine order can be deferred. A seventy-year-old's hip replacement is not rate-sensitive.
Underneath all five, the most cyclical part of the economy has started to turn up, and that is the mechanism that would make a narrow problem a general one. Chicago's purchasing managers index printed 57.6 against a 55.0 consensus. Philadelphia's general activity index jumped from 10.3 to 41.4 in a single month, with prices received up 7.1 points. Empire State shipments reached a four-year high. Industrial production ran at a 4.0% annual rate in the second quarter after 1.1% in the first. Core capital goods orders are up 12.5% from a year ago, orders excluding transportation have risen for fifteen consecutive months and unfilled orders for thirteen. Narrow bottlenecks in memory, turbines and transformers are containable on their own. They are not containable alongside a manufacturing sector competing for the same steel, copper, switchgear and electricians.
The long end of the Treasury curve appears to be pricing exactly this, and the Federal Reserve Chair came close to saying so without joining the dots. The 30-year closed July at 5.27%, a post-2007 high, the 2s-30s spread widened 22 basis points over the month, and the 30-year real yield reached about 2.9% in mid-July, its highest since inflation-protected securities of that maturity were reintroduced in 2010. That is a real-yield move rather than a breakeven move, which means investors are demanding more real return to fund a long-duration capital cycle rather than pricing more inflation. At his July 29 press conference Chair Warsh called the strong growth of business investment the most striking feature of the economy, observed that nominal and real yields are materially higher across the Treasury curve with the inter-meeting move among the largest in roughly two decades, and attributed that move to market participants reacting to real data rather than to anything the Committee said. He did not connect the two. We would.
Now the discipline, because an argument this tidy deserves to be tested rather than admired. The single most important number for whether we are right is one nobody is discussing, and it prints on Thursday. If second-quarter productivity is running at 2.5% or better, then 4% demand growth against a flat labor force is not an inflation problem at all, because output per worker is doing the work and unit labor costs stay contained. Our thesis requires productivity growth to remain near its recent trend rather than to accelerate. A strong productivity print would not damage the September call, which rests on the price and labor data, but it would materially weaken the 2027 worry, and we would say so.
There are three other ways we could be wrong, and they are worth naming precisely. The demand acceleration could prove to be one quarter rather than a trend, in which case the whole structure rests on a single observation that revises. The labor force could stop shrinking; participation among the over-55 cohort has surprised on the upside before and immigration policy could change. And the capital programs could be financed at the expense of other spending rather than on top of it, which is what happens if the long end keeps selling off, since a 30-year real yield near 3% eventually rations projects. That last one is the mechanism by which the market solves this without the Federal Reserve, and it is the reason we are short duration rather than calling for hikes.
The energy shock that dominated the spring is now moving against us, and we would rather point that out than let it pass. Over the weekend the President cancelled a planned strike campaign against Iran subject to a deal whose headline term is reopening the Strait of Hormuz, OPEC+ approved a 188,000 barrel-a-day September increase, and Brent fell to $83.57 with West Texas Intermediate at $79.57. Lower oil pulls headline inflation down through the fall and removes the last thing a September hike could claim to be responding to, which helps our policy call. It also weakens the framing we used through the spring, when the shock ran the other way. We would note that Iran publicly rejected the account on Sunday, that its foreign ministry said on Monday there are no talks with the American side at all, and that transits through the strait were last counted near a tenth of normal with war-risk cover at roughly eight times pre-crisis. Nothing physical has changed. But if the strait genuinely reopens, headline inflation falls faster than we have assumed and the hawks lose their last argument.
What would actually change our mind, in the order we would expect to see it. Private final domestic demand slowing back toward 2% would do it, and that is the cleanest single test. Productivity accelerating durably above 2.5% would do it. The median of our three trend estimates falling back below 2.5%, with the three re-converging rather than the producer leg simply rolling over on energy, would do it. On the other side, we would move toward the hawks if the employment cost index turns back up through 3.5%, if the Michigan five-to-ten-year expectation breaks above 3.5%, or if the producer trend keeps climbing while the consumer trends stop falling. None of those is happening now. All of them are checkable monthly, and we will publish the check.
So we hold the call, and we hold it for a reason that is not the usual one. No cut in 2026 and no hike required in September, because neither the price data nor the labor data supports one, and because housing, the one sector that responds cleanly to the funds rate, has already absorbed the full weight of it. A September increase would not touch a data center, a turbine order or a hospital bill. It would land on housing again, and housing is not where the demand growth is coming from. But we would want a Federal Reserve that arrives in 2027 with its credibility unspent, because the demand growth now in train is not consistent with 2% inflation, the constraints it is pressing on are physical rather than financial, and the cyclical sector that would broaden the problem has just started to turn. The mistake to avoid this fall is tightening on an energy move that is already reversing. If demand growth is still running near 4% next spring with the labor force flat, the Committee will need room to move, and it should not have spent it in September.
Mark P. Vitner
President & Chief Economist, Piedmont Crescent Capital
mark.vitner@piedmontcrescentcapital.com · 704-458-4000
Sources: U.S. Bureau of Labor Statistics; U.S. Bureau of Economic Analysis; Federal Reserve Board; Federal Reserve Banks of Dallas, Cleveland, Chicago, Philadelphia and New York; Bank of England; PJM Interconnection; Lazard; U.S. Department of Defense; U.S. Census Bureau; and Piedmont Crescent Capital calculations, all retrieved from primary releases or FRED. Trend estimates are one-sided Hodrick-Prescott filters (lambda = 129,600) fitted to monthly annualized inflation on an expanding window, sample from January 2005 for the consumer and personal consumption measures and December 2009 for producer prices. This commentary is published by Piedmont Crescent Capital for informational purposes only and does not constitute investment, legal, or tax advice. Views expressed are those of the author as of the date of publication and are subject to change.

The Strikes Stop, the Barrel Breaks, and Washington Discovers the Power Bill
The Strikes Stop, the Barrel Breaks, and Washington Discovers the Power Bill
A View from the Piedmont — Weekly Economic Commentary
Summary
- The air campaign stopped after thirteen nights, and the barrel broke. There were no U.S. strikes on Iran Saturday, Sunday or overnight into Monday, and Tehran halted its retaliation in kind. Brent gapped lower at the Sunday open and was trading near $90.85 Monday morning, roughly $10 below Thursday’s settle of $100.69. This is quiet for quiet rather than an agreement, and nothing in the Strait of Hormuz has reopened.
- Brent settled above $100 last week for the first time since May. Crude closed Thursday at $100.69 and finished the week at $96.72, up 9.7%. Iran rejected the American ceasefire proposal on Friday, refusing any temporary deal that does not settle the final status of the strait, and that refusal is what the weekend pause has parked rather than resolved.
- A second maritime front opened in the Red Sea. The Houthis declared a naval blockade of Saudi Arabia on July 20 and struck Saudi tankers two days later. War-risk premia for vessels calling at Jizan and Al Shuqaiq have run as high as 3% of hull value, from 0.30% a week earlier.
- Initial claims fell to 187,000, the lowest weekly total since 1969. The last reading below that level came in September 1969. Claims of 187,000 alongside a flash composite PMI at an eight-month high describe an economy that was accelerating into the third quarter.
- The hike is back on the table. Futures-implied odds of a rate increase at the July 28-29 meeting roughly tripled to about a third, and selling-price inflation in the July flash PMI ran at its steepest pace since August 2022. We still expect no move in 2026, but the risk to that call has shifted decisively toward an earlier hike.
- Equities have a capital spending problem, not a Gulf problem. Alphabet raised its 2026 capital budget to $195 billion to $205 billion and posted its first negative free cash flow quarter since the 2004 initial public offering. Tesla’s operating margin fell to 1.4%. The Nasdaq had its worst session since April 2025 on Thursday, even as 86% of early reporters beat on earnings.
- Washington moved to get in front of the power bill. The Tennessee Valley Authority, twenty-three Republican governors and 188 signatories including every large hyperscaler joined the administration’s Ratepayer Protection Pledge on Thursday and Friday, a week after the House Energy and Commerce Committee sent the bipartisan Ratepayer Protection Act to the floor by 52 to 0. The binding constraint on the AI buildout in 2027 is looking less like chips or capital and more like local permission.
Monday Morning Update, 10:30 a.m.
The weekend changed the lead story in our outlook. The American air campaign against Iran stopped after thirteen consecutive nights, with no strikes Saturday, Sunday or overnight into Monday. President Trump ordered a halt around the strait late Friday, and Central Command’s Admiral Brad Cooper had advised that the campaign was reaching the limit of its effectiveness with designated targets largely exhausted. Reporting also points to a shortage of air-defense interceptors as a constraint on protecting American forces and Gulf allies, which is a more sobering explanation than the diplomatic one. Iran reciprocated Sunday, with an army spokesman saying Tehran had halted its retaliatory operations and warning that the war would expand geographically if the strikes resume.
Markets priced the pause aggressively. Brent gapped lower at the Sunday open and was trading at $90.85 by mid-morning, down about 6% from Friday’s settle and nearly $10 below Thursday’s, with West Texas Intermediate at $84.33. Stocks opened higher, the ten-year eased to 4.66% from 4.68% after touching 4.63% before the bell, the two-year held at 4.33%, and gold firmed anyway. Futures-implied odds of a hike Wednesday trimmed to about a third from nearly 39% on Friday, and September still prices better than an 80% chance of at least one increase. The market took the tail off rather than the hike.
Nothing has actually reopened. Transits through Hormuz did not recover on the news, with one liquefied petroleum gas carrier and one Iranian-linked product tanker counted overnight into Sunday and no vessels using the southern corridor, and the Revolutionary Guard fired warning shots at six ships attempting to transit outside the designated lane. Iran’s foreign ministry spokesman said Monday morning that talks with Oman on shipping mechanisms are bilateral, have nothing to do with Washington, and that the strait is closed because of insecurity the United States imposed. The threat level is unchanged at severe.
The escalation migrated rather than ended. The Houthis struck Saudi Aramco facilities at Jizan and Yanbu on Saturday in retaliation for Friday’s coalition strikes on Hodeidah, with two ballistic missiles intercepted at Yanbu by a Greek-operated Patriot battery, and Pakistani mediators say halting those attacks is now a precondition for any resumption of American and Iranian talks. Ukraine separately struck Iranian vessels carrying military cargo in the Caspian, killing a sailor, and Tehran has promised an answer. The pause is worth what the next provocation says it is worth, and there are now three theaters that can supply one.
Market Snapshot
| Indicator | Level | Our Read |
|---|---|---|
| Brent Crude | $96.72 / bbl | Up 9.7% on the week after settling at $100.69 Thursday. Down about 6% to $90.85 by Monday mid-morning on the strike pause. |
| WTI Crude | $89.42 / bbl | Up 8.4% on the week, and back to $84.33 Monday mid-morning. The three-month Brent timespread widened to $9.26 last week, the widest since May 22. |
| S&P 500 | 7,411.98 | Off 0.6% on the week and 2.6% below the June 2 record close of 7,609.78. Futures up about 1% Monday morning. |
| Nasdaq Composite | 24,975.82 | Down 2.1%, with Thursday’s 2.15% drop the worst session since April 2025. Nasdaq 100 futures up more than 1.5% Monday. |
| 10-Yr Treasury | 4.68% | Up 13 basis points on the week and 4.71% at Thursday’s peak, then 4.66% Monday mid-morning. The move tracks the price of a barrel of oil, not the growth outlook. |
| 2-Yr Treasury | 4.33% | Up 15 basis points, more than the ten-year, and unchanged Monday mid-morning. The curve has flattened to 35 basis points from 72 at the start of the year. |
| Gold | ~$4,066 / oz | Touched $4,150 midweek and gave most of it back, then firmed above $4,090 Monday even as crude fell. |
| 30-Yr Mortgage | 6.58% | Up 3 basis points. New home inventory sits at 9.3 months’ supply. |
| Fed Policy | July 28-29 FOMC | No change expected Wednesday. Hike odds trimmed to about a third Monday from nearly 39% Friday, with September still above 80% for at least one increase. No updated projections. |
Crude Cleared $100, and Then the Bombing Stopped
The oil market spent the week discovering that the Strait of Hormuz is not the only chokepoint that matters. Brent traded up every session through Thursday, settling at $100.69 for the first time since May 26 and touching $101.01 intraday, before giving back nearly 4% Friday on reports that Pakistan, with Chinese backing, is trying to revive negotiations. U.S. strikes on Iranian targets ran for a thirteenth consecutive night on Friday, hitting Ahvaz, Omidiyeh, Bandar Abbas and Qeshm Island, and Tuesday’s wave reached seven provinces including an electrical installation near the Bushehr nuclear plant. American deaths since the war began in February now stand at 18. Iraq’s prime minister carried a ceasefire proposal to Tehran on Thursday, and Iran rejected it on Friday, saying it would not accept a temporary arrangement that leaves the final status of the strait unsettled. That refusal, more than any single strike, is what changed the week’s arithmetic.
Traffic through Hormuz has thinned to a trickle. The Joint Maritime Information Center counted 5 transits on July 19 and 3 a day from July 22 through Friday, against a historical norm the center puts near 138 vessels a day. Fourteen Iranian attacks on commercial shipping have been confirmed since June 25, mine danger areas remain active inside the traffic separation scheme, and the threat level has been held at severe. The blockade of Iranian ports reimposed on July 14 has redirected six ships and disabled one. The strait has never been formally closed, however, and formal closure is not necessary when war-risk premia are already rationing the passage more tightly than a port authority could.
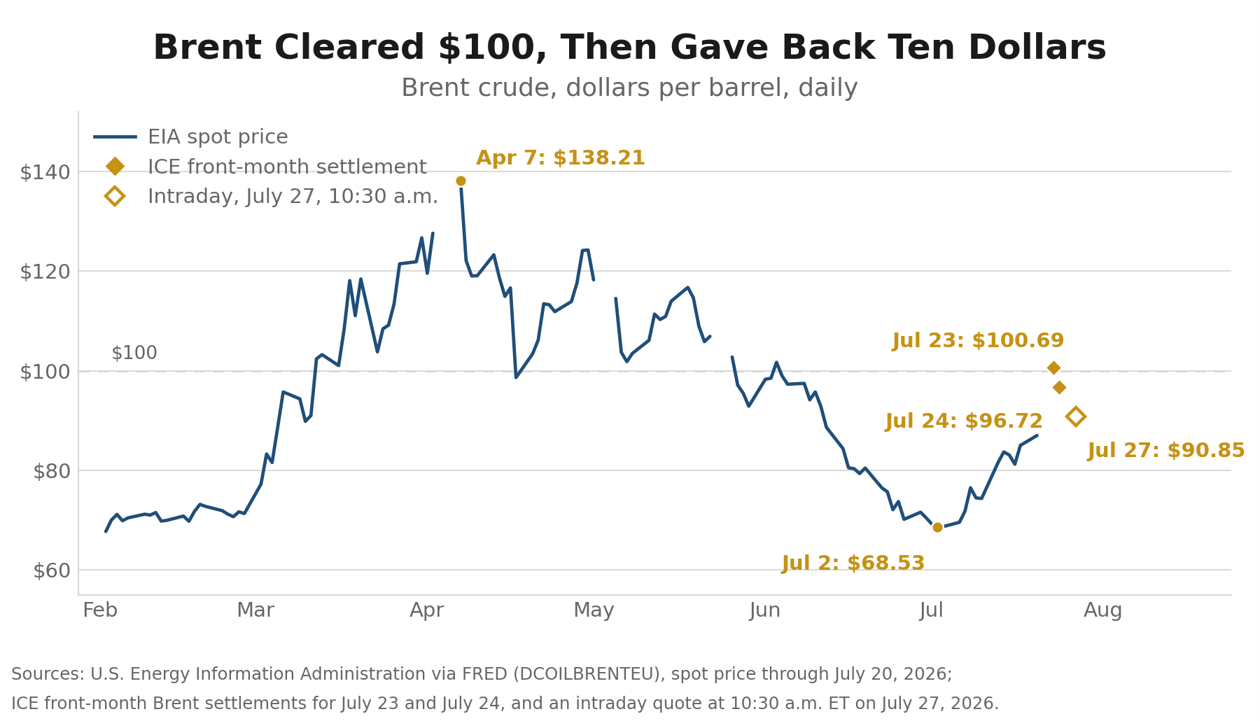
The genuinely new development came roughly 1,300 miles to the southwest. The Houthis declared a naval blockade of Saudi Arabia on July 20 in retaliation for the Saudi strike on Sanaa airport, struck two Saudi tankers on July 22, and by Thursday had prompted the Joint Maritime Information Center to raise the Bab el-Mandeb threat level from moderate to substantial. War-risk premia for vessels calling at Jizan and Al Shuqaiq climbed to as much as 3% of hull value, from roughly 0.30% on July 17, and five Saudi cargoes diverted. The Saudi-led coalition struck Hodeidah on Friday and announced that its military response was over. The two-strait scenario we have been treating as a tail risk has arrived, and the cushion that would normally absorb it is gone. The International Energy Agency puts effective OPEC+ spare capacity at 0.17 million barrels a day, and the Strategic Petroleum Reserve stands at 311.4 million barrels, the lowest level since 1983.
We are moving our scenario probabilities to 50/15/35, having carried 55/15/30 into last week and 45/15/40 out of it. The weekend’s pause is worth something, and it is worth less than the six-dollar break in the barrel implies. The base case, at 50%, has the pause holding long enough for the Oman channel to produce a transit mechanism, and Brent settling near $82 by year-end as the risk premium bleeds off. The upside case, unchanged at 15%, has a durable framework agreement pulling crude into the low $70s. The adverse case, at 35%, carries the disruption into the fall with Brent back in the triple digits, gasoline pushing past its spring peak, and the June inflation relief looking like the exception it probably was.
Three things argue against moving all the way back. The strait has not reopened, and Tehran restated Monday that it considers the closure Washington’s doing rather than its own. The Red Sea got worse over the weekend, not better, and Saudi Arabia now has refinery damage to answer for. And the campaign appears to have stopped because targets ran short and interceptors ran shorter, which is a supply constraint on the American side rather than a decision to settle. A pause built on exhaustion reverses faster than one built on terms.
The Hike Is Back on the Table
The pump has already turned. The AAA national average for regular gasoline crossed $4.00 on July 20 and reached $4.091 by Thursday, up 15 cents in a week and 94 cents from a year ago, after sitting at $3.83 as recently as July 2. Diesel is the more serious problem. The Energy Information Administration’s on-highway average reached $5.134 on July 20, up 34 cents in a single week and $1.32 over the year, with Gulf Coast diesel up 40 cents. Fuel surcharges reset weekly off the diesel index, so that part of the pass-through is mechanical rather than discretionary. Contract linehaul rates reset on a much slower cycle, which means freight pricing would have stayed firm into the fall even if diesel had not rebounded. Now it stays firm longer.
The market repriced the July meeting inside of a week. Futures-implied odds of a rate increase at the July 28-29 meeting climbed to roughly a third by Friday, from about one in eight a week earlier and 18% at the start of the month. September now prices better than 80% for at least one increase. The two-year note rose 15 basis points on the week and the ten-year rose 13, a repricing driven by the barrel and by tariffs rather than by any improvement in the growth outlook. This meeting arrives without an updated Summary of Economic Projections, so the statement language and the press conference carry the entire signal. We would offer one caution on this logic, however, since tighter monetary policy will do little to suppress supply-driven price increases.
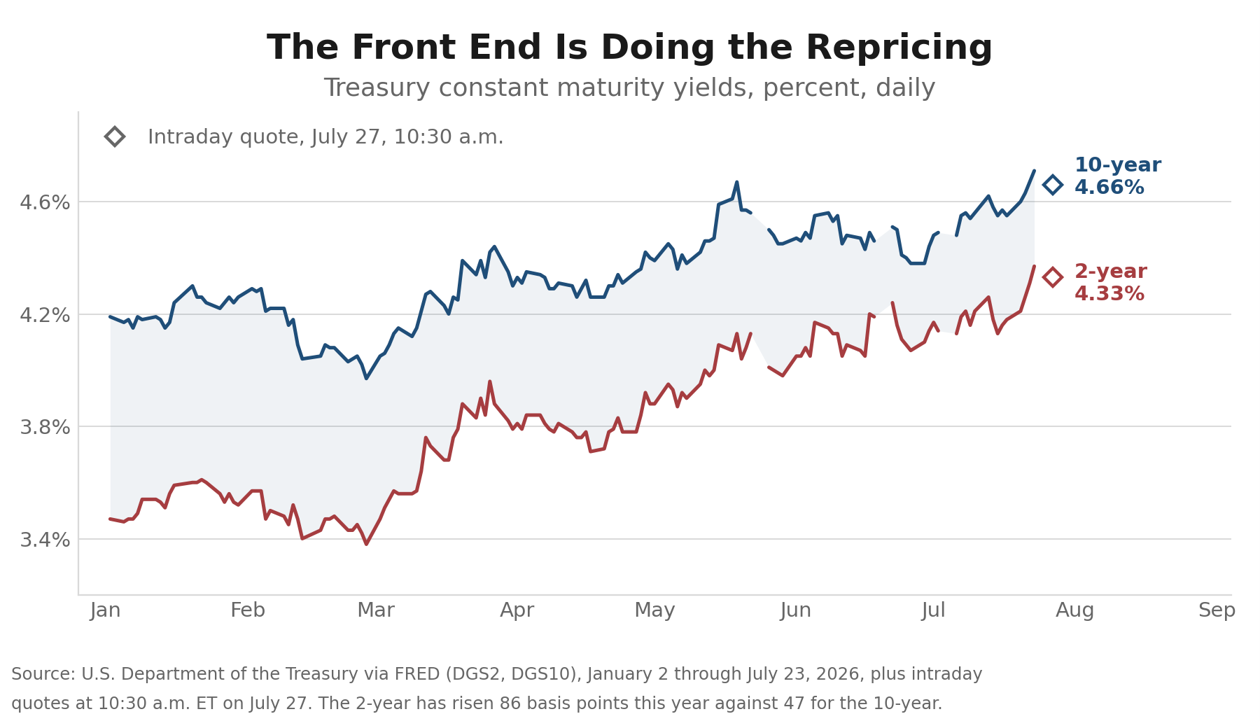
The tariff news deserves the same care as the barrel. The Trade Representative announced Section 301 duties on 60 trading partners on July 23, effective the following morning, at 10% for the seventeen economies that maintain forced-labor import bans and 12.5% for the rest, covering 99.4% of imports with carve-outs for energy, autos, steel, aluminum and qualifying North American entries. Read as a fresh escalation of ten to twelve and a half points, that would be a serious new inflation impulse on top of the oil shock. It is better read as a backfill. The Supreme Court struck down the emergency-powers tariffs in February, the 10% balance-of-payments bridge that replaced them expired on July 24, and this action steps into that gap, recovering less than 60% of the lost revenue by the Committee for a Responsible Federal Budget’s estimate. The effective rate is roughly where it was, which is why markets barely moved, and two suits filed at the Court of International Trade on Friday will decide whether it stays there.
Our call is unchanged. We expect no move in 2026, and we expect the next move to be a hike. What has changed is the balance of risk around that call, which now leans clearly toward an earlier increase than the first half of 2027 we have penciled in. If the July price detail repeats in the August surveys, September becomes a live meeting rather than a hypothetical one. A tightening aimed at containing inflation expectations does not appear warranted this year, and the market does not think it is needed. Five-year breakevens ended last week at 2.24% and the five-year forward measure at 2.28%, both close to target with headline inflation at 3.5% and an oil shock in progress. The case for the hike we expect rests on demand meeting a full-employment economy, not on expectations coming unmoored. The Warsh Fed has abandoned forward guidance, which cuts both ways: it will not talk itself into a corner, and it will not warn anyone before it moves.
Claims at 187,000, and a Flash PMI That Cut Both Ways
Initial jobless claims fell 22,000 to 187,000 in the week ended July 18, the lowest weekly total since 1969. We checked the full history rather than trusting the headline, and the last reading below this one came in September 1969, when claims registered 182,000. The four-week average fell to 207,500 and continuing claims eased to 1.796 million, holding the insured unemployment rate at 1.2%. The layoff channel is doing nothing to loosen the labor market. The claims data fit our out-of-consensus call for a cyclical rebound to lift job growth and output over the next six to eight quarters, which is the driver of the rate hikes in our forecast, since it arrives at a time when the economy is already operating at full employment.
The activity surveys pointed the same direction. The S&P Global flash composite index for July jumped to 53.6 from 51.9, an eight-month high, with services doing the work at 53.6 against 51.2 in June and manufacturing about flat at 53.8. S&P Global’s Chris Williamson read the survey as consistent with growth near a 2.0% annualized pace in the third quarter, against the 1.2% the survey signaled for the second. Employment rose marginally after two months of decline. The price detail underneath was considerably less friendly. Input cost inflation reached a fourteen-month high, services-led, on energy, shipping and tariffs, and selling-price inflation accelerated to its steepest pace since August 2022, with services charge inflation near a four-year peak. Firms that spent the spring absorbing higher costs have started passing them along.
Durable goods orders landed this morning and cut the same way. Headline orders rose 0.3% in June against a 1.6% consensus, held down by transportation, while orders excluding transportation rose 0.6%. The number that matters for the growth arithmetic was better than the headline: core capital goods orders rose 0.9% against a 0.5% consensus and core shipments jumped 1.9%, which feeds directly into equipment spending in Thursday’s advance estimate of second-quarter output. May was revised up across the board. Business investment is not what is soft.
Housing again ran against the grain. New home sales rose 1.6% in June to a 628,000 annual pace, better than the 610,000 consensus but 5.6% below a year ago, with the median price down 2.7% over the year to $398,300 and inventory at 9.3 months’ supply. Builders are carrying a record number of homes that have been authorized but not started, which is what a cautious builder does when the sales pace will not support the next foundation. The South, which accounts for most of the nation’s population growth, was the exception within the exception, at a 412,000 pace and up 9.9% for the month, the strongest region in the country.
The AI Trade Got Its Capital Spending Bill
Thursday’s selloff had nothing to do with Iran. Alphabet reported Wednesday evening with revenue of $119.8 billion, up 24%, and Google Cloud up 82% to $24.8 billion against a $514 billion backlog, and the stock fell 7.1% anyway. Second-quarter capital spending came in at $44.9 billion, roughly double a year earlier, and management raised full-year guidance to a range of $195 billion to $205 billion from $180 billion to $190 billion, well above the $188 billion the Street carried. Free cash flow swung to negative $5.9 billion from positive $10.4 billion, the first negative quarter since the company went public in 2004, and the chief financial officer said capital spending will rise significantly again in 2027. At the midpoint of the new guidance, Alphabet is spending roughly 42 cents of every revenue dollar on plant, a ratio more familiar from regulated utilities than from software companies.
Tesla reported the same evening, logging record 480,126 deliveries and revenue of $28.24 billion, up 26%, but still missed badly on the bottom line at $0.33 a share against roughly $0.52 expected. Operating income fell 57% to $398 million and the operating margin slid to 1.4% from 4.1%, while capital spending rose 142% to $5.79 billion and free cash flow turned negative for the first time in more than two years. The stock fell 14.5% Thursday, erasing roughly $140 billion of market value, and the Nasdaq fell 2.15% in its worst session since April 2025. Intel made the point most cleanly. It beat on Thursday evening with revenue of $16.13 billion, up 25%, and earnings of $0.42 against $0.22 expected, rose as much as 13% after hours, and closed Friday down 6.5%.
The earnings season underneath all this is quite strong. With 27% of the index reported, 86% have beaten on earnings against a five-year average of 78%, and 80% have beaten on revenue against an average of 70%. Blended revenue growth of 13.2% is the best since 2022. Investors are not questioning the demand. The question has moved to who funds the capacity that serves it, and for how long. Alphabet’s answer, 42 cents of every revenue dollar with more promised for 2027, is what the market will price against when Microsoft, Meta and Apple report this week.
Lessons from the South
The South is running the country’s data center experiment first, which makes it the most useful read available on how the buildout goes everywhere else. The region’s June employment report landed Tuesday and looked much as it has all year. Unemployment rates ran from 3.2% in Alabama and 3.4% in Georgia up to 4.4% in South Carolina and Texas and 4.7% in Florida, against 4.2% nationally. Texas was the only state in the region with a statistically significant monthly payroll gain (+43,400), and one of only four in the country. North Carolina added 62,900 jobs over the year (+1.2%), though manufacturing gave back 10,000 of them. Virginia was the outlier, shedding 43,600 jobs over the year (-1.0%) with participation slipping to 63.1%. The lesson generalizes past the map: the labor market is tight where private capital is landing and soft where federal payrolls dominate, and that divergence is about employer mix rather than geography.
The first lesson from the buildout itself is about the arithmetic of the jobs. OpenAI announced a $20 billion campus in Effingham County, Georgia on Wednesday, with 3.2 gigawatts contracted from Georgia Power under a 25-year agreement phased from 2028 through 2032, and about 400 permanent jobs at opening rising to 1,000 by 2032. Meta began operations at a $1.2 billion campus in Temple, Texas with 100 permanent jobs. Google filed for two Vernon, Texas facilities at $1 billion combined, CyrusOne announced a sixth San Antonio campus at $500 million, and Hut 8 leased 352 megawatts at Beacon Point to take that campus to a fully leased 704. These are capital projects rather than employment projects, and a county evaluating one on direct payroll will always be disappointed. Cushman & Wakefield published useful work on Monday putting the indirect effect at roughly 1,300 local jobs and $110 million of annual wages per 100 megawatts, which is the honest case for the buildout, and it rests on the supply chain and the tax base rather than on the badge scans at the fence line.
The second lesson is that the binding constraint is electricity, and the fight is over who pays for it. Georgia Public Service Commission staff have warned that the special industrial pricing structure could raise the average residential bill by as much as 11% by 2028. North Carolina’s attorney general rejected the Duke Energy Carolinas rate settlement on Tuesday, which would raise residential rates about 9.5% over two years against Duke’s original 18% request. "We did our own independent analysis of what Duke will need to meet demand, and we think they overshot the mark," Jeff Jackson said, and his approval is not legally required. Virginia’s commission is weighing how much transmission cost data centers should carry. The clearest signal came from the grid itself: PJM’s capacity auction for 2028 and 2029 cleared at $325 per megawatt-day, and for the first time in the market’s history the entire regional transmission organization fell short of its reliability requirement, by 6,831 megawatts.
The third lesson is that the local veto works, and it is spreading faster than the projects are. More than two dozen North Carolina counties and cities have passed moratoriums, and more than twenty Florida jurisdictions have rejected projects outright. Spartanburg County, South Carolina passed the second reading of a one-year moratorium unanimously on Monday before a standing-room crowd. Dougherty County, Georgia approved a 45-day pause, Albany is weighing six to eighteen months, and Frederick County, Virginia is drafting an ordinance that would remove data centers as an allowed use in every zoning district. In Texas, Diode Ventures withdrew a Henderson County project on Thursday after residents objected to a projected 5 million gallons a day of lake water, and Governor Abbott sided with the residents rather than the developer. Capital is arriving in jurisdictions that in many cases have no zoning authority and no experience negotiating with counterparties this size, and the response has been the only tool those jurisdictions have.
The leverage runs the other way too, and the veto is what created it. What the hyperscalers are short of is increasingly firm power and water rather than land, and a county that has both, and that arrives at the table already understanding the load, the water draw and the tax arithmetic, now negotiates from a much stronger position than it would have two years ago. A community in revolt can block a project, but it cannot bargain with one. Effingham County shows what the bargaining produces. Alongside the property tax abatement, OpenAI put up an $80 million community fund and $71 million in software credits for Georgia college students, and proposed a compact carrying annual independent audits, though it has not named the auditor.
The Power Bill Becomes a Midterm Issue
The politics caught up on Thursday and Friday. The Tennessee Valley Authority signed the administration’s Ratepayer Protection Pledge on Thursday, with chief executive Mike Skaggs committing to keep data center costs off the bills of the ten million people TVA serves and noting that data center load is expected to double by 2030. Twenty-three Republican governors signed on Friday, including Brian Kemp and Henry McMaster, while Ron DeSantis, Kelly Ayotte and Phil Scott declined. The pledge now carries 188 signatories, 106 of them rural cooperatives, alongside Google, Microsoft, Meta, Oracle, xAI, OpenAI and Amazon. The week before, the House Energy and Commerce Committee had sent the bipartisan Ratepayer Protection Act to the floor by a vote of 52 to nothing. A unanimous committee vote in late July of an election year is a tell. Both parties have read the same polling, and the industry signed because being at the table beats being on the menu.
The bill itself is narrower than the coverage suggests, and the gap matters. H.R. 9340, from Gabe Evans of Colorado and Kathy Castor of Florida, amends the Public Utility Regulatory Policies Act to require states to consider a ratemaking standard under which loads of 100 megawatts or more at a single site cover the full incremental cost of the generation, transmission and distribution needed to serve them. Consider is the operative verb. It is a consideration mandate rather than federal preemption, the Senate companion has no markup scheduled, and the pledge itself is voluntary. North Carolina’s attorney general put the enforceability problem more plainly than any analyst has: a promise in Washington does not lower a power bill in North Carolina. He and Governor Stein are pressing to convert the federal pledge into a binding tariff at the state commission, which is where this will actually be decided.
The timing is not mysterious. The two prices American households can quote from memory are both moving the wrong way at once. Gasoline crossed $4.00 on July 20 and reached $4.091 by Thursday, up 94 cents from a year ago, and the pump is a war problem that no administration can fix on a political calendar. The electricity bill is a problem it can be seen acting on. The polling has moved fast: Emerson College, in the field July 19 and 20, found 63% of likely voters opposed to an AI data center in their own community, against 42% last December. The empirical case exists too. Council incumbents in Spartanburg County who approved data center tax breaks lost their primaries in June, and a late retreat to a moratorium did not save them. Texas shows how quickly this nationalizes, with the Senate nominee calling for repeal of the state’s data center sales tax exemption, the gubernatorial nominee calling for a moratorium until the Legislature returns in January, and Governor Abbott separately proposing to repeal the exemption himself.
Two findings complicate the tidy version of this story, and both are worth carrying. Gallup finds that only about 15% of the people who object to data centers cite higher utility bills as their reason, which suggests the opposition is at least as much about water, noise, land and the sense of being negotiated around as it is about price. And new work from the Electric Power Research Institute finds that between 2015 and 2024 data center expansion was associated with lower retail electricity prices rather than higher ones, on the order of a 3.5% national decline for each doubling of capacity, as fixed costs spread across a larger base. The authors supply their own caveat, which is the one that matters here: if the grid builds for demand that does not arrive, the arithmetic runs the other way. That is the real risk in the buildout, and it is not the one the pledge addresses.
For the economy, none of this stops anything already under construction. Data center building has been one of the few genuinely strong categories of nonresidential construction while offices and retail sit out, and that contribution is locked in for 2026. The exposure is to what gets sited in 2027 and 2028, and a slower approval pace would land on the category that has been carrying the sector. That is a growth question for next year and the year after, not for this quarter, which is precisely why it is easy to underweight now.
For financial markets, the AI trade has picked up a second risk this month that was not priced at the start of the year. The first is return on capital, which is what Alphabet’s negative free cash flow quarter surfaced on Wednesday. The second is permission, which is what Henderson County surfaced on Thursday. Neither is a demand question, and that distinction is what makes them harder to underwrite than a soft revenue print. The test arrives Wednesday evening, when Meta reports against capital spending guidance of $125 billion to $145 billion for this year, a number large enough that the political conversation will move with it. Utilities carry the mirror image of the same risk, since the earnings case for large-load growth rests on cost allocations that state commissions and now a congressional committee are actively revisiting.
For policy, the cost allocation question has jumped from state dockets to a bipartisan bill, and whatever emerges will set the terms for a decade of load growth. For the Fed, the relevance is narrower but real. Household utility bills carry more weight in how people describe inflation than they do in the index itself, and a year of rising power bills would complicate the argument that this inflation episode is a war shock that unwinds on its own. We do not expect the pledge to stop a single project already in the ground. We do expect it to change what gets approved between now and November, and the projects most likely to slip are the ones whose economics assumed a friendly county commission.
Trading Efficiency for Security, and Not Yet Getting It
The slowest-moving story in this letter is probably the most consequential, and the war has made it harder to argue with. Firms and governments are rebuilding supply chains around security rather than cost, and the reallocation has been fast. China’s share of American goods imports has fallen from 21.6% in 2017 to about 9% last year and roughly 7% through April, while Mexico has risen to nearly 16% and Vietnam to almost 7%. The reallocation is not free, and that is the entire point. Laura Alfaro and Davin Chor, in work published through the National Bureau of Economic Research, find that where China lost five percentage points of share in a product, unit values rose 9.8% from Vietnam, 3.2% from Mexico and 2.3% from high-income Asia. Buying somewhere other than the cheapest place costs more. That is the efficiency being traded away.
What the money has not yet bought is the security. Research at the Bank for International Settlements finds that the average supply chain got longer rather than shorter after 2021, from 9.67 links to 10.03, with no increase in the number of suppliers per firm. Federal Reserve staff reported this month that Chinese-owned firms have gone from 11% to 25% of Vietnam’s exports to the United States while domestic Vietnamese firms fell from 33% to 23%, which is production changing address rather than dependence changing hands. And the buffer stocks never appeared. Adjusted for inflation, business inventories relative to sales sit below where they stood in December 2019 and roughly level with 2018, and the Richmond Fed finds no structural difference in inventory management before and after the pandemic. Six years after the chains broke, American business carries no more cushion than it did going in.
The inflation arithmetic deserves more precision than it usually gets. Most of what has been measured is a price level, not a rate. The European Central Bank’s modelling of fragmentation along geopolitical lines puts the effect at roughly 5% on global consumer prices in the short run and about 1% in the long run, and Federal Reserve staff put the entire tariff round at 0.8% on core personal consumption expenditure prices. Core goods prices are running 0.8% above a year ago, which is where a structural break would show up first and does not. The stronger version of the argument is not that reconfiguration adds to inflation every year. It is that it takes the give out of the supply side, so a given increase in demand produces more inflation than it would have in 2015. That is precisely the setup we expect: a cyclical rebound arriving at full employment against a supply curve with less slack in it than the last one had.
The interest rate conclusion is right, and the reason is not the one usually given. The Richmond Fed’s estimate of the neutral real rate rose from 1.33% in 2021 to 2.17% in mid-2024 and sits at 1.74% now, and the committee’s own longer-run projection implies a real rate near 1.1% against roughly half that before 2022. But the capital demand doing the work is not coming from factories. Manufacturing construction peaked at a $250 billion annual rate in September 2024 and has fallen to $175 billion, down 30%, with manufacturing payrolls still below where they stood in February 2020. Data center construction is running near a $50 billion annual rate and up more than a third over the year, and the five largest hyperscalers will spend more than a trillion dollars on artificial intelligence capital across 2025 and 2026. The construction boom did not end. It moved from factories to server halls. If real rates are structurally higher for the next decade, the buildout described three sections above is a larger part of the reason than the one described here, and both are the same story: capital being spent on something other than the cheapest way to make a thing.
What CFOs and Treasurers Should Do Now
Extend the contingency review to the Red Sea. Red Sea war-risk premia tripled in a week and the Bab el-Mandeb threat level was raised on Thursday. Freight surcharges reset weekly and pass through faster than contract rates, so routing alternatives and war-risk coverage should be priced as sticky through year-end rather than as an episodic add-on.
Use this break to hedge, rather than to celebrate. On-highway diesel rose 34 cents in a single week and is up $1.32 over the year, running well ahead of gasoline, and the pump has not yet seen the crude decline. Monday’s six-dollar break in the barrel is the cheapest calendar 2027 distillate and jet coverage anyone has been offered in two weeks, and it is priced off a pause that neither side has put terms under.
Term out funding now, and stop waiting for cuts. Credit spreads did not widen with equities, with high yield holding near 268 basis points through the drawdown, and the beat rate is running at 86%. With hike odds near one third and September pricing above 80%, the issuance window is more likely to narrow than to widen.
Reprice contracts before the surveys make it obvious. Selling-price inflation is at its steepest since August 2022 and services charge inflation is near a four-year peak. Firms that have been holding price to protect volume are about to find their competitors have stopped.
Scrutinize capital plans the way the market just did. Two of the country’s largest capital allocators were punished this week for what they are spending, and both had beaten on revenue. Boards should expect the same question, and the answer needs to include the payback period and the free cash flow bridge, not the strategic rationale alone.
Price siting and permitting risk as a real line item. Any capital plan that depends on a county commission, a water allocation or an interconnection queue now carries schedule risk it did not carry a year ago, and the approval calendar between now and November is the tightest part of it. Build the delay case, and know which jurisdictions have already moved.
The world is trading efficiency for security, and has not bought the security yet. Near-shoring and friend-shoring are supplementing re-shoring, and the reallocation is real, but chains have lengthened rather than shortened and the inventory buffers never arrived. Plan for a supply side with less give in it, which means firmer underlying inflation and higher underlying real rates, and audit whether your own diversification moved the dependence or only the address.
Budget for tight labor even with hiring soft. Claims at 187,000 are a 57-year low and the flash survey showed employment turning up after two months of decline. Wage pressure in labor-intensive functions is not going to ease because the payroll headline is modest.
The Week Ahead
The Fed has the week to itself. The Federal Open Market Committee announces Wednesday at two o’clock without updated projections, which puts the whole burden on the statement language and Chair Warsh’s press conference. A hold would be the fifth consecutive one, and the interesting question is the dissents, which for the first time in this cycle are expected to run hawkish. Second-quarter gross domestic product and the June personal consumption expenditures deflator both arrive Thursday morning, and the deflator is the one that matters for September. Home price indexes and consumer confidence come Tuesday, metro-area employment Wednesday, and the employment cost index Friday. The Atlanta Fed’s nowcast updates today off this morning’s durable goods, having sat at 1.7% since July 17.
Microsoft and Meta report Wednesday after the close and Apple and Amazon follow Thursday, which will tell us whether Alphabet’s capital budget was an outlier or a template. The geopolitical calendar is heavier than the economic one. Prime Minister Netanyahu is at the White House Wednesday, the United States and United Kingdom are convening an international conference this week on protecting the strait and clearing mines, and OPEC+ meets Sunday, August 2, with roughly 188,000 barrels a day of additional September supply expected and very little behind it.
Two things outside the calendar will matter more. We will be watching the transit count through Hormuz, which has not moved off two or three ships a day despite the pause, and whether the Saudi-Houthi exchange finds a floor after the weekend strikes on Jizan and Yanbu. Neither will appear on an economic calendar, and both will do more to set the third quarter than anything that does. The pause is the market’s story this morning. The strait is still the economy’s.
U.S. Economic & Financial Outlook
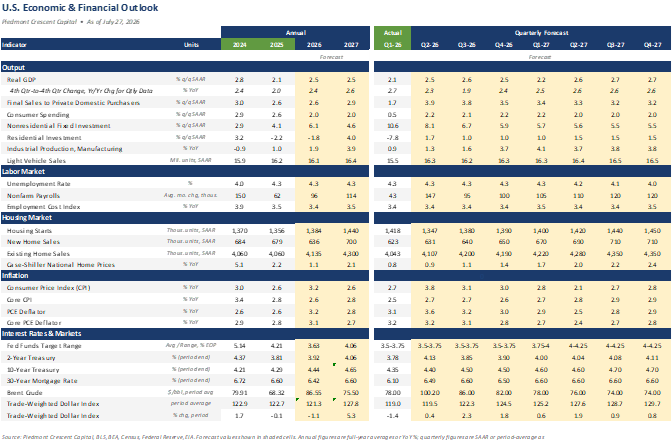
Source: Piedmont Crescent Capital, BLS, BEA, Census, Federal Reserve, EIA. Forecast values shown in shaded cells. Annual figures are full-year averages or year-over-year percent changes; quarterly figures are seasonally adjusted annual rates or period averages as noted in Units.
Forecast disclaimer: The projections above reflect Piedmont Crescent Capital’s views as of the date shown and are subject to change without notice. They are provided for informational purposes only, are not a guarantee of future results, and do not constitute investment advice or a recommendation to buy or sell any security. Actual outcomes may differ materially.
Mark P. Vitner – President & Chief Economist, Piedmont Crescent Capital
mark.vitner@piedmontcrescentcapital.com · (704) 458-4000
About Piedmont Crescent Capital. Piedmont Crescent Capital provides economic research and advisory services covering U.S. and regional economic conditions, financial markets, housing and commercial real estate. A View from the Piedmont is published weekly. Sources: U.S. Bureau of Labor Statistics; U.S. Census Bureau; U.S. Department of Labor; U.S. Energy Information Administration; International Energy Agency; Federal Reserve Board; Federal Reserve Bank of Atlanta; S&P Global; FactSet; AAA; UKMTO/Joint Maritime Information Center; PJM Interconnection; Bank for International Settlements; European Central Bank; Federal Reserve Banks of Richmond and Atlanta; Georgia and North Carolina utility regulators; Cushman & Wakefield; company reports. Market levels are Friday, July 24, 2026 closes unless noted; Monday figures are as of 10:30 a.m. ET, July 27, 2026. Chart sources appear beneath each exhibit. This commentary is for informational purposes only and does not constitute investment advice. © 2026 Piedmont Crescent Capital, LLC. All rights reserved.
The CAVU Compass: July 2026
Strait Out of Hormuz
Renewed Fears at the Pump and Growing Concerns That the AI Boom Will Not Be Profitable Enough to Justify the Investment Boom
Inflation Finally Broke the Fed’s Way. Payrolls Slowed, but So Has Labor Supply. The Truce Is Fraying at Sea and the AI Trade Is Being Repriced. We Hold Our No-Cut Base Case, with Risks Now Roughly Balanced.
This Month's Key Points
- The energy refund arrived at the register. June CPI fell 0.4%, the largest one-month decline since April 2020, pulling the annual rate down to 3.5% from 4.2% as gasoline dropped 9.7%. Core prices were flat on the month, easing the core rate to 2.6%, and producer prices fell 0.3%, taking annual PPI to 5.5% in its first deceleration in five months. Our HP-filtered estimate of trend core inflation eased to roughly 2.6%, and the spread across the four underlying-inflation gauges we track is now the narrowest of the cycle. The war-driven price spike is being refunded, at least partially for now.
- Payrolls slowed to 57,000 in June, and the labor market still tightened. April and May were revised down a combined 74,000, yet the unemployment rate fell to 4.2% as the participation rate slid to 61.5%, the lowest since March 2021. With Fed staff research putting labor force growth below 10,000 per month, a 57k print remains above breakeven. Jobless claims fell to 208,000 in mid-July. Leisure and hospitality shed 61,000 jobs on slower-than-usual seasonal hiring; the drop might also reflect an earlier than usual pickup in hiring, reflecting an early Memorial Day, as well as hiring ahead of the World Cup.
- The cyclical broadening is intact, but the second quarter carries an asterisk. ISM Manufacturing posted its sixth consecutive expansionary reading at 53.3 in June, and core retail sales rose 0.5% on top of May’s outsized 0.8% gain. Yet the Atlanta Fed’s GDPNow is tracking Q2 at 1.7% as of this morning’s update, lifted by the housing starts surge but still well below the spring pace. We read the gap as largely war distortion working through trade, inventories and energy-squeezed consumption, and we hold our above-consensus 2.5% full-year growth call, while conceding the risks around it are no longer tilted higher.
- The AI trade is being repriced, not repealed. Semiconductor shares are roughly 20% off their recent highs, Netflix fell double digits on earnings, and the S&P 500 has backed off the June 2 record of 7,621. The 10-Year completed a round trip, touching 4.62% Monday before rallying to the mid-4.50s as the inflation data cooled and safe-haven flows returned. Futures-implied odds of a July hike collapsed to roughly 17% from north of 40% after CPI.
- The truce frayed badly at sea. After Iranian attacks on commercial shipping, US forces have struck Iranian targets on six consecutive nights and the IRGC has again declared the Strait of Hormuz closed. Brent traded from a July 2 low of $68.53 back to roughly $87 by Friday afternoon. Senator Lindsey Graham’s sudden passing, one day after announcing a White House-endorsed agreement on his Russia sanctions bill, has accelerated momentum toward secondary sanctions on Russian oil buyers, one more reason a risk premium stays embedded in crude.
- Our scenario probabilities move to 55/15/30 from 60/20/20. The base case still has the flare-up contained, diplomacy resuming and the Warsh Fed on an extended hold, with no cut in 2026 and the next move a hike, which our updated forecast pencils in for the first half of 2027. But the re-closure of the strait forces us to carry a fatter adverse tail than we did in June.
Market Snapshot
| Indicator | Level | Context |
|---|---|---|
| Brent Crude | ~$87 / bbl | Up about 3% Friday after the reported strike on Kuwaiti water infrastructure; still well below the April peak of $138. Our base case has Brent settling near $78 by year-end, with upside risk while the strait stays shut. |
| WTI Crude | ~$81.50 / bbl | Rose about 3% Friday on the renewed fighting in the Gulf. |
| 10-Year Treasury | 4.54% | Touched 4.62% Monday, then rallied on the soft CPI and PPI and Friday’s safety bid; the term premium keeps our year-end base case at 4.40% with 4.70% upside. |
| 30-Year Fixed Mortgage | 6.55% | Freddie Mac weekly average, up from 6.49%; housing stays cooler-for-longer until spreads narrow. |
| Fed Funds Target | 3.50–3.75% | Hold expected July 28–29; market-implied July hike odds collapsed to ~17% from north of 40% after CPI. |
| Headline CPI (June) | 3.5% YoY | Fell 0.4% on the month, the largest decline since April 2020; energy did nearly all the work, in reverse this time. |
| Core CPI (June) | 2.6% YoY | Flat on the month; ex food, shelter and energy, prices fell 0.1% and are up just 2.1% over the year. |
| PCC HP-Filter Trend | 2.6% | Our trend estimate of underlying core inflation; Cleveland trimmed measures 2.6–2.7%, Dallas trimmed mean PCE 2.4%. The gauges are converging on the mid-twos. |
| Headline PPI (June) | 5.5% YoY | Fell 0.3% on the month, the largest decline in over a year; core PPI at 4.7%. |
| June Payrolls | +57k / 4.2% | April-May revised down 74k; unemployment fell on a participation slump to 61.5%. Above breakeven even at 57k. |
| ISM Manufacturing | 53.3 | Sixth straight month of expansion, off May’s four-year high of 54.0. |
| Atlanta Fed GDPNow (Q2) | 1.7% | Raised from 1.3% in this morning’s update on the housing starts surge; the war-distorted quarter. We look for a stronger second half as fuel-price relief repairs purchasing power. |
| Housing Starts (June) | 1.427M | +19% on the month, nearly all of it coming from the volatile multifamily segment (513k); single-family slipped to 895k and permits fell 3.0%. |
| UMich Sentiment (July prelim) | 54.4 | Released this morning; a five-month high, up from 49.5 in June, with one-year inflation expectations easing to 4.2% from 4.6%. |
| S&P 500 | Off record highs | June 2 record of 7,621; semiconductors in a ~20% correction as the AI trade reprices against a higher cost of capital. |
Sources: BLS, BEA, Census, EIA, Freddie Mac, CME Group, Atlanta Fed, ISM, FactSet. As of midday Friday, July 17, 2026.
“The refund is arriving at the register just as the risk premium rebuilds at sea. The Fed can be patient with both. It cannot print oil, and it should not tax a capital cycle to fight a fuel surcharge that is already being rebated.”
— Mark P. Vitner, Chief Economist, Piedmont Crescent Capital
The Macro Backdrop: The Refund and the Reprieve
A month ago we argued the war piece of the economy was beginning to take a back seat to the cyclical piece. June’s data delivered the evidence, and July’s geopolitics promptly complicated it. The June CPI fell 0.4%, as gasoline handed back 9.7% and the annual rate dropped to 3.5% from May’s 4.2%. Producer prices fell 0.3%, with the annual rate easing for the first time in five months. Real average hourly earnings jumped 0.8% in June and turned positive over the year for the first time since the war began. The imported tax we have described all year is being partially refunded, and the refund is landing first on the households that paid the most regressive share of it.
At the same time, the re-closure of the Strait of Hormuz has interrupted the energy normalization that made the refund possible. Brent has climbed from $68.53 on July 2 back to roughly $87, tanker throughput through the strait has fallen to a small fraction of normal, and no large commercial vessels have broadcast positions along the strait’s southern route since July 7. Fading pass-through at the register and a rebuilding risk premium at sea frame this month’s outlook, and they are why we carry both a friendlier inflation forecast and a fatter adverse tail than we did in June.
The deeper story has not changed. This remains a capital-led, employment-light expansion, powered by AI infrastructure, reshoring, defense replenishment and the productivity gains they finance. The manufacturing recession of 2024–2025 is fading away: ISM Manufacturing has now expanded six consecutive months. What is new is that the market is finally asking the capital cycle to justify its cost of capital, with semiconductor shares roughly 20% off their highs. We view that repricing as a test of valuations rather than of the underlying investment demand, which continues to show up in orders, backlogs and power procurement.
The Labor Market: Soft Prints, Tight Market
Employers added 57,000 jobs in June, roughly half the consensus, and April and May were revised down a combined 74,000. The unemployment rate fell anyway, sliding to 4.2%. The reconciliation of those two facts is the single most important thing to understand about this labor market: the labor force is barely growing. Participation slid 0.3 percentage points to 61.5%, the lowest since March 2021, as demographics and the immigration reversal both work against supply. Fed staff research puts labor force growth below 10,000 workers per month, which means breakeven payrolls sit near zero. A 57k month does not loosen this market; arithmetically, it tightened it. We suspect that the Fed staff’s estimate is too low but even if breakeven payrolls is near 50,000 jobs a month, job growth is still likely to exceed that pace, leading to higher wages and higher inflation.
The composition tells the same story we told last month, in reverse. Leisure and hospitality shed 61,000 jobs on slower-than-usual seasonal hiring, the beginning of the World Cup giveback we warned readers to expect, as an unusually early Memorial Day and the World Cup lifted hiring at restaurants and bars a little sooner than usual, which was amplified by seasonal adjustment. Professional and business services added 36,000 jobs, social assistance 25,000 and health care 22,000. Jobless claims fell to 208,000 in the July 11 week, and the Beige Book described employment rising on balance across the districts. Layoffs remain rare, hiring is deliberate and the labor supply behind both has stopped growing, which is why soft-looking payroll prints keep coinciding with a falling unemployment rate.
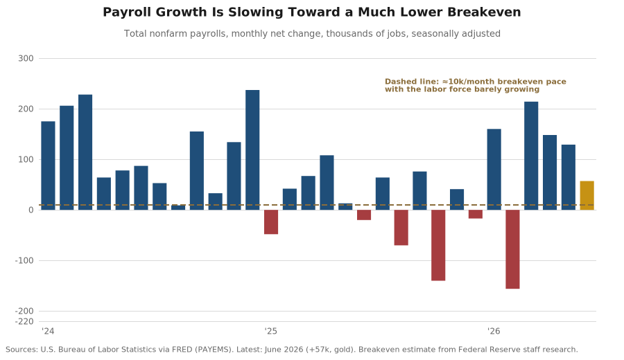
Inflation: The Refund Arrives, the Trend Converges
June’s inflation reports were the best of the cycle, and the details were more persuasive than the headline. The 0.4% headline decline was almost entirely energy driven: the energy index fell 5.7%, gasoline 9.7% and fuel oil 9.2%. But core prices were flat on the month (against expectations for a 0.2% rise) and the annual core rate eased to 2.6% from 2.9%. Strip out food, shelter and energy and prices actually fell 0.1% in June, leaving that cleanest cut up just 2.1% over the year. Shelter rose 0.1%, the smallest monthly increase since January 2021, with rent of primary residence slowing to 2.8% annually. Motor vehicle insurance fell a further 2.0% and is now down 4.1% over the year, an underappreciated source of disinflation in the core.
Our HP-filtered estimate of trend core inflation eased to roughly 2.6% in June from 2.8% in May, extending an almost unbroken glide from 3.4% a year ago. The convergence across gauges is the real news: the Cleveland Fed’s trimmed measures now sit at 2.6–2.7% on a trailing basis, the Dallas trimmed mean PCE at 2.4% through May, and the spread across all four measures is the narrowest of the cycle. When the gauges that make different compromises in the composition all point to the same mid-twos destination, the trend is the signal. The June PCE report at month-end, the last clean read before the BLS and BEA methodology changes take effect with the August releases, should confirm it. We estimate those changes will trim roughly 0.2 percentage points from measured year-over-year core PCE.
Two caveats keep us from declaring the final mile complete. First, households have not felt it yet: the New York Fed’s one-year inflation expectation rose to 3.7% in June, the highest since September 2023, and the three-year measure hit a four-year high. This morning’s Michigan survey offered the first crack in that wall, however, with one-year expectations easing to 4.2% from 4.6%. Expectations follow lived experience with a lag, and the price level is still a burden even as its rate of change improves. Second, our technology watch item is live. The AI memory-chip shock is arriving the way hedonic indexes receive cost shocks: not as price spikes but as the disappearance of routine deflation. Computers and smart-home equipment are down just 0.8% over a year in a category built to deflate several times that fast. If memory costs stay elevated into the fall, the tech aisle flips from a drag on core goods to a modest contributor just as tariff pass-through fades.
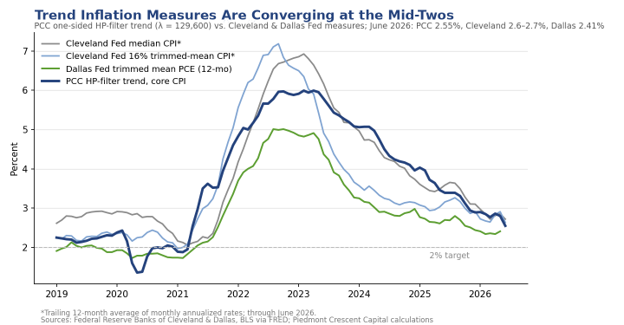
Growth and Housing: Broadening, with a Second-Quarter Asterisk
The cyclical broadening we described in June remains visible in the surveys and the orders data, but the second quarter’s GDP arithmetic will not flatter it. The Atlanta Fed’s GDPNow has Q2 tracking at 1.7% as of this morning’s update, lifted from 1.3% by the housing starts surge, though still down sharply from the 3%+ readings of mid-June. We attribute most of the gap to war distortions: the energy price shock squeezed real consumption in April and May, trade and inventory flows whipsawed around the strait closure, and the June relief arrived too late in the quarter to rescue the average. Retail sales rose 0.2% in June on top of May’s outsized gain, ISM Manufacturing held expansionary at 53.3, industrial production edged up 0.1% in June, and this morning’s preliminary July reading from the University of Michigan showed sentiment jumping to 54.4, a five-month high. Our own tracking puts second quarter growth closer to 2.3%, with final sales to private domestic purchasers rebounding to roughly a 3.5% pace. We hold our 2.5% full-year growth call, which now leans on a stronger second half as cheaper fuel repairs household purchasing power, while conceding that the risks around the call are no longer tilted higher. The renewed Hormuz closure is the swing variable: each month it persists shaves the energy relief that our second-half acceleration depends on.
Housing showed both of its faces in June. Total starts jumped 19% in June to a 1.427 million-unit pace, comfortably beating expectations, and nearly all of the surge was multifamily, which soared to 513,000 after a depressed May. Single-family starts slipped 0.2% to 895,000, permits fell 3.0%, and the Freddie Mac 30-year rate ticked up to 6.55%. The multifamily strength is real: rental demand is firm precisely because the for-sale market is locked up, and developers who shelved projects in the high-rate years are restarting them into tight vacancy. Single-family construction, however, is likely to stay range-bound until mortgage rates break meaningfully below 6.5%, and with the deficit outlook holding the term premium up, that break is unlikely before the Fed’s path clarifies. Existing sales at 4.09 million and flat prices tell the same story: housing turns when rates do, and rates turn on the inflation trend and the strait.
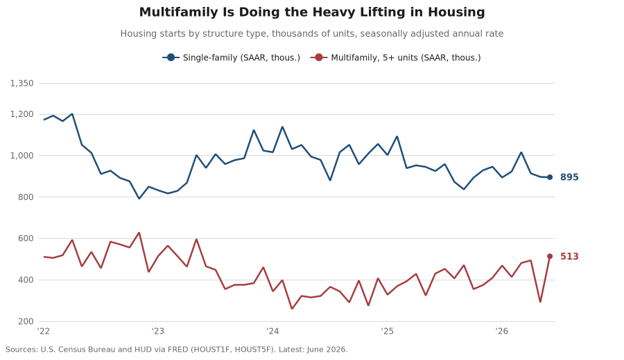
Markets and Rates: The AI Trade Meets the Cost of Capital
The correction we warned about arrived on schedule, and it arrived where we said the risk was concentrated. In June we wrote that a market this concentrated in one theme can correct hard without the economy doing anything wrong. Semiconductor shares are now roughly 20% below their recent highs, the sell-off deepened globally into Friday on a new Chinese model release and fresh questions about hyperscaler capex, and Netflix’s double-digit earnings-day decline showed how little forgiveness is priced into richly valued growth stories. SK Hynix’s record $26.5 billion US listing marked the top of the enthusiasm almost to the day. The S&P 500 has pulled back only modestly from its June 2 record of 7,621, however, with a sharp rotation underneath as financials, industrials and energy absorb the flows leaving the chips.
We would resist the temptation to read the correction as a verdict on the capital cycle. Earnings, not multiples, have carried this market all year; Q1 margins set records and the Q2 season now underway will test whether that holds. The features of durable market tops (speculative mania, deteriorating growth, a flood of issuance, a tightening Fed) remain mostly absent, though the SK Hynix episode shows issuance appetite testing its limits. The bond market, meanwhile, delivered a round trip that validates patience: the 10-Year touched 4.62% on Monday, then rallied through the soft CPI and PPI to the mid-4.50s, with Friday’s safe-haven bid taking yields lower still across the curve. Futures-implied odds of a July hike collapsed from 42% to roughly 17% over two sessions. The term premium story has not gone away (deficits and issuance guarantee that), which is why we hold a 4.40% year-end base case rather than chasing the rally, with 4.70% the upside marker if the adverse scenario materializes.
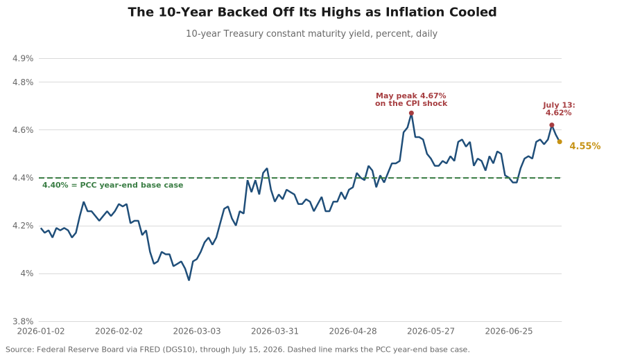
Geopolitics: A Fraying Truce and a Sudden Loss
The June 14 memorandum of understanding is, for practical purposes, lost at sea. After Iranian missile attacks on three commercial vessels transiting the strait, the first such attacks since the MOU was signed, US Central Command has struck Iranian targets on six consecutive nights, more than 300 of them in the first three, including missile and drone sites, naval assets and coastal surveillance positions. Iran claims retaliatory strikes on US facilities across the Gulf, and Kuwait reported an Iranian attack on a power and desalination plant early Friday. The IRGC has again declared the strait closed, and tanker traffic has all but stopped, with no large vessels broadcasting positions along the Oman-hugging southern route since July 7. President Trump has declared the MOU over while insisting talks will continue, and diplomacy is in fact continuing: Foreign Minister Araghchi traveled to Muscat, Oman for talks, Oman has drafted a traffic-management proposal, and Qatari mediators remain engaged. Oil’s measured response (Brent near $87 rather than anywhere near the spring’s $138) suggests the market still expects this flare-up to be contained. We agree, but with less conviction than a month ago, which is what our 30% adverse probability expresses.
Senator Lindsey Graham’s untimely death adds a poignant and consequential twist to the Russia file. Graham died July 11 of an aortic tear at 71, one day after announcing in Kyiv that the White House would support a version of his long-pending sanctions bill, co-authored with Senator Blumenthal. The bill would authorize sweeping tariffs and secondary sanctions on countries purchasing Russian oil and gas, aimed squarely at China, India and Brazil, and colleagues in both parties are urging swift passage as a tribute. Enactment prospects have improved markedly at the very moment Gulf flows are disrupted, stacking a second supply risk on top of Hormuz. The Russia-Ukraine war may be approaching its own inflection as well: Washington has agreed to license Patriot production in Ukraine, Ukrainian long-range drones are striking refineries deep inside Russia, and the Russian economy is flirting with recession and a budget crisis. Both diplomatic momentum and escalation risk are rising at once, which is the environment in which energy and defense markets move fastest. South Carolina’s August 11 special primary begins the contest for Graham’s seat and for the bridge role he played between the administration and the Senate.
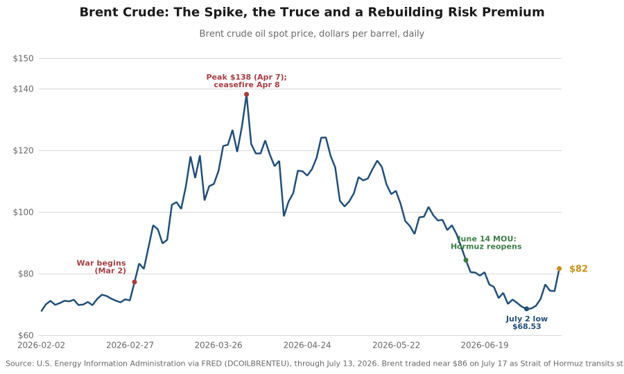
Monetary Policy: Patience, Priced
The July 28–29 FOMC meeting arrives with the decision effectively made and the framing the only live question. A hold keeps the funds rate at 3.50–3.75%, where it has sat all year. What changed this month is the balance of risks around it. In June, the committee’s hawkish projections and the May inflation spike had futures markets pricing 50 basis points of hikes through mid-2027; we called that an overcorrection, and the June CPI proved the point in a single morning, with hike odds collapsing to roughly 17%. Chair Warsh’s semiannual testimony this week walked the line his ECB Forum remarks drew: inflation “too high” but improving, no forward guidance, and a pointed refusal to submit a dot, making him the first chair to withhold one since the plot began in 2012. The June minutes revealed a committee split almost evenly between holders and hikers; the July data should thin the hikers’ ranks considerably.
Our view evolves with the evidence. We hold our no-cut base case for 2026, and we continue to think the next move, whenever it comes, is more likely a hike than a cut, driven by growth pressing into a full-employment labor market with no labor supply behind it. Our updated forecast now pencils in the first quarter-point hike in the first quarter of 2027 and a second by midyear, taking the funds rate to 4.00–4.25%, earlier than the late-2027-or-2028 timing we carried in June. But the June report removed the near-term hike tail, and we now describe the risks around the extended hold as roughly balanced rather than tilted toward tightening. Two things could still disturb the patience: an expectations problem (the New York Fed survey’s drift higher is the number we watch most) and a sustained strait closure that re-runs the spring’s energy passthrough. Neither is our base case. The August statistical-methodology changes, which we estimate will trim about 0.2 percentage points from measured core PCE, will complicate the autumn’s inflation debate just as the committee’s patience is being tested; expect hawks and doves alike to claim vindication from the same releases.
CFO & Treasurer Corner
Funding and liquidity: The post-CPI rally reopened the fixed-rate issuance window at better levels than any point since April. With the FOMC on July 28–29 and the strait situation fluid, the two weeks after the meeting may offer the month’s best conditions, or its worst. Issue opportunistically rather than on a calendar. Floating-rate borrowers should stress coverage on hikes beginning in early 2027; our updated forecast has the funds rate at 4.00–4.25% by midyear 2027.
Energy and input costs: The July 2 lows were the year’s best forward-hedging levels, and firms that acted on last month’s guidance to hedge “while forward prices remain well below the spring peaks” are being rewarded. Forwards have risen with spot but remain far below the war highs; treasurers with Gulf-exposed logistics should extend coverage on any diplomatic bounce. Track electronics and memory-chip costs separately from energy: the equity correction in semiconductors does not translate into cheaper components, and contract prices are still rising.
Russia sanctions contingency: Passage of the Graham-Blumenthal bill now looks probable rather than possible. Firms with Chinese, Indian or Brazilian counterparties should map secondary-sanctions exposure through shipping, insurance and settlement chains before enactment forces the exercise on a deadline.
Labor and wages: Discount the July and August payroll prints for World Cup givebacks; June’s leisure and hospitality decline was the preview. Seasonals are likely to play with the leisure and hospitality numbers all summer, as Labor Day comes unusually late, keeping summer workers on the payroll longer than usual. The structural reality is unchanged: no labor supply, scarce-category wage pressure, and productivity as the only sustainable offset. Budget for tight skilled-labor conditions through 2027.
Planning assumption: Base case: an extended Fed hold with no 2026 cut and quarter-point hikes beginning in early 2027, Brent settling near $78 by year-end if diplomacy reasserts itself, the 10-Year near 4.40% and full-year growth near 2.5% on a stronger second half. Keep a strait-stays-closed case (oil above $110, headline inflation re-accelerating, the Fed pinned) live for Q3 board discussions, at 30% rather than 20% weight.
Looking Ahead
| Date | Release / Event | Why It Matters |
|---|---|---|
| Wed, Jul 22 | Existing Home Sales (June) | The rate-sensitive corner’s cleanest read; watch inventory more than sales; supply is the missing ingredient. |
| Fri, Jul 24 | Flash PMIs (July); New Home Sales (June) | First July read on whether the capital-cycle momentum survived the chip correction and the strait re-closure. |
| Tue–Wed, Jul 28–29 | FOMC meeting and press conference | A hold is near-certain. The story is whether the statement acknowledges the improved inflation trend and how Warsh frames the energy tail risk. |
| Thu, Jul 30 | Q2 GDP, advance estimate | The war-distorted quarter. Look through the headline to final sales to private domestic purchasers for the true pulse. |
| Fri, Jul 31 | June PCE deflator; ECI (Q2); Dallas trimmed mean | The last clean read on the Fed’s preferred gauge before August’s methodology changes muddy year-over-year comparisons. |
| Fri, Aug 7 | July Employment Situation | World Cup givebacks begin in earnest. Discount the headline; watch participation and the diffusion indexes. |
Scenario Framework
| Scenario | Macro and Market Implications | Corporate Finance Action |
|---|---|---|
| Base Case (55%) | The flare-up is contained; Muscat-track diplomacy restores a managed reopening of the strait through the fall. Brent settles near $78 by year-end, headline CPI drifts toward 3% as the energy passthrough unwinds, and the HP trend holds in the mid-twos. The Warsh Fed holds all year with no cut; quarter-point hikes follow in the first half of 2027, taking the funds rate to 4.00–4.25% by midyear. The 10-Year finishes near 4.40%; the S&P grinds higher on earnings as the chip correction resolves without spreading. | Lock fixed-rate funding on post-FOMC strength. Maintain productivity-led capex with disciplined hurdle rates. Model no 2026 cut; keep 2027 hike risk in coverage tests. Extend energy hedges on diplomatic bounces. |
| Benign (15%) | A new, more durable agreement reopens the strait quickly. Brent breaks below $70; the energy refund accelerates and headline CPI approaches the core rate by year-end. Real income gains lift the rate-sensitive sectors (single-family housing, autos and other durables) into the broadening, and the Fed’s patience is rewarded with a soft landing on trend. Equities extend gains on breadth, not concentration. | Step up capex against an extended hold. Open the refinancing window fully. Add exposure to energy-sensitive demand recovery and rate-sensitive sectors. |
| Adverse (30%) | The strait stays closed into the autumn or the conflict widens. Brent averages above $110 with spikes higher; headline CPI re-accelerates through 4% and the trimmed gauges follow with a lag. Inflation expectations break higher and the Fed is pinned between imported inflation and a slowing consumer; a hike returns to the table for late 2026. The 10-Year tests 4.70%+ and the chip correction turns into a broader selloff. | Build liquidity now. Stress floating-rate exposure and covenant headroom at 10-Year 4.70%+. Hedge energy and freight aggressively on any dip. Defer non-essential capex; shorten working-capital cycles. |
Forecast Update
Piedmont Crescent Capital | As of July 17, 2026
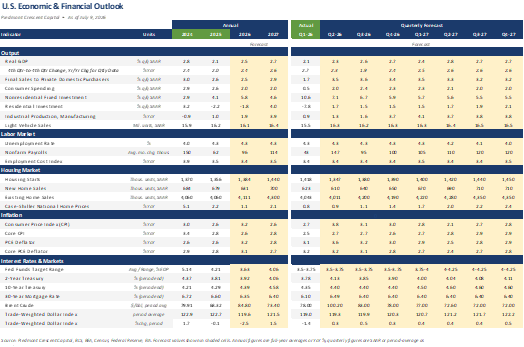
Forecast disclaimer: The projections above reflect Piedmont Crescent Capital’s views as of the date shown, are subject to change without notice and do not constitute investment advice.
Strategic Takeaway
A month ago, we said we might have to stand alone in arguing that the next Fed move would be driven by growth into full employment rather than by the inflation overshoot. June’s data moved the consensus toward us. The overshoot is unwinding on schedule: headline inflation is at 3.5% and falling, core is at 2.6%, and every underlying gauge is converging on the mid-twos. What remains is the framework we have carried all year: a capital cycle broadening beyond AI, a labor force that has stopped growing, a consumer whose real paycheck finally caught a break and a Fed with room to be patient. The complications are the strait, which has re-closed and taken our adverse probability to 30%, and the chip correction. For CFOs: take the improved issuance window seriously, extend energy hedges on diplomatic bounces, map secondary-sanctions exposure before the Graham-Blumenthal bill forces the timeline, and discount the labor headlines seasonal quirks are amplifying. We remain constructive on the expansion, but the second-half acceleration our 2.5% growth call now leans on requires the energy refund to resume, and that will not happen until tankers are again moving freely through the strait.
Mark P. Vitner – Chief Economist, Piedmont Crescent Capital
Questions? Email: CompassReport@cavusecurities.com
About The CAVU Compass. The CAVU Compass is a monthly macroeconomic outlook and market commentary published by CAVU Securities, LLC and Piedmont Crescent Capital. © 2026 CAVU Securities, LLC / Piedmont Crescent Capital. This publication is for informational purposes only and is not a recommendation, offer, or solicitation with respect to any security or other financial product, nor does it constitute investment advice. Forward-looking statements are subject to change at any time; information from external sources has not been verified but is generally considered reliable.
The War Widens, the Barrel Rallies, and the Labor Force Scare That Wasn't
The War Widens, the Barrel Rallies, and the Labor Force Scare That Wasn’t
A View from the Piedmont — Weekly Economic Commentary
Summary
- The truce is gone in all but name. U.S. strikes on Iran ran through a ninth consecutive night, Iran hit U.S. positions in six countries, two American service members were killed and one is missing in Jordan, a third died in Iraqi Kurdistan, and Kuwait reported Iranian strikes on power and water desalination plants three times in three days. Brent finished the week at $88.10, a round trip from $68.53 on July 2.
- The inflation news broke the Fed’s way just in time. June CPI fell 0.4% and PPI fell 0.3%, the friendliest pair of prints since the war began. Hike odds for July collapsed to roughly 17%. We hold our call: no move in 2026, next move a hike in early 2027.
- June’s participation scare is demographics, not discouragement. Prime-age participation is running at 83.7% over the past twelve months, above any comparable stretch between 2002 and the pandemic, and stood at 83.9% as recently as May. The slide in the headline rate reflects Peak 65 retirements and slower immigration. The economy has fewer workers, not fewer willing workers.
- The retiree wave is steadying the consumer. Nearly 53 million Americans age 65 and over now sit outside the labor force, most of them healthy and active, spending from inflation-indexed Social Security, pensions and portfolios rather than paychecks. Happy hour at The Villages arrives on schedule whether the market has a good day or a bad one.
- Equities have an AI problem, not an Iran problem. The S&P 500 slipped 1.9% below its June 2 record as semiconductors sold off on hyperscaler capex worries, even as 88% of early reporters beat on earnings, well above the five-year average, and energy rallied.
Market Snapshot
| Indicator | Level | Our Read |
|---|---|---|
| Brent Crude | $88.10 / bbl | Round trip from $68.53 on July 2. Base case settles near $78 by year-end; upside risk while the strait stays shut. |
| WTI Crude | $82.49 / bbl | Up 4.5% Friday on the Kuwait infrastructure strike. |
| S&P 500 | 7,475.69 | Off 1.9% from the June 2 record; the AI capex question, not the war, is setting the tone. |
| 10-Yr Treasury | 4.55% | Rangebound between safety flows and hike repricing. Year-end base case 4.40%, with 4.70% upside. |
| Gold | ~$4,010 / oz | The safe-haven bid keeps fading; a firm dollar and a hawkish Fed outweigh nine nights of strikes. |
| 30-Yr Mortgage | 6.55% | Cooler-for-longer housing until spreads narrow. |
| Fed Policy | July 28–29 FOMC | No change expected; hike odds repriced to roughly 17% after CPI. No move in 2026; next move a hike, penciled in for early 2027. |
The Truce Is Gone in All but Name
The Gulf conflict widened on every axis last week, and the weekend brought the most serious escalation since the war began in February. U.S. Central Command has now run strikes on Iranian military targets for nine consecutive nights, hitting coastal defense sites, missile batteries and maritime infrastructure. Iran answered with attacks on U.S. positions in Bahrain, Jordan, Kuwait, Oman, Qatar and Syria, killing two American service members in Jordan and leaving a third missing, and struck Kuwaiti power and water desalination plants three times in three days, the first sustained attacks on infrastructure critical to civilian life in a Gulf ally. Sixteen U.S. service members have now been killed and more than 430 wounded since the war began. Washington is reportedly moving dozens of additional refueling aircraft into the region, which keeps a larger strike package on the table. Tehran said Sunday that the ceasefire has effectively collapsed, and President Trump answered by proposing shipping fees on strait transits and restarting the blockade of Iranian ports. Brent traded above $90 in Asian hours Monday, the highest since mid-June. Qatar continues to mediate, but neither side is negotiating from the script that produced the spring ceasefire.
The Strait of Hormuz is functionally impaired even though it is not formally closed. Transits are running near 10 a day against a pre-war norm near 90, nearly all remaining traffic is following the Iranian-directed northern route, shadow-fleet crossings have stopped entirely, and a U.S. Hellfire strike disabled the tanker Belma, a blockade runner, near Kharg Island midweek. CENTCOM disputed Iranian claims that two tankers struck mines, but the dispute itself is the point: war-risk premia, not port authorities, are now rationing the world’s most important oil artery. Iran has also reportedly instructed the Houthis to prepare to disrupt Red Sea shipping if U.S. strikes extend to Iranian power infrastructure. A simultaneous two-strait disruption remains a tail risk rather than a base case, and that is exactly why it belongs in every hedging conversation.
Our scenario probabilities stand at 55/15/30, with risk shifting toward the darker end of the adverse bucket. The base case, at 55%, still has the flare-up contained, diplomacy resuming, and Brent settling near $78 by year-end as the risk premium compresses. The upside scenario, at 15%, has a durable framework agreement pulling crude back into the low $70s. The adverse scenario, at 30%, carries the strait closure into the fall with Brent holding in the $90s or higher, gasoline reclaiming its spring peak, and the June inflation relief proving a one-month reprieve. The weekend’s American casualties and the strike on Kuwaiti civilian infrastructure did not change the probabilities, but they moved the center of gravity within the adverse case.
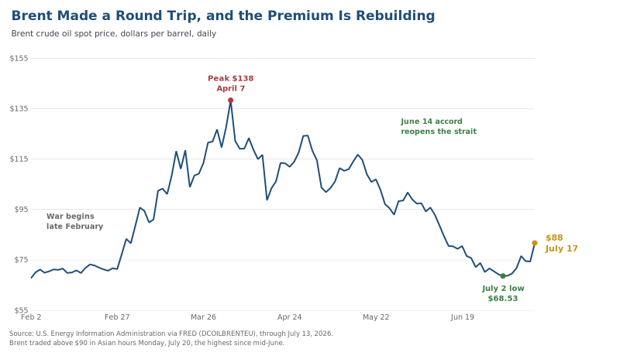
The Inflation News Broke the Fed’s Way, Just in Time
June delivered the friendliest pair of inflation prints since the war began. CPI fell 0.4% on the month, the largest one-month decline since April 2020, pulling the annual rate to 3.5% from 4.2% as gasoline dropped 9.7%. Core prices were flat, easing the core rate to 2.6%. Producer prices fell 0.3%, the first deceleration in five months, though final demand remains up 5.5% from a year ago and stage 2 intermediate demand is up 9.8%, so the pipeline has not cleared. Our HP-filtered estimate of trend core inflation eased to roughly 2.6%, and the spread across the four underlying-inflation gauges we track is the narrowest of this cycle. The war-driven price spike is being refunded, at least partially for now.
The refund is already being clawed back at the wholesale rack. Brent’s two-week rally from $68.53 to $88.10 will reach retail gasoline within weeks, and diesel remains the freight market’s problem regardless. That tug of war frames the July 28–29 FOMC: futures-implied odds of a hike collapsed to roughly 17% after CPI, and we expect a hold with hawkish body language. Our call is unchanged. No move in 2026, and the next move is a hike, penciled in for the first half of 2027 under the Warsh Fed. The committee is not going to validate cut hopes while an oil shock of uncertain duration sits between it and its target.
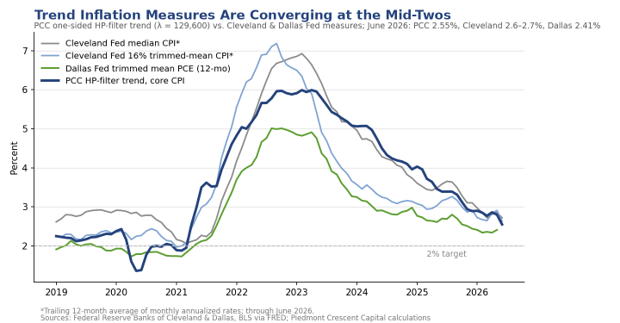
Fewer Workers, Not Fewer Willing Workers
June’s participation scare is demographics, not discouragement, and we take the argument apart in a new Piedmont Perspective this week. The labor force participation rate slid to 61.5% in June, the lowest reading in 50 years outside the pandemic, feeding a narrative that prime-age workers are giving up. The monthly figures deserve skepticism: the household survey covers roughly 60,000 households, June carries seasonal noise as the school year ends, and the updated population controls introduced with the February data removed roughly 1.5 million men, concentrated in the 25-54 age group. The longer-run trend shows prime-age participation remains quite strong. It averaged 83.7% over the past twelve months, higher than any comparable stretch between 2002 and the pandemic, and stood at 83.9% in May and 84.0% in January, readings never reached in the eighteen years before the pandemic. On the same twelve-month basis, the number of 25-54 year olds on the sidelines is near a two-decade low.
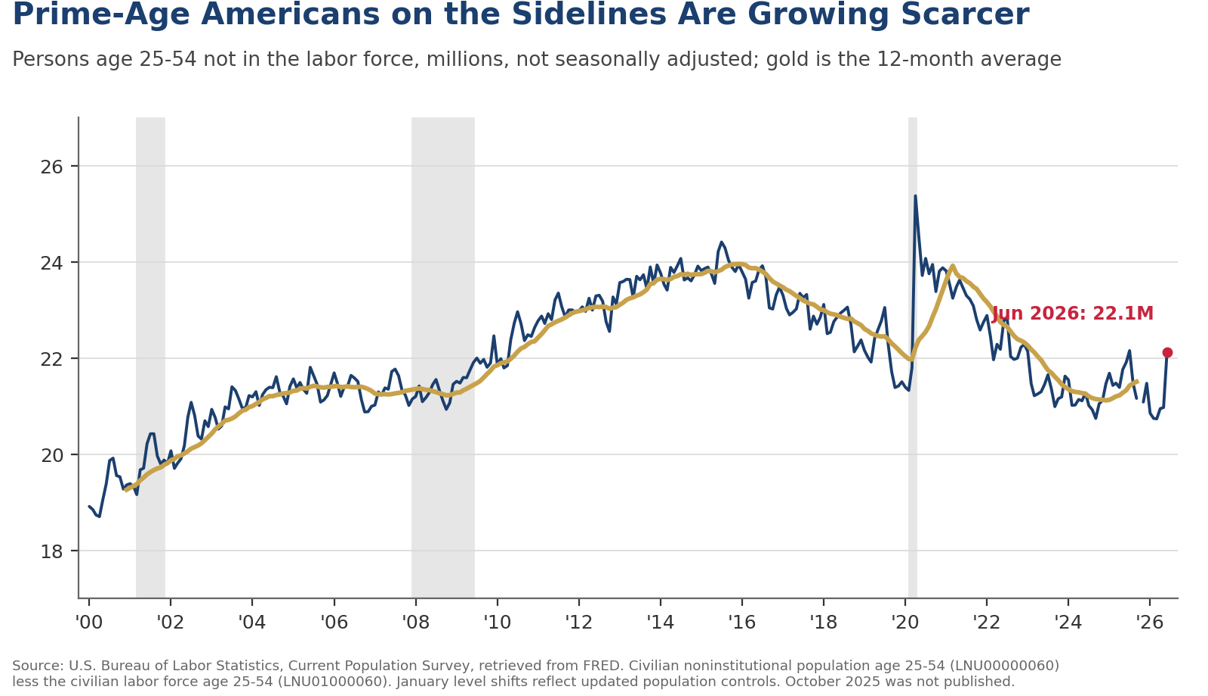
The slide in the headline rate is Peak 65 at work, and the swelling ranks of retirees are steadying the consumer. The number of Americans 65 and over outside the labor force has climbed from 31 million in 2008 to 52.7 million, most of them healthy and active, spending from inflation-indexed Social Security, pensions and portfolios rather than paychecks. Adults 50 and over already account for more than half of U.S. consumer spending, according to AARP, and that spending rests on inflation-indexed benefits rather than paychecks. The economy has fewer workers, not fewer willing workers, and with trend labor force growth below 10,000 per month, a 57,000 payroll print still tightens the labor market. The full analysis, including what the retiree wave means for manufacturers, retailers, restaurateurs, travel, health care, housing and financial services, appears in this week’s Piedmont Perspective.
Equities Have an AI Problem, Not an Iran Problem
The stock market’s July setback traces to the AI trade, not the Gulf. The S&P 500 fell 1.0% Friday to 7,475.69 and sits 1.9% below the June 2 record of 7,621, with the Nasdaq off 1.4% as semiconductors extended a slide driven by worries that hyperscaler capital spending will disappoint. Energy was the only sector to gain Friday, and Travelers jumped 9% on an earnings beat that lifted the insurers. The breadth beneath the surface remains encouraging: 88% of early S&P 500 reporters have topped earnings estimates, against a five-year average of 78%, and eight of eleven sectors rose Thursday even as the indexes fell. Gold tells the same story from the other direction, drifting near $4,010 and down more than a quarter from January’s record despite nine nights of strikes, because a firm dollar and a Fed with a tightening bias are more powerful than the safe-haven bid. Housing rounded out the week’s data with June starts beating expectations while permits fell short, another cooler-for-longer reading with mortgage rates at 6.55%.
What CFOs and Treasurers Should Do Now
Extend energy hedges before the forward curve catches up. The back of the crude curve still prices substantial normalization. Layering calendar 2027 diesel and jet fuel coverage on pullbacks is cheaper insurance than it will be if the strait stays shut through August.
Term out funding while credit windows are open. Spreads remain tight and the earnings beat rate is running at 88%, well above the five-year average. With our rate path pointing up rather than down, opportunistic issuance beats waiting for cuts that are not coming.
Put Hormuz and the Red Sea in the same contingency review. War-risk insurance, freight surcharges and routing alternatives should be priced as sticky through year-end. Surcharges reset weekly and pass through faster than contract rates.
Keep cash working but liquid. Treasury bills near 3.8% remain the treasurer’s friend. Resist reaching for duration in the liquidity book while the term premium is still rebuilding.
Refresh sanctions and counterparty screening. Momentum behind secondary sanctions on Russian oil buyers accelerated last week. Energy and shipping counterparties in the Gulf deserve a fresh compliance pass.
Plan for a tight labor market, not a weak one. The participation decline is a supply story. Budget for continued wage pressure in labor-intensive functions and lean into automation where the business case was marginal a year ago.
The Week Ahead
The calendar is light and the Fed is quiet, which leaves the Gulf in charge. Jobless claims arrive Thursday, with S&P Global flash PMIs and new home sales closing the week Friday. Alphabet and Tesla report Wednesday after the close and Intel follows Thursday, with Alphabet the cleanest read on whether AI capital spending plans survive the chip correction. The Fed is in blackout ahead of the July 28–29 FOMC. The indicators that matter most will not be on the calendar: daily tanker transit counts through the strait, the Kuwaiti response to the desalination plant strike, and whether the Houthi threat to the Red Sea moves from instruction to action. We would also keep an eye on wholesale gasoline, where the war’s second price wave is already forming.
U.S. Economic & Financial Outlook
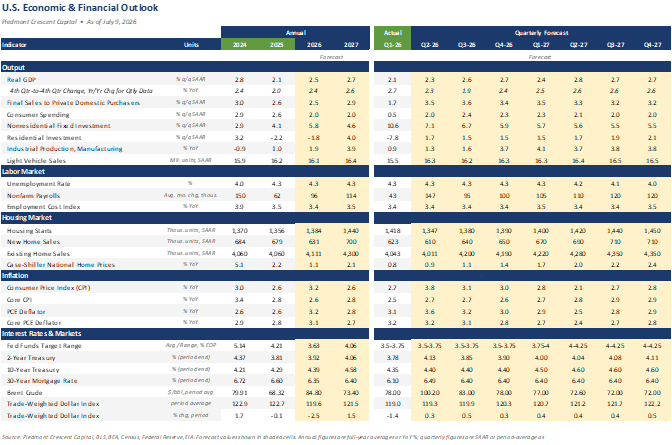
Source: Piedmont Crescent Capital, BLS, BEA, Census, Federal Reserve, EIA. Forecast values shown in shaded cells. Annual figures are full-year averages or year-over-year percent changes; quarterly figures are seasonally adjusted annual rates or period averages as noted in Units.
Forecast disclaimer: The projections above reflect Piedmont Crescent Capital’s views as of the date shown and are subject to change without notice. They are provided for informational purposes only, are not a guarantee of future results, and do not constitute investment advice or a recommendation to buy or sell any security. Actual outcomes may differ materially.
Mark P. Vitner – President & Chief Economist, Piedmont Crescent Capital
mark.vitner@piedmontcrescentcapital.com · (704) 458-4000
About Piedmont Crescent Capital. Piedmont Crescent Capital provides economic research and advisory services covering U.S. and regional economic conditions, financial markets, housing and commercial real estate. A View from the Piedmont is published weekly. Sources: U.S. Bureau of Labor Statistics; U.S. Census Bureau; Federal Reserve; U.S. Social Security Administration; CNBC; Reuters; Trading Economics; company reports. Chart sources appear beneath each exhibit. This commentary is for informational purposes only and does not constitute investment advice. © 2026 Piedmont Crescent Capital, LLC. All rights reserved.
The Piedmont Perspective -- Fewer Workers, Not Fewer Willing Workers
Fewer Workers, Not Fewer Willing Workers
Retirements, not discouragement, are pulling down labor force participation, and the swelling ranks of retirees may be steadying consumer spending
June’s employment report set off a fresh round of hand wringing about workers giving up. The labor force participation rate slid to 61.5%, its lowest reading in 50 years outside the pandemic, and the steepest one-month decline came from prime-age workers between the ages of 25 and 54, whose participation rate fell 0.6 percentage points to 83.3%. Household employment tumbled by 507,000 even as nonfarm payrolls rose a modest 57,000, feeding a narrative that discouraged job seekers are heading for the exits.
The monthly labor force figures deserve a healthy dose of skepticism. The data come from the household survey, which covers roughly 60,000 households, so monthly swings of half a million workers fall well within the survey’s normal margin of error. June also carries predictable seasonal noise as the school year winds down. Comparisons with a year ago are further muddied by the missing October 2025 data and by the updated population controls introduced with the February data, which removed roughly 1.5 million men from the estimated population, concentrated in the 25-54 age group, and mechanically shrank the measured labor force.
The longer-run trend shows prime-age labor force participation remains quite strong. Over the past twelve months the prime-age rate has averaged 83.7%, higher than any comparable stretch between 2002 and the pandemic, and it stood at 83.9% in May and 84.0% in January, readings never reached in the eighteen years before the pandemic. Even after June’s drop, the rate sits within four tenths of that pre-pandemic ceiling. The number of 25-54 year olds outside the labor force is running near 21.4 million on a twelve-month basis, close to a two-decade low and well below the pre-pandemic peak of nearly 24 million reached in 2015 and 2016. Relatively few potential workers are sitting on the sidelines, which is difficult to square with the notion that prime-age workers are giving up in large numbers.
The slide in the headline participation rate is being driven by demographics. The number of Americans age 65 and over outside the labor force has climbed from 31 million in mid-2008 to 52.7 million today, and the pace has quickened since 2024 as the largest birth cohorts reach traditional retirement ages. More than four million Americans are turning 65 each year through 2027, the peak of the Peak 65 wave, and a record 1.85 million retired workers were added to the Social Security rolls in 2025 alone, a figure flattered by the Social Security Fairness Act but extraordinary even allowing for it. Slower immigration removes another offset that boosted labor force growth in prior cycles. The economy has fewer workers, not fewer willing workers.
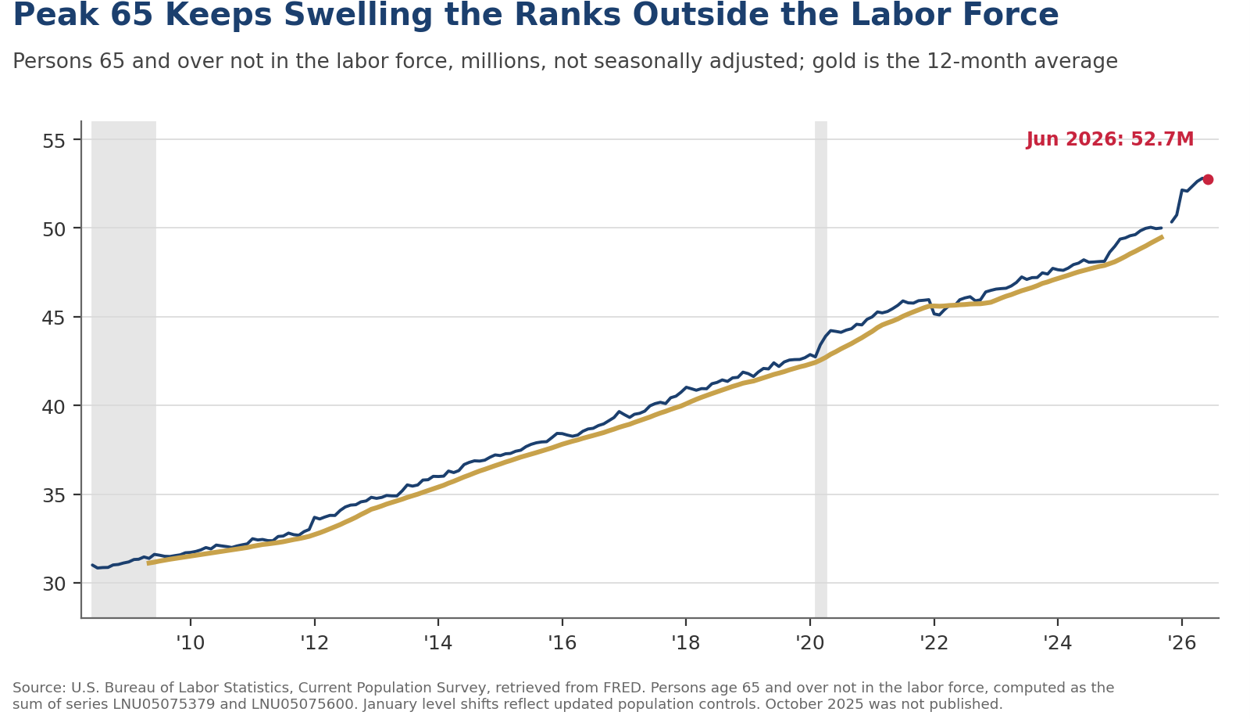
Most of the growth has come from healthy, active retirees. Since 2008, the number of people age 65 and over outside the labor force reporting no disability has nearly doubled to 34.7 million, roughly twice the count of those with a disability. These are largely able-bodied retirees with time on their hands, filling pickleball courts, cruise ships, golf courses and early dinner seatings across the Sun Belt.
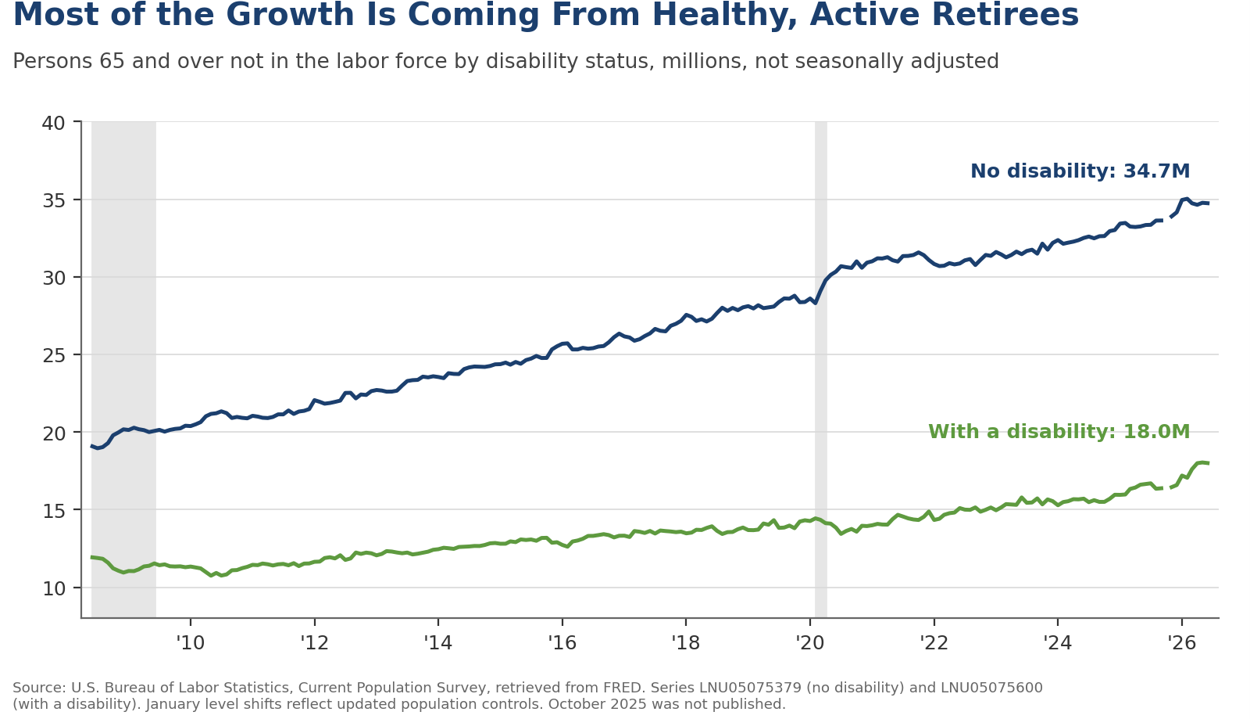
The swelling ranks of retirees are likely adding some resilience to consumer spending. Retiree budgets rest on Social Security benefits that are indexed to inflation, along with pensions, annuities and scheduled portfolio withdrawals, rather than on a paycheck. Their spending is therefore far less sensitive to the hiring cycle than that of working households. Adults age 50 and over already account for more than half of U.S. consumer spending, according to AARP, and retirees tilt toward services such as travel, dining and health care, categories that tend to hold up when goods spending wobbles. Happy hour at The Villages and other retiree havens arrives on schedule whether the market has a good day or a bad one.
The implications reach every business that sells to or hires from this economy. Manufacturers face the shift on both sides of the ledger: demand tilts toward replacement purchases, healthcare equipment, aging-in-place products and leisure categories, while the retirements walking out the door are disproportionately skilled trades, raising the return on automation and knowledge transfer just as reshoring collides with a shrinking workforce. Retailers gain a steadier, less cyclical customer whose budget resets every January with the Social Security cost-of-living adjustment, with traffic shifting toward weekday and mid-morning dayparts and service becoming a competitive weapon. Restaurateurs get the most predictable seating in the building, as early dinners, weekday lunches and happy hour fill the shoulder dayparts working households abandoned, though the same demographics thinning the labor pool make the kitchen harder to staff.
Travel, health care, housing and financial services inherit the largest structural tailwinds. Roughly 65% of U.S. cruise passengers are 55 and over, and retirees fill the shoulder seasons that airlines, cruise lines and hotels once struggled to sell. Health care and senior housing face a demand wave and a caregiver shortage at the same time, handing pricing power to providers who can staff. Builders and apartment owners should follow the migration into single-level product, active-adult communities and 55-plus rentals across the Sun Belt, and financial firms should follow the decumulation, as the growth business shifts from accumulation toward annuities, withdrawal strategies and the largest intergenerational wealth transfer on record.
The offset is not unlimited. A prolonged slide in equity or home values would eventually bite through wealth effects, since retirees fund a growing share of their spending from portfolios rather than paychecks. And the same wave of retirements that steadies consumption also tightens the labor supply ceiling, reinforcing our view that growth will remain uneven across this two-speed expansion, with capital spending doing more of the heavy lifting while labor-intensive sectors strain to find workers.
The bottom line is that June’s report says more about who Americans are than about how they feel. Prime-age workers remain attached to the job market at rates rarely seen in the past two decades. The participation slide is concentrated where the calendar, not the economy, is doing the work. For investors and business leaders, the practical implication is a labor market that stays tighter than the headline numbers suggest and a consumer base with a growing, income-steady retiree core.
Mark P. Vitner – President & Chief Economist, Piedmont Crescent Capital
mark.vitner@piedmontcrescentcapital.com · (704) 458-4000
About Piedmont Crescent Capital. Piedmont Crescent Capital provides economic research and advisory services covering U.S. and regional economic conditions, financial markets, housing and commercial real estate. The Piedmont Perspective examines the structural forces shaping the economy. Sources: U.S. Bureau of Labor Statistics, Current Population Survey, retrieved from FRED; U.S. Social Security Administration; AARP. This commentary is for informational purposes only and does not constitute investment advice. © 2026 Piedmont Crescent Capital, LLC. All rights reserved.
June 2026 CPI: An Energy Refund, a Paycheck Reprieve
An Energy Refund, a Paycheck Reprieve
Gasoline hands back part of the spring surge, pulling the headline down 0.4% and the annual rate to 3.5%, while core slips to 2.6% and real earnings turn positive.
Early Signals
- Energy gave it back. Headline CPI fell 0.4% in June, the largest one-month decline since April 2020, as gasoline dropped 9.7%. The 12-month rate fell to 3.5% from 4.2%.
- Core went quiet. The core index was unchanged on the month, easing the annual rate to 2.6%, and our HP-filtered trend estimate puts underlying inflation just above 2.5%.
- Paychecks caught a break. Real average hourly earnings jumped 0.8% in June and turned positive on a year-over-year basis, up 0.1%, after running negative through the spring.
- Expectations cut the other way. The New York Fed’s one-year inflation expectation rose to 3.7%, the highest since September 2023, a reminder that households have not yet felt the relief.
Key Takeaways
| Key Concept | Findings |
|---|---|
| Headline CPI | Fell 0.4% in June after rising 0.5% in May, the largest monthly decline since April 2020. The 12-month rate eased to 3.5% from 4.2%. Energy did nearly all of the work, in reverse this time. |
| Energy | Down 5.7% on the month as gasoline fell 9.7% and fuel oil dropped 9.2%. Even after June’s retreat, energy is up 15.7% over the year and gasoline 26.7%. |
| Core CPI | Unchanged in June after a 0.2% rise in May, lowering the annual rate to 2.6% from 2.9%. Stripping food, shelter, and energy, prices fell 0.1% and are up just 2.1% over the year. |
| HP-Filtered Trend | Our one-sided HP-filter estimate of trend core inflation eased to roughly 2.6% in June from 2.8% in May, continuing a steady glide. With this morning’s June update, the Cleveland Fed trimmed measures eased to 2.6–2.7%, and the Dallas Fed trimmed mean PCE sits at 2.4% through May. |
| Shelter | Up just 0.1%, the smallest monthly increase since January 2021. Owners’ equivalent rent rose 0.2% and rent of primary residence 0.1%; over the year, rent has slowed to 2.8%. |
| Real Earnings | Real average hourly earnings rose 0.8% in June and are up 0.1% over the year, after running negative through the spring. Production workers’ real pay rose 0.8% on the month. |
| Policy Signal | The report removes the hike tail without making the case for a cut. Expectations at 3.7% one-year ahead argue the Warsh Fed stays patient. We hold our no-cut base case with risks now roughly balanced. |
The Overview
The June inflation report is the fourth installment of the energy story, and the first one told in reverse. For three months a surge in energy prices did most of the work pushing the headline higher; in June the pump gave a good part of it back. The Consumer Price Index fell 0.4%, the largest one-month decline since April 2020, and the 12-month rate dropped to 3.5% from 4.2% in May. The energy index alone fell 5.7%, more than offsetting modest increases in food and shelter.
Just as we cautioned against reading the spring’s four handle as evidence of reigniting inflation, we would caution against reading June’s negative print as the arrival of disinflation’s final mile. What changed, again, was the price of a gallon of gasoline. The more meaningful development sits underneath: core prices were flat on the month, shelter posted its smallest increase in over five years, and the measures that strip away the noise point to an underlying trend in the mid-twos. The quiet in this report is more persuasive than the drama.
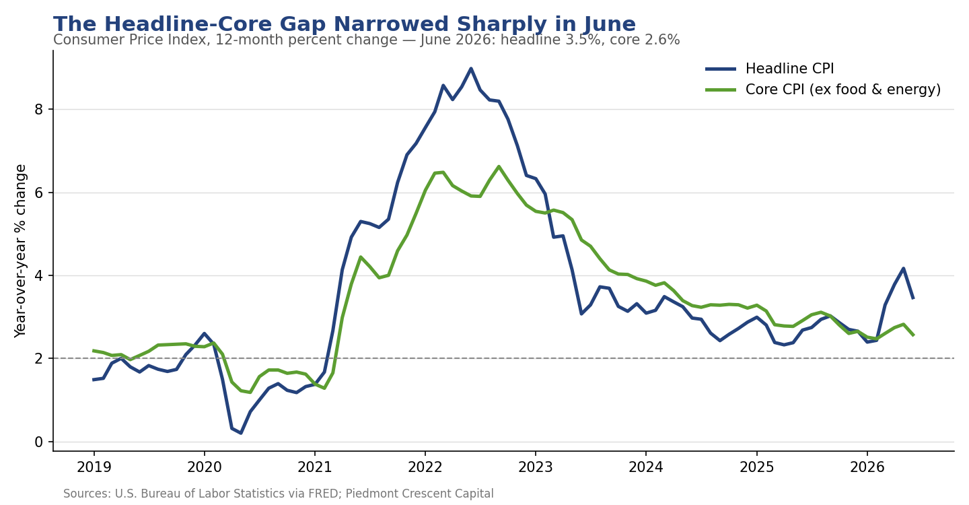
Energy Gave Back the Spring Surge
The energy index fell 5.7% in June, its largest monthly decline since April 2020, as gasoline dropped 9.7% and fuel oil fell 9.2%. Electricity slipped 1.0%, while natural gas rose 0.5%. The reversal was broad enough that energy more than offset every increase elsewhere in the index. Even so, the year-over-year arithmetic remains lopsided: energy is still up 15.7% from a year ago and gasoline 26.7%, so the cumulative bill from the spring shock has hardly been refunded in full.
The distributional point we made in May now runs in the other direction. The same households that absorbed the most regressive form of inflation on the way up capture the most immediate relief on the way down. A cheaper commute and grocery run provide the greatest immediate relief on the budgets with the least slack, which is why the real-earnings reversal later matters more than the headline.
Core Inflation: Quiet, and Quietly Softer
The core index was unchanged in June after a 0.2% rise in May, lowering the annual rate to 2.6% from 2.9%. The internals read like a disinflation checklist. Motor vehicle insurance fell 2.0% on the heels of a 1.7% May decline and is now down 4.1% over the year, a quiet, underappreciated force working through the core. Communication costs fell 1.5%, apparel declined 0.6%, and used vehicles slipped 0.2%. Medical care edged down 0.1% as physicians’ services and prescription drugs both declined. The offsets were modest: recreation rose 0.5%, household furnishings and personal care each gained 0.2%, and airline fares, which are up 26.5% over the year, added just 0.2% on the month.
The cleanest exclusion-based cut of the data (all items less food, shelter, and energy) fell 0.1% in June and is up just 2.1% over the past year. Food was similarly calm, rising 0.2%, with eggs bouncing 4.3% on the month, although they remain down nearly 28% from a year ago, and coffee prices fell 2.0%. Breadth, the thing we watch most closely for evidence of second-round effects from the energy shock, narrowed rather than widened in June.
The Underlying Trend: Our HP-Filter Read
Our HP-filtered estimate of trend core inflation stands at roughly 2.6% as of June, down from 2.8% in May and 2.9% at the turn of the year. The trend has now descended in an almost unbroken line from 3.4% a year ago, and June’s soft core reading extended the glide path rather than bending it.
Each of the popular measures of underlying inflation makes a different compromise. Core CPI excludes food and energy every month, whether or not those categories carry signal. The Cleveland Fed’s median CPI and 16% trimmed-mean CPI, and the Dallas Fed’s trimmed mean PCE, discard the outliers in each month’s cross-section of price changes but still treat every month in isolation. The HP filter works along the other dimension: it uses the full run of monthly data to separate a slow-moving trend from transitory noise, without throwing out any category. When a shock is genuinely temporary, the filter looks through it; when a shock persists, the trend moves, which is precisely the distinction policymakers need.
The spring provided a live demonstration. The Cleveland measures spiked to annualized rates near 5% in April as the energy shock bled into enough categories to survive the trim, then retreated over the following two months; with this morning’s June update, their trailing 12-month averages have eased to 2.7% and 2.6%. The Dallas Fed’s trimmed mean PCE, at 2.4% through May, never flinched. Our filtered estimate split the difference and, more importantly, never treated the spring as a change in trend. The June readings from Cleveland, released mid-morning, sealed the point: the median CPI rose at just a 2.1% annualized rate and the trimmed mean was essentially flat. Our filter puts underlying core inflation a touch above 2.5%, and the spread across all four measures is now the narrowest of the cycle. The measures are converging on the same conclusion from different directions: the trend is in the mid-twos and drifting lower.

Shelter: The Anchor Slips Further
Shelter rose just 0.1% in June, the smallest monthly increase since January 2021, and the category’s key components are finally telling the same story. Rent of primary residence rose 0.1% and has slowed to 2.8% over the year, a level consistent with the new-lease data that has pointed lower for two years. Owners’ equivalent rent, the heavier and stickier piece, rose 0.2% and is running at 3.3% annually. Lodging away from home fell 2.3%, adding to the month’s softness. Room rates had risen the prior month, likely due to the arrival of the World Cup. Because shelter carries more than a third of the index’s weight, a shelter category growing at a 2½-to-3% pace is the single most powerful argument that core inflation’s descent has further to run.
Technology Prices: Looking for the Memory Shock
We flagged one category for special attention this month: technology goods, where soaring memory-chip costs have been expected to pressure retail prices. The pass-through has not arrived as higher consumer prices, at least not yet, but it is visible as slower deflation. Information technology commodities fell 0.9% in June and are down 7.2% over the year, and smartphones are down 11.9%. Those are steep declines by ordinary standards, but these are categories built to fall as quality improves. The more telling reading is computers, peripherals, and smart home assistants: down just 0.8% over the past year, a remarkably shallow decline for a category that routinely deflates at several times that pace, and one that posted outright increases in April and May before dipping in June. Video and audio products are up 1.9% over the year, an unusual positive print for consumer electronics.
This is the overlooked story in the June report. The memory shock is arriving the way hedonically adjusted indexes usually receive a cost shock: not as a price spike, but as the disappearance of the deflation that consumers have come to treat as automatic. If memory costs remain elevated into the fall, the tech aisle could flip from a steady drag on core goods prices to a modest contributor, at precisely the moment tariff pass-through is fading elsewhere in the goods basket. We will keep this watch item in place.
Real Earnings: A Paycheck Reprieve
The companion release delivered the month’s best news for households. Real average hourly earnings jumped 0.8% in June, a 0.3% nominal wage gain compounded by the 0.4% decline in consumer prices, and turned positive over the year, up 0.1%, after running negative through the spring. Real weekly earnings rose 0.8% on the month and are up 0.3% over the year. For production and nonsupervisory workers, real hourly pay also rose 0.8% in June, though it remains down 0.1% over twelve months.
One good month does not repair a year of erosion, and the level of prices (the grocery bill, the insurance premium, the rent) still sits well above where paychecks left off. But the direction matters. The squeeze we have tracked all year loosened in June for the first time in a meaningful way, and if energy stays quiet, the arithmetic favors the worker for the balance of the summer.
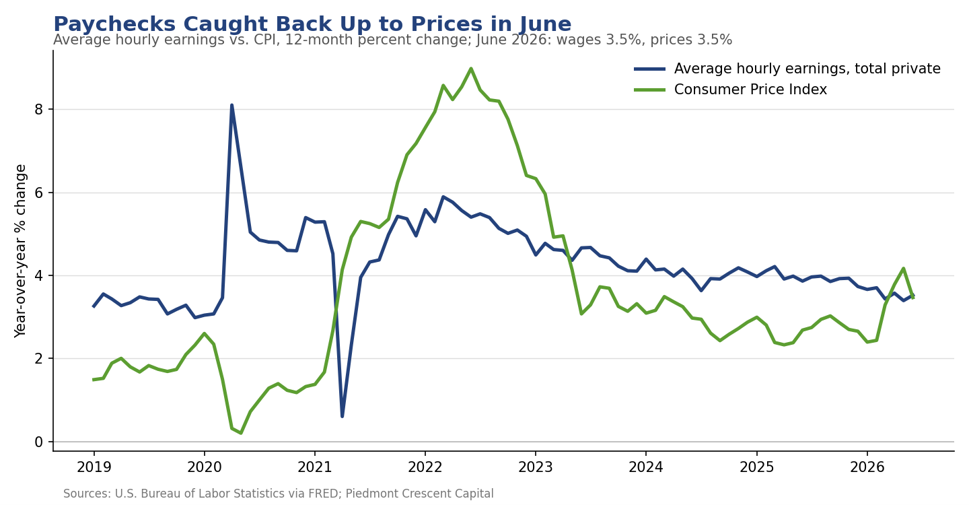
What Households Expect
Households have not yet felt the relief. The New York Fed’s June Survey of Consumer Expectations, taken before the full extent of the gasoline decline registered at the pump, showed the median one-year inflation expectation rising two tenths to 3.7%, the highest since September 2023, and the three-year measure climbing to 3.3%, the highest since June 2022. The five-year expectation held at 3.0%. The texture beneath tells the same two-sided story as the hard data: households marked their gasoline price expectations down sharply, to 1.5%, the lowest since August 2022, even as they braced for rent to rise 8.3% and medical care 9.4% over the year ahead.
Households expect rents to rise more than 8%; the CPI says rents actually rose 2.8% over the past year and are decelerating. The gap between what renters fear and what the lease data show is one of the widest on record, and it is a useful reminder that expectations follow lived experience with a long lag. Labor market expectations, at least, improved across the board in June.
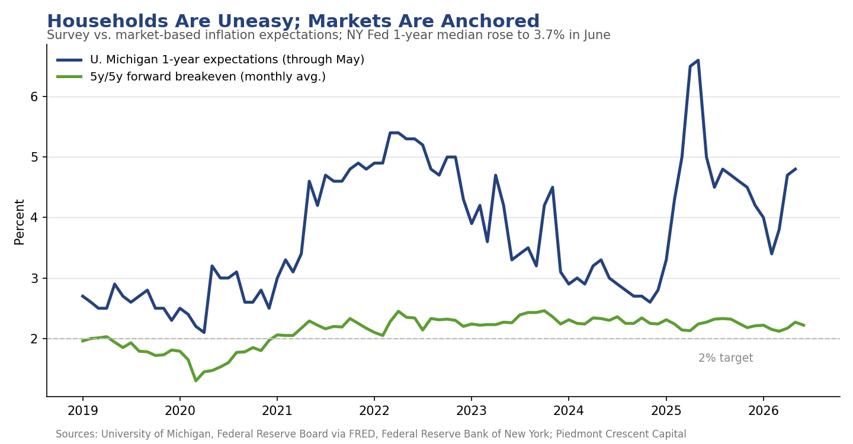
Our Call
A negative print is a partial energy refund, not the onset of deflation. June’s 0.4% decline unwinds a piece of the spring surge, and the drop in the 12-month change to 3.5% flatters the trend for the same reason April’s 4.2% maligned it. The signal sits in the middle. Our HP-filtered trend puts underlying core inflation just above 2.5%, the Dallas trimmed mean sits at 2.4%, and the Cleveland measures near 2.9%. Underlying inflation is in the mid-twos and grinding lower, which marks genuine progress, but not mission accomplished.
The composition finally favors the household. The most regressive inflation of the spring reversed first, real earnings turned positive over the year, shelter posted its smallest increase in five years, and motor vehicle insurance is now falling outright. The two-Americas framing we have carried all year is still intact (the price level remains a burden), but June was the first month in some time in which the wage earner, not just the asset holder, came out ahead.
For the Warsh Fed, June buys patience, not a pivot. The report removes the hike tail that the spring spike had put back on the table, but with the New York Fed’s one-year expectation at 3.7% and the three-year at a four-year high, the Committee cannot yet claim expectations are anchored at target. One negative energy print does not make a trend, and the second-round watch (airfares, transport, and technology products) stays open. We hold our no-cut base case for 2026, with the risks around it now roughly balanced rather than skewed toward a hike.
Mark P. Vitner – Chief Economist, Piedmont Crescent Capital
mark.vitner@piedmontcrescentcapital.com · (704) 458-4000
Disclaimer: This report is provided for informational purposes only and does not constitute investment, legal, tax, or accounting advice, nor an offer or solicitation to buy or sell any security. Information is drawn from sources believed to be reliable, including the U.S. Bureau of Labor Statistics and the Federal Reserve Banks of Cleveland, Dallas, and New York, but its accuracy and completeness are not guaranteed. Views expressed are those of the author as of the date of publication and are subject to change without notice. Past performance is not indicative of future results.
Too Much of a Good Thing
Too Much of a Good Thing
A View from the Piedmont — Weekly Economic Commentary
Week ended July 31, 2026, published Monday, August 3, before the open · Mark P. Vitner, President & Chief Economist · mark.vitner@piedmontcrescentcapital.com · 704-458-4000
Key Points
Market Dashboard
The month ended with the broad equity market close to unchanged, the long end of the Treasury curve at its highest yields since 2007 and Brent crude back above $90 a barrel. The table below shows where the major markets closed on Friday, the moves that produced those levels and the July totals behind them. The rates block is the place to start. The two-year yield rose 14 basis points over the month while the thirty-year added 36, and that gap accounts for most of what we have to say this week. Two things happened after these levels were struck, and both of them cut against the energy complex. The Sunday night section below has the read.
Levels as of Friday’s close, July 31.
Monday Morning: Before the Open
The oil market has priced a deal that one of the two parties says does not exist. As of twenty past six this morning Brent was $83.57 and West Texas Intermediate $79.57, down 5.0% and 6.0% respectively. Brent fell as much as 7% in Asian hours before steadying, and both benchmarks have been close to flat since the small hours. One caution on the arithmetic, because it is going to be misreported all day. The September Brent contract expired at Friday’s settle of $90.12, so the front month is now October, which settled Friday at $87.93. Measured against the contract that is actually trading, Brent is down $4.36. Measured from the $90.12 headline that everyone has in their notes, it looks like $6.55. The first number is the real one.
The move assumes the Strait of Hormuz reopens, and this morning Tehran said the talks behind it are not happening. Foreign ministry spokesman Esmaeil Baghaei said Iran is not currently holding talks with the American side, that its delegation is staying in the country and is not traveling to negotiate in the coming days, and that the mediator for any American channel is Pakistan working with Qatar rather than Oman. On the Omani corridor talks that are running, he said a deal there would not be sufficient to fully reopen the strait while American aggression continues. That is a harder position than Sunday’s rather than a softer one, and it came out while crude was down five percent on the opposite assumption.
Nothing physical has changed either, and that is the part we would put in front of a risk committee. The strait has been effectively closed for 155 days. The most recent hard count we can find, from July 23, puts transits at ten vessels a day against a normal rate near eighty-eight, which is roughly 11% of pre-crisis throughput. War-risk cover is running around eight times its pre-crisis cost, several protection and indemnity clubs have withdrawn cover altogether, and something like seventy tankers are moving with their transponders off. No shipping line has announced a resumption. A June memorandum that partially reopened the strait collapsed inside a month. We are not predicting that this one collapses, and we would note that at least one experienced oil strategist has called the de-escalation hopes most likely totally misplaced. We are pointing out that a five percent move has been paid for with a communique nobody has countersigned and, as of this morning, a negotiation that is not taking place.
For our purposes the policy conclusion is unchanged and, if anything, easier to hold. Whether crude settles in the high seventies or back above ninety, neither outcome touches private domestic demand growing at close to 4% against a shrinking labor force, and neither is a reason to raise rates in September. An energy move of this size in either direction is precisely the relative price change a central bank is supposed to look through. What it does change is the near-term path of headline inflation, and with it the political temperature around the September meeting. The thing to watch is the transit count rather than the crude price, and the transit count has not moved.
Our Thesis
There is a straightforward argument going around that the Federal Reserve is behind the curve and needs to raise rates, and it has gotten louder since Wednesday, when Lorie Logan, Beth Hammack and Neel Kashkari all dissented in favor of a quarter point. We understand the argument. We do not accept it, and our reasoning is easily misread as dovishness when it is nothing of the kind.
The data did not support a rate increase in July, and on present trends it will not support one in September either. Start with prices. The Dallas Fed’s trimmed mean personal consumption expenditures rate fell in June to 2.23%, its lowest since July 2021. The Cleveland Fed’s median consumer price index is up 2.7% over the past twelve months, down from 3.6% a year earlier. Core consumer prices are running at 2.6%. On employment, June payrolls came in at 57,000, manufacturing employment is down 38,000 from a year ago, and the employment cost index shows wages decelerating, to 3.1% from 3.3%. Inflation is lower and job growth has slowed. Those are the two things the Federal Reserve is charged with watching, and both of them argue against tightening right now.
Producer prices are the honest counter-argument and we do not wave them off. Final demand is up 5.5% and has run between 5.5% and 6.0% since the spring. But a war-driven energy shock passing through a supply chain is the textbook relative price change, and the textbook answer is to look through it unless it reaches wages or expectations. It has reached neither. The Bank of England reached the same conclusion on Wednesday from a larger energy shock and a smaller economy, holding Bank Rate at 3.75% on a 6-3 vote and recording in its minutes that there had been little evidence of material second-round effects so far, while noting that pass-through lags mean this cannot be read as a strong signal about the future.
The market has come around to the same view without saying so. September hike odds were 82% on Monday, 72% after the meeting, and roughly 60% by Friday’s close. The commentary is more hawkish than the pricing, and the pricing is more hawkish than the data. We would not pay up for the commentary.
What worries us is the growth rate of private final domestic demand, which is running too fast to be consistent with containing inflation. The second quarter’s headline growth rate of 1.5% is a distraction; every part of the shortfall was inventories, imported capital goods, or a federal spending line depressed by petroleum reserve sales. The number that describes the economy is real final sales to private domestic purchasers, and it grew 3.9%, up from 1.7% in the first quarter. That is a boom pace rather than a recovery pace, arriving in the middle of a war, with oil having averaged the mid-nineties, against a labor force that has shrunk by roughly a million people over the past twelve months.
An economy cannot grow domestic demand at close to 4%, with no growth at all in available workers, and expect inflation to settle at 2% for long. That arithmetic is why we are uneasy even as we argue against a September hike. The current rate of inflation does not justify tightening; the current rate of demand growth is why we would want the Committee ready to.
The cyclical layer on top is broader than the artificial-intelligence line item. Business fixed investment grew 8.4% in the second quarter on top of 10.6% in the first, with equipment up 15.2%, which is a good deal more than data centers.
The evidence is sectoral and specific rather than aggregate. Five programs are running at once, the artificial-intelligence buildout, electrification, defense replenishment, the pharmaceutical and life sciences onshoring wave and the demographic bulge we have called Peak 65, and each is pressing on a different physical bottleneck in an economy whose labor force is not growing.
Where the Price Pressure Actually Lives
Electric power is the clearest case, and the mechanism is worth spelling out because the number that follows is not a forecast but a price already struck. The PJM Interconnection is the regional transmission organization that coordinates the wholesale power market and the high-voltage grid for more than 67 million people in all or parts of thirteen states and the District of Columbia, from Illinois east to New Jersey and south to North Carolina. Its Base Residual Auction runs roughly three years ahead of the delivery year, and what it buys is not electricity but a promise: generators are paid a fee per megawatt-day to keep capacity available for the year in question, and the clearing price is the price that draws out enough of those promises to meet PJM’s own reliability requirement. When bidders cannot supply it at any price inside the cap, the auction clears at the cap and still falls short.
That is now what happens routinely. The auction for the 2028-29 delivery year cleared at the price cap of $325 per megawatt-day, the third consecutive auction to hit the cap, at a total cost of $16.4 billion, and the cost lands in retail bills across those thirteen states. It also fell 6,831 megawatts short of its own reliability requirement, the second auction running in which the entire system came up short. For scale, the clearing price was $28.92 for the 2024-25 delivery year, an auction held in December of 2022. It is a factor of eleven in less than four years.
Lazard’s nineteenth Levelized Cost of Energy study, published July 13, sets out why. It puts unsubsidized gas combined-cycle generation at $51–129 a megawatt-hour and gas peaking at $144–276, a fifteen-year high for gas-fired power. Its most useful sentence for our purposes is the observation that measured capital costs “have not yet reached the levels of recently observed quotes, suggesting higher-cost projects may still be in the planning” stages. The index is lagging the transactions, and there is more increase in the pipeline than in the data.
Electrification stopped being a deflationary story some time ago, and most published inflation forecasts still carry electricity as a disinflationary line. One option we expect to be played out further is the extension of already operating coal-fired power plants wherever possible. The equipment corroborates it. GE Vernova’s gas turbine backlog is 116 GW, up from 100 GW a quarter earlier, with customer conversations reaching “2032 and beyond”; Siemens Energy’s backlog is €154 billion on a book-to-bill of 1.72; and industry sources report generator step-up transformer lead times of up to four years with prices up about 80% over five years.
The Steepening Has Three Sources
The market is only discussing two. The 30-year closed Friday at 5.27%, a new post-2007 high, and the 2s30s spread widened 22 bp over the month, from 77 bp to 99 bp. The two explanations in general circulation are the deficit and the Federal Reserve’s credibility, and both are real. We would add a third. A cyclical reacceleration in the goods economy is a classic long-end story, because it raises the expected path of real growth and the inflation risk premium simultaneously without touching the front end, which is anchored by a Committee that is not moving in the next six weeks. Chair Warsh came close to this on Wednesday without joining the dots. He called the strong growth of business investment the most striking feature of the economy, he noted that nominal and real yields are materially higher across the Treasury curve and that the inter-meeting move ranked among the largest in two decades, and he put that move down to market participants reacting to real data rather than to anything the Committee said. He did not connect the two. We would. The corroborating detail is that this is a real-yield move rather than a breakeven move. The 30-year inflation-protected security reached a real yield of about 2.9% in mid-July, the highest since 30-year TIPS were reintroduced in February 2010.
Two qualifications. First, the steepening is roughly four weeks old. Measured over three, six or twelve months the curve has flattened, because the front end repriced from cuts toward hikes faster than the long end moved. The steepener is a July phenomenon and it began the week of the dissents. Second, at least one other house making very nearly our argument about manufacturing and inflation draws the opposite conclusion on the curve and recommends a flattener. The disagreement is real and clients should be aware that it exists.
Behind the Numbers
Start with what closed the month, because the tape said something clear. The S&P 500 fell 0.13% in July, its first negative July since 2014 and the end of an eleven-year streak, and its second consecutive losing month. In the same month the Dow rose 0.32% and recorded its fourth straight winning month. The Nasdaq fell 3.2% and the Russell 3.1%. Set those side by side and the story is a market repricing one very large, very concentrated trade while the rest of the index does fine, rather than a market that is worried about the economy. Friday’s session made the point in miniature. Amazon rose 15.3% on cloud results that monetize the spending; Apple fell 7.4% on a September guide.
The labor market is why we are comfortable with a hold in September and uneasy about 2027, and both readings come from the same fact. Payroll growth has slowed to 57,000 a month and manufacturing employment is down 38,000 from a year ago. On its face that is a cooling labor market and an argument for patience, and in the near term it is. Even so, breakeven payrolls are close to zero, initial claims printed 197,000 in the week of July 25, and manufacturing weekly hours have risen half an hour since December while manufacturing average hourly earnings run 3.8% against 3.5% for all private workers. Employers in the cyclical sector are adding hours and paying up rather than hiring, which is exactly what firms do when they believe demand is improving and cannot find people. Slow payroll growth in an economy whose labor force is contracting is a constraint rather than slack, and constraints show up in prices with a lag.
Housing is where the rate regime is doing the visible damage, and the 30-year Treasury at a new 19-year high does not help. New home sales ran at 628,000 units in June, down 5.6% from a year ago, with the median price down 3.3% in a single month and 9.3 months of supply. The 30-year mortgage is 6.66%. There is, however, an awkwardness here for the tightening camp. The one sector that responds cleanly to the funds rate has already absorbed the full weight of it. A September increase would not touch a data center, a turbine order or a hospital bill. It would land on housing again, and housing is not where the demand growth is coming from.
Then the war, which moved twice after Friday’s close and finished the weekend somewhere else entirely. Friday’s reporting had the President weighing a multi-day strike campaign against Iran with oil refineries and power plants under consideration as targets, and West Texas Intermediate traded above $86 after settling at $84.67 on that reading. On Saturday evening he said the attack would be cancelled, subject to being able to make a deal quickly, and described parameters that include the immediate and complete reopening of the Strait of Hormuz and an end to Iran’s nuclear threat. He said Israel is party to the commitment; Israel has not confirmed that. Iran spent Sunday rejecting the whole account, with Mehr calling it a new lie, Fars quoting a negotiator saying the strait stays closed while American hostile actions continue, and the acting defense minister calling the President’s comments psychological and cognitive warfare. On Monday morning the foreign ministry spokesman said plainly that no talks with the American side are under way, that Iran’s delegation is not traveling, and that any American channel runs through Pakistan and Qatar rather than Oman.
We would not move a forecast on an announcement, and we said the same about the report it replaced. What we would do is note how much the distribution has changed in seventy-two hours. Friday’s risk was a campaign against Iranian refining and generation, which is a destruction-of-capacity story rather than a transit story and is asymmetric to the upside on price. Sunday’s is an unratified de-escalation whose headline term is the reopening of the strait, which is asymmetric the other way. The range of outcomes for oil over the next month is now wider than it was on Friday and centered lower, and both tails run through Tehran rather than through Washington.
OPEC+ met Sunday and approved the 188,000 barrel-a-day September increase, a sixth consecutive monthly step that completes the second of the group’s three cut packages. The seven countries running voluntary adjustments are Saudi Arabia, Russia, Iraq, Kuwait, Kazakhstan, Algeria and Oman; the United Arab Emirates left the group earlier this year. Delegates say a pause through the fourth quarter follows, though that does not appear in the communique. The group meets again on September 6, and OPEC has now cut its 2026 demand growth forecast for a third consecutive month.
Bottom Line
We hold no cut in 2026 and we do not think a hike is required. Inflation is lower, job growth has slowed, and the underlying measures built to separate signal from noise are at or near target. What has changed this week is the location of our concern rather than our policy call. Private domestic demand is growing at close to 4% against a labor force that is smaller than it was a year ago, the price pressure is concentrated exactly in the five programs producing that growth, and the most cyclical part of the economy is now turning up underneath them. That is a 2027 problem rather than a September one, and the weekend, if the de-escalation holds, takes the other argument off the table as well: an oil complex giving back its war premium pulls headline inflation down through the fall and removes the last thing a September hike could claim to be responding to. It does nothing at all to private domestic demand growing at close to 4%. Stay short on duration. We would revisit that call if private final domestic demand slows back toward 2% while the long end stabilizes.
CFO & Corporate Treasurers Corner
This section is for the people who have to act on the forecast rather than debate it. Everything below follows from the same three facts: the front end is anchored, the long end is repricing, and the binding constraints in this cycle are physical rather than financial.
Do not build a 2027 plan that assumes rate relief. Our base case is no cut in 2026, no hike required in September, and the risk of a hike migrating into 2027 as a demand story rather than an oil story. Meanwhile the long end added 36 basis points in July alone to close at 5.27%, and the 30-year real yield reached about 2.9% in mid-July, the highest since 30-year inflation-protected securities were reintroduced in 2010. We read that as a structural repricing of real rates rather than an inflation scare, which is another way of saying that waiting for a better entry is unlikely to be rewarded.
Terming out now costs 99 basis points of curve, and that is the question to put to your board. With no cut in the base case, floating-rate exposure gets no relief this year, so the decision is whether to pay the 2s30s spread to remove 2027 risk. For a borrower whose 2027 risk is a demand-driven tightening rather than a recession, we think that is a reasonable premium.
If you are siting load, the schedule is the equipment order, not the capital approval. PJM cleared at the cap for a third consecutive auction and still came up 6,831 megawatts short. Generator step-up transformer lead times run to four years with prices up about 80% over five years. GE Vernova’s turbine conversations now reach 2032 and beyond. Budget electricity above the 4.0% consumer price print, which we regard as a floor.
The weekend improved the entry for fuel consumers and did not settle anything. Brent is $83.57 and WTI $79.57 this morning, five and six percent below Friday, on an announcement Tehran rejected on Sunday and on talks its foreign ministry says are not happening. We would layer hedges incrementally rather than in size, and treat the level as a chance to extend coverage rather than as a new forecast. Watch Strait of Hormuz transit counts and war-risk quotes, which move well before the price does. Transits were last counted at about a tenth of normal and war-risk cover at roughly eight times pre-crisis, and neither has moved.
Budget benefits well above headline inflation for 2027. The employment cost index shows wages decelerating to 3.1% from 3.3%, which flatters the picture, because the index rotated into benefits and the cost that drives a renewal is medical. Hospital services in the consumer price index are up 5.5% and the producer price index for hospital services 3.6%.
Check whether you have repriced since the spring. Producer prices for final demand are up 5.5% and have run between 5.5% and 6.0% since April, against core consumer prices at 2.6%. That gap is unrecovered input cost sitting in somebody’s margin, and if the energy unwind pulls headline inflation down through the fall the window to pass it through narrows rather than widens.
The Week Ahead
Mark P. Vitner
President & Chief Economist, Piedmont Crescent Capital
mark.vitner@piedmontcrescentcapital.com · 704-458-4000
A View from the Piedmont is published weekly by Piedmont Crescent Capital for informational purposes only and does not constitute investment, legal, or tax advice. Views expressed are those of the author as of the date of publication and are subject to change.