
Fewer Workers, Not Fewer Willing Workers
Retirements, not discouragement, are pulling down labor force participation, and the swelling ranks of retirees may be steadying consumer spending
June’s employment report set off a fresh round of hand wringing about workers giving up. The labor force participation rate slid to 61.5%, its lowest reading in 50 years outside the pandemic, and the steepest one-month decline came from prime-age workers between the ages of 25 and 54, whose participation rate fell 0.6 percentage points to 83.3%. Household employment tumbled by 507,000 even as nonfarm payrolls rose a modest 57,000, feeding a narrative that discouraged job seekers are heading for the exits.
The monthly labor force figures deserve a healthy dose of skepticism. The data come from the household survey, which covers roughly 60,000 households, so monthly swings of half a million workers fall well within the survey’s normal margin of error. June also carries predictable seasonal noise as the school year winds down. Comparisons with a year ago are further muddied by the missing October 2025 data and by the updated population controls introduced with the February data, which removed roughly 1.5 million men from the estimated population, concentrated in the 25-54 age group, and mechanically shrank the measured labor force.
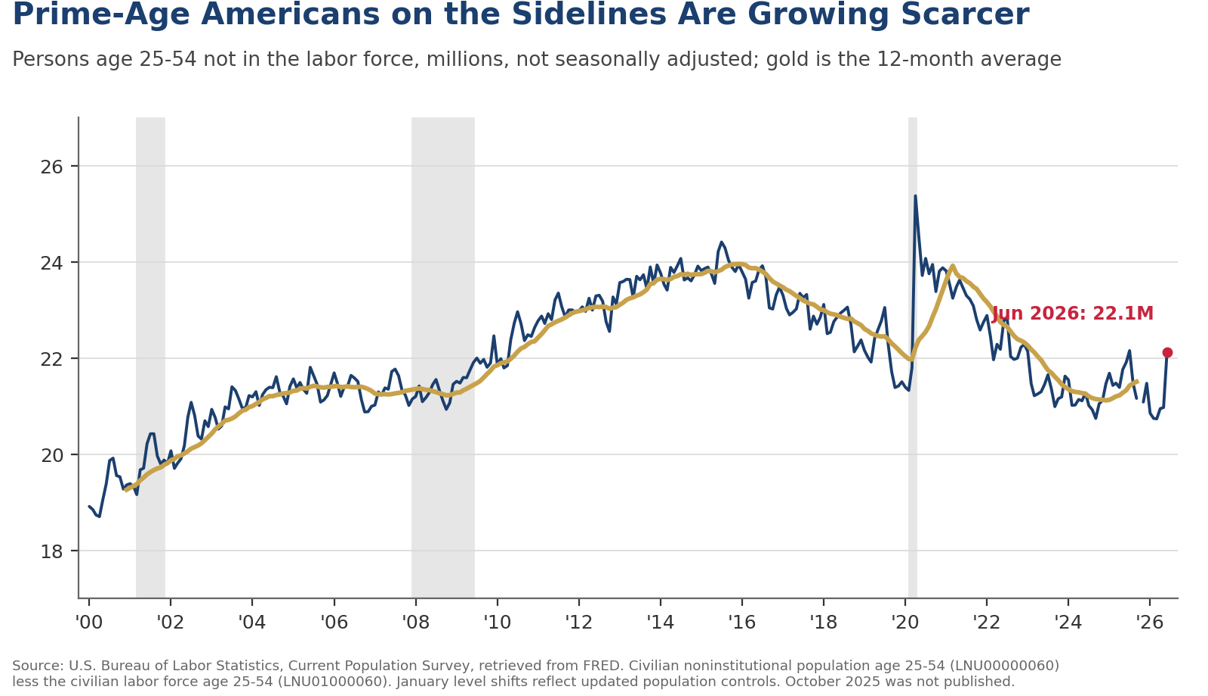
The longer-run trend shows prime-age labor force participation remains quite strong. Over the past twelve months the prime-age rate has averaged 83.7%, higher than any comparable stretch between 2002 and the pandemic, and it stood at 83.9% in May and 84.0% in January, readings never reached in the eighteen years before the pandemic. Even after June’s drop, the rate sits within four tenths of that pre-pandemic ceiling. The number of 25-54 year olds outside the labor force is running near 21.4 million on a twelve-month basis, close to a two-decade low and well below the pre-pandemic peak of nearly 24 million reached in 2015 and 2016. Relatively few potential workers are sitting on the sidelines, which is difficult to square with the notion that prime-age workers are giving up in large numbers.
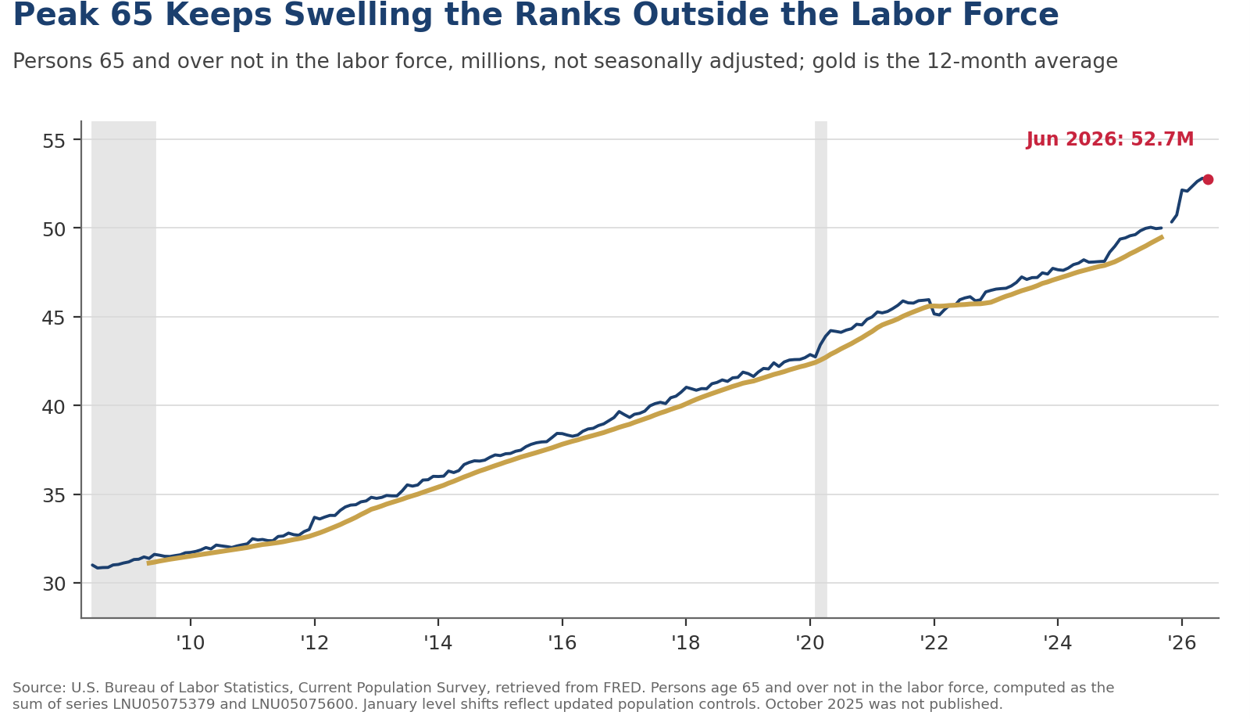
The slide in the headline participation rate is being driven by demographics. The number of Americans age 65 and over outside the labor force has climbed from 31 million in mid-2008 to 52.7 million today, and the pace has quickened since 2024 as the largest birth cohorts reach traditional retirement ages. More than four million Americans are turning 65 each year through 2027, the peak of the Peak 65 wave, and a record 1.85 million retired workers were added to the Social Security rolls in 2025 alone, a figure flattered by the Social Security Fairness Act but extraordinary even allowing for it. Slower immigration removes another offset that boosted labor force growth in prior cycles. The economy has fewer workers, not fewer willing workers.
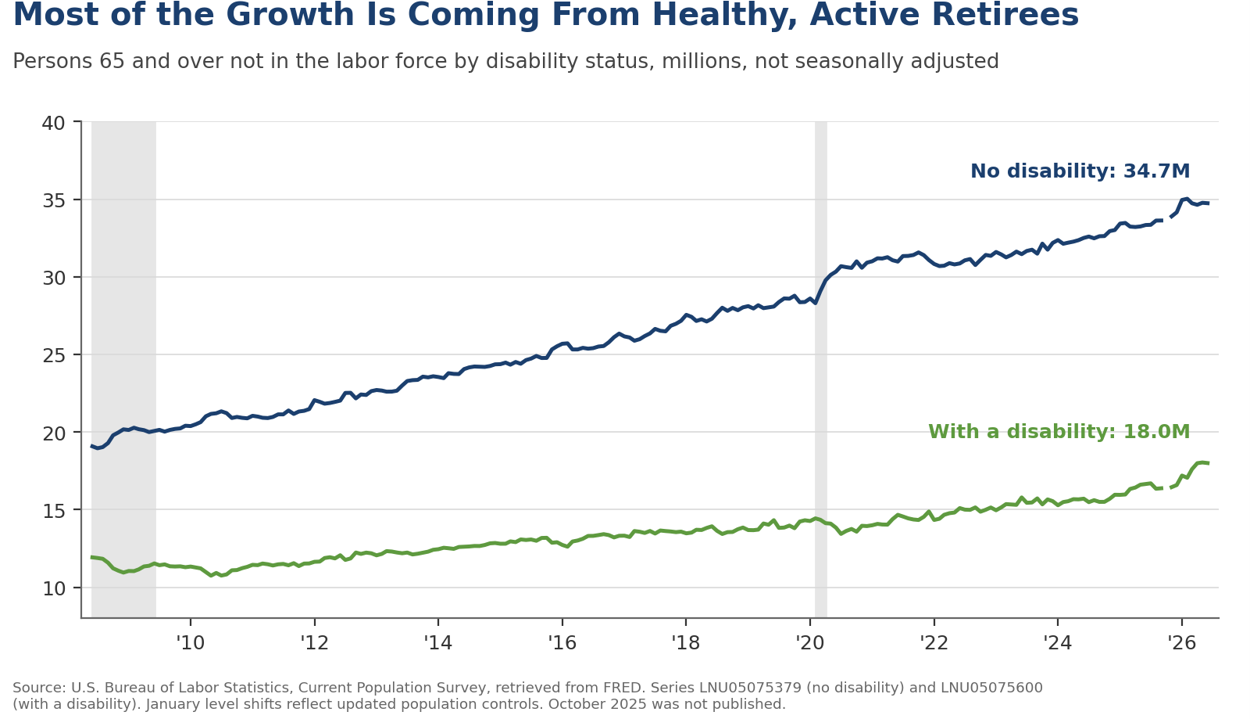
Most of the growth has come from healthy, active retirees. Since 2008, the number of people age 65 and over outside the labor force reporting no disability has nearly doubled to 34.7 million, roughly twice the count of those with a disability. These are largely able-bodied retirees with time on their hands, filling pickleball courts, cruise ships, golf courses and early dinner seatings across the Sun Belt.
The swelling ranks of retirees are likely adding some resilience to consumer spending. Retiree budgets rest on Social Security benefits that are indexed to inflation, along with pensions, annuities and scheduled portfolio withdrawals, rather than on a paycheck. Their spending is therefore far less sensitive to the hiring cycle than that of working households. Adults age 50 and over already account for more than half of U.S. consumer spending, according to AARP, and retirees tilt toward services such as travel, dining and health care, categories that tend to hold up when goods spending wobbles. Happy hour at The Villages and other retiree havens arrives on schedule whether the market has a good day or a bad one.
The implications reach every business that sells to or hires from this economy. Manufacturers face the shift on both sides of the ledger: demand tilts toward replacement purchases, healthcare equipment, aging-in-place products and leisure categories, while the retirements walking out the door are disproportionately skilled trades, raising the return on automation and knowledge transfer just as reshoring collides with a shrinking workforce. Retailers gain a steadier, less cyclical customer whose budget resets every January with the Social Security cost-of-living adjustment, with traffic shifting toward weekday and mid-morning dayparts and service becoming a competitive weapon. Restaurateurs get the most predictable seating in the building, as early dinners, weekday lunches and happy hour fill the shoulder dayparts working households abandoned, though the same demographics thinning the labor pool make the kitchen harder to staff.
Travel, health care, housing and financial services inherit the largest structural tailwinds. Roughly 65% of U.S. cruise passengers are 55 and over, and retirees fill the shoulder seasons that airlines, cruise lines and hotels once struggled to sell. Health care and senior housing face a demand wave and a caregiver shortage at the same time, handing pricing power to providers who can staff. Builders and apartment owners should follow the migration into single-level product, active-adult communities and 55-plus rentals across the Sun Belt, and financial firms should follow the decumulation, as the growth business shifts from accumulation toward annuities, withdrawal strategies and the largest intergenerational wealth transfer on record.
The offset is not unlimited. A prolonged slide in equity or home values would eventually bite through wealth effects, since retirees fund a growing share of their spending from portfolios rather than paychecks. And the same wave of retirements that steadies consumption also tightens the labor supply ceiling, reinforcing our view that growth will remain uneven across this two-speed expansion, with capital spending doing more of the heavy lifting while labor-intensive sectors strain to find workers.
The bottom line is that June’s report says more about who Americans are than about how they feel. Prime-age workers remain attached to the job market at rates rarely seen in the past two decades. The participation slide is concentrated where the calendar, not the economy, is doing the work. For investors and business leaders, the practical implication is a labor market that stays tighter than the headline numbers suggest and a consumer base with a growing, income-steady retiree core.
Mark P. Vitner – President & Chief Economist, Piedmont Crescent Capital
mark.vitner@piedmontcrescentcapital.com · (704) 458-4000
About Piedmont Crescent Capital. Piedmont Crescent Capital provides economic research and advisory services covering U.S. and regional economic conditions, financial markets, housing and commercial real estate. The Piedmont Perspective examines the structural forces shaping the economy. Sources: U.S. Bureau of Labor Statistics, Current Population Survey, retrieved from FRED; U.S. Social Security Administration; AARP. This commentary is for informational purposes only and does not constitute investment advice. © 2026 Piedmont Crescent Capital, LLC. All rights reserved.