

A Negative CPI Print, a New Chair on the Hill and a Fraying Ceasefire
A Negative CPI Print, a New Chair on the Hill and a Fraying Ceasefire
A View from the Piedmont — Weekly Economic & Financial Commentary
This Week's Key Points
- June CPI (Tuesday) is set up for the first negative headline print of this expansion. A drop of roughly 10 percent in retail gasoline prices should pull the headline index down; we forecast a 0.14 percent decline, trimming year-over-year inflation to about 3.9 percent from 4.2 percent.
- Do not let the headline fool you. We forecast a 0.26 percent rise in core CPI, holding the core rate near 2.9 percent, and our HP filter gauge puts underlying inflation right around 3 percent, well above the Fed's objective. One area we will be watching closely is technology products, where the AI buildout is driving chip costs higher, which is showing up in consumer electronics and laptops.
- Chair Kevin Warsh delivers his first semiannual monetary policy testimony, before the House on Tuesday and the Senate on Wednesday. Futures markets price roughly 50 basis points of tightening through mid-2027; we continue to look for the Fed to remain on hold this year, with the next move more likely a hike than a cut.
- The US-Iran ceasefire frayed badly this past week. US forces struck more than 300 targets over three nights after Iranian attacks on commercial shipping, and traffic through the Strait of Hormuz has slowed to a trickle. Oil still ended the week near $71 for WTI, about 30 percent below its spring peaks.
- Senator Lindsey Graham passed away Saturday evening, one day after announcing a White House-endorsed agreement on his bipartisan Russia sanctions bill. Momentum to pass the measure as a tribute has grown quickly, with meaningful implications for global oil supply. Senator Graham served as a bridge between the Trump Administration and the Senate, and vice versa. Whoever takes up that role will greatly determine what the Administration will accomplish before the midterm elections.
The Week in Perspective
The coming week packs more event risk into five trading days than we have seen since the Iran war began. Tuesday brings the June CPI report and the first of two days of semiannual monetary policy testimony from Federal Reserve Chair Kevin Warsh, followed Wednesday by the PPI, the Beige Book and Warsh's Senate appearance. Retail sales, housing starts and the start of second quarter earnings season round out the docket. All of this arrives against a geopolitical backdrop that shifted considerably over the weekend, with renewed US strikes on Iran, a diplomatic push in Muscat, Oman, and the sudden passing of Senator Lindsey Graham just as his Russia sanctions bill appeared headed for the floor.
The macro story we have been telling all year remains intact. This is a capital-led, employment-light expansion, or, as we are fond of saying, protein rather than carbohydrates, powered by AI infrastructure spending, reshoring and productivity gains rather than by hiring. The war-driven energy spike that pushed headline inflation to 4.2 percent in May is now unwinding, but underlying inflation is running near 3 percent and the Fed has little room for error. That tension, between a falling headline rate and a firm underlying trend, is the central theme of the week ahead.
Markets and Financial Developments
Equities carried strong momentum into the weekend despite the renewed fighting in the Gulf. The S&P 500 rose 0.4 percent Friday to close at 7,575, its fourth consecutive winning week and within roughly half a percent of its June 2 record of 7,621. The Nasdaq added 0.3 percent to 26,282, while the Dow gained 150 points to 52,637, though the blue chips lagged on the week. The AI trade continues to set the tone. Nvidia rose about 4 percent Friday and Meta jumped 6 percent, capping its best week since early 2024, after reports suggested the company is building AI capacity at a much lower cost per gigawatt than the Street had assumed. SK Hynix's American depositary receipts surged in their Nasdaq debut after the memory chipmaker raised $26.5 billion in the largest US listing ever by a foreign company, a clear signal that investor appetite for AI hardware remains deep. The stock sold off sharply in Korea on Monday, setting a weak undertone to Nasdaq trading this week.
Fixed income tells a more cautious story. The 10-year Treasury yield rose nine basis points on the week to 4.57 percent, its highest close since late May, and has risen in eight of the past nine sessions. Futures markets have swung from pricing cuts earlier this year to roughly 50 basis points of hikes through mid-2027, a shift that reflects both the May inflation surprise and the hawkish tone of Chair Warsh's first FOMC meeting in June, when the committee lifted its median 2026 inflation projection to 3.6 percent and nudged the dot plot higher. Equities have historically struggled in the opening months of tightening cycles, with an average 2 percent decline over the first three months across the past seven episodes, and this capital-intensive cycle is unusually sensitive to the cost of capital. A soft CPI print and measured testimony from Warsh could relieve some of that pressure; the S&P 500 has moved about 0.6 percent in absolute terms on the average CPI day over the past year.
Commodities reflected the week's geopolitical whiplash. WTI crude rose about 4 percent on the week on renewed Hormuz disruptions but settled Friday at $71.41, with Brent at $76.01, both roughly 30 percent below their spring peaks. Prices rose further on Monday, with WTI climbing to $78 and Brent rising to $82. The UAE lifted crude output to a record last month, and other Gulf producers continue to route around the strait where they can. The dollar firmed modestly, while the yen bounced off 40-year lows after Tokyo signaled it would encourage pension funds to hold more domestic assets.
Inflation Watch: Reading Through the Gasoline Swing
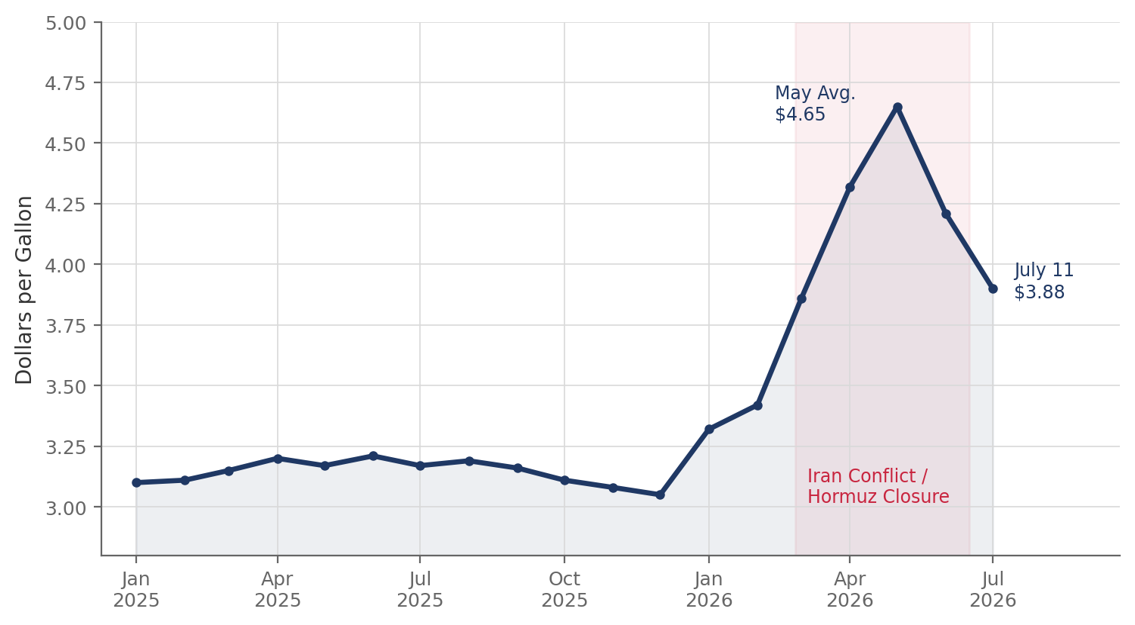
The June CPI should deliver the rare sight of a declining price level, and we would caution readers not to read too much into it. Retail gasoline prices fell roughly 10 percent from May to June as the mid-June memorandum of understanding reopened the Strait of Hormuz and crude prices tumbled from their wartime highs. With gasoline carrying a weight of nearly 4 percent in the CPI and June's seasonal factors offering little offset, the pump-price decline alone should subtract 0.35 to 0.40 percentage points from the headline index. We look for headline CPI to fall 0.14 percent for the month, pulling the year-over-year rate down to about 3.9 percent from May's 4.2 percent, which had been the fastest pace in more than three years.
Core inflation is another matter entirely. We forecast a 0.26 percent rise in core CPI in June, a touch below the 0.3 percent consensus, either of which would hold the core rate near 2.9 percent, essentially where it stood a year ago. Shelter costs continue to moderate only gradually, and services inflation remains sticky. Within core goods, we will be watching technology products closely. May brought the first monthly decline in core goods prices in 14 months, suggesting the bulk of tariff pass-through is behind us, but a new source of goods inflation is building. Surging memory chip and component costs tied to the AI buildout are working their way into consumer electronics, and Apple has announced price increases averaging about 20 percent on some of its most popular products. Information technology commodities carry a weight of only about three-quarters of a percent in the CPI, so the top-line effect will be modest, but the swing in direction matters: core goods are more likely to add to inflation over the second half than subtract from it.
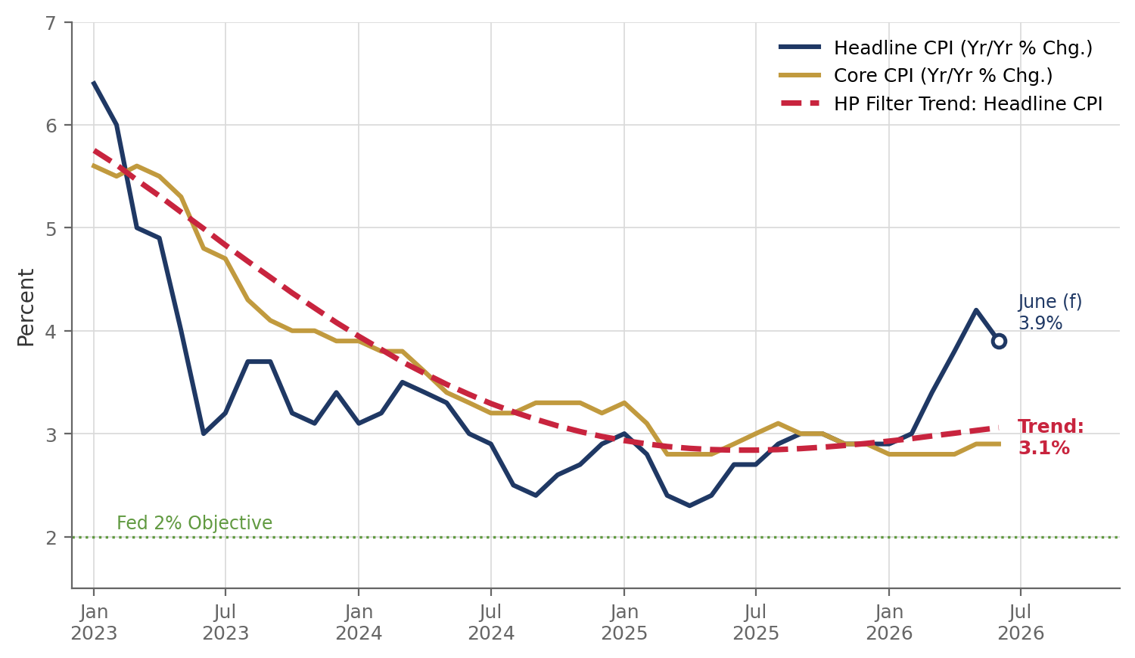
Our HP filter gauge of trend inflation now sits right around 3 percent, up from 2.8 percent at the turn of the year. The Hodrick-Prescott filter strips the monthly noise out of the inflation data and gives us a cleaner read on where prices are trending once temporary shocks wash out. The message is uncomfortable for the Fed. Even after the war-related energy spike unwinds, the underlying pace of inflation appears to have drifted up toward 3 percent rather than settling back toward 2 percent. The trimmed-mean gauges we favor, from the Cleveland and Dallas Feds, tell a similar story, with both running near 0.3 to 0.4 percent monthly in recent readings. A negative June headline will make for friendly newspaper coverage, but the underlying trend explains why the FOMC struck such a hawkish tone in June and why futures markets are entertaining hikes rather than cuts.
Geopolitics: A Fraying Ceasefire and a Sudden Loss
The US-Iran ceasefire came under severe strain this past week, though markets are treating the flare-up as containable. Iranian forces fired missiles at three commercial vessels transiting the Strait of Hormuz early in the week, the first such attacks since the 14-point memorandum of understanding was signed in mid-June. US Central Command responded with three nights of strikes on more than 300 Iranian targets, including missile and drone sites, naval assets and coastal surveillance positions, with roughly 140 targets hit in the latest round early Sunday. Iran retaliated against US military facilities in Jordan and elsewhere in the Gulf, and the IRGC has again declared the strait closed. Commercial transits have slowed dramatically, with no large vessels broadcasting their positions along the Oman-hugging southern route since July 7.
Diplomacy has not broken down, and that distinction matters for markets. Iranian Foreign Minister Araghchi traveled to Muscat, Oman, on Saturday for talks with his Omani counterpart, and Oman has drafted a proposal to manage traffic through the strait. President Trump has declared the memorandum of understanding over but says talks will continue, and Qatari mediators remain engaged. The commodity market response has been telling: oil rose about 4 to 5 percent on the week but remains far below the spring peaks, gasoline held steady at $3.88 per gallon nationally, and jet fuel and Gulf petrochemical exports are still well off their wartime highs. Our composite read is that the passthrough from the conflict to core inflation peaked in the second quarter and should fade through year-end, provided the current exchange does not escalate into something larger. A sustained return to triple-digit oil would add only a few basis points per month to core inflation directly, but the expectations channel is the risk worth watching, and it is the one Chair Warsh will surely be asked about on the Hill.
The war between Russia and Ukraine may be approaching an inflection point. President Trump held a cordial meeting with President Zelensky on the margins of the NATO summit in Ankara on July 8, and Washington has agreed to license Patriot missile production in Ukraine, a significant step in Kyiv's drive toward defense self-sufficiency. Ukrainian long-range drones have struck oil infrastructure as far away as St. Petersburg and the Urals, contributing to gasoline shortages inside Russia, an economy now flirting with recession and a budget crisis. Moscow, for its part, claims continued gains in the Donbas and has, if anything, expanded its territorial demands. Both diplomatic momentum and escalation risk have increased at the same time, which is precisely the kind of environment in which energy and defense markets can move quickly.
Senator Lindsey Graham's sudden passing on Saturday evening adds a poignant and consequential twist. Graham died of an aortic tear at 71, one day after announcing in Kyiv that he had reached agreement with the White House on a version of his long-pending Russia sanctions bill, co-authored with Senator Blumenthal, that the administration will support. The bill would give the President broad authority to impose tariffs and secondary sanctions on countries purchasing Russian oil and gas, aimed squarely at China, India and Brazil, which imports diesel and other refined products from Russia. Colleagues in both parties, including Senators Blumenthal, Shaheen and Wicker, are now urging swift passage as a tribute to Graham's legacy, and prospects for enactment appear to have improved markedly. For energy markets, secondary sanctions that meaningfully curtail Russian crude purchases would tighten global supply at a moment when Gulf flows are already disrupted, one more reason a risk premium is likely to remain embedded in oil prices even if the Hormuz situation stabilizes. Closer to home, Graham's passing opens a South Carolina Senate seat and sets up a special election that will reshape the Palmetto State's congressional delegation. South Carolina will hold a special primary on August 11, with a host of candidates fresh off a contested governor's race likely to enter.
Monetary Policy: Warsh Goes to the Hill
Chair Warsh's first semiannual testimony is the week's most important policy event, CPI notwithstanding. Warsh testifies before House Financial Services on Tuesday and Senate Banking on Wednesday, delivering the monetary policy report the Fed submitted to Congress on Friday. His June FOMC debut was decidedly hawkish: the committee lifted its median 2026 inflation projection to 3.6 percent from 2.7 percent and moved the median funds rate projection up to 3.8 percent, signaling higher for longer. Yet his remarks at the ECB Forum leaned the other way, emphasizing declining inflation risks, the supply-side benefits of AI and a firm commitment to the 2 percent objective. Lawmakers will press him on the gap between those two messages, on how the Fed intends to treat energy shocks it cannot control, and on the August methodological changes that are expected to lower the measured year-over-year core PCE rate by roughly 0.2 percentage points.
Our view has not changed. We expect the funds rate to finish the year in its current 3.50 to 3.75 percent range, and we continue to believe the next move is more likely a hike than a cut, though we would put the probability of tightening this year at only about one in four. This week's inflation data and Warsh's Humphrey-Hawkins testimony will go a long way toward determining whether the Fed retains the flexibility to hold off on any rate hikes until 2027, which is what we currently expect. Anything worse than a 0.3 percent rise in the core CPI, or even a broadening in the breadth of price increases within the core, would weaken the case for waiting until next year. Futures markets pricing roughly 50 basis points of hikes through mid-2027 strikes us as an overcorrection to the May inflation data, just as pricing for multiple cuts early this year was an overcorrection in the other direction. The June core PCE, due later this month, is likely to print around 0.24 percent for the month, slightly firmer than core CPI owing to the lagged financial services component.
The Global Backdrop
The durability of the US-Iran agreement has become the hinge on which the global outlook swings, and it was the through-line of Oxford Economics' quarterly roundtable last week. Oxford judges the latest escalation too small to change its baseline for growth, inflation or policy and expects the US economy to regain momentum in the second half as lower fuel prices repair household purchasing power, a read that lines up with our own capital-led thesis. We share that extended-pause baseline, though we would tilt the risks somewhat more toward tightening, and we take the recent Fed minutes, focused on inflation rather than employment, as leaving the door open to a hike. Europe looks a bit better on their read as well, with the eurozone having weathered the energy shock better than feared even as the ECB keeps stressing inflation risks. The near-term impulse we are watching most closely is the goods inflation from the AI buildout that Oxford itself flags, the same impulse that should surface in the technology components of Tuesday's CPI.
Labor and Housing: Steady Jobs, Rate-Sensitive Housing
The labor market continues to hold its ground without adding much to it. Initial jobless claims edged down to 215,000 last week, in line with expectations, and the four-week average improved. Layoffs remain low even as hiring stays subdued, the signature of this employment-light expansion. Businesses are building capacity without adding headcount, and the productivity data continue to validate that strategy.
Housing remains the economy's most rate-sensitive corner. Existing home sales fell 2.4 percent in the latest month to a 4.09 million-unit annual pace, defying expectations for a gain, as mortgage rates near 6.5 percent continue to sideline buyers. The median price was essentially flat and months' supply held at 4.3. Friday's housing starts report should bounce, with the consensus looking for a gain of roughly 12.5 percent after a weak prior month, but the single-family trend remains soft. Inventory gains are the missing ingredient; until resale supply improves meaningfully, affordability will remain stretched and sales will stay range-bound. We may see a slight bounce in sales in coming months, as buyers pull demand forward on fears that mortgage rates are headed higher.
The Week Ahead
Monday, July 13. Fed Vice Chair Bowman speaks on regulation; Governor Waller speaks. No major data. Quarterly earnings season begins in earnest Tuesday.
Tuesday, July 14. June CPI (PCC forecast: headline -0.14%, core +0.26%). Chair Warsh's semiannual testimony before House Financial Services. Fed speakers include Barr (AI), Goolsbee and Cook. Big bank earnings kick off the reporting season.
Wednesday, July 15. June PPI (consensus +0.2% headline); Empire State manufacturing; Chair Warsh testifies before Senate Banking; Beige Book (watch for regional color on energy volatility and shipping costs).
Thursday, July 16. June retail sales (consensus +0.1% headline, +0.4% control group); initial jobless claims; Philadelphia Fed manufacturing; pending home sales; Dallas Fed's Logan speaks.
Friday, July 17. June housing starts (consensus looks for a rebound of roughly 12.5%); industrial production (+0.2%); import & export prices; University of Michigan consumer sentiment (preliminary July).
CFO & Treasurers Corner
Rates and borrowing: Futures markets pricing hikes creates both optionality and volatility risk. With this cycle unusually capital-intensive, sensitivity to the cost of capital is elevated. We favor locking in longer-term financing while spreads remain attractive or pairing floating-rate structures with hedges. The window around Tuesday's CPI and testimony could produce the best or worst issuance conditions of the month.
Inflation and energy: The fading passthrough from the Gulf conflict is constructive for input costs, but the renewed fighting is a reminder that the tail risk has not gone away. Treasurers with Gulf-exposed supply chains should revisit hedging programs now, while forward energy prices remain well below the spring peaks. Watch electronics and component costs separately from broad energy costs; AI-driven chip demand is a distinct and durable source of input inflation.
Russia sanctions contingency: Passage of the Graham-Blumenthal sanctions bill now looks considerably more likely. Firms with exposure to Chinese, Indian or Brazilian counterparties should assess how secondary sanctions on Russian energy purchases could ripple through shipping rates, customer costs and compliance obligations.
Consumer and housing: Thursday's retail sales report should show a resilient but selective consumer. Plan around a two-Americas (K-shaped) demand environment: upper-income households continue to spend on services and experiences while rate-sensitive and lower-income segments trade down.
Cash and liquidity: Steady claims and solid spending keep recession signals muted. Maintain flexibility for opportunistic moves if equity volatility rises around the CPI-testimony window.
Regional Perspective: The South Shows Well in CNBC's Top States
The South was well represented in CNBC's latest America's Top States for Business study, even as top honors traveled north. Ohio claimed the No. 1 ranking for the first time in the study's 20-year history, propelled by the nation's best infrastructure, low business costs and a deepening data center pipeline. But North Carolina, which finished second by a mere nine points, earned the distinction that matters most to us: the nation's strongest economy. The Tar Heel State ranked first outright in the Economy category, on 3.2 percent first quarter growth and 3.7 percent unemployment, climbed to third for workforce and eighth for technology and innovation, and has now finished first or second overall for six consecutive years. Virginia placed third and Texas fourth, giving the South three of the top four spots, and Arkansas, which is riding a wave of industrial development, took Most Improved honors.
The results read like a scorecard for the themes we have been writing about for years. Capital, people and production continue to flow toward the South, the same Great Reshuffling of households and firms that has powered the region's outperformance through this capital-led expansion. It is telling that CNBC re-weighted its methodology this year to make infrastructure the heaviest category and to score permitting for the first time; site readiness, power availability and speed to build are precisely the terrain on which the AI and reshoring investment waves are being fought, and precisely where the Southeast has invested ahead of demand. Ohio's win, built on shovel-ready sites and a 10-gigawatt SoftBank data center campus, is a reminder that the Midwest is now competing hard for the same projects. North Carolina's slip to 35th for cost of living is the flip side of its own success, a strain we have chronicled across our Charlotte and Raleigh-Durham outlooks, and the strongest argument for the housing and infrastructure investment the state's newly signed budget can now advance.
The near-term regional backdrop remains favorable. The retreat in gasoline and jet fuel prices from their wartime peaks is a meaningful tailwind for the region's logistics, manufacturing and household budgets, and Wednesday's Beige Book will offer fresh color from the Richmond and Atlanta districts on how firms are absorbing energy volatility and shipping costs. Housing across the major Carolina metros echoes the national pattern of rate sensitivity, though resale inventory has improved more here than nationally, which should help moderate price pressures. The loss of Senator Graham also carries regional weight beyond politics: South Carolina loses considerable Senate seniority at a moment when the state is competing aggressively for defense, port and advanced manufacturing investment.
Strategic Takeaway
We remain constructive on the expansion, and this week will test that view from several directions at once. A negative headline CPI paired with measured testimony from Chair Warsh would reinforce the extended-pause narrative, support lower yields and likely extend the equity rally. The greater risk is the opposite combination: a firm core print alongside hawkish testimony would validate the futures market's drift toward hikes and pressure the rate-sensitive corners of the market. Underneath the weekly noise, our reading is unchanged. Growth is solid and increasingly broad, underlying inflation is closer to 3 percent than 2, the Fed will be patient but is not finished, and geopolitics will continue to set the tempo for energy markets. We will update our views immediately following Tuesday's data and testimony.
U.S. Economic & Financial Outlook
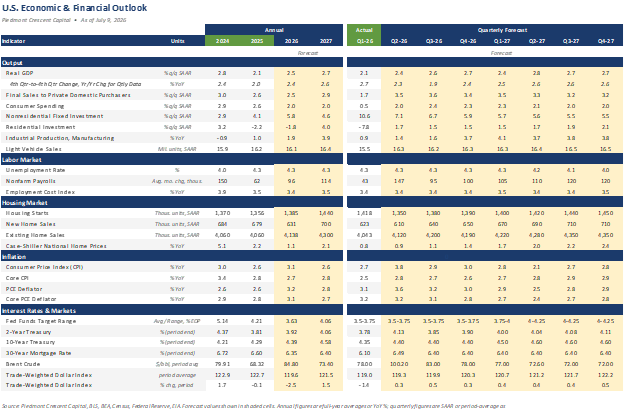
Source: Piedmont Crescent Capital, BLS, BEA, Census, Federal Reserve, EIA. Forecast values shown in shaded cells. Annual figures are full-year averages or YoY %; quarterly figures are SAAR or period-average as noted in Units.
Forecast disclaimer: The projections above reflect Piedmont Crescent Capital's views as of the date shown and are subject to change without notice. They are provided for informational purposes only, are not a guarantee of future results, and do not constitute investment advice or a recommendation to buy or sell any security. Actual outcomes may differ materially. © 2026 Piedmont Crescent Capital.
About Piedmont Crescent Capital. Piedmont Crescent Capital provides economic research and advisory services covering U.S. and regional economic conditions, financial markets, housing and commercial real estate. A View from the Piedmont is published weekly. This report is for informational purposes only and does not constitute investment advice or a recommendation to buy or sell any security. Views expressed are those of the author as of the date of publication and are subject to change without notice. © 2026 Piedmont Crescent Capital. All rights reserved.

A View from the Piedmont: Fewer Workers, Not Fewer Jobs
PIEDMONT CRESCENT CAPITAL
A View from the Piedmont
Download the full report (PDF)
Last week’s holiday-shortened data flow reinforced a familiar but evolving narrative: the U.S. economy remains on a sound footing with resilient, if cooling, momentum, while geopolitics, the buildout of AI, and the structural shift toward electrification are reshaping relative advantages and investment opportunities. Markets digested a soft June jobs print, pragmatic signals from new Fed Chair Kevin Warsh at Sintra, further de-escalation on Iran, and the first signs of a modest rebound in residential investment. Primary dealer positioning in Treasuries continued to build, and the long-term Age of Electricity theme, highlighted in BCA Research’s latest special report, gained sharper focus amid AI-driven demand, a surprising June jump in EV sales, and ongoing grid constraints. We also take a step back this week, in our Piedmont Perspective, to consider what the primary season’s socialist wave says about an expansion that, so far, is being driven more by capital than by labor.
Key Economic Reports of the Week
A compact scorecard of the week’s major releases, with our one-line read on each.
| Report (period) | Reading | PCC read |
|---|---|---|
| Nonfarm payrolls (Jun) | +57,000 | Half of consensus, but the labor force fell 720,000; less slack than the headline implies. |
| Unemployment rate (Jun) | 4.2% | Lower, but on falling participation rather than stronger hiring. |
| ISM Manufacturing (Jun) | 53.3 | Sixth straight month in expansion; input-price index dived 9.1 points to 73.0. |
| ISM Services (Jun) | Due Jul 6 | May registered 54.5, a 23rd consecutive month of expansion; we look for confirmation. |
Also released: May construction spending (reviewed below) and a firmer late-June pace of vehicle sales, led by a jump in EVs.
The June ISM Manufacturing PMI, released July 1, fit our capital-led thesis. The headline eased to 53.3 from 54.0 but marked a sixth consecutive month of expansion, with new orders (56.0) and production (52.2) still carrying the recovery. Employment, by contrast, rose 1.1 points to 49.7 yet stayed in contraction for a 33rd straight month, the build-without-hiring pattern our productivity work anticipated: output rising on flat-to-falling hours is productivity, not weakness. The most telling line was on prices, where the input-cost index plunged 9.1 points to 73.0, its steepest drop since July 2022, as the Iran-war premium on oil and diesel receded, though 15 of 18 industries still reported higher costs. Lean customer inventories, at 42.3, point to further production ahead. The factory sector is not booming, but it is broadening, and its cost pressures are easing.
Labor Market: Fewer Workers, Not Fewer Jobs
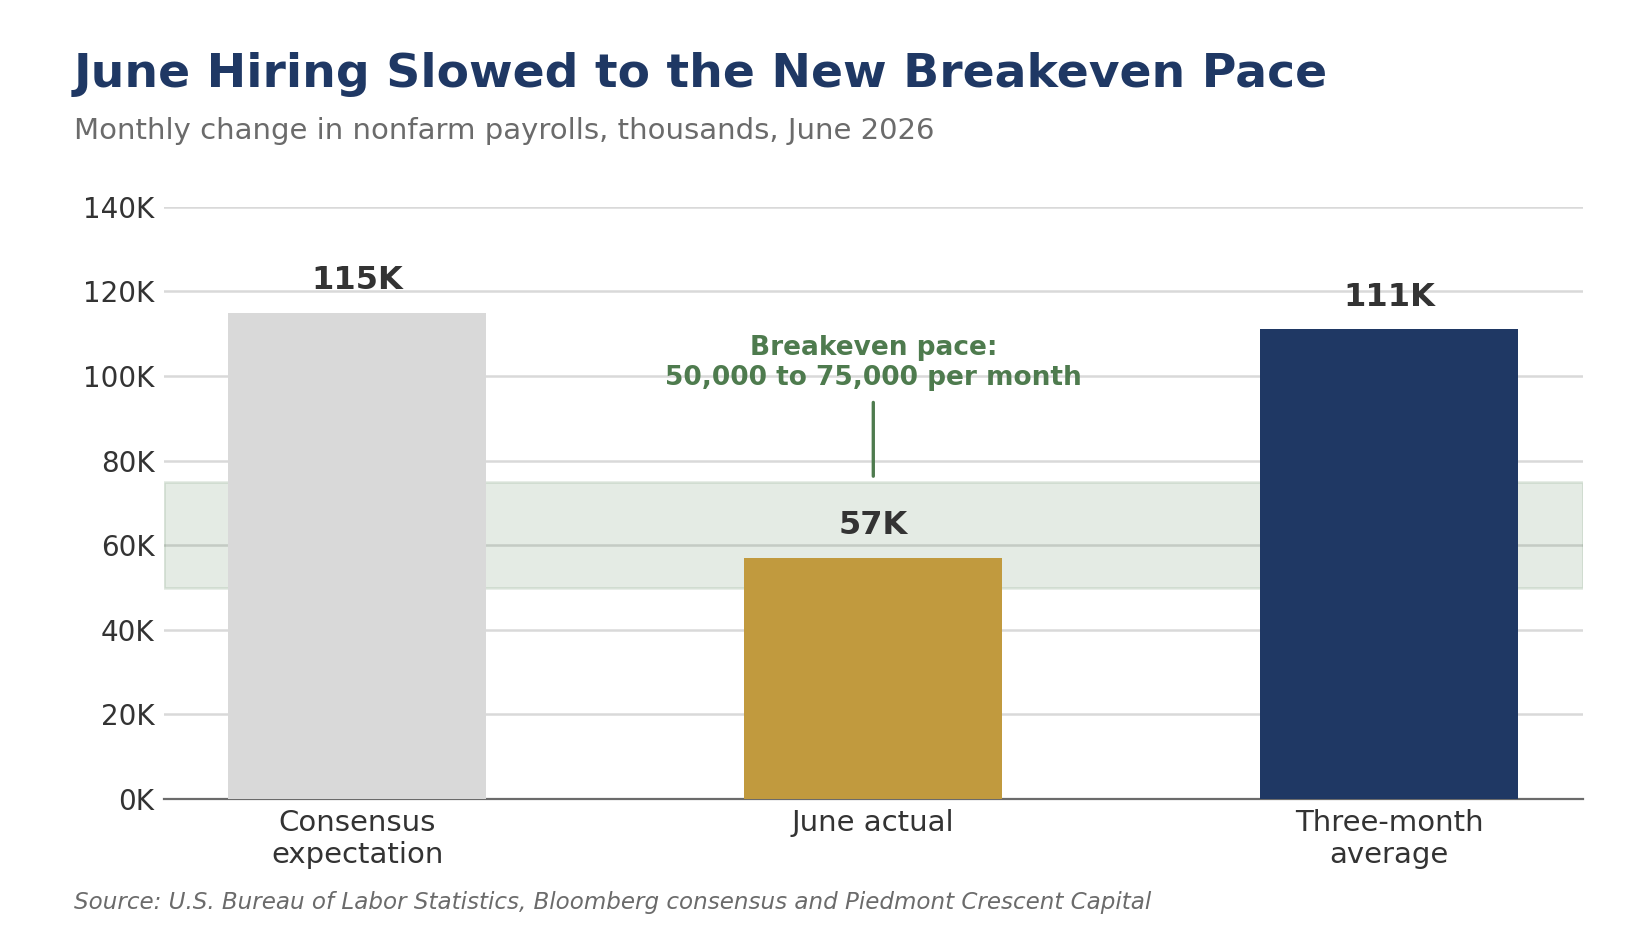
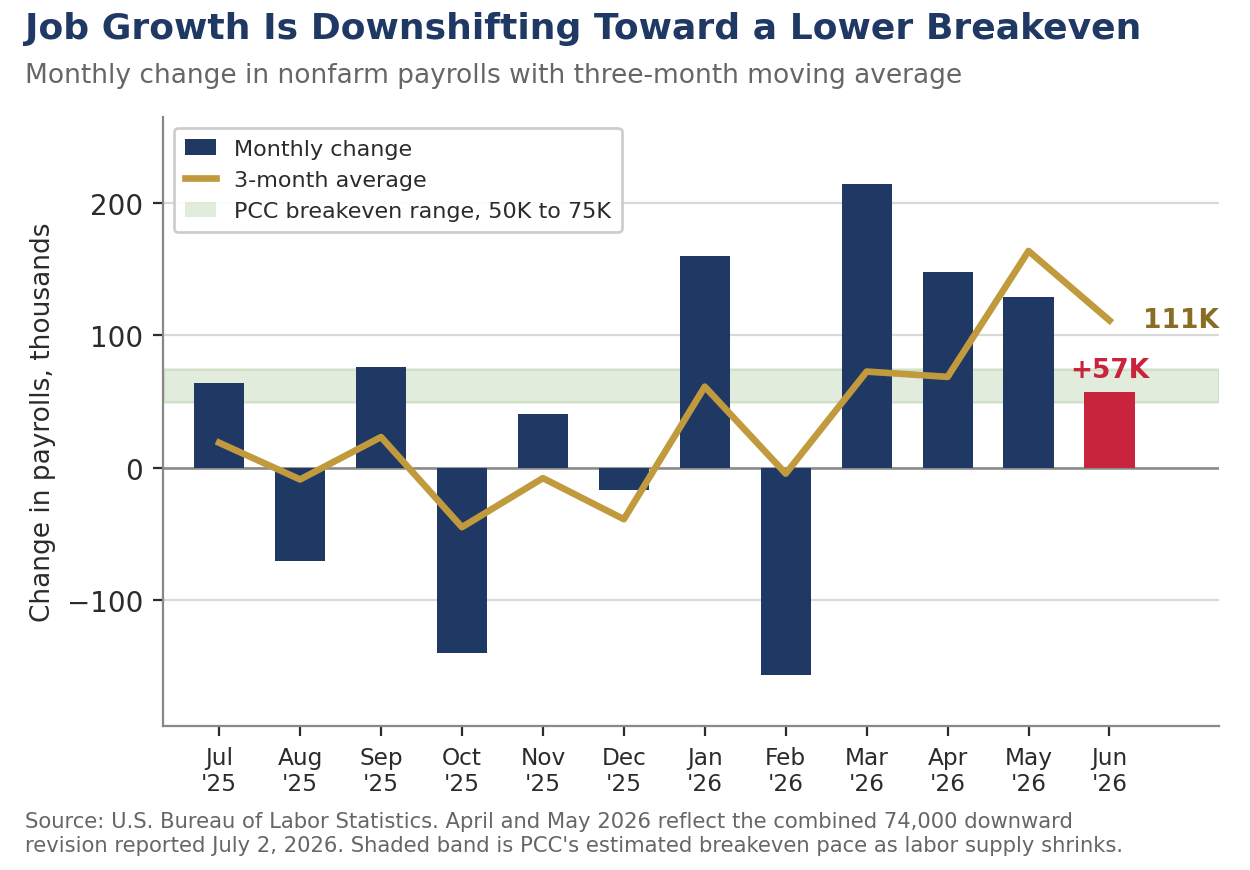
The June Employment Situation report delivered a headline disappointment, but we read it as something more interesting than a labor market rolling over: an economy generating fewer workers, not fewer jobs. Nonfarm payrolls rose just 57,000, roughly half the consensus expectation, and April and May were revised down a combined 74,000. The unemployment rate nevertheless fell to 4.2%, but for a less obvious reason. The civilian labor force shrank by 720,000 in June, pulling participation down to 61.5%, its lowest level since early 2021. When labor supply is barely growing, it takes only 50,000 to 75,000 jobs a month to hold the unemployment rate steady, and June’s gain landed squarely in that band. The three-month average of 111,000 remains comfortably above breakeven.
The details support the more constructive reading. Leisure and hospitality shed 61,000 jobs, but the early Memorial Day pulled seasonal hiring into May, and the two months roughly net out; there were also fewer days between the April and May survey periods, which lifted the seasonal adjustment for May. The World Cup, which opened one day before the June survey week, is filling bars and restaurants across the country in the middle of the afternoon, though most of that activity shows up as longer hours rather than new headcount. Little of it came through in the June payroll count, which is why we are watching the July report closely. Meanwhile, manufacturing breadth quietly improved, with the factory diffusion index reaching its best level in more than a year and catching up to an ISM survey that has been in expansion all year. We see this as the early innings of the capital-led expansion broadening out, and we expect some follow-through in professional services in the coming months.
Average hourly earnings firmed to 0.3% for the month and 3.5% over the year. The gains were largest in financial services, information, professional services, and other services, which is not where the job growth has been. Our sense is that, with less turnover and fewer new hires, a more seasoned workforce is posting modest raises on a higher wage base, which lifts average hourly earnings more than the underlying pace of pay increases would suggest. That pace is not a source of fresh overheating pressure, but with underlying inflation still running near 2.9% on our preferred trend measure, neither is it yet consistent with a sustained return to 2%. The prime-age softness was concentrated in the 25-34 cohort, a detail we return to in this week’s Piedmont Perspective. The bottom line: the labor market has lost some luster but is not deteriorating, and the shrinking labor force means there is less slack behind the headline than the payroll number suggests.
Monetary Policy: Warsh Leans Pragmatic; Our Call Is Unchanged
Chair Warsh’s comments at the ECB Forum in Sintra, Portugal, were the week’s most market-moving policy development. He noted that inflation expectations and inflation risks have both come down over the past four weeks, gave renewed emphasis to the employment side of the dual mandate, and highlighted the potential medium-term disinflationary effects of AI-driven supply expansion. He also signaled openness to structural change through the new task forces on communications and real-time data. Forecasters responded by pushing out the timing of the next move: Oxford Economics now sees the next cuts in September and December of 2027, and the broader consensus has converged on no change in the funds rate for the rest of 2026. The Supreme Court’s decision preserving Governor Cook’s position bolsters institutional independence, though that fight will continue.
Our call is unchanged. We continue to expect no cut in 2026, with the next move more likely a hike than a cut, arriving in 2027 or early 2028 as stronger growth, coming at a time when the economy is already operating at full employment, bolsters wage gains, consumer spending, and corporate pricing power. This week’s news, a soft payroll print, falling energy prices, and a chair speaking to both sides of the mandate, extends the pause; it does not change the destination. The mid-July CPI report is the next big point of focus, with sharply lower gasoline prices widely expected to pull the headline into negative territory for the month. Rising memory prices are already reaching consumers, however, and could deliver an upside surprise in core goods.
Geopolitics and Energy: The Fever Has Broken, for Now
Progress on the Iran front continues to deliver relief. The U.S.-Iran memorandum of understanding provides a 60-day ceasefire window for negotiations, with extensions likely, and Strait of Hormuz traffic is recovering across bulk, container, LNG, and crude categories, though normalization remains incomplete. Crude benchmarks have retreated sharply from conflict peaks, and regular unleaded gasoline has fallen below $4.00 per gallon for the first time since late March, down 60 cents in four weeks. Risks remain, including the possibility of renewed hostilities closer to the November midterms and a lingering geopolitical premium, but the worst of the price shock appears to be behind us.
The Age of Electricity: China’s Scale, America’s Innovation
BCA Research’s lead special report provides the week’s most forward-looking thematic anchor. The world is entering an Age of Electricity, driven by transport, industry, buildings, and above all AI, with global electricity demand projected to rise roughly 40% by 2035 and the binding constraint shifting from generation to transmission, storage, and grid flexibility.
China’s advantages are structural: the world’s largest electricity system, an ultra-high-voltage transmission network, industrial power costs roughly 40% below Europe’s, and a planned grid and storage buildout on the order of RMB 8 to 10 trillion over the next five years. The United States counters with an innovation ecosystem that has thrived despite aging infrastructure and slow permitting, and data centers are the distinctive American demand driver, where the theme lands closest to home. The grid buildout is both an opportunity and a competitive pressure for the Carolinas and the broader Southeast, where utility capex plans, data-center recruitment, and manufacturing reshoring converge on the same constraint. Grid equipment, transmission, storage, nuclear-exposed utilities, and copper stand to benefit; we will return to the regional implications in upcoming client work.
Housing and Construction: A Modest Q2 Rebound
May construction spending left our Q2 tracking largely unchanged. Private residential investment is on track for an increase of roughly 1% at an annual rate, the first quarterly gain since late 2024, driven by home improvements, a pickup in existing home sales that is boosting brokers’ commissions, and a gradual recovery in single-family construction. Multifamily remains mixed, and the pipeline of both single-family and multifamily projects continues to wind down, trimming residential construction employment. Private nonresidential structures continue to contract, tracking a 4.7% annualized decline, weighed down by the long-running drop in factory construction. Data-center spending is surging and has been revised higher, but it represents less than a tenth of private nonresidential outlays; the larger AI-related dollars flow through equipment, software, and R&D. The slide in manufacturing construction appears to be tempering, however, and we are seeing gains in institutional projects and in some heavy energy and transportation infrastructure. Housing will struggle to replicate Q2’s momentum in the second half, as single-family builders work down a large stock of completed unsold homes against margin pressure and higher-for-longer interest rates. A modest rise in new home sales would set the table for residential construction in 2027.
Financial Markets and Positioning
Equities posted a constructive holiday-shortened week, with the Dow extending its winning streak to fresh records on the jobs-day relief rally, while the Nasdaq absorbed some chip-sector rotation following a strong second quarter. Primary dealers continued building fixed-income positions through late June, with Treasury holdings rising $23.1 billion to $515.6 billion, including another record in the long bond sector, while MBS holdings eased modestly. The positioning reflects inventory management, relative value, and expectations for a prolonged policy pause.
The Week Ahead: A Quieter Calendar, Loud Minutes
The data calendar thins out after a heavy stretch, and consensus figures below reflect market surveys rather than any single house. Monday brings the June ISM services index, the week’s marquee release; the services gauge held up at 54.5 in May, its strongest in three months, and consensus looks for a reading in the mid-53 to 54 area, still comfortably in expansion. Tuesday’s May trade balance is expected to show the deficit widening from April’s $55.9 billion as imports rebound, and Wednesday brings May wholesale inventories. Thursday rounds out the week with weekly jobless claims, seen near 220,000 after 215,000, and June existing home sales, where another gain would extend a tentative housing thaw. Friday has no major releases.
The main event is Wednesday afternoon’s minutes from the June 16-17 FOMC meeting. That meeting, Chair Warsh’s first, held the funds rate at 3.50 to 3.75 percent by a unanimous vote but paired the hold with a decidedly hawkish set of projections: the median 2026 dot jumped to 3.8 percent from 3.4 percent in March, flipping the implied path from a cut to a possible hike, with nine of eighteen participants placing at least one hike on the table and seventeen of eighteen judging the risks to inflation to the upside. We will read the minutes for how broadly that hawkish shift is held, how the committee separates the energy-driven part of inflation from the underlying trend, and for any detail on Chair Warsh’s communication overhaul, including the five new task forces and his decision to withhold a dot of his own. Little in the minutes is likely to disturb our house call of no cut this year, with the next move more likely a hike than a cut.
The speaking calendar reinforces the theme. Governor Waller appears Monday, and two voters, New York’s John Williams and Dallas’s Lorie Logan, speak Thursday. All three have leaned toward patience or caution of late, with Logan the most explicit that further tightening could prove necessary later this year if inflation does not resume its descent. We would treat any dovish surprise as the news, precisely because it would run against the grain the June meeting established.
THE PIEDMONT PERSPECTIVE | ABRIDGED
A Wake-Up Call
In the summer of 1991, a British band called Jesus Jones had the biggest song in America, and it was a song about watching history turn. “Right Here, Right Now” was written in the afterglow of 1989, as the Berlin Wall came down and hundreds of millions of people walked out of a failed economic experiment that had run for most of a century. Thirty-five years later, we find ourselves wondering where Jesus Jones is when we need them.
The Democratic Socialists of America are having their best election cycle in the organization’s history. On June 23, candidates endorsed by New York Mayor Zohran Mamdani swept their congressional primaries, unseating a five-term incumbent in Upper Manhattan. One week later in Denver, a 29-year-old democratic socialist toppled a congresswoman who had held her seat since 1997. A year ago the DSA counted two members of Congress; it is now on track for at least five, with roughly three dozen primary victories this cycle. This is no longer a New York story.
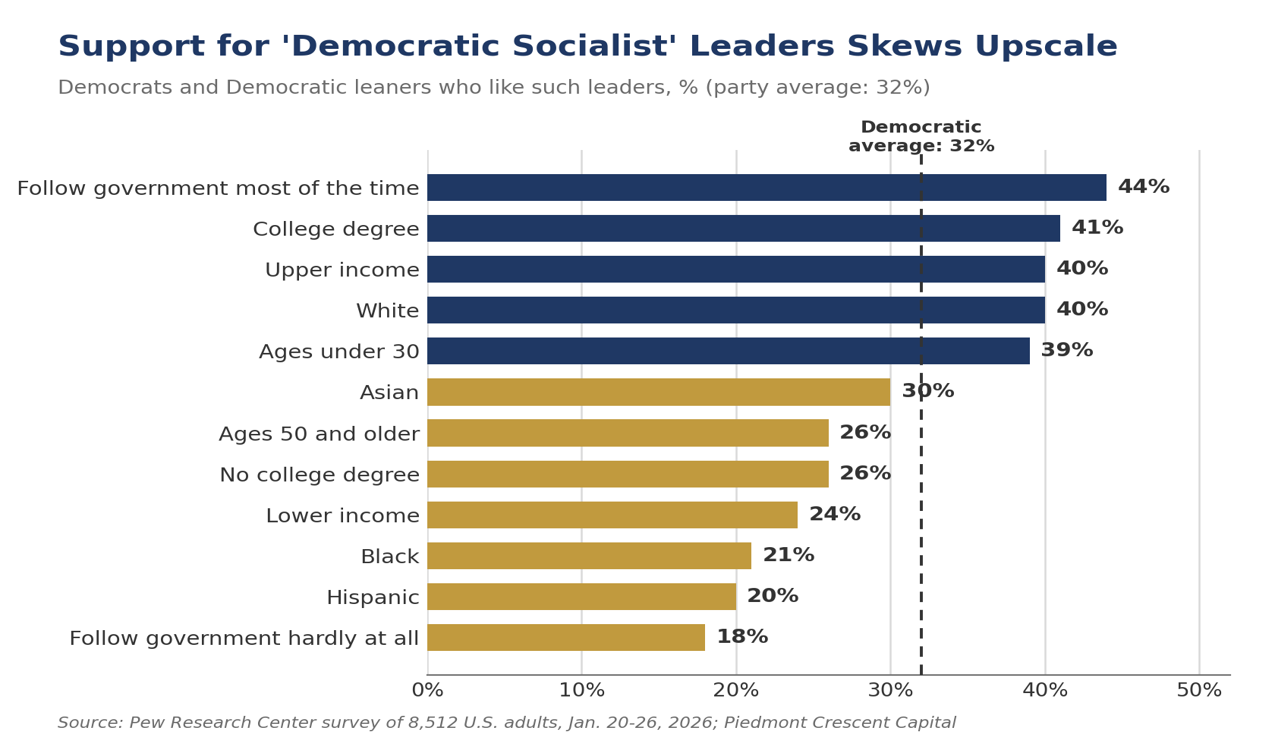
Step back from the primaries, though, and the national picture is ambivalence, not a groundswell. A late-January Pew survey found a 56 percent majority of Democrats neither like nor dislike leaders who call themselves democratic socialists; only 32 percent say they like them. And the affinity that exists runs upside-down, concentrated among affluent, college-educated, White, and politically engaged Democrats rather than the working-class base the ideology invokes. It is potent in a low-turnout urban primary and niche in the country at large.
We take the movement seriously because the grievances behind it are real, and our own research this week documents them. Our June employment report, “Fewer Jobs, Fewer Workers,” found the softness concentrated among workers aged 25 to 34, with the labor force shrinking and participation at a five-year low. Our companion report on the national capital cycle traced how narrowly this capital-heavy, employment-light expansion is concentrated by industry and by geography. For a young worker watching data centers rise while entry-level hiring stalls, the economy can feel like a party they keep seeing on social media but were never invited to, and that breeds resentment.
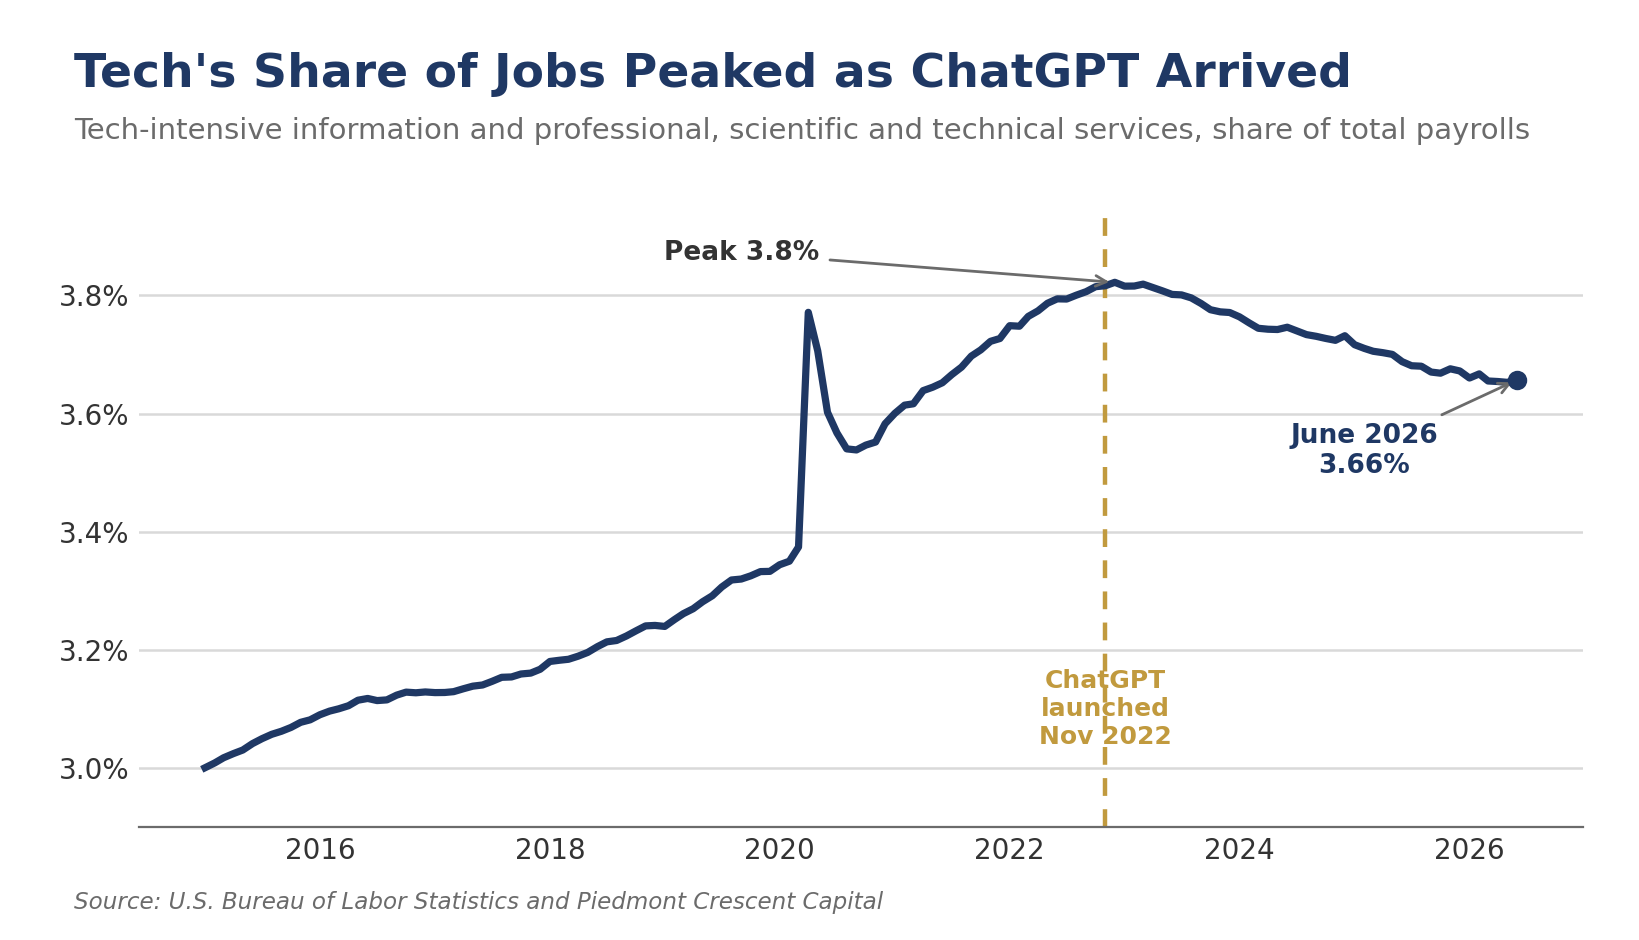
The frustration is legitimate. The prescription is not. Part of the current softness is AI itself. The tech-intensive share of employment climbed through the pandemic and peaked almost precisely as ChatGPT arrived in late 2022, and it has drifted lower ever since as firms learn to do more with the same headcount. We read that as a near-term adjustment, not a verdict. AI will be a powerful driver of growth and employment over time, and we expect that hiring momentum to become more evident in the second half of 2026.
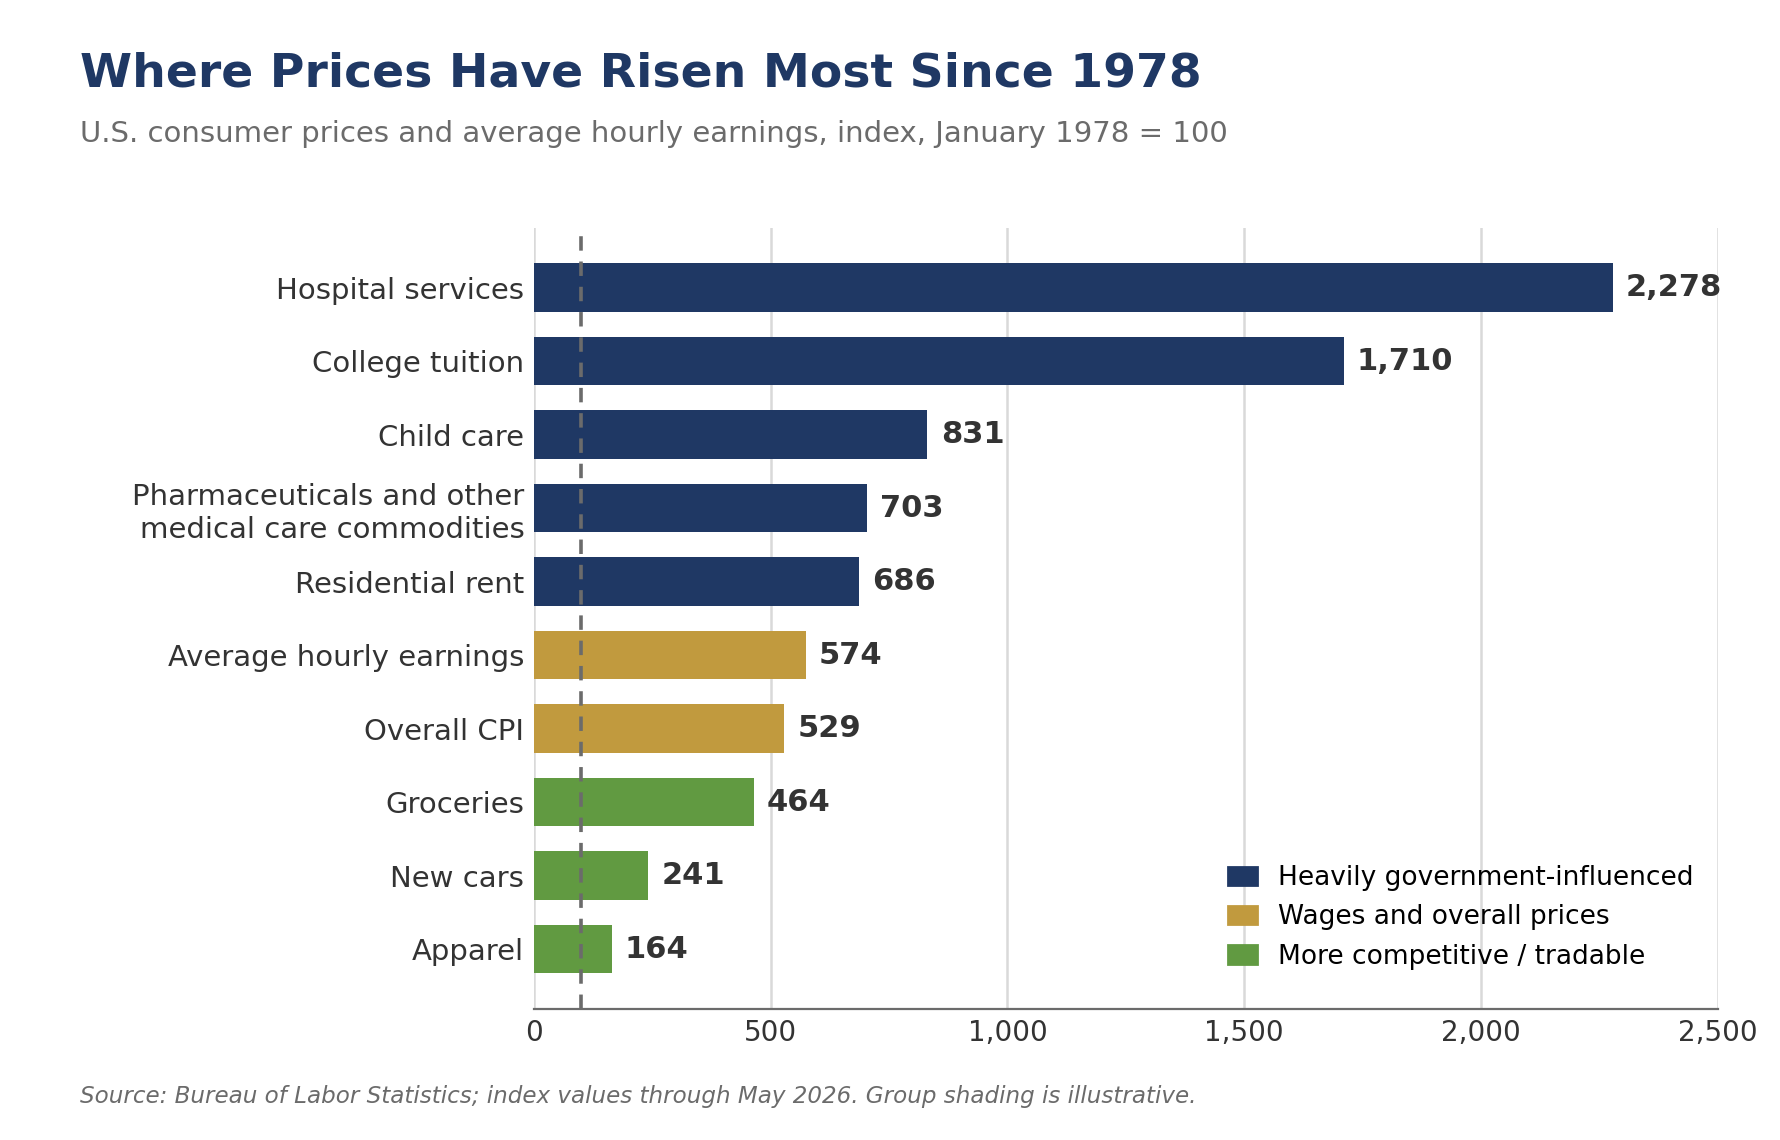
The second source of frustration is the affordability crisis. The steepest cost increases powering these campaigns are concentrated in housing, healthcare, and higher education, the three markets where government already does the most to underwrite demand and constrain supply. Since the late 1970s, prices in the most heavily managed sectors have risen several times faster than in the most competitive ones, where quality-adjusted costs have often fallen. In these markets, healthcare, higher education, child care, and housing, we do not need more socialist policy. We need less of it.
We would remind the pessimists that we have seen this movie before, and we remember how it ended. In the late 1980s, the fashionable book among skeptics of American dynamism was Paul Kennedy’s The Rise and Fall of the Great Powers, which argued that imperial overstretch doomed the United States to decline. I remember discussing it in graduate school and arguing that its logic made a better case for the collapse of the Soviet Union than of the United States. It did not win me any points with my professors. Within a few years, it was the Soviet Union that ceased to exist. Declinism had the direction of history backward, and this summer’s World Cup visitors, marveling on social media at the everyday abundance of American life, are supplying the counterpoint in real time.
The deepest cost of the socialist prescription is not redistribution. It is shrinkage. Dull the incentives to invest, build, and take risk, the very forces carrying this expansion, and the pie does not get divided differently; it gets smaller. Argentina entered the twentieth century among the wealthiest nations on earth and legislated itself into decades of stagnation. The young voters powering this wave deserve answers: more housing supply, more competition in healthcare, more accountability in higher education, and an economy that converts a remarkable capital cycle into broad-based hiring. What they do not deserve is a return trip to the thing the whole world woke up from in the late 1980s, right here, right now. Among the events of the long holiday weekend was a wedding at Madison Square Garden; we will borrow and rephrase a single line from the bride’s songbook, that socialism is an alluring daydream on its surface but always ends as a nightmare, and this time we would do well to stay awake.
The full-length essay, with charts and sources, is available as a standalone Piedmont Perspective.
Treasurer and CFO Corner
Translating this week’s data into the questions we are hearing from corporate finance teams.
- Funding and duration. With the Fed on hold and our next-move call a hike rather than a cut, treat the current window as a chance to term out funding rather than wait for cheaper money. On the investment side, we would stay cautious on duration: the front end is well anchored, but the long end holds more term premium than a soft-landing narrative implies.
- Energy and input costs. The retreat in crude and gasoline, echoed by the nine-point drop in the ISM prices index, is a natural moment to revisit fuel, freight, and commodity hedges. We would not treat the relief as permanent, since a geopolitical premium could return ahead of the November midterms.
- Pricing and margins. Headline inflation is cooling, but underlying inflation near 2.9% keeps wage and services costs firmer than the CPI suggests. Rising memory and AI-hardware prices are a fresh source of goods cost-push worth building into 2027 budgets, so we would hold pricing discipline.
- Labor and capital spending. In a capital-led, employment-light expansion, the marginal return sits in equipment, automation, and software rather than headcount. A cooling but low-turnover labor market rewards retention over aggressive expansion hiring.
Bottom Line and Regional Implications
The week’s data and commentary describe an economy in a summer pause that refreshes. Cooling labor momentum alongside a gradually broadening hiring base, falling energy prices providing much-needed relief to consumers, and policymakers showing pragmatic flexibility set the stage for stronger growth in the second half of the year. For clients and regional stakeholders, lower energy prices and a patient Fed are supportive for housing-sensitive sectors and consumer-facing activity in the near term. Longer term, the electricity and grid buildout represents both opportunity, in utilities, transmission, copper, and data centers, and competitive pressure from China’s cost and scale advantages in energy-intensive production. Trade policy adds complexity, with the USMCA now on an annual review cycle. Risks remain, including lingering Iran and Hormuz volatility, sticky core inflation, and the possibility that grid constraints begin to bind innovation, but the base case is continued expansion with policy optionality preserved, and with the next Fed move, in our view, still more likely a hike in 2027 or 2028 than a cut this year.
Mark P. Vitner | President and Chief Economist | Piedmont Crescent Capital | Charlotte, North Carolina
A Wake-Up Call - The Real Grievances Behind Socialism
THE PIEDMONT PERSPECTIVE
A Wake-Up Call
A measured look at the revival of socialism, the real frustrations behind it, and the memory the moment is missing.
Download the full report (PDF)
“The country was emerging out of a tunnel.” — Mike Edwards of Jesus Jones, recalling the band’s tour of Romania weeks after the fall of Ceaușescu, 1990
Something has entered our politics that would have struck most of us as implausible a generation ago. The word socialism has been rehabilitated. A democratic socialist now runs the nation’s largest city, and his endorsed candidates swept their New York congressional primaries in late June, unseating a five-term incumbent in Upper Manhattan and claiming an open seat in Brooklyn and Queens. One week later the wave reached Denver, where a 29-year-old democratic socialist toppled a congresswoman who had held her seat since 1997. A year ago, the Democratic Socialists of America counted two members of Congress. They are now on track for at least five, with roughly three dozen primary victories this cycle and allied candidates winning or advancing in Washington, Los Angeles, and Seattle. This is no longer a New York story. It is a national one. The frustration underneath all of this is real, and we think it deserves to be taken seriously rather than waved away. That is where we want to begin, because the easy responses to this moment are mostly the wrong ones.
This essay covers more ground than most. We start with who actually backs the movement, a group narrower and more upscale than the primary headlines suggest. We then take its grievances seriously where they are real: a cooling labor market, the fading likelihood that children will out-earn their parents, and the handful of sectors where the cost of a stable life has genuinely outrun wages. From there we turn to why the diagnosis is largely right but the prescription largely wrong, and why the cure on offer risks shrinking the very prosperity that would make the grievances fixable. A memory from 1989 runs underneath the whole argument, and it is where we begin to explain why we are not persuaded that the remedy fits the complaint.
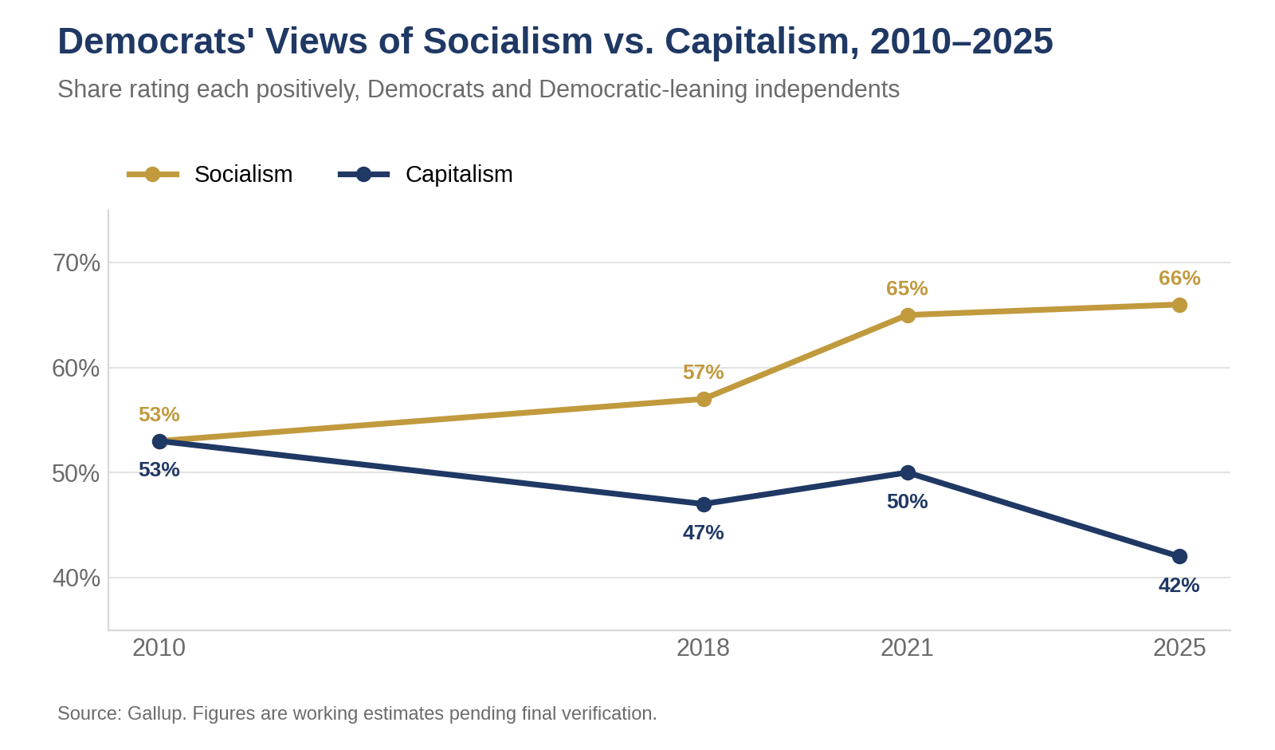
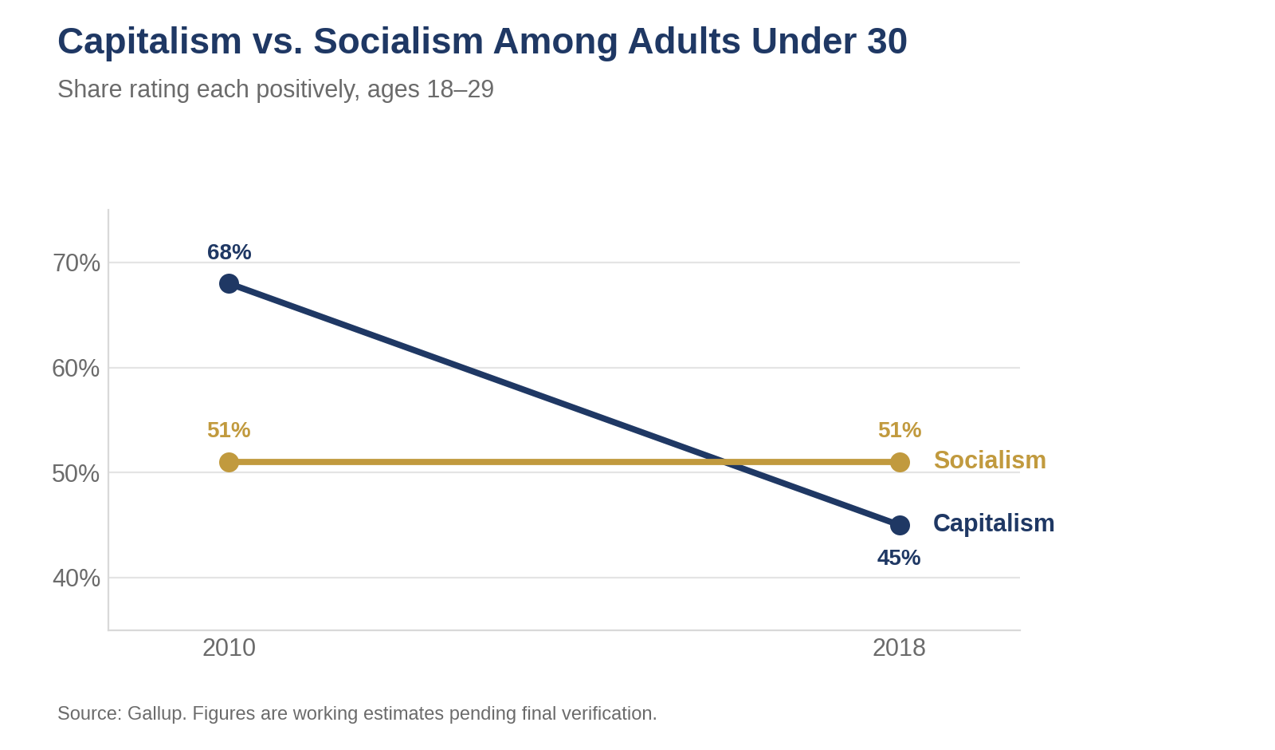
Step back from the primary returns, and the national picture is not a groundswell. It is ambivalence. A Pew Research Center survey taken in late January found that most Americans neither like nor dislike leaders who call themselves democratic socialists. Among the public, 43 percent land in that neutral middle, with 38 percent expressing dislike and only 17 percent affinity. The pattern holds inside the Democratic Party, where a 56 percent majority is neutral, 32 percent say they like such leaders, and 11 percent say they do not. For most voters, in other words, the label carries no strong day-to-day meaning at all. Warmth toward the word socialism, which Gallup finds rising among Democrats, is not the same thing as embracing a politician who runs under the banner, and the gap between the two is where the movement’s national ceiling shows.
Look at who does like the label, and the movement turns out to stand on its head. Socialism has always claimed the working class as its natural constituency. The modern American affinity for the term runs the other way. In Pew’s data, the Democrats most drawn to democratic socialist leaders are the affluent, the credentialed, and the politically engaged: 41 percent of Democrats with a college degree versus 26 percent without one, 40 percent of upper-income Democrats versus 24 percent of lower-income ones, and 44 percent of those who follow government most of the time versus 18 percent of those who follow it hardly at all. It is also, uncomfortably for a movement built on solidarity, a racial inversion, with White Democrats (40 percent) and Asian Democrats (30 percent) far more receptive than Black (21 percent) or Hispanic (20 percent) Democrats. The enthusiasm is real, but it is concentrated in the party’s upscale, attentive wing rather than in the working-class base the ideology invokes.
Pew’s new political typology sharpens the same point into a fault line running through the Democratic coalition. The party’s ideological engine is two highly educated, heavily White, intensely engaged groups Pew labels Leftward Progressives and Loyal Liberals, together roughly 35 percent of Democrats. About two-thirds of Leftward Progressives (66 percent) like democratic socialist leaders, and roughly half of Loyal Liberals do. But the larger share of the coalition, about 42 percent, sits in the more diverse, more financially stressed, and more institutionally minded Left-Out Left and Order and Opportunity Left, where affinity falls to roughly a fifth (22 percent) and about one in ten. These are the Democrats most likely to feel politically ignored, and they are not asking for socialism. They are asking to be heard. A fair reading grants the caveats: Pew’s January survey predates the spring and summer primary wave, and liking or disliking a label is not the same as turning out to vote for a candidate who carries it, which is exactly why a brand this potent in a low-turnout urban primary can remain this niche in the country at large.
In 1991, a British band called Jesus Jones had an American hit about the strangest thing many of us had ever watched: a world rousing from history in real time. The song was “Right Here, Right Now,” and its writer had watched the Berlin Wall come down on television and tried to catch the shocking brevity of it before it passed. Those of us paying attention then remember it, as walls and regimes that had defined the entire postwar order gave way not over decades but over months, and the disbelief was part of the experience. We were, as the song had it, watching the world wake up from history.
To understand why that awakening felt close to miraculous, you have to remember the night that came before it. In the late 1970s and early 1980s, the tide appeared to run the other way. The Soviet Union marched into Afghanistan in 1979, and Soviet-aligned movements were advancing across Asia, Africa, and Latin America, from Angola and Ethiopia to Nicaragua. Those of us just starting out in the profession assumed the Eastern bloc was permanent, and perhaps still expanding.
The fashionable worry of the moment was not about them at all. It was about us. The much-discussed book of the day, talked about more often than it was actually read, was Paul Kennedy’s The Rise and Fall of the Great Powers, and the lesson the culture drew from it was American decline. Imperial overstretch, the argument ran, would do to Washington what it had done to every great power before, while a rising Japan prepared to inherit the century. The thesis found its readiest audience among those skeptical of Reagan, who saw in the defense buildup and the deficits a country spending its way toward the same fate. I remember discussing the book in graduate school and arguing that its logic made a far better case for the collapse of the Soviet Union than of the United States, a view that did not win me many points with my professors. Within a few years the power that actually buckled under the weight of its commitments was the other one. The smartest consensus of the age had the direction of history nearly backward, which bears remembering now, because every age is certain it can read the trend, and ours is no exception.
The youngest voters do not carry this memory. They did not live through the collapse, and they certainly did not live through the long stretch before it, when the other side looked like it was winning and confident experts kept calling the race wrong. What reaches them instead is a word, stripped of the experience that once gave it its infamy.
The same conviction is loose again today. On a recent trip to Europe, we kept meeting people certain that America had entered a serious and perhaps lasting decline, with its political turmoil offered as the proof. We did not argue the politics, although we suspect that is where much of the criticism was truly aimed. What stayed with us was how little the country they described, consumed and defined by its national politics, resembled the one most Americans actually live in.
The football fans who poured in for the World Cup this summer seem pleasantly surprised by what they have found. Across social media, visitors from dozens of countries have spent the tournament marveling at the everyday abundance of the place: the free refills and the ice water that arrives unbidden, the scale of the stores, the size of ordinary middle-class homes, the easy friendliness of strangers. Many had come expecting the angry and diminished country of the headlines and found something closer to its opposite. Critics are right that abundance can tip into excess, and how that abundance is distributed is a real question we will come to in a moment. But the aggregate is not seriously in doubt. The United States produces roughly a quarter of global output with about four percent of the world’s people, and even the economists who dispute how far American living standards have pulled ahead of Europe’s are arguing over how large and how durable that lead is, not whether it exists.
The abundance the visitors photographed is real, and so is the distribution problem underneath it. That is the resolution of the apparent paradox: seen from outside, the country is an obvious success; lived from inside, by a great many people, it can feel like a treadmill. We have written for some time about a K-shaped economy, two Americas living in the same country on different terms. For a large share of younger households, the price of the things that signal a stable adult life, a home, health care, a degree, a path upward, has outrun wages for the better part of two decades, while asset prices have rewarded those who already held the assets. When a generation concludes that the system was not built with them in mind, the conclusion is not irrational. It is a reasonable reading of their own balance sheets.
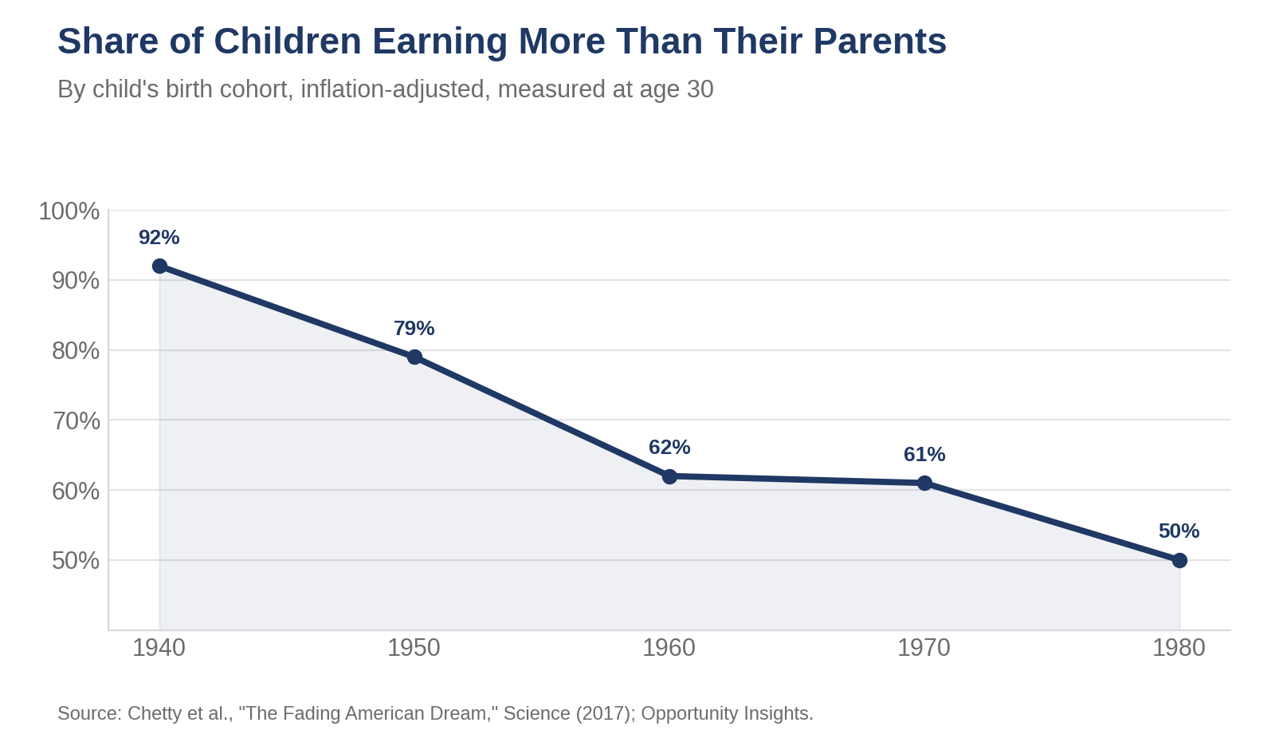
We see this in a variety of measures. One of the most telling, and one that gave the old order much of its legitimacy, is the expectation that children will out-earn their parents. That expectation has weakened persistently. For those born in 1940 it was nearly a certainty, on the order of 90 percent; for those born around 1980 it is closer to a coin flip. Part of that decline is mechanical, since each generation starts from a higher rung and the children of high earners have the most ground to defend. A physician’s children, for example, can prosper without ever matching a physician’s pay. The ladder itself has not seized up either, since the chances of climbing relative to one’s peers are about what they were in the 1970s. But for families nearer the middle the shortfall is not a measurement artifact, and that is the part worth worrying about. We can hold that thought and the next one at the same time, and we intend to.
Our own research this week documents the soil in which this movement grows. The June employment report, which we covered under the title “Fewer Jobs, Fewer Workers,” showed payrolls rising just 57,000, with the labor force shrinking by 720,000 and participation falling to its lowest level since early 2021. The softness in employment was concentrated among workers aged 25 to 34, precisely the cohort now casting primary ballots for candidates who promise to rewrite the rules. Our companion report on the national capital cycle traced how a historic wave of private investment has carried this expansion through a hiring soft patch, and how narrowly that capital is concentrated, by industry and by geography alike. Growth is running on capital rather than labor, or, as we like to say, on protein rather than carbohydrates, and the difference is not an abstraction to a young worker watching data centers rise on the edge of town while entry-level hiring stalls.
For the people not yet at the table, the expansion can feel like a party happening in another room. The aggregate statistics are genuinely strong, and we have spent much of this year documenting their strength. But an economy that adds output faster than it adds workers, and adds both in a narrow set of industries and metros, will manufacture exactly the sentiment now showing up at the ballot box. The grievance is visible in the data and in lived experience. It does not need to be imagined, and pretending otherwise cedes the argument to the people offering the wrong cure.
Part of the near-term softness is artificial intelligence itself. The tech-intensive slice of the labor market, the information and professional and technical services jobs that have long been the ladder into the knowledge economy, climbed as a share of total employment through the pandemic and peaked almost precisely as ChatGPT arrived in late 2022. The share has drifted lower ever since, as firms learn to produce more with the same headcount and slow their hiring of the very workers this generation expected to become. That is the mechanism behind a real and specific grievance. We read this as a near-term adjustment, however, not a verdict on the technology. The last comparable general-purpose technologies, electrification and the personal computer, each depressed measured employment in their early diffusion and then generated far more work than they displaced, in categories no one had yet identified. We expect the same arc here, with the broadening of hiring becoming more visible over the second half of 2026. The task is to carry this generation across the adjustment, not to conclude from the adjustment that the system has failed them.
Affordability is another problem the democratic socialists are looking to solve. Look closely at where the squeeze actually falls, however, and a pattern emerges that should give the reformers pause. The costs that have outrun the family budget are concentrated in a few sectors, and they are not random ones. Hospital care, college tuition, child care, and the rent have all climbed many times faster than wages since the late 1970s, while the goods that come from genuinely competitive markets, clothing and automobiles and most of what crosses a border, have risen far less or in real terms grown cheaper. The common thread in the costly group is not greed, which is a constant, but design. Prices have risen the most in the sectors where government underwrites the demand and constrains the new supply at the same time, the textbook recipe for prices that outrun the paycheck. The affordability crisis now feeding the appetite for socialism is, to a considerable degree, a product of the government we already have rather than the market we are told to distrust. In these markets, we do not need more socialism. We need less of it.
The next thought is a distinction the branding tends to blur. Most of what polls well under the socialist banner is redistribution: tax-and-transfer policy, social democracy of the kind that is ordinary across much of the developed world and debatable on its own honest terms. That debate is a fair one. The genuinely socialist part, collective ownership of productive enterprise and the displacement of markets as the organizing mechanism, is the part with the long and grim record. The word now being rehabilitated does not point at the popular half. It points at the experiment whose results the world spent the twentieth century escaping, and the gap between the label and the ledger is where a careful reader should slow down.
The deeper error would be to treat the engine of American prosperity as the thing to dismantle. The abundance the World Cup visitors photographed did not arrive by decree. It is the product of a system that rewards invention and risk-taking, and that lets the people who build something keep enough of the gains to build again. The capital cycle we wrote about this week, the very force carrying the expansion, is that system at work. Dull those incentives in the name of fairness and the likeliest result is not a more even distribution of plenty but less plenty to distribute. Argentina spent the last century demonstrating the point, beginning among the richest nations on earth and legislating its way to chronic inflation and recurring default. A wealthy country can, in fact, vote itself poor. The grievances remain real; the danger is that the socialist cure would shrink the very pie everyone is fighting to divide.
There is an irony in reaching for Jesus Jones here, and it is worth sitting with rather than hiding. The man who wrote that 1991 anthem never intended it as an ideological statement and was uncomfortable when it was adopted as a triumphalist banner. Both Clintons campaigned to it; a conservative magazine later claimed it for its own list. So the point of invoking the song is not to conscript a champion who never enlisted. The point is quieter and, we think, more honest. The memory of what was at stake has faded so far that even the song’s own author would decline to wave the flag, and so the work of remembering falls to the rest of us who simply lived through it. That work is not to scold the longing but to supply the memory it lacks.
The song’s image was a world waking up from history. The revival of socialism, for all the legitimacy of the grievances beneath it, is the temptation to go back to sleep, to re-enter a dream the world already paid in full to leave. The measured response is neither to mock the frustration nor to indulge the remedy. It is to stay awake and fix what is truly broken, the affordability of ordinary American life, the cost of owning a home, seeing a doctor, and earning a degree, the narrowing of the path upward, and an economy that converts this remarkable capital cycle into broad-based hiring, without reaching again for the system the world rose from in 1989. We woke up once, and it was the work of a generation. We should be careful not to mistake exhaustion for a reason to lie back down.
Among the events of the long holiday weekend was a wedding at Madison Square Garden. We will borrow and rephrase a single line from the bride’s songbook: socialism is an alluring daydream on its surface but always ends as a nightmare, and this time, we would do well to stay awake. 1
Download the full report (PDF)
1 Note on the closing line: the daydream-and-nightmare image alludes to the theme of Taylor Swift’s song “Blank Space” but deliberately does not quote its lyric and does not attribute any statement about socialism to Swift. The line is the author’s own, framed as a borrowing and rephrasing, to avoid putting words in a real person’s mouth or reproducing copyrighted lyrics. ↩
Mark P. Vitner is President and Chief Economist of Piedmont Crescent Capital, a boutique investment bank in Charlotte, North Carolina.
mark.vitner@piedmontcrescentcapital.com | (704) 458-4000 | piedmontcrescentcapital.com
June Employment Report: Fewer Jobs, Fewer Workers

Fewer Jobs, Fewer Workers
A soft June payroll print met a shrinking labor force. Beneath the surface, we see a broadening economic expansion, with less overall slack than the headline suggests.
Early Signal
- June payrolls rose just 57,000, roughly half the consensus call of around 113,000, and April and May were revised down a combined 74,000 (to 148,000 and 129,000), unwinding much of the spring's upside surprises.
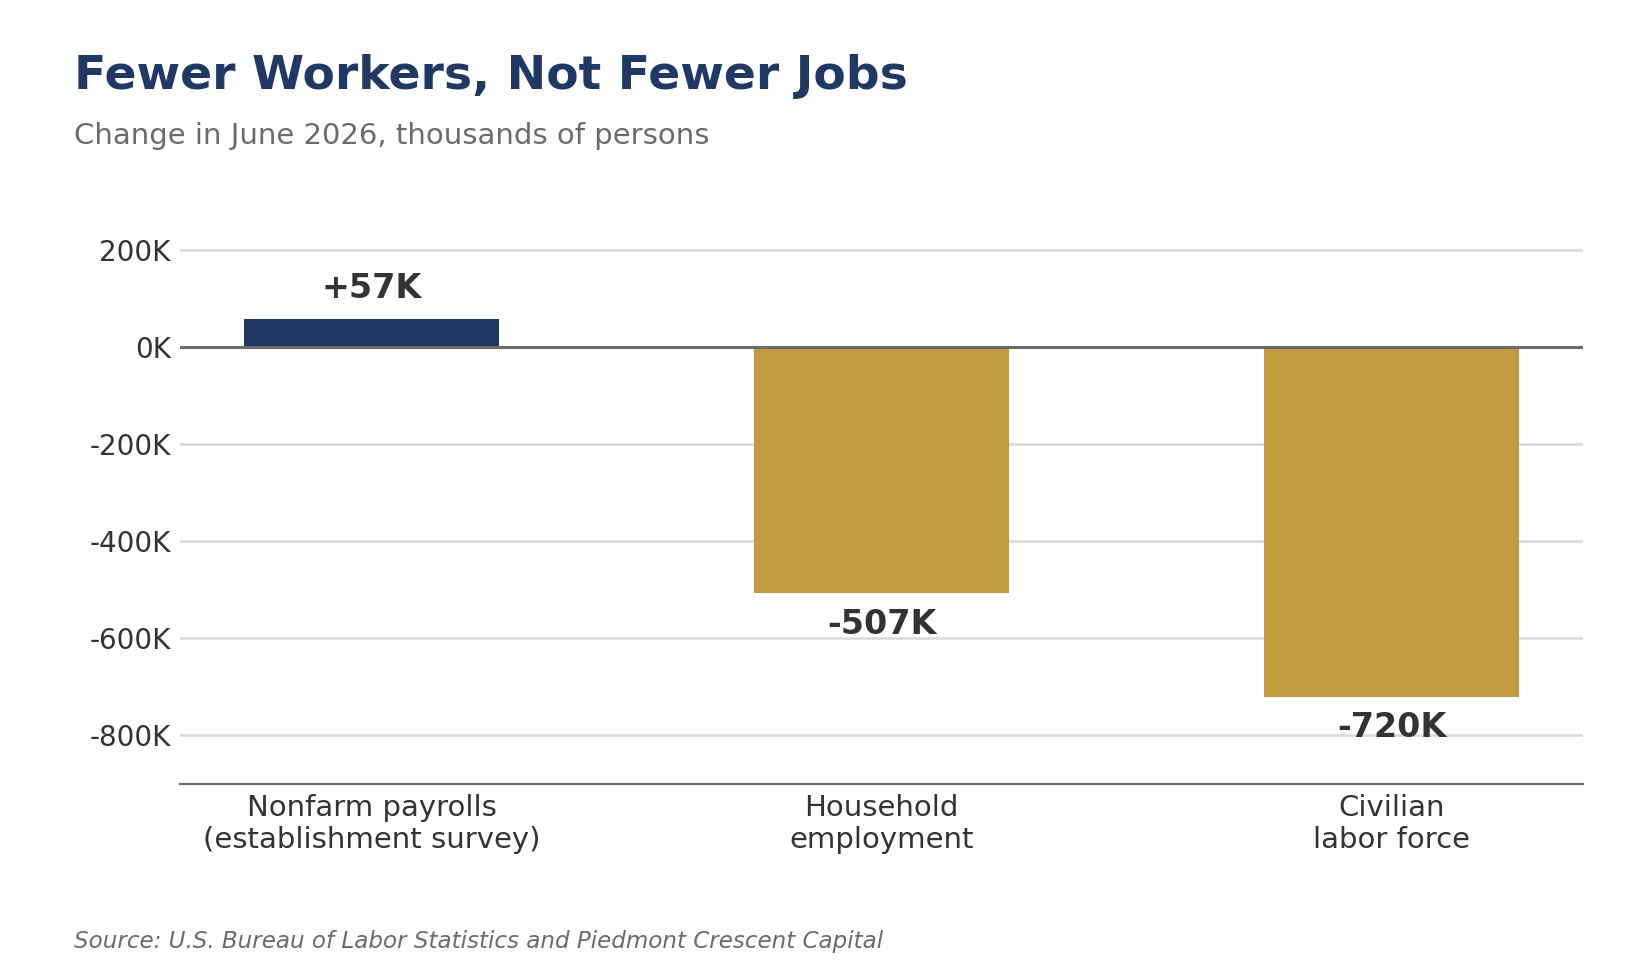
- The unemployment rate fell to 4.2%, but for reasons that give little comfort. Household employment fell 507,000 and the labor force shrank by 720,000, pulling the participation rate down 0.3 percentage point to 61.5%.
- The participation drop was concentrated among workers aged 25 to 34, whose participation rate fell 1.6 percentage points, the largest one-month decline outside the pandemic. Slower immigration and stepped-up enforcement appear to be shrinking labor supply.
- Leisure and hospitality shed 61,000 jobs, more than reversing May's gain. As we noted last month, the early Memorial Day likely pulled summer hiring into May, so June's decline owes more to the calendar than to any genuine crack in consumer spending or hiring.
- The World Cup is likely boosting payrolls by more than the data show. The tournament kicked off the day before the survey reference week began, and much of the lift is coming through longer hours and busier afternoons at bars and restaurants across the country, not just in the host cities.
- Manufacturing breadth is quietly improving. The factory diffusion index rose 2.8 points to 55.6, the highest reading in more than a year, and manufacturing payrolls added 3,000 jobs, consistent with an ISM survey that has held above 50 all year.
- Wage growth firmed rather than faded. Average hourly earnings rose 0.3% in June and are up 3.5% over the past year, while the workweek held at 34.3 hours.
A Soft Print, With Asterisks
The June employment report was the softest of the year, but it arrives with more than the usual number of asterisks. Nonfarm payrolls rose 57,000, well short of expectations. Private payrolls accounted for just 49,000 of the gain, while government added 8,000 following an outsized May increase that was revised lower. We feel the best way to look at this number is to take the three-month average of job growth, which slipped to 111,000. The downward revisions to April and May sting a bit more than the June miss itself. Last month we noted that the persistent downward-revision pattern of late 2025 had finally reversed. That reprieve lasted exactly one report. April was marked down 31,000 and May 43,000, and the spring hiring surge now looks more modest than it did a month ago. Even after the revisions, job growth is strong enough to keep the unemployment rate in check. The jobless rate actually fell just over 0.1 percentage point in June to 4.2%.
Job growth narrowed in June, though it did not collapse. The one-month diffusion index slipped 1.6 points to 54.4, and the three-month measure eased to 56.2. A majority of industries are still adding workers, but the broadening we highlighted in the May report lost a step. The gains that did materialize came from familiar places. Professional and business services added 36,000 jobs and has now added 172,000 since its October low, a genuine bright spot that suggests firms are rebuilding white-collar capacity and suggests that fears of AI hollowing out white-collar employment are, at least so far, overblown. More and more firms are finding they need more workers to get more out of AI. Social assistance added 25,000 and health care 22,000, though the latter is running well below its 38,000 average monthly pace over the past year. Private education added 22,000, a gain we read as a seasonal-adjustment artifact rather than genuine hiring. On the other side of the ledger, information, retail trade, and mining all shed jobs, and state and local government education added just 3,000, breaking a pattern of strong first prints in June that had held for several years. The earlier than usual Memorial Day likely distorted the payroll figures in a number of these categories, which we will detail later.
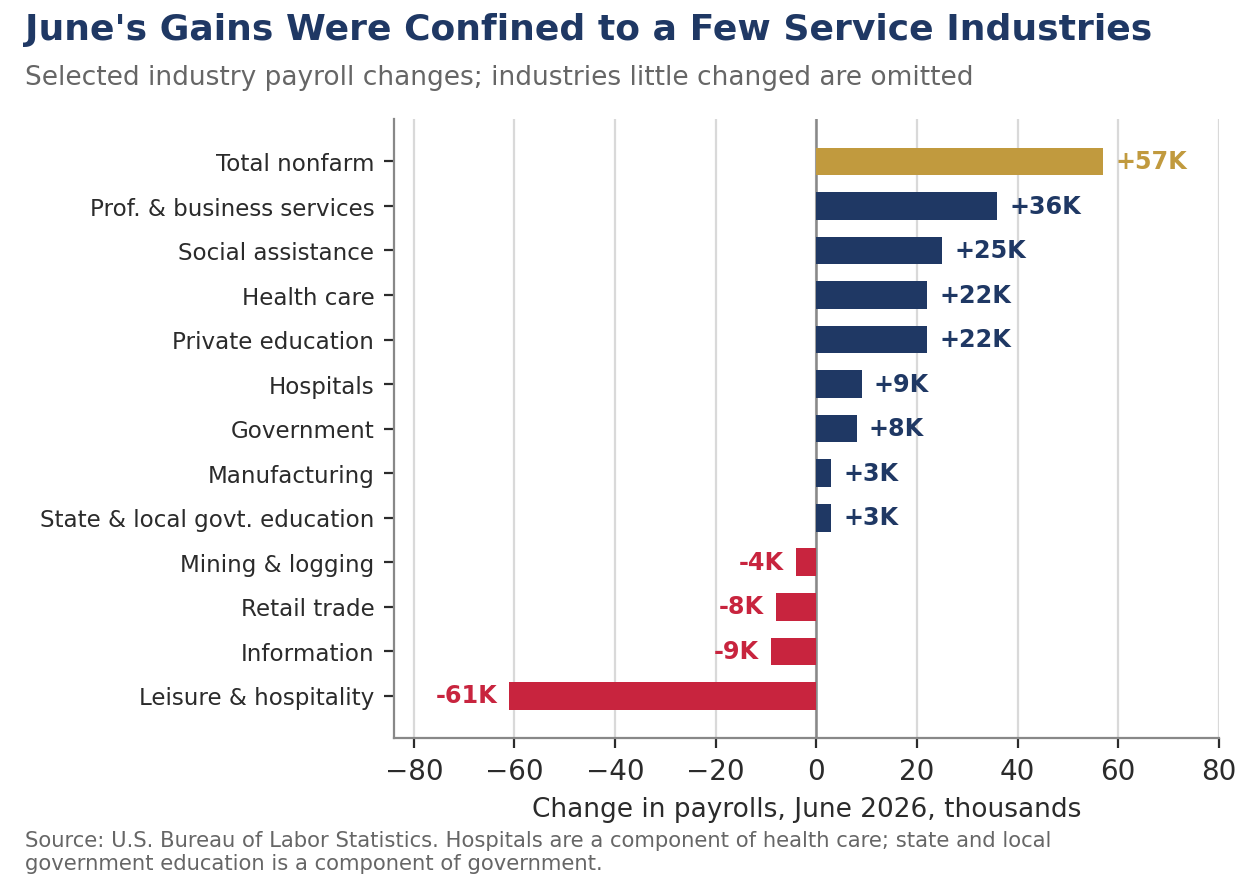
Payback at the Pool Bar, and a World Cup Wild Card
Leisure and hospitality's 61,000-job decline looks alarming until the calendar is fully considered. Memorial Day fell on May 25 this year, one of the earliest possible dates, and pulled a slug of seasonal hiring at pools, resorts, restaurants, and amusement venues forward into the May survey week. We flagged the timing effect last month, when it flattered the May figures, and June's drop is simply the other side of the same trade. The seasonal factors anticipate even larger hiring gains in June than in May, so the two months together likely do not fully net out. This is an issue we are likely to deal with all the way into the fall. Labor Day comes unusually late this year, falling on September 7, which means summer hires will likely remain on payrolls longer than usual.
The impact of the early Memorial Day extends well beyond the leisure and hospitality sector. Private education payrolls added a surprising 22,000 jobs in June. The gain is a statistical artifact, however. On a non-seasonally adjusted basis, employment in private education fell by 181,400 jobs. The reason employment rose on a seasonally adjusted basis is that employment fell more than usual in May, as the school year ended earlier than usual for many schools, resulting in a smaller than usual June dropoff.
Hiring at home improvement centers and hardware stores, another highly seasonal business, was also a casualty of the calendar. Hiring rose strongly on a non-seasonally adjusted basis in May, resulting in less hiring than usual in June, producing a seasonally adjusted loss of 11,900 jobs this past month. There are undoubtedly more distortions than these, but they are among the most visible.
The World Cup is the wild card the seasonal factors cannot see. The tournament opened across the United States, Mexico, and Canada on June 11, one day before the establishment survey's reference period began, which means much of the staffing tied to the event either came too late in the month to be counted or simply was not reported yet. The bigger point is that the boost is not confined to the eleven U.S. host cities. With matches airing through the afternoon, sports bars and restaurants all across the country are drawing crowds in parts of the day that are normally quiet, and much of that lift shows up first in longer hours, added shifts, and busier tip jars rather than in new positions. Some of it will surface as hiring in the July report, which will make an already noisy month noisier still, and some of it will show up in revised data for May and June. Our read is that the true pace of leisure and hospitality activity in June was meaningfully firmer than the payroll figures suggest, but maybe we are just paying more attention to the matches ourselves.
Unemployment Fell for the Wrong Reasons
The drop in the unemployment rate to 4.2% is the least reassuring decline we have seen in some time. Household employment fell 507,000 in June, and the labor force contracted by 720,000, dragging the participation rate down to 61.5% and the employment-population ratio down to 59.0%. Nearly all of the labor force decline came from workers aged 25 to 34, whose participation rate plunged 1.6 percentage points, the largest one-month drop outside the pandemic in the history of the series. The decline was evident among both men and women in the cohort. A move that large among prime-age workers is hard to square with retirements or schooling. It is much easier to square with sharply slower immigration and stepped-up enforcement pulling foreign-born workers out of the measured labor force. The calendar may also be a factor, with more younger workers joining the workforce in May and fewer than usual joining in June, leading to a seasonally adjusted drop.
We want to be careful when discussing younger workers. This group has become a focal point of the political debate recently, with concern about job prospects and affordability featuring prominently in the policy conversation. The unemployment rate for those ages 25 to 34 fell 0.1 percentage point to 4.6% in June. The jobless rate for this age cohort is the highest within prime working age adults. The rate for men is slightly higher, at 4.8%, while the rate for women is 4.3%. By comparison the unemployment rate for those ages 35 to 44 is currently 3.3% and the unemployment rate for those 45 to 54 is 3.1%. Elevated joblessness among younger workers is the signature of a low-hire economy, where entry-level hiring has slowed the most, and it helps explain why more of them are leaving the labor force.
The low-hire, low-fire labor market remains firmly in place, but the low-hire side is starting to leave marks. Initial jobless claims held at 215,000 in late June and continuing claims near 1.8 million, so layoffs remain scarce. The number of permanent job losers dipped in June, and the Sahm rule remains comfortably below its recession threshold on both the unemployment rate and prime-age employment measures. Yet the number of long-term unemployed has climbed 286,000 over the past year to 1.9 million and now accounts for 27.3% of all unemployed workers. Those who lose a job are staying out of work longer, even as the chances of losing one remain low. That combination is the household-survey signature of the same story the establishment data tell: businesses are meeting demand with capital and productivity rather than headcount.
A shrinking labor force also resets the bar for what counts as a weak report. If labor supply is barely growing, monthly payroll gains in the 50,000 to 75,000 range are enough to hold the unemployment rate steady. June's 57,000, which would have signaled stall speed two years ago, now sits close to that breakeven pace, and the falling unemployment rate says as much. The economy is not generating fewer jobs than it needs. It is generating fewer workers.
Wages, Hours and the Fed
For the Fed, June's report offers something for everyone and a clear case for no one. Doves will point to the weakest payroll print of the year and a diffusion index that narrowed slightly. Hawks will point to an unemployment rate that fell to 4.2%, average hourly earnings that rose 0.3% on the month and firmed to 3.5% over the year, and a labor supply that is contracting. Wage gains were strongest in information, utilities, and finance, precisely the industries at the center of the capital-led expansion. The average workweek held at 34.3 hours, and factory overtime edged up even as the manufacturing workweek slipped, leaving aggregate hours little changed. Total hours worked edged up just 0.1% for the month. For the quarter, aggregate hours worked climbed at a 1.3% annual rate. After adding in 2% productivity growth, that would be consistent with 3% plus GDP growth. Real earnings are also turning a corner. Paychecks trailed inflation over the three months through May as war-driven energy costs outran wage gains, but with energy prices falling, that arithmetic likely flipped back in workers' favor in June.
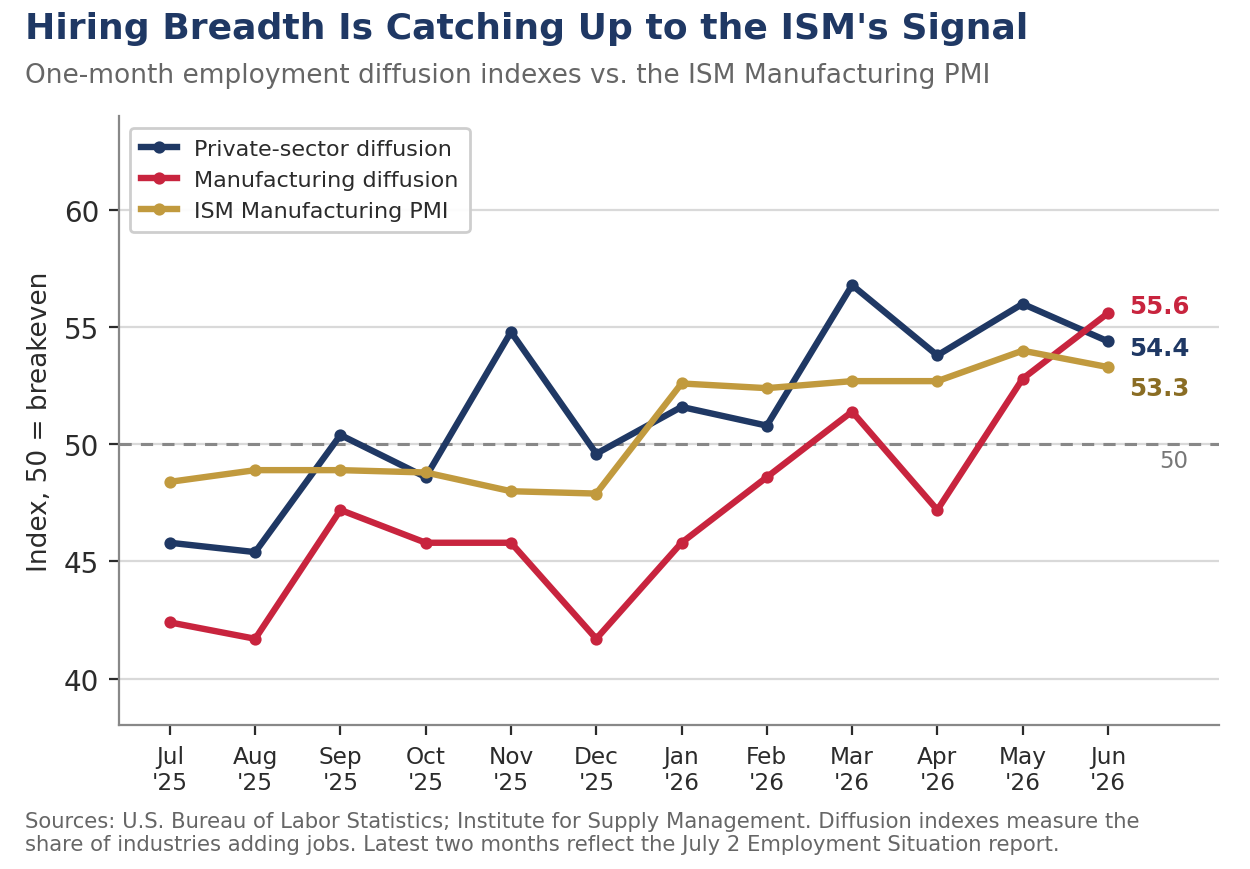
Our read is more upbeat still. Forecasters are already drifting our way, with some shops that until recently penciled in a 2026 cut now dating the next move deep into 2027. We see job growth as broadening and feel the slight drop in the diffusion index is mostly seasonal noise. The diffusion index in the factory sector actually improved in June, rising 2.8 points to 55.6, the highest reading in more than a year. That reading is consistent with what we have been seeing in the ISM report, which has remained above the key 50 breakeven level all year. Manufacturing payrolls also edged higher in June, adding 3,000 jobs. We believe overall hiring during the prior three months was likely overstated and expect payroll growth to average around 90,000 jobs a month during the third quarter and see the pace strengthening later this year. Manufacturing provides much of the cyclical momentum for the economy and the factory sector looks to be on the upswing right now, with rising orders, lean inventories and improving productivity setting the stage for stronger job gains. That improvement will quickly spill over into the broader economy.
A Weak Print That Argues for Patience, Not Cuts
Bond yields fell within minutes of the release as futures markets moved to price a fall rate cut. We would not chase that move. A labor market where hiring has slowed to roughly its breakeven pace, the unemployment rate is falling, and wage growth is firming toward 3.5% is not one crying out for easier policy, particularly with underlying inflation still running near 2.9%. We continue to look for no cut in 2026 and still believe the next move is more likely to be a hike than a cut, arriving in 2027 or 2028 if growth presses the economy back toward full employment. The July report, with World Cup hiring and the Memorial Day payback both in the mix, will be unusually noisy. The signal worth watching is labor supply. If participation among 25-to-34-year-olds does not bounce back, breakeven job growth is lower than the Street believes, and so is the unemployment rate consistent with stable inflation.
Chief Economist, Piedmont Crescent Capital
mark.vitner@piedmontcrescentcapital.com
Sources: U.S. Bureau of Labor Statistics, The Employment Situation, June 2026; U.S. Department of Labor, Unemployment Insurance Weekly Claims; Oxford Economics.
This report is for informational purposes only and does not constitute investment advice. Views expressed are those of Piedmont Crescent Capital as of the date of publication and are subject to change without notice.
ISM Manufacturing Report: Building Without Hiring

Economic Indicator Report · ISM Manufacturing PMI, June 2026
Building Without Hiring
New Orders and Production Are Carrying the Factory Recovery While Employment Contracts for a 33rd Straight Month, the Capital Led Pattern Our Productivity Work Anticipated
Early Signals
- The expansion held even as the headline eased. The Manufacturing PMI slipped 0.7 point to 53.3, a sixth straight month above 50 after a ten-month contraction, and the level remains consistent with the overall economy growing for a 20th consecutive month.
- New orders and production are doing the lifting. New orders, the most-leading component of the survey, held at 56.0, a sixth month of growth. Production expanded for an eighth straight month at 52.2. Demand and output are leading the recovery, employment is lagging.
- Employment is again the laggard. The Employment Index rose 1.1 points to 49.7 but remained in contraction for a 33rd consecutive month.
- That gap is the signature of a capital-led recovery. Rising output on flat-to-falling hours worked is productivity, not weakness. The factory floor that sat out the 2023 to 2025 productivity boom is finally delivering through capital and automation rather than hiring.
- Price pressure cooled sharply but did not clear. The Prices Index fell 9.1 points to 73.0, the largest drop since July 2022, yet still marks a 21st straight month that more managers reported rising input costs than reported falling costs. Some of the most persistent price pressures have been driven by steel and aluminum tariffs and Middle East oil.
- Geopolitics remains the swing factor. The Iran conflict surfaced in 31 percent of negative comments and tariffs in 17 percent, with half of panelists citing pricing volatility. A reopening of the Strait of Hormuz would ease the cost overhang substantially.
A Headline That Undersells the Story
The June PMI headline reads like a mild deceleration, but the more important signal is the regime change that came before it. The index eased to 53.3 from 54.0. Remember the ISM is a diffusion index. Any reading above 50 is consistent with improvement in the factory sector, while a reading below 50 is consistent with weakening conditions. The internals softened at the margin, with the New Orders and Production sub-indexes posting narrower gains than in May. Even so, four of the five components that feed the PMI were in expansion in June, one more than in May, and the composite remains consistent with real GDP rising at roughly a 2 percent annual pace. The larger picture is the one our first chart below tells. Manufacturing spent the back half of 2025 in a shallow contraction, bottoming at 47.9 in December, then flipped to six consecutive expansion readings in the low-to-mid 50s. A few tenths of wobble inside that new expansion is noise. The turn itself is the story.
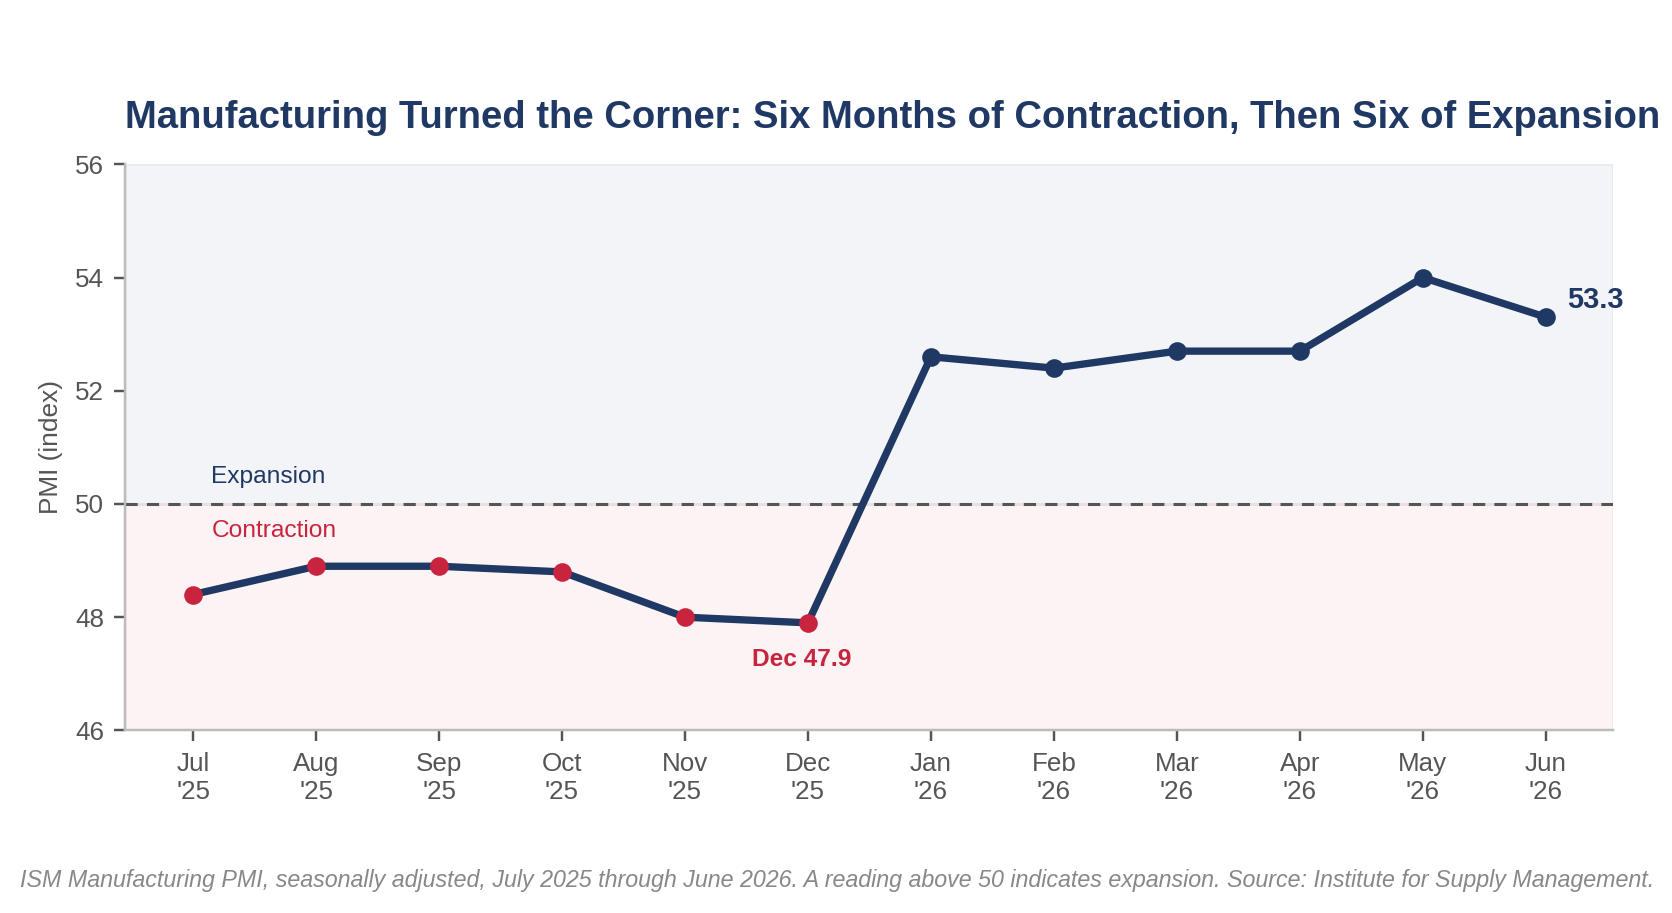
Momentum is steady rather than accelerating, and that distinction matters. The share of firms reporting higher new orders fell to 22 percent from 31 percent, and the net new-orders reading dropped to plus 9 from plus 17, even as the index held near 56. In plain terms, the expansion is broad but no longer broadening. That is an early-to-mid cycle profile, not a boom, and it fits our view of a capital-led recovery that grinds higher without the vertical takeoff of a demand-driven cycle.
New Orders and Production Are Carrying the Recovery
The demand side of this report is doing its job. New orders expanded for a sixth month at 56.0, production for an eighth at 52.2, and both have sat comfortably above 50 all year. Backlogs are only barely positive at 50.5, but customers’ inventories remain deep in too-low territory at 42.3, a 21st month, a condition that historically foreshadows restocking and future production. Supplier deliveries slowed for a seventh straight month, a pattern that usually accompanies firming demand, though tariff friction and disruptions tied to the Iran conflict are behind much of the lengthening.
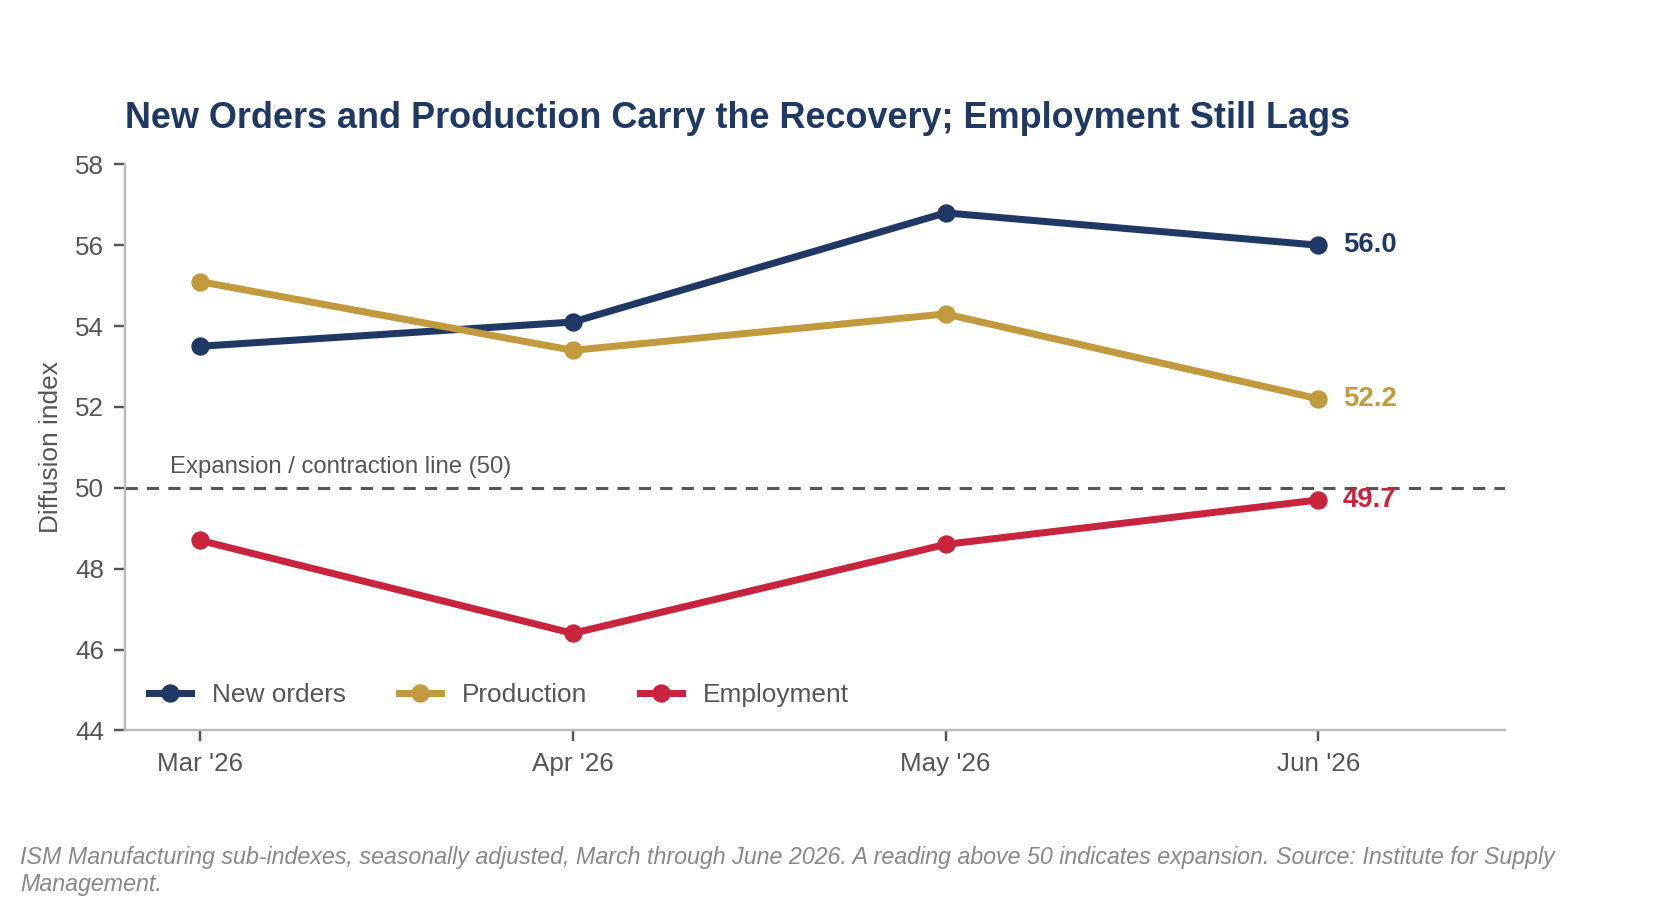
What the chart makes plain is the split between output and labor. New orders and production have held in the 52 to 57 band for four months while employment has sat below 50 the entire time. The lines do not converge. Orders and production are pulling the sector forward, and employment is trailing well behind. The divergence is not unusual at pivot points. The road to recovery in the factory sector is typically led by new orders, rising production, increased order backlogs and eventually rising employment. Uncertainty surrounding tariffs and the Iran War has likely made employers a bit more hesitant to add staff.
Employment Is Soft, and That Is the Point
The soft employment reading is not a crack in the recovery; it is the fingerprint of a capital-led one. The Employment Index registered 49.7, its 33rd consecutive month of contraction, and it has now contracted in 41 of the past 42 months. Because a reading near 50.3 is the level consistent with rising factory payrolls, June’s 49.7 implies manufacturing employment is still edging lower even as output climbs. Producing more with the same or fewer hours is the definition of rising productivity, and it is exactly what a sector leaning on recently installed plant, equipment, and automation looks like.
Beneath the sub-50 headline, though, the labor picture is quietly turning. The Employment Index improved 1.1 points, and the ratio of panelists hiring to those merely managing head counts flipped to 1.8-to-1, with 64 percent hiring, a near-reversal of the 1-to-2 ratio that prevailed at the start of the year. The recovery began with capital and is only now beginning to pull in labor. Gains in factory payrolls would significantly broaden the recovery and help make the rebound self-reinforcing.
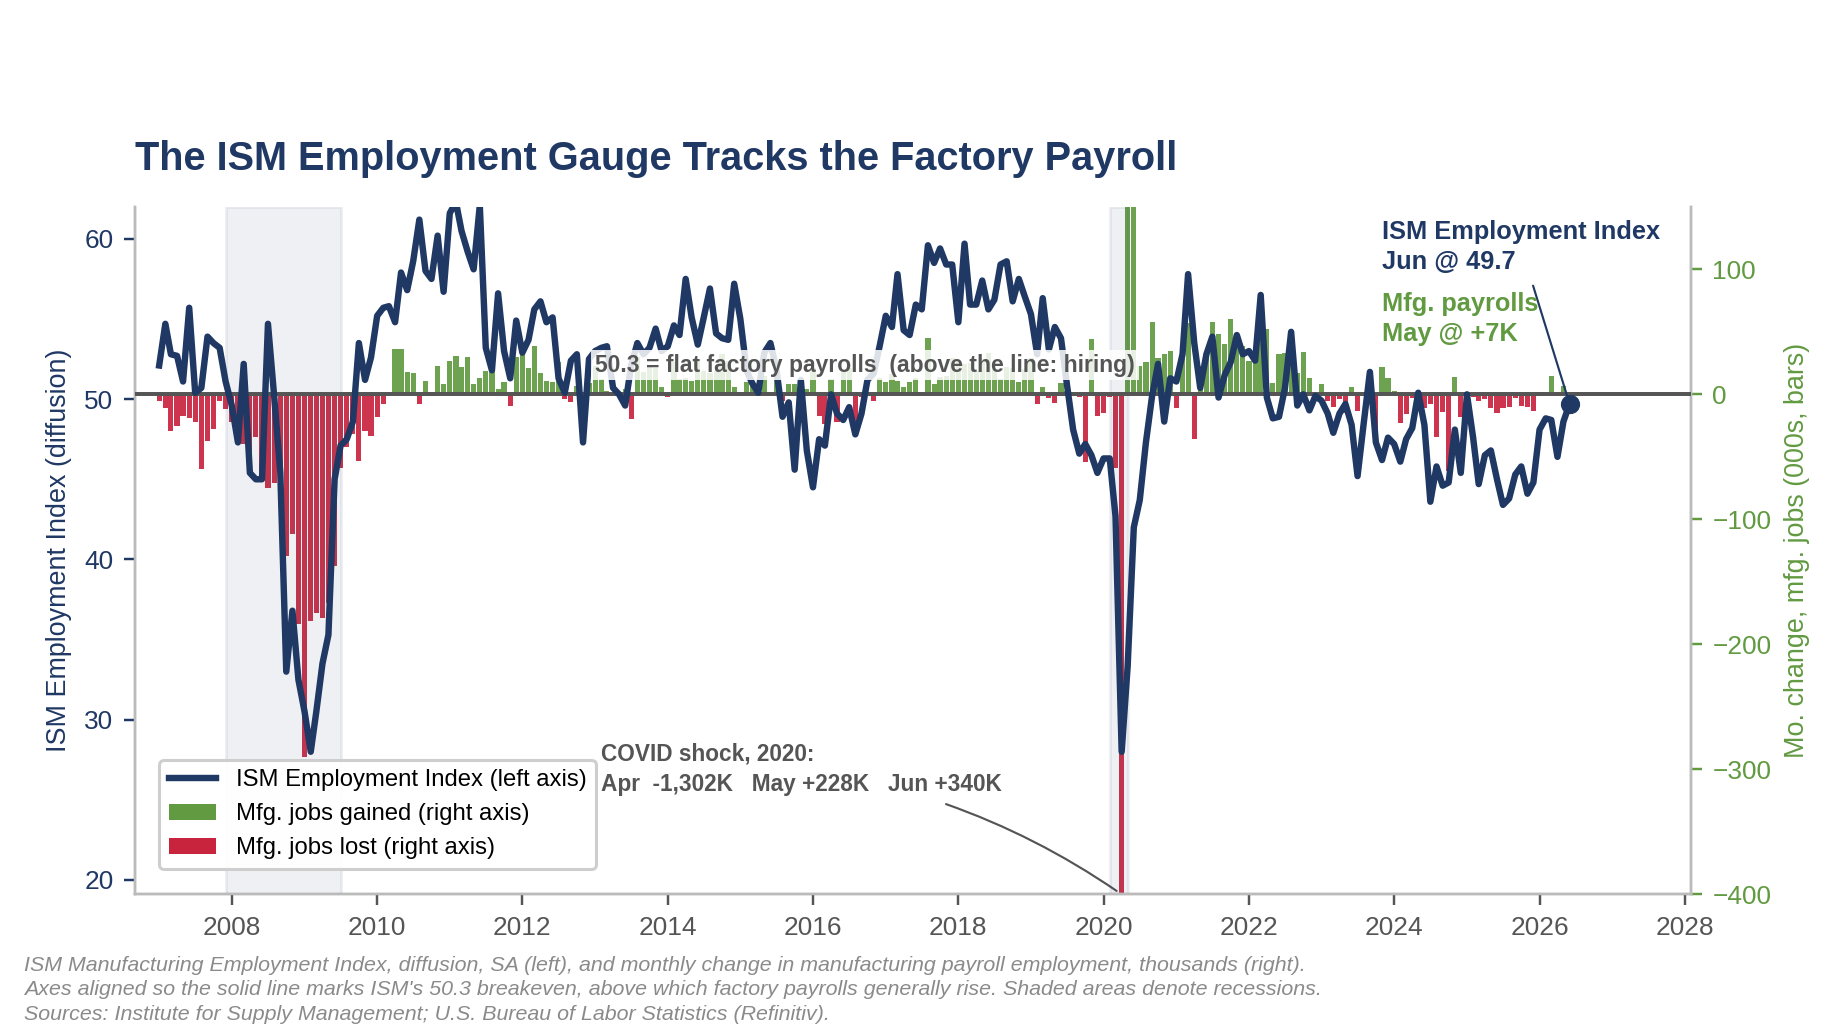
Why the Floor Struggled, and Why This Time Looks Different
This is the pattern our productivity report focused on this past week. That report showed the factory floor sitting out the productivity boom, with total factor productivity falling in 70 of 86 manufacturing industries in 2023, a third straight broad-based down year, while the economy-wide engine of software, information, and data centers powered ahead. Our estimates for the two following years based on output by industry, employment and hours data suggest the data for subsequent two years were no better, with output rising in only 19 of 85 industries and hours falling in most. That was the 2024 and 2025 struggle in a sentence: weak output, shrinking hours, and productivity gains confined to a sliver of the sector.
The difference now is that the capital is finally showing up in output. Those productivity figures were a photograph of the old regime, taken before the reshoring and AI-driven capital build hit its stride in 2025. What the June ISM, and data for the first half of 2026 in general, capture is the handoff. The plant and automation put in place over the past two years are beginning to convert into rising orders and production, without a matching rise in payrolls. The factory floor is starting to earn the capital deepening it absorbed. Protein for the platforms through 2025, and the production line is finally being fed in 2026. Look for employment to rise after order backlogs improve a bit further.
Prices, Tariffs, and the Fed
The price relief is real, but it is relief from a very high level. The Prices Index dropped 9.1 points to 73.0, the sharpest fall since July 2022, and the share of firms paying more fell to 55 percent from 66 percent. June marked the 21st consecutive month of rising input costs, and any reading above roughly 53 is consistent with a rising producer price index. The cooldown owes much to retreating oil, with crude now listed among the commodities falling in price as the war premium fades, and to the disappearance of European energy surcharges. What has not gone away is the structural layer. Section 232 steel and aluminum tariffs continue to lift costs across the value chain, and panelists again flagged tariffs and pricing volatility as their dominant concerns.
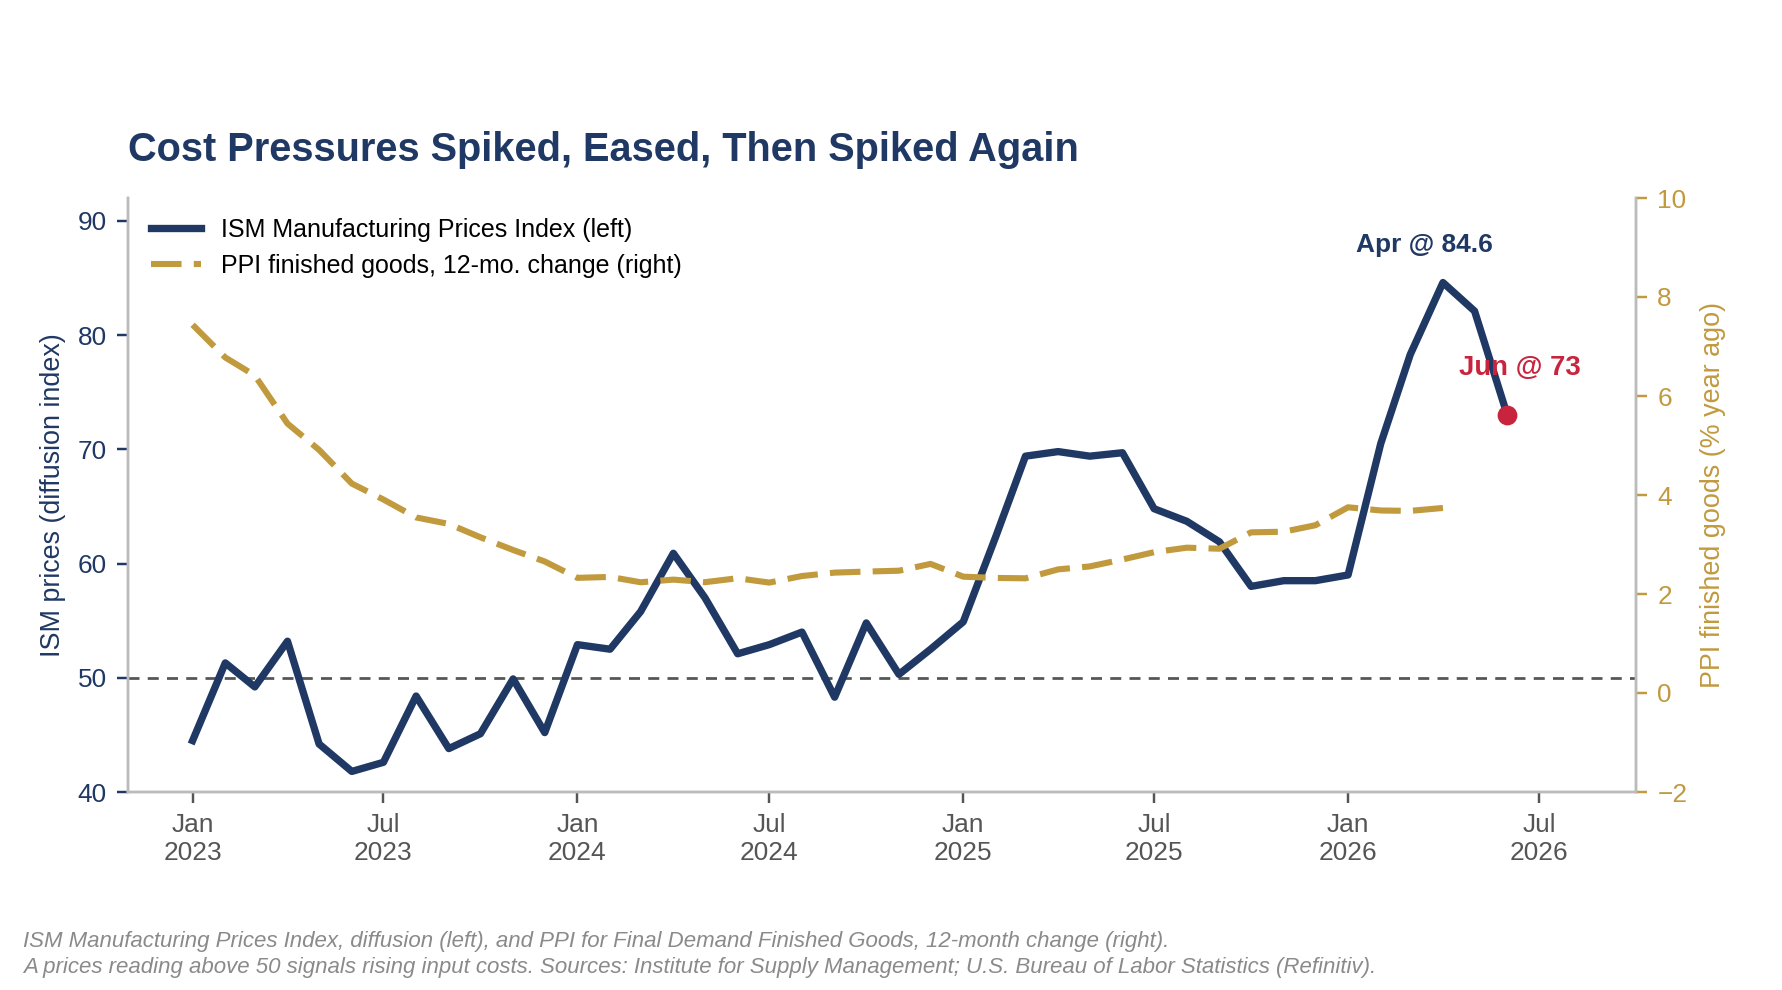
For the Fed, a single sharp drop in a still-elevated prices gauge does not open the door to easing. Pair a firming, capital-led industrial recovery with input costs that remain well above their historical norm, and the case for a near-term cut weakens rather than strengthens. We continue to carry no 2026 rate reduction in our base case, and we still judge the next policy move as more likely up than down, in 2027 or 2028. New export orders slipping back into contraction at 48.5 is a reminder that tariffs cut both ways, but it does not change the domestic inflation math the Fed is watching.
Our Call
The June ISM confirms two things at once, and they point the same way. The manufacturing recovery is real, durable and, on a six-month view, still strengthening. The improvement is being delivered through output and productivity rather than job growth. A firming factory economy layered on a prices index still in the 70s does not give the Fed any room to cut but it does not demand a rate hike either. Our 2026 base case has the Fed on hold until at least December and likely well into 2027, when the next move is more likely to be a rate hike. That is typically what the Fed has done when manufacturing accelerates after a mid-cycle pause and the labor market is near full employment.
For positioning, we would stay with the capital-led expansion rather than fade it. The equipment, automation, power, and semiconductor supply chains doing the work in this recovery remain the place to be, and the soft factory-employment reading is a reason to lean into the productivity leaders, not away from the sector. With input costs still elevated and the long end still under-compensated for fiscal and geopolitical risk, we remain cautious on duration.
This report is produced by Piedmont Crescent Capital for informational purposes only and does not constitute investment, legal, or tax advice or a recommendation to buy or sell any security. Views are as of the date of publication and are subject to change without notice. Underlying data are from the Institute for Supply Management Manufacturing PMI report for June 2026 and from the U.S. Bureau of Labor Statistics. Past performance is not indicative of future results.
A View from the Piedmont: As the Tanker Turns
A VIEW FROM THE PIEDMONT · Weekly Commentary on Money, Credit, Exchange Rates & Geopolitics
As the Tanker Turns
Oil fell even as the ceasefire was tested, May inflation likely marked the peak, and the hawkish turn at the Fed gained a fresh convert.
Week of June 26, 2026 · Updated Saturday, June 27 · Mark Vitner, President & Chief Economist
Market Snapshot
| Indicator | Close | Week | Note |
|---|---|---|---|
| S&P 500 | ~7,350 | −1.5% | Flat on the day; rotation out of tech |
| Nasdaq Composite | ~25,300 | ~−4% | Worst week in months; AI fatigue |
| Dow Jones Industrial | ~51,850 | +0.6% | Non-tech leadership; record midweek |
| Russell 2000 | ~3,000 | higher | Rotation winner; SpaceX added to R1000 |
| 2-yr Treasury | 4.20% | lower | Eased as oil fell after PCE |
| 10-yr Treasury | 4.40% | lower | Back below 4.5% |
| Brent crude | $72.55 | −3.2% | Lowest since before the February war |
| WTI crude | $69.21 | −3.1% | Fell even on the Hormuz drone report |
| Gold | ~$4,085 | higher | Safe-haven bid on soft monthly PCE |
| VIX | ~19 | higher | Tech volatility leads |
Levels as of the close, Friday, June 26, 2026. Oil and gold are settlement prints; equity index and Treasury levels are approximate.
On the Data Tape
| Release | Reading | Read-through |
|---|---|---|
| Headline PCE (May) | 4.1% y/y | Three-year high; energy-led and likely the peak |
| Core PCE (May) | 3.4% y/y | Sticky services; the monthly read was soft |
| Q1 GDP (third est.) | 2.1% SAAR | Revised up from 1.6%; growth firmer |
| Durable goods (May) | −4.5% | Transport-led drop; core capital goods firm |
| New home sales (May) | −7.3% | Housing still pinched by rates |
| UMich sent (June, final) | 44.8 | Inexplicably weak; we look to the detail |
The Week in Brief
Inflation reached a three-year high, oil kept falling, and the AI trade lost its footing, all this week. The week confirmed the hawkish hold and handed our framework two fresh supports. The Federal Reserve removed its 2026 cut, May inflation printed at a three-year high, and one more policymaker moved into the rate-hike camp. Energy worked the other way. Crude fell even after the Iran ceasefire was tested at the Strait of Hormuz, which tells us the market now expects the waterway to stay open. The wobble worth watching is in technology, where worries about the cost and financing of the artificial intelligence buildout pulled the largest names lower and revived comparisons to the late 1990s.
The Fed Got the Data It Wanted
The Federal Open Market Committee held the funds rate at 3.50 to 3.75 percent and erased the rate cut it had penciled in for this year at its June meeting. The dot plot did the talking. Nine of eighteen officials now see at least one increase in 2026, and only one still expects a cut, a sharp turn from the March projections. Chair Warsh used his first press conference to commit plainly to returning inflation to 2 percent. Markets heard the message and repriced the front end, sending the two-year note to a fresh high for the year before it eased back as oil fell. Our framework has held that the next move is more likely a hike than a cut, and nothing this week argued otherwise.
The Hawkish Camp Gains a Voice
The case for a hike is no longer confined to the dot plot. On Friday, Minneapolis Fed President Kashkari said he had changed his outlook and now expects one increase this year, arguing that the investment surge tied to artificial intelligence will add to price pressure. He joins Governor Waller, who has warned that the energy shock is working its way into other prices and that inflation is not moving in the right direction. We have made this argument for some time. When the doubts start migrating from the projections into the speeches, the committee is usually closer to acting than the market assumes.
A Three-Handle at the Headline
The Fed’s preferred gauge, the personal consumption expenditures price index, rose 4.1 percent from a year ago in May, the fastest pace in three years. Core prices, which strip out food and energy, climbed 3.4 percent, although the monthly increase was softer than feared. The energy shock from the conflict in the Gulf has been the main driver, and it has been seeping into services, where restaurant meals, lodging, auto repair, and medical care all firmed. We have long preferred trimmed-mean measures to the headline for reading the underlying trend, and even those sit above target today. The bottom line is that the underlying pace has not returned to 2 percent, a point we take apart in this week’s Perspective, summarized below.
Growth Is Not the Problem
The economy is not the soft spot in this picture. The third estimate of first-quarter output lifted growth to a 2.1 percent annual rate from 1.6 percent. Real consumer spending rose 0.3 percent in May, and real incomes turned higher for the first time in four months. Durable goods orders fell on a drop in transportation, but the core capital goods that feed business investment held firm, and new home sales slipped as housing stays pinched by rates. We would temper the income headline, since a one-time farm support payment flattered the May figure rather than broad wage growth, but the direction of travel on spending is intact. Firmer growth alongside above-target inflation is precisely the mix that keeps the Fed leaning toward restraint. We shaved our current read for Q2 real GDP growth by the same magnitude as the upward revision, 0.5 percentage point to 2.5 percent, and the wider-than-expected goods trade deficit in May adds further downside risk.
The Consumer’s Mood
Consumer sentiment fell to 44.8 in June, a reading we treat with more caution than usual. The University of Michigan index has dropped to a level the fundamentals do not explain, weaker than the troughs of 2008 and 2022 even as the labor market holds and households keep spending. We put less weight on the headline for that reason. The detail beneath it still earns its keep. The survey captures the frustration of families who have watched prices outrun paychecks through this expansion, and it tracks the long stretch of soft real income growth that has defined it. Real disposable income turned slightly positive in May for the first time in months, and the energy relief now coming through should lift it further in June. We would expect mood to firm as that improvement reaches household budgets, even if the gap between how consumers feel and how they spend remains one of the puzzles of this cycle.
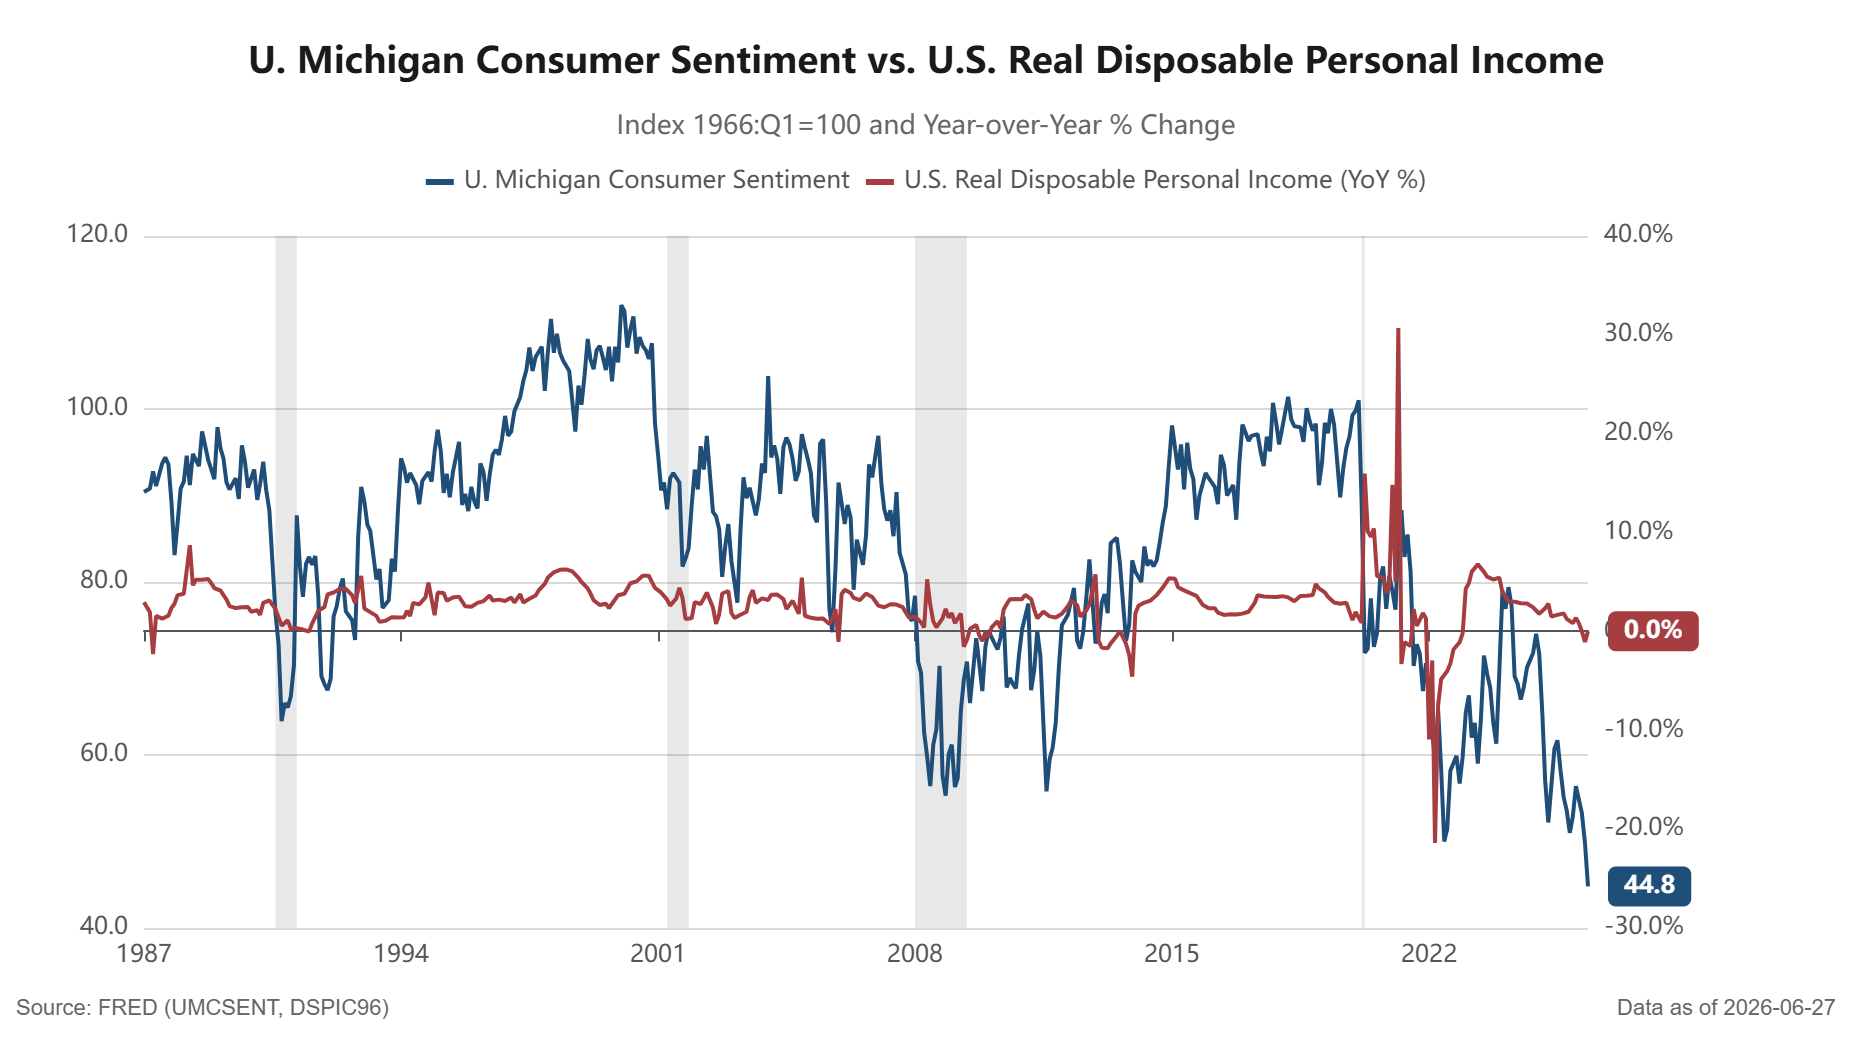
The Tanker Turns
The most telling moment of the week came when the ceasefire was tested and oil fell anyway. An Iranian drone struck a Singapore-flagged cargo ship in the Strait of Hormuz on Thursday, and the United States answered on Friday with strikes on Iranian missile, drone, and radar sites, the first American strikes on Iran since the ceasefire was extended. Crude still declined roughly 3 percent on Friday, with Brent settling near 72 dollars and West Texas Intermediate near 69, the lowest since before the war began in February, because traffic kept moving and the market is pricing the waterway to stay open. The weekend complicated that read. Iran launched drones at Bahrain on Saturday, Hezbollah rejected the new Lebanon framework as a disgrace, and the basic terms of the memorandum, from control of the strait to the use of unfrozen funds, remain unsettled. Central Command still counted dozens of merchant ships transiting the strait on Saturday, so the disruption is contained for now. We attach two conditions to the peak-inflation call. The June price data, due in mid- and late July, has to confirm it, and the understanding has to hold. The weekend is a live test of the second, and oil could gap on Monday if the exchange widens.
The Lebanon Framework
The trilateral framework signed in Washington is best understood as a design to separate Hezbollah from Iran, not a peace deal. The United States, Israel, and Lebanon agreed to a sequenced process in which the Lebanese Armed Forces disarm Hezbollah and dismantle its infrastructure, after which the Israeli military progressively redeploys out of the territory it holds. Two pilot zones come first, with reconstruction money and the return of civilians promised once disarmament in those zones is verified. A trilateral military coordination group and a forthcoming security annex are meant to police the steps, and Washington put one hundred million dollars of humanitarian aid on the table to start. The Israeli delegation summarized the intent plainly, that Iran is out, Hezbollah is out, and a Lebanese state monopoly on force is in. The fact that Iran and Hezbollah both oppose the deal is itself a reason to think it could improve the region’s security.
The sequence is the whole argument, and it is the reason the framework will be hard to implement. Disarmament comes before withdrawal, with no fixed timetable, which lets Israel hold its buffer zone and its freedom to strike for as long as it judges a threat remains. Hezbollah, which was not at the table, has called the deal null and void and a humiliation, and one of its lawmakers warned that any attempt by the Lebanese army to enforce it would mean civil war. That is the trap. The framework asks the Lebanese army to accomplish by force what years of Lebanese politics could not, while Iran presses to fold the Lebanon question back into its own track, where it holds more cards. Reconstruction is the carrot, but it is withheld until the disarmament that Hezbollah refuses, which leaves the arrangement circling itself.
Our read is that this is a long and conditional process rather than a clean settlement, and the markets should treat it that way. The likely path is a slow, contested deployment into the two pilot zones, punctuated by Israeli strikes and Hezbollah harassment, with full peace a distant prospect. The Lebanon file and the Hormuz file move together, since Iran has shown it will use the strait as leverage whenever the regional picture turns against it, as the weekend made clear. The implication for our work is twofold. If the framework holds even loosely, it caps the escalation that drives the oil-risk premium and supports the case that May marked the inflation peak. If it breaks, it hands Iran a ready pretext to squeeze the strait again. We would keep a latent geopolitical premium in mind even as headline crude falls, because the arrangement pulling energy prices down is the same fragile one that could reverse them.
A K-Shaped Tape
The split inside the market widened into a fault line this week. Memory chipmaker Micron blew past expectations, yet the AI complex sold off anyway. A report that OpenAI may delay its public offering into next year, alongside the weak after-IPO performance of SpaceX, raised doubts about how the buildout will be financed, and trading desks flagged the risk to capital spending if the financing window stays shut. The selling went global. South Korea’s Kospi fell nearly 6 percent and tripped a circuit breaker, and the semiconductor index neared correction. Beneath it, the rotation we have flagged continued, with the Dow setting records midweek and the Russell 2000 holding near highs. The capital cycle we have likened to the late 1990s now carries the other half of that comparison. A rush of giant listings, from SpaceX to the coming OpenAI and Anthropic offerings, has drawn the same dot-com parallels we would expect this late in a capex boom. We read the pullback as a recalibration of expectations rather than the end of the investment wave, but the financing question is real and demands respect.
Across the Water
Britain is a useful reminder of what fiscal credibility is worth. Prime Minister Starmer has announced his resignation, with Andy Burnham the favorite to succeed him as soon as mid-July and the choice of Chancellor the next question. A Burnham government would likely lean on public investment and social care, which points to higher near-term borrowing and slower fiscal consolidation, and fits the premium the gilt market has been charging. Yields spiked toward levels last seen in the late 1990s as investors weighed the looser stance, then eased as the leadership picture cleared and soft activity data lowered the odds of further Bank of England tightening. The episode is a live demonstration of what markets demand when they doubt a government’s commitment to its own budget rules.
Geopolitical Watch
Two fronts moved this week, and a third opened on trade. In the Gulf, a single drone strike on a tanker escalated into American retaliation and an Iranian drone attack on Bahrain over the weekend. The skeptics who called the memorandum a pause rather than a peace look closer to right, and the nuclear and inspections questions remain open, with the IAEA still awaiting access. In Eastern Europe, Ukrainian strikes on Russian energy infrastructure are producing domestic fuel shortages inside Russia, a thread that could feed back into global product markets even as crude retreats. On trade, the administration said Europe had agreed to drop tariffs on a range of United States goods to zero, a development we will watch for its effect on industrial supply chains.
Our Call
We expect no rate cut in 2026, and we now count Minneapolis among the voices preparing for a hike. The risk around the Fed remains skewed toward tightening, and the hotter data have pulled that risk forward from the 2027 timing in our June base case, putting a September move on the table unless the energy-led decline in inflation arrives quickly and convincingly in the data. We stay cautious on duration, favor trimmed-mean gauges over the headline for reading the trend and continue to view this as a capital-led, K-shaped expansion, now with a financing question hanging over the AI buildout. May 2026 likely marks the inflation peak, conditional on an open Strait of Hormuz and a durable ceasefire, a condition the weekend’s renewed strikes have put back in play.
Key Takeaways
| Theme | Our read |
|---|---|
| Fed | Hawkish hold confirmed; Kashkari joins the hike camp; next move likely up |
| Inflation | Headline 4.1% is a three-year high; our underlying read near 2.9% is still a three-handle |
| Growth | Q1 revised up to 2.1% and spending resilient; housing still soft |
| Oil | Crude fell even as the ceasefire was tested; watch for a Monday gap on the weekend escalation |
| Consumer | Sentiment at 44.8 looks overdone; soft real incomes are the signal, and they are turning up |
| Markets | K-shaped tape; AI financing doubts pressure megacaps; Dow and small caps lead |
| Rates | Yields eased with oil, but we stay defensive on duration |
| Risks | Lebanon and Hormuz durability, June PCE confirmation, and AI capex financing |
Treasurers & CFO Corner
What this week means for corporate treasury and finance teams.
- Manage the front end actively. With the next move more likely a hike than a cut, revisit hedge ratios on floating-rate exposure, and keep operating cash in laddered Treasury bills and short corporates where front-end yields stay well-anchored.
- Pre-fund while the window is open. The cool reception for large AI-related debt sales and the reported delay in marquee listings show funding access can narrow fast. Term out maturities and bring issuance forward.
- Bank the energy relief, but hedge the tail. Brent near 72 dollars should ease fuel, freight, and input costs, yet the strait was tested this week. Lock in part of the savings with hedges rather than assuming the calm holds.
- Reassess FX into European flux. Sterling is soft on the UK transition and a move toward zero tariffs on United States goods is underway. Review euro and sterling hedges and counterparty exposure before they reprice.
THE PIEDMONT PERSPECTIVE · ABRIDGED
Left of the Decimal Point
Condensed from the Perspective published June 25, 2026. The full piece, with complete methodology and four exhibits, is available separately.
The debate over whether inflation carries a two-handle or a three-handle is not a rounding curiosity, it decides whether the Fed is near its goal or still distant from it. We ran a Hodrick-Prescott filter across a broad set of price series to separate the durable trend from monthly noise and the energy spike. The filtered measures put underlying inflation near 2.9 percent. That reading reaccelerated into the spring as the energy shock spread across the cross-section, but energy is the principal outlier and is now rolling over, leaving the durable trend firm relative to target rather than back at it.
Headline and core readings both distort the trend at a moment like this one. Headline at 4.1 percent overstates the persistent pace because it carries the full energy shock. Core at 3.4 percent removes food and energy but still reflects the pass-through of higher fuel costs into services. The filtered series cuts through both and lands near 2.9 percent. The Dallas trimmed mean reads lower, at 2.4 percent, though the Dallas Fed cautions the positive skew in the current shock is biasing that measure down, so we treat it as the floor of the range rather than its center.
Even under the most generous reading, the number does not round to target. A 2.9 percent underlying pace rounds to three, not to two. The Fed’s new leadership has signaled a willingness to interpret progress generously, yet generosity cannot turn a 2.9 into a 2.0. Only the trimmed mean slips to a two-handle, and the Dallas Fed itself says that reading is biased low today. The better-behaved gauges, and the more constructive forecasts across the Street, keep the trend on a three-handle through year end.
This is why we do not expect a cut. Underlying inflation sits closer to 3 percent than to 2 percent, in an economy still growing above 2 percent, leaving the Fed with no room to ease and a credible reason to consider tightening. The exhibit below shows where the major gauges stood in May.
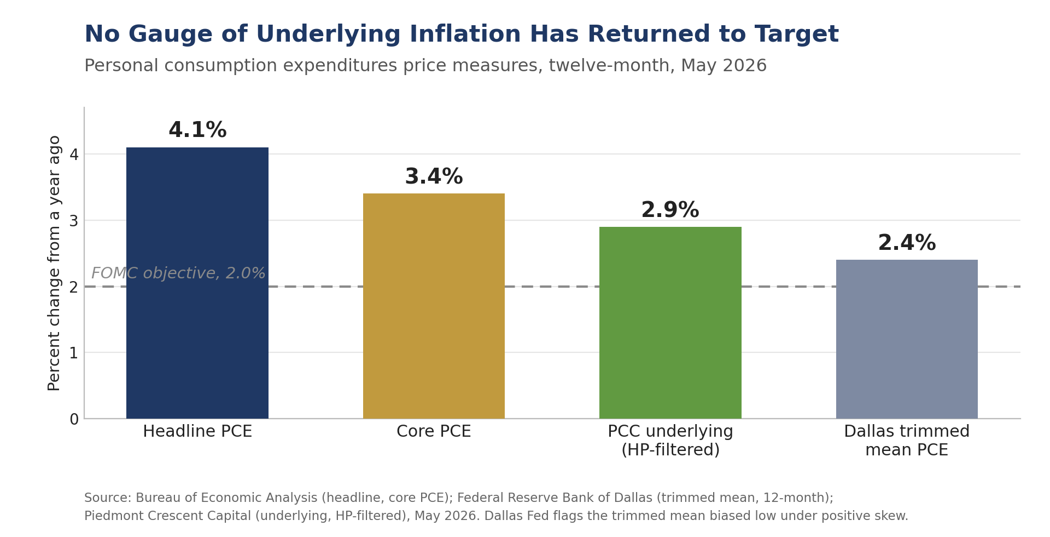
Mark P. Vitner
President and Chief Economist, Piedmont Crescent Capital
mark.vitner@piedmontcrescentcapital.com | (704) 458-4000
A View from the Piedmont is published by Piedmont Crescent Capital for informational purposes only and does not constitute investment, legal, or tax advice. Views are as of the date of publication and are subject to change.
The Piedmont Perspective – Left of the Decimal Point
Firming up Chair Warsh’s definition of the Fed’s 2 percent target
The Federal Reserve adopted its explicit 2 percent inflation goal in January 2012, which means the target turns fourteen this year. With the headline PCE deflator climbing to 4.1 percent in May, reported this morning, on the back of the energy shock now working through the system, it is worth stepping back from the monthly noise to ask a longer question. Since the goal was set, how often has inflation actually been where the Fed wants it?
The objective was written into the Committee’s Statement on Longer-Run Goals and Monetary Policy Strategy, adopted effective January 24, 2012 and reaffirmed every January since. It is defined on the headline PCE price index, measured as a twelve-month change, and in 2016 it was clarified as a symmetric goal rather than a ceiling. That symmetry matters for the scorecard, because it means undershooting the mark counts as a miss in the same way overshooting does.
We took the 173 monthly readings from January 2012 through May and sorted them into three bins: at target, which we define as within half a point on either side of the goal, or 1.5 to 2.5 percent; below that band; and above it. The result runs against the prevailing mood. Inflation has sat at target or below it roughly 72 percent of the time, and above the upper edge of the band only about 28 percent of the time.
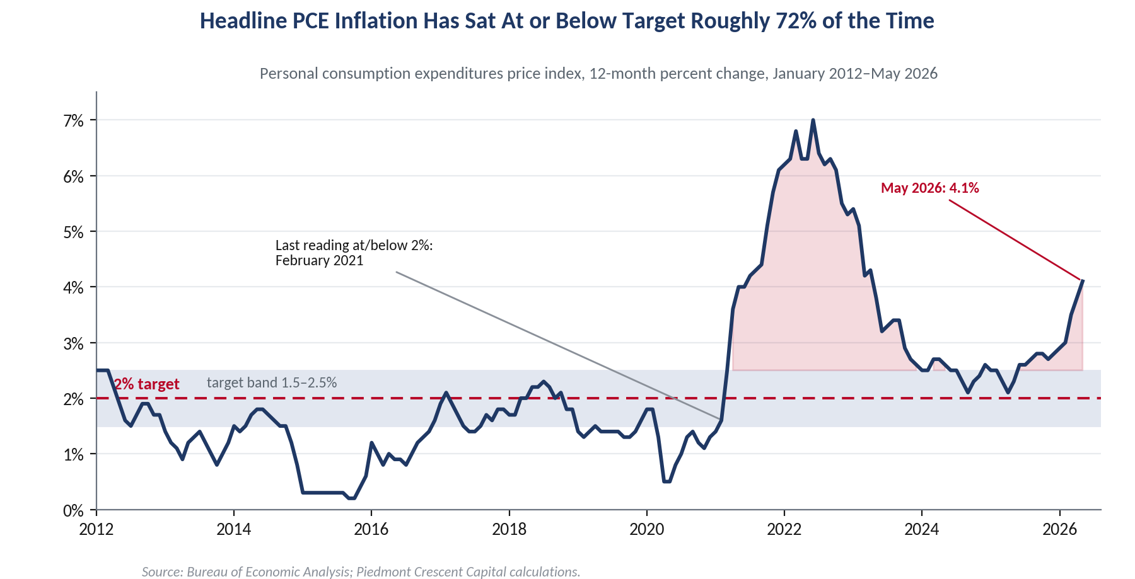
There is a definitional question lurking inside that figure, and Chair Warsh framed it well when he said he likes to focus on the left side of the decimal point. Some read that pessimistically, and perhaps deliberately so, as meaning that anything with a two in front of it counts as success, which would wave a 2.9 percent print through as on target. We read it as the number that rounds to two, which is both the sensible standard and the one behind our band. A reading of 1.8 percent rounds to two and clears the bar, as does 2.3 percent, while a reading of 2.99 percent rounds to three and plainly does not.
Splitting the at-or-below group is where the picture gets interesting. Time spent squarely in the band, at about 36 percent of months, is almost exactly matched by time spent below it, at about 35 percent. For most of the last decade the Fed was not fighting inflation at all. It was coaxing it up toward a target it kept missing on the low side. That persistent undershoot is the reason the Committee rewrote its framework in 2020 to allow inflation to run moderately hot for a time, and it is worth remembering now that the lived experience of the 2010s was disinflation, not the reverse.
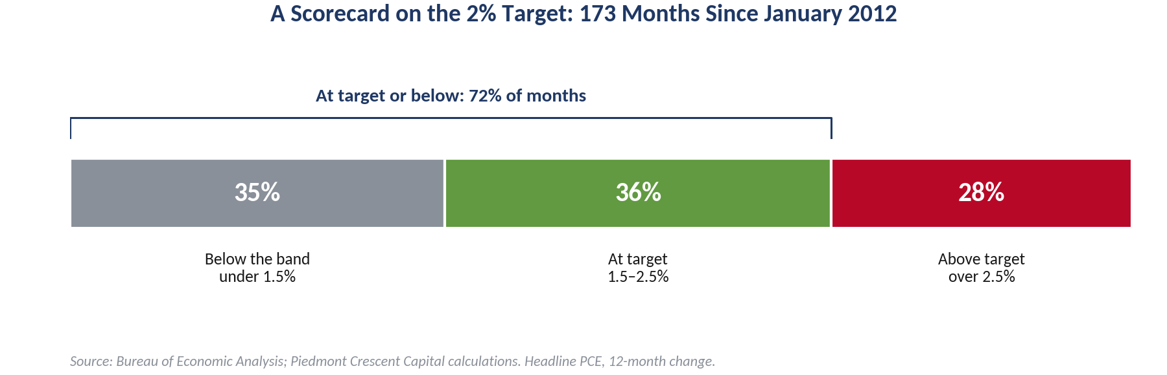
The overshoot, when it finally came, was violent but concentrated. From the target’s adoption through February 2021, a span of nine years, not a single month printed above 2.5 percent. Every above-target reading in the record sits inside two episodes, the 2021 to 2023 surge and the reacceleration underway this year. The 2024 and 2025 readings spent much of their time pressed against the top of the band, neither cleanly inside it nor far above it, which is the uncomfortable middle ground the Committee has been navigating.
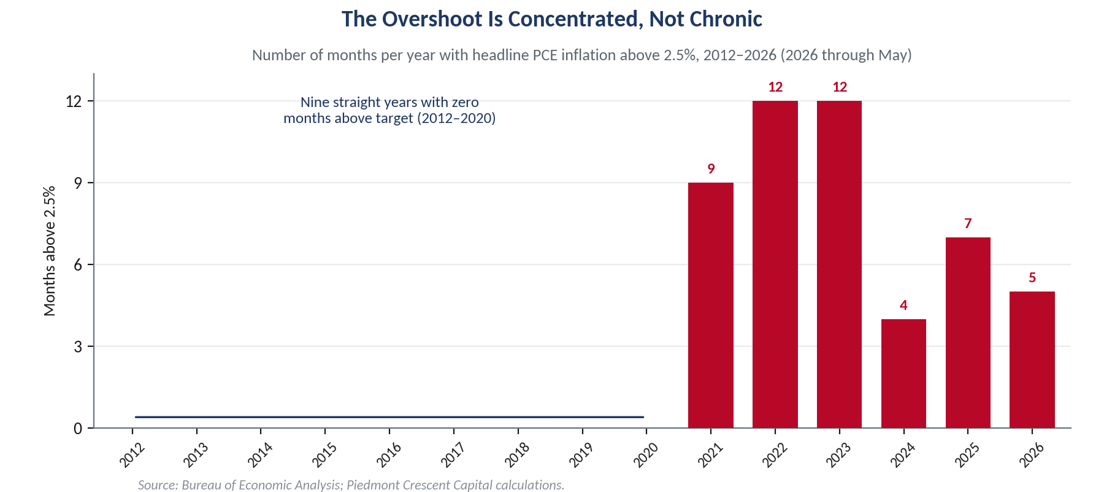
A Filter, Not a Trim
There is a definitional cousin to the trimmed mean worth setting beside it. The trimmed-mean family answers one question. Strip the most extreme price moves in a given month, weight what remains, and read the center. The Cleveland Fed does this for the CPI with its median and trimmed measures, and the Dallas Fed does it for the PCE with its trimmed mean. We lean on these gauges because they are honest about what a headline print hides, which is that a handful of categories can carry an entire month in either direction.
We reach a similar place by a different road. Rather than trim the cross-section of one month’s price changes, we filter the time path of each component, pull out its underlying trend with a Hodrick-Prescott filter, and take the cross-sectional median of those trends. The trim discards the outliers in space, across categories within a single month. The filter discards them in time, the month-to-month noise within each category. Taking the median across the filtered trends keeps the center and drops the tails, which is what the trim does to the cross-section, so the two are cousins. When they agree, we have more confidence that we are looking at signal rather than noise.
Run on the headline deflator alone, the filter puts the underlying trend near 2.9 percent, with May’s 4.1 percent reading sitting about 1.2 points above it. That gap is an energy price spike from the supply disruption abroad resting on a firm underlying rate, the mark of a supply shock rather than a broadening of price pressure, and it is the clearest picture of why the headline can cool in the second half without the Committee gaining anything that would justify a cut. Softer energy pulls the headline back down toward the trend. It does not pull the trend down to two. The filtered trend has come well off its 2022 peak near 3.7 percent, but at roughly 2.9 percent it sits closer to three than to two.
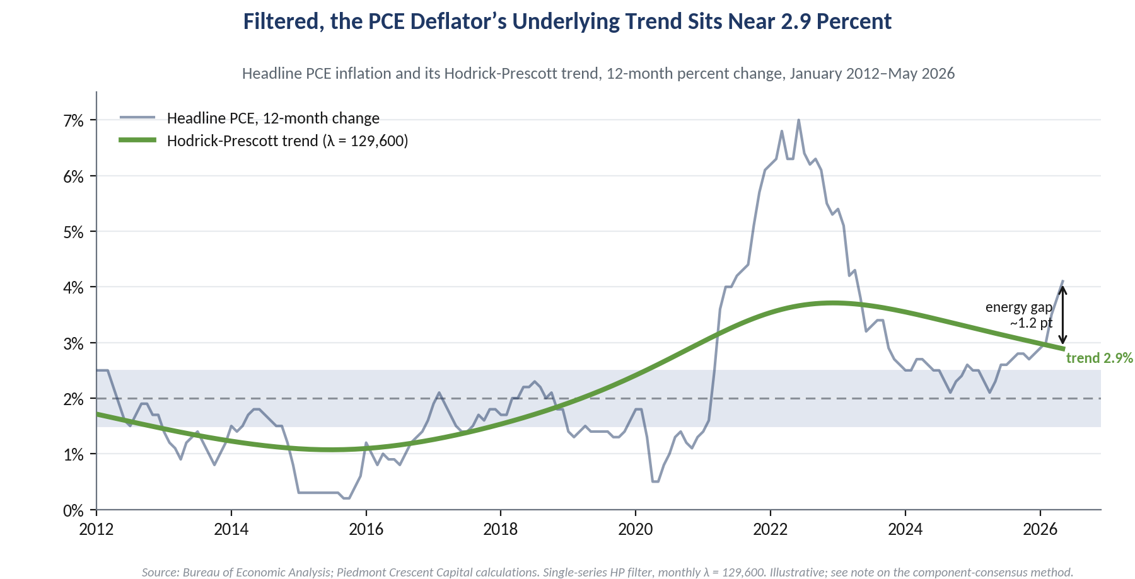
We would not lean on that single-series read for a turning-point call. A filter run on one aggregate is fragile at the endpoint, where it has no future data to anchor it, and it can mistake a real reacceleration for noise for months before the trend catches up. That is the weakness the consensus version is built to handle. Running the filter across dozens of components and taking the median averages out the idiosyncratic endpoint errors and, more to the point, lets us see breadth. When most components turn up together rather than one or two doing the work, the firming is real. That breadth is what the comparable CPI consensus showed this spring, and it is what we will be watching the PCE components to confirm.
We would not read that 72 percent, the share of months inflation has spent at or below the top of the target band, as cause for comfort. The composition of the misses has changed in kind, not just in degree. The last episode was a demand shock and a supply shock layered together. The current one is an energy-led impulse from the conflict abroad, arriving while the underlying economy is running into full employment rather than slack. That is the configuration we have flagged before: growth pressing against capacity, capital spending leading the expansion, and an inflation impulse that is harder to dismiss as transitory because it is not landing on a weak labor market. Our filter and the trimmed-mean gauges point the same way, with the underlying rate firm and a touch above the mark rather than back at it, and we continue to think the path of least resistance for the Committee this year is to hold rather than to cut.
This Morning’s Print
This morning’s release put hard numbers on that picture. The headline PCE price index rose 0.4 percent on the month and 4.1 percent over the year in May, up from 3.8 percent in April and a tenth above what the consensus expected. Core, which strips out food and energy, rose 0.3 percent on the month and firmed to 3.4 percent over the year, its highest reading since late 2023. The spending side held up, with personal income and nominal consumer spending each up 0.7 percent, real spending up 0.3 percent once prices are stripped out, and the saving rate edging up to 3.0 percent, though the income gain leaned on a round of farm and disaster-relief payments as much as on wages. Energy did the heavy lifting on the headline, the supply-shock signature we described, while the firmer core says the underlying pace is still drifting the wrong way rather than settling back.
Markets took it in stride, and the reaction said as much about positioning as about prices. Treasuries barely moved, with the ten-year note holding near 4.4 percent, and equity futures were firmer on the morning, though that owed more to a blowout result from a large memory-chip maker than to anything in the inflation data. The relief was that the print was not worse, given how far energy had run. Underneath the calm, the policy story kept moving in one direction. Futures now put the odds of a rate hike by September near two-thirds, up from less than a third a week ago, and not a single meeting this year is priced for a cut. What markets are leaning on is that crude has round-tripped much of its war premium this month as tanker traffic through Hormuz normalized, which means the energy spike that drove the May headline is already reversing in real time. That is consistent with our read. The headline should cool as energy fades, the core will be slower to follow, and neither development hands the Committee a reason to cut.
Fourteen years in, the record reads less like a story of chronic overshoot and more like a target missed in both directions, low for a decade and high for a stretch, with relatively few months spent exactly on the mark. For an investor, the lesson is in the duration of the misses rather than their direction. They have tended to run in long regimes rather than quick reversions, and that argues for respecting the current impulse rather than fading it.
Chief Economist, Piedmont Crescent Capital
704-458-4000 · mark.vitner@piedmontcrescentcapital.com
The Piedmont Perspective is published by Piedmont Crescent Capital for informational purposes only and does not constitute investment, legal, or tax advice. Inflation buckets are computed from the headline PCE price index, 12-month change, seasonally adjusted, and are subject to revision by the Bureau of Economic Analysis.
Total Factor Productivity Growth: The Factory Floor Sits Out the Productivity Boom
ECONOMIC INDICATOR REPORT · TOTAL FACTOR PRODUCTIVITY, DETAILED INDUSTRIES 2023
The Factory Floor Sits Out the Productivity Boom
Total factor productivity fell in 70 of 86 manufacturing industries in 2023, but the snapshot predates the AI build. Output is climbing, hours are flat, and productivity is accelerating again.
Early Signals
- Breadth was brutal. Total factor productivity declined in 70 of the 86 four-digit NAICS manufacturing industries in 2023, a third straight year of broad declines after only 10 industries fell in 2021.
- The snapshot is stale. The data released this morning are for 2023. The AI build did not scale until 2025, when data-center capital spending jumped more than 50 percent and AI-related investment added more to growth than consumer spending. The release captures none of it.
- Output is outrunning hours. Since 2023, nonfarm business output has risen about 5 percent while hours worked are roughly flat, so output per hour has carried nearly all of the gain. Productivity is accelerating, not stalling.
- The gain is capital-led. Roughly half of the 2024 labor-productivity rise came from pure efficiency and the rest from capital deepening and a better-skilled workforce, which reconciles our strong nowcast with the soft total factor productivity in today’s release.
- The factory floor still lagged. The 2025 companion release shows output rising in only 19 of 85 manufacturing and mining industries, although the ISM index and industrial production have since turned higher in 2026.
- Reshoring is taking physical form. Factory construction has roughly tripled since 2021, led by semiconductor and pharmaceutical plants. Commercial aerospace and defense rearmament are additional capital-led engines whose output, like AI’s, lies ahead of these data.
- The seven-trillion-dollar question is open. The weak reading lands awkwardly against the pandemic relief and industrial policy of 2021 and 2022, and some of that money, especially the EV and battery bets, was clearly misallocated.
Key Takeaways
| Key Concept | Findings |
|---|---|
| 2023 Breadth | Total factor productivity fell in 70 of 86 detailed manufacturing industries, after 66 in 2022 and just 10 in 2021. Four-fifths of the group lost efficiency in a single year, a decline that is structural and shared. |
| Data Lag | The detailed-industry series runs about two years behind. Today’s release describes 2023 and captures none of the AI investment wave that scaled in 2025. |
| Output vs. Hours | Nonfarm output is up about 5 percent since 2023 on essentially flat hours. Labor productivity grew 3.0 percent in 2024 and 2.1 percent in 2025, well above the 1.5 percent trend. |
| Capital Deepening | More than a third of the 2024 labor-productivity gain came from capital intensity rather than pure efficiency. The acceleration is real but capital-led, not yet a broad free lunch. |
| Factory Floor | The 2025 manufacturing and mining release shows output rising in only 19 of 85 industries, with hours falling in most. The plants had not found a new gear in the lagged data. |
| 2026 Turn | The high-frequency data have already improved. The ISM Manufacturing PMI reached 54.0 in May, a four-year high and a fifth straight month of expansion, with output growing even as factory employment keeps shrinking. |
| Policy Signal | Firming economy-wide productivity alongside a still-soft factory floor is one more reason the Warsh committee can hold rather than cut. |
A Snapshot from Before the Boom
Timing matters here more than the numbers. The detailed-industry series runs about two years behind because it waits on Census economic survey and capital data, so today’s release describes 2023. The artificial-intelligence investment wave that is now reshaping the capital stock did not scale until 2025. Data-center capital spending rose more than 50 percent last year, the four largest cloud builders lifted their outlays by roughly three-quarters, and AI-related investment contributed more to GDP growth in the first half of 2025 than consumer spending did. None of that is in this report. Reading the 2023 factory-floor weakness as the current state of productivity would be a mistake.
The breadth of the 2023 decline is still worth marking. Of the 86 detailed manufacturing industries, total factor productivity fell in 70, following 66 in 2022 and just 10 in 2021. When four-fifths of an industry group loses efficiency in the same year, the cause is structural and shared, not a handful of idiosyncratic plants. The goods-producing core entered the AI era already on its back foot.
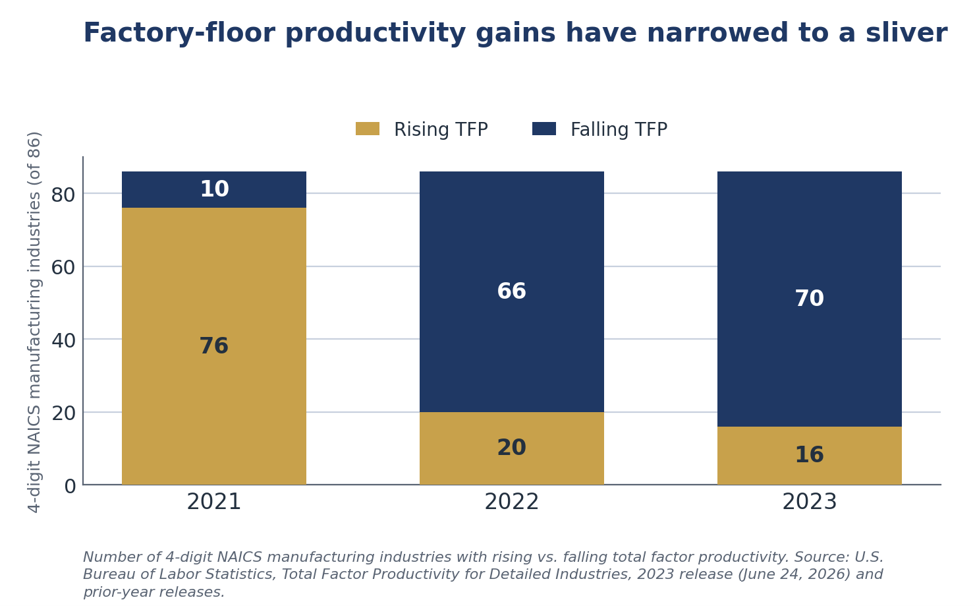
What the Numbers Miss: Output Is Outrunning Hours
To see what has happened since, set the lagged data aside and compare output against hours worked. It is the rawest reading on productivity, and the contrast is stark. Nonfarm business output rose 2.9 percent in 2024 and 2.5 percent in 2025, while hours worked fell 0.1 percent and then rose just 0.4 percent. Output is up about 5 percent since 2023 on essentially flat hours, which means output per hour has carried nearly the entire gain. Labor productivity grew 3.0 percent in 2024 and 2.1 percent in 2025, both well above the long-run trend near 1.5 percent. Over the current cycle, productivity has grown more than four times as fast as hours.
The economy is making more with the same labor, and the gap is widening rather than closing. This is the capital-led expansion we are constantly highlighting in our weekly reports and monthly commentary. The gains are not spread evenly, though, and the next chart shows where they are landing.
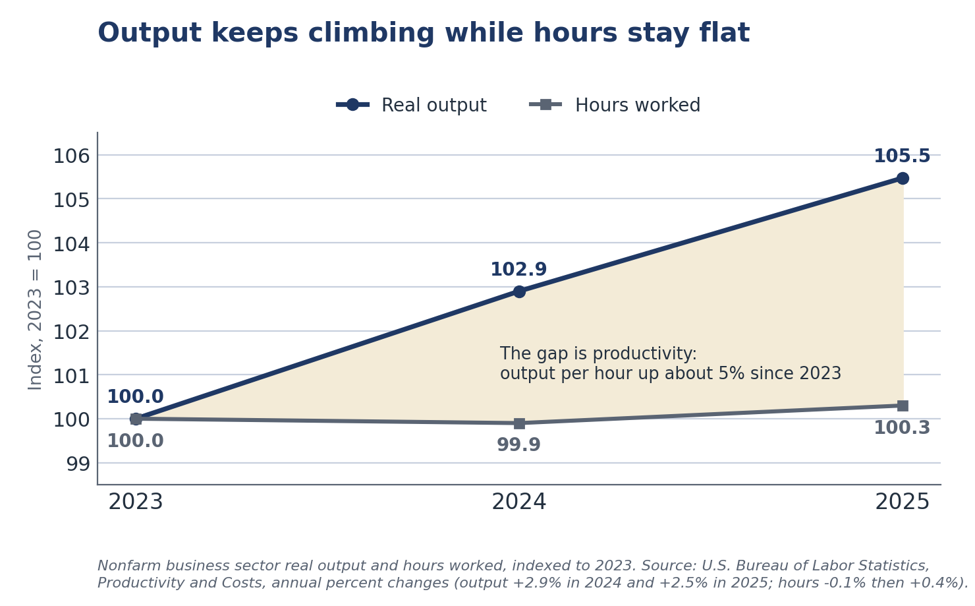
The Breakout by Sector
Break output and hours apart by sector and the split is unmistakable. In information, the heart of the data-center build, real output rose about 4 percent in 2024 while hours fell, so output per hour jumped more than 5 percent. Finance and professional services tell the same story on a smaller scale, with output climbing on flat or falling hours. Health care grew output even faster, but it did so the old-fashioned way, by adding workers, so its productivity gain was middling. Manufacturing alone saw output and hours fall together, with productivity slightly negative. The boom is concentrated in the capital-intensive, technology-facing service sectors, which is exactly where the AI investment is landing.
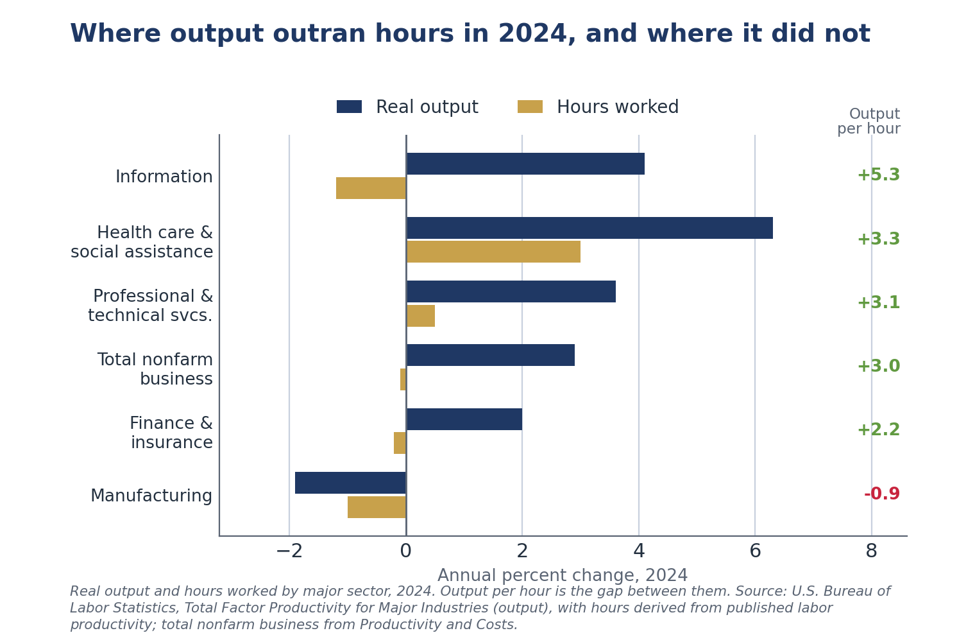
Reconciling the Two Gauges
This raises a fair question. How can productivity be accelerating in the nowcast when today’s release shows total factor productivity falling across manufacturing and running only modestly positive for the broad economy? The two measures track different things, and both are true at once. Labor productivity, the nowcast, is output per hour. Total factor productivity is output per unit of every input, capital and materials included, so it strips out the effect of giving each worker more and better tools. An identity ties them together: labor productivity equals total factor productivity plus capital deepening plus workforce quality.
The arithmetic settles it. Of the roughly 3 percent gain in labor productivity in 2024, total factor productivity contributed somewhere between 1.3 and 1.5 points, capital intensity about 1.1 points, and a better-skilled workforce about 0.3 points. More than a third of the gain came from capital deepening rather than pure efficiency. In 2025 the tilt grew sharper, with broad total factor productivity decelerating to 0.8 percent while labor productivity held above 2 percent. The productivity acceleration is real, but so far it is being driven by capital rather than by efficiency. The free lunch that a true total-factor gain represents has not yet broadly arrived. That is the open question hanging over the AI build, and it is why the weak factory-floor reading in today’s release and the strong labor-productivity nowcast are not in conflict. They are two gauges of one capital-led expansion.
The Factory Floor Still Lags
The freshest annual factory data say the malaise carried forward. The manufacturing and mining release out the same morning, covering 2025, shows output rising in only 19 of 85 industries and labor productivity up in fewer than half. Hours worked fell in most industries, so the sector was making less with fewer people rather than more with the same. The broad economy had found another gear. The plants, in these tables, had not.
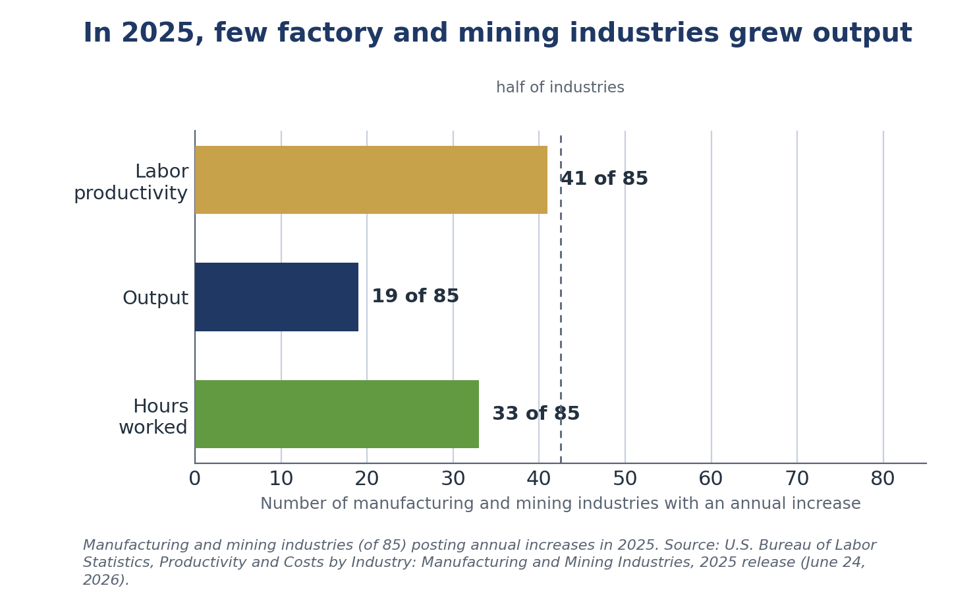
Beyond the AI Headlines
AI dominates the coverage, but it is not the only thing being built. We have made the point all year that meaningful growth is also coming from reshoring, and the clearest evidence is poured in concrete. Spending on new factory construction has roughly tripled since 2021, from around $80 billion a year to a peak above $240 billion in 2024, and it still runs near $190 billion after cooling. The surge is led by computer, electronic, and electrical plants, the semiconductor fabs that the CHIPS program helped seed, with 23 backed projects and 16 new fabs across 15 states. It does not stop at chips. Drugmakers are reshoring too, with Eli Lilly alone committing more than $50 billion to new domestic sites and active-ingredient production, part of a broader pull of pharmaceuticals, life sciences, and medical supply chains back onshore. More is on the way.
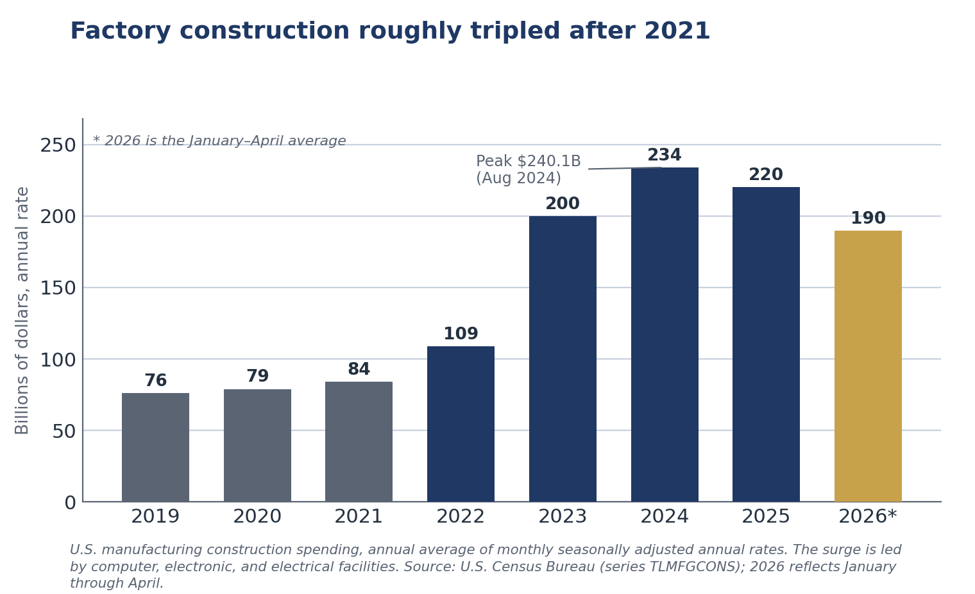
The timing echoes the AI story. A fab or a finishing plant takes years to design, pour, equip, and bring up to speed, so the spending above is investment, not yet output. Much of this capacity is still under construction or only now coming online, which means its contribution to production and productivity lies ahead, not in the 2023 figures we received today. The reshoring wave, like the AI build, postdates the snapshot.
Commercial aerospace is a second engine, and it is turning over again. Boeing is working the kinks out of its supply chain and its assembly lines. It delivered 143 commercial jets in the first quarter, its best opening quarter since 2019, with the 737 running near 42 a month and headed for 47 and beyond as a fourth line opens this summer. The company expects 500 narrowbody deliveries this year, up from 447, against a backlog above 6,000 aircraft. Profitability still trails the production recovery, but the direction is set, and a healthier Boeing pulls a deep domestic supplier base along with it.
Private space has become a real industry rather than a science project. SpaceX flew a record 170 launches in 2025 and lifted more than 80 percent of the mass the world sent to orbit, on rockets it lands and reuses, and its market debut valued it near $1.8 trillion. Competitors from Blue Origin to Rocket Lab and the traditional primes are scaling behind it. Reusability has pushed launch costs down far enough that satellite broadband, defense sensing, and even orbital manufacturing now pencil out, which widens the industrial base feeding them.
Defense is the third engine, and the demand is structural. A decade of underinvestment ran headlong into a war in Europe and conflict in the Middle East, and the stockpiles came up short. NATO has lifted its target to 5 percent of GDP, U.S. defense authorizations now run above a trillion dollars with roughly $25 billion earmarked to rebuild the munitions arsenal, and European budgets are climbing at double-digit rates. Restocking missiles, interceptors, and artillery is not a one-year order. It is a multiyear production ramp that lands squarely on the domestic industrial base. Contractors are urgently expanding facilities and ramping up production where they have excess capacity today.
These are the kinds of growth we favor. Reshoring, aerospace, and defense are capital-led and capacity-building, protein rather than carbohydrates, and they share the AI build’s defining feature for reading today’s release. The money is going in now, so the output and the productivity follow later. The 2023 data capture none of it.
The Manufacturing Outlook: What 2026 Is Telling Us
The high-frequency data have already turned. The detailed-industry tables describe a factory floor that was contracting in 2023 and barely growing in 2025, but the monthly indicators we track in real time paint a more encouraging picture for the first half of 2026. The ISM Manufacturing PMI climbed to 54.0 in May, its highest reading since May 2022 and a fifth straight month of expansion, after holding at 52.7 in March and April. New orders reached 56.8, the production index 54.3, and the survey now points to a pace of activity consistent with roughly 2 percent real GDP growth. The cyclical bottom that defined the goods sector for the better part of three years looks to be behind us.
The hard data confirm the direction, if not yet the magnitude. Manufacturing output rose 0.6 percent in April, its best month in more than a year, before flattening in May, and factory production is running about 1.4 percent above its year-earlier level. The gains are concentrated where a capital-led cycle would put them: durable goods, motor vehicles, and business equipment led by transit and aerospace, while nondurable lines such as food and textiles softened. Capacity utilization in manufacturing sits near 75.7 percent, more than two points below its long-run average, so the rebound still has room to run before it presses against capacity.
The factory is making more without adding workers, exactly as the productivity data imply. Even as orders and output have firmed, the ISM employment index has stayed below 50, contracting for a thirty-second consecutive month, and factory payrolls have been flat to lower. This is not a contradiction. It is the same capital-led expansion we have described all year, now visible at monthly frequency: output per hour is doing the work, and headcount is not. A manufacturing recovery that shows up in production and productivity but not in employment is the defining feature of this cycle, and it is precisely the pattern the detailed-industry tables will eventually record once they catch up to it.
The headwinds are real, and they are mostly about prices and policy. The ISM prices-paid index held at an elevated 82.1 in May, pushed up by the jump in oil and diesel that followed the conflict in the Middle East, and tariffs surfaced in roughly a fifth of survey comments. Input-cost pressure and trade-policy uncertainty are the chief risks to the nascent rebound, and they are the same forces lifting the headline inflation we flagged in our May CPI work. With the Federal Reserve holding rates in June and financial conditions still tight, the recovery is unfolding without monetary tailwinds, which argues for a gradual climb rather than a vertical one.
The structural build-out is still ahead of the data. The capital that is reshaping the goods sector, the AI data centers, the CHIPS-seeded fabs, the reshored drug plants, the Boeing ramp, and the defense restocking, is for the most part still pouring concrete and installing equipment rather than shipping product. As those projects move from investment to output over the next two to three years, they should add a second, structural leg to the cyclical recovery now underway. The near-term picture is a manufacturing sector that has stopped falling and started to climb. The medium-term picture is one in which the protein-rich, capacity-building investment we favor finally shows up where the productivity statistics can see it.
For the broader economy, the signal is consistent. Services activity expanded for a twenty-third straight month in May, payrolls are still growing, and first-quarter output advanced at a modest but positive pace. The economy-wide story remains one of solid output, firm productivity, and a labor market that is cooling without cracking. Manufacturing is the lagging piece that is beginning to catch up, not the leading edge of a downturn, and that distinction is the heart of how we read both today’s release and the year ahead.
Questions for the Seven Trillion
The weak 2023 reading lands awkwardly against the scale of public money committed earlier in the decade. Between 2021 and 2022, Washington enacted the $1.9 trillion American Rescue Plan, the roughly $1.2 trillion infrastructure law, the CHIPS and Science Act, and the Inflation Reduction Act, and layered them on top of the pandemic relief already in the pipeline. Counted with the residual COVID packages still spending out, the fiscal push approached $7 trillion. A large share was designed to rebuild the productive base in semiconductors, infrastructure, and clean-energy manufacturing.
The 2023 data offer little sign that the money lifted the factory floor, but the verdict deserves a fair caveat. The bulk of the rescue spending was transfers and relief meant to support demand, not to raise output per input, carbohydrates rather than protein. The industrial-policy dollars that were aimed at productivity were barely deployed by 2023. Only a fraction of the infrastructure and CHIPS funds had gone out the door, and a semiconductor fab takes years to pour and equip. The honest read is not that the supply-side bet has failed, but that it had not yet arrived when these numbers were collected. What is lifting productivity now is private capital chasing artificial intelligence, not the federal programs. Whether the public money eventually shows up in the data is the open question, and one we will be watching as the plants come online.
The deployment that did happen has not all gone well, and candor requires saying so. Where the money was spent, some of it was poorly invested, and the clearest misjudgment was electric vehicles, where demand never matched the projections that justified the build-out. The expiration of the $7,500 federal tax credit at the end of 2025 only sharpened a slowdown already under way. Two of the most visible casualties sit in our own backyard. Wolfspeed, the Durham silicon-carbide maker whose Siler City plant was tied to the largest CHIPS award the prior administration never finalized, passed through bankruptcy in 2025 and all but wiped out its shareholders, hurt by soft EV demand, low yields, and Chinese competition. VinFast’s $4 billion Chatham County plant has slipped from a 2024 opening to 2028, cut its hiring target from 7,500 jobs to 1,400, and now faces a state lawsuit to reclaim the site.
These are not isolated stumbles. By one widely tracked count, roughly $35 billion of announced EV and clean-energy factory investment was canceled or downsized in 2025, the first year since 2022 that withdrawals exceeded new commitments, with EV and battery projects accounting for most of the loss. Detroit has written down more than $50 billion across its electric programs. We read this as more than bad luck. When government steers capital toward favored industries, it trades a market forecast for a political one, and political capital is slow to admit error and reluctant to cut its losses, so a share of the money reliably lands in the wrong place. That does not condemn every public investment, and there is a genuine national-security case for reshoring critical chips and medicines. It does mean the waste is closer to a feature of the model than an accident of it. None of this erases the real build-out we charted above, but the supply-side bet and its waste tend to travel together.
Our Call
OUR CALL
Today’s headline is real but stale. Total factor productivity did fall across most of manufacturing in 2023, yet the data stop before the AI build that now drives the cycle. The current picture is the one that matters for portfolios and for policy: output is climbing on flat hours, productivity is accelerating, and the gains are concentrated in the capital owners and platforms rather than the goods-producing core.
The high-frequency data say the worst is over for the factory floor. The ISM Manufacturing PMI reached a four-year high in May and output is growing again, even as factory employment keeps shrinking. That is the capital-led, productivity-driven recovery we have described, now visible in real time, and the structural build-out in chips, pharmaceuticals, aerospace, and defense still lies ahead of it.
For businesses and the Fed, the read is the same. Stay with the productivity leaders and meet any broad manufacturing-renaissance narrative with the breadth data in hand. Firming economy-wide productivity alongside a still-soft factory floor is one more reason the Warsh committee can hold rather than cut. On the seven-trillion-dollar question the jury is still out, because the supply-side money was still pouring concrete when the latest BLS total factor productivity numbers were taken.
Mark P. Vitner
President & Chief Economist, Piedmont Crescent Capital
mark.vitner@piedmontcrescentcapital.com · (704) 458-4000
A note on the data: the detailed 2023 industry tables were not yet posting on the BLS site as of this writing, so the industry-by-industry leaders and laggards are not reflected here. Breadth counts come from the release headline and prior-year releases; output and hours figures are from the BLS Productivity and Costs and BEA GDP by Industry programs, and the 2026 monthly indicators from the ISM Manufacturing Report On Business and the Federal Reserve G.17 release. We will add the league table once the full 2023 tables post.
Disclaimer: This report is provided for informational purposes only and does not constitute investment, legal, tax, or accounting advice, nor an offer or solicitation to buy or sell any security. Information is drawn from sources believed to be reliable, including the U.S. Bureau of Labor Statistics, the U.S. Census Bureau, the Bureau of Economic Analysis, the Institute for Supply Management, and the Federal Reserve, but its accuracy and completeness are not guaranteed. Views expressed are those of the author as of the date of publication and are subject to change without notice. Past performance is not indicative of future results.
A View from the Piedmont: A Hawkish Fed Meets a Middle East Thaw

A VIEW FROM THE PIEDMONT
Highlights of the Week
FOMC. Rates held at 3.50 to 3.75% in a 130-word statement stripped of forward guidance and its easing bias. The dot plot dropped the cut bias and split nine for a hike against nine for unchanged or lower, and futures have swung to price a quarter-point hike by the October 28 meeting.
Energy. Crude round-tripped the war premium. WTI fell about 10% on the week to near $77 as tankers, including the first Saudi-owned cargoes since the war, moved through Hormuz, and pump prices slipped below $4.00. But the Switzerland nuclear talks were called off and Iranian-proxy Hezbollah and Israel kept exchanging strikes in northern Israel and Lebanon, leaving the deal’s durability in question.
Data. Retail sales rose 0.9% in May, though much of that was higher gas receipts, so real sales rose less, still a good result against sluggish real earnings. Claims held near 226,000, factory output was soft, and a multifamily-driven drop in housing starts overstated the sector’s weakness. Permits held up relatively well.
Our view. We read this as a hawkish hold, not a hiking cycle. The next move is up, not down, but we do not expect it before 2027. The durable driver is growth pressing into full employment, not energy, which has eased.
| Market Snapshot | Last | Week |
|---|---|---|
| S&P 500 | 7,500.58 | +0.9% |
| Nasdaq Composite | 26,517.93 | +2.1% |
| Dow Jones Industrial Avg | 51,564.70 | +0.8% |
| US dollar (DXY) | stronger | +1.1% |
| Fed funds target | 3.50–3.75% | unch |
| 2-yr Treasury | 4.22% | higher |
| 10-yr Treasury | ~4.50% | lower |
| WTI crude | ~$77 | −10% |
| Brent crude | ~$80 | −10% |
| Pump gas, US avg | <$4.00 | lower |
Executive Summary
Two developments defined the week. A hawkish-leaning FOMC decision under new Chair Kevin Warsh signaled fresh vigilance on inflation, and a US-Iran de-escalation pulled crude down by about 10%. Economic data revealed surprisingly resilient consumer spending and a steady labor market, even as housing starts softened and import prices remained elevated. Markets churned around the Fed but recovered on Thursday, led by small caps and technology, to finish the week modestly higher even as the yield curve flattened sharply. We read the Middle East thaw as a net positive for the growth and inflation mix, but the deal’s durability is in question after the nuclear talks in Switzerland were pushed back late in the week and got off to an unspectacular start when they convened on Sunday. The energy relief takes some of the near-term pressure off headline inflation, yet the underlying trend remains firm. Those calling for a rate hike miss one critical point: the real federal funds rate rises as headline inflation eases. That passive tightening is why we expect the Fed to remain on hold this year. The next move is up, but we do not look for it before 2027.
1FOMC Decision & Policy Stance
The Committee held the line, and Chair Warsh reset how the Fed talks. The Federal Open Market Committee voted unanimously, twelve to zero, on June 17 to keep the federal funds target range at 3.50 to 3.75%, the fourth consecutive hold. This was Chair Kevin Warsh’s first meeting since he succeeded Jerome Powell in May, and it left no doubt that a new chair is in the building. The policy statement ran about 130 words, down from more than 340 in April, and it dropped both the forward guidance and the easing bias that had framed recent communications. Warsh has long argued that forward guidance anchors the Fed to stale data and distorts the very market signals it relies on, and he put that conviction into practice on day one.
The projections did the talking the statement would not. In the Summary of Economic Projections, the median 2026 dot moved up to imply a possible hike, a sharp reversal from March, when the median still pointed to a cut. The Committee split evenly, nine participants penciling in at least one hike against nine who saw rates unchanged or lower. Officials lowered the projected unemployment rate to 4.3% from 4.4% and raised expected inflation to 3.6% from 2.7%, a revision that reflects the energy-driven price surge from the Mideast war. Warsh declined to submit his own dot, consistent with his skepticism of the exercise, and said he is setting up five task forces to review the Fed’s operations, communications, and inflation analysis.
The market repriced toward our long-standing view. The reaction was swift. The two-year Treasury yield, the maturity most sensitive to policy expectations, jumped about twenty basis points after the decision, and pricing for the funds rate at the end of 2026 rose roughly twenty basis points with end-2027 up about eleven. The median 2027 core PCE projection was lifted to 2.5%, a sign participants now read the energy-driven firmness as having a longer tail. One area where energy price pressure is likely to linger is transportation, with diesel and jet fuel prices set to lag the declines in oil and gasoline given extremely low inventories and tight refinery capacity. We have argued all year that the next move is more likely up than down, and the June dots have caught up to that view. Where we differ from the room is on timing. We read this as a hawkish hold, not the start of a hiking cycle, and we still see no move in 2026.
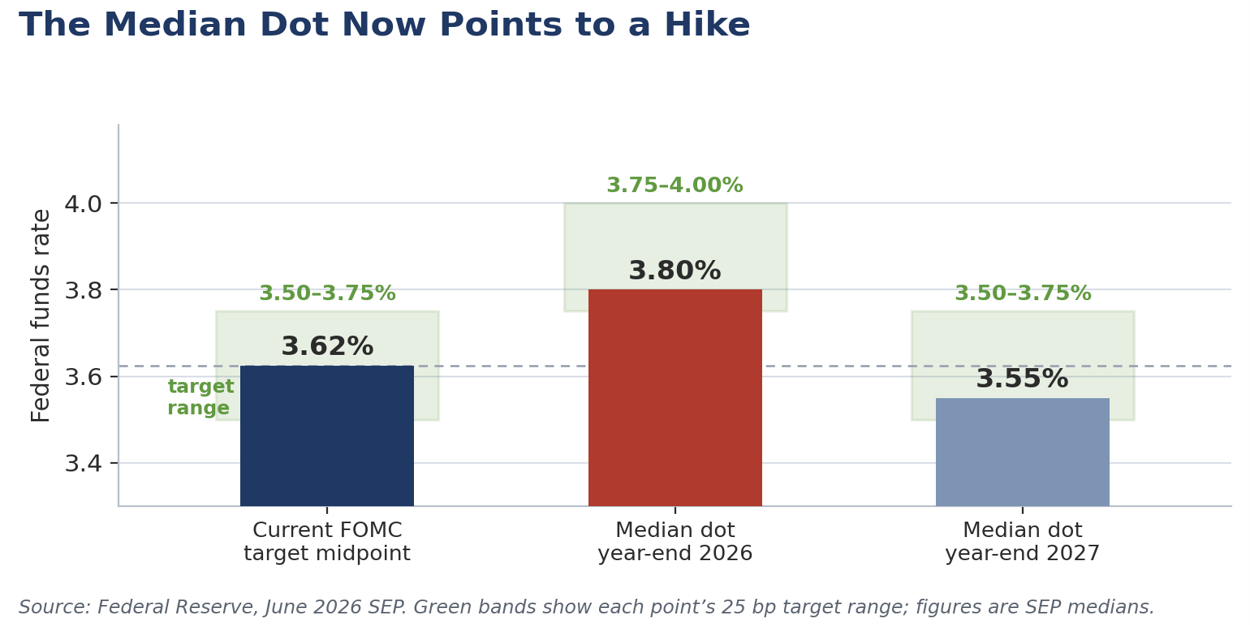
Warsh gave himself room to wait. The new Chair was deliberately balanced. He leaned on the price-stability mandate in a way that would make him sympathetic to a hike if the next several inflation prints disappoint, but he also said he watches the left of the decimal point, which we read as any reading that rounds to 2%, roughly 1.51% to 2.49%. That framing has always made more sense to us than a hard 2% target, under which a 0.1% rise in prices would count as too low and a 0.2% rise as too high. The move buys the Warsh Fed room to hold while inflation gradually drifts back toward that pace. Alongside it, Warsh announced five task forces to re-examine the post-2008 operating model, from communications and the dot plot to the balance sheet and the inflation framework. A Chair who has just commissioned a year of study is not in a hurry to move, and the reviews function as a patience mechanism.
Our own inflation filter says the underlying trend is still firm. Rather than crown a single gauge, we run a Hodrick-Prescott filter across dozens of individual price series, extract each trend, and take the cross-sectional median, a consensus that is resistant to outliers. The current read is consistent. The underlying pace has reaccelerated over the past three months across most measures, the breadth is real rather than the work of a few categories, and energy stands out as the principal outlier. That last point is also where the relief lies. Softer energy should ease headline readings in the second half, even as the underlying consensus stays firm, which is precisely the split that lets the headline cool. The case for a cut simply will not be there this year.
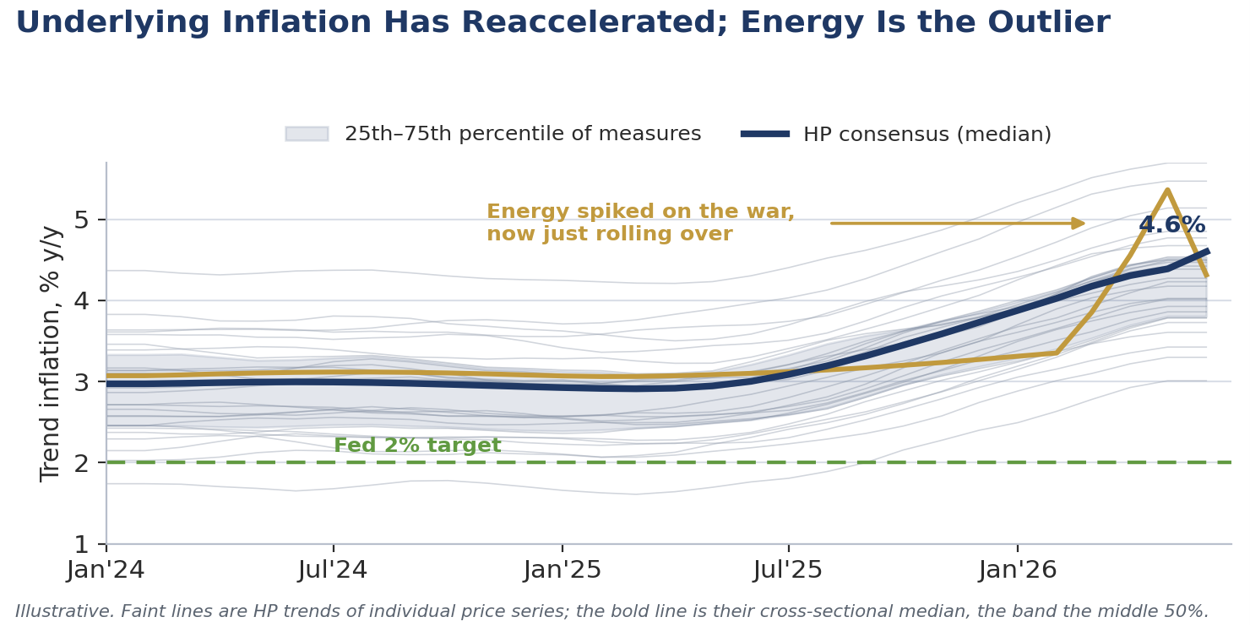
Assessment. Three things keep us at no hike in 2026 despite the dots. First, the energy shock is de-escalating, and if trade through Hormuz resumes, today’s hawkish projections could look stale within a quarter or two. Second, the dots reflect all nineteen participants, but only twelve vote, and we suspect a majority of those twelve still prefer to wait. Third, the Chair has given himself latitude through the left-of-the-decimal framing and the task-force timetable. There is a fourth, more mechanical point. As inflation decelerates in the second half with the nominal rate on hold, the real funds rate rises on its own, a passive tightening that does the work the penciled-in quarter-point hike was intended to do. The direction of travel is nonetheless clear. The durable inflation risk in this cycle is not energy but an economy pressing further into full employment while a capital-led, AI-driven investment boom broadens, with breakeven payroll growth near zero as baby boomers retire and immigration enforcement tightens. We retain our no-cut base case, with the tail skewed toward a hike that we do not expect before 2027, and we stay cautious on duration as the term premium rebuilds.
2Key Economic Data Releases
The data described resilient demand against softer manufacturing and housing. Several important indicators printed during the week, and together they showed solid domestic spending alongside mixed factory output and weaker homebuilding.
| Indicator | Period | Actual | Consensus | Comment |
|---|---|---|---|---|
| Retail sales | May | +0.9% | +0.5% | Strongest gain since early 2023; broad based |
| Retail ex-autos | May | +0.8% | +0.6% | Consumer resilience evident |
| Initial jobless claims | Jun 13 | 226K | 225–230K | Stable, low level; labor market balanced |
| Philadelphia Fed mfg | June | +10.3 | +10.0 | Solid regional expansion |
| Industrial production | May | +0.1% | +0.3% | Soft; capacity utilization steady near 76.2% |
| Housing starts | May | 1.17M | 1.43M | Weaker than expected; permits stable |
| Import price index | May | +1.9% | +1.1% | Elevated; tariff and supply factors |
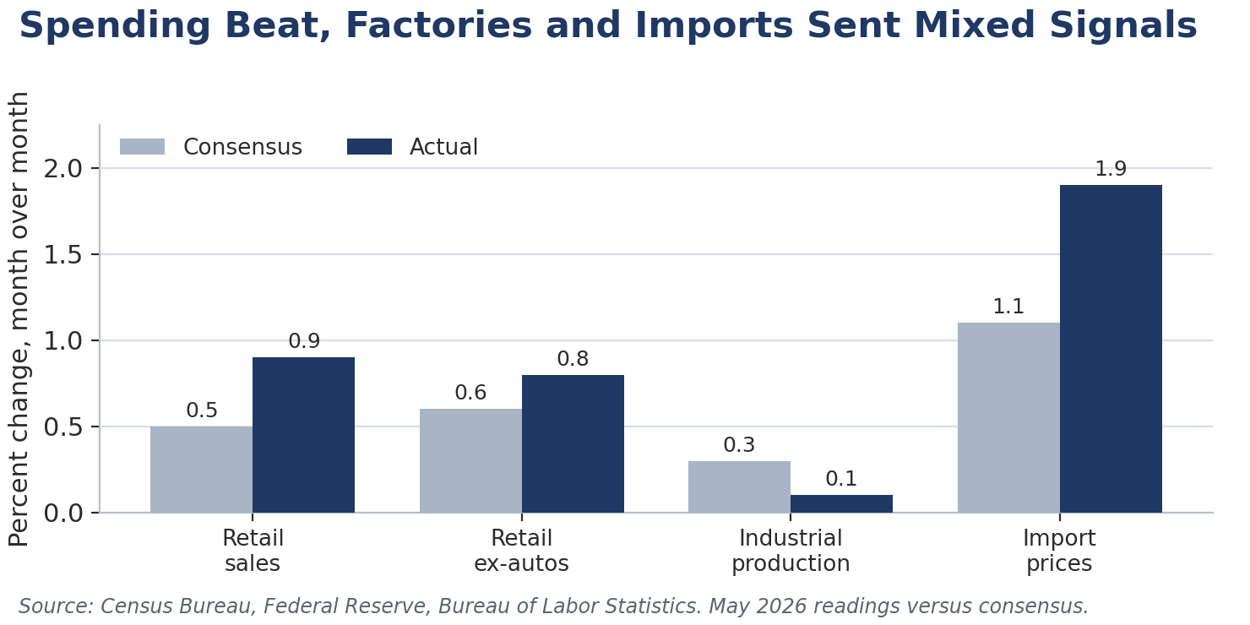
Read the retail headline with care. Retail sales rose 0.9% in May, the strongest gain in more than two years, but the strength was nominal. Service stations were among the biggest contributors as higher pump prices lifted the dollar value of gasoline sales, so real, inflation-adjusted purchases rose by less than the headline suggests. We still view it as a good result, particularly against a backdrop of sluggish real earnings. The war-driven jump in energy prices pushed inflation above wage growth over the past two months and produced the first decline in real wages in three years, yet households kept spending. The core control group, which feeds the consumer spending line in the GDP accounts, advanced a sturdy 0.7%, and second-quarter real consumer spending is tracking near a 2% annual pace, well ahead of the first quarter.
A spending tailwind is fading. Some of that resilience is borrowed. Tax refunds this season ran about 20% larger than a year ago and were skewed toward later filers and higher-income households, a boost that will be spent down over the summer. With pump prices now falling, the real-wage squeeze should ease, but the net support to spending from these crosscurrents is set to diminish as the year wears on.
The housing headline overstated the weakness. Housing starts dropped to a 1.17 million pace, well short of expectations, but the decline was concentrated in volatile multifamily activity, where permits point to a June rebound. Single-family starts fell a much milder 1.9%. Pending home sales surprised to the upside with a 3.8% jump even as mortgage rates touched a nine-month high, a forward signal of firmer closings into the summer. The binding constraint remains the overhang of completed, unsold homes, still near levels last seen in 2009, which builders must clear before single-family construction accelerates.
Factory softness and import prices point the same way we do. Industrial production rose just 0.1%, held back in part by petroleum-reliant chemicals and plastics, even as the AI buildout kept computer and electronics output climbing. Import prices jumped 1.9% on higher energy costs, and because they are measured early in the month, they missed the later slide in fuel. The more telling figure sits underneath. Nonfuel import prices are up 3.7% over the past year, led by capital goods and AI-driven electronics, with tariff effects still filtering through as policy shifts from Section 122 to Section 301 duties. That core-goods stickiness, not energy, is the inflation we are watching. Initial jobless claims fell to 226,000, with the four-week average just above 220,000 and the unemployment rate steady at 4.3% for a third straight month, a labor market that has firmed without overheating.
3Financial Markets Response
Markets traded the crosscurrents of de-escalation and a hawkish Fed. Early in the week equities surged on the emerging US-Iran agreement and falling oil. The Dow Jones Industrial Average set a record above 52,000 on Tuesday, reflecting a heartier risk appetite.
The hawkish projections sparked a midweek pullback that did not last. The dot plot triggered a sell-off on Wednesday afternoon and into Thursday as Treasury yields jumped on the higher rate path. Markets then recovered smartly on Thursday, June 18, the last session before the Juneteenth holiday, led by small caps and technology as the long end slipped back. On the four-day, holiday-shortened week, the S&P 500 closed near 7,500 for a gain of about 0.9%, the Nasdaq Composite finished around 26,518 up roughly 2.1%, and the Dow ended near 51,565, up about 0.8%. The dollar surged about 1.1% on the hawkish Fed shift.
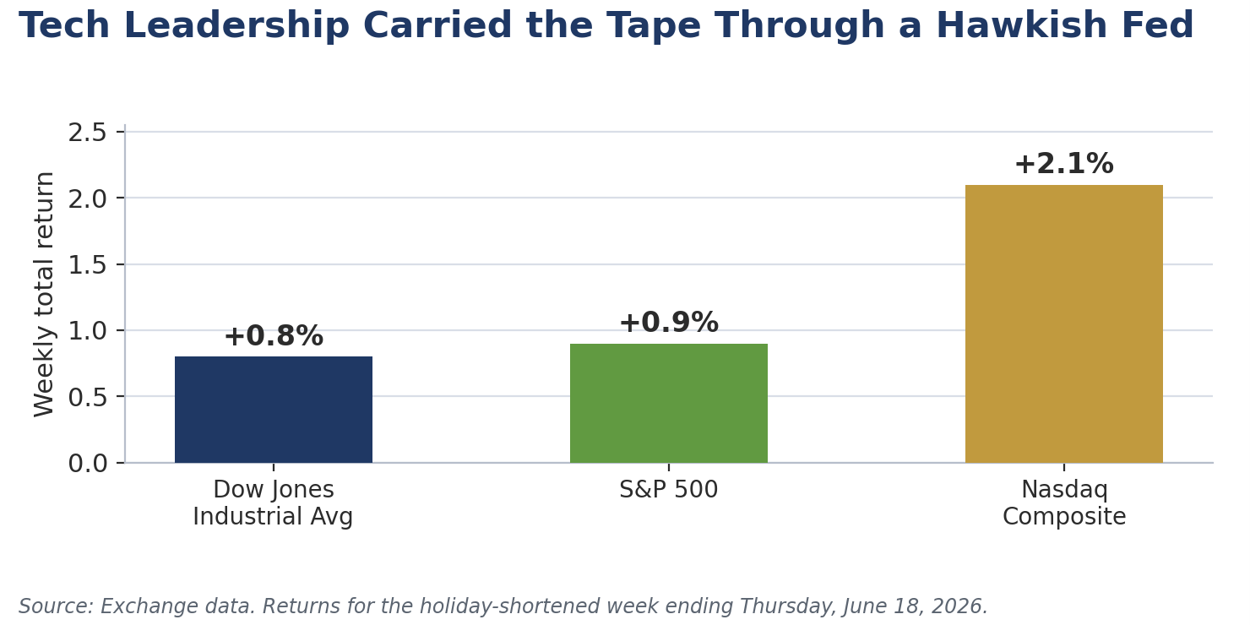
The curve flattened hard as the dots hit the front end and oil hit the long end. This was the sharpest flattening of the two-year/ten-year spread since early 2025. The hawkish projections drove the two-year yield to a new cycle high near 4.22%, while the ten-year slipped and found support around 4.50% as tumbling oil pulled inflation expectations lower across the curve. Markets now fully price a quarter-point hike by the October meeting and a second by next March. We believe that pricing is way too aggressive, but, unlike the cut-callers, we do not think the answer is easing either.
Financial conditions stayed easy, which is the point. Risk appetite barely flinched. Corporate spreads held near their tightest levels of the year, with investment-grade around 73 basis points and high-yield near 263, and a heavy issuance calendar led by a twenty-five-billion-dollar bond sale from a marquee AI chipmaker met ready demand. Easy financial conditions alongside a hawkish Fed reinforce our view that this economy does not need rate cuts and that the Committee can comfortably remain on hold.
The energy trade is a lesson in how quickly top-of-the-K wealth can swing. One of the quieter but more instructive moves of the past several weeks played out in energy shares. In the first six weeks of the war, energy stocks outran the broad market by nearly twenty percentage points, a windfall concentrated in the portfolios of higher-income households that hold the bulk of equity wealth. As peace talks advanced, that trade reversed hard. Energy gave back all of its war-era outperformance even as the broad market recovered, with the sector’s roughly $4.6 trillion in market value swinging on the headlines. It is a timely reminder that the asset wealth underpinning affluent consumer spending, the strong leg of our Two Americas economy, can erode as fast as it builds.
4Geopolitical Spotlight: The US-Iran MOU
The week’s dominant story was the US-Iran memorandum. The headline event was the announcement and release of the fourteen-point Islamabad Memorandum of Understanding between the United States and Iran, aimed at ending active hostilities and building a framework for de-escalation. Officials read out the terms during the week, with formal execution around June 19. The principal provisions include:
- Immediate and permanent termination of military operations on all fronts, including Lebanon, with commitments to respect territorial integrity and sovereignty.
- Reopening of the Strait of Hormuz to toll-free commercial navigation, with provisions for demining and safe passage, a critical channel for global energy supplies.
- Phased termination of UN and US primary and secondary sanctions, tied to compliance and a future nuclear agreement, with immediate waivers for Iranian crude, products, and associated banking, insurance, and transport services.
- A framework for technical negotiations on Iran’s nuclear program within a sixty-day extended ceasefire window.
- A commitment, with regional partners, to develop a mutually agreed reconstruction and economic development plan for Iran of roughly $300 billion. US officials clarified that this does not entail direct upfront US government funding.
- Broader confidence-building measures intended to prevent future conflict.
The picture on the ground is improving but fragile. By Thursday, tanker traffic was returning to the strait, with roughly ten million barrels of crude observed transiting or staging nearby, including the first Saudi-owned cargoes to move since the conflict began. Crude fell about 10% on the week, WTI settling near $77 against a wartime peak above $110 in early April, and pump prices slipped below $4.00 a gallon from a nationwide average of $4.48 in late May. Gasoline is on track to fall more than 9% in June, which alone should trim roughly three tenths from headline CPI. The caveats are real. The technical nuclear talks in Switzerland were pushed back late in the week and got off to an unspectacular start when they convened on Sunday, outbound vessel flows slowed on Friday, and Hezbollah and Israel kept exchanging strikes across northern Israel and Lebanon. The de-escalation is genuine, but its durability is the variable that matters most.
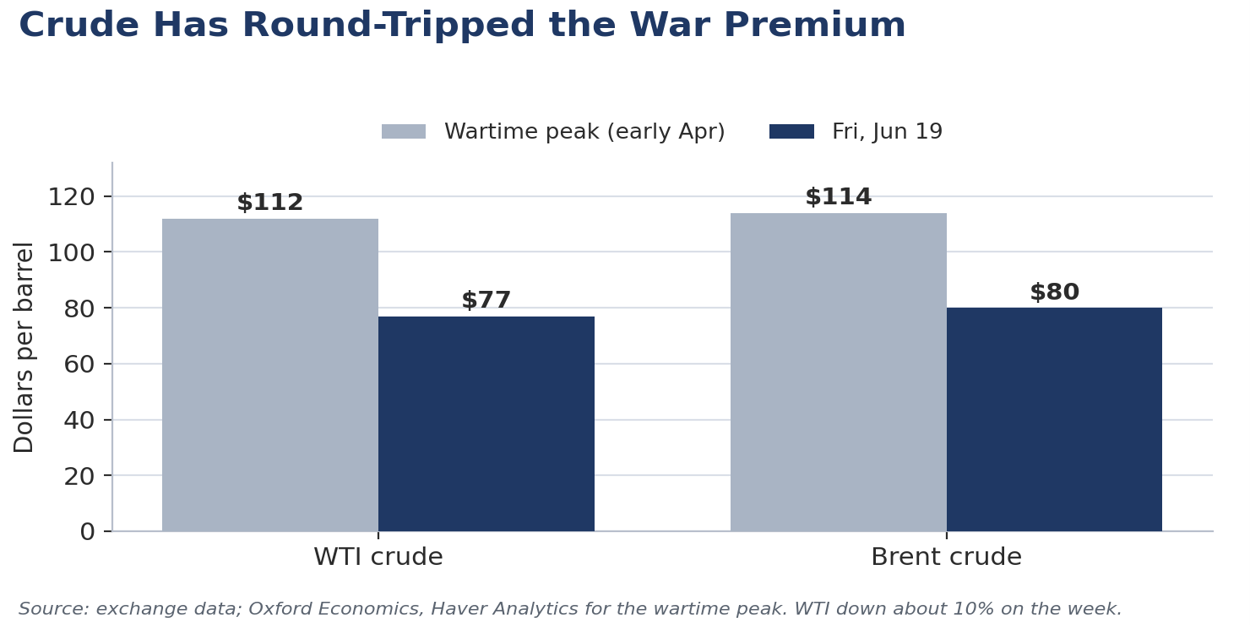
Assessment. This marks a significant and fast turn away from the heightened Middle East conflict that the FOMC explicitly cited as a source of uncertainty. The reopening of Hormuz and the oil export waivers should help stabilize and potentially lower global energy prices, easing one of the inflationary supply shocks the Fed flagged. For the economy and markets, the agreement lowers tail risks around energy shocks, shipping disruptions, and broader contagion. The reconstruction framework and sanctions-relief path draw bipartisan skepticism at home, but the phased, compliance-linked structure and the funding clarification mitigate some of those concerns. We will watch the sixty-day nuclear window closely, since progress there would embed stability while setbacks could quickly reintroduce volatility. On balance, the memorandum is a clear net positive for the global growth outlook and reduces the elevated uncertainty the Fed referenced only days earlier.
5The Global Backdrop and the G-7
The G-7 put its weight behind the de-escalation. Meeting at Évian from June 15 to 17, the G-7 leaders welcomed the US-Iran memorandum, which President Trump signed at Versailles on the final day, and reaffirmed that the right of transit through chokepoints such as Hormuz, free of restrictions or tolls, is the bedrock of international trade. The same communiqué pledged tougher sanctions on Russia, including its oil and gas sectors, a reminder that even as Iranian barrels return, the supply side is not uniformly looser and that a floor under crude could build from the other direction. Less settled were tariffs and industrial policy, where Washington and its allies remain at odds, and France used its presidency to press the case for narrowing global imbalances. For a US reader, the through-lines are straightforward: the energy supply shock is easing, the trade-policy overhang is not, and both still run to inflation.
The global outlook is firmer than the spring scare suggested. The Middle East shock knocked the international forecasts lower this spring. The World Bank trimmed global growth to about 2.5% for 2026 and the OECD to roughly 2.8%, both pinning the markdown on the energy spike before a projected firming through 2027 and 2028 as supplies recover and trade normalizes. With the war now de-escalating, the more benign of the two paths the OECD sketched, the one that assumes Gulf energy comes back from the third quarter, is the one playing out. The international consensus pegs US growth near 2.0% this year; we sit above it, consistent with our capital-led, AI-driven read of this expansion. The common thread runs alongside our own: a supply-driven jump in energy prices can be looked through so long as expectations stay anchored, and the durable story is the underlying trend and the AI investment cycle lifting it, not the oil price.
6Forward Outlook
The second half opens on constructive footing, and the rate debate is the crux. Solid underlying growth, a resilient consumer, and reduced geopolitical risk make for a favorable backdrop into the back half of 2026. The honest debate is about inflation and the Fed. The dovish camp argues that fading energy and tariff pressures will pull inflation below the Fed’s projections and open the door to a cut this year. We disagree. We do look for inflation to decelerate in the second half, but the disinflation is energy-led and largely mechanical, while our cross-sectional filter shows the underlying trend still firm. The key point the cut case misses is that as headline inflation falls with the nominal funds rate on hold, the real funds rate rises modestly, and that passive tightening does the work the Committee’s penciled-in quarter-point hike was meant to do. That is why we expect no hike this year even as the dots and the market lean that way, and why we see no case for a cut. The next move in the funds rate is up, and we do not expect it before 2027.
We look for the labor market to cool gently, not crack. We expect job growth to moderate back toward about 95,000 a month in the second half, with a slight rise of roughly one tenth of a point in the unemployment rate. That is a soft landing at full employment, not a downturn. With breakeven payroll growth near zero as baby boomers retire and immigration enforcement tightens, even a moderating pace of hiring keeps the labor market tight, which keeps wage and services inflation from cooling as quickly as the energy-led headline. Continued strength in nondefense capital goods orders and a broadening AI investment cycle, with a public-market pipeline now measured in the trillions, point to a capital-led expansion that keeps demand firm. We will keep watching the durability of the Iran agreement, incoming inflation and labor data, and any signal from a deliberately less transparent Fed.
7The Week Ahead
Next week is heavy on the data that will test this view. The calendar turns to the releases that bear directly on the growth and inflation debate. New home sales open on Tuesday. Wednesday is the crowded session, with the final read on first-quarter GDP, May personal income and spending, the PCE price index, durable goods orders, and weekly jobless claims. The trade balance and the final University of Michigan sentiment reading close out the week on Thursday.
- PCE prices. Core PCE is expected to rise about 0.4% in May and headline about 0.5%, a hot print. With gas now falling, we still expect May to mark the peak in inflation for the year.
- Real spending. Strong retail sales point to a solid rise in nominal personal spending, but real spending may eke out only about 0.1%, the same nominal-versus-real gap we flagged this week, with the saving rate likely slipping again.
- Capital goods. We look for another solid gain in nondefense capital goods orders excluding aircraft, consistent with the capex cycle underpinning our above-consensus growth call.
- Claims. A small dip is likely. The recent uptick in the four-week average looks like summer seasonal noise rather than a turn in the labor market.
8Our Forecast
Our base case in brief. We look for above-consensus growth led by capital investment, inflation that decelerates in the second half on energy while the underlying trend stays firm, a funds rate held through 2026 with the next move a hike in 2027, and a labor market that cools gently to roughly 95,000 jobs a month with a slight uptick in unemployment. The full forecast is summarized below.
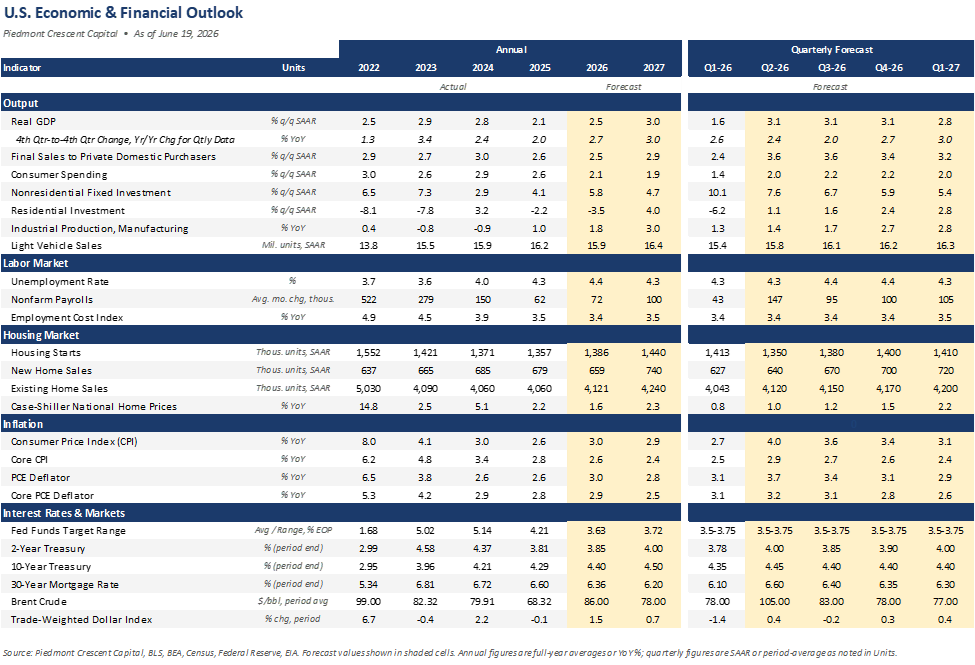
A Hawkish Hold, a Quieter Fed: Warsh's First FOMC
FOMC REACTION · JUNE 17, 2026
A Hawkish Hold, a Quieter Fed
Warsh holds at 3.50%–3.75%, the dots split nine-to-nine, and the new Chair orders a top-to-bottom review of the institution.
Download the PDFEarly Signals
- A hawkish hold. The Committee left the funds rate at 3.50%–3.75%, stripped the easing bias from the statement, and shortened the statement itself. No cut, as we have argued all year.
- The dots flipped. Nine of eighteen submitting participants now project at least one 2026 hike. Warsh’s decision not to submit a dot left a clean nine-to-nine split, and the 2027 core PCE median was marked up to 2.5%.
- A wider target, by design. Warsh said he focuses on the left of the decimal point, which we read as any reading that rounds to 2%, roughly 1.51% to 2.49%. That range has always made more sense to us than a hard 2% target, and it buys room to hold as long as inflation is drifting toward that pace.
- A Fed under review. Five new task forces and a wholesale re-examination of the post-2008 operating model signal patience now and a rethink of the framework for an AI-era economy.
Key Takeaways
| Key Concept | Findings |
|---|---|
| Decision | Held the federal funds target range at 3.50%–3.75%, removed the language pointing toward eventual cuts, and trimmed the statement to a leaner document. The hold surprised no one, but the message around it did. |
| The Dots | Nine of the eighteen participants who submitted projections now pencil at least one hike in 2026. Because Warsh chose not to submit a dot, the result is a clean nine-to-nine split between the hike camp and those projecting an unchanged or lower rate. |
| Projections | The 2027 Q4/Q4 core PCE median was lifted to 2.5%, a sign participants read the energy-driven firmness as having a longer tail. Markets repriced hawkish, roughly +20bp on the end-2026 path and +11bp on end-2027. |
| Warsh’s Band | The Chair said he watches the left of the decimal point. We read that as any reading that rounds to 2%, roughly 1.51% to 2.49%, which gives him more room to navigate. |
| Five Task Forces | Reviews of communications and the SEP, the balance sheet, the Fed’s data sources, productivity and jobs in “an era of transformation,” and the inflation framework. Functionally a patience mechanism that buys time. |
| Policy Signal | A hawkish hold rather than a hike. The next move is more likely up, but the energy de-escalation, the task-force timetable, and Warsh’s wider band push it into 2027. |
The Overview
Kevin Warsh’s first meeting in the chair delivered the outcome we expected on the policy rate and a genuine surprise nearly everywhere else. The Committee held at 3.50%–3.75%, removed the language that had pointed toward eventual cuts, and pared the post-meeting statement to a leaner document, a first concrete sign of the communications philosophy the new Chair brings with him. With the hold itself never in doubt, the meeting that mattered played out in the dots and at the podium.
Read in full, this was a hawkish hold. The Committee has not merely paused. It has removed easing from the near-term menu and put the question of a hike squarely back on the table, and the June dots have now caught up to a view we have held for some time, that the next move is more likely up than down. What is new is how many participants want to act this year rather than later, and, against that, how much latitude the new Chair has quietly given himself to wait.
The Dots Flipped Toward Hikes
The headline sits in the dots. Nine participants now project at least one rate hike in 2026, a far more hawkish tally than the Street expected, and because Warsh chose not to submit his own projection, the result is a clean nine-to-nine split between the hike camp and those projecting an unchanged or, in a single case, lower rate. Half of the committee that submitted dots is now signaling that the next move, if it comes this year, is up.
The economic projections carried the same message. The median 2027 core PCE forecast was lifted to 2.5%, a meaningful upward revision that says participants increasingly read the recent firmer inflation, driven in part by the energy cost shock from the Iran conflict, as having a longer tail than a one-off price-level bump. Markets took the cue, with pricing for the funds rate at the end of 2026 rising roughly 20 basis points and end-2027 pricing rising about 11 across the projections and the press conference.
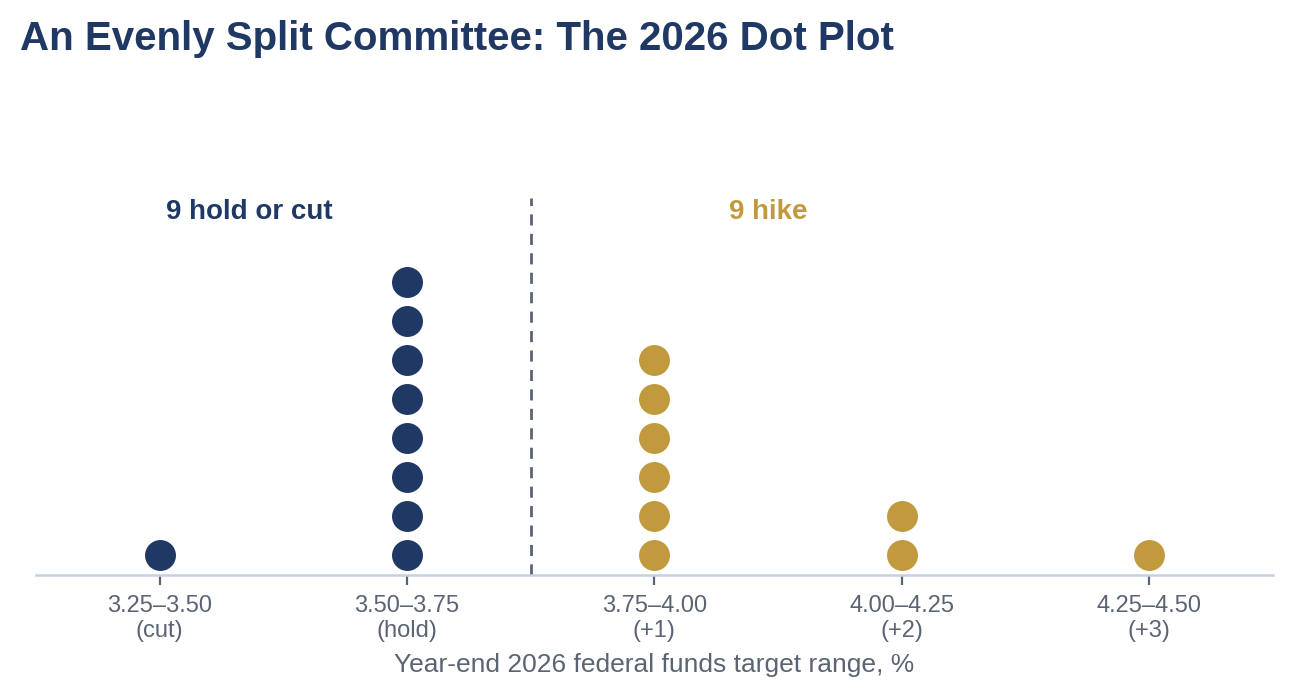
Warsh and the Left of the Decimal Point
Warsh’s own stance was deliberately balanced. He allowed that policy is probably restraining housing while declining to say the same of financial conditions, and he leaned on the price-stability mandate in a way that would make him sympathetic to a hike if the next several inflation prints disappoint. He also flagged that market prices are among the most important signals a central banker has, which could mean he reads the market’s own move toward a higher path as corroborating evidence.
The most useful tell was his comment that on inflation he watches the left side of the decimal point. Some will read that as treating anything with a two in front of it as at target, but we believe he meant any reading that rounds to 2%. That makes intuitive sense, because under a hard 2% target a 0.2% rise in the CPI would count as above target and a 0.1% rise as below it, distinctions too fine to manage. The CPI has averaged 2.7% since 1990. We do not see this as a major change for the Fed, since Warsh reiterated several times that the FOMC remains committed to returning inflation to its 2% target.
Which Gauge? Reading Across the Measures
The choice of inflation gauge has quietly become its own debate. Warsh has pointed to Federal Reserve research showing that the trimmed-mean CPI tends to forecast where headline inflation is heading better than the traditional core, and he has argued that policymakers should weight it more heavily as a signal rather than leaning primarily on the core PCE deflator, the Fed’s current preferred measure. He is not proposing any change to how inflation is officially calculated. The point is about which gauge best anticipates the trend, which matters because policy acts with long and variable lags, so getting the forward read right is most of the job. The counterargument is about timing rather than principle. Trimmed-mean measures smooth by design and are slow to register abrupt moves, the twelve-month window still carries the distortions of last fall’s government shutdown, and with the PCE deflator having jumped from roughly 2.5% to 3.8%, some at the Fed, including the Dallas Fed’s Lorie Logan, have cautioned against putting too much weight on soft trimmed-mean readings just now. The cautionary tale of 2021 sits underneath it all, when a gauge favored because it confirmed a prior proved a credibility risk rather than a forecast.
Our own practice sidesteps the contest between any two gauges. Headline inflation is, and always will be, the Fed’s ultimate target, and the various core and trimmed measures matter only to the extent they forecast it. Rather than crown one, we examine the full range of price series and focus on where they agree and where they diverge, treating statistical outliers as more likely transitory than representative of the trend. To formalize that, we run a Hodrick-Prescott filter across dozens of individual price series, extract each one’s underlying trend, and take the cross-sectional consensus, a median resistant to outliers that we report alongside its dispersion and the outliers themselves. The current read is consistent. The consensus underlying pace has reaccelerated over the past three months across most measures, the breadth is real rather than the work of a few categories, and energy stands out as the principal outlier. That last point is also where the relief lies, since softer energy should help ease headline readings in the second half even as the underlying consensus stays firm.
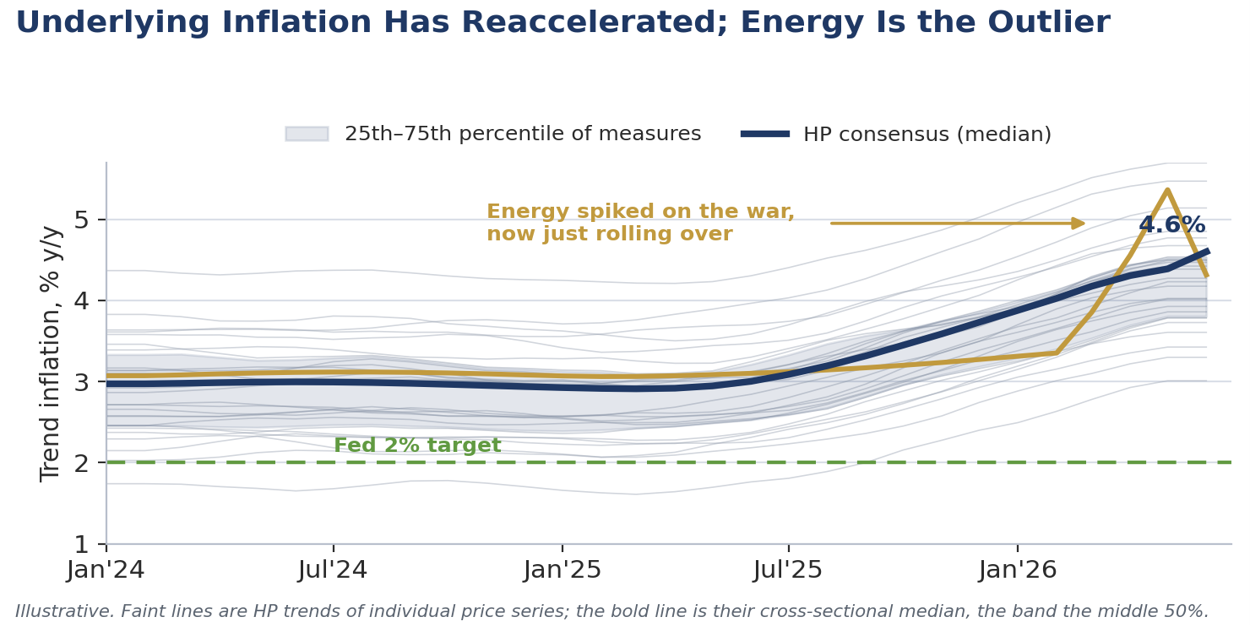
Five Task Forces and the Time They Buy
Warsh announced five task forces, to be staffed with Fed economists and outsiders, including non-economists. They will reconsider Fed communications, with particular focus on the Summary of Economic Projections and the dot plot and a hint that press conferences may not follow all eight meetings; the balance sheet; the Fed’s use of and reliance on its existing data sources; productivity and jobs in “an era of transformation”; and the inflation framework itself.
The immediate market read should be that these reviews buy time. A Chair who has just commissioned a year of study on how the institution thinks, talks, and measures is not in a hurry to move in the interim, and the task forces function as a patience mechanism. Combined with the at-target-band framing and a cooling energy shock, they make a 2026 move unlikely in our base case.
The Bigger Story: A Reset of the Post-2008 Fed
Step back, and the task forces are not five separate housekeeping items but the scaffolding of a single project. Warsh is signaling a wholesale review of an operating model the Fed has run essentially unchanged since the 2008 crisis: the communications apparatus, the ample-reserves balance-sheet regime, the data it leans on, and the inflation framework. The question underneath all five is whether the old benchmarks still hold.
The starting point for that review is a judgment the new Chair has come close to making explicit, that the extraordinary policies assembled after the 2008 financial crisis, and again during the pandemic, are no longer appropriate for the economy we actually have. Zero rates, successive rounds of quantitative easing, and a balance sheet that swelled from roughly 6% of GDP before the crisis to nearly 37% at its pandemic peak were emergency responses to a world short of demand and stuck below the inflation target, conditions that no longer hold. Even after several years of runoff, the balance sheet remains far above its pre-crisis footprint, and the question Warsh is forcing is whether tools designed to fight deflation still belong in a cycle whose problem is the opposite.
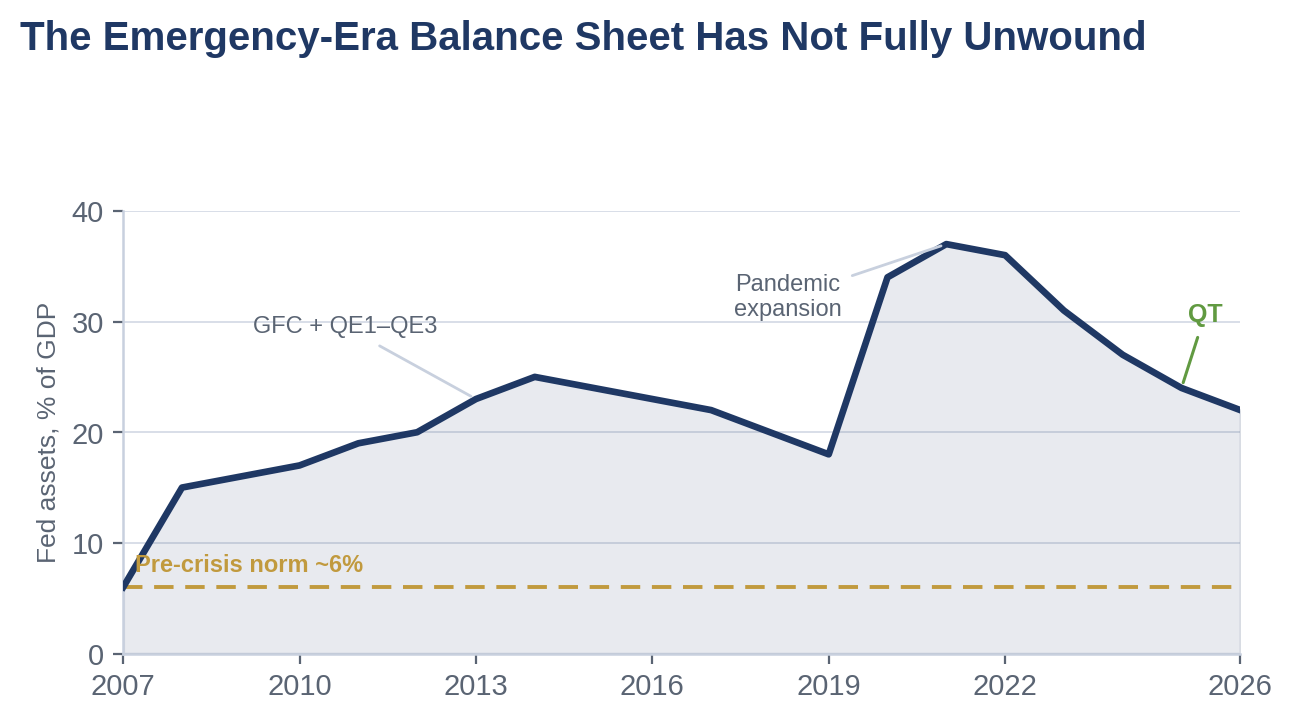
That question lands with particular force in an AI-era economy. The “productivity and jobs in an era of transformation” task force is the explicit hook, and it dovetails with the framework we have used all year, a capital-led, investment-driven expansion that rhymes with the late-1990s capex cycle. If productivity is structurally faster, the neutral rate, the slope of the Phillips curve, and the speed limit on growth may all sit somewhere other than the post-crisis playbook assumes. A Fed that takes that seriously may keep policy higher for longer, not because it fears overheating but because the old framework no longer fits the economy it faces.
A Different Set of Challenges
If the old emergency tools no longer fit, neither do the old problems. The challenges that now dominate the economic conversation are not the deficient-demand, debt-deflation risks of 2009 but distributional ones. Income and wealth inequality have widened as asset holders compounded through a decade and more of cheap money and rising markets, while wage earners relied on paychecks that have only intermittently kept pace with prices. This is the two-speed, K-shaped economy we have described all year, with the top half insulated by asset values and capital income and the bottom half exposed to the day-to-day cost of living.
Housing affordability sits at the center of the strain. A long stretch of suppressed rates inflated home prices, and the post-pandemic surge pushed the median home well out of reach for first-time buyers even before mortgage rates normalized. The result is a widening divide between those who own and those locked out, with the rental market absorbing the overflow. Monetary policy built around the price of credit has limited reach here, because lower rates tend to capitalize into higher prices rather than better affordability, which is precisely why the problem resists the Fed’s blunt instruments.
Inflation itself lands unevenly, and that is the part the headline average obscures. The categories running hottest, namely energy, food, and shelter, are the essentials, and they consume a far larger share of a low-income household’s budget than a high-income one. A burst of energy- and grocery-led inflation therefore works as a regressive tax, falling hardest on the families least able to substitute away from the commute or the checkout line. A central bank that targets an economy-wide average will, by construction, understate the burden carried at the bottom.
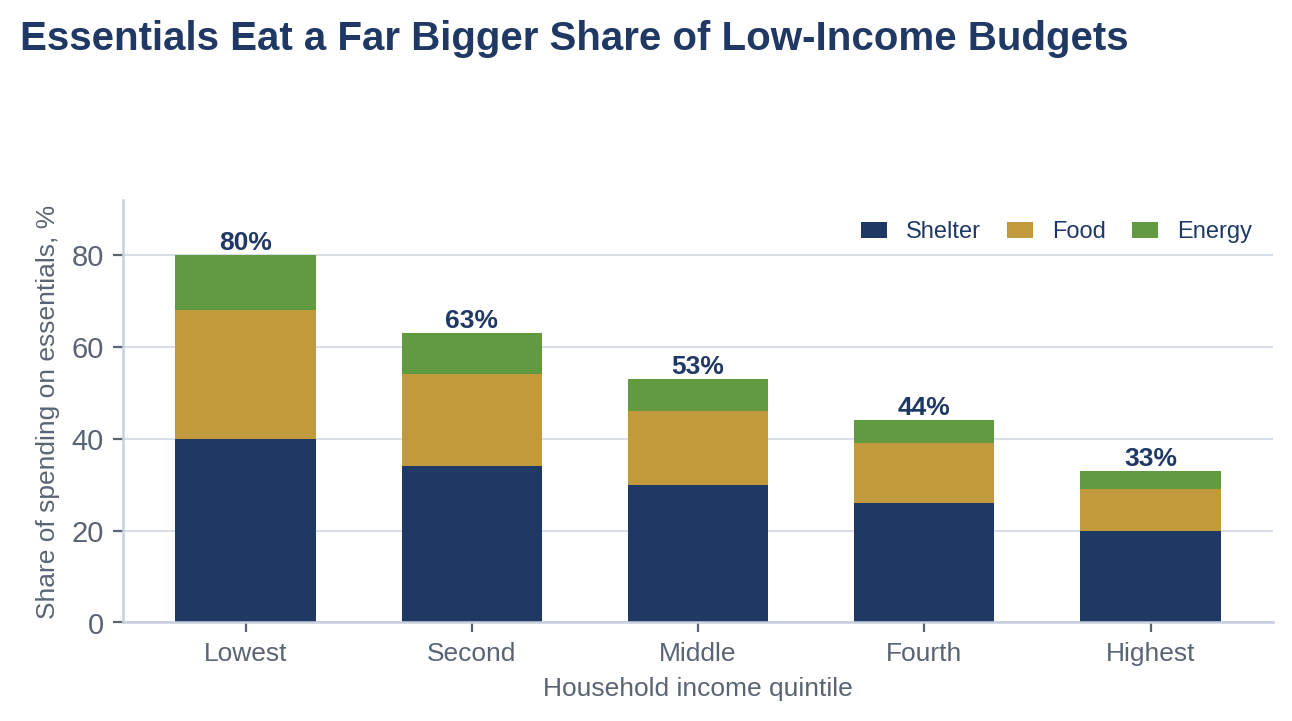
None of these problems, whether inequality, affordability, or the distributional bite of inflation, is one the Federal Reserve can solve with the funds rate, and Warsh has been careful not to claim otherwise. They are instead the backdrop against which the post-2008 framework now looks mismatched. A toolkit and a communications style built for a low-inflation, demand-short decade are being asked to govern an economy with the opposite ailments, and that mismatch, as much as any single inflation print, is what the five task forces are really being convened to confront.
Why We Still See No Move in 2026
Three things keep us at no hike this year despite the dots. First, the energy shock is de-escalating. News of a deal with Iran and the reopening of the Strait of Hormuz removes the most acute source of upside inflation risk, and if trade resumes, today’s hawkish projections could look stale within a quarter or two. Warsh underscored as much when he noted that his colleagues do not feel bound by their dots in a fast-changing world. Second, the voters lean less hawkish than the room. The dots reflect all nineteen participants, but only twelve vote, and we suspect a majority of those twelve still prefer to wait. Third, the Chair has given himself latitude through the left-of-the-decimal framing and the task-force timetable. The direction of travel is nonetheless clear, with the next move more likely a hike than a cut, even if we do not expect it before 2027.
Market Implications
A Fed on hold with a hawkish dot split, a Chair tolerant of a wider inflation band, and a quieter communications posture argues for front-end yields anchored higher for longer, a flatter curve as residual cut expectations are squeezed out, and a firmer dollar. The larger repricing risk sits in the Fed put itself, since a Warsh-led committee that telegraphs less, studies more, and re-benchmarks the whole framework sets a higher bar for the rescue that risk markets habitually assume, and we would be cautious about extrapolating the old reaction function into the new regime.
Our Call
OUR CALL
This was a hawkish hold rather than the start of a hiking cycle. The Committee removed the easing bias and half the dot submitters now see a 2026 hike, but the level held at 3.50%–3.75% and the new Chair built himself room to wait, so the next move points up while the timing looks like 2027 in our base case.
Warsh’s band is the quiet dovish offset to the hawkish dots. Watching the left of the decimal point means any reading that rounds to 2%, roughly 1.51% to 2.49%, counts as at target. That latitude, the five task forces, and a de-escalating energy shock together make a 2026 move unlikely even as the projections turn.
The real story is the reset. Five task forces amount to a top-to-bottom review of the post-2008 Fed, spanning communications, the balance sheet, the data, productivity, and the inflation framework, and they start from the premise that the emergency tools of the crisis and pandemic no longer fit the economy we have. The problems that dominate now are distributional, including inequality, housing affordability, and the regressive bite of inflation, none of which the funds rate can fix. This is the two-speed, capital-led expansion we have described all year, now meeting a central bank willing to question its own map. We retain our no-cut base case for 2026, with the tail skewed toward a hike, and we continue to favor caution on duration as the term premium rebuilds.
Mark P. Vitner
Chief Economist, Piedmont Crescent Capital
mark.vitner@piedmontcrescentcapital.com · (704) 458-4000
Disclaimer: This report is provided for informational purposes only and does not constitute investment, legal, tax, or accounting advice, nor an offer or solicitation to buy or sell any security. Information is drawn from sources believed to be reliable, including publicly reported FOMC materials and meeting coverage, but its accuracy and completeness are not guaranteed. Statement, projection, and market-pricing figures should be verified against source data before publication. Views expressed are those of the author as of the date of publication and are subject to change without notice. Past performance is not indicative of future results.
© 2026 Piedmont Crescent Capital · For informational purposes only.