
ECONOMIC INDICATOR REPORT · TOTAL FACTOR PRODUCTIVITY, DETAILED INDUSTRIES 2023
The Factory Floor Sits Out the Productivity Boom
Total factor productivity fell in 70 of 86 manufacturing industries in 2023, but the snapshot predates the AI build. Output is climbing, hours are flat, and productivity is accelerating again.
Early Signals
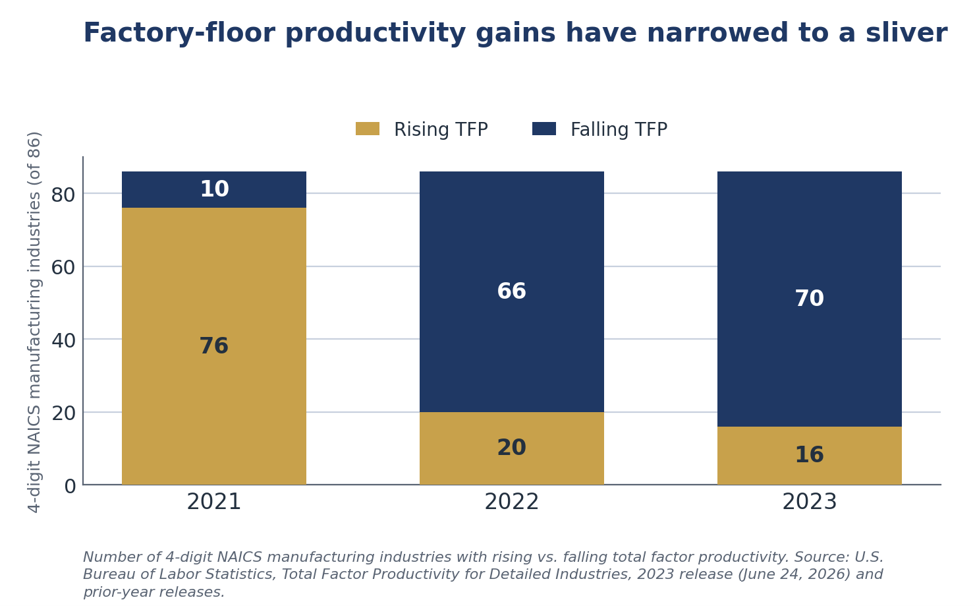
- Breadth was brutal. Total factor productivity declined in 70 of the 86 four-digit NAICS manufacturing industries in 2023, a third straight year of broad declines after only 10 industries fell in 2021.
- The snapshot is stale. The data released this morning are for 2023. The AI build did not scale until 2025, when data-center capital spending jumped more than 50 percent and AI-related investment added more to growth than consumer spending. The release captures none of it.
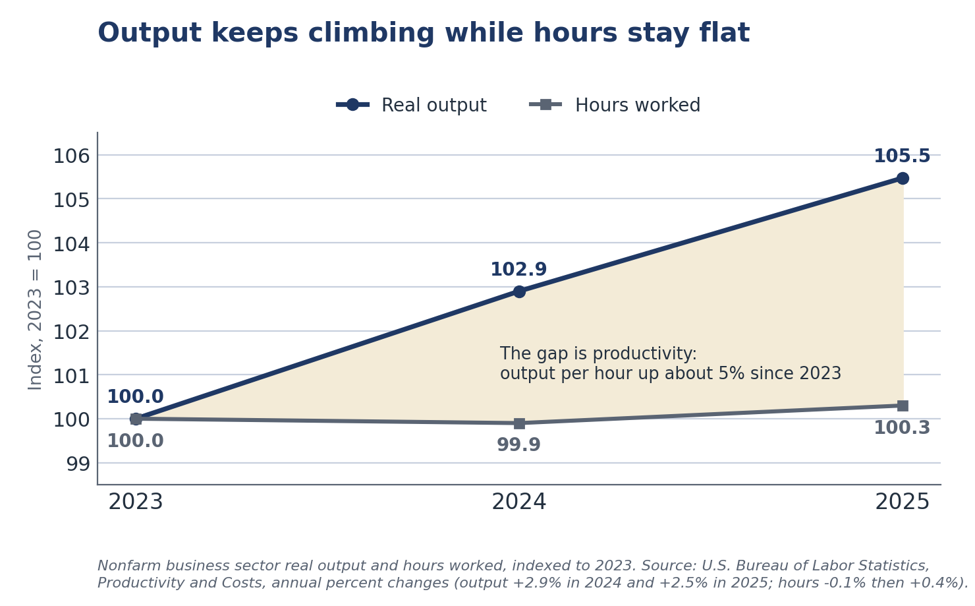
- Output is outrunning hours. Since 2023, nonfarm business output has risen about 5 percent while hours worked are roughly flat, so output per hour has carried nearly all of the gain. Productivity is accelerating, not stalling.
- The gain is capital-led. Roughly half of the 2024 labor-productivity rise came from pure efficiency and the rest from capital deepening and a better-skilled workforce, which reconciles our strong nowcast with the soft total factor productivity in today’s release.
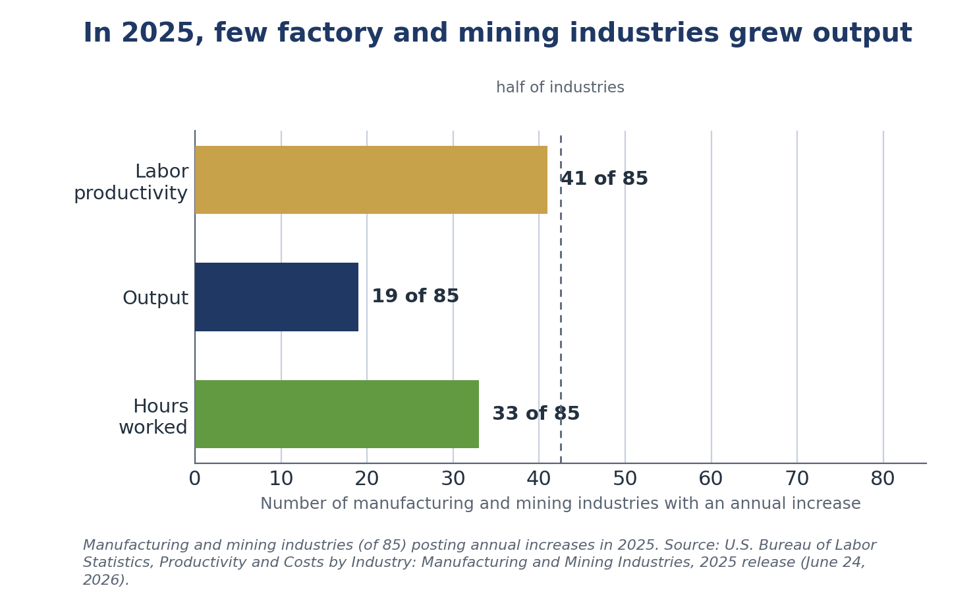
- The factory floor still lagged. The 2025 companion release shows output rising in only 19 of 85 manufacturing and mining industries, although the ISM index and industrial production have since turned higher in 2026.
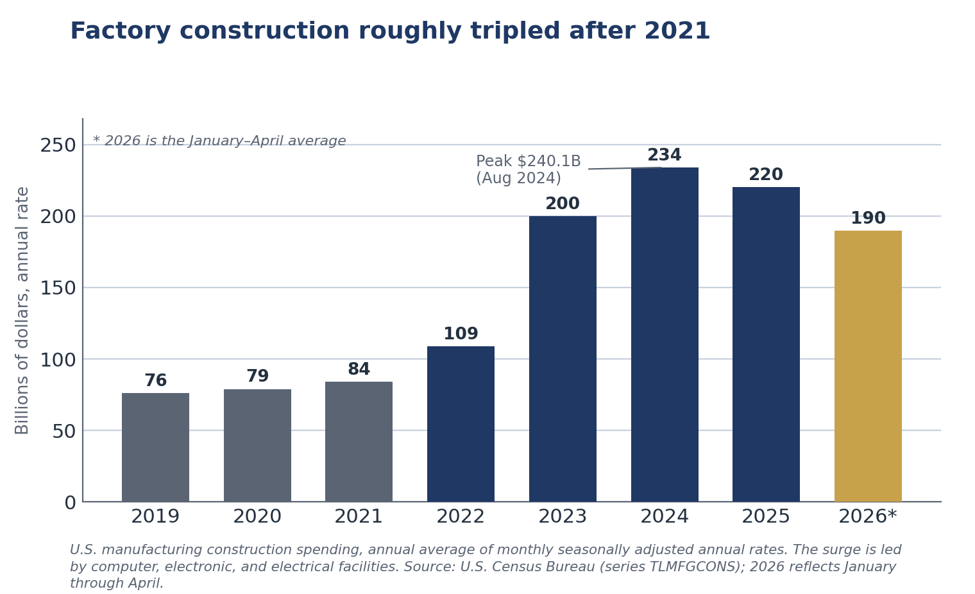
- Reshoring is taking physical form. Factory construction has roughly tripled since 2021, led by semiconductor and pharmaceutical plants. Commercial aerospace and defense rearmament are additional capital-led engines whose output, like AI’s, lies ahead of these data.
- The seven-trillion-dollar question is open. The weak reading lands awkwardly against the pandemic relief and industrial policy of 2021 and 2022, and some of that money, especially the EV and battery bets, was clearly misallocated.
Key Takeaways
| Key Concept | Findings |
|---|---|
| 2023 Breadth | Total factor productivity fell in 70 of 86 detailed manufacturing industries, after 66 in 2022 and just 10 in 2021. Four-fifths of the group lost efficiency in a single year, a decline that is structural and shared. |
| Data Lag | The detailed-industry series runs about two years behind. Today’s release describes 2023 and captures none of the AI investment wave that scaled in 2025. |
| Output vs. Hours | Nonfarm output is up about 5 percent since 2023 on essentially flat hours. Labor productivity grew 3.0 percent in 2024 and 2.1 percent in 2025, well above the 1.5 percent trend. |
| Capital Deepening | More than a third of the 2024 labor-productivity gain came from capital intensity rather than pure efficiency. The acceleration is real but capital-led, not yet a broad free lunch. |
| Factory Floor | The 2025 manufacturing and mining release shows output rising in only 19 of 85 industries, with hours falling in most. The plants had not found a new gear in the lagged data. |
| 2026 Turn | The high-frequency data have already improved. The ISM Manufacturing PMI reached 54.0 in May, a four-year high and a fifth straight month of expansion, with output growing even as factory employment keeps shrinking. |
| Policy Signal | Firming economy-wide productivity alongside a still-soft factory floor is one more reason the Warsh committee can hold rather than cut. |
A Snapshot from Before the Boom
Timing matters here more than the numbers. The detailed-industry series runs about two years behind because it waits on Census economic survey and capital data, so today’s release describes 2023. The artificial-intelligence investment wave that is now reshaping the capital stock did not scale until 2025. Data-center capital spending rose more than 50 percent last year, the four largest cloud builders lifted their outlays by roughly three-quarters, and AI-related investment contributed more to GDP growth in the first half of 2025 than consumer spending did. None of that is in this report. Reading the 2023 factory-floor weakness as the current state of productivity would be a mistake.
The breadth of the 2023 decline is still worth marking. Of the 86 detailed manufacturing industries, total factor productivity fell in 70, following 66 in 2022 and just 10 in 2021. When four-fifths of an industry group loses efficiency in the same year, the cause is structural and shared, not a handful of idiosyncratic plants. The goods-producing core entered the AI era already on its back foot.
What the Numbers Miss: Output Is Outrunning Hours
To see what has happened since, set the lagged data aside and compare output against hours worked. It is the rawest reading on productivity, and the contrast is stark. Nonfarm business output rose 2.9 percent in 2024 and 2.5 percent in 2025, while hours worked fell 0.1 percent and then rose just 0.4 percent. Output is up about 5 percent since 2023 on essentially flat hours, which means output per hour has carried nearly the entire gain. Labor productivity grew 3.0 percent in 2024 and 2.1 percent in 2025, both well above the long-run trend near 1.5 percent. Over the current cycle, productivity has grown more than four times as fast as hours.
The economy is making more with the same labor, and the gap is widening rather than closing. This is the capital-led expansion we are constantly highlighting in our weekly reports and monthly commentary. The gains are not spread evenly, though, and the next chart shows where they are landing.
The Breakout by Sector
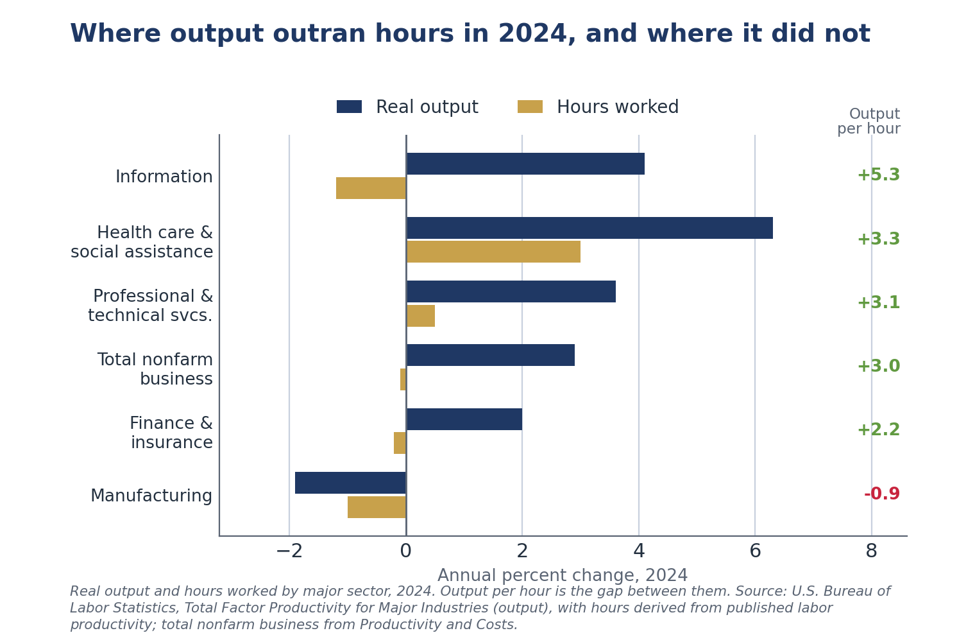
Break output and hours apart by sector and the split is unmistakable. In information, the heart of the data-center build, real output rose about 4 percent in 2024 while hours fell, so output per hour jumped more than 5 percent. Finance and professional services tell the same story on a smaller scale, with output climbing on flat or falling hours. Health care grew output even faster, but it did so the old-fashioned way, by adding workers, so its productivity gain was middling. Manufacturing alone saw output and hours fall together, with productivity slightly negative. The boom is concentrated in the capital-intensive, technology-facing service sectors, which is exactly where the AI investment is landing.
Reconciling the Two Gauges
This raises a fair question. How can productivity be accelerating in the nowcast when today’s release shows total factor productivity falling across manufacturing and running only modestly positive for the broad economy? The two measures track different things, and both are true at once. Labor productivity, the nowcast, is output per hour. Total factor productivity is output per unit of every input, capital and materials included, so it strips out the effect of giving each worker more and better tools. An identity ties them together: labor productivity equals total factor productivity plus capital deepening plus workforce quality.
The arithmetic settles it. Of the roughly 3 percent gain in labor productivity in 2024, total factor productivity contributed somewhere between 1.3 and 1.5 points, capital intensity about 1.1 points, and a better-skilled workforce about 0.3 points. More than a third of the gain came from capital deepening rather than pure efficiency. In 2025 the tilt grew sharper, with broad total factor productivity decelerating to 0.8 percent while labor productivity held above 2 percent. The productivity acceleration is real, but so far it is being driven by capital rather than by efficiency. The free lunch that a true total-factor gain represents has not yet broadly arrived. That is the open question hanging over the AI build, and it is why the weak factory-floor reading in today’s release and the strong labor-productivity nowcast are not in conflict. They are two gauges of one capital-led expansion.
The Factory Floor Still Lags
The freshest annual factory data say the malaise carried forward. The manufacturing and mining release out the same morning, covering 2025, shows output rising in only 19 of 85 industries and labor productivity up in fewer than half. Hours worked fell in most industries, so the sector was making less with fewer people rather than more with the same. The broad economy had found another gear. The plants, in these tables, had not.
Beyond the AI Headlines
AI dominates the coverage, but it is not the only thing being built. We have made the point all year that meaningful growth is also coming from reshoring, and the clearest evidence is poured in concrete. Spending on new factory construction has roughly tripled since 2021, from around $80 billion a year to a peak above $240 billion in 2024, and it still runs near $190 billion after cooling. The surge is led by computer, electronic, and electrical plants, the semiconductor fabs that the CHIPS program helped seed, with 23 backed projects and 16 new fabs across 15 states. It does not stop at chips. Drugmakers are reshoring too, with Eli Lilly alone committing more than $50 billion to new domestic sites and active-ingredient production, part of a broader pull of pharmaceuticals, life sciences, and medical supply chains back onshore. More is on the way.
The timing echoes the AI story. A fab or a finishing plant takes years to design, pour, equip, and bring up to speed, so the spending above is investment, not yet output. Much of this capacity is still under construction or only now coming online, which means its contribution to production and productivity lies ahead, not in the 2023 figures we received today. The reshoring wave, like the AI build, postdates the snapshot.
Commercial aerospace is a second engine, and it is turning over again. Boeing is working the kinks out of its supply chain and its assembly lines. It delivered 143 commercial jets in the first quarter, its best opening quarter since 2019, with the 737 running near 42 a month and headed for 47 and beyond as a fourth line opens this summer. The company expects 500 narrowbody deliveries this year, up from 447, against a backlog above 6,000 aircraft. Profitability still trails the production recovery, but the direction is set, and a healthier Boeing pulls a deep domestic supplier base along with it.
Private space has become a real industry rather than a science project. SpaceX flew a record 170 launches in 2025 and lifted more than 80 percent of the mass the world sent to orbit, on rockets it lands and reuses, and its market debut valued it near $1.8 trillion. Competitors from Blue Origin to Rocket Lab and the traditional primes are scaling behind it. Reusability has pushed launch costs down far enough that satellite broadband, defense sensing, and even orbital manufacturing now pencil out, which widens the industrial base feeding them.
Defense is the third engine, and the demand is structural. A decade of underinvestment ran headlong into a war in Europe and conflict in the Middle East, and the stockpiles came up short. NATO has lifted its target to 5 percent of GDP, U.S. defense authorizations now run above a trillion dollars with roughly $25 billion earmarked to rebuild the munitions arsenal, and European budgets are climbing at double-digit rates. Restocking missiles, interceptors, and artillery is not a one-year order. It is a multiyear production ramp that lands squarely on the domestic industrial base. Contractors are urgently expanding facilities and ramping up production where they have excess capacity today.
These are the kinds of growth we favor. Reshoring, aerospace, and defense are capital-led and capacity-building, protein rather than carbohydrates, and they share the AI build’s defining feature for reading today’s release. The money is going in now, so the output and the productivity follow later. The 2023 data capture none of it.
The Manufacturing Outlook: What 2026 Is Telling Us
The high-frequency data have already turned. The detailed-industry tables describe a factory floor that was contracting in 2023 and barely growing in 2025, but the monthly indicators we track in real time paint a more encouraging picture for the first half of 2026. The ISM Manufacturing PMI climbed to 54.0 in May, its highest reading since May 2022 and a fifth straight month of expansion, after holding at 52.7 in March and April. New orders reached 56.8, the production index 54.3, and the survey now points to a pace of activity consistent with roughly 2 percent real GDP growth. The cyclical bottom that defined the goods sector for the better part of three years looks to be behind us.
The hard data confirm the direction, if not yet the magnitude. Manufacturing output rose 0.6 percent in April, its best month in more than a year, before flattening in May, and factory production is running about 1.4 percent above its year-earlier level. The gains are concentrated where a capital-led cycle would put them: durable goods, motor vehicles, and business equipment led by transit and aerospace, while nondurable lines such as food and textiles softened. Capacity utilization in manufacturing sits near 75.7 percent, more than two points below its long-run average, so the rebound still has room to run before it presses against capacity.
The factory is making more without adding workers, exactly as the productivity data imply. Even as orders and output have firmed, the ISM employment index has stayed below 50, contracting for a thirty-second consecutive month, and factory payrolls have been flat to lower. This is not a contradiction. It is the same capital-led expansion we have described all year, now visible at monthly frequency: output per hour is doing the work, and headcount is not. A manufacturing recovery that shows up in production and productivity but not in employment is the defining feature of this cycle, and it is precisely the pattern the detailed-industry tables will eventually record once they catch up to it.
The headwinds are real, and they are mostly about prices and policy. The ISM prices-paid index held at an elevated 82.1 in May, pushed up by the jump in oil and diesel that followed the conflict in the Middle East, and tariffs surfaced in roughly a fifth of survey comments. Input-cost pressure and trade-policy uncertainty are the chief risks to the nascent rebound, and they are the same forces lifting the headline inflation we flagged in our May CPI work. With the Federal Reserve holding rates in June and financial conditions still tight, the recovery is unfolding without monetary tailwinds, which argues for a gradual climb rather than a vertical one.
The structural build-out is still ahead of the data. The capital that is reshaping the goods sector, the AI data centers, the CHIPS-seeded fabs, the reshored drug plants, the Boeing ramp, and the defense restocking, is for the most part still pouring concrete and installing equipment rather than shipping product. As those projects move from investment to output over the next two to three years, they should add a second, structural leg to the cyclical recovery now underway. The near-term picture is a manufacturing sector that has stopped falling and started to climb. The medium-term picture is one in which the protein-rich, capacity-building investment we favor finally shows up where the productivity statistics can see it.
For the broader economy, the signal is consistent. Services activity expanded for a twenty-third straight month in May, payrolls are still growing, and first-quarter output advanced at a modest but positive pace. The economy-wide story remains one of solid output, firm productivity, and a labor market that is cooling without cracking. Manufacturing is the lagging piece that is beginning to catch up, not the leading edge of a downturn, and that distinction is the heart of how we read both today’s release and the year ahead.
Questions for the Seven Trillion
The weak 2023 reading lands awkwardly against the scale of public money committed earlier in the decade. Between 2021 and 2022, Washington enacted the $1.9 trillion American Rescue Plan, the roughly $1.2 trillion infrastructure law, the CHIPS and Science Act, and the Inflation Reduction Act, and layered them on top of the pandemic relief already in the pipeline. Counted with the residual COVID packages still spending out, the fiscal push approached $7 trillion. A large share was designed to rebuild the productive base in semiconductors, infrastructure, and clean-energy manufacturing.
The 2023 data offer little sign that the money lifted the factory floor, but the verdict deserves a fair caveat. The bulk of the rescue spending was transfers and relief meant to support demand, not to raise output per input, carbohydrates rather than protein. The industrial-policy dollars that were aimed at productivity were barely deployed by 2023. Only a fraction of the infrastructure and CHIPS funds had gone out the door, and a semiconductor fab takes years to pour and equip. The honest read is not that the supply-side bet has failed, but that it had not yet arrived when these numbers were collected. What is lifting productivity now is private capital chasing artificial intelligence, not the federal programs. Whether the public money eventually shows up in the data is the open question, and one we will be watching as the plants come online.
The deployment that did happen has not all gone well, and candor requires saying so. Where the money was spent, some of it was poorly invested, and the clearest misjudgment was electric vehicles, where demand never matched the projections that justified the build-out. The expiration of the $7,500 federal tax credit at the end of 2025 only sharpened a slowdown already under way. Two of the most visible casualties sit in our own backyard. Wolfspeed, the Durham silicon-carbide maker whose Siler City plant was tied to the largest CHIPS award the prior administration never finalized, passed through bankruptcy in 2025 and all but wiped out its shareholders, hurt by soft EV demand, low yields, and Chinese competition. VinFast’s $4 billion Chatham County plant has slipped from a 2024 opening to 2028, cut its hiring target from 7,500 jobs to 1,400, and now faces a state lawsuit to reclaim the site.
These are not isolated stumbles. By one widely tracked count, roughly $35 billion of announced EV and clean-energy factory investment was canceled or downsized in 2025, the first year since 2022 that withdrawals exceeded new commitments, with EV and battery projects accounting for most of the loss. Detroit has written down more than $50 billion across its electric programs. We read this as more than bad luck. When government steers capital toward favored industries, it trades a market forecast for a political one, and political capital is slow to admit error and reluctant to cut its losses, so a share of the money reliably lands in the wrong place. That does not condemn every public investment, and there is a genuine national-security case for reshoring critical chips and medicines. It does mean the waste is closer to a feature of the model than an accident of it. None of this erases the real build-out we charted above, but the supply-side bet and its waste tend to travel together.
Our Call
OUR CALL
Today’s headline is real but stale. Total factor productivity did fall across most of manufacturing in 2023, yet the data stop before the AI build that now drives the cycle. The current picture is the one that matters for portfolios and for policy: output is climbing on flat hours, productivity is accelerating, and the gains are concentrated in the capital owners and platforms rather than the goods-producing core.
The high-frequency data say the worst is over for the factory floor. The ISM Manufacturing PMI reached a four-year high in May and output is growing again, even as factory employment keeps shrinking. That is the capital-led, productivity-driven recovery we have described, now visible in real time, and the structural build-out in chips, pharmaceuticals, aerospace, and defense still lies ahead of it.
For businesses and the Fed, the read is the same. Stay with the productivity leaders and meet any broad manufacturing-renaissance narrative with the breadth data in hand. Firming economy-wide productivity alongside a still-soft factory floor is one more reason the Warsh committee can hold rather than cut. On the seven-trillion-dollar question the jury is still out, because the supply-side money was still pouring concrete when the latest BLS total factor productivity numbers were taken.
Mark P. Vitner
President & Chief Economist, Piedmont Crescent Capital
mark.vitner@piedmontcrescentcapital.com · (704) 458-4000
A note on the data: the detailed 2023 industry tables were not yet posting on the BLS site as of this writing, so the industry-by-industry leaders and laggards are not reflected here. Breadth counts come from the release headline and prior-year releases; output and hours figures are from the BLS Productivity and Costs and BEA GDP by Industry programs, and the 2026 monthly indicators from the ISM Manufacturing Report On Business and the Federal Reserve G.17 release. We will add the league table once the full 2023 tables post.
Disclaimer: This report is provided for informational purposes only and does not constitute investment, legal, tax, or accounting advice, nor an offer or solicitation to buy or sell any security. Information is drawn from sources believed to be reliable, including the U.S. Bureau of Labor Statistics, the U.S. Census Bureau, the Bureau of Economic Analysis, the Institute for Supply Management, and the Federal Reserve, but its accuracy and completeness are not guaranteed. Views expressed are those of the author as of the date of publication and are subject to change without notice. Past performance is not indicative of future results.