A VIEW FROM THE PIEDMONT
Highlights of the Week
FOMC. Rates held at 3.50 to 3.75% in a 130-word statement stripped of forward guidance and its easing bias. The dot plot dropped the cut bias and split nine for a hike against nine for unchanged or lower, and futures have swung to price a quarter-point hike by the October 28 meeting.
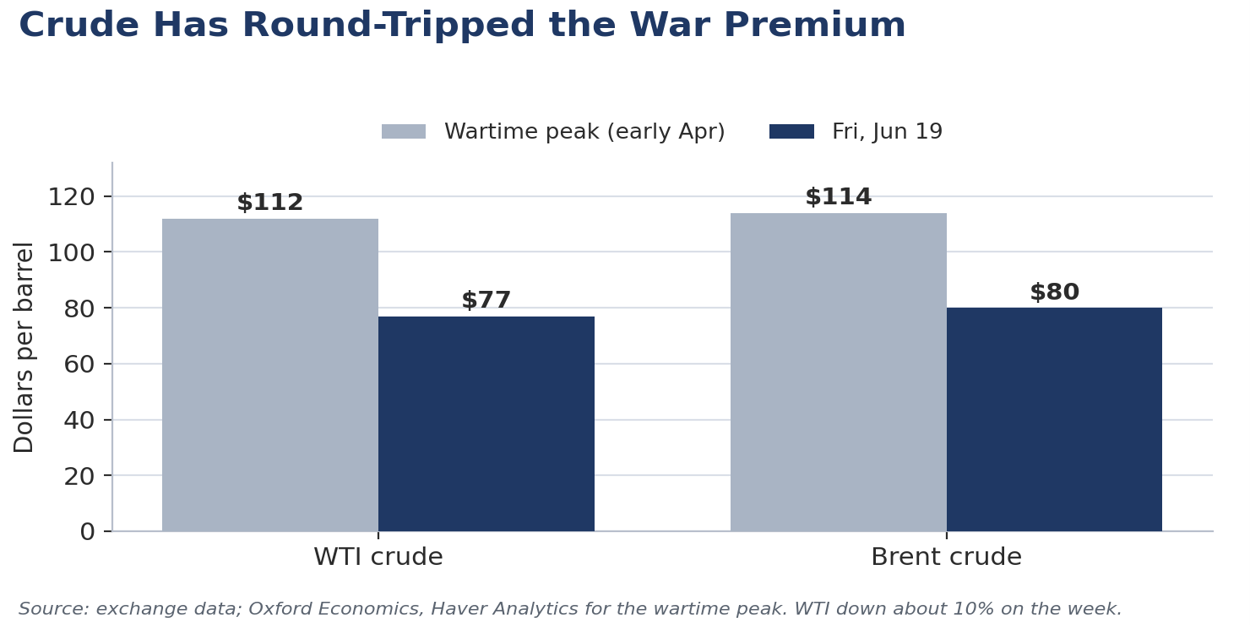
Energy. Crude round-tripped the war premium. WTI fell about 10% on the week to near $77 as tankers, including the first Saudi-owned cargoes since the war, moved through Hormuz, and pump prices slipped below $4.00. But the Switzerland nuclear talks were called off and Iranian-proxy Hezbollah and Israel kept exchanging strikes in northern Israel and Lebanon, leaving the deal’s durability in question.
Data. Retail sales rose 0.9% in May, though much of that was higher gas receipts, so real sales rose less, still a good result against sluggish real earnings. Claims held near 226,000, factory output was soft, and a multifamily-driven drop in housing starts overstated the sector’s weakness. Permits held up relatively well.
Our view. We read this as a hawkish hold, not a hiking cycle. The next move is up, not down, but we do not expect it before 2027. The durable driver is growth pressing into full employment, not energy, which has eased.
| Market Snapshot | Last | Week |
|---|---|---|
| S&P 500 | 7,500.58 | +0.9% |
| Nasdaq Composite | 26,517.93 | +2.1% |
| Dow Jones Industrial Avg | 51,564.70 | +0.8% |
| US dollar (DXY) | stronger | +1.1% |
| Fed funds target | 3.50–3.75% | unch |
| 2-yr Treasury | 4.22% | higher |
| 10-yr Treasury | ~4.50% | lower |
| WTI crude | ~$77 | −10% |
| Brent crude | ~$80 | −10% |
| Pump gas, US avg | <$4.00 | lower |
Executive Summary
Two developments defined the week. A hawkish-leaning FOMC decision under new Chair Kevin Warsh signaled fresh vigilance on inflation, and a US-Iran de-escalation pulled crude down by about 10%. Economic data revealed surprisingly resilient consumer spending and a steady labor market, even as housing starts softened and import prices remained elevated. Markets churned around the Fed but recovered on Thursday, led by small caps and technology, to finish the week modestly higher even as the yield curve flattened sharply. We read the Middle East thaw as a net positive for the growth and inflation mix, but the deal’s durability is in question after the nuclear talks in Switzerland were pushed back late in the week and got off to an unspectacular start when they convened on Sunday. The energy relief takes some of the near-term pressure off headline inflation, yet the underlying trend remains firm. Those calling for a rate hike miss one critical point: the real federal funds rate rises as headline inflation eases. That passive tightening is why we expect the Fed to remain on hold this year. The next move is up, but we do not look for it before 2027.
1FOMC Decision & Policy Stance
The Committee held the line, and Chair Warsh reset how the Fed talks. The Federal Open Market Committee voted unanimously, twelve to zero, on June 17 to keep the federal funds target range at 3.50 to 3.75%, the fourth consecutive hold. This was Chair Kevin Warsh’s first meeting since he succeeded Jerome Powell in May, and it left no doubt that a new chair is in the building. The policy statement ran about 130 words, down from more than 340 in April, and it dropped both the forward guidance and the easing bias that had framed recent communications. Warsh has long argued that forward guidance anchors the Fed to stale data and distorts the very market signals it relies on, and he put that conviction into practice on day one.
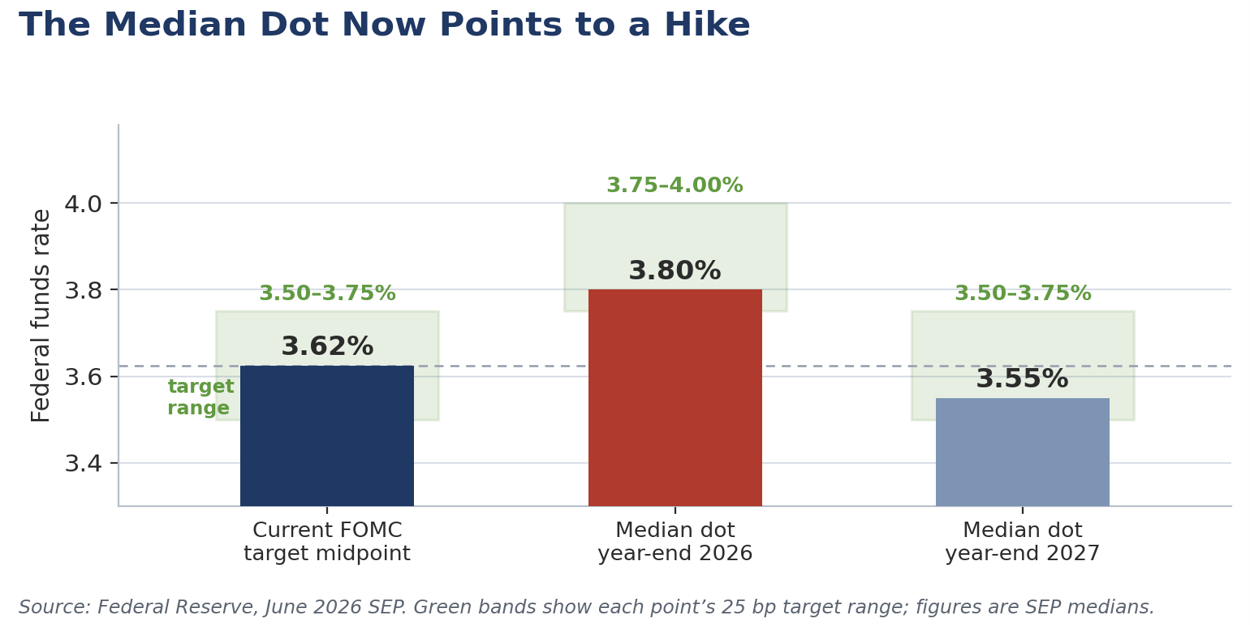
The projections did the talking the statement would not. In the Summary of Economic Projections, the median 2026 dot moved up to imply a possible hike, a sharp reversal from March, when the median still pointed to a cut. The Committee split evenly, nine participants penciling in at least one hike against nine who saw rates unchanged or lower. Officials lowered the projected unemployment rate to 4.3% from 4.4% and raised expected inflation to 3.6% from 2.7%, a revision that reflects the energy-driven price surge from the Mideast war. Warsh declined to submit his own dot, consistent with his skepticism of the exercise, and said he is setting up five task forces to review the Fed’s operations, communications, and inflation analysis.
The market repriced toward our long-standing view. The reaction was swift. The two-year Treasury yield, the maturity most sensitive to policy expectations, jumped about twenty basis points after the decision, and pricing for the funds rate at the end of 2026 rose roughly twenty basis points with end-2027 up about eleven. The median 2027 core PCE projection was lifted to 2.5%, a sign participants now read the energy-driven firmness as having a longer tail. One area where energy price pressure is likely to linger is transportation, with diesel and jet fuel prices set to lag the declines in oil and gasoline given extremely low inventories and tight refinery capacity. We have argued all year that the next move is more likely up than down, and the June dots have caught up to that view. Where we differ from the room is on timing. We read this as a hawkish hold, not the start of a hiking cycle, and we still see no move in 2026.
Warsh gave himself room to wait. The new Chair was deliberately balanced. He leaned on the price-stability mandate in a way that would make him sympathetic to a hike if the next several inflation prints disappoint, but he also said he watches the left of the decimal point, which we read as any reading that rounds to 2%, roughly 1.51% to 2.49%. That framing has always made more sense to us than a hard 2% target, under which a 0.1% rise in prices would count as too low and a 0.2% rise as too high. The move buys the Warsh Fed room to hold while inflation gradually drifts back toward that pace. Alongside it, Warsh announced five task forces to re-examine the post-2008 operating model, from communications and the dot plot to the balance sheet and the inflation framework. A Chair who has just commissioned a year of study is not in a hurry to move, and the reviews function as a patience mechanism.
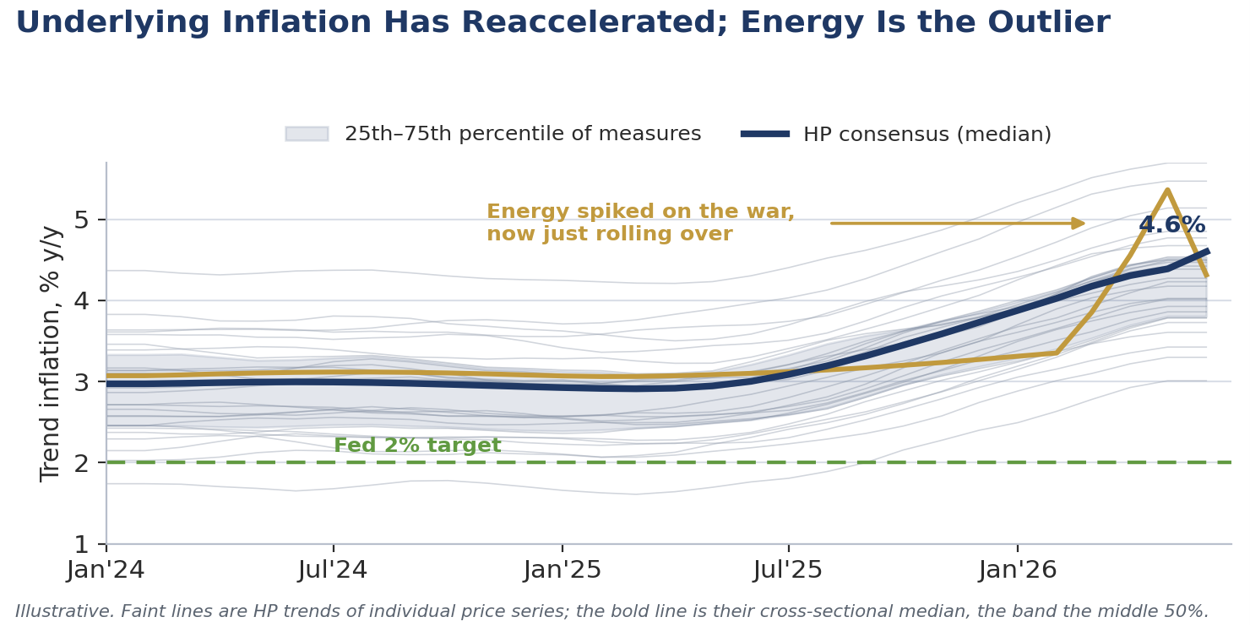
Our own inflation filter says the underlying trend is still firm. Rather than crown a single gauge, we run a Hodrick-Prescott filter across dozens of individual price series, extract each trend, and take the cross-sectional median, a consensus that is resistant to outliers. The current read is consistent. The underlying pace has reaccelerated over the past three months across most measures, the breadth is real rather than the work of a few categories, and energy stands out as the principal outlier. That last point is also where the relief lies. Softer energy should ease headline readings in the second half, even as the underlying consensus stays firm, which is precisely the split that lets the headline cool. The case for a cut simply will not be there this year.
Assessment. Three things keep us at no hike in 2026 despite the dots. First, the energy shock is de-escalating, and if trade through Hormuz resumes, today’s hawkish projections could look stale within a quarter or two. Second, the dots reflect all nineteen participants, but only twelve vote, and we suspect a majority of those twelve still prefer to wait. Third, the Chair has given himself latitude through the left-of-the-decimal framing and the task-force timetable. There is a fourth, more mechanical point. As inflation decelerates in the second half with the nominal rate on hold, the real funds rate rises on its own, a passive tightening that does the work the penciled-in quarter-point hike was intended to do. The direction of travel is nonetheless clear. The durable inflation risk in this cycle is not energy but an economy pressing further into full employment while a capital-led, AI-driven investment boom broadens, with breakeven payroll growth near zero as baby boomers retire and immigration enforcement tightens. We retain our no-cut base case, with the tail skewed toward a hike that we do not expect before 2027, and we stay cautious on duration as the term premium rebuilds.
2Key Economic Data Releases
The data described resilient demand against softer manufacturing and housing. Several important indicators printed during the week, and together they showed solid domestic spending alongside mixed factory output and weaker homebuilding.
| Indicator | Period | Actual | Consensus | Comment |
|---|---|---|---|---|
| Retail sales | May | +0.9% | +0.5% | Strongest gain since early 2023; broad based |
| Retail ex-autos | May | +0.8% | +0.6% | Consumer resilience evident |
| Initial jobless claims | Jun 13 | 226K | 225–230K | Stable, low level; labor market balanced |
| Philadelphia Fed mfg | June | +10.3 | +10.0 | Solid regional expansion |
| Industrial production | May | +0.1% | +0.3% | Soft; capacity utilization steady near 76.2% |
| Housing starts | May | 1.17M | 1.43M | Weaker than expected; permits stable |
| Import price index | May | +1.9% | +1.1% | Elevated; tariff and supply factors |
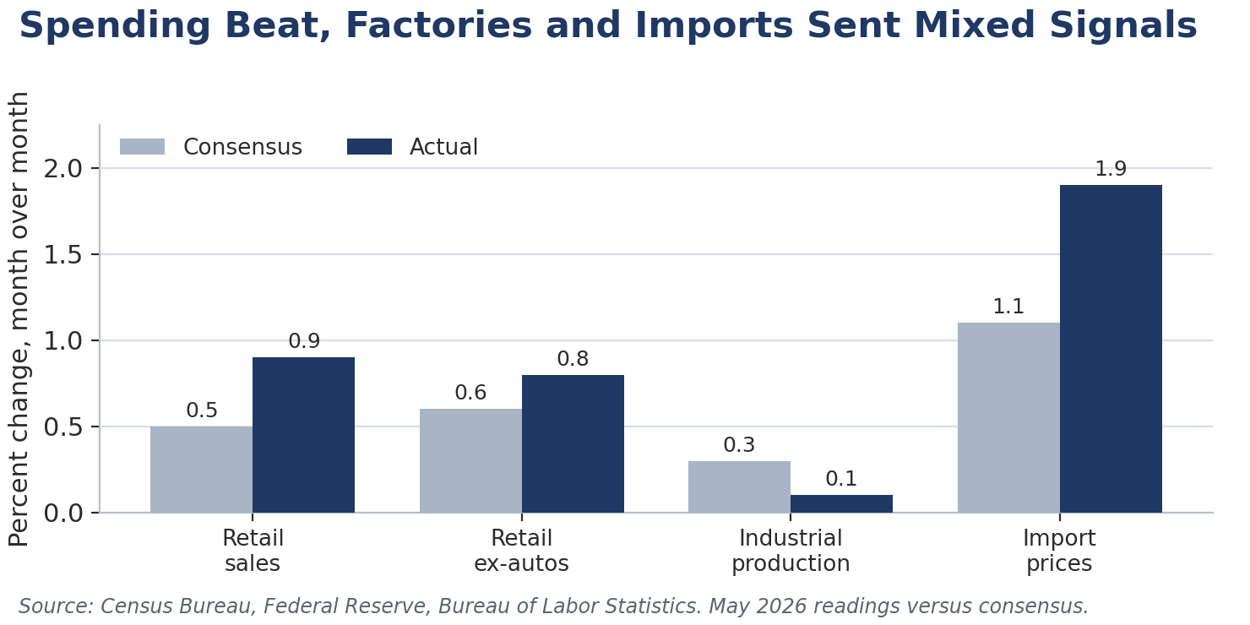
Read the retail headline with care. Retail sales rose 0.9% in May, the strongest gain in more than two years, but the strength was nominal. Service stations were among the biggest contributors as higher pump prices lifted the dollar value of gasoline sales, so real, inflation-adjusted purchases rose by less than the headline suggests. We still view it as a good result, particularly against a backdrop of sluggish real earnings. The war-driven jump in energy prices pushed inflation above wage growth over the past two months and produced the first decline in real wages in three years, yet households kept spending. The core control group, which feeds the consumer spending line in the GDP accounts, advanced a sturdy 0.7%, and second-quarter real consumer spending is tracking near a 2% annual pace, well ahead of the first quarter.
A spending tailwind is fading. Some of that resilience is borrowed. Tax refunds this season ran about 20% larger than a year ago and were skewed toward later filers and higher-income households, a boost that will be spent down over the summer. With pump prices now falling, the real-wage squeeze should ease, but the net support to spending from these crosscurrents is set to diminish as the year wears on.
The housing headline overstated the weakness. Housing starts dropped to a 1.17 million pace, well short of expectations, but the decline was concentrated in volatile multifamily activity, where permits point to a June rebound. Single-family starts fell a much milder 1.9%. Pending home sales surprised to the upside with a 3.8% jump even as mortgage rates touched a nine-month high, a forward signal of firmer closings into the summer. The binding constraint remains the overhang of completed, unsold homes, still near levels last seen in 2009, which builders must clear before single-family construction accelerates.
Factory softness and import prices point the same way we do. Industrial production rose just 0.1%, held back in part by petroleum-reliant chemicals and plastics, even as the AI buildout kept computer and electronics output climbing. Import prices jumped 1.9% on higher energy costs, and because they are measured early in the month, they missed the later slide in fuel. The more telling figure sits underneath. Nonfuel import prices are up 3.7% over the past year, led by capital goods and AI-driven electronics, with tariff effects still filtering through as policy shifts from Section 122 to Section 301 duties. That core-goods stickiness, not energy, is the inflation we are watching. Initial jobless claims fell to 226,000, with the four-week average just above 220,000 and the unemployment rate steady at 4.3% for a third straight month, a labor market that has firmed without overheating.
3Financial Markets Response
Markets traded the crosscurrents of de-escalation and a hawkish Fed. Early in the week equities surged on the emerging US-Iran agreement and falling oil. The Dow Jones Industrial Average set a record above 52,000 on Tuesday, reflecting a heartier risk appetite.
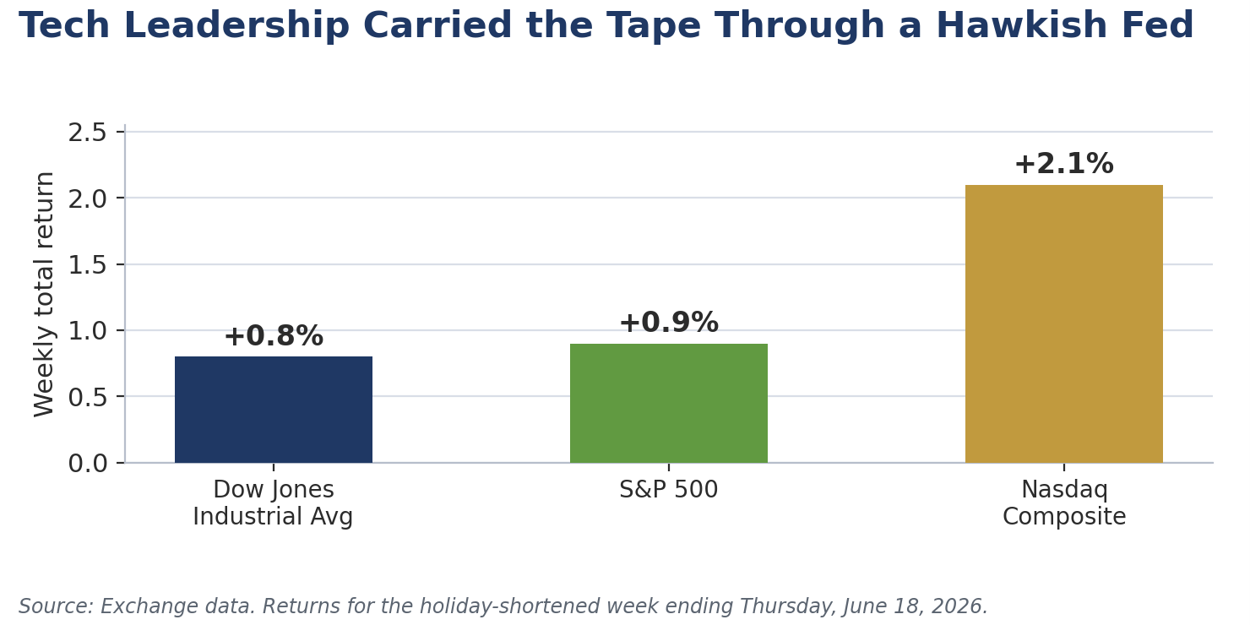
The hawkish projections sparked a midweek pullback that did not last. The dot plot triggered a sell-off on Wednesday afternoon and into Thursday as Treasury yields jumped on the higher rate path. Markets then recovered smartly on Thursday, June 18, the last session before the Juneteenth holiday, led by small caps and technology as the long end slipped back. On the four-day, holiday-shortened week, the S&P 500 closed near 7,500 for a gain of about 0.9%, the Nasdaq Composite finished around 26,518 up roughly 2.1%, and the Dow ended near 51,565, up about 0.8%. The dollar surged about 1.1% on the hawkish Fed shift.
The curve flattened hard as the dots hit the front end and oil hit the long end. This was the sharpest flattening of the two-year/ten-year spread since early 2025. The hawkish projections drove the two-year yield to a new cycle high near 4.22%, while the ten-year slipped and found support around 4.50% as tumbling oil pulled inflation expectations lower across the curve. Markets now fully price a quarter-point hike by the October meeting and a second by next March. We believe that pricing is way too aggressive, but, unlike the cut-callers, we do not think the answer is easing either.
Financial conditions stayed easy, which is the point. Risk appetite barely flinched. Corporate spreads held near their tightest levels of the year, with investment-grade around 73 basis points and high-yield near 263, and a heavy issuance calendar led by a twenty-five-billion-dollar bond sale from a marquee AI chipmaker met ready demand. Easy financial conditions alongside a hawkish Fed reinforce our view that this economy does not need rate cuts and that the Committee can comfortably remain on hold.
The energy trade is a lesson in how quickly top-of-the-K wealth can swing. One of the quieter but more instructive moves of the past several weeks played out in energy shares. In the first six weeks of the war, energy stocks outran the broad market by nearly twenty percentage points, a windfall concentrated in the portfolios of higher-income households that hold the bulk of equity wealth. As peace talks advanced, that trade reversed hard. Energy gave back all of its war-era outperformance even as the broad market recovered, with the sector’s roughly $4.6 trillion in market value swinging on the headlines. It is a timely reminder that the asset wealth underpinning affluent consumer spending, the strong leg of our Two Americas economy, can erode as fast as it builds.
4Geopolitical Spotlight: The US-Iran MOU
The week’s dominant story was the US-Iran memorandum. The headline event was the announcement and release of the fourteen-point Islamabad Memorandum of Understanding between the United States and Iran, aimed at ending active hostilities and building a framework for de-escalation. Officials read out the terms during the week, with formal execution around June 19. The principal provisions include:
- Immediate and permanent termination of military operations on all fronts, including Lebanon, with commitments to respect territorial integrity and sovereignty.
- Reopening of the Strait of Hormuz to toll-free commercial navigation, with provisions for demining and safe passage, a critical channel for global energy supplies.
- Phased termination of UN and US primary and secondary sanctions, tied to compliance and a future nuclear agreement, with immediate waivers for Iranian crude, products, and associated banking, insurance, and transport services.
- A framework for technical negotiations on Iran’s nuclear program within a sixty-day extended ceasefire window.
- A commitment, with regional partners, to develop a mutually agreed reconstruction and economic development plan for Iran of roughly $300 billion. US officials clarified that this does not entail direct upfront US government funding.
- Broader confidence-building measures intended to prevent future conflict.
The picture on the ground is improving but fragile. By Thursday, tanker traffic was returning to the strait, with roughly ten million barrels of crude observed transiting or staging nearby, including the first Saudi-owned cargoes to move since the conflict began. Crude fell about 10% on the week, WTI settling near $77 against a wartime peak above $110 in early April, and pump prices slipped below $4.00 a gallon from a nationwide average of $4.48 in late May. Gasoline is on track to fall more than 9% in June, which alone should trim roughly three tenths from headline CPI. The caveats are real. The technical nuclear talks in Switzerland were pushed back late in the week and got off to an unspectacular start when they convened on Sunday, outbound vessel flows slowed on Friday, and Hezbollah and Israel kept exchanging strikes across northern Israel and Lebanon. The de-escalation is genuine, but its durability is the variable that matters most.
Assessment. This marks a significant and fast turn away from the heightened Middle East conflict that the FOMC explicitly cited as a source of uncertainty. The reopening of Hormuz and the oil export waivers should help stabilize and potentially lower global energy prices, easing one of the inflationary supply shocks the Fed flagged. For the economy and markets, the agreement lowers tail risks around energy shocks, shipping disruptions, and broader contagion. The reconstruction framework and sanctions-relief path draw bipartisan skepticism at home, but the phased, compliance-linked structure and the funding clarification mitigate some of those concerns. We will watch the sixty-day nuclear window closely, since progress there would embed stability while setbacks could quickly reintroduce volatility. On balance, the memorandum is a clear net positive for the global growth outlook and reduces the elevated uncertainty the Fed referenced only days earlier.
5The Global Backdrop and the G-7
The G-7 put its weight behind the de-escalation. Meeting at Évian from June 15 to 17, the G-7 leaders welcomed the US-Iran memorandum, which President Trump signed at Versailles on the final day, and reaffirmed that the right of transit through chokepoints such as Hormuz, free of restrictions or tolls, is the bedrock of international trade. The same communiqué pledged tougher sanctions on Russia, including its oil and gas sectors, a reminder that even as Iranian barrels return, the supply side is not uniformly looser and that a floor under crude could build from the other direction. Less settled were tariffs and industrial policy, where Washington and its allies remain at odds, and France used its presidency to press the case for narrowing global imbalances. For a US reader, the through-lines are straightforward: the energy supply shock is easing, the trade-policy overhang is not, and both still run to inflation.
The global outlook is firmer than the spring scare suggested. The Middle East shock knocked the international forecasts lower this spring. The World Bank trimmed global growth to about 2.5% for 2026 and the OECD to roughly 2.8%, both pinning the markdown on the energy spike before a projected firming through 2027 and 2028 as supplies recover and trade normalizes. With the war now de-escalating, the more benign of the two paths the OECD sketched, the one that assumes Gulf energy comes back from the third quarter, is the one playing out. The international consensus pegs US growth near 2.0% this year; we sit above it, consistent with our capital-led, AI-driven read of this expansion. The common thread runs alongside our own: a supply-driven jump in energy prices can be looked through so long as expectations stay anchored, and the durable story is the underlying trend and the AI investment cycle lifting it, not the oil price.
6Forward Outlook
The second half opens on constructive footing, and the rate debate is the crux. Solid underlying growth, a resilient consumer, and reduced geopolitical risk make for a favorable backdrop into the back half of 2026. The honest debate is about inflation and the Fed. The dovish camp argues that fading energy and tariff pressures will pull inflation below the Fed’s projections and open the door to a cut this year. We disagree. We do look for inflation to decelerate in the second half, but the disinflation is energy-led and largely mechanical, while our cross-sectional filter shows the underlying trend still firm. The key point the cut case misses is that as headline inflation falls with the nominal funds rate on hold, the real funds rate rises modestly, and that passive tightening does the work the Committee’s penciled-in quarter-point hike was meant to do. That is why we expect no hike this year even as the dots and the market lean that way, and why we see no case for a cut. The next move in the funds rate is up, and we do not expect it before 2027.
We look for the labor market to cool gently, not crack. We expect job growth to moderate back toward about 95,000 a month in the second half, with a slight rise of roughly one tenth of a point in the unemployment rate. That is a soft landing at full employment, not a downturn. With breakeven payroll growth near zero as baby boomers retire and immigration enforcement tightens, even a moderating pace of hiring keeps the labor market tight, which keeps wage and services inflation from cooling as quickly as the energy-led headline. Continued strength in nondefense capital goods orders and a broadening AI investment cycle, with a public-market pipeline now measured in the trillions, point to a capital-led expansion that keeps demand firm. We will keep watching the durability of the Iran agreement, incoming inflation and labor data, and any signal from a deliberately less transparent Fed.
7The Week Ahead
Next week is heavy on the data that will test this view. The calendar turns to the releases that bear directly on the growth and inflation debate. New home sales open on Tuesday. Wednesday is the crowded session, with the final read on first-quarter GDP, May personal income and spending, the PCE price index, durable goods orders, and weekly jobless claims. The trade balance and the final University of Michigan sentiment reading close out the week on Thursday.
- PCE prices. Core PCE is expected to rise about 0.4% in May and headline about 0.5%, a hot print. With gas now falling, we still expect May to mark the peak in inflation for the year.
- Real spending. Strong retail sales point to a solid rise in nominal personal spending, but real spending may eke out only about 0.1%, the same nominal-versus-real gap we flagged this week, with the saving rate likely slipping again.
- Capital goods. We look for another solid gain in nondefense capital goods orders excluding aircraft, consistent with the capex cycle underpinning our above-consensus growth call.
- Claims. A small dip is likely. The recent uptick in the four-week average looks like summer seasonal noise rather than a turn in the labor market.
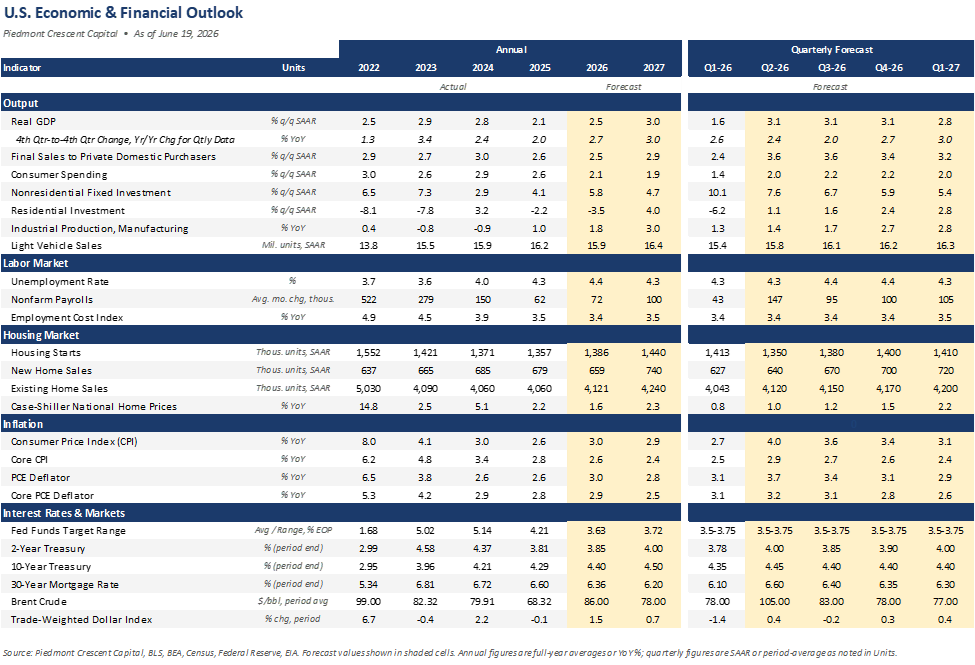
8Our Forecast
Our base case in brief. We look for above-consensus growth led by capital investment, inflation that decelerates in the second half on energy while the underlying trend stays firm, a funds rate held through 2026 with the next move a hike in 2027, and a labor market that cools gently to roughly 95,000 jobs a month with a slight uptick in unemployment. The full forecast is summarized below.