

August CPI Report Comes In No Better Than Expected: Gasoline Lights the Headline, Shelter Lights the Fuse
Economic Indicator Report · Consumer Price Index, August 2026
Gasoline Lights the Headline, Shelter Lights the Fuse
August's inflation numbers were no worse than expected, but no better either. The headline 0.4% increase was gasoline's doing. Core prices cooled to 2.4% over the year but firmed to 0.3% on the month, and for the first time since we set our hold call's falsifiable test in July, shelter and core services outside housing both moved the wrong way at once.
Early Signals
- The underlying trend ticked up for the first time in four months. It ended three straight monthly declines (May, June, July), though it remains close to the cycle low.
- Gasoline did almost all of the headline's work. The all items index rose 0.4% in August, its fastest pace since May, after rising just 0.1% in July. Gasoline rose 3.9% on the month and, per BLS, accounted for over a third of the increase on its own. Energy overall rose 2.1% and is up 16.3% over the year.
- Shelter and core services outside housing both re-accelerated. Shelter rose 0.3% in August, matching May's pace, after rising just 0.1% in July, even as its 12-month rate eased to 3.0% from 3.2% on favorable base effects. Services less rent of shelter rose 0.3%, a third straight acceleration from 0.0% in June and 0.2% in July.
- Real wages fell for a second straight month. Real average hourly earnings declined 0.1% in August and are down 0.3% over the year, as a 0.3% nominal wage gain was outrun by the 0.4% rise in the CPI-U.
Key Takeaways
| Key Concept | Findings |
|---|---|
| Headline CPI | Rose 0.4% in August after rising 0.1% in July. The 12-month rate held at 3.4%, matching July and roughly in line with consensus. |
| Energy | Up 2.1% on the month as gasoline rose 3.9%, reversing July’s 1.5% decline. Up 16.3% over the year with gasoline up 27.4%. |
| Core CPI | Rose 0.3% after rising 0.2% in July, easing the annual rate to 2.4% from 2.5%. Core goods are up just 0.7% over the year. |
| HP-Filtered Trend | Our one-sided estimate of trend core inflation rose to 2.55% from 2.51%, its first increase since April. Core CPI has risen at a 2.01% annual rate over the past three months, up from 1.64% in July. |
| Shelter | Up 0.3% in August, matching May's pace, though the 12-month rate eased to 3.0% from 3.2%. Owners' equivalent rent and rent both rose 0.2%. |
| Light Vehicles | New vehicles up 0.3% (+0.6% over the year), used vehicles up 0.4% (-2.3%), and motor vehicle insurance down 0.8% (-5.1%). |
| Real Earnings | Real average hourly earnings fell 0.1% in August and are down 0.3% over the year. Real weekly earnings rose 0.2% as the workweek lengthened. |
| Policy Signal | We are changing the call. Our analysis has not changed: the case for a hold is intact, but we now expect the Committee to hike anyway on September 16 and then hold in October, since markets have priced high odds of a move and the Fed has shown little appetite to surprise them this cycle. |
The Overview
August's inflation report arrived hotter on the headline and cooler on the year for core, an unusual combination that gives both hawks and doves something to point to. The all items index rose 0.4% in August, its fastest monthly pace since May, after rising just 0.1% in July. The move was concentrated almost entirely in energy: gasoline prices rose 3.9% on the month, and BLS attributes more than a third of the headline's increase to gasoline alone. Core prices, which exclude food and energy, rose 0.3% in August after a 0.2% rise in July, close to the roughly 0.4% consensus estimate but below it, and nearer Wells Fargo's below-consensus 0.23% call. The 12-month core rate eased to 2.4% from 2.5%, continuing almost a year of gradual moderation.
A report that runs hot on the headline and cooler on the year rarely resolves anything, and this one is no exception. It lands one week before the Committee meets, with futures markets, by some accounts, pricing meaningful odds of a move at that meeting, a read that sits uneasily against a core print that came in below consensus on the month. We think the report is more supportive of our hold call than the headline number suggests, but two developments inside it, detailed below, are the first real test of the trip-wire we set in July.
Energy Sets the Headline, Again
The energy index rose 2.1% in August after falling 1.5% in July, entirely reversing course. Gasoline prices rose 3.9% on a seasonally adjusted basis (2.5% before adjustment) and are up 27.4% over the year. Fuel oil (a thin, volatile series, but the earliest read we get on winter heating costs) jumped 10.1% in August after a 1.7% decline in July, and is up 52.0% over the year. Natural gas (-1.1%) and electricity (-0.2%) both fell. The food index rose just 0.1%, as a 6.2% drop in lettuce prices offset gains in eggs (+2.9%) and dairy (+0.3%).
Core Inflation: A Firmer Month, A Cooler Year
The core index rose 0.3% in August after rising 0.2% in July, lowering the annual rate to 2.4% from 2.5%. Core goods showed little pricing power, up just 0.1% on the month and 0.7% over the year, as new vehicles (+0.3%), used vehicles (+0.4%) and apparel (unchanged) barely moved. The firming sat almost entirely in services.
Services less rent of shelter, our cleanest read on core services outside housing and the number we said in July we would be watching, rose 0.3% in August, a third consecutive acceleration from 0.0% in June and 0.2% in July. Transportation services rose 0.5%, its own third straight acceleration (-0.3% in June, +0.3% in July), and airline fares rose 2.7% for a second month above 2%, after +2.2% in July. None of these is yet at the '0.4% for two or three months' pace that would confirm our trip-wire, but the direction, for the first time since we set it, is uniformly the wrong way.
The Underlying Trend: Our HP-Filter Read
Our HP-filtered estimate of trend core inflation rose to 2.55% in August from 2.51% in July, its first increase in four months, following declines in May, June and July. It remains close to the cycle low and well below the 3.39% reading from a year ago, but the direction changed for the first time since our July report described the trend as 'grinding lower.' Core CPI has risen at a 2.01% annualized rate over the past three months, up sharply from 1.64% in July, though still below its 12-month pace of 2.46%.
The alternative measures we track agree the level is low and disagree mainly about direction. The Cleveland Fed's median and 16% trimmed-mean CPI stood at 2.69% and 2.60% in July, little changed from June's 2.71% and 2.63%, however, and both released with a lag against this morning's CPI. The Dallas Fed's trimmed-mean PCE was 2.28% in July, up slightly from 2.26% in June. All four measures remain clustered in a narrow band just above 2.5%, a level none of them has meaningfully broken in either direction since spring.


Methodology note. We apply a one-sided Hodrick-Prescott filter to monthly annualized inflation with the standard monthly smoothing parameter (λ = 129,600), computed on seasonally adjusted CPIAUCSL and CPILFESL from a 2000 sample start. The one-sided implementation uses only data available through the current month, so the estimate is real-time and does not revise as future data arrive. October 2025 has no CPI observation because of the 2025 lapse in appropriations; we interpolate the index level geometrically between September and November, which moves the trend estimate by less than a basis point. August's core CPI index level is not yet published by FRED as of this writing; we estimate it from July's confirmed level and the BLS-published seasonally adjusted monthly change, and will true it up against FRED's own figure once posted.
Shelter and Light Vehicles: The Transmission Channels Wobble
Housing and light vehicles, the two channels that carry monetary policy to consumer prices, both moved against the case for further moderation this month, modestly, but for the first time in a while. Shelter rose 0.3% in August, matching May's pace, after rising just 0.1% in July. Owners' equivalent rent and rent of primary residence each rose 0.2%, in line with recent months, and lodging away from home swung from -2.8% in July to +2.4% in August, a volatile line item that likely accounts for some of the acceleration. Shelter's 12-month rate eased to 3.0% from 3.2% as a strong August 2025 print rolled out of the comparison, a reminder that the year-over-year number can improve even as the freshest monthly reading worsens.
New vehicle prices rose 0.3% (+0.6% over the year), used vehicles rose 0.4% and remain down 2.3% over the year, and motor vehicle insurance fell 0.8% in August and is down 5.1% over the year, now the steepest annual decline of any major category we track. Between the two channels, vehicles are still doing the disinflationary work; shelter, this month, was not.
Travel and Transportation: The Forward-Looking Signal
Three categories in this release are worth watching less for what they say about August than for what they say about the months ahead. Airline fares rose 2.7% in August, a second consecutive month above 2% after a slow spring, and are up 23.4% over the year, among the largest annual increases of any category in the index. Transportation services broadly rose 0.5%, a third straight monthly acceleration from -0.3% in June. Fares and transportation services both tend to move with discretionary travel demand and fuel-cost pass-through before that shows up elsewhere, so two straight strong prints are a genuine signal.
Fuel oil's 10.1% August jump, its largest monthly gain since spring, is the earliest data point we will get on heating costs heading into the fourth quarter. It is a volatile series (it fell 9.2% in the May-June window alone), so one month should not be treated as destiny, but it moved the same direction as crude oil, which has traded closer to $100 a barrel in recent weeks. We will be watching the September and October prints closely.
Real Earnings: The Squeeze Continues
The companion release showed a second straight month of real wage erosion. Real average hourly earnings for all employees fell 0.1% in August and are down 0.3% over the year, as a 0.3% nominal gain in average hourly earnings was more than offset by the 0.4% rise in the CPI-U. Real average weekly earnings rose 0.2% only because the average workweek lengthened by 0.3%; on an hourly basis, workers lost ground for a second straight month. Production and nonsupervisory employees, whose earnings are deflated by the CPI-W (+0.5% in August, which carries more weight on gasoline and food), fared about as poorly: real hourly earnings fell 0.1% and are down 0.1% over the year.
Nominal average hourly earnings are up 3.1% over the past year, against a 3.4% rise in headline consumer prices and a 2.4% rise in core. Wage growth now trails the headline but has pulled back ahead of core, a reversal from where the two stood a year ago.

What Households and Markets Expect
Households held roughly steady in the New York Fed's August Survey of Consumer Expectations, which put median one-year household inflation expectations unchanged at 3.6% and five-year expectations unchanged at 3.0%; the three-year measure eased a tenth to 3.2%. The same survey showed a sharper deterioration in labor-market sentiment: the average probability that unemployment will be higher in a year rose to 44.4%, its highest reading since April 2020, a reminder that households are more worried about jobs than prices right now.
The University of Michigan's preliminary September survey, released today, was weaker. Its sentiment index fell to 47.8 from a final 51.7 in August, below the 51.0 consensus. Both of its inflation-expectations gauges moved the wrong way: year-ahead expectations rose to 4.6% from 4.0%, and long-run expectations firmed to 3.4% after three straight months at 3.3%. The two household surveys read differently this week, NY Fed steady, Michigan sharply worse, and neither lets the Fed treat inflation expectations as settled.
Markets are calmer than households, and little moved by this report. The five-year, five-year forward inflation compensation rate stood at 2.34% on September 10, and the 10-year breakeven at 2.40%, both essentially where they have sat for weeks. Neither measure suggests markets see this month's firmer core print as the start of a new trend.
OUR CALL
We are changing our call. Our view of the right policy has not moved: the case we laid out in July, that underlying inflation is moderating and policy is already doing its job through housing and vehicles, is intact after this report and, on the 12-month core rate, a little stronger. We still think the Committee should hold the federal funds rate at 3.50% to 3.75% on September 16, but we now expect them to hike anyway, to 3.75% to 4.00%, and then hold at the October 27-28 meeting.
Markets currently assign an 88% probability to a September move, and a Committee that has spent this cycle trying not to surprise investors is more likely to follow pricing that one-sided than fight it a week out. We have also been expecting the Committee's next move to be a hike rather than a cut: normalizing policy away from an emergency-era stance means rates settle higher, and manufacturing hiring has kept improving even as the sector's order book cooled in August, one more piece of evidence pulling the same direction. None of this is the outcome we would choose, but a September hike still strikes us as directionally sound, just early.
The report itself argues for patience. Real wages are still falling, which cuts against a demand-side inflation story, and the two transmission channels remain net disinflationary even after this month's wobble: vehicles more than offset shelter, on balance. Core goods barely moved, and the alternative underlying-inflation measures we track are all still clustered just above 2.5%. A single quarter-point move followed by an October hold is a small deviation from what the data call for, and the falsifiable test we set in July, two or three more months of core services less shelter near 0.4% with shelter no longer decelerating, still stands as the real signal to watch.
Mark P. Vitner
Chief Economist, Piedmont Crescent Capital
mark.vitner@piedmontcrescentcapital.com · (704) 458-4000
Disclaimer: This report is provided for informational purposes only and does not constitute investment, legal, tax, or accounting advice, nor an offer or solicitation to buy or sell any security. Information is drawn from sources believed to be reliable, including the U.S. Bureau of Labor Statistics and the Federal Reserve Banks of Cleveland, Dallas, New York and St. Louis, but its accuracy and completeness are not guaranteed. Views expressed are those of the author as of the date of publication and are subject to change without notice. Past performance is not indicative of future results.
Appendix: Trend Inflation Estimates
| Measure | Latest | Prior month |
|---|---|---|
| PCC HP-filter trend, core CPI (one-sided, λ=129,600) | 2.55% (Aug) | 2.51% (Jul) |
| PCC HP-filter trend, headline CPI | 2.89% (Aug) | 2.78% (Jul) |
| Core CPI, compound annual rate over three months | 2.01% (Aug) | 1.64% (Jul) |
| Core CPI, compound annual rate over six months | 2.59% (Aug) | 2.42% (Jul) |
| Cleveland Fed median CPI (12-month percent change) | 2.69% (Jul) | 2.71% (Jun) |
| Cleveland Fed 16% trimmed-mean CPI (12-month percent change) | 2.60% (Jul) | 2.63% (Jun) |
| Dallas Fed trimmed mean PCE (12-month rate) | 2.28% (Jul) | 2.26% (Jun) |
| Core CPI, official 12-month | 2.4% (Aug) | 2.5% (Jul) |
Computation notes: HP-filter estimates were computed on seasonally adjusted FRED series (CPIAUCSL, CPILFESL) through July 2026 (confirmed) plus August 2026, sample from 2000, one-sided recursive expanding-window implementation, λ = 129,600, applied to monthly annualized inflation. August's headline SA index level (334.131) is the preliminary figure published in BLS's Real Earnings, August 2026 release (Table A-1); no equivalent official SA level for core CPI has been published, so August's core level is estimated from July's confirmed FRED level (336.789) and the BLS-published seasonally adjusted monthly change (+0.3%). October 2025 has no CPI observation; the index level is interpolated geometrically between September and November 2025, which moves the trend estimate by less than a basis point. Cleveland Fed values are 12-month percent changes of the published median and 16% trimmed-mean indexes through July 2026; the Cleveland Fed's August readings are released later on CPI day and are not reflected here. Dallas Fed trimmed mean PCE is the published 12-month rate through July 2026.
Sources: U.S. Bureau of Labor Statistics, Consumer Price Index and Real Earnings, August 2026; Federal Reserve Bank of Cleveland, median and 16% trimmed-mean CPI; Federal Reserve Bank of Dallas, trimmed mean PCE; Federal Reserve Bank of New York, Survey of Consumer Expectations, August 2026; Federal Reserve Bank of St. Louis (FRED); Piedmont Crescent Capital calculations.


Twenty-Five Years Ago: My Perspective from Three World Trade Center | The Piedmont Perspective
Twenty-Five Years Ago: My Perspective from Three World Trade Center
The Piedmont Perspective
Twenty-five years ago this morning I was in a hotel ballroom at Three World Trade Center when the first airplane hit. The building has all but vanished from the story, and I am told that no airplanes hit the towers and that America had it coming. This is what I saw, and this is what the record shows.
I was sitting at a table near the back of a hotel ballroom in lower Manhattan when the first airplane hit. It was 8:46 on the morning of September 11, 2001, and our breakfast speaker had been going about ten minutes. We heard a boom that was loud but not alarming, the sort of noise you would blame on an air conditioning compressor. Then came a rattle across the roof of the ballroom that sounded like machine gun fire, then three or four thunderous concussions, and then the room shook the way a room shakes in an earthquake. The chandeliers swayed. A few people screamed, some got under the tables and most of us simply looked up. What none of us knew was that large pieces of the north tower were coming down on top of us, and that the ceiling was holding.
The building I was in was Three World Trade Center. It opened in 1981 as the Vista International, became the New York Marriott World Trade Center in 1995, and stood 22 stories and 825 rooms on the southwest corner of the complex, wedged between the two towers and joined to the north tower by an underground entrance at concourse level and a walkway at plaza level. It had been seriously damaged once before, in February 1993, when the truck bomb went off in the parking garage directly beneath its ballroom. I was there for the annual meeting of the National Association for Business Economics, which ran September 9 through 11 and held its Tuesday breakfast session in that same ballroom. Robert Scott, then president and chief operating officer of Morgan Stanley, was speaking on the future of the financial services industry. The hotel had 940 registered guests that morning. My suitcase was packed and sitting by the desk on the 18th floor.
Nothing of that building survived the day. The south tower came down at 9:59 and crushed the middle of the hotel, opening a gap that nearly cut it in half. The north tower came down at 10:28 and took nearly all of the rest, leaving a fragment standing around the southern stairwell. Fourteen people lived through both collapses from inside it, thirteen firefighters and one guest. Forty-three people in the hotel were killed, among them two Marriott employees who stayed behind to get guests out, Joseph Keller, the executive housekeeper, and Abdul Malahi, an audiovisual technician.
The hotel itself has nearly disappeared from the story, and I have contributed to that myself. In the account I wrote that same week I called it “the Marriott Hotel right next to it,” which is how everyone spoke of the place then and how most people still speak of it. The address was Three World Trade Center. It was built as part of the complex and joined to the north tower at the concourse and again at the plaza, and when people say the towers fell they are describing what happened to the building I was standing in. The main evacuation route out of the north tower that morning ran through the hotel lobby and out the door beside the bar, which I believe was called Tall Ships. Fire trucks were still arriving. The hotel staff led us to that door, and a fireman stood at it watching for falling debris, waiting for a pause and then sending each of us out across the West Side Highway with a slight pull and a nudge. It is not remembered the way the towers are because it was buried by them, and I have come to think that is the ordinary way memory treats a day like that one. The largest things survive, the things underneath them do not, and after twenty-five years what remains is a shape that is easier to argue with than the day was.
Twenty-five years is long enough for the argument about a day to take the place of the day. A child born the week after the attacks turns twenty-five this month, and anyone who was ten years old that morning is thirty-five now. My wife was three months pregnant with our first child that morning, so my own children learned about the attacks the way I learned about Pearl Harbor, as history, from books and from the people who were there. For most of the country, September 11 is no longer something recalled but something received, and what is being received has changed. Three claims in particular now reach me often enough that I have stopped being surprised by them.
The first is that no airplanes hit the buildings. I did not see the first one. I heard it, could not identify the sound, and spent the next twenty minutes believing, along with nearly everyone around me, that someone had set off a bomb. I did see the second one. I was standing near the Wall Street Journal building, perhaps five hundred feet from the south tower, talking with a reporter who had noticed my conference badge, when we heard an engine screaming and echoing off the glass so that we could not tell which direction it was coming from. Then there was an explosion, and we watched the airplane go into the south tower in the reflection off the building next to us, and we hit the ground.
The record does not depend on me. Close to a hundred cameras caught United 175 in photographs before it struck the south tower, and the impact itself went out live on national television because the networks already had cameras pointed at the north tower. In April 2013 a five-foot section of a Boeing 767 wing, a trailing edge flap support structure stamped with the Boeing name and a serial number, was found wedged in an alley behind 51 Park Place a few blocks north of the site, and a section of fuselage from United 175 was recovered from the roof of Five World Trade Center. Thirty-seven telephone calls were placed from United 93 between the hijacking at 9:28 and the crash at 10:03, thirty-five of them from the seatback Airfones in the last nine rows of the airplane.
I ate dinner that night in the house of a man who had just lost a friend on one of those airplanes. I got out of Manhattan on a tugboat, walked into New Jersey, and eventually found a train, where a Sprint account representative named Bob offered to take me home to Princeton and help me rent a car so I could drive to Charlotte. I took a shower at his house. While I was in it, he and his wife learned that a close friend of theirs had been on the airplane that went down in Pennsylvania. Bob showed me a photograph. The man was an account manager at Oracle named Todd Beamer, and at that hour he was only a name, a face and a family they had taken a vacation with. It was days before I learned what he had done on that telephone. If no airplanes were involved, then thirty-seven people invented their own last conversations, and the two people who set a plate in front of me that night were grieving a man who had not died.
The second claim is that it was done from the inside. The National Institute of Standards and Technology spent about six years on the question, from August 2002 to November 2008. Its final report on the towers, NCSTAR 1, was published in September 2005, and its report on Building 7, NCSTAR 1A, in November 2008. NIST concluded that the aircraft severed columns and dislodged fireproofing from the steel, that the resulting fires weakened the floors to the point where they sagged and pulled inward on the perimeter columns, and that the investigation “found no corroborating evidence for alternative hypotheses suggesting that the WTC towers were brought down by controlled demolition using explosives.”
That claim is growing fastest among the people with no memory of the day. In a YouGov survey of 1,000 American adults conducted November 9 through 13, 2023, twenty percent said it was definitely or probably true that the U.S. government was behind the attacks. Among adults aged 18 to 29 the figure was 31 percent, against 7 percent among those 65 and older. A study of 2,174 online comments published in Frontiers in Psychology in 2013 found that people arguing the conspiracy case spent roughly twice as much of their effort attacking the official account as defending any alternative to it, which is the tell. It functions less as an explanation of how the buildings came down than as a posture toward whoever is doing the explaining, and it travels most easily to people who were not there and have no particular reason to trust anyone who was.
The third claim is different in kind. It is not an argument about evidence at all. In August 2019, reacting to Representative Dan Crenshaw’s defense of the American military footprint abroad, the commentator Hasan Piker said on his livestream that “America deserved 9/11” and that we brought it on ourselves. Two days later, asked directly whether America deserved the attack, he answered “No, obviously not,” said he “should’ve used more precise and better use of the language there,” and drew a distinction between America, meaning the state and its foreign policy, and Americans, meaning the people who live here. Twitch suspended him for seven days. He has since built a following of roughly three million on Twitch, and in July of this year he hung a framed front page of the September 12, 2001 New York Times behind him on his set.
That distinction between America and Americans does not survive contact with the building. The people who died in Three World Trade Center were a housekeeping manager, an audiovisual technician and forty-one firefighters who went in after the rest of us came out. Among the 940 guests registered in the hotel was an economist named Hiroshi, who came over from Tokyo every year for the meeting and whom I had promised to take to the Krispy Kreme in the concourse during the morning break, on the theory that a single doughnut would end his career in economics, since he would make a fortune selling them in Japan. There is a serious argument to be had about American foreign policy, and I have no interest in pretending otherwise. No part of it was decided in that ballroom.
The related worry, that sympathy for Osama bin Laden is spreading among the young, needs better arithmetic than it usually gets. In November 2023 a translation of bin Laden’s 2002 “Letter to America” circulated on TikTok and a handful of users posted videos saying it had changed how they saw the country. Before the story broke there were 274 such videos and about two million views between them, which on that platform is close to nothing, and TikTok said afterward that reports of the letter trending were inaccurate. The single post condemning the trend drew close to forty million views on its own. The outrage was roughly twenty times the size of the thing it was about. I do not think the drift is imaginary. The number worth being alarmed by, however, is the one from the YouGov survey rather than the one from the viral episode.
Around eleven o’clock that morning a man at a pushcart handed me a tray of water bottles. The south tower had come down and the dust had thinned enough to walk, and I was making my way back toward the site past a line of carts the running crowd had trampled. At one of them a man I took to be an Arab immigrant was handing out water and soda to anyone who came by, and he would not meet anyone’s eye. I have thought about his expression for twenty-five years and I remain confident I read it correctly, because it was fear, and it was not fear of the buildings. He was worried the crowd was going to turn on him. I have worked alongside and played soccer with enough people from the Middle East to know that fear of exactly this kind of violence is a large part of why many of them came to the United States in the first place. His fear was understandable, but I do not believe he had anything to fear from that crowd, which had thinned considerably by then, and in the whole of that day I never heard a single person say a word against Arabs or Muslims. He handed me the tray and asked me to pass it around. On that morning, the person who stopped to help me was the one with the most reason to be afraid, and no one gave him one.
I was back in the office in Charlotte by nine o’clock the next morning, and one of the first themes I heard from the bond market analysts I spoke with that day was that American hegemony was coming undone. The question that followed was what that would mean for the dollar, for Treasury yields and for the willingness of the rest of the world to keep financing us. It was a strange thing to hear on September 12, 2001, because the United States had no rivals that morning. Russia was actively helping us. Vladimir Putin had been the first foreign leader to call the White House the day before, Moscow shared what it knew about Afghanistan, and it raised no objection when American forces began operating from bases in Uzbekistan and Kyrgyzstan a few weeks later. China was three months away from joining the World Trade Organization, its economy was roughly one-eighth the size of ours and its industrial resurgence had barely begun. The analysts were not wrong that the world would look different in twenty-five years, however. They were wrong about the cause. Whatever has changed in America’s standing since then was worked out in factories, budgets and elections over the following quarter century, and the men who flew those airplanes had no hand in any of it.
Like most Americans I followed the news more closely than usual in the weeks that followed. On October 7, the day the air campaign against the Taliban began, Al Jazeera aired a videotaped statement from Osama bin Laden in which he said that America had been struck “in one of its vital organs, so that its greatest buildings are destroyed.” Two things struck me watching it. The first was how much larger the plan may have been than what was carried out, and how much of it may have been stopped when every airplane over the United States was on the ground by early afternoon. The second was how little he understood about where American power comes from. It was never in the buildings. It is in the ability to create the institutions the buildings house, and to create them again when they are lost, and that ability rests on the country’s founding ideals, its system of laws and property protections, and the deep and liquid financial markets that al Qaeda had tried to drive a stake through that morning. The Treasury market was trading again on the 13th and the New York Stock Exchange, a few blocks east of the site, reopened on the 17th. Theodore Roosevelt was born on East 20th Street, about two miles north of the hotel, and in October 1912, standing before a crowd in Milwaukee with a fresh bullet in his chest, he told them that “it takes more than that to kill a Bull Moose” and went on to give his speech. It took more than that to kill this one, too.
The medical examiner’s office is still identifying victims. On August 24 of this year the New York City Office of Chief Medical Examiner announced that it had identified another one, an adult woman whose name was withheld at her family’s request, and that she was the first identified through forensic investigative genetic genealogy. She is the 1,654th of the 2,753 people killed at the World Trade Center to be identified by name. That leaves 1,099 who have never been identified at all, about 40 percent of the total, and the office has gone on re-testing remains as the science improves rather than close the case. Those families have now been waiting a quarter of a century for a telephone call. Anyone who wants to argue that the airplanes were not real, that the buildings were brought down by someone else, or that any of it was deserved, ought to be willing to make that argument in a room with the 1,099.
Appendix: Account of the Events of September 11
I woke up early that morning, probably around 6:30 am. I then got shaved and showered and packed my belongings so that I could go back up to my room during the break before lunch and gather my things so I could leave right after the last session of our conference. The last session was scheduled to end around 2:30 and I could take a taxi or bus to the airport afterward and easily make my 4:30 flight home.
After packing my suitcases, I left them by the desk in my room on the 18th floor. I then took the elevator down to the lobby and went to our breakfast session. I chose a seat at a table near the back of the room. That way I would be facing the speaker and could also escape quickly after the session. I had planned to take a friend of mine to the Krispy Kreme in the shops at the World Trade Center during the break. Hiroshi is an economist at Mitsui Bank in Tokyo and I only run into him about once a year at this conference. He had never had a Krispy Kreme doughnut and I joked with him that after tasting one he would give up economics and open a doughnut shop in Tokyo.
Our breakfast was about as normal as could be. Our speaker that morning was Robert Scott, who is president and chief operating officer of Morgan Stanley. His topic was the future of the financial services industry.
Shortly into his speech, probably around 10 minutes or so, we heard a loud boom. Not an alarming noise but something that caused everyone to look up. I thought maybe it was an air conditioner compressor exploding. Mr. Scott paused for a second and continued speaking. A few seconds later we heard a series of noises on the roof of the ballroom that sounded at first like machine gun fire and then several large bombs going off. We heard a series of crackling sounds and then three or four thunderous booms. Then the room shook violently, as if in an earthquake. The floor shook and the chandeliers on the ceiling swayed. There were a few isolated screams but for the most part people remained remarkably calm. Some folks ducked under the tables, others began to run for the door.
What we did not know at this time is that the impact of the aircraft had sent several large pieces of the north tower tumbling down directly on top of our meeting facility. Thankfully, none of them had pierced the ceiling and while all of us were shaken, we were still relatively safe.
I slowly walked out of the room and into the lobby. I assumed that someone had just bombed the World Trade Center but felt reasonably safe at that moment. Whatever had happened was apparently over and we were now dealing with the aftermath. As we walked out to the lobby, I saw people streaming into the lobby from the adjacent lobby of the north WTC tower. I also noticed that there were a few small fires on the stairway leading up to the plaza between the two WTC towers. Hotel staff quickly extinguished the fires, but smoke was coming into the lobby from the plaza area.
There were a few security guards by the front door, and they were not letting anyone leave the building. Obviously, the staff at the Marriott thought that we would be in even more danger if we had left the building at that time and they were right.
A few people tried to sneak by hotel staff and I even walked close to the window to see what was out there. At that point I saw a few huge pieces of concrete and steel tumble down on the street and all sorts of other debris. The security guards then yelled for everyone to get away from the windows. But there really was not anywhere to go. The lobby was not very wide, and smoke was coming in from the second floor and also from the lobby of the tower next door.
I began to worry that the crowd might storm the door, so I made my way back to the wall on the other side of the lobby. It then dawned on me that there might be other bombs, maybe even in the room right behind me. But what could you do other than wait?
Finally, after what seemed like an eternity but was probably only about five or ten minutes, the hotel staff led us out a side door. At that time, one of the first fire trucks was arriving on the scene. I still could not see what had happened and did not know where to go. So I followed the crowd across West Side Highway. As we ran across the street we saw all sorts of debris and then I realized that some of that debris was actually body parts.
I still could not see what had happened though. There was a demolished and burned out bus right in front of the entrance to the north tower. Was that what had caused this? As I got about halfway across the median we could see and hear the roaring fire at the top of the World Trade Center. There was no way a bomb on a bus could have done that.
My next thought was that I needed to find a phone and call my wife Amy. Other than my mother, she was the only person that knew I was staying at the World Trade Center. I knew that the phones would seize up any minute and remembered seeing a deli in the Battery Park area. I ran to that deli and asked the man behind the counter if I could use his phone.
I then called Amy at her office. I told her that someone had just bombed the World Trade Center and that hundreds of people had been killed. I told her that I thought they would close the airports and that it would be tough to get out of there. Then I told her to call my office and let them know I was o.k. and that I would try to get back to Charlotte the best I could. There was a line of people waiting to the phone so I told her that I would try to call her later that day.
She had not heard about the attack and was surprised and asked if I was certain of what I was saying. She said she had just gotten out of a meeting and had seen several people crowding around the television and thought folks might be watching a sporting event. After hanging up, the man behind the deli counter told me it was not a bomb but that someone had flown a plane into the World Trade Center. He said he had seen it. He said it was a huge plane, like a 747.
My reaction was surprise. The fire honestly did not look big enough to have been caused by a plane. That is probably because the fire was so high up. I then went out of the shop and looked up at the tower and ask a few people what they had heard. We then began to see people jumping from the building. That was a very frightening and weird thing to see I did not really want to watch it.
The first time I saw someone jump from the building I got this sick feeling in my stomach that seemed to rise right up through my chest. It felt the same way my stomach felt after hearing of the death of my father and I really did not want to watch it. But part of me also felt that I needed to watch it. Someone needed to bear witness to these needless deaths, and I felt I was paying some sort of respect to them to watch in silence.
After about five or ten minutes I could not watch it anymore. I began to walk away and then someone called my name. I assumed he was from the conference. He asked me what I had heard, and I said I heard it was an airplane. He then said no, what did you hear in the building. “You were at a conference, right?” “What conference?”
It then dawned on me that he was a reporter and interviewing me. I still had my National Association for Business Economics badge on from the conference. So, I then told him what I heard and who I was and where I was from. Before we could finish, we heard a loud screaming sound. I thought it was a missile. But we couldn’t tell where it was coming from or where it was headed because it was echoing off of all the other buildings.
We then heard a loud explosion and saw the reflection of the plane hitting the South tower off the glass of the building next to us.
We instinctively hit the ground and sprang right back up. The building was only about 500 feet away from us and we could see debris coming our way. We ran around the corner of the Wall Street Journal building and then stopped for a minute.
Another reporter came out of the building and told us that there were at least seven planes unaccounted for and that they thought more might be headed our way. Someone else said, the terrorists were trying to kill as many people as possible. Why else would they have waited until the building was evacuated and the streets were packed with people?
Another person, apparently reading from his pager, said that this was the work of Osama bin Laden and that at least 12 more planes were headed our way and that the Newark Airport was just 30 seconds flying time away. At that time, the area around us seemed to be in complete pandemonium. People seemed to be running in every direction. I asked someone where we should go and they said head for the George Washington bridge. Then someone else said, no that might be the next target. So, I asked about the Battery Park and someone said no that’s not safe they might hit the Statue of Liberty. With my limited knowledge of New York City geography, even I could figure out that there was a sizable river between Battery Park and the Statue of Liberty. I decided to head for the park.
On the way down there, I saw an elderly lady who did not know what was going on. So I stopped running and started walking with her toward the park. She kicked off her shoes so she could keep up with the crowd and I carried them for her. She found a friend of hers who said they were going to take the ferry to Staten Island. She told me I should come too. I decided not to go, still thinking I could make it to Midtown and possibly hitch a ride back on our company plane or at least camp out in our corporate condo.
I tried to make it back over the West Side Highway about eight blocks south of the WTC but the police and fire department would not let me. They told me to go back to the park and wait to be evacuated. I caught up with another reporter that I had met earlier at our conference, Drew Ward from Bloomberg. He didn’t have any shoes on. He told me he left straight from his hotel room without his shoes on. I told him we should go somewhere that we could sit down and we made our way to the park and found a bench that faced the Trade Center. We began talking about our experiences for just a few moments and then suddenly we saw the south tower begin to collapse. The building fell right over the top of the Wall Street Journal building onto the very place that I had just run from. We then saw thousands of people running our way and a huge cloud of smoke and dust behind them. Our immediate worry was the crowd might trample us so we got up and ran toward the waterfront.
We got separated as we ran. I tripped over a concrete planter and went flying on the concrete. Aware that I was in the midst of a panic I jumped right back up and continued to make my way toward the river. There was a ferry docked in the park and people were running and jumping onto the boat. I didn’t want any part of that panicked crowd and stayed put right on the river’s edge. There was a guy standing next to me that said he was in the training class at Morgan Stanley. He told me, which turned out to be incorrect, that he feared his entire class had been killed. He said he had been in the mall in the lobby of the trade center when the plane hit because he had an upset stomach and was going to buy something for it.
The smoke and dust from the collapse of the south tower began to make its way toward us. The smoke moved very slowly and was incredibly thick. It had the consistency of the dust that is generated when you sand a piece of dry wall in an unventilated room. We took off our jackets and used them as masks. They didn’t work all that well but that is all we had.
After about five minutes we heard another jet echoing off the towers. A few people began to cry and scream and I told the fellow from Morgan Stanley that even if the plane hit the building directly behind us we should still have a few seconds to jump in the river. He told me he couldn’t swim. And then I told him that if we had to jump to grab the wall of the bulkhead but not to grab me because he would drown us both.
In a few seconds we were both relieved to see it was one of our military jets that was apparently sent to intercept the second plane or any other planes headed in our direction. After running for your life it is hard to describe the emotion you felt upon seeing that jet. We couldn’t tell if it was the Navy or the Air Force but it was certainly a welcomed sight. The military wasn’t just protecting our nation they were protecting us right at that very moment.
After seeing the military jet we felt that there probably would not be any more attacks in Manhattan. As the smoke began to clear, a small police boat made its way toward us and asked us to walk back toward the World Trade Center. The policemen said the air was clearer that way. He also said if you feel safe where you are, stay there, but that the air was a little clearer just a few hundred yards away.
We began to walk back toward the World Trade Center and just as the officer had said the air was clearer. Several of the pushcarts that were in the area had been completely demolished as people had run over them on their way to the park.
At one cart, what appeared to be an Arab immigrant was handing out cokes and bottled water to anyone that came by. The look in his eyes seemed to be one of fear and apprehension. I couldn’t help but think that he thought the crowd might attack him. I thought that he probably felt the same way Japanese immigrants felt in Hawaii after the Japanese attacked Pearl Harbor. He gave me a tray of water bottles and asked me to pass them out. I took one bottle and then took the tray back toward the crowd.
As we made it back to where we had been standing we began to hear some incredible tales. One said that a plane had been shot down outside the White House and was in flames on the White House lawn. Another said the Pentagon had been hit. And yet another said that trading on the New York Stock Exchange had been delayed. The word delayed sent off a little nervous laughter from the group. I asked one of the guys that was reading news off his beeper if I could see it. Sure enough, all those stories really were on there.
As we waited for another boat we began to talk. I mentioned that I was trying to get back to Charlotte and a lot of the folks began to offer me suggestions. I also said I had a sister who lived in Hoboken and that I might try to get over there and come up with some sort of plan from there. Another ferry to Staten Island came over and much of the crowd got on that boat. The fellow from Morgan Stanley said he was going to stick around for another boat too. He wanted to get to Jersey City.
A few minutes later, we wished we had gotten on that boat. The remainder of the south tower collapsed and once again we were engulfed in smoke and dust. This time we were better prepared. We dumped some water on our suit jackets and used them for masks. This seemed to work fairly well and we made it through the second cloud in relatively good shape. We also knew to move back toward the World Trade Center so that we could get to the clearer air as soon as possible. After the second cloud hit us we decided to take the next boat wherever it was headed. But the next boat was some sort of workboat and I didn’t like the look of the guys on it. I asked them where it was headed and they said in that charming New York type of way “what do you care anyplace is better than this buddy.” I pressed them and they finally relented that the boat was headed to Ellis Island. Why on earth would I want to go there? Several others felt the same way and the boat nearly tipped over as people rushed to get back off.
Several others though still wanted to leave, including one older apparently homeless man, who looked so shaken by the day’s events that the fellow from Morgan Stanley grabbed a twenty dollar bill out of his wallet and stuffed it in his shirt pocket as we helped him onto the boat.
After that boat left, this fellow from Morgan Stanley told me that these attacks had truly changed him. Before today all I wanted was to make a lot of money, like ten million dollars or so. Now I just want to make a million or two and get out. I thought he was joking but he was serious. It was only a conversation you could have in Manhattan.
We thought another boat would come any minute and there were only a few hundred of us left at riverbank. But no boats came. More people began to arrive with suitcases and other belongings they were bringing from their nearby condominiums. A woman came up to us and said that boats would come and take us to Jersey City and that they would meet us at the dock a few hundred yard south of the Park.
As we began to walk toward the ramp, we heard and felt the rumble of the north tower collapsing. Once again we were engulfed in smoke and dust. But this time it was far worse. The wind had died down and the cloud move much slower. We were in total darkness for at least ten minutes and this time I actually began to get scared. It was very hard to breathe and there was nowhere to go.
Suddenly I felt a sharp pain in my ankle. I looked down and the woman who had directed us to the dock was at my feet in a fetal position and her fingernails were grinding into my ankle. She didn’t have anything covering her mouth or nose, so I knelt down and covered both of us with my jacket and told her to use the jacket as a mask.
By the time the smoke cleared we were both gasping for air and we shared what was left of the water I had. This time I vowed to take the next boat even if it was going to Ellis Island. But still there were no boats. A few ambulances began to arrive and they carried folks that were wounded into the park. The police told us that the next boats would be taking wounded people off first and that we would have to wait a while longer to be evacuated.
As we waited we saw a young fireman make his way toward us. He looked like he was eighteen years old and he was visibly sobbing. One guy tried to console him and few others said he may have just lost all his friends or family. As much as I wanted to go over and say something to him I knew I couldn’t. There was nothing I could say.
Fortunately, a tugboat came by a few minutes later and we were able to board. By that time I was so shaky I actually had to be helped aboard. As we made our way across the Hudson River we rode out toward the Statue of Liberty and then cut back across toward Jersey City. We could then see the smoldering remains of the World Trade Center.
When we got to Jersey City, Red Cross workers were waiting for us with water and towels. I had blood on my hands from my fall earlier in the day and they encouraged me to go to their shelter, where I could get cleaned up. As we left the dock, we could see that Jersey City was set up as an enormous staging area, where the wounded were being flown in by helicopter or taken off boats. The shelter itself was in the activity center of an apartment complex in Jersey City. As you walked in, someone took your name and the name and phone number of someone they could contact to let them know you were safe. I went into the restroom area and tried to wash the soot off my face and wipe it off my clothes. I then went back out and got the cuts on my hands cleaned up and tried to call my wife again. I had very little luck on the phone but eventually got through to her for about 30 seconds. I told her I was going to try to get home the best way I could and would start walking south and see if I could catch a ride on a bus or a train.
After I left the shelter I told the woman at the door that I was trying to get to Charlotte and asked her if she had any idea how I could get there. She thought I was nuts and told me that I was better off at the shelter. Finally I persuaded her to tell me how to get to Hoboken. From there I could catch a train to Newark and from there I could catch a train to somewhere south of here, where I might be able to get a bus or rental car. She told me to start walking south and that I would end up in Hoboken.
The streets were deserted and I seemed to be the only one walking south. Maybe this was a crazy idea. Finally, I saw a small school bus of Red Cross volunteers. I put out my thumb and they picked me up. They were headed to Hoboken too. As we got closer to Hoboken, the activity grew much more intense. There were police cars and ambulances going all over the place and we actually got hit by a police vehicle. The policeman was driving an SUV and it ripped off the front bumper of the bus. We all got out of the bus and started walking again. By around 2:00 I made it to the Hoboken train station.
The train station was a madhouse too. I asked one of the policemen how I could get to Newark. He took one look at me and asked me if I was coming from Manhattan. I said yes and he walked me over to a train platform and filled me on what was going on. He said that very few people had made over from Manhattan and that I was lucky to have gotten on one of those tugboats. They were not selling tickets for the train that day. You just got on. When I got on the train I met a few people that were sitting near me. One guy asked if I was at the Trade Center. I said I was at the Marriott Hotel right next to it. He said he knew the area well and had customers there.
As we began talking, he asked me where I was headed. I told him Charlotte. Then he asked how I was planning on getting there. I told him there was one Amtrak train that went to Charlotte but I didn’t know when it left. He then introduced himself and gave a business card so I wouldn’t think he was some kind of nut that would butcher me. I hadn’t really been worried about that. His name Bob Neubaum and he was an account representative from Sprint. He said he would call his wife and have her find out about the train but he suggested that I ride back with him to Princeton and just rent a car. He said he took his family to Myrtle Beach every year and I could get there quicker in a car. He said he could ask his wife to reserve a car for me in Princeton or even Philadelphia if she had to. That sounded like a great plan to me, so I thanked him and said yes, please do that.
The train from Hoboken does not actually go to the Newark station. We had to get off the train at 52nd street and take a bus to the Newark station. That was relatively simple. But as our bus pulled into the Newark station a policeman stopped us. He got on the bus and asked if anyone on the bus had been at the Trade Center. We were sitting right at the front of the bus and the officer looked right at me and I said yes, why? He told me that the whole bus would have to be decontaminated. I asked from what? He said he didn’t know. I began to fear that I had been exposed to either chemical or radioactive material. Fortunately, all they wanted to do was wash my shoes off, so I didn’t track any of the dust from the Trade center anywhere else.
At Newark we were able to quickly get a train down to Princeton. Once we got on the train Bob asked me why I needed to get back to Charlotte so quickly. I told him that I had a meeting in Charlotte at 9:00 am the next morning and planned on being there. But don’t you think they will cancel it, he asked. I told him that I doubted it but even if they did I needed to begin to analyze what these attacks would mean for our economy.
He asked me how on earth I was going to do that. I told him that you simply have to figure out the property losses, assign a value to business that was lost on a permanent basis and then try to figure out how the economy will be changed going forward. I told him we had done it for hurricanes and earthquakes and even the earlier attack on the World Trade Center.
After that, one of Bob’s co-workers asked me if I thought the terrorists attacked us because of all the wealth we have. I told her that was an easy one to answer. No. They attacked us because of the freedom our society enjoys and advocates. Freedom takes their power away. Osama bin Laden and the Taliban were relying on fear to hold on to their power and attacking us would make their followers and the leaders of other Muslim countries even more fearful of them.
By around four o’clock we made it down to Princeton. Bob’s wife and children met us at the train. We rode back to the town of Princeton and tried to find a clothing store where I could buy some clean clothes. Everything was closed though so we headed to the rental car agency and I picked up a Pontiac Sunbird and followed Bob and his wife back to their home.
Once we got there Bob found a shirt that he had gotten from a vendor and told me to go take a shower and he would try to get a pizza for us for dinner. After I got out of the shower Bob and his wife seemed to be very concerned about something and then Bob told me that they had just found out that one of their close friends was on the plane that crashed in Pennsylvania. He showed me a picture of the fellow. Bob said he worked for Oracle Corporation and his name was Todd Beamer. They had taken a family vacation down to Mexico together just recently.
At that time, the name Todd Beamer was just another victim. It was only the next day or maybe even a few days later that I found out about Todd’s heroics on that plane. We sat down to dinner and Bob’s wife said a brief prayer. Being Jewish, I am always a little uncomfortable when I am at someone else’s table for dinner. We don’t pray in Jesus’ name we simply pray to god but on this night I was willing to take whatever prayer was offered.
By seven o’clock I was on the road to Charlotte. Bob had given me directions to I-95 and from there it was fairly smooth sailing. I turned on the radio in time to hear Congress gather on the steps of the Capitol to sing My Country ‘Tis of Thee. All the way home I listened to reports from New York and wondered if everyone from my group had made it out. Fortunately, they did. By 5:30 am, I was back at home in Charlotte and by 9:00 am back in the office. I was running a bit late that morning. The meeting was still on and, unaware of my journey the day before, they were wondering why I wasn’t there yet.
Mark P. Vitner
President & Chief Economist, Piedmont Crescent Capital
mark.vitner@piedmontcrescentcapital.com · 704-458-4000
Sources: New York Marriott World Trade Center building and casualty detail, FEMA 403, Chapter 3. NABE 43rd annual meeting, September 9-11, 2001, contemporaneous attendee accounts. NIST NCSTAR 1 (September 2005) and NCSTAR 1A (November 20, 2008), and the NIST WTC investigation FAQs. Recovery of a Boeing 767 wing section at 51 Park Place, NYPD, April 2013. Flight 93 telephone call count, FBI, via the National Park Service, Flight 93 National Memorial. YouGov, “Which conspiracy theories do Americans believe?”, fielded November 9-13, 2023, n=1,000. M. J. Wood and K. M. Douglas, “What about Building 7?”, Frontiers in Psychology, 2013. Hasan Piker remarks of August 2019 and his August 22, 2019 response, as reported contemporaneously. “Letter to America” video and view counts, NPR and TIME, November 2023. Victim identification announcement, New York City Office of Chief Medical Examiner, August 24, 2026. This essay is published by Piedmont Crescent Capital. Views expressed are those of the author.
The Piedmont Perspective | The Umpire Defines His Strike Zone
The Umpire Defines His Strike Zone
The Piedmont Perspective
Chair Warsh told the market at Jackson Hole to play the ball and not the referee. Six days later Governor Waller answered that nobody can play the ball until they know the strike zone, and then he called his. The pitch that decides September arrives on the 11th, and the Committee’s real disagreement is over who is standing behind the plate.
The Argument in Brief
- Two speeches, opposite answers. Chair Warsh retired forward guidance at Jackson Hole and declined to describe a reaction function. Six days later Governor Waller agreed guidance belongs at the zero bound and nowhere else, then explained why a reaction function is a different thing and published his.
- The zone is narrow enough to be useful. If August inflation shows continued progress, Waller holds at 3.50% to 3.75% on September 16. If it comes in hot, he would consider a hike. His vote turns on the inflation data, not the jobs report.
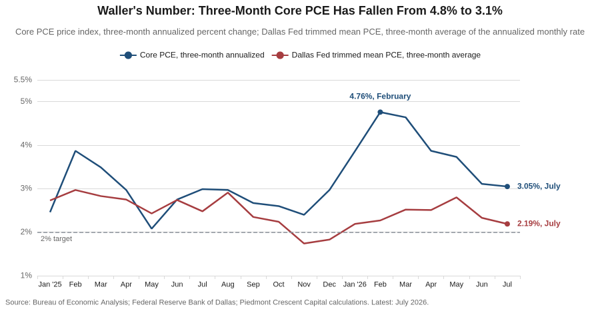
- We share his reading of the July price data. Three-month annualized core PCE has fallen every month since February, from 4.76% to 3.05%, and is converging on the trimmed mean. Roughly half of July’s core increase came from prices that are imputed and never paid.
- Where we part company is on how much restraint is already in place. Waller sees policy as only slightly restrictive. We think the 2-year at a one-year high, mortgage rates back at 6.71% and single-family starts at their lowest since 2022 say the long end is already doing the Committee’s tightening.
- Twelve reaction functions are not a reaction function. Four voters called pitches in one week and September hike odds swung from 63% to 50% to 65% to 58%. Every reaction function is ceteris paribus, and the batter’s box moved between every pitch.
- The call, with dates. August core CPI at 0.2% or below on September 11 means a hold on the 16th. Core at 0.3% or above with core goods at 0.4% or more makes a September increase our base case that morning. Our house call is unchanged: hold in September, first increase December 9, one more in 2027 to a terminal 4.00% to 4.25%, and we own the tension between that date and Waller’s framework.
Two speeches six days apart asked the same question and gave opposite answers. The question is what a central bank owes the public about its own future behavior. Chair Warsh answered from Jackson Hole on August 28 that it owes a standard and nothing more. He retired forward guidance as a crisis legacy that “has overstayed its welcome,” declined to describe a reaction function, and closed with a line that has been quoted more than anything else he has said in office: “I stand here today committed to a discipline, not to a decision.” Governor Waller answered from a Reuters interview on September 3 that a standard is not enough. He agreed that forward guidance belongs at the zero bound and nowhere else, then spent the second half of his remarks explaining why a reaction function is a different thing, why he intends to keep publishing his, and what his looks like right now.
Waller’s framework separates three things that get lumped together as “guidance,” and the distinction is the most useful part of the speech. The first is explaining the vote just taken, which every policymaker does. The third is forward guidance in the strict sense, a path for the policy rate that is “essentially independent of incoming data,” and he confines it to the effective lower bound. He cites his own record: in September 2021 he supported guidance that signaled the end of asset purchases, and by March 2022 the 2-year Treasury yield had risen 200 basis points before the funds rate had moved at all. The second thing sits between them. A reaction function is a conditional statement, “IF the data comes in a particular way, THEN I will advocate for policy to be set a particular way,” and he was emphatic that “it is not a commitment to a policy action.” It is a description of how he will read the data he has not seen yet.
Then came the umpire. “The pitcher is trying to strike out the batter, and the batter is trying to hit the ball or walk to get on base. Both want to play the ball, but they cannot do that until they know the umpire’s strike zone.” The players do not need a perfect zone. They need “a rough idea of its parameters and some guarantee that it won’t change much on every pitch.” It is a direct reply to the Chairman, who has spent his first year telling market participants to stop watching the referee, and Waller drew the contrast himself when asked about it. A referee whose calls cannot be anticipated is not a discipline. He is noise.
So he called his zone, and it is narrow enough to be useful. If the August inflation data due over the next two weeks show “continued progress toward our 2 percent goal,” he will support holding the funds rate at 3.50% to 3.75% on September 16. If the data show the improvement “has been fleeting,” if inflation “comes in hot,” he “would consider a rate hike,” and he framed that as “a small adjustment in our stance.” He also told us how much weight each report gets. The employment data, he expects, “will not deviate much from what we have been seeing,” so his vote “will be heavily influenced by what we learn about August inflation.” In the interview he put it in a phrase that will outlast the speech: “To paraphrase John Lennon, I’m willing to give disinflation a chance.”
What sits inside his zone is a specific reading of the July price data, and it is a reading we share. Twelve-month PCE inflation is 3.7% and core is 3.3%, and he set both aside as “not the best guide for where inflation is today.” His number is the three-month annualized core rate, which has fallen every month since February, from 4.76% to 3.05% in July. Figure 1 plots it against the same three-month window on the Dallas Fed’s trimmed mean, which discards the extremes from the same basket and has run between 2.2% and 2.8% all year. The two lines are converging from above, and the direction is the argument. He then went further than any Committee member has in print this year. Roughly half of July’s core increase came from nonmarket services, prices that are imputed and never paid, and “ignoring this one factor, my take is that underlying inflation is doing better than the core numbers suggest.” He expects a pending Commerce Department change in how the fees paid to portfolio managers are estimated to take “a few tenths” off the twelve-month rate.
That is the same divergence we measured last week from a different direction. Core PCE is running more than a full point above its own trimmed mean, the widest gap since April 2022, and 0.87 points above core CPI, a relationship that has run the other way for most of the past sixty years. The categories carrying the gap are medical care, airfares and the asset-linked fees Waller named. A governor arriving at the same place from the headline series and a private economist arriving from the trimmed means is about as much corroboration as an inflation argument gets in real time. On the labor market, he and we also agree on the frame. Job growth of 60,000 a month through July, and roughly 80,000 with August and the revisions, is “close to and probably a bit above” what a labor force barely growing can absorb. Friday’s 162,000 does not disturb that. Two categories with distorted summer seasonals, restaurants and school districts, supplied 104,000 of it, and the three-month average of 71,000 is the number to carry.
Where we part company is on one clause, and it is the clause that decides how expensive a mistake would be. Waller judges that “policy is currently only slightly restricting aggregate demand, and it may not take much acceleration in inflation to nudge me into supporting tighter policy.” We think the restraint is larger than that, and we think it has been arriving without the Committee lifting a finger. The funds rate is 175 basis points below its August 2024 level. Over the same two years the 10-year Treasury has risen 81 basis points and the 30-year mortgage rate 17, on monthly averages, and this week the 2-year closed at 4.37%, its highest in a year, while Freddie Mac’s survey rate moved back up to 6.71%. Single-family starts fell to 808,000 units in July, the fewest since November 2022, and residential investment is subtracting from growth for the balance of the year. Core goods prices are up 0.8% over twelve months and new vehicle prices 0.5%. The maturities that price houses, plants and refinancings have tightened while the policy rate fell, which is restraint by any definition a borrower would recognize. The practical difference is this: if Waller is right about the cushion, the August CPI carries most of the decision; if we are right, a September increase would be adding restraint to channels that are already carrying the adjustment, and the cost of being wrong in that direction takes a year and a half to show up.
The pitch itself arrives Friday, and the strike zone tells us what to watch. The consensus for the August consumer price index is 0.4% on the headline and 0.2% on core. We published our own threshold on August 30 and it stands: a core reading at or above 0.3%, particularly with core goods above 0.4%, would mean the refining shock has reached the goods basket and would make a September increase the base case. Below that, Waller’s zone calls a ball, and so does ours. The evidence on pass-through this week leaned his way. The ISM prices indexes printed 71.1 in manufacturing and 72.6 in services, which say that seven in ten purchasing managers paid more in August, and the Beige Book said in nearly every District that firms are absorbing those costs, with Richmond reporting input price growth just above 7% against prices received “relatively unchanged.” That is a margin squeeze, and it is the mechanism behind Waller’s observation that his “earlier worry that higher energy prices would bleed into many goods and services prices hasn’t come to pass, at least so far.” The qualifier is doing real work. Margins are finite, and the place a hot number is more likely to show up first is Thursday’s producer price index, not Friday’s CPI.
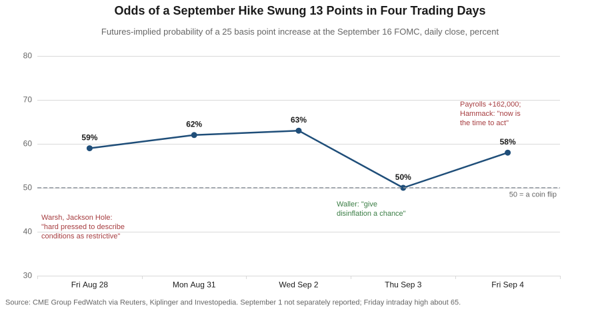
Now the cost of a strike zone, which the Chairman understands better than his critics allow. A committee has twelve umpires, and three of them called pitches in the same week. Governor Barr on Tuesday: act “decisively” if inflation is not moderating sufficiently, otherwise “take a bit more time.” President Williams on Wednesday: “no clear signs right now” whether the stance is sufficient. Waller on Thursday: give disinflation a chance. President Hammack on Friday, after the payroll report: “Now is the time to act. There’s no tension in the mandate. Policy isn’t restrictive.” The market repriced on every one of them. Futures-implied odds of a September increase went from 59% after Jackson Hole to 63% on Wednesday, to 50% after Waller, to roughly 65% in the minutes after Friday’s payroll print, and settled at 58% (Figure 2). The 2-year yield moved 4 to 6 basis points on each turn. Four conditional statements from four voters, each internally consistent, add up to a path by another name, and a noisier one than any dot plot. The reason is the clause every reaction function leaves unspoken: ceteris paribus. Each voter described what he or she would do if nothing else changed, and in the same five days Brent rose 9%, payrolls printed 162,000, Canada retaliated and two tankers were hit in the strait. A strike zone is stable only in a stationary batter’s box, and this one moved between every pitch. Warsh’s objection to reaction functions is not that they are wrong. It is that twelve of them are not a reaction function; they are a rumor.
The benefit is the other side of the same coin, and Waller’s own history lesson makes the case for him. His 2022 example was a market that tightened 200 basis points at the front end before the Committee moved, because the Committee had told it what was coming. Look at 2026. The Committee has told the market nothing about the path, and the 2-year has risen 90 basis points since January while the funds rate sat still and the 3-month bill moved 26. The front end has walked to the house call, a first increase after the midterms, without a word of guidance and without the Committee doing anything but describing its strike zone one voter at a time. That is the discipline Warsh asked for, delivered by the market, and it is a large part of why we think September can wait. The part of the curve no reaction function reaches is the long end, where the 30-year at 5.24% has priced a term premium for a fiscal deficit, an energy shock and a private credit boom, and that is doing the tightening the Committee would otherwise have to do itself.
The honest test of any strike zone is to apply it to your own forecast, and ours does not pass it cleanly. We carry core PCE inflation at 3.1% for 2026 and 2.7% for 2027, which is continued progress by Waller’s definition every quarter of the way. Applied to that path, his zone calls a ball in September and a ball again in December. Yet we expect the Committee to raise the funds rate on December 9, the first meeting after the midterms, and hold it at 3.75% to 4.00% before one more increase in 2027. The two views reconcile only if the December majority is judging by a different zone, and we think it is. Warsh’s standard is that underlying inflation must be moving to target “clearly and at sufficient speed,” which is a statement about speed as well as direction. The three July dissenters and Hammack are judging by the level: 64 months above target, averaging 4.0%. Our December call rests on the majority weighting level and speed over the trend, and on a Chairman who has said he cannot describe conditions as restrictive. If Waller’s zone is the Committee’s zone, our first hike is too early, and the argument for December becomes the argument for the spring. We would rather say that plainly than pretend the framework and the forecast agree.
So the falsifiable version, with dates. If August core CPI on September 11 prints 0.2% or below, the Committee holds on September 16 with no more than the three July dissents, and Waller votes with the majority. If core prints 0.3% or above with core goods at 0.4% or more, we move a September increase to our base case that morning, on the rule we published a week ago, and Waller’s zone gets its first real test of consistency: a hold vote after a hot print would mean the zone moved on the pitch, which is the one thing he promised it would not do. Either way the September meeting is the pitch, the umpire has shown where the zone is, and a batter who cannot hit a strike down the middle has no complaint about the umpire.
Our call is unchanged. We expect a hold on September 16 and we think the Committee should hold. We carry December 9 as the first increase, with one more in 2027 to a terminal 4.00% to 4.25%, and we own the tension between that date and the framework we have just praised. The condition that would move us on the whole path is the one we set in August and it has nothing to do with the strike zone: two or three more months of core services outside of shelter near 0.4% with shelter no longer decelerating. Until then, the disagreement inside the Committee is less about where the zone is than about who is umpiring, and on Friday the market decided that is a question worth 58 cents on the dollar.
Mark P. Vitner
President & Chief Economist, Piedmont Crescent Capital
mark.vitner@piedmontcrescentcapital.com · 704-458-4000
Sources: Christopher J. Waller, “The Economic Outlook and Some Comments on My Policy Communication,” Reuters NEXT Newsmaker Interview, Washington, September 3, 2026, and the interview with Howard Schneider that followed; Kevin Warsh, “In Our Time,” Jackson Hole, August 28, 2026; Michael Barr, remarks of September 1; John Williams, CNBC interview, September 2; Beth Hammack, statement of September 4; U.S. Bureau of Economic Analysis, Personal Income and Outlays, July 2026; Federal Reserve Bank of Dallas, Trimmed Mean PCE Inflation Rate; U.S. Bureau of Labor Statistics, Employment Situation, August 2026, and Consumer Price Index, July 2026; Institute for Supply Management, August 2026 manufacturing and services reports; Federal Reserve Board, Beige Book, September 2, 2026; U.S. Department of the Treasury, daily par yield curve; Freddie Mac, Primary Mortgage Market Survey; CME Group FedWatch as reported by Reuters, Kiplinger and Investopedia; Piedmont Crescent Capital, “A Wider Gap, a Narrower Problem,” September 2026. Three-month core PCE is the annualized change in the index over three months; the trimmed mean comparison is the three-month average of the Dallas Fed’s annualized monthly rate. This commentary is published by Piedmont Crescent Capital for informational purposes only and does not constitute investment, legal, or tax advice. Views expressed are those of the author as of the date of publication and are subject to change.

Four Umpires, One Pitch | A View from the Piedmont
A View from the Piedmont — Our Weekly Commentary on Money, Credit, Exchange Rates & Geopolitics
Four Umpires, One Pitch
Governor Waller gave the market the strike zone Chair Warsh withheld, three colleagues called their own in the same week, and the front end repriced on every one. The August jobs report delivered the print we said the calendar owed us, and its composition argues for a hold. Hormuz escalated for real, and this week the bond market priced it as inflation. The pitch that decides September is the August CPI on Friday.
Market Dashboard
| Indicator | Level | This Week | Indicator | Level | This Week |
|---|---|---|---|---|---|
| Fed funds target range | 3.50 to 3.75% | Unchanged | S&P 500 | 7,718.60 | +0.1% |
| 2-year Treasury | 4.37% | +3 bp, 52-week high | Dow Jones Industrial Average | 53,414.25 | -0.3% |
| 5-year Treasury | 4.54% | +6 bp | Nasdaq Composite | 26,506.99 | +0.4% |
| 10-year Treasury | 4.78% | +5 bp | Brent crude, November | $96.28 | About +9%, October expired |
| 30-year Treasury | 5.24% | +2 bp | WTI crude, October | $91.48 | +9.7% |
| 2s-10s spread | 41 bp | +2 bp | Gold, December settle | $4,476.60 | -1.2% |
| 2s-30s spread | 87 bp | -1 bp | High yield OAS, Thursday | 265 bp | +2 bp |
| 5-year TIPS breakeven | 2.37% | +7 bp | Retail diesel, EIA, Aug. 31 | $5.599 | -5.3 cents; AAA record $5.85 Friday |
| 10-year TIPS breakeven | 2.35% | +4 bp | Distillate stocks | 104.2 mn bbl | 14% below 5-year average |
| 30-year fixed mortgage | 6.71% | +5 bp | Nonfarm payrolls, August | +162,000 | vs. 55,000 consensus |
| Sept. 16 hike odds | 58% | 63% Wed., 50% Thu. | ISM services prices paid | 72.6 | +2.3 points |
Treasury yields, real yields and implied breakevens are the official daily par yield curves for Friday, September 4; weekly changes are against August 28. Breakevens are the nominal par yield less the real par yield at the same maturity. Equity, energy and metals levels are Friday closes; gold is the COMEX December settlement. The October Brent contract expired August 31, so the weekly change on the November contract is approximate. Credit spreads are ICE BofA option-adjusted through Thursday. Hike odds are CME futures-implied as reported at the close; the intraday high after Friday's payroll release was about 65%.
Summary
- Governor Waller called his strike zone, and it is the reaction function Chair Warsh declined to give. Hold on September 16 if the August inflation data show continued progress; a "small adjustment" higher if they come in hot. Employment, he said, "will not deviate much" and is "not a large factor" in his vote. "To paraphrase John Lennon, I'm willing to give disinflation a chance." Futures took September hike odds from 63% to 50% within the hour.
- The August jobs report landed the call we published on August 10. Payrolls rose 162,000 against a consensus near 55,000, and June and July were revised up a combined 55,000. Two categories with distorted summer seasonals, restaurants and school districts, supplied 104,000 of the gain. The three-month average of 71,000 is the number to carry, hours worked jumped, wage growth slowed to 3.1%, and nothing in the report argues for moving in September.
- Four FOMC voters used their last public appearances before the blackout to describe four different reaction functions, and the front end repriced on each. Barr Tuesday, Williams Wednesday, Waller Thursday, Hammack Friday ("Now is the time to act. Policy isn't restrictive."). September odds ran 59, 63, 50, 65 and settled at 58. The 2-year closed at 4.37%, a 52-week high, and is up 90 basis points this year while the 30-year is up 38. The market has walked to the house call without a word of guidance. One reminder before anyone trades a reaction function: every one of them is ceteris paribus. Each voter told us what he or she would do if nothing else changed, and in the same week oil rose 9%, payrolls printed 162,000 and Canada retaliated. The conditions moved faster than the conditionals.
- The war in the Gulf escalated for real, and this week the bond market priced it as inflation. After the Larak Island strike, the United States hit roughly 100 targets on Tuesday and, for the first time, two Iranian government tankers. Iran hit bases in Jordan, Kuwait, Bahrain and the Emirates, and two Saudi-chartered VLCCs were struck in the strait, killing two crew. WTI rose 9.7% on the week, retail diesel set a record $5.85 on Friday, and the 5-year breakeven added 7 basis points. Last week's selloff was real rates. This week's was inflation compensation.
- Prices paid are rising faster than prices received, and the Beige Book says firms are eating the difference. ISM prices indexes printed 71.1 in manufacturing and 72.6 in services, while Richmond reported input costs growing just above 7% against prices received "relatively unchanged." That is a margin squeeze, and it is why Waller can say energy has not bled into goods and services "at least so far." The qualifier is the risk.
- Activity is fine and the import wedge is back. ISM services 55.4 with business activity at 61.7, its highest since November 2022; ISM manufacturing 54.6 with new orders and backlogs both down three points; GDPNow at 4.7% for the third quarter. The July trade deficit widened to $88.6 billion on a $14.4 billion jump in capital goods imports, most of it computers and accessories. The AI buildout inflates domestic demand and subtracts from GDP in the same month, again.
- Washington and the trade file both moved. Canada's counter-tariffs on C$27.6 billion of U.S. goods take effect at 12:01 a.m. Tuesday. The continuing resolution through December 11 is law, so the fiscal fight lands on the December 8 and 9 FOMC. The G20 chair's statement from Asheville called for "free, safe, and predictable navigation through the Strait of Hormuz," with China dissenting from four paragraphs. Witkoff and Kushner were in Moscow Saturday.
- Our call: hold on September 16, first increase December 9, one more in 2027 to 4.00% to 4.25%. The pitch is Friday's CPI. Core at or above 0.3% with core goods at 0.4% or more moves a September increase to our base case; anything less and the Committee holds with no more than three dissents.
Our Central Thesis
The week was an argument about what a central bank owes the public, and the market settled it in the Committee's absence. Chair Warsh's position from Jackson Hole is that the Fed owes a standard: underlying inflation "moving to our objective, clearly and at sufficient speed," and otherwise "we have work to do." No path, no reaction function, "a discipline, not a decision." Governor Waller's answer on Thursday was that a standard without a strike zone is not a discipline the players can use, and he gave his. This week's Piedmont Perspective is about that exchange. The thesis here is about what the exchange did to prices.
It did a great deal, and most of it happened at the front end. Four voters described four conditional policies in four public appearances, and the 2-year Treasury moved 4 to 6 basis points on each. It closed Friday at 4.37%, its highest in a year, having risen 90 basis points since January against 26 on the 3-month bill and 38 on the 30-year bond; the 10-year touched about 4.82% intraday on Wednesday before Williams and Waller pulled yields off the highs. The funds rate has not moved. The front end has done the Committee's tightening for it, in exactly the way Waller's own 2022 example describes, only this time without any guidance at all. Figure 1 shows the year. That is the discipline Warsh asked for, delivered by the market one strike zone at a time, and it is a large part of why we think September can wait.
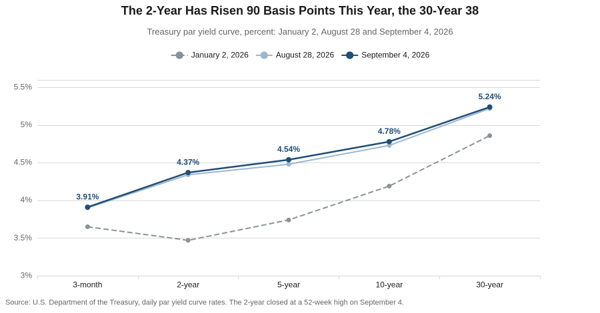
The long end did not move, and this week that is a different story from last week. On August 28 the 2-year rose 14 basis points on the Warsh speech while breakevens fell, which told us the market believed him. This week the 5-year breakeven rose 7 basis points and the 10-year 4 while real yields were flat to a basis point lower. The difference is oil. WTI rose 9.7% and November Brent settled at $96.28 after the largest U.S. strike package of the war and the first attacks on Iranian tankers. The move was inflation compensation, in the part of the curve no reaction function reaches. A 30-year at 5.24% is pricing a shipping lane, a fiscal deficit and a private credit boom, and none of the three answers to a quarter point in September.
The jobs report is the piece of evidence that fits both sides, which is why it moved the market four points and then gave most of it back. August's 162,000 cleared the 125,000 bar we set on August 23, and it arrived in the two categories we said it would. Restaurants and bars had fewer summer workers to release because they hired so few in June and July, and seasonal factors built for a midsummer roll-off turned a flat month into a 59,000 gain; school districts swung back 42,000 after July's 57,500 drop. The three-month average of 71,000 sits above the zero to 40,000 breakeven we adopted on August 28, hiring breadth widened to 55.6 on the private diffusion index and 61.1 in manufacturing, and the workweek rose a tenth, worth roughly 400,000 jobs of labor input. Wage growth slowed to 3.1%, and unit labor costs are up 1.4% over the year. Employers are paying more people for more hours at a slower rate of pay growth, which is a labor market in balance, and the Committee's own dove said Thursday that employment is not a large factor in his vote. On the question in front of the Committee, which is inflation, the report leans the other way.
Positioning follows from the curve, not the calendar. We stay cautious on duration and prefer the belly. The 2-year at 4.37% pays for a reinvestment decision with almost no duration risk and now prices better than even odds of a September increase and, on Friday's close, something close to two moves over the next year. Eighty-seven basis points from the 2-year to the 30-year is thin compensation for a maturity whose marginal basis point was set this week by a tanker off Khasab. We would rather own the 5-year, which sold off 6 basis points on the week and carries the house call at 4.54%, than either wing. If the Committee holds on September 16 and explains why, the belly does best. If it holds without explaining, the July pattern returns, a bear steepening and a term premium build, and the belly still does least badly.
This Week's Argument
The calendar paid what it owed, and the composition says hold
We said on August 10 that a surprisingly strong employment report would arrive in August or September, and on August 23 we put the bar at 125,000. August cleared it by 37,000, and the two prior months were revised up a combined 55,000, so July's first print of minus 23,000 is now a gain of 21,000 and the first outright decline since February has been revised away. We would not, however, extrapolate this print any more than we extrapolated July's, and the reason is in the industry detail. Leisure and hospitality added 62,000 after revised declines of 54,000 and 21,000, so the industry has lost 13,000 jobs over the three months of a summer stretched to 105 days by the earliest Memorial Day and the latest Labor Day the calendar allows. Before seasonal adjustment restaurants and bars shed 700 workers in August against declines of 25,700 in 2023 and 9,700 in 2024, and factors built for a midsummer roll-off printed that as a 59,200 gain. Local government education added 41,900 after its 57,500 July drop, the second half of a swing BLS itself describes as largely offsetting. Set the two calendar categories aside and payrolls rose roughly 58,000, close to the 67,000 underlying pace we estimated for July and above the breakeven range. Figure 2 carries the three-month average, which is the line to read.
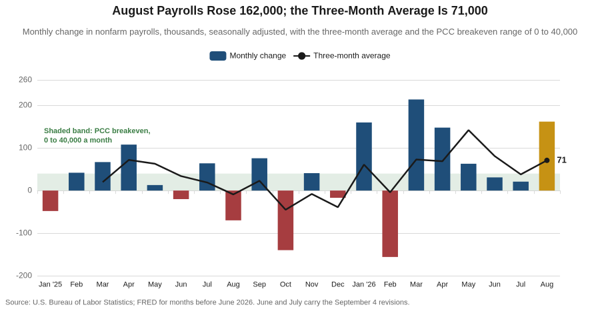
The parts of the report that were not calendar were better than the headline, and they were better in the right places. Manufacturing added 16,000 and has added 58,000 since December's low, with machinery up 6,100 and fabricated metals 5,700, the capital-goods end that answers to the orders and backlogs ISM reported through July. The one-month factory diffusion index jumped to 61.1 from 52.1, so roughly six of every ten factory industries added workers. Construction added 22,000, all of it nonresidential, with heavy and civil engineering up 4,400 on the month and 27,200 over the year, the payroll signature of the data center and transmission buildout. Health care added 12,900, a second month near 13,000 and well below its 32,000 monthly average of the prior year; a month in which restaurants, factories and construction sites did the hiring while hospitals took a smaller share is a better month than the same headline built the other way around. ADP's 38,000 for private payrolls, the weakest since January, is closer to the 58,000 ex-calendar pace than to the headline, and ISM's services employment index at 47.8, a second month in contraction beside business activity at 61.7, says the same thing from the other survey: activity up, headcount not, prices the problem. A Committee that hikes on inflation can point to that survey; one that would cut on jobs cannot. The weak spot was information, down 23,000 with computing infrastructure and data processing off 7,700 and computer systems design 31,300 below a year ago. The data centers going up across the Southeast are a construction story first and an information-sector payroll story hardly at all, and the firms building them are shedding people in the parts of the business that AI reaches first.
The household survey moved the same direction for once, and the wage and hours detail is where the Fed argument lives. The labor force rose 683,000 and household employment 569,000, so the unemployment rate held at 4.1% on flows in the right direction. After June's 720,000 labor-force drop we read the pair as partial payback and sampling noise, not a participation turn; the trend is still down half a point since January and it is still retirement. Participation rose to 61.6%, U-6 fell to 7.7%, and involuntary part-time work fell 414,000. The labor force is still 973,000 smaller than a year ago on a population 1.4 million larger, and the binding constraint is still supply. Average hourly earnings rose 0.3% and 3.1% over the year, the slowest of the year, against productivity growth of 2.2% and unit labor costs of 1.4% in Thursday's revised second-quarter figures. That combination is consistent with 2% inflation, and it is the table a Committee looking for a reason to hold can point to. The workweek rose to 34.4 hours after four months at 34.3 and the aggregate hours index rose 0.3% after readings of 0.0% and 0.1%, which is why third-quarter output is tracking better than the summer payroll prints implied. The September report, due October 2, carries Labor Day's half of the calendar, with the summer workforce held on payrolls through the survey week, and part of August's school-district gain should come back out. We would wait for it before calling the trend higher.
Four umpires, one front end
Waller's speech is the subject of this week's Perspective; the point here is what a week of reaction functions did to the curve. Governor Barr opened Tuesday with a conditional: "a bit more time" if inflation is moderating, act "decisively" if not. President Williams said Wednesday there were "no clear signs right now" whether the stance is sufficient, and put the rise in long yields down to "a strong U.S. economy" and AI investment. Waller said Thursday he would hold on continued progress and consider "a small adjustment" if August inflation came in hot. President Hammack said Friday, after the jobs report, "Now is the time to act. There's no tension in the mandate. Policy isn't restrictive." Each was internally consistent. Together they moved the odds of a September increase from 59% at the prior Friday's close to 63% on Wednesday, 50% after Waller, roughly 65% in the minutes after the payroll print, and 58% at the close (Figure 3). The 2-year fell 4.6 basis points on Waller and rose 4 on Friday, touching 4.42% intraday, its highest since January 2025. None of the four voters, however, said anything about the path beyond September, which is the point. The blackout began Saturday, so those five readings are the Committee's last word until the statement.
Warsh's objection to reaction functions is precisely this, and it deserves a fairer hearing than it got this week. One conditional statement from one voter is a strike zone. Four from four voters, each with a different threshold, are a path by another name, and a noisier one than any dot plot, because the market has to guess at the weights and because each one holds everything else constant. Waller's IF-THEN was written Thursday morning with Brent at $92 and payrolls unknown; by Friday's close both had moved, and so had his odds. That is the case for "a discipline, not a decision," and the week made it for him. The case against it is the same week. In the absence of any guidance, the market has repriced the front end 90 basis points this year and now carries something close to two increases over twelve months, which is the house call, arrived at without the Committee saying anything about the path. Waller's 2022 example was a 2-year that rose 200 basis points on guidance before liftoff. The 2026 version is a 2-year that rose 90 on nothing but conditionals. Either way the front end tightens ahead of the Committee, and a Chairman who cannot describe conditions as restrictive is looking at a policy rate when the restraint is in the maturities that price houses and plants.
Treasury's operations this week said the same thing from the supply side. Thursday's buyback in the 1-month to 2-year bucket drew $28.3 billion of offers against a $12.5 billion maximum and took the full amount, a 2.3 times cover, against an August 25 operation in 5- to 7-year paper that accepted only $1.19 billion of a $4 billion cap. Dealers will sell the front end to Treasury at these levels and will not sell the belly. The upsized long-end buybacks begin this week, at least $4 billion per operation in the 10- to 20-year and 20- to 30-year buckets, with the published schedule still showing $2 billion for Wednesday's 10- to 20-year operation against the August 19 announcement's $4 billion. We would verify the size before positioning around it, and we would note that Treasury did not fill the cap it already had in August.
Hormuz (and Russia) is back in the price, and this week the price was inflation
The war moved from a pause to a campaign in five days, and the tape followed. The Larak Island strike a week ago Sunday ended a 31-night pause on Iranian territory. On Tuesday U.S. forces hit roughly 100 targets, air defense, radar, mine-laying and launch sites at Sirik, Lavan and in Khuzestan and Kermanshah, and for the first time struck two Iranian government tankers anchored north of the blockade line under what Axios reported as a tanker-for-tanker policy. Iran answered with missile and drone strikes on King Hussein and Al-Azraq air bases in Jordan, Camp Titin, Sheikh Isa in Bahrain, bases in Kuwait and Erbil, and Ahmad al-Jaber and al-Minhad on Thursday night; Jordan intercepted eight missiles the first night and ten the second, and U.S. officials report no impacts on U.S. positions. Two Saudi-chartered VLCCs were hit in the strait, the Sidr with two Filipino crew killed and the Senegal Prosperity off Khasab on the Omani side of the channel, the side the August 26 Iran-Oman corridor was supposed to protect. Nothing in the record says that corridor has carried a ship. Iranian claims of a U.S. munition hitting a wedding at Kuhestak, with a death toll reported between four and eighteen, are unverified but were assessed as plausible by four independent weapons analysts, and CENTCOM says it never targets civilians. Vice President Vance said Thursday "I wouldn't call it a war" and that there would be no talks "unless they stop shooting at commercial shipping." There are no direct talks.
The transit data disagree by a factor of three to eight, and the disagreement is the trade. The administration's figures run from Secretary Bessent's "at least 10 million barrels a day" to Energy Secretary Wright's "more than 17 million" on Monday and the President's 18 million on Tuesday, with roughly 30 escorted ships a night; the joint maritime center counts 39 facilitated transits over August 30 and 31 and 44 on September 1 and 2. The trackers count Kpler at 5 to 11 vessels a day, Lloyd's List Intelligence at 12 to 14 non-Iranian-linked, and Windward at three transits in the 24 hours to Thursday evening, one of them dark, against a prewar baseline above 100. Independent analysts put late-August flows at 5 to 7 million barrels a day against roughly 20 before the war. Twenty-two tankers holding 22 to 25 million barrels of Iranian crude sat at Kharg with the berths empty. Whichever count is right, the price moved. WTI settled $91.48 Friday, up $8.08 on the week, November Brent $96.28 after touching $97 on Thursday, its highest since July 23, and the 5-year breakeven rose 7 basis points while real yields were flat. The President said the latest round would be short-lived. The market, however, treated that as a ceiling on the price and not a floor under it. OPEC+ meets online Sunday morning and is expected to leave October policy unchanged, having said itself that its supply decisions now have "more limited impact." The 2.2 million barrel a day voluntary layer finished unwinding with September; the second layer runs to year end.
Diesel is where the shock reaches a household, and it set a record on Friday. AAA's national average hit $5.85 on Friday, above the EIA's Monday reading of $5.599, which had eased 5.3 cents and will reverse in Tuesday's survey. The September ULSD contract expired at a post-war record $4.68 a gallon, the diesel crack against WTI touched $106 on Tuesday and settled near $100 on Thursday, and distillate stocks of 104.2 million barrels are the lowest for late August since 1982, with East Coast inventories the lowest since 1990 and refineries at 97.2% of capacity. The supply side is still Russia as much as the Gulf. Ukraine's General Staff says Lukoil's NORSI refinery, struck August 26, and Novatek's Ust-Luga condensate complex, struck Tuesday, have both halted, and Kirishi was hit for a sixth time a week ago; Russia extended its diesel export ban through September 30. This is the same energy channel that produced the spring CPI spike and the June energy refund, and a second refund is not the base case while diesel is making highs. None of this is reachable by a funds rate, which was last week's thesis and is still ours. What changed this week is that the bond market began charging for it in inflation compensation, and that is the one part of Warsh's standard, "clearly and at sufficient speed," that a supply shock can fail on its own.
The domestic evidence on pass-through cuts Waller's way, with a qualifier that is doing real work. The ISM prices indexes printed 71.1 in manufacturing, unchanged, and 72.6 in services, a fifth reading above 70 in six months. Both are diffusion indexes; they say that seven in ten purchasing managers paid more in August, and nothing about how much more or whether it was passed along. The Beige Book answered the second question. Boston reported that price sensitivity "was putting a limit on their ability to pass through input price increases," New York that firms were "absorbing cost increases rather than passing them through," and Richmond that input price growth had settled just above 7% while prices received were "relatively unchanged" and that one wood producer's customers "demanded price cuts following the Supreme Court tariff ruling." Cleveland's largest retailer contact reported petroleum-based product prices up more than 20% against 2 to 3% for everything else. A margin squeeze in the making is the mechanism behind Waller's line that his "earlier worry that higher energy prices would bleed into many goods and services prices hasn't come to pass, at least so far." Margins are finite, however, and if a hot number arrives this week it is likelier in Thursday's producer prices than Friday's consumer prices; the gap between the two is the number to watch.
Behind the Numbers
| Release | Reading | |
|---|---|---|
| ISM manufacturing, August | 54.6 vs. 55.2 consensus; new orders 53.7 (-3.0), backlogs 51.8 (-3.2), production 58.3, employment 51.2, prices 71.1; S&P Global final 53.9 | Eighth month of expansion and the confirmation test Chicago's 47.1 failed. Fifteen of eighteen industries grew; ISM's own translation is 2.4% annualized GDP. Supplier deliveries at 59.3 were the only headline component to improve, and customers' inventories at 42.8 are "too low" for a 23rd month, which is why production can keep expanding after orders slip. A softer August order book is a statement about fourth-quarter hiring |
| ISM services, August | 55.4 vs. 54.2; business activity 61.7, new orders 60.9, backlogs 55.6 (from 50.9), employment 47.8, prices 72.6; S&P Global services 56.5, composite 56.0 | Activity highest since November 2022 and orders since early 2023, with employment contracting a second month. Prices paid highest since August 2022, a fifth reading above 70 in six months and a 21st above 60; tariffs and the Middle East again the most-cited supply problems, with GPUs and steel added to the short-supply list. S&P Global's survey carries less price heat. A construction respondent: 30-year mortgage rates at 6.67% "moving prospective buyers back to the sidelines" |
| Employment, August | +162,000 vs. ~55,000; U-3 4.1%; AHE +0.3% and 3.1% y/y; workweek 34.4 | See the argument above. Strongest print since March; 12-month average 31,000 through July. The benchmark revision of -79,000 does not enter published data until February |
| JOLTS, July | Openings 7.27 million vs. 7.30; June revised down 177,000 | Hires 5.1 million, quits 3.1 million, layoffs 1.7 million. Professional and business services hires -188,000. A low-hire, low-fire market, unchanged |
| ADP, August | +38,000 vs. 47,000; weakest since January | Goods -10,000 with manufacturing -17,000; large firms +34,000, small +3,000. ADP and BLS rarely match when education and leisure seasonals dominate the establishment survey; ADP is closer to the 58,000 ex-calendar pace. They disagreed on manufacturing by 33,000, and we carry BLS |
| Claims | 206,000 initial; 1.779 million continuing | Below every calendar-year average since at least 1976. Challenger cuts 52,881, lowest August since 2022, with AI cited for 3,462 |
| Productivity, Q2 revised | +1.4% unrevised; unit labor costs +1.2% (from 1.3%); ULC +1.4% y/y | Manufacturing productivity revised up to 2.4% with unit labor costs -0.3%. The factory sector is producing more per hour and paying less per unit |
| Trade, July | Deficit $88.6 billion from $71.2 billion, widest in over a year; exports -$6.6 billion, imports +$10.8 billion | Capital goods imports +$14.4 billion: computers +$6.9 billion, accessories +$6.6 billion, semiconductors +$1.2 billion, with record monthly deficits with Mexico, Vietnam, Taiwan, Thailand, South Korea and Malaysia. The AI wedge, again: domestic demand up, GDP arithmetic down. Real petroleum imports were the lowest since April 2020, so July's oil story was volume down; that will not hold at $96 Brent. GDPNow 4.7% for Q3 |
| Construction spending, July | -0.5% vs. 0.0%, inside the ±0.8% confidence band; -3.8% y/y clears it | Factory construction -22.2% year to date and -32% from the September 2024 peak, 95% of it computer, electronic and electrical plants, while data centers ran $37.2 billion over seven months, +34.8% and 57% of private office construction. Core capital goods orders $85.9 billion in July, +12.9% y/y, a series high. Structures off, equipment on, as in Tuesday's report |
| Factory orders, July | +0.9% vs. 0.6%; unfilled orders up in 24 of 25 months | Core capital goods orders revised to flat. Backlogs at $1.6 trillion are why the factory workweek is 41.7 hours |
| Beige Book | Activity "increased modestly"; ten Districts slight to moderate growth; employment "rose very slightly" | Prices moderate in eight Districts. A Maryland construction firm gave a 35% raise to hold workers against data center competition. Richmond: freight moving from truck to rail on fuel costs |
| Vehicle sales, August | 16.8 million SAAR from 16.3 million; average payment $812, a record for August | BEV share 6.2% from 10.1% a year ago; hybrids 15.7%. Not the cold channel it was in the spring; new vehicle prices are still up only 0.5% over the year |
| Broadcom, fiscal Q3 | Revenue $29.6 billion, +86%; AI semiconductors $16.7 billion, +221% | Guided AI revenue to $21.7 billion for Q4 and "gated by land, power and shell." Stock fell 6% on margin mix. Demand exceeds supply; the constraint is the grid |
| Bank of Canada | Held 2.25%, seventh straight | Core near 2%, "little evidence" of energy spreading; warned the tariff exchange "could feed into consumer prices over time" |
| ECB, September 10 | Reuters poll: 65 of 65 expect +25 bp to 2.50% | Euro area August CPI 3.3% from 2.9%, core 2.4%, energy 14.3% from 10.3%. A hike from Frankfurt six days before the FOMC, on the same energy channel, is the backdrop for Warsh's "sufficient speed" |
| Japan, 30-year JGB | Auction "uneventful," 30-year closed 4.07% off a record near 4.15% | Gilts: 10-year 5.14%, markets fully price a Bank of England hike by year end. The global long end is one market |
| China, August PMIs | Official manufacturing 49.8, nonmanufacturing 49.0, lowest since December 2022; RatingDog 51.5 | Output prices cut for the first time this year. China dissented from the G20 paragraphs on imbalances, Hormuz and debt |
Sanctions and the dollar system are the other Iran policy, and they moved this week. Operation Economic Outcast, launched August 24, suspended five general licenses with a wind-down to September 8 and added roughly 60 designations; on Friday OFAC designated three Istanbul entities around Golden Global Investment Bank. Secretary Bessent told the G20 in Asheville that the United States would "economically asphyxiate" Iran, that it knows the trust accounts and "the $100 million houses," and that facilitators would be removed from the dollar system. China takes roughly 90% of Iran's crude exports, and China dissented. If that pressure works it is oil-positive, not negative, which is the same thing we said a week ago.
The G20 produced a chair's statement, as expected, and it is an American document. The global economy "has remained resilient"; structural impediments are regulation, taxation and labor supply; embrace AI; concern over "disruptions to energy trade"; a call for "free, safe, and predictable navigation through the Strait of Hormuz"; avoid export restrictions on energy, food, fertilizer and critical minerals; reaffirm the 2021 exchange rate commitment with no dollar language. Nothing on Treasury market functioning, which was the one tradeable output we were watching for. Warsh's own remarks were about growth: "a global investment surge," and whether the economy can grow faster than the 1.8% conventional forecasters assume. Chris Rugaber's account for the Associated Press has China alone dissenting from the paragraph on low-priced exports and imbalances.
Two dates in Washington and two abroad. The continuing resolution through December 11 passed the House 370 to 48 and is signed, so September 30 is a nonevent and the appropriations fight lands on top of the December 8 and 9 FOMC, which is also our meeting for the first increase. Canada's counter-tariffs take effect at 12:01 a.m. Tuesday, September 8, on C$27.6 billion of goods in tiers of 15%, 25% and 50% matching the U.S. rates on like products, with goods in transit exempt and a remission process open; Prime Minister Carney said Tuesday that talks resume when Washington stops "doing memes." Witkoff and Kushner arrived in Moscow Saturday with what were described as American proposals, the first envoy visit since January, with a Kyiv leg to follow; Putin said Thursday there was a chance of a deal. And the Department of Energy issued a Section 202(c) order Thursday directing Duke Energy Carolinas to run whatever it must through Labor Day, the second such order in the Carolinas this year, while PJM's large-load rule, which would require new loads above 50 megawatts after June 2027 to bring their own capacity or face early curtailment, closed for comment and is proposed to take effect October 12.
Bottom Line
We expect a hold on September 16, a first quarter-point increase on December 9, and one more in 2027 to a terminal 4.00% to 4.25%. Futures price 58% for September. We are under it, for the reasons in the Perspective and in the composition of Friday's report, and we would note that the Committee's most reliable hawk-turned-patient voter has told us his vote turns on one release.
The December date is a change from the Jackson Hole preview, which carried the first half of 2027, and the reasons are services prices at 72.6, Brent at $96 and a Chairman who says he has "work to do." None of those is the 162,000, which was two seasonal categories. Warsh also said at Jackson Hole that a couple of moderate summer prints "do not tell me that underlying trends have meaningfully improved." Another soft core on Friday tests that sentence; a hot core with diesel in the pipeline does not.
The condition that would flip us is five days away and it is unchanged. Core CPI at or above 0.3% on September 11, particularly with core goods above 0.4%, would mean the refining shock has reached the goods basket and would make a September increase our base case that morning. Thursday's producer prices are the earlier warning; the ISM prices indexes and the Beige Book say the pressure is in margins, and a producer price index that jumps while the consumer index does not would say margins are still holding.
| Call | Status | Where it stands |
|---|---|---|
| August or September payrolls above 125,000 | Landed | 162,000, with June and July revised up 55,000. September carries the second half of the calendar |
| 30-year 5.00 to 5.40% into Sept. 16 | On track | 5.24%; 44 consecutive trading days at or above 5% since July 7 |
| Brent $85 to $100 average through year end | On track, upper half | November $96.28; our $92.00 third-quarter mark now looks about right |
| ULSD crack above $60 through Q4 | On track | Near $100 Thursday; record $106 Tuesday |
| PCE components above 3% below 54% in January | Open | The Chairman's own gauge; no update until the August PCE report on September 25 |
| Hold on Sept. 16 with no more than three dissents | New | Scored September 16. A fourth dissent would say Hammack's zone is the majority's |
| MOVE above 70 into Sept. 16 | Unverified this week | No published Friday close available to us; last confirmed reading 73 in late August |
The risk to our call that is not the obvious one is the same as last week, and this week made it larger. A hold that reads as a close call, without a clear account of why, invites the July pattern back, bear steepening and a term premium build, at a moment when breakevens are already rising on oil. That is the scenario in which we are right on the decision and hurt on the positioning, and it is why we own the belly against both wings. The other risk is the one we state in the Perspective: if Waller's zone is the Committee's zone, our December increase is early.
This is still a capital-led, employment-light expansion, protein rather than carbohydrates. The trade report showed it in capital goods imports, Broadcom showed it in a $21.7 billion quarterly AI guide gated by power, and the payroll report showed it in heavy and civil construction hiring while information shed 23,000. What changed this week is that the Committee's last words before the blackout were four different strike zones, and the market decided the pitch is Friday's.
CFO and Treasurers Corner
Fix what you were going to fix before Friday, or wait until the 17th. The 2-year at 4.37% already carries better than even odds of a September increase and something near two moves over the next twelve months. If the CPI prints 0.2% on core, the front end rallies and you will have paid up; if it prints 0.3%, the hike is in the price by lunchtime. The asymmetry favors waiting for the number unless you cannot carry the exposure through a 0.4% surprise, in which case fix half now.
The issuance window is the narrowest of the quarter. Treasury sells 3s, 10s and 30s Tuesday through Thursday, the ECB meets Thursday, CPI is Friday, and the FOMC statement lands the following Wednesday, with the upsized 10- to 30-year buybacks starting Wednesday. Investment grade spreads at 81 basis points and high yield at 265 are a basis point or two wider on the week, not a problem, but rate volatility into Friday is. Price before Wednesday or after the 17th.
Budget diesel off the crack, not the barrel, and budget for the record. Crude rose 9.7% and diesel set an all-time high at the pump on Friday at $5.85, with distillate inventories the lowest for late August since 1982 and two Russian refineries reported halted. The crack near $100 is the input to hedge, and Sunday's OPEC+ meeting will not change it; the group has said as much.
Canada's counter-tariffs are live Tuesday, and they follow marking rules, not USMCA rules. The 15%, 25% and 50% tiers apply to goods eligible to be marked as U.S. origin under Canada's marking regulations, which means USMCA qualification does not exempt you; the U.S. Section 338 duties that provoked them do not exempt USMCA goods either. Goods in transit before 12:01 a.m. are exempt and remission requests are being accepted. If you ship dairy, steel and iron products, appliances, agricultural equipment, pulp and paper, electronics or cosmetics north, your landed cost changes Tuesday.
Set next year's wage budget at 3 to 3.5%, and stop worrying about it as an inflation risk. Average hourly earnings are up 3.1%, the slowest of the year; ADP's job-stayers are at 3.0% and job-changers at 4.7%; unit labor costs are up 1.4% over the year with productivity at 2.2%. The exceptions are technical trades near data centers, where a Maryland contractor told the Richmond Fed it paid a 35% raise to hold a crew, and health insurance renewals, which the Beige Book flagged in nearly every District.
Delivered power: the interconnection bill is coming due in PJM, and the emergency orders are now routine in the Carolinas. PJM's proposed rule would require any new load above 50 megawatts energizing after June 1, 2027 to bring its own capacity or accept early curtailment, effective October 12 if approved, and comments closed Thursday. The Department of Energy's Section 202(c) order for Duke Energy Carolinas over Labor Day is the second this year. If you are siting load in either territory, plan for capacity charges as a line item and for curtailment language in the contract.
Piedmont Perspective
The Umpire Defines His Strike Zone
Abridged from the standalone essay published today. The full version carries the three-part communication framework, the case against our own December call, and the test we would apply to Waller's consistency.
Two speeches six days apart asked what a central bank owes the public about its own future behavior, and gave opposite answers. Chair Warsh said from Jackson Hole that it owes a standard: forward guidance "has overstayed its welcome," no reaction function, "a discipline, not a decision." Governor Waller agreed on Thursday that forward guidance belongs at the zero bound, then argued that a reaction function is a different thing and gave his. "The pitcher is trying to strike out the batter, and the batter is trying to hit the ball or walk to get on base. Both want to play the ball, but they cannot do that until they know the umpire's strike zone." The players do not need a perfect zone, only "a rough idea of its parameters and some guarantee that it won't change much on every pitch."
The zone he called is narrow enough to use. Hold at 3.50% to 3.75% on September 16 if the August inflation data show continued progress; "a small adjustment" higher if they show the improvement "has been fleeting." Employment "will not deviate much" and is "not a large factor" in his vote. In the interview: "To paraphrase John Lennon, I'm willing to give disinflation a chance."
Inside his zone is a reading of the July price data that we share. He set aside twelve-month PCE at 3.7% and core at 3.3% as "not the best guide for where inflation is today." His number is three-month annualized core PCE, down every month since February from 4.76% to 3.05%, and Figure 4 plots it against the same window on the Dallas Fed's trimmed mean, which has run between 2.2% and 2.8% all year. He went further than any voter has in print: roughly half of July's core increase came from imputed nonmarket services, and "ignoring this one factor, my take is that underlying inflation is doing better than the core numbers suggest." That is the divergence we measured last week from the trimmed means, arrived at from the headline series.
Where we part company is one clause: policy is "only slightly restricting aggregate demand." We think the restraint is larger and has arrived without the Committee. The funds rate is 175 basis points below its August 2024 level while the 10-year is 81 basis points higher and the mortgage rate 17 on monthly averages, single-family starts fell to 808,000 in July, and core goods are up 0.8% over the year. If he is right, Friday's CPI carries most of the decision; if we are right, a September increase adds restraint to channels already carrying the adjustment, and that mistake takes eighteen months to show up.
A committee has twelve umpires, and four called pitches in one week. Barr, Williams, Waller and Hammack each gave a conditional, and September odds ran 59, 63, 50, 65 and 58. Four consistent conditionals from four voters add up to a path by another name, and a noisier one than any dot plot, because every reaction function is ceteris paribus and nothing else stayed put; that is Warsh's objection, and the week made it for him. The other half is that the 2-year has risen 90 basis points this year on no guidance at all, which is the tightening Waller's own 2022 example describes, delivered by the market instead of the Committee.
The honest test is to apply the zone to our own forecast, and it does not pass cleanly. We carry core PCE at 3.1% for 2026 and 2.7% for 2027, which is continued progress by Waller's definition, so his zone calls a ball in December as well as September. We expect a December increase anyway, because we think the majority is judging by Warsh's "clearly and at sufficient speed" and by the level, 64 months above target, not by the trend. If Waller's zone is the Committee's, our first hike is early. We would rather say so than pretend the framework and the forecast agree.
The falsifiable version has dates. Core CPI at 0.2% or below on September 11 and the Committee holds on the 16th with no more than three dissents. Core at 0.3% or above with core goods at 0.4% or more and a September increase becomes our base case that morning, on the rule we published August 30, and Waller's zone gets its first test of consistency. Our call is unchanged: hold on September 16, December 9 for the first increase, terminal 4.00% to 4.25%, and we own the tension between that date and the framework we have just praised.
The Week Ahead
| Date | Release or event | Consensus | Why it matters |
|---|---|---|---|
| Sun Sep 6 | OPEC+ core group, online | Hold October policy | The group says its decisions have "more limited impact" with Hormuz constrained. Watch for any Kharg language |
| Mon Sep 7 | Labor Day; U.S. markets closed | Latest Labor Day the calendar allows; the summer workforce is still on payrolls for the September survey week | |
| Tue Sep 8 | Canadian counter-tariffs take effect, 12:01 a.m.; NFIB small business, August; 3-year auction; consumer credit | NFIB 100.5 | Iran general license wind-down also ends. What would move us: an NFIB "higher selling prices" share jumping, which would say the margin squeeze is ending |
| Wed Sep 9 | Treasury buyback, 1-month to 2-year, $12.5 billion; 10-year auction; wholesale inventories | Verify whether the 10- to 20-year operation Thursday runs at $2 billion or the announced $4 billion | |
| Thu Sep 10 | August producer prices; ECB decision; 30-year auction; claims; buyback 10- to 20-year; GDPNow | PPI +0.3%; ECB +25 bp to 2.50% | The earlier pass-through test. A PPI jump with a tame CPI a day later says margins are still absorbing. A 30-year auction tail into a term premium build is the positioning risk |
| Fri Sep 11 | August CPI; Michigan sentiment, preliminary | Headline +0.4%; core +0.2% | The pitch. Core at or above 0.3% with core goods at 0.4% or more moves a September increase to our base case. Below that, Waller's zone and ours both call a ball |
| Tue Sep 15 or Wed Sep 16 | Retail sales, August (release date to be confirmed); Empire State; import prices; buyback TIPS | Prime Day moved to June; read August against a July that was distorted by it | |
| Wed Sep 16 | FOMC decision, statement and press conference; industrial production | Hold, 58% priced | Scored: hold with no more than three dissents. Warsh's first post-Jackson Hole press conference is the reaction-function question in public |
| Thu Sep 17 | Housing starts, August; Philadelphia Fed; buyback 7- to 10-year; blackout ends | Starts near 1.28 million | Single-family starts at 808,000 in July are the cold channel; a further decline is the cost of a September hike made visible |
Then: PCE and personal income September 25 with the test of the Chairman's 54% gauge; the September employment report October 2 carrying Labor Day's half of the calendar; FOMC October 27 and 28, six days before the November 3 midterms, which is why a September hold is a hold until December 8 and 9; the Court of International Trade hears the Section 301 case September 30; Boeing's SPEEA contracts expire October 6 with a 90% strike authorization already in hand.
U.S. Economic & Financial Outlook
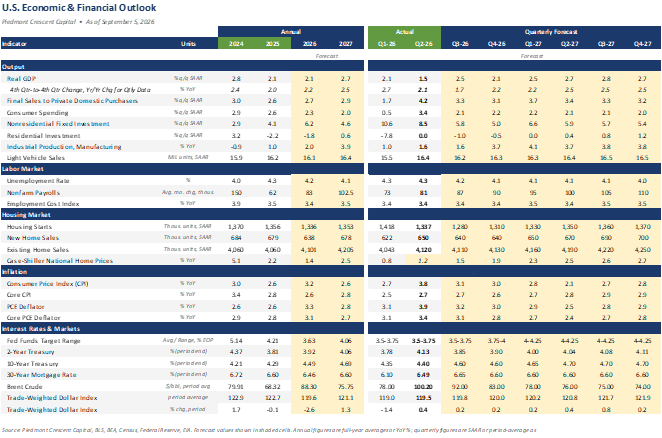
Latest readings referenced in the notes below are the Treasury par yield curve for Friday, September 4, the Freddie Mac survey rate for September 3, and the Friday close on the November Brent contract.
Three notes on how to read this table. First, the funds rate path carries a first increase on December 9, after the midterms, with one more in the first quarter of 2027 to the 4.00% to 4.25% terminal range; the August 30 issue showed the first quarter of 2027, and this issue supersedes it. Second, the market has moved past the rate rows: the 2-year at 4.37% sits 47 basis points above the 3.90% year-end cell, the 10-year at 4.78% is 18 basis points above its 4.60% cell and 8 above the 4.70% we carry for the end of 2027, and the mortgage rate at 6.71% is 11 basis points above 6.60%. We have not chased the market; the long end is pricing a term premium for a shipping lane and a deficit that we expect to give some of it back once the war premium fades, and a 30-year mortgage near 6.60% still leaves residential investment subtracting from growth through the fourth quarter. Third, Brent is running above the fourth-quarter assumption with a war that widened this week, and the scenario odds across a $70 to $100 band are unchanged at 45% base, 30% upside and 25% adverse.
Sources and Notes
Sources. Christopher J. Waller, "The Economic Outlook and Some Comments on My Policy Communication," Reuters NEXT, September 3, and the interview that followed; Kevin Warsh, "In Our Time," Jackson Hole, August 28, and G20 remarks, Asheville, August 31; Michael Barr, September 1; John Williams, CNBC, September 2; Beth Hammack, September 4 · Bureau of Labor Statistics for the Employment Situation, JOLTS, productivity and claims; Census Bureau and BEA for trade, construction spending and factory orders; Institute for Supply Management; ADP Research; Challenger, Gray and Christmas; NADA · Federal Reserve Board, Beige Book, September 2; Federal Reserve Banks of Atlanta, Cleveland, Dallas and Richmond · U.S. Department of the Treasury for par and real yield curves, buyback results and Operation Economic Outcast; OFAC; Finance Canada for the counter-tariff list; Bank of Canada; the G20 chair's statement of September 1 · CME Group settlements and FedWatch as reported by Reuters, Kiplinger and Investopedia; Freddie Mac; EIA Weekly Petroleum Status Report and retail price survey; AAA; ICE BofA index spreads via FRED · CENTCOM, Critical Threats Project Iran updates, USNI News, Al Jazeera, Axios, Windward, Kpler and Lloyd's List Intelligence on the Gulf; Ukrainian General Staff statements on Russian refineries · Associated Press, Reuters, PBS, American Banker, Bloomberg headlines · Broadcom investor relations · Department of Energy and PJM filings · Piedmont Crescent Capital, "August Employment Report: Not the Blowout It Appears," September 4; "Hiring Arrived Just as the Order Book Cooled," September 1; "A Wider Gap, a Narrower Problem," September 2026.
Notes. Treasury yields are the official daily par yield curve for Friday, September 4, which Treasury posted the same day; breakevens are computed as nominal par less real par at each maturity. Credit spreads are through Thursday, September 3, the latest published. The October Brent contract expired Monday, August 31, so the weekly change on November Brent is stated as approximate; the WTI change is on the October contract throughout. The diesel crack levels cited are as reported by Bloomberg and Cornerstone Futures on the days named and are approximate; Friday's ULSD settlement was not available from a source we could verify. The MOVE index reading is the last published figure available to us and is flagged as such in the scorecard. Hike odds are CME FedWatch figures as reported at the close on each day; Tuesday, September 1 was not separately reported and Friday's intraday high is as reported by Reuters. Iranian casualty claims at Kuhestak and Iranian claims of strikes on U.S. ships are unverified; U.S. official statements on intercepts are as reported. Hormuz transit counts are as published by each tracker and are not reconciled. The statement that two Russian refineries have halted is the Ukrainian General Staff's and is not independently confirmed. The three-month core PCE rate is the annualized change in the index over three months; the trimmed mean comparison is the three-month average of the Dallas Fed's annualized monthly rate. The forecast table is the PCC U.S. Economic and Financial Outlook as of September 5, 2026; quarterly Treasury and mortgage figures are period-end, GDP is the annual average and payrolls are the average monthly change in the quarter. All figures are subject to revision. For informational purposes only; not investment advice.
Mark P. Vitner
President & Chief Economist, Piedmont Crescent Capital
mark.vitner@piedmontcrescentcapital.com · 704-458-4000
A View from the Piedmont is published weekly by Piedmont Crescent Capital for informational purposes only and does not constitute investment, legal, or tax advice. Views expressed are those of the author as of the date of publication and are subject to change. © 2026 Piedmont Crescent Capital, LLC. All rights reserved.
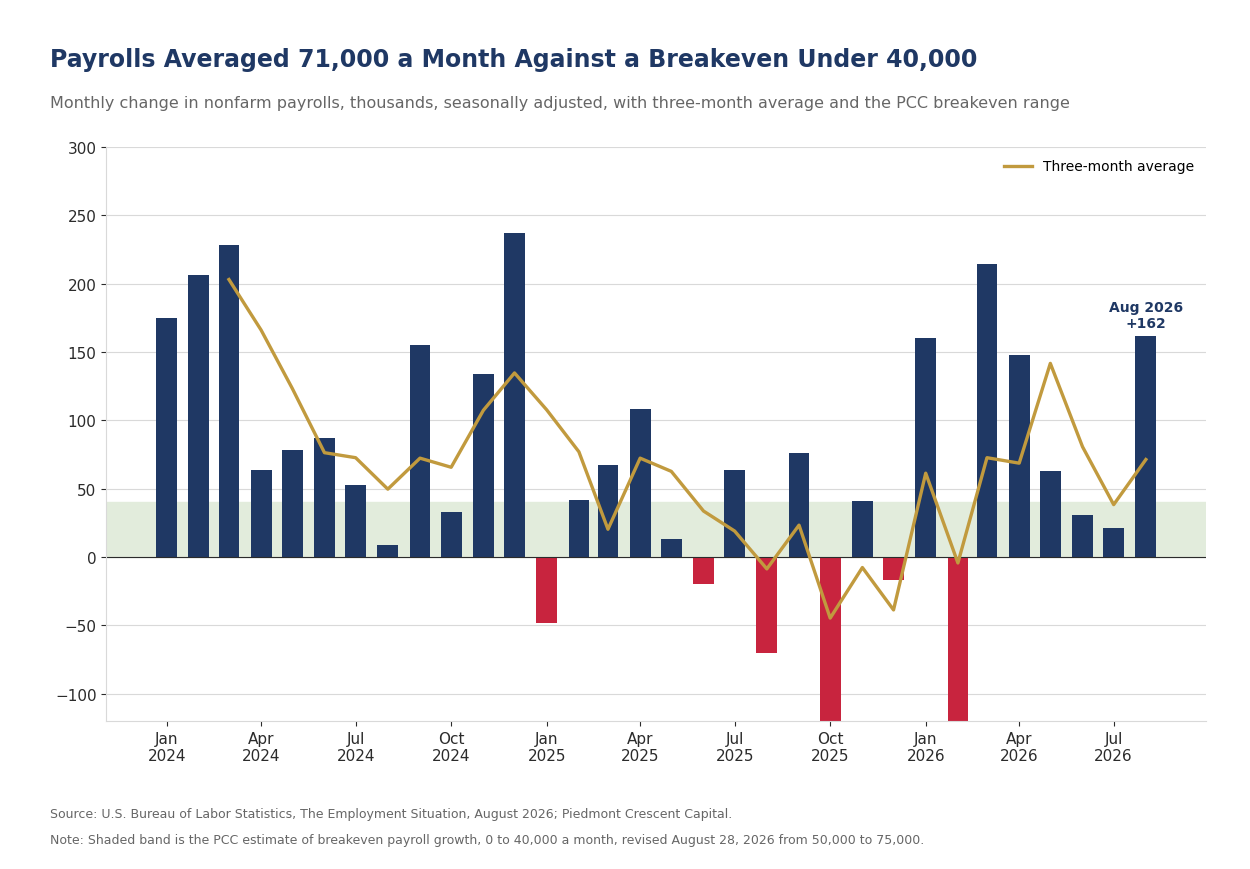
August Employment Report: Not the Blowout Report It Appears to Be
August Employment Report: Not the Blowout It Appears
Payrolls rose 162,000 on wider-than-usual seasonal swings in leisure & hospitality and local education, the payback we warned about. The three-month average is the number to carry, manufacturing is broadening, hours worked jumped, and nothing here should change the Fed’s thinking for September.
Early Signal
- Nonfarm payrolls rose 162,000 in August, and this report is not the blowout it appears on the surface. The gain was roughly three times the consensus call near 50,000, and the two prior months were revised up a combined 55,000, but 104,000 of the 162,000 came from two categories, leisure & hospitality and local government education, whose seasonal swings have been wider than usual all summer. June was revised to a gain of 31,000 from 20,000 and July to a gain of 21,000 from a decline of 23,000, so the first outright decline since February has been revised away. The three-month average is 71,000 and the average over the twelve months through July is 31,000.
- Leisure & hospitality added 62,000 jobs, the payback we have warned about since July, and the three-month average is the right way to read it. After revised declines of 54,000 in June and 21,000 in July, the industry has lost 13,000 jobs over three months, about 4,000 a month, the pace to carry for a summer stretched to 105 days by the earliest Memorial Day and the latest Labor Day the calendar allows. Before seasonal adjustment restaurants and bars shed just 700 workers in August, and against factors built for a midsummer roll-off that printed as a 59,200 gain.
- Local government education added 41,900 jobs after its 57,500 July drop, the second half of a seasonal swing that BLS describes as largely offsetting and that has no counterpart in the unadjusted data. Unadjusted, districts added 327,300 workers as the school year began, fewer than in any of the past three Augusts, and district payrolls are 51,100 below last August’s.
- Set the two calendar categories aside and payrolls rose roughly 58,000, close to the 67,000 underlying pace we estimated for July and above the zero to 40,000 breakeven range we adopted on August 28. Hiring breadth widened as well, with the one-month private diffusion index at 55.6 from 52.8 and the factory index at 61.1.
- Manufacturing payrolls rose 16,000 and are up 58,000 from December’s low, and the gains are broadening. The one-month manufacturing diffusion index jumped to 61.1 from 52.1, meaning roughly six of every ten factory industries added workers, with machinery (+6,100) and fabricated metals (+5,700) leading and motor vehicles & parts giving back 4,500. Construction added 22,000, with heavy & civil engineering up 4,400 on the month and 27,200 over the year and nonresidential specialty trades up 7,800, the payroll signature of the AI buildout and the factory projects still under way. Tech-centric employment was the weak spot, with information shedding 23,000, including 7,700 at computing infrastructure and data processing providers, and computer systems design down again and 31,300 below a year ago.
- The unemployment rate held at 4.1% as the labor force grew 683,000 and household employment rose 569,000. Participation rose to 61.6% from July’s 61.4%, and the count of people working part time for economic reasons fell 414,000, pulling U-6 down to 7.7%. The labor force is 973,000 smaller than a year ago on a population 1.4 million larger.
- Average hourly earnings rose 10 cents, or 0.3%, to $37.75 and are up 3.1% over the past year, a pace consistent with the Fed’s 2% inflation mandate once productivity growth is taken into account. The year-over-year rate, from 3.2% in July, is the slowest of the year. Hours worked jumped, with the workweek up a tenth to 34.4 after four months at 34.3 and the index of aggregate weekly hours up 0.3%, a large move for a series that had been flat all summer; a tenth of an hour on 136 million private payrolls is worth roughly 400,000 jobs. Production workers in manufacturing held a 41.7-hour week for a third month.
- Layoffs are still low. Initial claims were 206,000 in the week ended August 29 and continuing claims 1.78 million in the week ended August 22. Job leavers rose 121,000 to 914,000, the kind of increase that comes when workers are confident of finding the next job, and job losers fell 64,000.
The Print the Calendar Owed Us
August’s employment report was the strongest of the year on the surface, and it arrived in the two categories we said it would, which is why we would read its composition before its headline. Nonfarm payrolls rose 162,000 against a consensus near 50,000, and June and July were revised up a combined 55,000, with July’s first print of -23,000 now a gain of 21,000. Private payrolls added 127,000 and government 35,000, nearly all of it local education. The three-month average now stands at 71,000 and the twelve-month average at 31,000, measured over the twelve months through July, which is the window BLS uses. We said on August 10 to expect a surprisingly strong report in one or both of August and September and on August 23 put the bar at 125,000. August cleared it, and the composition does not support claiming more. Leisure & hospitality and local government education together account for 104,000 of the 162,000, and both are categories where the seasonal swings this summer have been wider than usual in both directions.
The bar this print had to clear moved on August 28, and it moved lower. The preliminary benchmark revision to March 2026 payrolls came in at -79,000, or 0.1%, against -911,000 a year earlier, and the composition mattered more than the level. Transportation & warehousing, information and financial activities were revised higher while retail, wholesale and private education & health were revised lower, so the jobs added paid an average of $2,769 a week and the jobs removed paid $1,518. Applied to the published data, the underlying pace of hiring over the revision year was between 11,000 and 16,000 jobs a month, and we marked our estimate of breakeven payroll growth down to a range of zero to 40,000 a month from 50,000 to 75,000. The benchmark does not enter the published series until February, so today’s revisions to June and July are the ordinary sample revisions and not the benchmark.
Hiring breadth widened more than the headline alone would suggest. The one-month diffusion index for private industries rose to 55.6 from a revised 52.8 in July, and the manufacturing index jumped to 61.1 from 52.1. Health care added 12,900 jobs, a second straight month near 13,000 and well below the 32,000 monthly average of the prior year, and social assistance added 15,500. Health care has carried the payroll count for two years; a month in which restaurants, factories and construction sites did the hiring while hospitals took a smaller share is a better month than the same headline built the other way around.
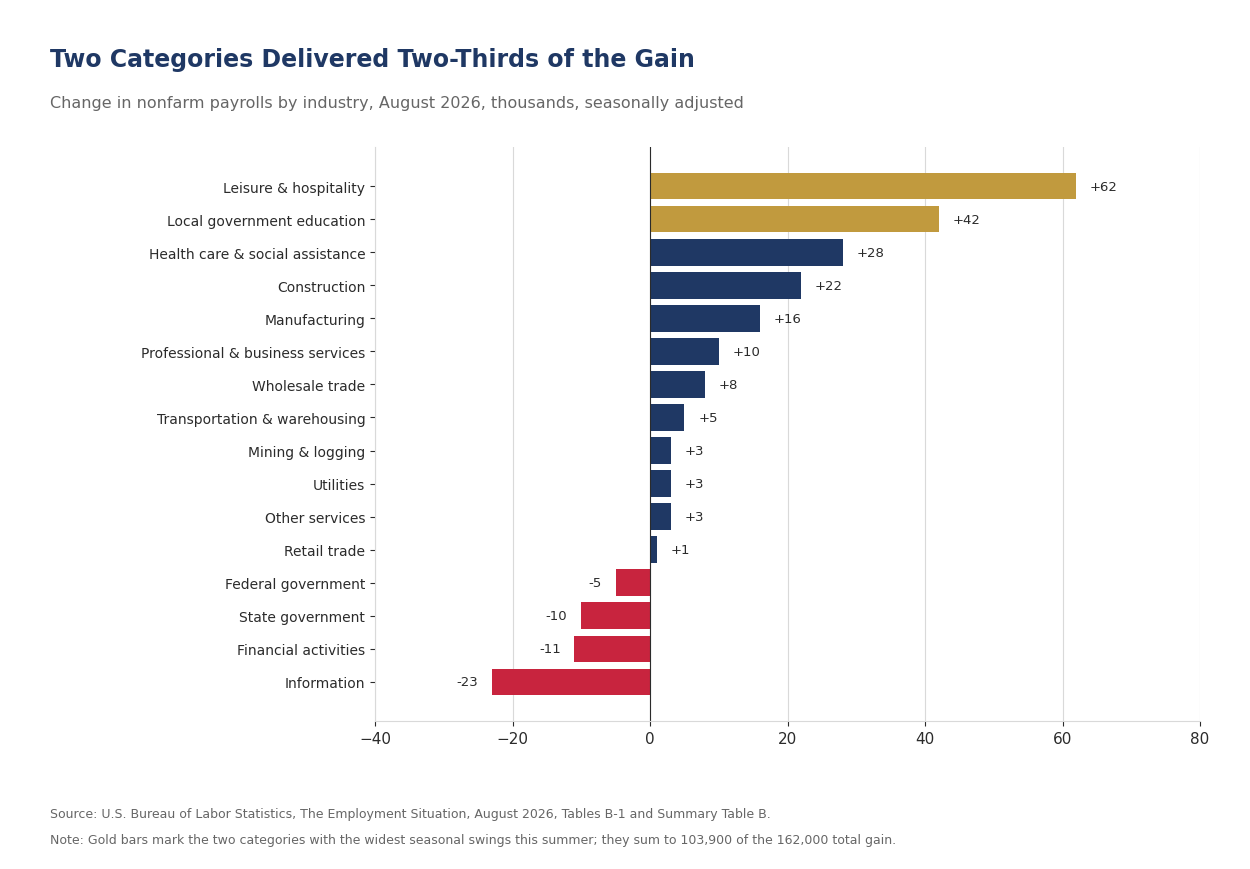
The Summer Unwinds
Leisure & hospitality added 62,000 jobs in August, and with June and July now at -54,000 and -21,000 the three months together are the only sensible way to read a summer whose hiring came early. Over the three months together the industry has lost 13,000 jobs, roughly 4,000 a month, against a gain of 131,000 over the past year, and that is the number we would carry into the fall. An extraordinarily long summer, with Memorial Day on May 25 and Labor Day on September 7, pulled hiring into May and left less to shed in August. The industry shed 91,000 jobs between July and August before seasonal adjustment, against declines of 73,000 last August, 107,000 in August 2024 and 125,000 in August 2023. Restaurants and bars held their July head count, losing just 700 workers, against declines of 25,700 in 2023 and 9,700 in 2024 and a gain of 17,600 last year, and the seasonal factors, which look for restaurant staffing to roll off from a midsummer peak, turned a flat month into a 59,200 gain. The unadjusted record makes that gain look less remarkable than the adjusted one, since restaurants and bars have held or added staff into August in most recent years, so part of the printed gain is where the re-estimated factors set the bar after this summer. Arts, entertainment & recreation ran a normal August, down 68,700 unadjusted against 68,800 a year earlier, and printed a 6,300 decline seasonally adjusted. Accommodation added 8,600.
The arithmetic was set out in advance, and it ran the way we said it would. Restaurants and bars did not hire as many people as they usually do in June and July. They therefore have far fewer people to let go as the summer winds down in August and September. The seasonal factors for leisure and hospitality jobs in August and September compensate for jobs that are expected to decline. Since fewer jobs were added during the prior two months, the end-of-summer decline will be less than usual, resulting in a larger seasonally adjusted job gain. The World Cup appears to have been the largest single reason the hiring came early, though it is likely not the only one, and Memorial Day on May 25, the earliest date the calendar permits, pulled the season’s start forward by a week. The same logic applies to the headline, and the 71,000 three-month average sits comfortably above our breakeven range.
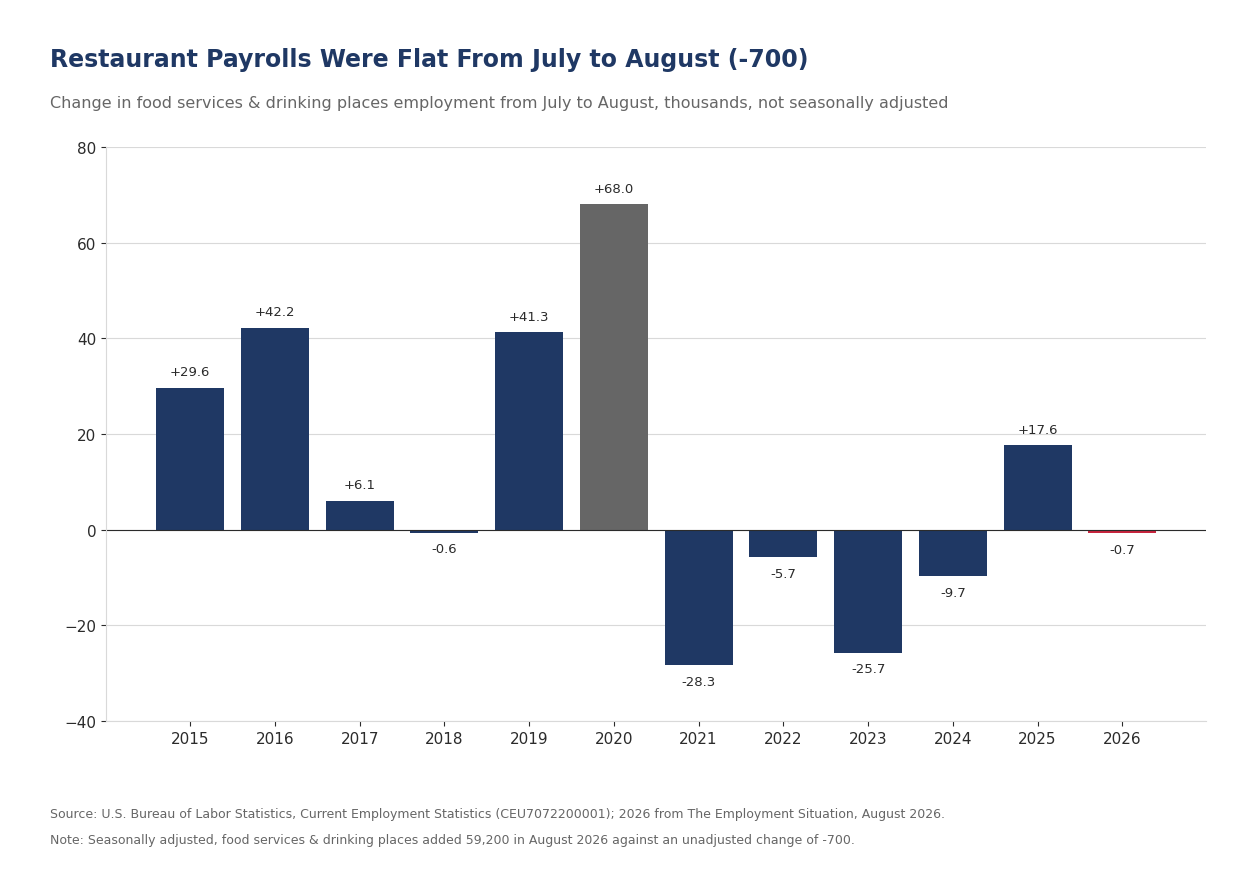
Labor Day’s half of the argument lands in the September report. September 7 is the latest date the calendar permits, which leaves the summer workforce on payrolls through the September survey week. Taken together, 2026 runs 105 days from Memorial Day to Labor Day against 98 in each of the prior two years, the longest span possible, so the calendar effect runs through both prints and the September report, due October 2, carries the second half. That report will also carry the payback in local government education, where the August rebound has run ahead of the unadjusted data.
Local government education posted an outsized 41,900 gain as districts re-hired for the new school year, and the unadjusted data argue for reading it as the other half of July’s swing. BLS describes the August gain as largely offsetting July’s 57,500 decline, the largest July drop in at least a decade, and says the category has shown little net change since January 2025. Unadjusted, districts added 327,300 workers between July and August against 362,100 a year ago, 368,300 in 2024 and 372,500 in 2023, the smallest August re-entry in the past four years, and the category is 51,100 smaller than it was in August of last year. School payrolls are shrinking with enrollment, and we look for part of August’s 41,900 gain to come back out in the September report.
The Factory Sector, After the Order Book Cooled
Manufacturing payrolls rose 16,000 in August and have added 58,000 jobs since December’s low after shedding 56,000 over the second half of last year. Durable goods added 15,000 and nondurables 1,000. Machinery (+6,100), fabricated metals (+5,700) and computer & electronic products (+1,300) led, while motor vehicles & parts gave back 4,500 of July’s 10,700 gain and transportation equipment slipped 1,000 in total, leaving the balance in aerospace and other transportation equipment modestly higher. July’s factory gain was revised up to 14,000 from 5,000 and June’s to 13,000 from 11,000, so the sector’s momentum was stronger through the summer than the first prints showed.
The ISM employment index slipped to 51.2 from 52.8 in July, its second month above the 50.3 threshold ISM associates with rising factory payrolls, so the survey pointed to a small gain and the payroll data delivered a larger and broader one. The orders-to-backlogs-to-hours-to-hiring sequence we described in Tuesday’s ISM report still holds. With the manufacturing diffusion index at 61.1, roughly six of every ten factory industries added workers in August, and the gains came in machinery and fabricated metals, the capital-goods end that responds to the orders and backlogs ISM reported through July. Manufacturing is showing some strength, and it is broadening. New orders fell 3.0 points to 53.7 and backlogs 3.2 points to 51.8, the two largest declines in the report, but hiring follows orders with a lag of several months, so a softer order book in August is a statement about fourth-quarter hiring. The production-worker factory week held at 41.7 hours for a third month, the highest since June 2019, and the all-employee week edged up to 40.5 hours with overtime steady at 3.1. Six tenths of an hour above December’s 41.1-hour production week is worth roughly 184,000 workers at that workweek, against the 58,000 the sector has actually added, so the workweek is still doing work that hiring has not. This remains a productivity-led expansion, and we look for manufacturing employment to post small gains through the fall.
Construction added 22,000 jobs, and the nonresidential side did the hiring. Heavy & civil engineering construction, the category that builds data center campuses, substations, transmission and the site work for large plants, added 4,400 jobs in August, 12,200 before seasonal adjustment, and is up 27,200, or 2.3%, over the past year. Nonresidential specialty trades added 7,800 and are up 86,000, or 3.0%, over the year, and nonresidential building added 26,000 over the same span. Taken together the nonresidential side of construction has added roughly 139,000 jobs in a year in which residential specialty trades lost 20,700, and the same split shows in Tuesday’s construction spending report, where factory construction spending is down 22.2% year to date while data centers and power generation keep rising. Plants announced in 2023 and 2024 are still being finished even as new factory starts have slowed, and the electricity to run the data centers has become its own construction cycle.
Changes elsewhere were small, with professional & business services adding 10,000, temporary help up 6,800 for a third month, transportation & warehousing adding 5,000, wholesale 7,800 and retail 1,400, while financial activities lost 11,000 for a second month.
Tech-centric employment was the weak spot, with information losing 23,000, the largest decline of any industry, as computing infrastructure, data processing and web hosting providers were down 7,700. Publishing, which includes software publishers, lost 6,700, broadcasting 5,000 and telecommunications 2,100. Computer systems design and related services, the largest tech industry outside the information sector, lost 900 jobs and is down 31,300 over the past year, and computer & electronic products manufacturing added just 1,300. Information payrolls are 115,000, or 4.0%, below a year ago, and the two software-heavy categories, computing infrastructure and computer systems design, are down a combined 57,000. The data centers going up across the Southeast are a construction story first and an information-sector payroll story hardly at all, and the firms building them are shedding people in the parts of the business that AI reaches first. The labor-market signature of the capital-led expansion shows up there first, and it is not a bullish one for white-collar hiring.
The Labor Force Is Still the Story
The unemployment rate held at 4.1%, and for once the household survey moved in the same direction as the payroll count. The labor force rose 683,000 and household employment 569,000, so the unemployment rate held on flows in the right direction rather than on a shrinking denominator, and the number of people not in the labor force fell 551,000. Employment among workers 55 and over rose 354,000 while prime-age employment was flat, so the month’s gain came from older workers. The labor force is still 973,000 smaller than a year ago while the adult population is 1.4 million larger, though the January population controls, which raised the 55-and-over population 1.25 million and cut the 25-to-54 population 1.48 million, overstate the year-over-year withdrawal, so rates are comparable across January and levels are not.
The participation rate rose two tenths to 61.6% from July’s 61.4%, the lowest reading outside the pandemic since 1976, and the age split still points to retirement rather than discouragement. The 55-and-over rate rose three tenths to 37.2% from July’s 36.9%, its lowest since March 2005, which accounts for most of the month’s increase, while prime-age participation held at 83.4% and the prime-age employment-to-population ratio at 80.4%. A one-month rebound among older workers does not change the trend. Participation is still down half a point since January, and a cohort with a participation rate near 37% keeps taking a larger share of the adult population from cohorts whose rates exceed 83%, so the aggregate rate falls even if no one changes their mind about working. Peak 65 adds 4.1 million people a year to that cohort through 2027, roughly 11,200 a day, and the retiree tide is still rising. The foreign-born labor force is 379,000 smaller than a year ago, a narrower gap than July’s 550,000, with its participation rate at 65.7% from 66.4% and its unemployment rate down a full point to 3.4%; the native-born labor force is down 608,000 over the same span, a decline that is mostly retirement.
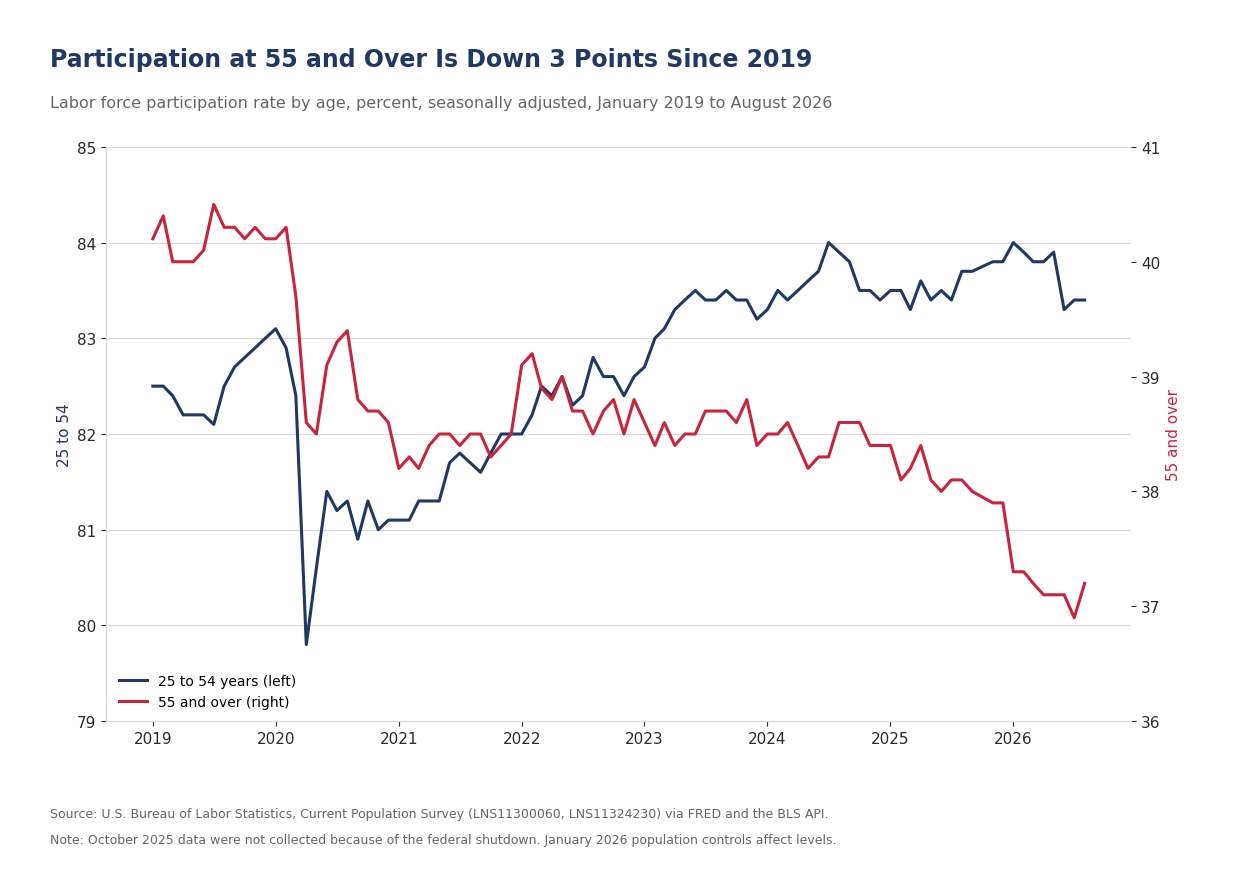
The headline rate is a narrower gauge of the labor market than it used to be, and the broader measures improved with it this month. U-6 fell to 7.7% from 7.9% as the number of people working part time for economic reasons dropped 414,000 to 4.4 million, below the 4.8 million of a year ago, and the employment-to-population ratio rose two tenths to 59.1%. Multiple jobholders were 5.2% of the employed in August, unchanged from a year ago. Continuing claims cover roughly one unemployed worker in four, against half in the 1950s, because independent contractors cannot file a claim in any state, and one hour of paid work is enough to count someone as employed, so we would keep reading those measures beside the headline. None of that says the labor market is secretly weak, and this month none of it says it is secretly strong either; it says the 4.1% rate carries less information than the Committee is asking of it.
A shrinking labor force lowers the bar for what counts as adequate job growth, and the bar has now been lowered in print. If breakeven sits between zero and 40,000 a month, a run of prints in the 20,000 to 50,000 range is a labor market in balance, and a 162,000 print, even one built on a seasonal rebound, is a labor market that has tightened. We feel the breakeven is now slowly rising, however, as jobs are being created in parts of the economy, manufacturing in particular, where they have been lagging, and as workers with valid documentation return as processing normalizes. Neither force is large enough to change the arithmetic this year, and both argue for a higher breakeven by 2027.
Wages, Hours and the Fed
Wage growth cooled again in August even as hours rose. Average hourly earnings rose 10 cents, or 0.3%, to $37.75, and the year-over-year rate slipped to 3.1% from 3.2% in July and 3.5% in June, the slowest pace of the year. Production and nonsupervisory pay rose 11 cents to $32.53. A 3.1% rate of wage growth is consistent with the Fed’s 2% inflation mandate after taking productivity growth into account: nonfarm business productivity rose 2.2% over the year through the second quarter and unit labor costs just 1.4%, according to Thursday’s revised productivity report, and unit labor costs are what firms pass through to prices. Wages are no longer the channel through which this labor market threatens the inflation target, and a Committee looking for a reason to hold in September can find it in this table. Against core CPI at 2.5% and core PCE at 3.3% in July, pay is running ahead of the narrower price measure and slightly behind the broader one, and the gap between those two gauges, the widest since April 2022, is the subject of Sunday’s Perspective. Hours worked jumped, with the workweek up a tenth to 34.4 hours after four months at 34.3, the index of aggregate weekly hours up 0.3% after readings of 0.0% and 0.1% in June and July, and aggregate weekly payrolls up 0.7%. A tenth of an hour across 136 million private payrolls is the equivalent of roughly 400,000 jobs at the July workweek, so third-quarter output is tracking better than the summer payroll prints implied. Employers are paying more people for more hours at a slower rate of pay growth, the combination we would expect from a labor market in balance.
The report landed six days into a debate about whether to wait one meeting, and the calendar makes it two. Governor Waller said Thursday that his vote turns on the August CPI on September 11 and that if disinflation holds he would support leaving the funds rate at 3.50% to 3.75%, and we agree with him. The meeting after September is October 27 and 28, six days before the midterm elections, and this Committee is not going to move the funds rate in that window, so a September hold is a hold until December 8 and 9. Futures put the odds of a September increase at 53% after the release, from 49% on Thursday, roughly two-thirds after Jackson Hole and near even after Waller spoke, so the report moved the market by about four percentage points and left the decision a toss-up. The 2-year yield rose about 6 basis points to 4.41% and the 10-year about 3 basis points to 4.79%, leaving the 2s-10s spread near 38 basis points, a bear flattening. The hawks will cite the headline and the workweek. The doves will cite wage growth at 3.1% and a participation rate that finally rose. Nothing in this report argues for moving in September. A 162,000 print built on two categories swinging back from distorted July readings is not evidence of a labor market re-accelerating, and on the question in front of the Committee, which is inflation, the report leans the other way.
Our Call · Wider Swings, Same Trend, No Change for September
Yields rose and the odds of a September increase edged up to 53% from 49% within minutes of the release. We would not extrapolate this print any more than we extrapolated July’s. Restaurants and bars had far fewer summer workers to shed in August because they hired so few in June and July, and the seasonal factors turned a flat month into the largest gain in the report, which is the arithmetic we set out on August 10; local government education swung back by an outsized 41,900 after its July drop. Those two categories are 104,000 of the 162,000, and both have swung harder than usual in both directions this summer. The three-month average of 71,000 is the number to carry, and leisure & hospitality has lost 13,000 jobs over the three months of the summer. Without the two calendar categories payrolls rose roughly 58,000 in August, against a breakeven we now put at zero to 40,000 a month, manufacturing hiring is broadening across six of every ten factory industries, and hours worked jumped. A labor market that holds its unemployment rate at 4.1% on that much hiring is small, not weak, and the binding constraint is still a labor force that is nearly a million smaller than a year ago, and no setting of the funds rate changes the size of the labor force. Nothing here changes our forecast, and we do not believe it should change the Federal Reserve’s thinking for September. We look for the Committee to hold on September 16, no cut in 2026 and a first quarter-point increase in December, after the midterms, with one more in 2027 to a terminal 4.00% to 4.25%. Waller asked what it costs to wait one meeting; this report does not answer his question, the August CPI on September 11 does, and wage growth at 3.1%, a pace consistent with the 2% mandate once productivity is counted, argues that the answer will be very little. The condition that would move us on rates is two or three more months of core services outside of shelter running near 0.4% with shelter no longer decelerating, and the first of those readings arrives on September 11. September’s print carries the second half of the calendar, with Labor Day on September 7 holding summer staff into the survey week, and we would wait for it before calling the trend higher.
Mark P. Vitner – Chief Economist, Piedmont Crescent Capital
mark.vitner@piedmontcrescentcapital.com · (704) 458-4000
Sources: U.S. Bureau of Labor Statistics, The Employment Situation, August 2026, Current Employment Statistics preliminary benchmark revision and Quarterly Census of Employment and Wages; U.S. Department of Labor, Unemployment Insurance Weekly Claims; Institute for Supply Management; Board of Governors of the Federal Reserve System; Federal Reserve Banks of Atlanta, Dallas and St. Louis; CME Group. Disclaimer: This report is provided for informational purposes only and does not constitute investment, legal, tax, or accounting advice, nor an offer or solicitation to buy or sell any security. Information is drawn from sources believed to be reliable, but its accuracy and completeness are not guaranteed. Views expressed are those of the author as of the date of publication and are subject to change without notice. Past performance is not indicative of future results.
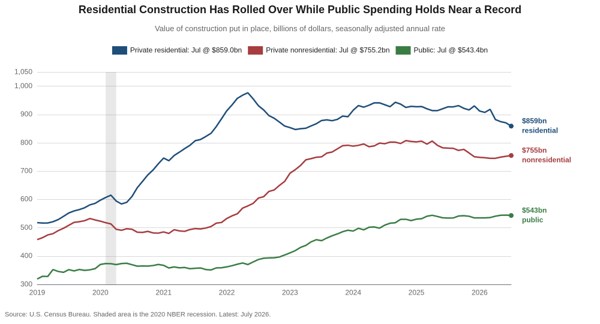
July Construction Spending: Building Fewer Factories, Buying More Equipment
Building Fewer Factories, Buying More Equipment
Construction spending slipped 0.5 percent in July and is 3.8 percent below a year ago, with factory construction down 22 percent so far this year and a third below its 2024 peak, even as orders for the equipment that goes inside those buildings reached a high.
Early Signals
- The headline decline is not statistically significant. Construction spending fell 0.5 percent in July to a $2,157.6 billion annual rate, but Census puts the confidence interval at plus or minus 0.8 percent, so the monthly change cannot be distinguished from zero. The 3.8 percent decline from a year earlier can be.
- Factory construction is the weakest category in the report. Manufacturing construction fell 1.0 percent in July to $169.8 billion and is down 22.2 percent in the first seven months of the year, more than twice the decline in the next weakest category. It has now fallen 32 percent from its September 2024 peak.
- Ninety-five percent of that decline is a single subcategory. Computer, electronic and electrical construction fell 45.4 percent for the year to date, $27.7 billion of a $29.1 billion drop in private manufacturing construction. Strip it out and the rest of factory building is down 2.1 percent.
- The equipment side of the same capital cycle set a high. Orders for nondefense capital goods excluding aircraft reached $85.9 billion in July, up 12.9 percent from a year earlier and the highest monthly reading in a series that begins in 1992.
- Data centers are the fastest growing category in the report. Census reports them separately from other office construction in its detailed table. Data center construction ran $37.2 billion in the first seven months of the year, 34.8 percent above the same period in 2025, while every other kind of office building fell 9.5 percent. Data centers were 57 percent of private office construction, against 47 percent a year earlier.
- Residential kept sliding and single-family led it down. Private residential construction fell 1.3 percent to $859.0 billion, and is down 4.1 percent in the first seven months of the year. New single-family construction fell 3.2 percent in July, the largest monthly decline of any private category in the report.
Key Takeaways
| Key Concept | Findings |
|---|---|
| Total Construction | $2,157.6 billion at an annual rate, down 0.5 percent from June’s revised $2,167.7 billion and 3.8 percent below July 2025. Spending in the first seven months of the year totaled $1,244.6 billion, 3.5 percent below the same period in 2025. |
| Private Construction | Down 0.5 percent to $1,614.2 billion, one of only two figures in the release text that clears its confidence interval. Residential fell 1.3 percent to $859.0 billion and nonresidential rose 0.4 percent to $755.2 billion. |
| Manufacturing | Down 1.0 percent in July to $169.8 billion, and 22.2 percent below the same seven months of 2025, the weakest of the 17 categories Census publishes. Computer, electronic and electrical construction is 95 percent of the decline; everything else is down 2.1 percent. The level is still more than double the 2019 average of $81.0 billion, so this is a boom unwinding rather than a sector in trouble. |
| Data Centers | Up 34.8 percent in the first seven months of the year to $37.2 billion, the fastest growing category in the report, and accelerating: July alone ran 57.2 percent above a year earlier and 118 percent at a three-month annualized rate. Data centers were 57 percent of private office construction against 47 percent a year ago, and 8.6 percent of all private nonresidential construction against 6.0 percent. |
| Traditional Office | Down 9.5 percent in the first seven months of the year to $37.6 billion, one of the weakest categories in the report. General office building alone fell 11.8 percent. The office aggregate, up 8.2 percent, is the average of a boom and a bust and describes neither. |
| Announcements vs. Starts | More than $5 trillion of foreign investment has been pledged, but the Peterson Institute finds fewer than 30 percent of those dollars have an identified project. The lag from announcement to groundbreaking runs nine months for electrical equipment, seventeen for steel and twenty-eight to thirty-nine for semiconductors, so the announced plants are 2027 and 2028 spending, not 2026. |
| Peak Data Center? | Not in anything this release measures. The political constraint is real and growing, with 56 formal public actions across 25 states and Texas pausing all new grid interconnections on August 3, but almost all of it raises the cost of a data center without reducing the number of them, and 80.4 percent of the record capacity under construction is already preleased. |
| Residential | Down 1.3 percent to $871.2 billion including public, 4.1 percent below the same seven months of 2025 and 7.3 percent below July 2025 alone. New single-family fell 3.2 percent to $395.2 billion. New multifamily rose 0.2 percent to $115.1 billion and is close to flat over the year. |
| Public Construction | Down 0.2 percent to $543.4 billion, within the confidence interval, and up 0.8 percent in the first seven months of the year. Highway and street spending is up 2.4 percent and conservation and development 23.8 percent. Public spending sits within a whisker of its June record. |
| Breadth | Ten of the 17 categories Census publishes grew in the first seven months of the year and seven declined. The distribution runs from religious at plus 24.7 percent to manufacturing at minus 22.2 percent, and splitting data centers out of office puts the top of the range at plus 34.8 percent. |
| Alongside the ISM | This morning’s ISM report showed factory production expanding for a tenth month and new orders for an eighth. Factories are running harder while fewer new ones are being built, which is the rotation from structures to equipment that this release measures from the other side. |
| Policy Signal | The weakness is concentrated in two categories with causes a rate cut does not address. We continue to look for the Fed to hold through the meetings before the November 3 midterm elections and to raise the target range in December, with one further increase in 2027 to a terminal 4.00 to 4.25 percent. |
The Overview
Construction spending fell 0.5 percent in July to a seasonally adjusted annual rate of $2,157.6 billion, and the first thing to say about that number is that it may not be a decline at all. Census puts the 90 percent confidence interval on the monthly change at plus or minus 0.8 percent, which contains zero, and its own explanatory note says it can take two months to establish an underlying trend for total construction and as long as eight months for individual categories. The 3.8 percent decline from a year earlier does clear its interval, as does the 3.5 percent shortfall in the first seven months of the year against the same period in 2025. Read the year, not the month.
The categories run from plus 34.8 percent to minus 22.2 percent so far this year. A single figure covering a $2.2 trillion aggregate is going to bury a spread that wide, and in this release it buries the whole story. Two categories account for nearly the entire decline, and both are unwinding booms of their own making, while one category is growing faster than anything else in the report and is now large enough to hold up the aggregate on its own.
Private nonresidential construction actually rose in July, by 0.4 percent to $755.2 billion, and that is one of only two figures in the release text that clears its confidence interval. Public construction was essentially flat at $543.4 billion, a whisker below the record it set in June. What fell was private residential, down 1.3 percent to $859.0 billion, and inside private nonresidential the composition did far more work than the total.
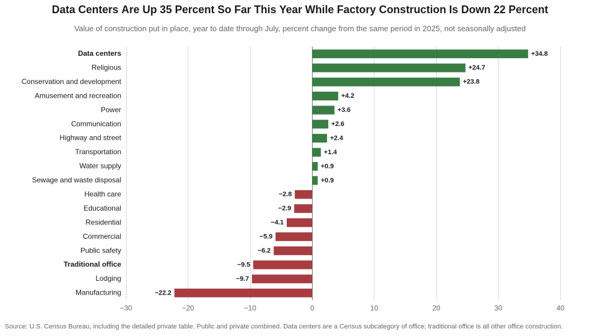
The Factory Building Cycle Has Turned
Manufacturing construction fell 1.0 percent in July to $169.8 billion and is 22.2 percent below the same seven months of 2025, the weakest reading of the 17 categories in the report. The private share, which is almost all of it, fell 22.5 percent. Against its September 2024 peak of $250.2 billion, spending on factories has fallen 32 percent in twenty-two months.
One subcategory is 95 percent of the decline. Census breaks private manufacturing construction into seven subcategories, and one of them accounts for almost the whole decline. Computer, electronic and electrical construction ran $33.3 billion in the first seven months of the year against $61.0 billion in the same period of 2025, a fall of 45.4 percent and $27.7 billion. Private manufacturing construction as a whole fell $29.1 billion. That subcategory has gone from 47 percent of factory construction to 33 percent in a year.
The other six subcategories moved by less than a billion dollars each. Chemical plant construction, the second largest subcategory at $25.0 billion, is down 1.2 percent. Transportation equipment is down two tenths. Food, beverage and tobacco is up 5.1 percent and plastic and rubber up 11.0 percent. Strip out computer, electronic and electrical and the rest of factory construction is down 2.1 percent for the year, which is close to flat. Chemicals matter more than their share suggests, because chemical output is an input to most other manufactured goods, so a stable chemical build is a better read on the breadth of industrial investment than the manufacturing headline is.
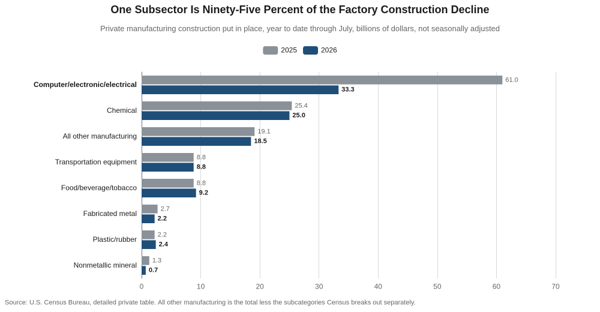
The subsidies did not start the boom, but they doubled it. The CHIPS and Science Act and the Inflation Reduction Act were both signed in August 2022, and the shorthand is that they created the boom. The data say they extended one already running. Factory construction was $76.4 billion in January 2021, essentially its 2019 level, and had reached $128.1 billion by the month the two acts were signed, a gain of 68 percent before either took effect. It then nearly doubled again, to the September 2024 peak of $250.2 billion. The subsidies did not start the cycle; they roughly doubled it and concentrated it in one subcategory.
A semiconductor fab takes three to five years to build, and the 2022 cohort is finishing now. Nothing behind that cohort matches it in scale, which is what the Census subcategory is measuring. The 2019 average for all factory construction was $81.0 billion, so at $169.8 billion the sector is still building at more than twice the pre-pandemic rate. A boom unwinding toward a higher base ends somewhere above where it started, and a sector in trouble does not.
Unfilled orders for capital goods reached a record $953.2 billion in July. The capital cycle did not stop when the buildings did. Orders for nondefense capital goods excluding aircraft reached $85.9 billion in July, up 12.9 percent over the year and the highest monthly reading in a series that begins in 1992. Manufacturing construction has fallen back, however, to 120 percent above its January 2019 level from a peak of 224 percent above it, while core capital goods orders have climbed to 26 percent above the same base and are still rising. That backlog is 9.2 percent above the same month last year and the highest the series has recorded. Firms have stopped adding walls and are filling the ones they built, which is what the house forecast of 6.1 percent growth in nonresidential fixed investment this year has been describing all along.
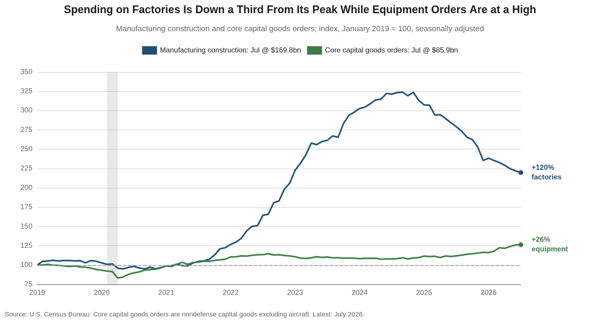
From Announcement to Groundbreaking
The gap between what has been announced and what has been built appears to be the widest on record. The Peterson Institute counted more than $5 trillion of foreign investment pledges made to the United States in the past two years, about 18 percent of last year’s gross domestic product, from the United Arab Emirates at $1.6 trillion down through Japan at $550 billion, Taiwan at $500 billion and South Korea at $350 billion. Fewer than 30 percent of those dollars have an identified project attached to them, and Peterson says the metrics for verifying the pledges are unclear. Set against the flows these countries actually sent before the pledges, the numbers are large. Japan averaged $39 billion a year of direct investment into the United States between 2020 and 2024, so $550 billion is 14 years of it. South Korea averaged $6.4 billion, so $350 billion is 55 years of it.
The structures matter more than the headline figures. Japan’s $550 billion is not equity. The St. Louis Fed read the structure and found cash flows split evenly until Japan recovers its principal and a deemed rate of interest and 90 to 10 in favor of the United States after that, with Japan taking no ownership in the projects, which makes the commitment resemble a loan. Korea’s agreement carries a $20 billion annual cap, which turns $350 billion into a program lasting more than seventeen years. Commerce named the first tranche of Japanese projects in February, $35.7 billion, or 6.5 percent of the total, and it was a natural gas power plant in Ohio, a crude oil export terminal on the Gulf and one small industrial facility in Georgia. Only the third of those is manufacturing.
Several of the largest figures in circulation are not capital spending at all. Apple’s $600 billion covers direct hiring, supplier and partner purchases across all fifty states, data centers and component partnerships, with no published split among them. Nvidia’s $500 billion is a target for the value of American-made equipment the company intends to sell over four years, which is a revenue figure rather than a capital budget. Micron’s $250 billion runs through 2035. These are not comparable to one another and none of them is an annual number, so adding them tells you nothing about what will be poured next year.
What separates an announcement from a construction dollar is time, and the lags are long. Toyota announced its Liberty, North Carolina battery plant in December 2021, broke ground eight months later and started production in November 2025, four years after the announcement, and that is the fast case. Micron announced its Clay, New York site in October 2022 and broke ground in January of this year, thirty-nine months later. SK Hynix announced West Lafayette, Indiana in April 2024 and started construction on August 29, twenty-eight months later, with mass production scheduled for 2029. Susan Spence, who chairs ISM’s survey committee, puts it at three to five years from deciding to build a factory to opening it, and every completed case we could date is consistent with that.
The Backlog That Has Not Broken Ground
The largest steel mill announced last year has taken seventeen months to reach groundbreaking. Hyundai Steel announced a $5.8 billion electric arc furnace mill at Donaldsonville, Louisiana on March 24 of last year. Ground has still not been broken; the ceremony is scheduled for this Friday, seventeen months after the announcement, with production slated for 2029. Nippon Steel has committed $11 billion in the United States by 2028 and has publicly allocated about half of it, including up to $2.5 billion at Mon Valley announced in June for a new hot strip mill and the replacement of an eighty-seven-year-old one. That is a two-year build that has not started. Cleveland-Cliffs announced a $1 billion modernization at Middletown, Ohio on August 21, half of it Department of Energy money, with construction beginning within weeks and the blast furnace rebuild finishing in the first quarter of 2030.
One steel project is nearly finished, and it shows what the difference looks like. Nucor’s $4 billion sheet mill at Apple Grove, West Virginia was 85 percent complete in April and is commissioning through this year for a commercial start in early 2027. It absorbed 40 percent of the company’s capital spending in the first quarter. One mill at that stage is worth more to next year’s construction spending than a dozen announcements.
Hitachi Energy went from announcement to groundbreaking in nine months. Hitachi Energy broke ground on a $457 million transformer plant at South Boston, Virginia on June 29, nine months after announcing it, as part of a commitment of more than $1 billion. GE Vernova is spending close to $600 million across ten American sites over two years, including gas turbine capacity at Greenville and Schenectady and switchgear at Charleroi. Siemens Energy is building transformer capacity at Charlotte. These move faster than the steel and semiconductor projects because most of them expand plants that already exist on sites that are already permitted and already connected to the grid.
Siemens Energy’s turbine backlog runs four and a half years deep at current delivery rates. GE Vernova’s gas equipment backlog and slot reservations went from 100 to 116 gigawatts in a single quarter, though the two are not the same thing and the firm order book is the smaller 53 gigawatts of it. Siemens Energy carries a 69 gigawatt gas turbine backlog against 15 to 16 gigawatts of annual deliveries, which is four and a half years of work, and says lead times across the company now run three years or more. Mitsubishi’s large-frame backlog went from 23 to 35 gigawatts and the orders it booked last quarter deliver between 2028 and 2030. Lead times published last year ran 128 weeks for power transformers and 143 weeks for generation step-up units, and demand for the latter had risen 274 percent since 2019. None of that shows up in a construction spending report for years.
The counterweight is that the pipeline is thinner than the announcement flow suggests. Dodge expects manufacturing construction starts to fall 24 percent this year. The Clean Investment Monitor, which separates capital actually deployed from capital announced, put announced clean manufacturing investment down 79 percent from a year earlier in the first quarter and actual investment down 34 percent, the weakest quarter of real spending in nearly three years, with cancellations of $1.6 billion in the first quarter and $1.7 billion in the second. Contractors with data center work carry 11.4 months of backlog against 7.5 months for those without, and only 12 percent of Associated Builders and Contractors members have any of that work.
Both things are true, and they resolve on different timetables. Read the two together and the announcements are neither the mirage the cancellation figures suggest nor the boom the pledge totals suggest. A transformer plant announced last autumn is being poured now, on a nine-month lag; a steel mill announced last spring becomes construction spending in 2027 and 2028, on a seventeen-month lag; and a semiconductor fab announced this year does not reach the data until the end of the decade, on a lag of twenty-eight to thirty-nine months. We expect factory construction to keep falling through the first half of 2027 and to find a floor as the steel and grid-equipment cohort starts pouring, unless the policy that justified those projects changes first.
Where the Money Is Still Going
Office construction was the strongest of the large categories, up 2.9 percent in July to $140.1 billion and 8.2 percent for the year to date, and the private share reached a record $123.3 billion. Nothing in the leasing market explains that, and the detailed Census table shows why it does not have to. Census reports office construction in three parts, general, data center and financial. Data centers came to $37.2 billion in the first seven months of the year against $27.6 billion in the same period of 2025, a gain of 34.8 percent, while every other kind of office building fell 9.5 percent. The category is two businesses moving in opposite directions, and the aggregate is the average of a boom and a bust.
Power construction passed manufacturing in May and is now $11.7 billion above it, $181.5 billion against $169.8 billion, having been $65 billion below it as recently as December 2023. Power rose 0.5 percent in July and is up 3.6 percent for the year to date. Highway and street spending is 2.4 percent higher than the same seven months of 2025, conservation and development 23.8 percent higher, and communication construction 2.6 percent higher. These are the categories that serve the same buildout, and they are the reason public construction has risen in each of the past five years.
The categories that are not part of that buildout are flat to lower. Health care fell 0.5 percent in July and is down 2.8 percent for the year to date, educational construction is down 2.9 percent, and lodging is down 9.7 percent. The eds-and-meds categories that carried nonresidential construction through the last cycle are no longer contributing, and neither is anything tied to discretionary consumer spending.
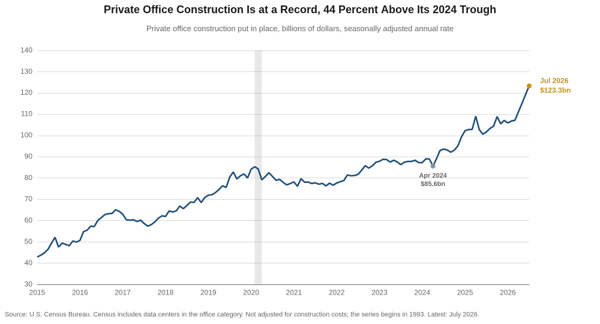
Are We at Peak Data Center?
Data center construction accelerated through the summer, and the July figures answer the question in the direction the political coverage would not suggest. Data center construction rose 6.2 percent in July, its fifth consecutive monthly gain of more than 6 percent, and is running at a 118 percent annualized rate over the past three months. Spending has gone from $58.1 billion in March to $75.2 billion in July. Whatever is happening at the leading edge of this buildout, nothing has slowed in the spending data.
Office and data centers are two different businesses inside one Census line, and separating them changes what the category says. Census separates them in its detailed private table, in a subcategory covering buildings that contain the hardware needed for storing, processing and transmitting digital information. Data centers came to $37.2 billion in the first seven months of the year against $27.6 billion in the same period of 2025, up 34.8 percent, while general office building fell 11.8 percent and every other kind of office construction taken together fell 9.5 percent. Data centers passed the halfway mark of the category this year, at 57 percent of private office construction for the year to date against 47 percent a year earlier, and 61 percent in the month of July alone.
The category is now large enough to move the aggregate on its own. Private nonresidential construction is down 5.6 percent in the first seven months of the year. Take data centers out of both ends of that comparison and the remainder is down 8.2 percent. Data centers added $9.6 billion against the same period last year while manufacturing gave up $28.8 billion, so one category offset a third of the largest decline in the report. At the July run rate the offset is larger still, $27.4 billion against $46.5 billion at annual rates. Private nonresidential construction excluding data centers is having a considerably worse year than the headline suggests.
Census measures work put in place, which is the last thing to happen rather than the first. A project pouring concrete this month was financed a year ago and permitted before that, so put-in-place spending is a record of decisions taken a year or more ago. The leading edge sits in the interconnection queue and the permit docket, and both have tightened this year.
One private tracker counts 56 formal public actions against data center projects across 25 states, most of them taken between May and August of this year, running from local moratoria to state bills to outright project rejections. Tax incentives are being reconsidered where they are largest, with Virginia’s exemption costing about $1.6 billion in the most recent year, up 118 percent, and Georgia putting its foregone revenue at $2.5 billion, several times an earlier estimate. The largest single action came on August 3, when the governor of Texas directed the state utility commission and ERCOT to audit every data center seeking a grid interconnection. That queue holds more than 1,800 projects representing over 474 gigawatts, more than five times the state’s record peak demand, and roughly 90 percent of new power requests in Texas now come from data centers. The Energy Information Administration cut its forecast for Texas load growth in 2027 to 6 percent from 14 percent in its August outlook, citing the pause.
The pipeline already under contract is large enough to carry spending for another year whatever happens to new approvals. CBRE puts North American data center vacancy at 1.4 percent, a record low, with 7,481 megawatts under construction, also a record, and 80.4 percent of that capacity already preleased. Fewer than 1,500 megawatts are uncommitted across the primary markets, which is about six months of absorption. The four largest hyperscalers raised their 2026 capital budgets through the year, and did so against visible investor resistance. If new approvals stopped tomorrow, construction spending on this category would keep rising well into next year.
Producer prices for the equipment the buildout consumes have risen nearly three times as fast as producer prices generally. The producer price index for transformers and power regulators rose 7.6 percent over the year through July and has climbed 89 percent since January 2019. Switchgear and switchboard apparatus rose 8.9 percent over the year and 96 percent since 2019. The producer price index for final demand rose 33 percent over the same period. Transformer prices jumped 4.2 percent in July alone after four flat months, which is worth watching in the September 10 release.
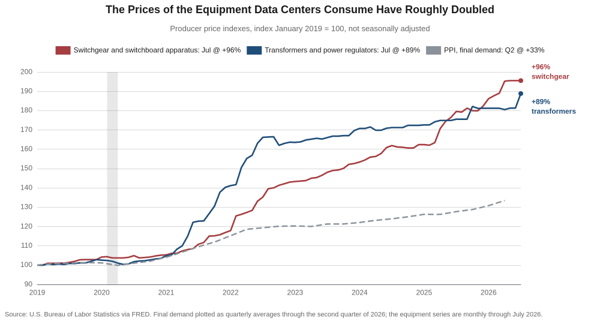
Electricity is the second channel. PJM’s most recent capacity auction cleared at $333.44 per megawatt-day for the 2027 to 2028 delivery year at a total cost of $16.4 billion, and nearly all of the roughly 5,250 megawatt increase in its forecast peak load was attributable to data centers. The Dallas Fed estimates that existing data centers have already raised wholesale generation costs by 5 to 15 percent nationally, and that the pass-through to consumer inflation through retail electricity amounts to about five hundredths of a percentage point on PCE this year, rising toward a tenth of a point by 2030. The Committee named the channel itself in the minutes of the July meeting, observing that materials for data centers such as chips and steel had registered large price increases and that electricity had been subject to price pressures as well.
The blowback so far raises the cost of the buildout without reducing its size, which points the wrong way for anyone hoping it cools inflation. State moratorium bills failed in all eleven states that filed them, and local moratoria have proven vulnerable to litigation, with one Texas county rescinding its own within weeks of a developer lawsuit and a second abandoning its plans on the strength of that example. What has passed instead is cost allocation. Oregon’s new large-load tariff requires customers above 20 megawatts to fund distribution upgrades in full, pay minimum demand charges on 90 percent of contracted capacity, sign contracts running as long as 30 years and pay a surcharge of one cent per kilowatt-hour above 100 megawatts. Virginia and North Carolina have added electricity taxes, and several states are repealing sales tax exemptions. Every one of these raises the cost of building and running a data center. None of them reduces the demand for transformers.
The Texas interconnection pause is the exception, because it constrains quantity rather than price, and the EIA has already marked its forecast to it. Whether it binds is not yet known. The directive came as a letter with no stated end date, and it exempts projects with on-site generation and everything outside ERCOT. It is the one action in the set large enough to move the national figures, however.
None of this changes what we expect the Committee to do on September 16. We have looked for a hold at the meetings before the November 3 midterm elections since late August, and nothing here changes that. The argument bites on December, and there it cuts both ways. If the buildout is the marginal source of the goods and electricity price pressure the Committee named in July, a genuine slowdown would remove a reason to move. The Dallas Fed’s estimate of the size of that pressure, roughly five hundredths of a point on PCE this year, is not large enough to hike over on its own, and it is not large enough to hold over either.
Two things would tell us the peak has arrived, and we would want to see them in this order. Transformer and switchgear prices rolling over would say the equipment bottleneck is clearing. A second state following Texas into an interconnection pause would say the quantity constraint is spreading beyond one market. Neither has happened. Until one does, the July data say the buildout is running at the fastest pace of this cycle and that its constraint has moved from capital to permission, which raises its cost rather than lowering it.
Residential Is the Other Drag
Private residential construction fell 1.3 percent in July to $859.0 billion and is 4.1 percent below the same seven months of 2025, and 7.3 percent below July 2025 alone. New single-family construction fell 3.2 percent to $395.2 billion, the largest monthly decline of any private category in the report, and is down 5.7 percent for the year to date. New multifamily rose two tenths to $115.1 billion and is down three tenths for the year to date, so the weakness is entirely on the single-family side.
Single-family starts fell to 808,000 in July from 1,017,000 in March. Builders are cutting production against an inventory of completed new homes for sale that peaked at 128,000 in January and stood at 117,000 in July. That level is higher than any month in the series before 2025, when the previous record was 96,000 in January 2010. Builders are working down a record overhang, and the construction spending data are the arithmetic of that decision showing up two quarters after the decision was made.
Reading the Two Releases Together
The ISM Manufacturing PMI and the construction spending report landed within an hour of each other this morning, and they describe the same economy one month apart. ISM is an August survey of what purchasing managers saw last month, while Census is a July count of dollars actually put in place, which lags the decision to spend by months. The two are measuring different ends of the same process, however, so the places where they agree carry more than either does alone.
ISM had factory production expanding for a tenth consecutive month in August, at 58.3, and new orders for an eighth, at 53.7. Census has factory construction down 22.2 percent so far this year. Existing plants are running harder while fewer new ones go up, and core capital goods orders at a high say the money has moved inside the buildings. That is the conditional capital argument we made in our data center work, seen from the construction side.
The demand for what the buildout consumes shows up in both releases. ISM panelists described photonics, high-speed connectors, semiconductors and AI infrastructure demand expanding significantly, and ISM’s Computer & Electronic Products industry reported higher new orders in August. Census has private office construction, which is where data centers are counted, at a record level and up 10.2 percent in the first seven months of the year, with power construction up 3.6 percent alongside it.
The residential signal agrees as well. We wrote in this morning’s ISM note that we suspected much of the deceleration in new orders was coming from the slowdown in residential construction, and this release supports it from the other direction. Wood Products was one of only two industries ISM shows contracting in August, with lower new orders, lower production and lower backlogs, and Census has new single-family construction posting the largest monthly decline in the report.
Neither release adjusts for prices. Census states that its data are adjusted for seasonality but not for price changes, and the ISM Prices Index has signaled rising input costs for 23 consecutive months, with steel, aluminum and tariffs named as the primary drivers. Nominal construction spending 3.8 percent below a year ago, against input costs that have risen over the same period, means the decline in real activity is larger than these figures show.
The composition of this release matters more than its level, and the composition is not weak across the board. Two categories account for nearly all of the year-over-year decline, and both are working off booms of their own. Factory construction is 32 percent below its peak and still more than double its 2019 level, and single-family building is adjusting to a record inventory of completed homes. Meanwhile private nonresidential spending rose in July, public construction sits beside a record, and office construction is at one. We expect total construction spending to keep drifting lower into the fourth quarter on the residential and factory categories while the aggregate understates what the rest of the sector is doing.
We are holding the nonresidential investment call, and this release is why. The construction data measure the structures half, and it is falling. Core capital goods orders measure the equipment half, and it is at a high. Our forecast of 6.1 percent growth in nonresidential fixed investment this year requires exactly that split to hold, since structures are a smaller share of the total than equipment and intellectual property together. Nothing in the July figures argues against it, and the ISM production and new orders readings this morning argue for it.
A construction sector 3.8 percent smaller than a year ago is the case for a rate cut. We are not taking it. The weakness sits in two categories whose causes a quarter-point cut does not reach, a subsidy-driven factory building boom unwinding on its own schedule and a housing market working through the largest overhang of finished homes on record. The parts of construction least sensitive to the funds rate, which are public works, power and data centers, are at or near records. We look for the Fed to hold through the meetings before the November 3 midterm elections and to raise the target range in December, with one further increase in 2027 to a terminal 4.00 to 4.25 percent.
Two readings would change the view. If private nonresidential spending falls for two more months while manufacturing keeps sliding, the rotation described here stops being a rotation and becomes a downturn in business fixed investment, and our nonresidential investment forecast would be too high. The second is public construction, which has carried the aggregate for three years on federal infrastructure money that is now largely obligated. A rollover there would remove the one steady support in this release, and it would arrive without a boom to blame.
Mark P. Vitner – Chief Economist, Piedmont Crescent Capital
mark.vitner@piedmontcrescentcapital.com · (704) 458-4000
Disclaimer: This report is provided for informational purposes only and does not constitute investment, legal, tax or accounting advice, nor an offer or solicitation to buy or sell any security. Information is drawn from sources believed to be reliable, including the U.S. Census Bureau, the Institute for Supply Management, the U.S. Bureau of Labor Statistics and the Federal Reserve Board, but its accuracy and completeness are not guaranteed. Views expressed are those of the author as of the date of publication and are subject to change without notice. Past performance is not indicative of future results.
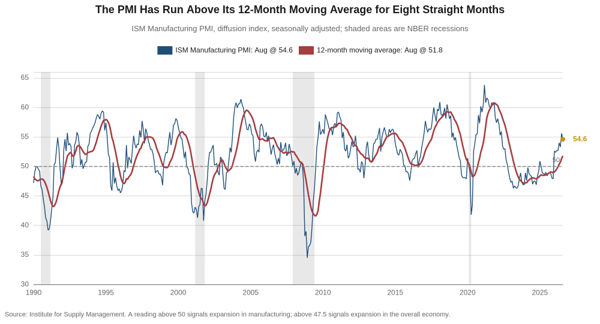
ISM Manufacturing Report: Hiring Arrived Just As the Order Book Cooled
Hiring Arrived Just as the Order Book Cooled
The Manufacturing PMI slipped a point to 54.6 in August as new orders and backlogs gave back most of July’s gain, while the Prices Index held at 71.1 for a second month and the latest payroll data showed factory employment rising for a second straight month.
Early Signals
- The expansion continued at a slower pace. The Manufacturing PMI registered 54.6 in August, 1 percentage point below July’s 55.6 and the eighth consecutive month above 50. ISM’s own mapping puts that reading at 2.4 percent real GDP growth on an annualized basis, four tenths below what the July reading implied.
- New orders gave back most of July’s gain. The New Orders Index fell 3 points to 53.7 and the Backlog of Orders Index fell 3.2 points to 51.8, the two largest declines in the report, and the biggest disappointment, though both have now been in expansion for eight months.
- Production barely moved. The Production Index slipped two tenths to 58.3 and has expanded for ten consecutive months. Twelve of 18 industries reported higher output and two reported less.
- Hiring held, narrowly. The Employment Index fell 1.6 points to 51.2, a second month above 50. In the raw responses, 76.7 percent of panelists reported no change in head counts, the highest share in the four months the release publishes. This remains a productivity-led expansion.
- Prices did not move at all. The Prices Index registered 71.1 for a second consecutive month, a 23rd month of rising input costs, with steel, aluminum, tariffs and petroleum-based products still named as the primary drivers.
Key Takeaways
| Key Concept | Findings |
|---|---|
| Manufacturing PMI | Fell to 54.6 from 55.6, an eighth straight month of expansion following a ten-month contraction. The 12-month average is 51.8, with a high of 55.6 in July and a low of 47.9 in December. ISM’s mapping corresponds to 2.4 percent real GDP growth on an annualized basis. |
| New Orders and Backlogs | New orders fell 3 points to 53.7 and backlogs fell 3.2 points to 51.8. Eleven industries reported higher new orders and three reported declines. Customers’ inventories improved to 42.8 from 40.7 and have been judged too low for 23 consecutive months, which historically points to future production. This is where ongoing geopolitical and policy uncertainty is taking a toll. |
| Production | Down two tenths to 58.3, a tenth consecutive month of growth. Twelve industries reported higher output, while Wood Products and Computer & Electronic Products reported less. |
| Employment | Down 1.6 points to 51.2, a second month in expansion. Seven industries added workers, three cut them and eight were unchanged. The ratio of panelists hiring to those managing head counts narrowed to 1.3 to 1 from 1.5 to 1 in July. |
| Prices | Unchanged at 71.1, a 23rd month of increases. The share paying more fell to 46.2 percent from 50.2 percent, but the share paying less fell to 4.0 percent from 8.1 percent. Fifteen industries paid more for raw materials and none paid less. |
| Supplier Deliveries | Slower for a ninth month, at 59.3, and the only one of the five headline components to improve. Fourteen industries reported slower deliveries and none reported faster. Lean inventories and shortages in parts of the economy are behind the slower deliveries. |
| Trade | New export orders rose two tenths to 53.2 for a second month of growth, while the Imports Index fell 3.2 points to 52.5 from July’s 55.7. |
| Breadth | Fifteen of 18 industries grew and two contracted, Wood Products and Chemical Products. By GDP weight, however, the contracting share widened to 22 percent from 20 percent, and 2 percent of manufacturing GDP was in strong contraction against none in July. Chemical Products alone is close to a fifth of manufacturing value added. |
| Policy Signal | Growth that is decelerating without contracting, alongside input costs still in the 70s, argues for patience rather than a pivot. We look for the Fed to hold through the meetings before the November 3 midterm elections and to raise the target range in December, with one further increase in 2027 to a terminal 4.00 to 4.25 percent. |
The Overview
The Manufacturing PMI fell 1 percentage point to 54.6 in August, its first decline since June and its eighth consecutive month above 50, and the composition of that decline matters more than its size. Four of the five components that feed the headline weakened, and the one that improved, supplier deliveries, is the inverted gauge, so slower deliveries added eight hundredths of a point to an index that fell a full point. New orders alone accounted for six tenths of the decline. That is a demand story rather than a supply story. Remember that the ISM index is a diffusion index and provides a reading on the breadth of the strength in the factory sector, not the magnitude of that strength.
The gap between the two breadth measures in this report is almost entirely one industry. Fifteen of 18 industries grew in August, yet ISM reports that 22 percent of manufacturing GDP was contracting, up from 20 percent in July. Chemical Products is nearly all of the difference. It is the largest manufacturing industry by value added, $578 billion of the sector’s $2.9 trillion in 2025 on Bureau of Economic Analysis figures, close to a fifth of the total and nearly twice the next largest, because chemicals are an input to almost everything else the sector makes: plastics and rubber, coatings, packaging, textiles, agricultural products and processed food, and the category carries pharmaceuticals as well. Chemical Products and Wood Products, worth about 2 percent, were the only two industries in contraction in August, and together they come to almost exactly the 22 percent ISM reports.
The factory-cycle sequence we have cited all year runs from orders to backlogs to hours worked to hiring, and in August the front of that chain gave ground while the back of it was still improving. New orders fell to 53.7, the lowest since March, and backlogs fell to 51.8. The workweek and payrolls, which sit at the back of the chain, were still gaining as of July, when average weekly hours in manufacturing reached 41.7 and manufacturing payrolls added 5,000 jobs after 11,000 in June. Hiring follows orders with a lag of several months, however, so a softer order book in August is a statement about the fourth quarter rather than about Friday’s employment report.
The Prices Index registered 71.1 for a second straight month, and the way it got there is not encouraging. The share of respondents paying more fell to 46.2 percent from 50.2 percent, which on its own would have pulled the index down. It did not, because the share paying less fell by almost exactly as much, to 4.0 percent from 8.1 percent. What the survey describes is a spreading standstill on costs, with nearly half the panel still paying up each month and almost nobody negotiating anything back.
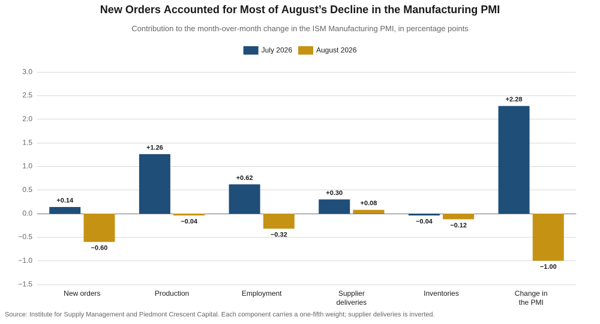
The Order Book Gave Ground
New orders fell 3 percentage points to 53.7 in August and the Backlog of Orders Index fell 3.2 points to 51.8, the two largest declines in the report. Both remain in expansion, and both have been in expansion for eight consecutive months, so this is a deceleration, or a narrowing of the breadth of new orders and order backlogs, not a turn. Eleven of 18 industries still reported higher new orders and three reported declines, those being Wood Products, Chemical Products and Food, Beverage & Tobacco Products. Panel sentiment on demand cooled with the index, at a 2-to-1 ratio of positive to negative comments against 3.5-to-1 in July.
The detail behind the index describes a shift to standstill rather than to contraction. ISM’s raw responses show the share of panelists reporting higher orders fell to 19.0 percent from 25.6 percent, while the share reporting lower orders rose only to 15.6 percent from 14.2 percent. The difference went into the middle, where 65.4 percent reported no change, the highest share in the four months the release publishes. Order books stopped growing for most of the panel in August without starting to shrink. We suspect that much of the deceleration in the orders series is coming from the slowdown in residential construction, as homebuilders reduce starts to work off a record inventory of completed homes.
The rest of the demand block held up better than the two headline gauges. New export orders rose two tenths to 53.2 for a second month of growth, which is worth noting with tariffs still in force across much of the goods basket and the Middle East conflict still adding to freight costs. Customers’ inventories improved to 42.8 from 40.7 and have now been judged too low for 23 consecutive months, a condition that historically precedes restocking. Imports were the exception, falling 3.2 points to 52.5, and the buying-policy detail points the same way. The average commitment lead time for production materials shortened to 84 days from 87 in July, capital expenditure lead times slipped a day to 171, and maintenance and repair supplies shortened to 48 days from 50. Buyers committed less far forward in August than they did in July. The prolonged level of low inventories reflects uncertainty surrounding tariffs, interest rates and geopolitical developments.
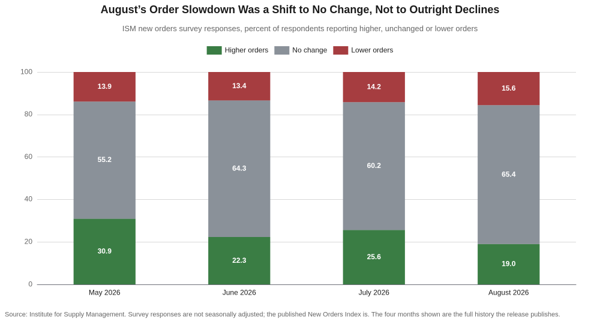
Hiring Held Its Ground
The Employment Index fell 1.6 points to 51.2 in August, a second month in expansion after 33 months below 50. Seven industries added workers, three cut them and eight reported no change, and the ratio of panelists hiring to those managing or reducing head counts narrowed to 1.3 to 1 from 1.5 to 1. ISM’s guidance is that an Employment Index above 50.3 is generally consistent with rising manufacturing payrolls in the Bureau of Labor Statistics data, so the August reading still points to a gain, if a small one.
The composition of that reading is thinner than the level suggests. In the raw responses, 76.7 percent of panelists reported no change in head counts, the highest share in the four months the release publishes, and the net between those adding and those cutting was three tenths of a point, the narrowest of the four. That is a factory labor market in which employers are neither laying off nor committing to much hiring.
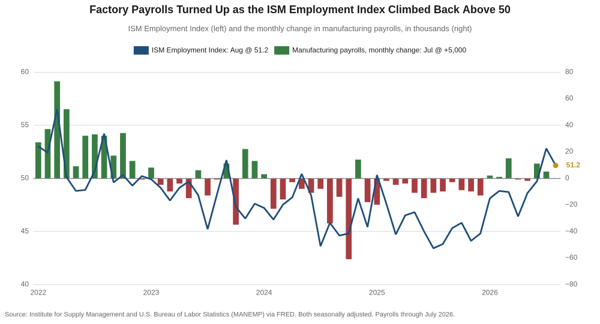
The hard data have been catching up to the survey. Manufacturing payrolls added 5,000 jobs in July after 11,000 in June and now stand 31,000 above December’s trough, and the shortfall against a year earlier has narrowed to 14,000 from 91,000 in January. Factory output has climbed 2.4 percent since December and 3.7 percent since the start of 2024, while payroll employment remains 2.1 percent below its January 2024 level.
The workweek is still doing work that hiring has not. Average weekly hours in manufacturing reached 41.7 in June and July, the highest readings since June 2019. Six tenths of an hour above December’s 41.1 is worth roughly 184,000 workers at December’s workweek, against the 31,000 the sector has actually added since then. Employers stretch hours rather than hire when they doubt whether a recovery will last, because hours can be unwound quickly and hires cannot, and the August survey suggests a fair number of them have gone back to doubting.
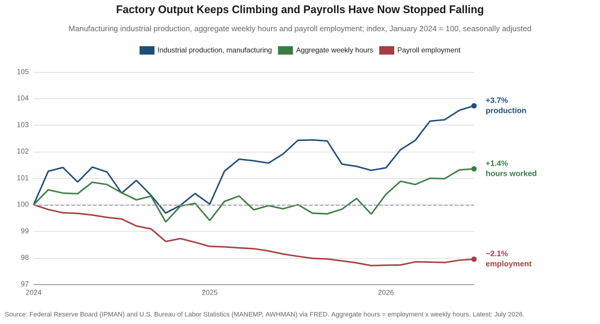
The Investment Cycle Has Not Turned
Nothing in the August survey suggests the capital spending behind this recovery is slowing. Orders for nondefense capital goods excluding aircraft reached $85.9 billion in July, up 12.9 percent from a year earlier and up 8.4 percent since December alone. Manufacturing labor productivity rose 1.5 percent over the year through the first quarter, the most recent reading available. Since the start of 2024 factory output is up 3.7 percent while aggregate hours are up 1.4 percent and payrolls are down 2.1 percent, which is the signature of a cycle that deepened capital before it added workers.
The panel comments locate that demand precisely, and they locate the strain alongside it. A machinery panelist reported photonics, high-speed connectors, semiconductors and government orders expanding significantly while supply chains grew more difficult at home and abroad. A computer and electronic products panelist described the electronics supply situation as a crisis bigger and more complicated than the one that followed the pandemic, attributing it to AI infrastructure demand and to uncertainty in global oil and critical-supply markets. A miscellaneous manufacturing panelist cited availability and price challenges in commodities heavily consumed by AI. The recovery still has a narrow set of end markets behind it, which is the conditional capital argument we made in our data center work.
Supplier deliveries slowed for a ninth consecutive month, at 59.3, and no industry reported faster deliveries. Slower deliveries usually accompany firming demand, and they can also signal genuine scarcity. With new orders decelerating in the same month, the second reading is doing more of the work than the first. Electronic components have been in short supply for 18 consecutive months, electrical components for 14 and memory for eight, and lengthening lead times turned up in 46 percent of the negative panel comments.
Prices, Tariffs and the War Premium
The Prices Index registered 71.1 in August, the same reading as July, and has now signaled rising input costs for 23 consecutive months. Fifteen of 18 industries reported paying more for raw materials and none reported paying less. Aluminum has been up in price for 33 consecutive months, copper for 14, steel for ten and steel products for nine. Aluminum appeared on both the up and the down lists for a third month, and a primary metals panelist described it as rising again after dropping.
The index held its level because both tails of the distribution thinned at once. The share of respondents paying higher prices fell 4 percentage points to 46.2 percent, its fourth consecutive decline and the lowest of the four months the release publishes. The share paying lower prices fell 4.1 points to 4.0 percent. The two moves offset, leaving the index exactly where July left it, while the middle of the distribution swelled to 49.8 percent from 41.7 percent. Fewer manufacturers are absorbing increases each month, and almost none are winning anything back.
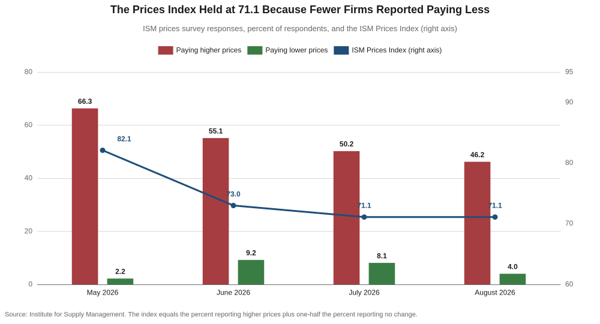
The official price data have started to cooperate in a way the survey has not yet registered. The producer price index for processed goods for intermediate demand, the series ISM’s Prices Index maps to, fell 0.4 percent in July after a 0.7 percent decline in June, and its year-over-year rate has slowed to 9.9 percent from 11.3 percent. Two monthly declines do not make a trend, and the level is still nearly ten percent above a year ago.
The order of the two series matters more than the gap between them. The survey has turned ahead of the official series at each of the three turning points since 2018, by five months at the 2021 peak, six months at the 2023 trough and one month this spring. That ordering is what makes the August reading worth watching rather than dismissing. A Prices Index that has stopped falling, after leading the producer price data down all year, argues that the deceleration in producer prices has less room left in it than the past two monthly declines suggest.
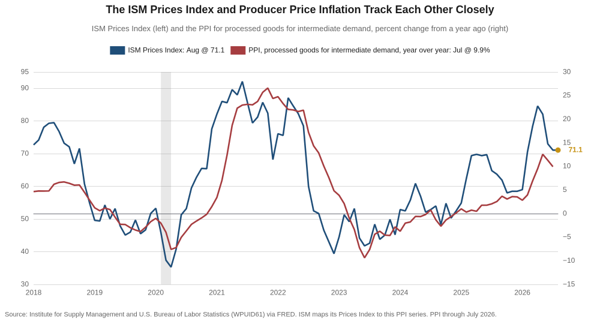
Three forces are holding the survey index up, and they are separable. Tariffs on steel and aluminum raise costs through the entire value chain, and they are a policy choice. The Middle East conflict has put a premium on petroleum-based products and freight, and it is a live variable, named in 30 percent of the negative panel comments in August against 43 percent in July. The third is scarcity in the categories the AI buildout is consuming, which will not ease materially until the buildout does.
For the Federal Reserve, a slower expansion at these input costs does not make the case for easing. Growth decelerated in August and it did not stop. Factory output is rising, payrolls have turned, and nearly half the manufacturing panel is still paying more for materials than it did a month earlier. The Committee has spent the year waiting for evidence that the spring energy shock was not turning into a wage-price problem. August did not settle that question in either direction.
Our Call
The recovery is decelerating rather than ending, and the next two order readings will settle which. The chain we have followed all year runs from orders to backlogs to hours to hiring, and August weakened the first two links while the last two were still improving in the July hard data. Hiring responds to orders with a lag of several months, so a softer order book now shows up in payrolls late in the fourth quarter rather than in Friday’s report. We look for manufacturing employment to post small gains through the fall and for the Manufacturing PMI to hold in the low 50s.
Composition is doing more work than the headline, in both directions. The count of industries and the GDP weight behind them are telling different stories, and the weight is the one that moves quarterly output. Chemical Products contracted for a second month and 2 percent of the sector was in strong contraction against none in July. The panel comments point the same way, with data centers, semiconductors, aerospace and defense running at capacity while consumer, chemical and general industrial demand lags. This is still a capital goods recovery riding an investment cycle, and it stays vulnerable to anything that interrupts that cycle.
We hold our view that the next move in the funds rate is up, and we now look for it in December. We expect the Committee to hold through the meetings before the November 3 midterm elections and to raise the target range at the December meeting, with one further increase in 2027 to a terminal 4.00 to 4.25 percent. Nothing in the August report changes that. A factory sector growing more slowly is not a factory sector that needs help, and a Prices Index at 71.1 for a second month is not the backdrop for a cut.
Two things would break the call. The first is a wider Middle East conflict that pushes energy and freight costs high enough to stall the demand this report measures, which would turn a deceleration into a contraction and take the December move off the table. The second is a run of order readings like August’s. One month of weaker new orders is noise. Three consecutive months would mean the investment cycle behind this recovery has crested, and the fourth quarter would look very different.
Mark P. Vitner – Chief Economist, Piedmont Crescent Capital
mark.vitner@piedmontcrescentcapital.com · (704) 458-4000
Disclaimer: This report is provided for informational purposes only and does not constitute investment, legal, tax, or accounting advice, nor an offer or solicitation to buy or sell any security. Information is drawn from sources believed to be reliable, including the Institute for Supply Management, the U.S. Bureau of Labor Statistics, the U.S. Census Bureau and the Federal Reserve Board, but its accuracy and completeness are not guaranteed. Views expressed are those of the author as of the date of publication and are subject to change without notice. Past performance is not indicative of future results.
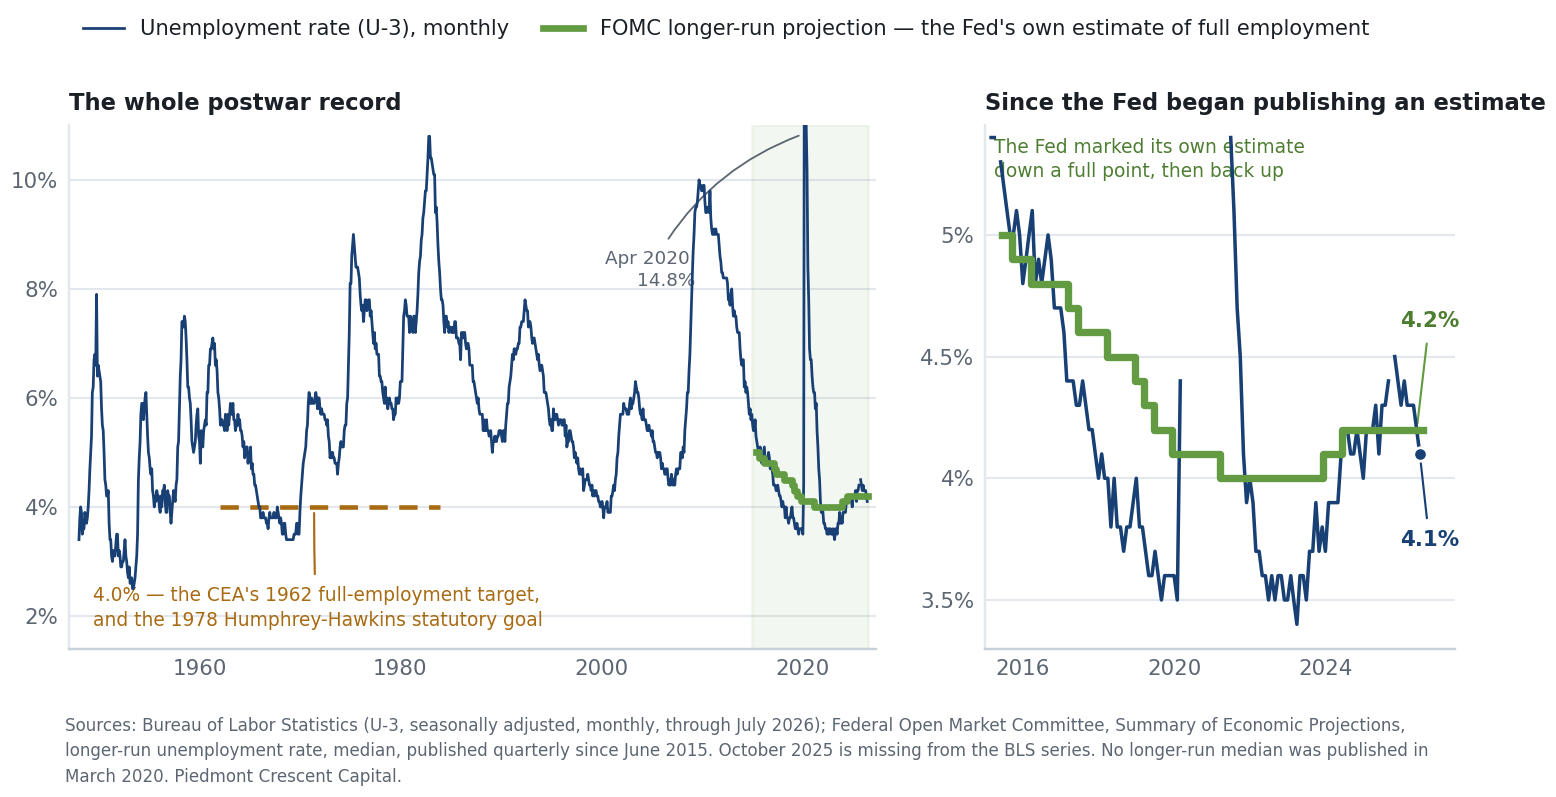
The Piedmont Perspective | What Counts as a Job Today
PIEDMONT PERSPECTIVE
What Counts as a Job Today
The Chairman declared the employment mandate satisfied on Friday. He did it with three indicators, and all three were built for an economy that no longer exists.
Long form. A condensed version appears in this week's View from the Piedmont.
Download the full reportPDF, 18 pages, with the chart, the state detail, the policy section and the methodological appendix.
This edition takes up a question raised by Chair Warsh's first Jackson Hole keynote, delivered August 28. We have no quarrel with his framework but a serious one with his instrumentation. The companion piece in this week's View from the Piedmont deals with the inflation half of the speech; this one deals with employment. A condensed version runs in the weekly; this is the full argument, with the state-level detail, the employer-side incentive, the policy section and the methodological appendix.
Here is the passage this essay is about.
"On the employment side of the Fed's dual mandate, our country is doing well. Labor markets are quite stable. The jobless rate, at 4.1 percent, remains low by historical standards and has not changed much for a couple of years. Unemployment claims, on a four-week average—an empirically robust real-time indicator—are near their lowest level in decades."
"In general, though, people who want to work, by and large, are holding or finding jobs… as of now, I believe the labor markets are consistent with full employment."
Three things carry the weight: the unemployment rate, the four-week average of initial claims, and an inference about job-finding. They are the three most-quoted labor indicators in the country and there is nothing eccentric about relying on them. They also share a single structural blind spot, and it has been widening for at least twenty-five years.
We are not arguing that the labor market is secretly weak. We do not know that, and neither does anyone else, which is the point. We are arguing that the Federal Reserve has just declared one half of its mandate satisfied using instruments that cannot see a large and growing share of American work — and that the Chairman's own second principle, that supply cannot be directly observed and must be inferred, applies more to the labor market than he implied.
PART ONE — THE CLAIMS SERIES MEASURES A SHRINKING UNIVERSE
Independent contractors cannot file a claim. This is not an oversight; it is the design.
Regular state unemployment insurance covers employees in covered employment. Independent contractors, the unincorporated self-employed and app-based platform workers classified as contractors are categorically outside it, in every state. The Minneapolis Fed's own explainer this February put it plainly: gig workers and independent contractors "generally don't qualify."
The reason is structural rather than political, and it is worth understanding because it means the exclusion will not be legislated away casually. Unemployment insurance was created by the Social Security Act of 1935 around a specific employment relationship: a wage earner, on one employer's payroll, in industry or commerce, separated involuntarily from that employer. The financing is experience-rated — employers whose former workers claim more, pay more — which requires an identifiable employer to charge. There is no employer to experience-rate for an independent contractor. Coverage was broadened in 1954, again in 1970, and in 1976 to state and local government and nonprofits. The self-employed have been outside it for ninety-one years and are outside it today.
And the financing mechanism creates a standing incentive to shrink the covered universe
This deserves more attention than it gets, because it explains why the covered share erodes rather than merely drifting.
Experience rating means an employer's unemployment insurance tax rate rises with the claims its former workers file. The intended effect is to make firms internalize the social cost of layoffs. The unintended effect is to put a price on the employee classification itself. A firm that engages the same labor as independent contractors pays no unemployment insurance tax, generates no claims, and carries no experience rating at all.
We would not overstate this. Classification is driven by many things — payroll taxes, workers' compensation, benefits, wage-and-hour exposure, and genuine differences in how work is organized. Unemployment insurance is one line in that calculation and not the largest. But it is the line that determines whether the worker appears in the claims series, and it is the only one that runs in a single direction. No firm has ever reclassified a contractor as an employee in order to raise its unemployment insurance experience rating.
The legal tests that police this are stricter for unemployment insurance than for most other purposes, which is the system defending itself. Most states apply some version of the ABC test for unemployment insurance eligibility — a worker is presumed an employee unless the hiring entity proves all three of: freedom from control in fact and under contract; that the work is outside the usual course of the hiring entity's business; and that the worker is customarily engaged in an independently established trade of the same nature. The middle prong is the one platforms lose on in litigation, and it is the one they have spent most heavily to legislate around, most visibly through California's Proposition 22 in 2020.
So the trend has a motor. The measurement problem is not a passive artifact of changing tastes in how people want to work. There is a tax wedge pushing in one direction, a litigated boundary that moves when enough money is spent on it, and a statistical system anchored to whichever side of that boundary the work lands on.
The recipiency rate is the number nobody quotes, and it has been falling for seventy years
The share of unemployed Americans actually receiving unemployment benefits was roughly 50% in the 1950s, about 40% in the 1960s and 1970s, roughly 30% by 1984, and 28% in 2025. The state range in 2025 ran from 8% in Florida to 52% in Minnesota.
The ratio that makes it concrete: the insured unemployment rate divided by the unemployment rate was about 0.70 in 1971. On Friday it was 1.2 divided by 4.1, or 0.29.
Or in this month's arithmetic: continuing claims of 1,778,000 against 6,916,000 unemployed Americans is 25.7%. Roughly three of every four unemployed people in this country do not appear in the continuing claims count.
Some of that erosion is deliberate state policy rather than structural change, and we should say so. Minneapolis Fed work published this March finds overall eligibility fell 5.4% between 2000 and 2024, and that had states held their 2000-era maximum benefit durations the decline would have been 2.8% — so roughly half the erosion is a policy choice. More than a dozen states cut maximum duration; Florida and North Carolina cut to 12 weeks from the 26-week standard. Separate decomposition work suggests about 57% of the unemployed are eligible and only about 61% of the eligible actually claim.
But the direction is not in dispute and neither is the destination. A series that captured half of unemployment in the 1950s captures a quarter of it now. Calling it "an empirically robust real-time indicator" is defensible about its statistical properties and misleading about its coverage. It is a robust real-time measure of separations from unemployment-insurance-covered employee jobs. That is a narrower object than it was, and it is narrowing.
The pandemic ran the experiment for us
Pandemic Unemployment Assistance existed for exactly one reason: the population excluded from regular unemployment insurance was large enough to matter. Its statutory eligibility condition was ineligibility for regular UI. So its claimant counts are a direct measurement of the hole.
Some 15.5 million individuals received at least one week of PUA between March 2020 and its expiration in September 2021, against 30.6 million who received at least one week of regular state benefits. At its peak PUA accounted for something on the order of a third to 40% of all unemployment claims. Of the claimants whose eligibility was verified, 41% were self-employed in 2020 and 49% in 2021.
We would use those figures directionally and not as point estimates, and we would rather say so than be corrected on it. PUA claim counts were inflated by fraud and by states reporting retroactive backweeks as current claims; analysts documented a persistent gap of five to six million between reported continued claims and plausible claimant counts. The 15.5 million individuals figure, built from state administrative counts of persons rather than weekly claims, is the more robust number.
The conclusion survives the caveats. When the federal government briefly opened the claims system to people who normally cannot use it, something on the order of fifteen million Americans walked through the door. Those people did not stop existing on September 6, 2021. They stopped being counted.
PART TWO — THE UNEMPLOYMENT RATE HAS THE OPPOSITE PROBLEM
First the yardstick, then the reading: 4.1% is measured against an estimate, not a standard
A level means nothing without a benchmark, and the benchmark here is not observed. The rate at which the labor market is judged to be at full employment is inferred, revised, and disputed. That is the Chairman's own second principle — supply cannot be seen directly and must be inferred — applied to the other half of his own sentence.
The historical standard sat below today's rate, not above it. From 1946 to 1956 the Council of Economic Advisers treated 3% as the marker of full employment. In 1962 the Council raised it, describing 4% as a reasonable and prudent target for stabilization policy. Sixteen years later Congress put a number in statute: the Full Employment and Balanced Growth Act of 1978 set an interim five-year goal of 3% unemployment for workers twenty and over and 4% for workers sixteen and over. On the standard the country legislated, 4.1% is not full employment. It is a tenth of a point worse than a target Congress set for 1983 and never reached.
We would not lean on that too hard. Those were political commitments rather than estimates of an equilibrium, they were written before the inflation of the 1970s discredited the idea that any unemployment rate could be targeted directly, and the labor force they described was younger, less educated and more heavily male than today's. But they are the source of the intuition that 4% is what full employment looks like, and that intuition is doing quiet work in a lot of current commentary.
Then the estimate moved the other way, hard. By the mid-1980s the Congressional Budget Office put the natural rate near 6%, on a younger workforce with higher turnover and slower job matching. It was still around 5% in the mid-2000s and the CBO's short-run measure rose to 6% by 2012 before falling back. For roughly thirty years, a 4.1% print would have been read not as full employment but as well through it — as the kind of overheating that precedes an inflation problem. The same number has meant three different things.
The Federal Reserve's own estimate has moved a full point in eleven years, and it has moved in both directions. The Committee first published a longer-run unemployment projection in June 2015 at 5.0%. It was marked down every year to 4.0% by March 2021, held there through September 2023, then marked back up — to 4.1% in December 2023 and 4.2% in June 2024, where it has stayed. Against that, July's 4.1%.
So the claim that the labor market is consistent with full employment rests on a gap of one tenth of one percentage point between a measured rate and an estimate the Committee has revised twice since the end of 2023, and by a full percentage point since it began publishing one. That is not a criticism of the estimate. Nobody has a better one. It is an observation about how much weight the sentence can carry.
And the dispersion inside the Federal Reserve System is wider than the gap. The FOMC's longer-run median is 4.2%. The Congressional Budget Office projection underlying recent Federal Reserve work on breakeven employment uses 4.4%. San Francisco Fed research published this month puts trend unemployment at 4.8% in 2024, falling from 7.8% in 1976. ⚠ These are not the same statistic and we would not stack them in a table — the San Francisco measure is a slow-moving trend rather than a policy-relevant equilibrium — but they are the range of defensible answers, and it is roughly sixty basis points wide. On one estimate the labor market is very tight. On another it is marginally tight. On a third there is slack. The Chairman's conclusion is not robust to the choice among them, and he did not say which he was using.
The demographic case says the benchmark should still be falling
This is the part we would press, and it cuts against the Committee's most recent revision. The forces that have pulled the trend down for fifty years have not stopped. The workforce is older and better educated, and both shift the composition toward groups that have always had lower unemployment rates. Kansas City Fed work attributes roughly half the decline in the natural rate between 1994 and 2017 to the aging of the labor force alone, the rest to changes in the skills employers demand. San Francisco Fed research projects the trend falling a further four tenths, to about 4.4%, over the next twenty years.
If the trend is still drifting down, the benchmark against which 4.1% is judged should be drifting down with it. A rate that reads as full employment today reads as slack in a decade without a single worker changing behavior. On that logic, today's 4.1% is more plausibly the upper end of the full-employment range than the lower end — which inverts the intuition inherited from 1962 and 1978, when 4% was a ceiling to get under rather than a floor to stay above.
The Committee moved its estimate the other way in 2024, raising it twenty basis points, and has not explained why in any published material we can find. ⚠ We are not asserting the revision was wrong; there are respectable reasons to think post-pandemic matching efficiency deteriorated. We are noting that the direction of the revision runs against the demographic arithmetic, that it happens to be the direction that makes the current rate look like full employment, and that no reasoning has been published alongside it.
One argument that is often merged with this one and should be kept separate
Slower labor force growth is a statement about payrolls, not about the unemployment rate. An aging population and lower net immigration reduce breakeven employment growth — the monthly job gain needed to hold the unemployment rate steady. Kansas City Fed work puts that number at 150,000 a month on the CBO's January 2024 population projection and 126,000 on the January 2025 projection, the revision driven almost entirely by immigration.
That is the argument the Chairman used, and on its own terms he is right: when labor supply barely grows, weak payroll prints are not evidence of weak demand. But it tells you how to read the payroll number. It does not tell you where full employment sits. The two get run together constantly, including in commentary that cites the breakeven figure as though it settled the level question. It does not. The level question is the one in the chart above, and the honest answer is that nobody knows it to within half a percentage point.
One hour of paid work makes you employed
The household survey counts a person as employed if they did any paid work at all in the reference week. A worker driving eight hours a week because full-time work is not available is in the numerator of "people who want to work, by and large, are holding or finding jobs."
The broader measures say something different from the headline, and the divergence is the tell.
| July 2026 | Level | Note |
|---|---|---|
| U-3 unemployment rate | 4.1% | 4.3% a year earlier |
| U-6 | 7.9% | 7.9% a year earlier — unchanged |
| Part-time for economic reasons | 4.8 million | |
| Multiple jobholders | 8,693,000 | |
| Multiple jobholders rate | 5.4% | 5.1% in March, rising every month since |
| Labor force participation rate | 61.4% | −0.7% since January |
| Employment-population ratio | 58.9% | −0.5% since January |
| Prime-age (25–54) participation | 83.4% | −0.5% since May |
| Prime-age (25–54) employment-population | 80.4% | −0.4% since May |
U-3 fell 0.2% over the year while U-6 did not move at all. Participation and the employment-population ratio have both fallen since January while the unemployment rate held. That is the signature of people leaving the count rather than finding work, and it is exactly the configuration in which the unemployment rate is least informative.
Boston Fed researchers made this point formally last year in a paper on assessing maximum employment: the employment-population ratio and the participation rate "become especially valuable during mature business cycles, when employment gains increasingly stem from participation increases rather than unemployment reductions." They retain U-3 as the key cyclical indicator and demonstrate its blind spot in precisely the configuration we are now in. Neither ratio appeared in the keynote.
And the one household series that responds directly to the phenomenon this essay is about — the multiple jobholders rate — has risen in every month since March and was not mentioned. A rising share of people working more than one job is consistent with a hot labor market offering abundant opportunity. It is equally consistent with a household economy in which one job no longer covers the bills. The unemployment rate cannot distinguish between those two readings. Nothing in the Chairman's list can.
PART THREE — HOW BIG IS THE PART WE CANNOT SEE
The official answer is a decade old and the agency has effectively conceded it
The Bureau of Labor Statistics measures this through the Contingent Worker Supplement, which it ran in July 2023 and published in November 2024.
| Sole or main job | July 2023 | Share | May 2017 |
|---|---|---|---|
| Independent contractors | 11.9 million | 7.4% | 6.9% |
| Contingent workers | 6.9 million | 4.3% | 3.8% |
| On-call workers | 2.8 million | 1.7% | 1.7% |
| Temporary help agency workers | 945,000 | 0.6% | 0.9% |
The platform-specific number is where it falls apart. The most recent published official estimate of electronically mediated work is 1.6 million workers, or 1.0% of employment, from May 2017 — and that figure is a manual recode, because the survey questions as fielded "did not work as intended and had a large number of incorrect 'yes' answers."
The July 2023 supplement included new app-based work questions written to replace the failed 2017 items. The Bureau has never published the estimates. The news release states they "are not included," and the technical documentation confirms no estimates have been issued. As of this weekend, the United States has no published official measure of digital platform work more recent than a recoded figure from May 2017.
The Bureau has since conceded the underlying problem, and the concession is more informative than any estimate. A Federal Register notice this February set out a redesigned module: the platform-work questions consolidated into a single section about half of which is new; the reference period extended from the survey week to the prior four weeks; and — decisively — the questions extended to people who are not employed at the time of the survey, in order to capture platform work "that might be of short duration or intermittent." It was fielded in July 2026.
Read what that redesign admits. The prior instrument could not see intermittent platform work, could not see it when it was not someone's main job, and could not see it at all among people the survey classifies as unemployed or out of the labor force. That last category is the one that matters for a full-employment judgment, and the agency responsible for measuring it has just told us its previous instrument could not.
Everything else we have suggests the official number is low
| Source | Estimate | What it counts |
|---|---|---|
| BLS supplement, 2023 | 7.4% | Independent contractors, main job, survey week |
| BLS, 2017 recode | 1.0% | Electronically mediated work |
| IRS tax records, 2016 | 11.8% | Anyone with any 1099 income in a tax year |
| Rockefeller Institute, survey of surveys | 10–36% | Range across the literature |
| McKinsey, 2022 | 36% | Self-identified independent or gig work |
| Upwork, 2026 | 39% | Self-identified freelancing |
Census nonemployer statistics — businesses with no paid employees, at least $1,000 of receipts, filing a federal return — counted roughly 30 million establishments in 2023, up from about 24 million in 2015. Nonemployer establishments in transportation and warehousing rose from 1.5 million to 4.0 million over that span, an increase of 165%.
Internal Revenue Service research found the share of the workforce with any 1099 income rose from 9.9% in 2000 to 11.8% in 2016, with more than half of that growth occurring between 2013 and 2016 — and 86% of the expansion since 2012 coming from platform-mediated participants with no other 1099 earnings.
The nine-fold spread between 4% and 36% is not sloppiness and we would not present it as such. It reflects five orthogonal design choices: main job versus any job; a survey week versus a tax year; structural classification versus self-identification; whether the question is asked only of the employed; and whether there is an income floor. A nurse who drives on weekends is a nurse to the Bureau of Labor Statistics and a gig worker to McKinsey. Both are right about their own question.
The defensible framing is this. The official range runs from 1% for platform-specific work in 2017 to 7.4% for independent contracting as a main job in 2023. The broader range, including supplemental work, runs from roughly 12% verified in tax records to roughly 36% self-identified. Both ends are relevant to a full-employment judgment. Neither is in the unemployment rate, and neither can file a claim.
PART FOUR — THE TWO SURVEYS, AND WHY THE BENCHMARK CANNOT RESCUE THEM
Neither survey measures the object the Chairman described
The establishment survey covers employees on nonfarm payrolls. It excludes proprietors, unpaid family workers, agricultural workers, private household workers, and — the relevant category — the unincorporated self-employed. In July that was 9,735,000 people who are invisible to the payroll count by construction. Add the incorporated self-employed and the total is roughly 16.4 million.
The household survey sees the person but not the arrangement. It counts a multiple jobholder once; the payroll survey counts them once per payroll. In July the household survey put civilian employment at 162,177,000 against nonfarm payrolls of 158,858,000 — but strip out the categories the payroll survey cannot see and the payroll count is roughly 8 million higher than household non-agricultural wage and salary employment, because it is counting jobs and the household survey is counting people.
The two surveys are not measuring the same object, and neither one measures labor demand in a platform economy. The payroll survey misses the workers entirely. The household survey sees the person and files their platform income under whatever they volunteer as their main activity.
And the benchmark revision runs on the same records
This is the part that makes the problem self-reinforcing rather than merely awkward, and Friday made it topical.
The payroll survey's sample frame is built from unemployment insurance tax records, which lag seven to nine months. The birth-death model that bridges the lag is estimated on unemployment insurance data. And the annual benchmark that corrects the whole thing is the Quarterly Census of Employment and Wages — which is itself built from unemployment insurance tax records.
The frame, the model and the correction all run on the same universe, and it is the universe that excludes independent contractors. The Census of Employment and Wages covers 97.2% of employees on nonfarm payrolls, and that figure is quoted constantly. It is a coverage ratio against a denominator that excludes the self-employed by construction. It does not mean 97% of workers. The 9.3 million unincorporated self-employed are in neither the numerator nor the denominator.
On Friday the Bureau published its preliminary benchmark revision for March 2026: −79,000, against a consensus near +138,000. The Street had positioned for the first upward revision since 2022. We would not overclaim the number — at −0.1% it is below the ten-year average absolute revision of 0.2%, it cuts average monthly payroll growth by only about 7,000, and the major forecasting houses expect it to shrink or reverse in the final estimate. What it does illustrate is the recursion. A benchmark built from the payroll universe can correct errors inside that universe. It cannot tell you anything about the workers who were never in it.
PART FIVE — THE MECHANISM THAT MAKES THIS CYCLICAL RATHER THAN MERELY UNTIDY
Everything to this point is a measurement complaint. This section is the reason it matters for policy.
If losing a payroll job pushes people into platform work, then the indicators the Chairman relied on improve during exactly the episodes when labor demand deteriorates. That is not speculation. It has been measured three separate ways.
First, unemployment claiming. A study published this year in the Journal of Financial Economics, using roughly a quarter of all United States job separations between 2011 and 2017 and identifying off Uber's vehicle-age rule and staggered city entry, finds that after a job loss, workers with platform access carried $689 less total debt, were 4.9% less likely to be delinquent, and were 3.3% less likely to collect unemployment insurance benefits. The effects were strongest in states with lower benefits. One of the authors put it in a sentence: "there are some people for whom unemployment insurance is not enough, but Uber is."
Second, participation and duration. Treasury and Internal Revenue Service research finds that among individuals with high propensity and maximum platform availability, gig participation rose 10.5% in the year of job loss and 19.8% two to four years later. Income fell about $3,000 less during the unemployment spell. But those workers were 5% less likely to regain wage employment, and prime-age household income was roughly $4,000 lower in years two through four. The estimated compensation forgone for flexibility is 39% of earnings.
Third, the classification error itself. Boston Fed work on informal work participation found that 16% of informal-work participants are classified as not in the labor force despite averaging 22 hours and about $340 a month, and that participation was highest — 49.6% — among workers already counted as part-time for economic reasons. Their estimate of the aggregate effect: if all informal work were counted as employment, the participation rate would be 2.0% higher, the employment-population ratio 2.5% higher, and the unemployment rate 1.0% lower. Follow-on work through 2022 put the range at 2.4% to 5.5% on the employment rate.
Put the three together and the shape is unambiguous. A worker who loses a payroll job and starts driving is less likely to file a claim, may not be counted as unemployed, is less likely to return to wage employment, and earns materially less for years afterward. Every one of those effects pushes the Chairman's three indicators toward "full employment" without a single unit of improvement in labor demand.
And the margin claims measure is not the margin that is moving
There is a second, better-established problem with resting on claims, and it has nothing to do with gig work.
St. Louis Fed research established more than a decade ago that 75% to 80% of changes in unemployment come from the job-finding rate rather than from separations. Claims measure separations. The series is therefore, in that author's words, "inherently a weak predictor of changes in unemployment."
Chicago Fed work published this April confirms the channel with current data: nearly 80% of the recent increase in unemployment is attributable to reduced job-finding rather than elevated separations, in what everyone now calls a low-hire, low-fire market. The June JOLTS report is the same fact from another angle — a quits rate of 2.0% and a hires rate of 3.4%, with 0.96 unemployed people per opening.
A further St. Louis Fed finding, from January of last year, deserves to be quoted at policymakers: since 1984, claims have become "more informative for gauging labor market conditions during expansionary rather than recessionary periods." The indicator is most reliable exactly when it matters least.
So the case against the claims series is doubled. It covers a shrinking share of the workforce, and within that share it measures the margin that is not currently moving.
PART SIX — THE CAROLINAS AND FLORIDA HAVE THE SHARPEST VERSION OF THIS
The national recipiency rate is 28%. It is a national average of a distribution that runs from 8% to 52%, and the low end of that distribution is in our coverage area.
Florida's recipiency rate is 8% — the lowest in the country. In 2019 the same table put North Carolina at 9.5%, the lowest in the nation that year. Minnesota was 52% in 2025 and 59.0% in 2019.
Both Carolina-adjacent outliers are policy, not economics. More than a dozen states cut maximum benefit duration after 2000. Florida and North Carolina cut furthest, to 12 weeks against the 26-week national standard, and Minneapolis Fed work published this March estimates the duration cuts drove eligibility down by as much as 17% in those states. Nationally, roughly half the 2000-to-2024 erosion in eligibility is attributable to state benefit-duration choices rather than to changes in the structure of work.
Put the two mechanisms together and the Southeast has the compound version of the problem.
First, the denominator. The region is the fastest-growing labor market in the country and the destination for most of the domestic migration of the past decade. Its claims series is measuring a shrinking share of a rapidly growing workforce.
Second, the industry mix. Nonemployer establishments in transportation and warehousing rose 165% nationally between 2015 and 2023, from 1.5 million to 4.0 million. The Southeast is the country's fastest-growing distribution corridor; Savannah moved 503,739 twenty-foot equivalent units in July alone, up 5.7% over the year. The occupations expanding fastest in the region are disproportionately the ones that classify as independent contract work — last-mile delivery, owner-operator trucking, warehouse-adjacent logistics, construction trades and residential services.
Third, the benefit level. The Fos, Hamdi, Kalda and Nickerson finding is that platform access reduces unemployment claiming after job loss, and that the effect is strongest in states with lower benefits. Florida and North Carolina are low-benefit, short-duration states. The substitution the study identifies should be strongest precisely where the claims series already captures the least.
We do not have state-level estimates of that interaction. What we can say is that the three mechanisms are aligned rather than offsetting, and that they are aligned in the region we cover.
The practical consequence for anyone reading Southeast labor data. The state and metro payroll benchmark revisions published Friday were large and regionally uneven, and Atlanta and Memphis were among the largest downward revisions while Richmond was revised up more than 1%. Those revisions come from the Quarterly Census of Employment and Wages, which is built from unemployment insurance tax records — so they correct the covered universe and are silent about the rest of it. In a region where the covered share is lower than the national average and falling faster, a benchmark that corrects only the covered part is doing less work than it appears to.
We will take this up properly in the Southeast Economic Weekly, where the state detail belongs. For a national audience the point is narrower: the state with the lowest recipiency rate in the country is the fourth-largest state economy, and the state that had the lowest rate before it cut benefits further is the one we live in.
PART SEVEN — WHAT PORTABLE BENEFITS WOULD AND WOULD NOT FIX
There is an active legislative response to the coverage gap, and it is worth understanding why none of it touches the measurement problem.
| Jurisdiction | Action | What it covers |
|---|---|---|
| Florida | HB 1067, February 2025 | Voluntary portable benefit accounts — health and retirement |
| Tennessee | Voluntary Portable Benefit Plan Act, April 2025 | Health insurance and retirement; roughly 1.5 million contractors |
| Alabama | Portable Benefit and Incentives Law, 2025 | Portable accounts, with a tax deduction for contributing hiring entities |
| Maryland | DoorDash pilot, April–June 2025 | Health, dental, vision, retirement, emergency funds and paid time off |
| Federal | Modern Worker Security Act, February 2025 | Safe harbor letting firms contribute without triggering reclassification |
Every enacted program is voluntary, funded at the hiring entity's discretion, and confined to health and retirement. California's Proposition 22 has the same shape — healthcare stipends and accident insurance. Not one of them includes unemployment insurance.
That is not an oversight either. Unemployment insurance is the one benefit whose financing requires a compulsory, experience-rated levy on an identifiable employer. A voluntary portable account can hold a health premium. It cannot hold a claim against a firm that has, by construction, denied being the employer. The Modern Worker Security Act's central provision is a safe harbor from reclassification, which is the opposite of bringing the work inside the covered universe.
So the direction of travel is toward giving independent workers benefits while keeping them outside the statistical system. From a worker's standpoint that may well be an improvement. From a measurement standpoint it entrenches the problem, because it removes the pressure that reclassification would otherwise create while leaving the claims series exactly as blind as it was.
There is one reform that would fix the measurement without touching the classification fight, and it costs almost nothing. Publish the coverage statistic. The Bureau of Labor Statistics could report, quarterly, the share of employed Americans in unemployment-insurance-covered employment — covered employment over total employment including the self-employed — alongside the recipiency rate. Neither series requires new collection. Both are computable from data the government already holds. Until they are published, every statement that the labor market is at full employment rests on a coverage assumption that has never been quantified.
PART EIGHT — WHAT WE WOULD USE INSTEAD
We would not abolish anything. We would demote the claims series from a headline read on labor market health to what it actually is — a high-frequency read on separations from covered employment — and we would put four things alongside the unemployment rate.
1. The employment-population ratio and the participation rate, prime-age. Boston Fed research makes the case and the current readings make the point: both have fallen since January while the unemployment rate held.
2. U-6, involuntary part-time work, and the multiple jobholders rate. These are the household series that respond when work fragments rather than disappears. U-6 has not improved in a year and the multiple jobholders rate has risen every month since March.
3. The job-finding rate directly, rather than separations. The Chicago Fed publishes twice-monthly labor market indicators combining thirteen streams — claims, insured unemployment, JOLTS hires and layoffs, two confidence differentials, search data, two job-postings series, weekly private surveys and payroll-processor data — and reports a 36% improvement over consensus and 52% over a random walk in forecasting the unemployment rate. It exists, it is free, and it is produced by the System.
4. Aggregate hours. When employment fragments into shorter and more numerous engagements, headcount and hours diverge. Hours are the honest quantity.
We would treat private payroll and postings data as complements rather than substitutes. Richmond Fed work this February assessed the private sources during last year's shutdown and found the divergence severe — for September 2025 one processor reported −32,000 jobs while a profile-based estimator reported +60,000. The Chicago Fed's own caveat is the right posture: alternative data are drawn from convenience samples, and representativeness concerns "can dominate statistical precision even in very large datasets." Their value comes from systematic combination anchored to official statistics.
And the missing statistic, restated because it is the cheapest fix available. We went looking for the share of American workers eligible to file an unemployment claim — coverage measured against all employment, including the self-employed. No federal agency publishes it. The Census of Employment and Wages expresses coverage against a payroll denominator that excludes the self-employed by construction, which is why the 97.2% figure circulates and misleads. The statistic that would answer "what fraction of working Americans can use this system" is not produced by anyone, and it is computable from data the government already holds.
PART NINE — THE MEASUREMENT QUESTION IS NOW BOTH HALVES OF THE MANDATE
Everything above concerns the employment side. It would be a narrower essay if the price side were secure. It is not.
On September 30 the Bureau of Economic Analysis restates the index the Chairman named as his target. As part of the annual national accounts update, the Bureau is changing the deflation methodology for three PCE components: portfolio management and investment advice services, computer software and accessories, and legal services. The changes apply retroactively to 2021, so five years of inflation history are rewritten in a single release.
The estimated effect on core PCE runs from about five basis points to about twenty, depending on whose work you read. Goldman Sachs marked its December 2026 core PCE forecast down from 3.2% to 3.0% on the change alone and left its core CPI forecast untouched. One specialist shop that reconstructed the portfolio-management series puts the effect at roughly five basis points and no more than ten. ⚠ The dispersion is the point rather than the level, and we would not print a single number for it.
Two things follow, and the second is the one worth carrying.
First, the component being repaired is the one that has been doing the work. The July core print was driven materially by portfolio management and investment advice fees — an imputed price no household pays, which rises when equity markets rise because the fee is levied on assets under management. That is precisely the distortion the Bureau is fixing, by deriving the quantity of services consumed rather than extrapolating from the value of the assets. The measure has been reading the stock market and calling it inflation, and it is about to stop.
Second, the restatement lands two weeks after the meeting it would have informed. The Committee votes September 15 and 16. The revised history publishes September 30. A Committee that hikes in September on a 3.3% core reading may find, a fortnight later, that the series it hiked against had been running a tenth or two lower all along. ⚠ We are not forecasting that it will change the decision, and the revisions are routine and long-scheduled rather than convenient. We are observing that the gauge is not fixed, that everyone has known it was not fixed since June, and that nobody has said out loud what a policy standard means when the standard is restated after the vote.
Which brings this back to the task forces
Put the two halves together and the shape is uncomfortable. The employment mandate was declared satisfied on Friday using three indicators that cannot see a growing share of American work, judged against an equilibrium estimate that has moved a full percentage point and on which the Federal Reserve System's own research spans sixty basis points. The price-stability mandate is anchored to an index whose construction changes in four weeks. Neither half of the dual mandate currently rests on a measure that a careful outsider could reproduce and defend.
The Chairman has already commissioned the people who would have to settle this. Five task forces were named on July 9. Three of them go directly at the question: Data — Raj Chetty, Doug McMillon and Kevin Murphy; Productivity and Jobs — Marc Andreessen, Charles Jones and Asha Sharma; and Inflation Frameworks — Greg Mankiw, Thomas Sargent and William White. In his July testimony the Chairman framed the first as asking how policymakers can be sure they are receiving accurate, relevant, contemporaneous and actionable data, and the third as asking whether the Fed's models give an empirically robust view of prices.
Those are the right questions. They are, almost word for word, the questions this essay is asking.
And on Friday he ruled them out of the current decision. The task forces were mentioned once, in the artificial intelligence section, with the qualification that their recommendations "will come later and have no bearing on decisions we make in the current policy conjuncture." We understand the institutional reason for saying that — a chairman cannot have every meeting relitigated by a review in progress, and the alternative is paralysis.
But it cannot be right that the measurement of both mandate halves is under active review by five outside panels, and that the review has no bearing on a decision that turns on a tenth of a point in each of them. If the instruments are good enough to declare the employment mandate satisfied in August, they are good enough not to need a task force. If they need a task force, the declaration should have been held more loosely. That is not a call for delay. It is a call for the confidence in the conclusion to match the confidence in the instrument, and on Friday it did not.
WHERE THIS ARGUMENT IS WEAKEST
We would rather print the objections rather than wait for the endless stream of notes to come in.
First, we cannot show that the labor market is weak, and we have not tried. Everything here establishes that the standard indicators have a widening blind spot. It does not establish which way the missing information cuts. It is entirely possible that Warsh is right about the level and wrong only about the instruments. Initial claims fell 4,000 in the latest week and continuing claims fell 18,000, which reverses a grind higher we had been flagging.
Second, the supply-side explanation is strong and the prevailing house view holds it. The consensus reading is of a balanced labor market — demand sluggish, but labor supply growth weaker still, with break-even job growth having noticeably dropped — and several published forecasts have the unemployment rate falling to 3.9% by the fourth quarter. More telling, houses that cut their payroll forecasts this month cut their unemployment forecasts in the same revision, which is an analyst quietly re-attributing weak hiring from demand to supply. The immigration evidence supports them: a worldwide pause on immigrant visa appointments through mid-September, H-1B issuance down 30%, student visas down 35% and green cards down more than 20% since early 2025. Low payroll growth against a falling break-even is not slack, and we accept that.
Third, the timing of the academic evidence. The strongest studies use data from 2011–2017 and 2015–2022. They establish the mechanism. They do not establish its current magnitude, and platform work has both grown and matured since.
Fourth, gig work is genuinely voluntary for many of the people doing it, most of whom already hold traditional jobs, roughly one in nine of whom report it as primary income, and who typically earn $300 to $400 a month from it. A supplemental income stream is not a hidden unemployment queue and we would not describe it as one.
None of that rescues the instruments. Whether the missing work represents distress or flexibility, it is missing, and a central bank that has declared one half of its mandate satisfied should want to know which.
WHAT WOULD CHANGE OUR MIND
We would adjust our thinking for any of the following.
1.The Bureau publishes app-based work estimates from the July 2026 supplement showing platform work at or below 2% of employment on the new four-week reference period, including among the non-employed. That would mean the phenomenon is smaller than the private estimates suggest and the official instruments are adequate. This is the decisive test and the data has already been collected.
2.U-6 falls back toward its pre-2020 relationship with U-3 while the multiple jobholders rate stops rising. That would mean work is not fragmenting and the headline is not flattering.
3.The prime-age employment-population ratio recovers its January level while participation holds. That would mean the January-to-July decline was noise rather than exit.
4.Research using post-2022 data fails to replicate the finding that platform access reduces unemployment claiming after job loss. The mechanism is the load-bearing element and it deserves a current test.
5.The recipiency rate stabilizes or rises. It has fallen for seventy years, but roughly half of the 2000–2024 erosion was state benefit-duration policy, which is reversible.
CONCLUSION
The Chairman's framework is better than his instruments, and the gap between them is the argument.
He told us on Friday that supply cannot be directly observed and must be inferred, and that a central bank should be humble about what it can know. He then used that principle to explain away weak payroll growth on the employment side of the mandate and set it aside entirely on the price side. We took up the second asymmetry in this week's View from the Piedmont. This is the first one, and it runs deeper, because the labor market is where the measurement problem is genuinely structural.
Unemployment insurance was designed in 1935 for a wage earner on one employer's payroll. It covered half the unemployed in the 1950s and covers 28% now. The unemployment rate counts an hour of paid work as employment. The payroll survey cannot see nine and a half million unincorporated self-employed Americans, the benchmark that corrects it runs on the same tax records, and the only official measure of platform work in existence is a hand-recoded figure from May 2017 that the agency has since redesigned out of existence.
Meanwhile the Census counts 30 million businesses with no employees, up 6 million in eight years, with non-employer establishments in transportation and warehousing up 165%.
Something significant has happened to the structure of American work, and the three indicators the Federal Reserve used on Friday to declare the employment mandate satisfied were all built before it. They are not wrong. They are narrow, and they are getting narrower, and the direction of the narrowing is the direction that flatters the reading.
We would not have the Committee conclude the opposite. We would have it hold the conclusion more loosely. A Chairman who has just retired forward guidance on the grounds that the Federal Reserve should be humble about what it knows, and who has staked his price-stability case on a diffusion measure of his own construction, is entitled to ask harder questions of the employment data than the ones the headline answers.
And there is a practical version of this for anyone setting policy in the next six weeks. The September decision now rests on the September 4 employment report and the September 11 consumer price index, because the Chairman has removed everything else. The payroll report will be read against a benchmark that was just revised down, using a survey that cannot see a tenth of the workforce, in a month when the household and establishment surveys are already 3.3 million apart. We would put less weight on the headline than the market is about to, and more on hours, participation and the household detail underneath it.
A View from the Piedmont and the Piedmont Perspective are published by Piedmont Crescent Capital for informational purposes only and do not constitute investment, legal, or tax advice. Views expressed are those of the author as of the date of publication and are subject to change.
SOURCE NOTES
Speech. Kevin M. Warsh, "In Our Time," keynote remarks, Federal Reserve Bank of Kansas City Economic Policy Symposium, Jackson Hole, Wyoming, August 28, 2026.
Official statistics. BLS Employment Situation, July 2026 (released August 7, 2026), including Table A-7 class of worker and the U-1 through U-6 series · BLS Contingent Worker Supplement, July 2023 (released November 8, 2024) and May 2017 · BLS electronically mediated work recode, May 2017 · Federal Register notice on the redesigned platform-work module, February 10, 2026, comment period closing April 13, 2026, fielded July 2026 · BLS Preliminary Benchmark Revision, March 2026, released August 28, 2026 · BLS Quarterly Census of Employment and Wages, 2024 coverage documentation · BLS JOLTS, June 2026 (released August 4, 2026) · Department of Labor Unemployment Insurance Weekly Claims, week ending August 22, 2026 (released August 27, 2026) · Department of Labor UI Chartbook · Census Bureau Nonemployer Statistics, 2023 (released May 15, 2025) and 2015 · BLS unemployment rate (U-3), seasonally adjusted monthly series, January 1948 through July 2026 · Federal Open Market Committee, Summary of Economic Projections, longer-run unemployment rate, median, June 2015 through June 2026.
Research. Fos, Hamdi, Kalda and Nickerson, "Gig Labor: Trading Safety Nets for Steering Wheels," Journal of Financial Economics, 2025 · Jackson, "Availability of the Gig Economy and Long Run Labor Supply Effects for the Unemployed," Internal Revenue Service and Treasury, November 2022 · Bracha and Burke, Federal Reserve Bank of Boston Working Paper 16-29, December 2016, and Burke's Survey of Informal Work Participation, 2015–2022 · Foote, Fujita, Michaud and Montes, "Assessing Maximum Employment," Federal Reserve Bank of Boston Working Paper 25-9, 2025 · Wiczer, Federal Reserve Bank of St. Louis, September 2014 · McCracken and Trần, Federal Reserve Bank of St. Louis, January 14, 2025 · Brave, Henken, Karger and Safi, Federal Reserve Bank of Chicago Working Paper 2026-09, April 2026 · Macaluso, Federal Reserve Bank of Richmond Economic Brief 26-04, February 2026 · Cramer, Narayan and Nunn, Federal Reserve Bank of Minneapolis, March 19, 2026, and the Minneapolis Fed recipiency explainer, February 24, 2026 · Collins, Garin, Jackson, Koustas and Payne, "Is Gig Work Replacing Traditional Employment?", March 2019 · JPMorgan Chase Institute, "The Online Platform Economy through the Pandemic" · The Century Foundation and JPMorgan Chase Institute on Pandemic Unemployment Assistance · Bipartisan Policy Center on recipiency · Rockefeller Institute of Government survey of gig workforce estimates · McKinsey American Opportunity Survey, 2022 · Upwork Future Workforce Index, 2026 · Yale Law Journal Forum on gig worker unemployment insurance eligibility, January 2022.
On the full-employment benchmark in Part Two. Council of Economic Advisers, Economic Report of the President, 1962, on the 4% target, and Duboff (1977) on the Council's earlier 3% marker · Full Employment and Balanced Growth Act of 1978, interim goals of 3% for workers 20 and over and 4% for workers 16 and over · Congressional Budget Office, "The Natural Rate of Unemployment," Working Paper 2007-06, and CBO long-term budget outlook appendices on the compositional markdown of the trend · Tüzemen, "Job Polarization and the Natural Rate of Unemployment," Federal Reserve Bank of Kansas City Working Paper 18-03, and the associated Economic Bulletin · Aaronson, Hu, Seifoddini and Sullivan, "Changing Labor Force Composition and the Natural Rate of Unemployment," Chicago Fed Letter 338, 2015 · Federal Reserve Bank of San Francisco, "What's Behind the Declining Trend Unemployment Rate?", Economic Letter, August 2026 · Federal Reserve Bank of Kansas City, "Declining Immigration and an Aging Population Are Reducing Breakeven Employment Growth," Economic Bulletin, February 2026.
On Part Nine. Board of Governors press release naming the five task forces and their members, July 9, 2026 · Chairman Warsh, testimony on the semiannual Monetary Policy Report, July 14–15, 2026, on the charge to the data and inflation-frameworks task forces · Warsh, "In Our Time," August 28, 2026, on the task forces having no bearing on the current policy conjuncture · Bureau of Economic Analysis announcement of methodological changes to the deflation of portfolio management and investment advice services, computer software and accessories, and legal services, to be incorporated in the annual update of September 30, 2026 and applied retroactively to 2021 · Goldman Sachs and independent estimates of the effect on measured core PCE.
State and policy material in Parts Six and Seven. Minneapolis Fed on state benefit-duration cuts and eligibility, March 19, 2026 · Bipartisan Policy Center and Minneapolis Fed state recipiency ranges, 2019 and 2025 · Florida HB 1067, February 2025 · Tennessee Voluntary Portable Benefit Plan Act, April 2025 · Alabama Portable Benefit and Incentives Law, 2025 · the Maryland DoorDash portable benefits pilot, April to June 2025 · the Modern Worker Security Act, February 2025 · California Proposition 22, 2020 · BLS state and metropolitan area preliminary benchmark revisions, August 28, 2026 · Georgia Ports Authority July 2026 volumes.
Two cautions carried in the text rather than in a footnote. Pandemic Unemployment Assistance claim counts were inflated by fraud and by retroactive backweek reporting; we use the 15.5 million individuals figure and treat the weekly claim shares as directional. And the core academic evidence on the counter-cyclicality of platform work uses data through 2017 and 2022; it establishes the mechanism, not its present magnitude.
METHODOLOGICAL APPENDIX
This appendix supports the ratios computed in the text. Every figure below is either published or is arithmetic on published figures, and we identify which.
1. The recipiency ratio. We report three related quantities and they are not interchangeable.
| Measure | Construction | Latest |
|---|---|---|
| Recipiency rate (administrative) | Regular-program insured unemployed ÷ total unemployed, Department of Labor basis | 28% (2025) |
| Continuing claims ÷ unemployed | 1,778,000 (week ended August 15) ÷ 6,916,000 (July) | 25.7% (our calculation) |
| Insured unemployment rate ÷ U-3 | 1.2 ÷ 4.1 | 0.29 (our calculation) |
The second and third are our own arithmetic on published series and are offered as a current-month check on the first, which is annual. They are not the same statistic and should not be quoted as though they were. The administrative recipiency rate uses a twelve-month average covered-employment denominator and a different reference period from the household survey; a difference of two or three points between our ratio and the official rate is construction, not news.
2. The historical recipiency series. Roughly 50% in the 1950s, roughly 40% in the 1960s and 1970s, roughly 30% by 1984, 28% in 2019, 29% in 2023, 28% in 2025, from the Department of Labor's unemployment insurance chartbook and Bipartisan Policy Center and Minneapolis Fed compilations. One source puts the 1950s figure nearer 55%. We use "roughly 50%" and would not defend a decimal.
3. The decomposition of the 28%. St. Louis Fed work decomposes recipiency into eligibility and take-up: roughly 57% of the unemployed are eligible and roughly 61% of the eligible claim. Note that 0.57 × 0.61 is about 35%, above the administrative 28%. The gap reflects differing definitions of the eligible population and differing reference periods. We report both and do not reconcile them, because they cannot be reconciled without microdata we do not have.
4. The Boston Fed adjustment. The estimate that counting all informal work as employment would raise the participation rate 2.0%, the employment-population ratio 2.5% and lower the unemployment rate 1.0% comes from the 2015 Survey of Informal Work Participation and depends on an inclusive threshold. At a 20-hours-a-month threshold the same source gives 0.7% and 0.8%. We cite the inclusive figures in the text and disclose the threshold sensitivity here. The follow-on range of 2.4% to 5.5% on the employment rate, through 2022, is a different construction again and is the widest claim in this essay.
5. The two-survey gap. July 2026: household civilian employment 162,177,000; nonfarm payrolls 158,858,000; difference 3,319,000. Household non-agricultural wage and salary employment 150,852,000, against which nonfarm payrolls are 8,006,000 higher. The two gaps have opposite signs and different causes — the first is dominated by the self-employed and agricultural workers the payroll survey cannot see, the second by second and third jobs the payroll survey counts separately. Neither difference is an error and neither is a measure of anything by itself.
6. Gig workforce estimates. The nine-fold spread between 4% and 36% is definitional, and we set out the five design choices in the text. We report the range rather than a point estimate and we would treat any single number offered without its definition as unusable.
7. The chart in Part Two. The unemployment rate is the published monthly seasonally adjusted U-3 series; October 2025 is absent from the official series and is left as a gap rather than interpolated. The step line is the median longer-run projection from the Summary of Economic Projections, plotted at each release date and held flat until the next; the FOMC published no longer-run median in March 2020, and the series does not exist before June 2015, which is why the panel on the right begins there. The 1962 and 1978 reference line is drawn only across the years in which those benchmarks were the operative standard, and it is a policy target rather than an estimate of an equilibrium. The three current estimates quoted in the text — 4.2%, 4.4% and 4.8% — are constructed differently and are reported as a range of defensible answers rather than as a distribution.
8. What we did not do. We have not estimated the current size of the measurement gap, we have not attempted a corrected unemployment rate, and we have not modelled the state-level interaction described in Part Six. Each is doable and none is done here. The July 2026 Contingent Worker Supplement, when the Bureau publishes it, is the input that would make the first of those worth attempting.
Download the full reportPDF, 18 pages.
The Turn You Cannot See at the Time | A View from the Piedmont
Piedmont Crescent Capital
A View from the Piedmont · Our weekly commentary on money, credit, exchange rates and geopolitics
The Turn You Cannot See at the Time
Chair Warsh took the Fed off its emergency footing and the market believed him: breakevens fell while real rates rose. Underlying inflation is already at target on every gauge that strips the shocks. The pressure that remains sits in energy, protein and fertilizer, and none of it is reachable by a funds rate.
Download the full report PDF, 10 pages, including the full U.S. economic and financial outlook table.
Market dashboard
| Indicator | Level | This week |
|---|---|---|
| Fed funds target range | 3.50–3.75% | Unchanged |
| 2-year Treasury | 4.34% | +10 bp |
| 5-year Treasury | 4.48% | +5 bp |
| 10-year Treasury | 4.73% | −1 bp |
| 30-year Treasury | 5.22% | −5 bp |
| 2s–10s spread | 39 bp | −11 bp |
| 2s–30s spread | 88 bp | −15 bp |
| 5-year TIPS breakeven | 2.30% | −1 bp Friday |
| 10-year TIPS breakeven | 2.31% | −2 bp Friday |
| 30-year fixed mortgage | 6.66% | +1 bp |
| Investment grade OAS | ~80 bp | −1 bp |
| High yield OAS | 263 bp | −6 bp |
| September 16 hike odds | 59% | from 35% |
| Hikes priced, next 12 months | 2.4 | from 1.8 |
| Chicago PMI, August | 47.1 | −10.5 points |
| S&P 500 | 7,711.76 | +0.5% |
| Dow Jones Industrial Average | 53,559.99 | +0.5% |
| Nasdaq Composite | 26,402.42 | +0.8% |
| Russell 2000 | 2,972.37 | −1.5% |
| Brent crude, October | $89.31 | −5.4% |
| WTI crude, October | $83.40 | −5.0% |
| Gold, December settle | $4,529.90 | −2.9% Friday |
| ULSD crack spread | $95.06 | +$3.23 Friday |
| Retail diesel, national | $5.652 | +52.4% y/y |
| Distillate stocks | 103.4 mn bbl | 14% below 5-yr |
| Headline PCE, 12-month | 3.7% | July print |
| Headline PCE, 6-month annualized | 4.1% | Warsh’s number |
| Core PCE, 12-month | 3.30% | Unchanged |
| Dallas Fed trimmed mean PCE | 2.3% | Flat six months |
| Benchmark revision, March 2026 | −79,000 | vs. +183,000 est. |
Summary
Chair Warsh gave a standard rather than a rule. He retired forward guidance as a crisis legacy that “has overstayed its welcome,” declined to offer a reaction function, and closed: “I stand here today committed to a discipline, not to a decision.” The standard he gave has a trigger: “We must be confident that underlying inflation is moving to our objective, clearly and at sufficient speed. Otherwise, we have work to do.”
He declared one mandate met and the other not. Employment: 4.1% jobless rate, claims near the lowest in decades, “labor markets are consistent with full employment.” Prices: “the Fed’s predominant focus right now should be on prices.” This Fed is content with one half of its mandate but frustrated and a little anguished by the other.
He rejected the premise our commentary has run since June. Warsh: “I would be hard pressed to describe broad financial conditions as restrictive.” We disagree and would point to the most interest-rate-sensitive parts of the economy — housing and consumer durable goods — as prima facie evidence that policy is tight. The parts of the economy that are booming are less affected by interest rates and are being driven by a structural shift in technology and by waves of public and private investment.
The market repriced hard, and the composition is the most important thing in this issue. The 2-year rose 14 basis points on the day to 4.34%; the 30-year rose 3 and fell 5 on the week. 2s–30s flattened 15 basis points. September hike odds went from 35% to 59%. And breakevens fell while real yields rose 11 and 8 basis points. The entire move was real rates, the market believing him rather than doubting him.
Then the data arrived and did not corroborate Warsh. Inside fifteen minutes: the payroll benchmark revision at −79,000 against a Bloomberg survey median of +183,000; the Chicago Business Barometer down 10.5 points to 47.1, into contraction against a consensus near 58.
The war escalated Sunday and it is in no price you can see yet. U.S. forces struck two IRGC rocket launchers on Larak Island in the Strait of Hormuz, which CENTCOM says were being prepared to fire sea mines into the waterway, ending a 31-night pause in strikes on Iranian territory. The IRGC reported dead and wounded on the island and promised reprisals, then struck U.S. positions in Jordan overnight, at King Hussein Air Base and Al Azraq. Jordan’s army says it intercepted eight ballistic missiles over the kingdom at dawn Monday, and U.S. officials report no significant impacts. The IRGC claims heavy damage to maintenance and aircraft facilities on the two bases, which nobody outside Tehran has confirmed. Brent for November opened above $90 and West Texas Intermediate near $86, up roughly 3% from Friday. Visible Hormuz transits fell to about five a day over the weekend. The August 26 Iran–Oman revenue-sharing framework survives on paper, but Tehran had already said it guarantees no reopening and Washington has told mediators it will not revive the June terms.
Our central thesis
A turn is almost impossible to identify while you are standing on it. That is the lesson we keep returning to, and it is the frame for this issue.
Earlier in my career we called the end of the 1990–91 recession correctly and early. The call was right and it was useless, because the endpoint of a recession is its low point, and nobody can be persuaded that things are improving at the moment they feel worst. The data that would have proved it arrives a year later, revised.
We think that is where underlying inflation sits today. Figure 1 is the argument in one graph. Every gauge that strips or trims the shocks is at or below target: the Dallas Fed trimmed mean at 2.3% and flat for six months, our own Hodrick-Prescott trend on core CPI at 2.51% and falling for six consecutive months, six-month core CPI at 2.42% and three-month at 1.64%. Every gauge that carries the shocks is well above it, and those are the ones being quoted: headline PCE at 3.7% over twelve months and 4.1% over six, which is the number the Chairman led with. Those are also the prices consumers actually see and feel.
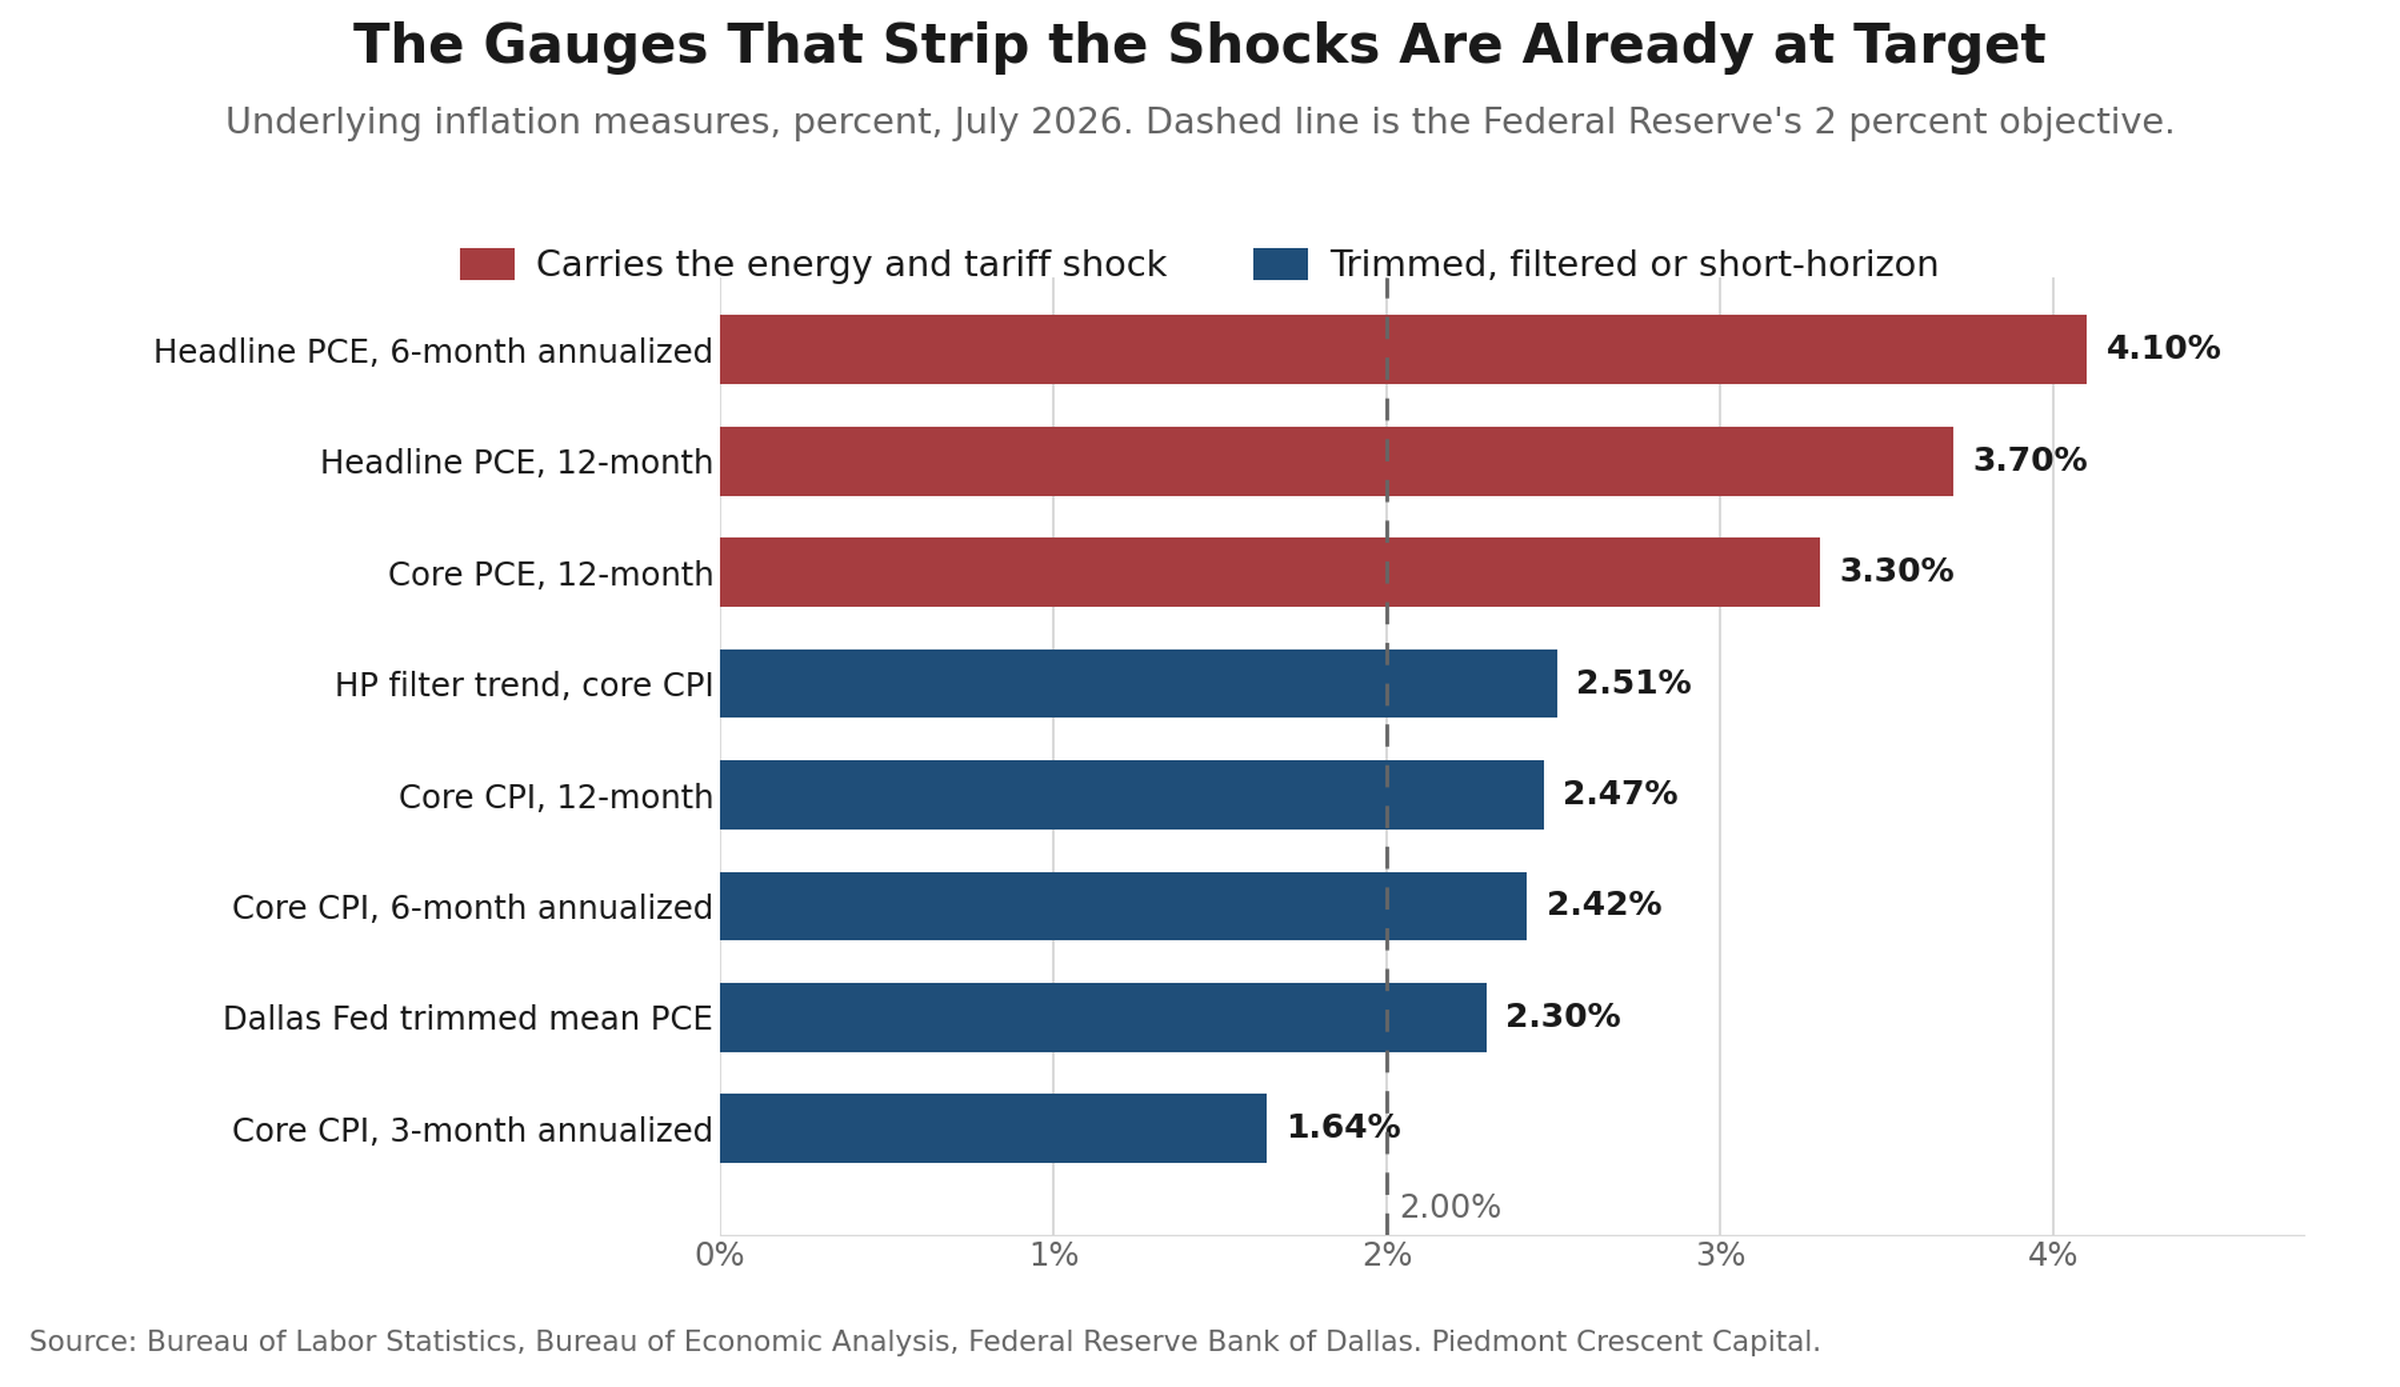
The corollary is uncomfortable for both sides. If underlying inflation has turned, the hawks are calling for a hike into a disinflation they cannot see yet. But we would not expect anyone to believe us, for the same reason nobody believed the March 1991 call: telling a trucking company that underlying inflation is 2.3% while diesel is up 52% is not an argument that lands well.
Look at what is still hot. Diesel, gasoline, ammonia, phosphate, coffee, beef. Figure 2 puts them next to the two aggregates the Committee actually targets. These are supply shocks: a refining shortage, a war, a fertilizer complex routed through Hormuz, and a cattle herd at a 75-year low. A funds rate hike does not reach any of them. A central bank that tightens into this set is adding a demand contraction to a supply contraction and calling the sum prudence.
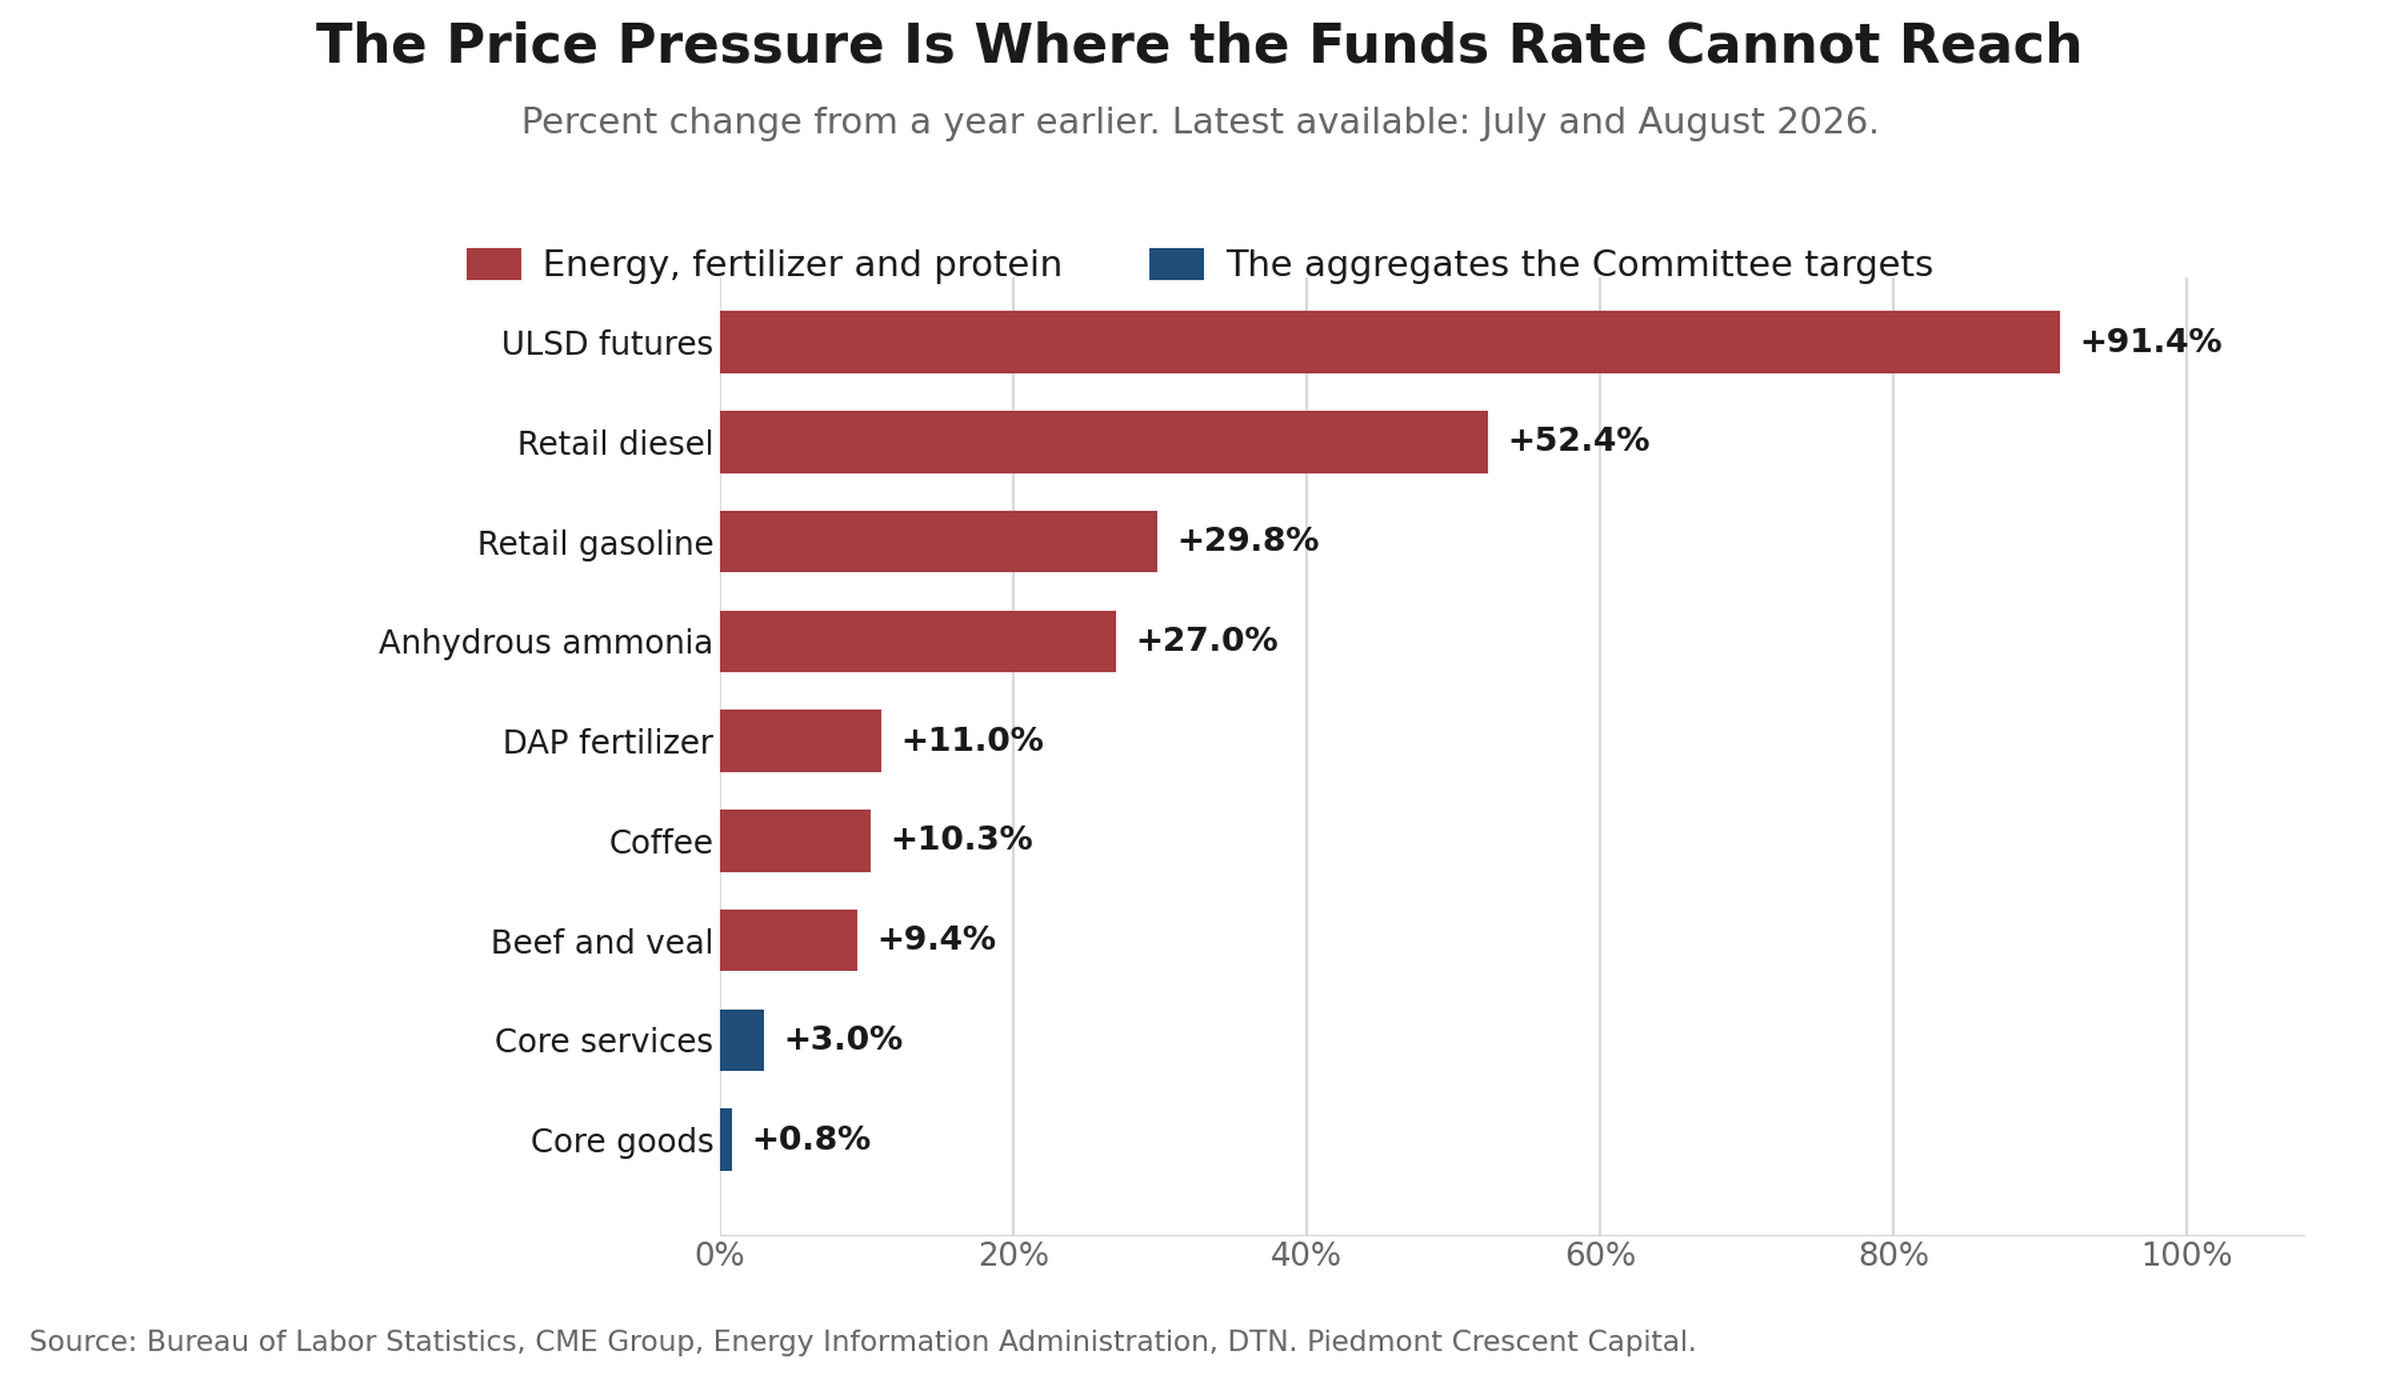
Friday settled a question we have been arguing for two months, and it settled it our way. We have said the long-end selloff is a real-rate and term-premium event rather than a credibility event. On the day the market repriced most violently, inflation compensation fell while real yields rose (Figure 3). If the bond market doubted this Committee’s willingness to return inflation to target, a hawkish speech would not compress breakevens. Everyone arguing that a 5% thirty-year reflects lost credibility now has some explaining to do.
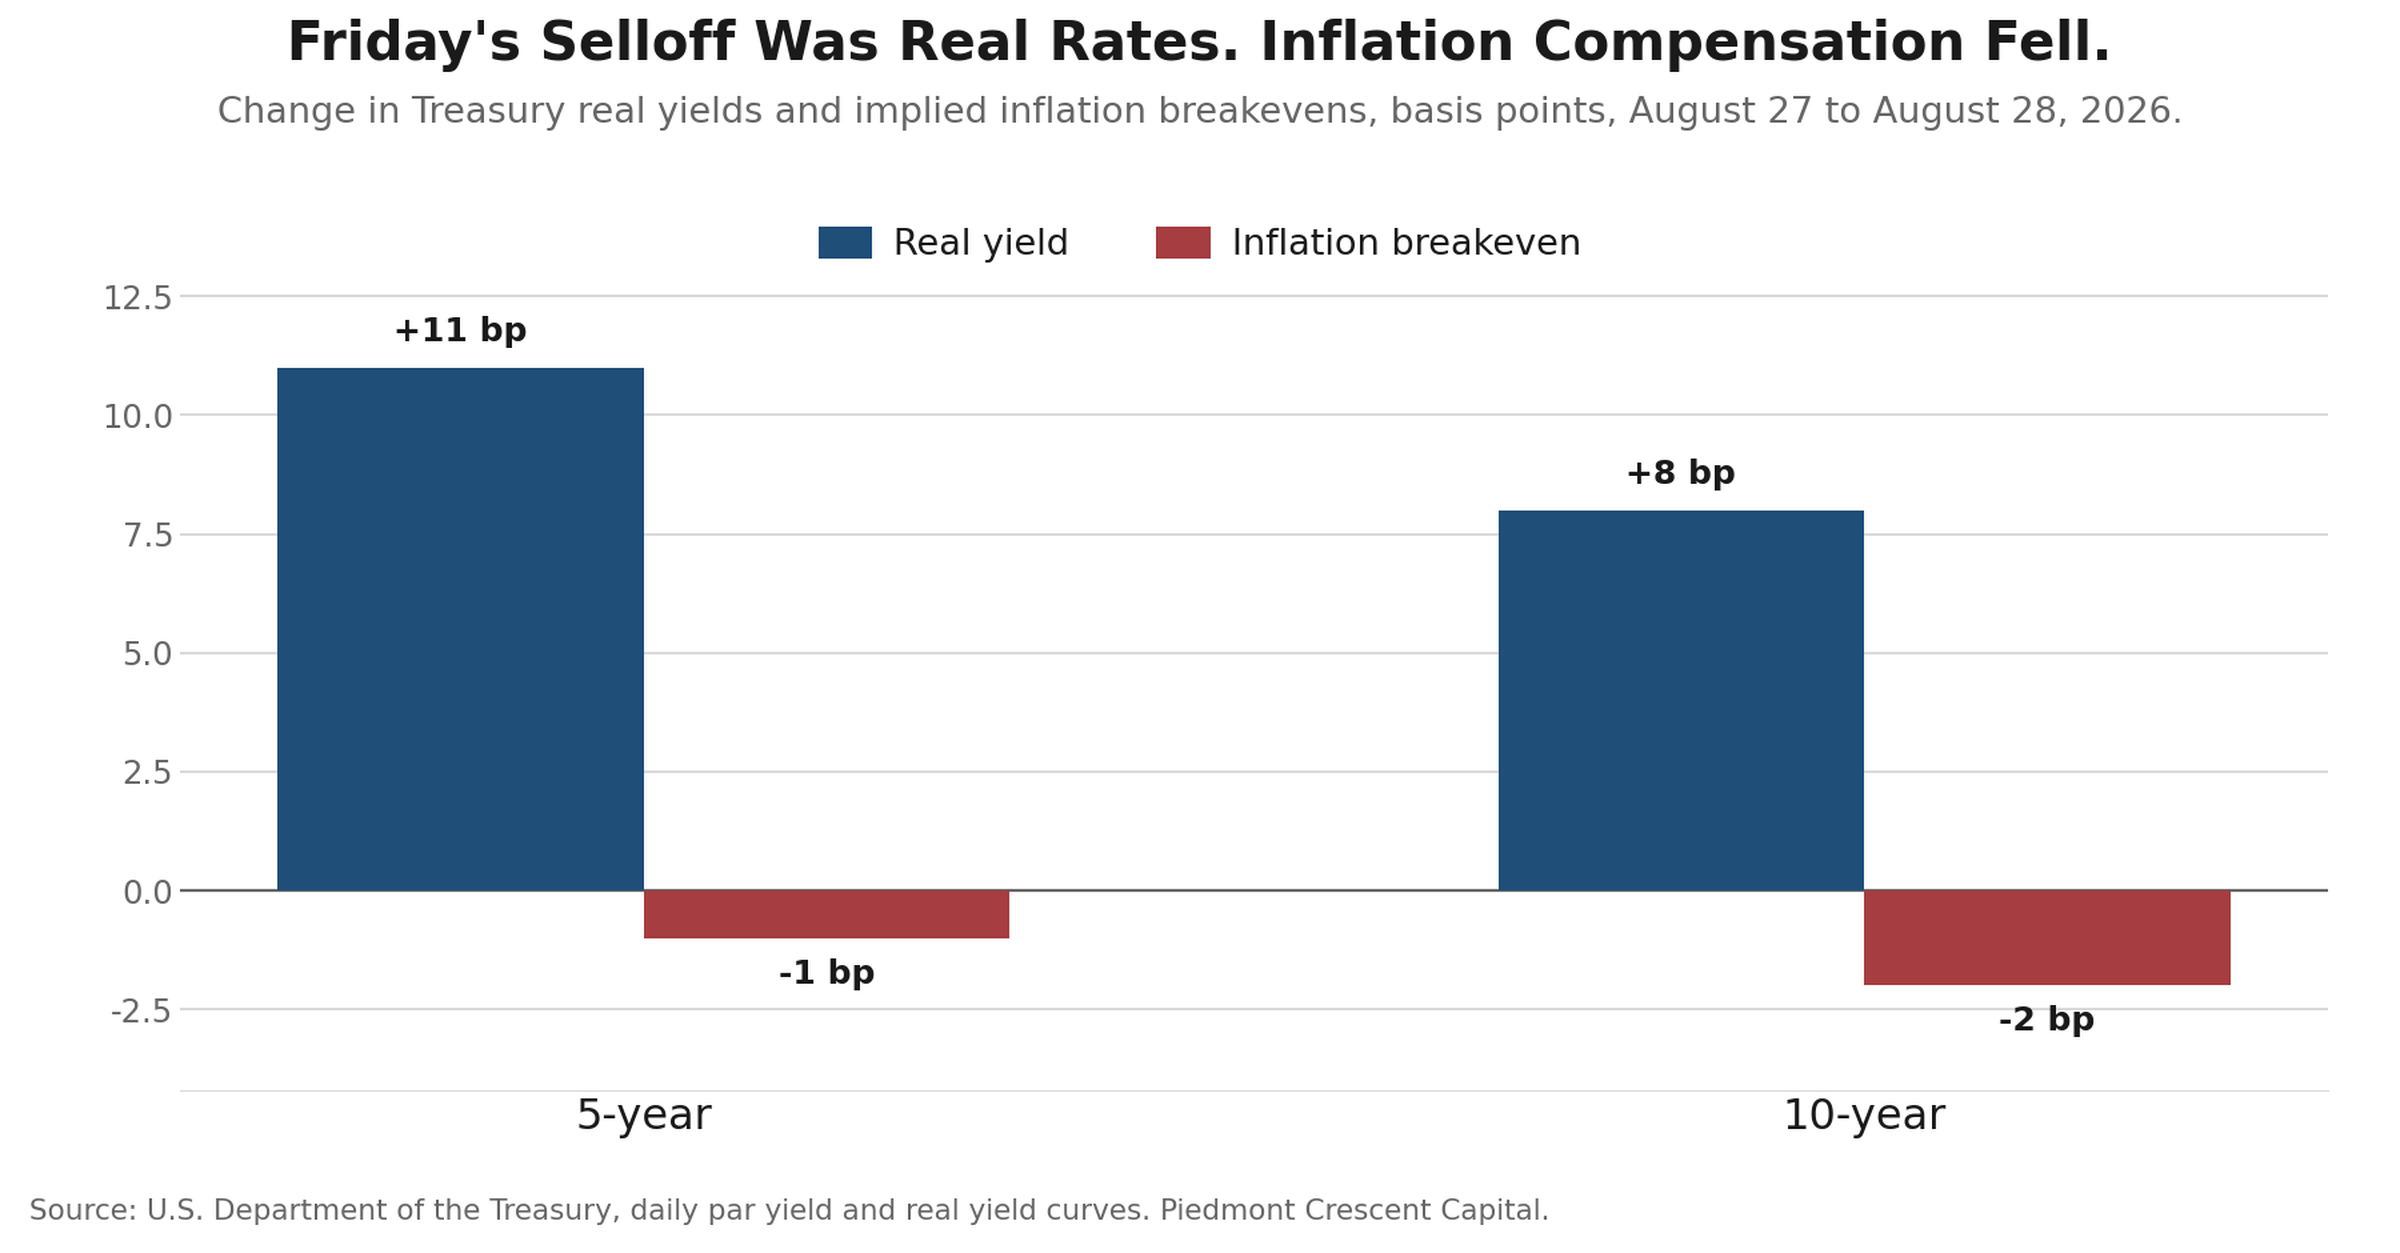
We are moving the first hike to the first quarter of 2027 from the first half, keeping the September hold, and raising the weight on a 2026 move. We set a rule a week ago: an explicit conditional tightening rule would mean our timing was too late; philosophy without a conditional would leave the call unchanged. Warsh gave neither cleanly: a refused reaction function plus a standard with a trigger. A partial clear moves the date, not the direction.
The house consensus is with us on September and nowhere near us on the first quarter of 2027. Most major forecasters expect a hold this month, several conditioning a hike on a firmer August consumer price print. The published alternatives to our view run in opposite directions: a 2026 hike as a tail risk, or a 2027 cut as a baseline. Nobody else carries a first-quarter-2027 hike, and the bullish duration calls have the 10-year 30 to 40 basis points through forwards by then.
This week’s argument
The supply argument in the speech runs in one direction only
Warsh’s second principle is the spine of the address: “all we observe directly is activity. We never see, and can only infer, what’s really happening on the supply side.” It is correct. He then applies it asymmetrically.
On employment, supply does all the work — “when labor supply is barely growing, monthly job gains are naturally going to run low,” which converts a weak payroll trend into a reading “consistent with full employment.” On prices, the supply argument disappears. The speech names not one constraint: not tariffs, not semiconductors, not fertilizer, not the immigration policy behind the labor scarcity he invokes. The word “diesel” does not appear.
The arithmetic is what makes this more than a stylistic complaint.
| What he used | What he did not | The gap |
|---|---|---|
| Headline PCE, 6-month annualized: 4.1% | Core PCE, 12-month: 3.3% | Largely energy — the shock his own principle says to be careful about |
| Target is 2% “as measured by the PCE price index” — headline | Core, which most central banks target | An energy shock now sits inside the target rather than being looked through |
| Private domestic final purchases “nearly 3%” | That the measure is inflated by AI equipment imports | Same wedge as Q2 GDP at 1.5% against domestic final demand at 4.2% |
| 54% of PCE components above 3% | That the calculation partly reflects tariffs | Core goods run roughly 4.5% above their pre-2025 trend on tariffs, a weaker dollar and oil |
Each of those choices flatters the hawkish reading, and each one does it by picking up a supply distortion. We do not think it is deliberate. We do think a Chairman whose second principle is that supply cannot be observed should have been more careful with measures that confound it.
The 54% figure is worth one further note. It is a diffusion index: it counts how many prices are rising quickly and does not weight them by what households spend. It has no counterpart in the literature or in any major house’s published toolkit, and nobody outside the building can replicate it. That is a fair thing to ask him to publish. One point against ourselves: a gauge built specifically to track what households perceive — weighted toward food and rent, the prices met most often — prints above core PCE, not below. Expenditure weighting does not automatically favor our reading.
What we would and would not blame on the artificial intelligence buildout
We had intended to argue that part of the diesel surge is data centers burning fuel in generators while they wait for grid interconnection. The data does not support it as a macro story, and we would rather say so than run it.
The premise is real. Northern Virginia has more than 4,000 diesel generators at data centers with over 11 gigawatts of capacity — more than Dominion’s entire gas fleet — and interconnection waits have stretched from under two years in 2008 to about five, so developers self-generate to get operational. In January the Department of Energy authorized PJM and two Duke units to direct data centers to run diesel backup against rolling blackouts.
But the magnitudes do not work. One Amazon permit contemplating 10 million gallons a year is about 650 barrels a day at full permitted burn, and permitted maximum is far above actual for units that idle most of the year. Fifty such campuses running flat out would be under 1% of distillate demand, and domestic distillate demand in August is running below a year ago. There is no demand surge to explain. Sustained bridge generation is also overwhelmingly gas, not diesel.
The tightness is supply and exports. Distillate exports hit a record 1.9 million barrels a day in the week ending August 5, into a European market starved by Russia’s export ban, while stocks sit at 103.4 million barrels, the lowest for the time of year in the history of the series, with refineries at 97.4% of capacity. Ukraine struck 21 Russian refineries in August, a record; Russian crude runs averaged 3.8 million barrels a day against a 5.3 to 5.5 normal, a 24-year low. Kirishi, the second largest at roughly 20 million tonnes a year, took another drone strike overnight Saturday, days after restarting from repairs; 62 drones were downed over Leningrad Oblast alone.
So the honest version is narrower and still ours: data center diesel is a real regional pressure in PJM and Northern Virginia, activated by cold snaps and loosening emergency definitions, and it is growing. It is not why the crack is at $95.
Fertilizer and beef are the same story as diesel, and beef is the cleanest illustration of the whole thesis
Fertilizer is a Hormuz story. Anhydrous ammonia is $964 a ton, up 27% over the year; DAP is $917, up 11%. The Middle East supplies roughly a quarter of global urea exports plus much of the sulfur and ammonia, all routed through the strait, and Iran, the third-largest urea exporter, has halted ammonia production while Qatar suspended output after facility damage. Two qualifications: five of eight fertilizers have now fallen month-over-month for four straight weeks, and USDA projects fertilizer and fuel costs to decline in 2027.
Beef is where the 1990/91 lesson hits home. Beef and veal are up 9.4% over the year, roughly three times headline, on a cattle herd of 86.2 million head — the lowest since 1951 — and a ninth consecutive annual decline in the calf crop. But July showed beef replacement heifers up 3%, the first real retention in about a decade.
That retention is the turn, and it makes the shortage worse before it makes it better, because every heifer held back to rebuild is one not slaughtered. The cycle has turned and beef prices will keep rising for two more years. Beef and coffee both fell month-over-month in July, and eggs are down 25.7% over the year. A central bank waiting for these categories to confirm a disinflation will wait past the point where it should have acted, the same error, in the other direction, that we made in 1991.
Behind the numbers
| Release | Reading | |
|---|---|---|
| Core PCE, July | +0.2% m/m, 3.3% y/y | Our decomposition puts portfolio management and advice fees — an imputed price no consumer pays — at roughly a tenth of the monthly print; market-based core ran 0.15%. The risk is core services ex-housing, neither a fees artifact nor energy |
| Q2 GDP, second estimate | 1.5%, unrevised | Core PCE price index revised up to 3.6% annualized — a within-quarter acceleration and the hawks’ best number |
| Real consumer spending, July | 0.0% | Services +$86.2 bn, goods −$49.9 bn. Warsh cited “more than 2 percent over the past four quarters”; over the last month it was zero |
| Benchmark revision | −79,000 | Cuts monthly payroll growth from ~25,000 to ~18,000. Private cut 178,000; government revised up 99,000. The preliminary has run below the final in each of the last six years by ~100,000; not in published data until February 2027 |
| Chicago PMI | 47.1, −10.5 pts | One volatile regional survey, no component detail. Tuesday’s ISM is the confirmation test |
| Michigan, final | 1-yr 4.0%, 5–10 yr 3.3% | We are not using this against Warsh. The 1-year improved from 4.3%, and the survey has been distorted by politicized responses and a switch to online collection. Market measures are cleaner and support him |
| New home sales, July | 607,000, −10.5% | Months’ supply 9.6; completed spec inventory ~4× its 2022 low; homes not started at an all-time high |
| Claims | 203,000; continuing 1,778,000 | Reverses a grind higher. But Richmond employment printed −2 and Kansas City 0, with prices paid pulling away from prices received |
On small business, which we add to the strained list, the evidence is mixed and we report it that way. Subchapter V small business bankruptcies rose 67% year over year in the first quarter and 24% in July, with first-half filings up 50%, while total commercial filings were flat to down. That concentration is the cleanest fact available; the NFIB average rate paid on short-maturity loans is 7.9%, with only 27% of small firms borrowing regularly against a 34% historical average. The July Senior Loan Officer survey cuts the other way: banks left small-firm standards unchanged and eased spreads while demand was flat. The squeeze is on the demand side, reflecting tighter margins.
Bottom line
We expect a hold on September 16 and a first hike in the first quarter of 2027. The market prices 59% for September on futures and 69% on prediction markets. We are well under it.
The condition that would flip us is eleven days away. Core CPI at or above 0.3% on September 11, particularly with core goods above 0.4%, would mean the refining shock has reached the goods basket and would make a September move the base case. Friday’s payroll report comes first and matters mainly for the tail.
| Call | Status | Where it stands |
|---|---|---|
| 30-year 5.00–5.40% into September 16 | On track | 5.22%; 39 consecutive sessions at or above 5% since July 7 |
| Brent $85–100 average through year end | On track | $89.31; our own $92.00 third-quarter mark now looks high |
| August or September payrolls above 125,000 | At risk | Consensus near 45,000–55,000 for August |
| MOVE above 70 into September 16 | On track | Friday’s selloff helps |
| ULSD crack above $60 through Q4 | On track, now priceable | $95.06 Friday; record $101.86 on August 17. The Kirishi strike is not in that settlement |
| PCE components above 3% below 54% in January | New | A test of the Chairman’s own gauge. If we are right, his standard is met without a hike |
One risk attached to our own call is not the obvious one. A September hold seen as a close call, without a clear explanation of why, risks a repeat of the July meeting’s effect on the curve: bear steepening and a term-premium build. That is the scenario where we are right on the decision and hurt on the positioning, and it argues for the belly against both wings.
We stay cautious on duration. The 2-year at 4.34% pays for a reinvestment decision with almost no duration risk, and 88 basis points at the long end is not compensation for a maturity whose marginal basis point is set by a shipping lane and a drone campaign. This puts us opposite the bullish duration calls, which have the 10-year well through forwards by early 2027.
This is still a capital-led, employment-light expansion. What changed is that the Federal Reserve is being taken off the emergency footing it has occupied since 2008, and the market’s first verdict was to believe it. If the Fed will no longer say where rates are going, someone else decides what duration is worth. A 30-year at 5.22% is that decision being made in public.
CFO and treasurers corner
Plan on less warning. The Fed has stopped underwriting your rate forecast: fewer signposts, possibly fewer meetings, no path. Hedge on a schedule rather than on a view.
Do not read the crude tape as a fuel budget. Brent fell 5.4% and diesel rose 19.8 cents; the crack settled at $95 on a day crude fell, and Sunday’s escalation is not in it. Hedge the product or the crack, not the barrel.
The 2-year moved 14 basis points on a speech containing no policy commitment. If you were planning to fix floating-rate exposure, you are now paying for better than half a hike in September and 2.4 over twelve months.
Two dates. Canadian retaliation takes effect September 8. Ottawa published the schedule on August 25: C$27.6 billion of goods, roughly 700 tariff lines at 15%, 25% and 50%, with steel and aluminum doubled to 50%, alongside a C$7.5 billion support package. Check the list against your own bill of materials before you assume an exemption. Treasury’s upsized long-end buybacks begin September 9 or 10: the announcement says the 9th, the published schedule shows the next 10- to 20-year operation on the 10th. Verify before positioning.
If you buy protein or fertilizer, the cycle is against you into 2028. Cattle retention has started, which tightens beef before it loosens it. Contract further forward than feels comfortable.
Piedmont Perspective — What counts as a job now
The short version of a standalone essay published today.
The Chairman rested the employment mandate on three indicators: the 4.1% unemployment rate, a four-week claims average he called “an empirically robust real-time indicator,” and the judgment that people who want work are finding it. All three share a blind spot that has been widening for twenty-five years.
Independent contractors cannot file an unemployment claim in any state, and the exclusion is structural. Unemployment insurance was built in 1935 around a wage earner on one payroll, and its financing is experience-rated, which requires an identifiable employer to charge. There is no employer to experience-rate for a contractor.
The consequence is a number nobody quotes. The share of unemployed Americans actually receiving benefits was roughly 50% in the 1950s and is 28% today. The insured unemployment rate divided by U-3 was about 0.70 in 1971; on Friday it was 0.29. Continuing claims of 1,778,000 against 6,916,000 unemployed is 25.7%. Three of every four unemployed Americans are not in the series the Chairman called robust.
The unemployment rate has the opposite problem: one hour of paid work makes you employed. U-3 fell 0.2% over the year while U-6 did not move at all, and the multiple jobholders rate has risen every month since March.
And the official measure of platform work is a decade old: 1.6 million workers, 1.0% of employment, from May 2017, itself a hand-recode because the questions “did not work as intended.” The 2023 replacement questions have never been published. In February the Bureau redesigned the module to ask them of people not employed at the time of survey, an admission the old instrument could not see platform work among people classified as unemployed.
What makes this cyclical rather than untidy is that the substitution has been measured. Work published this year in the Journal of Financial Economics finds that after a job loss, workers with platform access were 3.3% less likely to collect unemployment benefits, strongest in low-benefit states. Boston Fed work estimates counting informal work as employment would lower the unemployment rate 1.0%. Each effect pushes the Chairman’s indicators toward full employment without a unit of improvement in labor demand.
We are not arguing the labor market is secretly weak. We do not know, and neither does anyone else. That is the point. The prevailing house view reads it as supply-constrained rather than demand-weak, with some forecasts putting unemployment at 3.9% by year end. We would have the Committee hold its conclusion more loosely and put the prime-age employment-population ratio, U-6, the job-finding rate and aggregate hours alongside the headline.
The G20 comes to North Carolina
The G20 finance ministers and central bank governors meet at the Omni Grove Park Inn in Asheville Monday and Tuesday. Secretary Bessent hosts and Chair Warsh co-hosts, three days after Jackson Hole and four days before the blackout. Lagarde and Ueda skipped the symposium to attend. The United States holds the 2026 presidency; the Leaders’ Summit is December 14–15 at Doral. Climate, health and food security working groups have been cut. South Africa is not participating, so this is effectively a G19.
Do not expect a communiqué. April produced only a narrow chair’s statement, so treat anything from Asheville as an American document. Iran is the live wire: Bessent is pressing members to choose between Iranian trade and dollar-system access, China takes roughly 90% of Iran’s crude exports, and Sunday’s escalation makes agreement less likely and headlines more so. If that pressure worked it would be oil-positive, not negative. Watch for any language on Treasury market functioning; that would be the week’s one tradeable output.
A local note, since we live here. Bessent chose Asheville to showcase the Helene recovery. Damage was roughly $60 billion against $9.7 billion of federal aid delivered, about 16%.
The week ahead
| Date | Release | Consensus | Why it matters |
|---|---|---|---|
| Mon Aug 31 | Dallas Fed manufacturing; G20 convenes, Asheville | 0.7 | Markets reopen to a repriced front end and Sunday’s escalation |
| Tue Sep 1 | ISM manufacturing | 55.3 | The confirmation test for Chicago’s 47.1. Sub-50 makes the activity question live; near 55 says Chicago was noise |
| Tue Sep 1 | JOLTS (July); construction spending; GDPNow | 7.39 mn openings | Governor Barr speaks |
| Wed Sep 2 | ADP; Beige Book; factory orders; Bank of Canada | +47,000 | Look for whether Richmond and Atlanta corroborate the margin squeeze. Broadcom reports — the AI capex read |
| Thu Sep 3 | Governor Waller, 8:30 a.m.; claims; ISM services; productivity; trade | Claims 205,000 | The last dovish voice before the blackout. If Waller has moved, that is the week. Hammack and Goolsbee also speak; coupons announced |
| Fri Sep 4 | August employment report | +45,000 to +55,000; U-3 4.2% | July missed by 103,000. A print below 25,000 on a revised-down benchmark takes September off the table |
| Sat Sep 5 | FOMC blackout begins | — | Runs through September 17 |
Then: OPEC+ September 6; Canadian retaliation September 8; auctions September 8–10; August PPI and CPI September 10–11, the pass-through test that decides September; FOMC September 15–16.
One quieter date. The fiscal year ends September 30 and shutdown risk is low: both chambers have passed continuing resolutions and prediction markets have moved from 35% in July to about 8%. The point is not October: the fight has been deferred to early December, landing on top of the December 8–9 FOMC.
U.S. economic and financial outlook
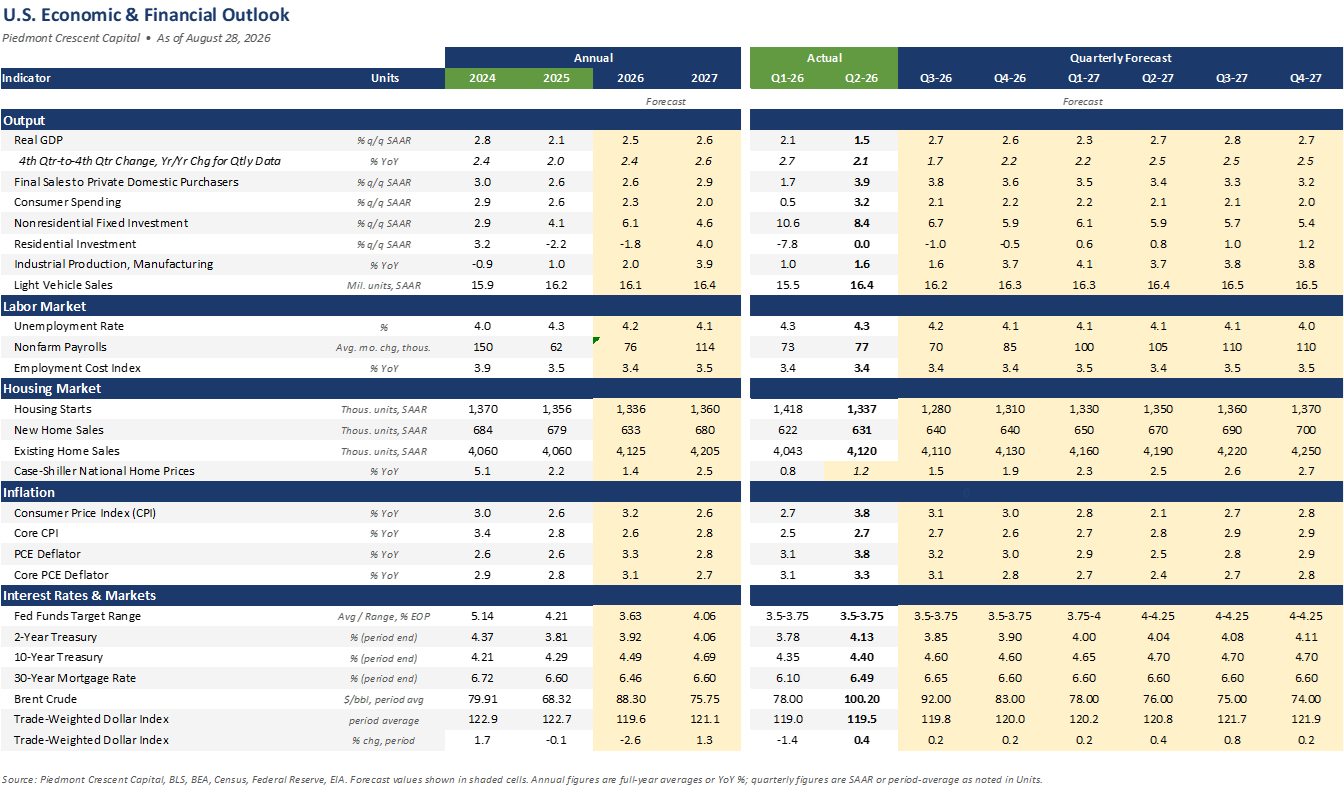
Sources and notes
Sources. Warsh, “In Our Time,” Jackson Hole, August 28 · BLS, BEA and Census for the benchmark revision, prices, GDP and housing · U.S. Treasury par yield and real yield curves and the auction and buyback schedules · CME Group settlements · MNI, University of Michigan, Freddie Mac and EIA · USDA July Cattle report and DTN retail fertilizer · NFIB, the Senior Loan Officer Opinion Survey and Epiq/ABI · the Reserve Banks of Richmond, Kansas City, Dallas, Chicago, Atlanta, Boston, St. Louis and Minneapolis · CENTCOM, Reuters, CNN and Al Jazeera on Larak Island and Jordan · the World Bank on fertilizer · and published sell-side and independent research.
Notes. Yields, real yields and implied breakevens are the official par yield curves for August 28; gold is the COMEX December settlement, resolving a roughly $75 dispersion across intraday quotes; the ULSD crack is computed from CME settlements at 42 gallons per barrel, and the August 17 record of $101.86 is on the same basis. Sunday’s escalation is reported through Monday morning Gulf time. Larak casualty figures are Iranian claims, damage at the two Jordanian bases is unconfirmed, and there had been no Omani, Qatari or congressional response as of publication. Our underlying inflation trend is a one-sided recursive Hodrick-Prescott filter on monthly annualized core CPI, lambda 129,600, sample from January 2000, so each estimate uses only data available at the time and never revises. The 54% and 49% component shares are as cited by Chairman Warsh and are not independently replicated. The benchmark revision does not enter published payroll data until February 2027. All figures are subject to revision. For informational purposes only; not investment advice.
Download the full report PDF, 10 pages, with the market dashboard, all three figures and the full forecast table.
Full Count | A View from the Piedmont
Piedmont Crescent Capital
A View from the Piedmont | Our Weekly Commentary on Money, Credit, Exchange Rates & Geopolitics
September 14, 2026 | Mark P. Vitner, Chief Economist | mark.vitner@piedmontcrescentcapital.com
Full Count
The rule we published relative to the inflation data two weeks ago cleared half of its own bar, hike odds hit roughly 90% anyway, and a presidential ultimatum on Iranian infrastructure now lands on the FOMC's own first meeting day. Goldman Sachs, which like us did not see a hike before the midterms, flipped to a hike on an argument its own economists say the data does not support. A handful of economists are still calling for the Fed to hold. We are not among them. We see a hike as more likely than not because we believe a majority of the FOMC will not want to surprise the markets when fed funds futures assign nearly a 90% probability of a quarter point hike.
Market Dashboard
*Treasury yields are Thursday, September 10 closes (Federal Reserve H.15) against last week's edition; the 2-year and 10-year moved further at Friday's post-CPI close, to roughly 4.63% and 4.96% to 4.97%, per secondary providers we could not reconcile against Friday's own H.15 print. Equity, VIX and gold levels are Friday closes; oil levels are Friday, ahead of the weekend's escalation. Credit spreads have not been refreshed since September 8. Hike odds are CME futures-implied, intraday Friday. Brent traded to nearly $108 intraday Monday on a vessel attack in the Strait of Hormuz and a drone strike on a Saudi pipeline, not incremental OPEC+ supply; that level and Monday's Treasury close were still moving as this draft closed.
Summary
The flip rule we set two weeks ago just returned a split verdict, and on our own arithmetic that verdict is a hold. August core CPI rose 0.3% m/m, 0.29% unrounded, clearing the first half of our threshold. Core goods, the second half, rose just 0.1% m/m, a quarter of the 0.4% bar we set before we had the number. Headline CPI rose 0.4% m/m and 3.4% y/y, with gasoline's 3.9% jump doing over a third of the increase, per BLS. Taken literally, our framework still says September 16 should be a hold.
The most important rule we follow in regard to the following the Fed is to separate what we believe the Fed should do from what we think they will do. CME-implied odds of a hike reached roughly 90% intraday Friday, up from 70% Thursday and 58% the week before, and Goldman Sachs flipped to a 25bp hike that afternoon. But Goldman's economists remain conflicted: their own note says the August CPI report "only raised our August core PCE forecast slightly to 0.26%" on the month, well short of a strong data case for tightening, and "has not changed our fundamental inflation view." Goldman hikes anyway because it expects the Committee "will want to avoid the market reaction that would likely follow from remaining on hold when the market is pricing a nearly 90% chance of a hike." Our own logic is slightly different. We see inflation near an inflection point, with underlying price pressures, which have been moderating, likely to be pulled higher over the next 18 months by the ongoing AI buildout and a strengthening manufacturing sector.
Only a handful of analysts have the Fed holding rates steady in September. We have a lot of sympathy for this view, as higher rates will do relatively little to curb inflation. Brent cleared $107 intraday Monday on a vessel attack in the Strait of Hormuz and a drone strike on a Saudi pipeline, and a 45-day Hormuz ceasefire proposal collided with a presidential ultimatum on Iranian infrastructure landing Tuesday, the FOMC's first meeting day. Diesel is now over $6 a gallon, hitting trucking and farmers hard at a critical time for their business. Our technical call had been for the Fed to hold September 16, increase a quarter point on December 9, and hike one more in 2027 to 4.00% to 4.25%. We now see a September hike as more likely than not, even though we would vote against it if the Fed gave us a vote. The most interest rate sensitive parts of the economy, housing, consumer durables and light vehicles, are already reeling. Higher rates will cool demand further. Higher rates will do some good, however, as they will slow final demand for consumer, making it more difficult for firms to pass along their higher costs (diesel being one of the biggest), impacting profit margins and likely rocking an already nervous stock market. We doubt this will have much impact on diesel, however, as prices are being driven by Ukraine's relentless attacks on Russia's energy infrastructure and Iran's proxies attacks on Saudi oil pipelines. Data centers will continue to run their diesel generators until the weather cools later this fall and opens up room on traditional energy grids. The data center influence is also pulling natural gas prices higher. The Fed's move is then a containment strategy rather than an inflation fighting strategy.
This Week's Argument
The flip rule, half right
Core CPI cleared our bar. Core goods were particularly well behaved, which is surprising given the persistence of tariffs. Core services were not as well behaved. Wireless phone services jumped 5.9% m/m, adding about 10bp to core CPI; airfares and lodging rose 2.7% and 2.4%, adding 4bp apiece. Shelter ran cooler than expected, however, with OER and rent each up just 0.2% m/m, holding shelter to 3.0% y/y. Core goods, commodities excluding food and energy, rose only 0.1% m/m and 0.7% y/y. If tariffs and the war were broadening into the price of things people buy off a shelf, core goods would show it first, and it did not. That argues against raising interest rates this week, particularly given that the reason tariffs are not being passed along is that interest-sensitive parts of the economy (housing, light vehicles, furniture and appliances) remain weak.
Governor Waller's own assessment from his September 3 remarks, that his "earlier worry that higher energy prices would bleed into many goods and services prices hasn't come to pass, at least so far," survives another month. We believe Waller will dissent in favor of leaving interest rates unchanged. As far as our forecast goes, the earlier Fed move produces only a modest drag on our above consensus forecast. Higher rates will create a greater pullback in single-family starts than we had earlier projected and higher long-term rates will keep buyers on the sidelines for longer. Asking prices are coming down across the country, particularly in the South, which we believe will bring buyers back into the market, provided mortgage rates fall back under 7%.
Core Goods Stayed Cool While Core CPI Cleared Our Bar
Core CPI versus core goods, monthly, January 2025 through August 2026, with the flip rule's 0.3%/0.4% thresholds marked.
The case the rule can't see
Our flip rule was built to catch whether the energy shock was broadening into the price of goods within a month. It was not built to catch a Committee that hikes to protect the credibility it spent August building, and it was not built to catch an inflation problem forming over the next eighteen months rather than the last thirty days. Both are live, and each is a separate reason to expect a hike Wednesday even though our own rule says hold. Chair Warsh's Jackson Hole language left the market pricing a hike unless the inflation news came in clean, and August's report, hot on the headline if not on the composition, was not clean enough to change that pricing. We think a majority of the Committee would rather hike than disappoint a market assigning nearly 90% odds to one, and that disappointing it without a clear inflation justification is its own kind of communication risk, exactly the one Chair Warsh has spent the year trying to avoid rather than invite. Oxford Economics is holding the other side of that bet, keeping its own baseline call for a hold this week on the expectation that core PCE stays benign; we think that reading, even if it comes in as they expect, will not be the deciding input this time.
The second reason is ours, and it does not depend on what we think the Fed thinks. This remains a capital-led, employment-light expansion, protein rather than carbohydrates, and the sectors carrying it are the ones a quarter point does the least to cool. Manufacturing payrolls have turned positive after two years of decline, capital goods orders are running double digits above a year ago, and the scarcity running through semiconductors, electronic components and the other categories the AI buildout is consuming has not eased and will not until the buildout does; ISM's own Prices Index has signaled rising input costs for twenty-three straight months. None of that shows up in a single month of core goods CPI, because none of it moves goods prices the way a demand shock would, in one month; it moves them the way capital investment always does, slowly at first and then all at once. We think the underlying pressure this expansion has built, most of it outside the reach of the fed funds rate, is closer to the surface than August's print alone would suggest, and that a Committee looking eighteen months out has more reason to move now than a rule built for a one-month test can show.
We've closed most of the gap to the curve
The 10-year at 4.95% to 4.97% is now just above our own forecast, not dramatically past it. We raised our own path this week to 4.88% for the third quarter and 4.85% for the fourth, up sharply from the 4.60% we had going into the meeting, which leaves a residual gap of only 9 to 12 basis points rather than the 35-plus we were looking at a few days ago. The backup in long rates is already doing some of the Committee's own work for it, tightening financial conditions before Wednesday's vote is even cast. We still own the belly, where the 5-year near 4.75% is the least exposed of the three main tenors to being wrong about Wednesday in either direction.
Equities rallied Friday, which is its own kind of data point. The S&P 500, Dow and Nasdaq each rose roughly 1% on the day, the first gain in five sessions, and the VIX fell more than 11% to back under 16, even with a hot core print and oil climbing toward $108 over the weekend. Credit spreads have not printed a fresh reading since our last edition, but nothing in the equity or volatility reaction argues for stress building underneath the Fed debate. Markets are still pricing this as a Fed-and-oil repricing rather than a growth scare.
We've Closed Most of the Gap to the Curve
The 10-year Treasury yield against the house Q3-26 forecast path, the gap now near 9 to 12 basis points.
Consumer Sentiment's K-Shaped Split
University of Michigan Index of Consumer Sentiment, monthly, June 2025 through September 2026; the September reading is preliminary.
Behind the Numbers
Not only did consumer sentiment fall sharply in early September, but the split between higher and lower income households also became sharper. The University of Michigan's September preliminary index dropped to 47.8 from 51.7. One-year inflation expectations jumped to 4.6%; five-to-ten-year expectations rose to 3.4%. Sentiment fell for lower- and middle-income households and rose for upper-income households. This is the K-shaped economy that so many are experiencing and talking about. One aspect that is often overlooked is that wealth rises with age and the growing share of retirees is helping drive spending on the top half of the K. We have trimmed our forecast but still have consumption growing at around a 2% pace through year-end even as lower-income households absorb the gas-price hit directly. The same squeeze shows up in housing, where higher mortgage rates have pushed the payment on a median-priced home up nearly $300, or 15%, since the war began.
The oil shock is now a supply story running on at least two tracks. A vessel attack in the Strait of Hormuz threatens the shipping lane itself, while Saudi exports have taken a separate, direct hit from Red Sea and Houthi threats. Saudi output is expected to remain below 7 million barrels a day for the rest of the year. Gulf foreign ministers are reportedly meeting Iranian counterparts on an Oman-brokered arrangement for interim Strait management, the logic behind Monday's ceasefire proposal. Our oil price forecast for Q4 Brent currently sits at $92 a barrel, which is about $15 below the current spot price. We are expecting supply issues to remain in place through the election and then ease considerably in 2027. Brent crude is expected to end 2027 at around $75 a barrel.
A fiscal tail risk worth naming and not overweighting. President Trump has proposed $5,000 dividend checks to all adult citizens if Republicans hold both chambers after the midterms, a measure that would potentially cost $1.25 trillion, or 3.8% of GDP, more than Treasury will spend this year on defense, Medicare, or debt interest combined. The odds of a Republican sweep are low today and we doubt the dividend would pass even with a GOP controlling both houses of congress. The economics of such a deal are dubious at best, with a short-term boost to consumer spending no lasting benefit and a much larger national debt that is harder to paper over.
Bottom Line
We now see a hike as more likely than not on September 16, even though our own flip rule, taken literally, still says hold. Core CPI cleared the 0.3% bar we had set; core goods missed the 0.4% bar by three-quarters. That is the whole test we set for ourselves based on Warsh's recent statements two weeks ago, and on that test alone the case for holding is not close. We are overriding our own rule for reasons it was never built to weigh: a Committee that spent August guiding markets toward a hike and would rather deliver one than explain why it did not, an oil shock that builds a risk-management case with nothing to do with core-goods breadth, and our own view that this expansion's underlying inflation pressure is closer to the surface, on an eighteen-month horizon, than one month of goods prices can show.
We would not vote for this hike if the Fed gave us a vote. Higher rates will do little to curb an inflation problem running through energy, tariffs and AI-driven capital scarcity, none of which a quarter point touches, while the parts of the economy still sensitive to rates, housing, consumer durables and light vehicles, are already reeling; a hike now cools demand further where it can least be afforded and squeezes the margins of firms already absorbing higher costs, and we would expect it to rattle a stock market that has traded the last several sessions as though the decision were a formality. Fed funds futures assign roughly 90% to a hike, more conviction than we have ourselves, though this is the first meeting this year where we lean toward one, and a hold that surprises pricing that heavy would be its own event, one we would expect Chair Warsh to spend the press conference explaining. Check this against Wednesday's vote count and how he frames the neutral-rate question, not against Friday's headline alone. A hike leaves open whether the Committee treats it as the first of two moves this year or one it can pause after; a hold leaves our December 9 call and the 4.00% to 4.25% terminal rate for 2027 standing as before.
CFO and Treasurers Corner
If you were waiting for the print to fix the position, the print already told you what it can, and the decision is two days out. The 2-year sits at 4.56% to 4.63% depending on the day's close, already pricing most of a hike and a real share of a second within the year. We now see a hike as more likely than not, which leaves less room for the front end to rally than our old call implied, and little room at all if the Committee delivers and signals more to come. Fix now if you cannot carry the position through either Wednesday outcome.
Issuance windows are tight heading into Wednesday, before the decision lands. The FOMC meets the same week Treasury typically returns to the belly and long end with fresh coupon supply, and rate volatility historically peaks into the statement. Investment-grade spreads at 81 basis points and high yield at 267 are not the obstacle; funding-cost uncertainty into Wednesday is. Price before the meeting or wait until Thursday.
Budget diesel off a crack that just moved again and stop treating $6 as a ceiling. Brent cleared $107 intraday Monday on the Hormuz vessel attack and the Saudi pipeline strike, up from the low $100s a week ago, and diesel has moved above $6 a gallon, past April's high. A Tuesday strike on Iranian infrastructure would add fresh upside. Hedge the crack, not the barrel.
The dollar's rate-differential story is waiting on the same Wednesday decision as everything else. A Fed on hold while an already-hiking ECB and a live Canadian tariff dispute sit on the other side of the ledger keeps one rate gap narrow and the other wide; a hike closes both at once. Reassess hedge ratios on European and Canadian exposure together once Wednesday's outcome is known.
Hold the wage budget at 3 to 3.5% but budget the bifurcation into discretionary-spend assumptions. Wage data has not moved this week. What has moved is the split inside the University of Michigan's index: lower- and middle-income households absorbing the gas-price shock directly, upper-income households still spending on the wealth effect. If your base skews toward the former, build more caution into discretionary categories than the aggregate wage number suggests.
The October 12 PJM deadline for delivered power is four weeks out, and nothing this week moved it. PJM's rule requiring new loads above 50 megawatts energizing after June 2027 to bring their own capacity or accept curtailment still takes effect October 12 if approved as filed. Treat the capacity charge as a line item and the curtailment language as a negotiating point now.
Piedmont Perspective
Twenty-Five Years Ago: My Perspective from Three World Trade Center
Abridged from the standalone essay published today.
Twenty-five years ago I was in a hotel ballroom at Three World Trade Center when the first airplane hit. I am told now that no airplanes hit the towers, and that America had it coming. This is what I saw, and what the record shows.
I was in the back of the ballroom at the New York Marriott World Trade Center, wedged between the towers and joined to the north tower below ground, attending the annual meeting of the National Association for Business Economics. Robert Scott of Morgan Stanley was about ten minutes into a talk on financial services when we heard a boom, then a rattle across the roof like machine-gun fire, then three or four thunderous concussions, and the room shook like an earthquake. None of us knew that pieces of the north tower were landing on our building, and that the ceiling was holding.
Nothing of that hotel survived the day. The south tower crushed its middle at 9:59; the north tower took nearly all the rest at 10:28. Forty-three people inside were killed, including two employees who stayed behind to get guests out. Staff led the rest of us out a side door onto the West Side Highway, a fireman timing our exits between falling debris.
I did not see the first plane; I saw the second. I was five hundred feet from the south tower when an engine screamed off the glass towers, then came an explosion, and we watched the impact in a building's reflection before hitting the ground. Close to a hundred cameras caught that airplane before it struck; a wing section turned up blocks away in 2013. Thirty-seven telephone calls came off United 93 before it crashed five minutes later. If none of it happened, those thirty-seven people invented their last conversations, and the family that fed me dinner that night was grieving a man, an Oracle account manager named Todd Beamer, who had not died.
I got out on a tugboat, walked into New Jersey, and a Sprint representative named Bob drove me to Princeton, rented me a car, and sat a stranger at his family's dinner table. Along the way, at a pushcart near the site, a man I took to be an Arab immigrant handed out water to anyone who passed, refusing to meet anyone's eye, clearly afraid the crowd might turn on him. It did not. In the whole of that day I never once heard a negative or threatening word said against Arabs or Muslims.
Twenty-five years is long enough for the argument about a day to replace the day. A National Institute of Standards and Technology investigation running six years found no evidence of controlled demolition; a 2023 survey still found twenty percent of American adults believe our own government was behind the attacks, a share that reached twenty-seven percent of Gen Z in a survey three years later. I have come to read that instinct less as an argument about steel and fire than as a posture toward whoever is doing the explaining, and it travels easiest to people with no particular reason to trust anyone who was there.
New York's medical examiner is still identifying the dead by name, one at a time, twenty-five years on; 1,099 of the 2,753 killed at the Trade Center have never been identified at all. Anyone prepared to argue that any of it was deserved, staged, or invented should be willing to make that case in a room with them.
Read the full essay: Twenty-Five Years Ago, My Perspective from Three World Trade Center →The Week Ahead
US Economic and Financial Outlook
This table reflects an updated, September 11 vintage. The 2-year at 4.56% to 4.63% remains well above our Q3-26 call of 3.85%, while the 10-year at 4.95% to 4.97% is now within about 10 basis points of our updated 4.88% estimate for the quarter, after we raised that path to reflect the backup in long rates. The 30-year fixed mortgage near 6.75% now sits just under our updated Q3-26 estimate of 7.00%. Brent's move past $107 sits above our updated Q3-26 average of $98.00, and we have already raised our Q4-26 estimate to $92.00 from $83.00 to reflect the escalation.
Key Q3-26 / Q4-26 forecast levels, as of September 11, 2026:
10-Year Treasury: 4.88% / 4.85% | 30-Year Mortgage: 7.00% / 6.80% | Brent Crude: $98.00 / $92.00 | Fed Funds Target Range: 3.75-4.00% / 4.00-4.25%
The complete annual (2024-2027) and quarterly (Q1-26 through Q4-27) outlook tables, covering output, labor, housing, inflation and rates, are in the full report.
Notes. Treasury yields are Thursday, September 10 H.15 closes; Friday's post-CPI 2-year and 10-year (roughly 4.63% and 4.96% to 4.97%) come from secondary providers we could not reconcile against Friday's own H.15 print, and Monday's session was still underway as we finalized this piece. Brent's move past $107 on the Hormuz attack and the ceasefire proposal are moving in real time; treat the levels here as our best read as of Monday morning, not as settled by the time this reaches you. Equity, VIX, gold and oil levels are Friday closes as reported by the cited outlets and have not been independently verified against settlement data. Credit spreads have not been refreshed since September 8. All figures are subject to revision. For informational purposes only; not investment advice.
© 2026 Piedmont Crescent Capital, LLC. All rights reserved.