
PIEDMONT PERSPECTIVE
What Counts as a Job Today
The Chairman declared the employment mandate satisfied on Friday. He did it with three indicators, and all three were built for an economy that no longer exists.
Long form. A condensed version appears in this week's View from the Piedmont.
Download the full reportPDF, 18 pages, with the chart, the state detail, the policy section and the methodological appendix.
This edition takes up a question raised by Chair Warsh's first Jackson Hole keynote, delivered August 28. We have no quarrel with his framework but a serious one with his instrumentation. The companion piece in this week's View from the Piedmont deals with the inflation half of the speech; this one deals with employment. A condensed version runs in the weekly; this is the full argument, with the state-level detail, the employer-side incentive, the policy section and the methodological appendix.
Here is the passage this essay is about.
"On the employment side of the Fed's dual mandate, our country is doing well. Labor markets are quite stable. The jobless rate, at 4.1 percent, remains low by historical standards and has not changed much for a couple of years. Unemployment claims, on a four-week average—an empirically robust real-time indicator—are near their lowest level in decades."
"In general, though, people who want to work, by and large, are holding or finding jobs… as of now, I believe the labor markets are consistent with full employment."
Three things carry the weight: the unemployment rate, the four-week average of initial claims, and an inference about job-finding. They are the three most-quoted labor indicators in the country and there is nothing eccentric about relying on them. They also share a single structural blind spot, and it has been widening for at least twenty-five years.
We are not arguing that the labor market is secretly weak. We do not know that, and neither does anyone else, which is the point. We are arguing that the Federal Reserve has just declared one half of its mandate satisfied using instruments that cannot see a large and growing share of American work — and that the Chairman's own second principle, that supply cannot be directly observed and must be inferred, applies more to the labor market than he implied.
PART ONE — THE CLAIMS SERIES MEASURES A SHRINKING UNIVERSE
Independent contractors cannot file a claim. This is not an oversight; it is the design.
Regular state unemployment insurance covers employees in covered employment. Independent contractors, the unincorporated self-employed and app-based platform workers classified as contractors are categorically outside it, in every state. The Minneapolis Fed's own explainer this February put it plainly: gig workers and independent contractors "generally don't qualify."
The reason is structural rather than political, and it is worth understanding because it means the exclusion will not be legislated away casually. Unemployment insurance was created by the Social Security Act of 1935 around a specific employment relationship: a wage earner, on one employer's payroll, in industry or commerce, separated involuntarily from that employer. The financing is experience-rated — employers whose former workers claim more, pay more — which requires an identifiable employer to charge. There is no employer to experience-rate for an independent contractor. Coverage was broadened in 1954, again in 1970, and in 1976 to state and local government and nonprofits. The self-employed have been outside it for ninety-one years and are outside it today.
And the financing mechanism creates a standing incentive to shrink the covered universe
This deserves more attention than it gets, because it explains why the covered share erodes rather than merely drifting.
Experience rating means an employer's unemployment insurance tax rate rises with the claims its former workers file. The intended effect is to make firms internalize the social cost of layoffs. The unintended effect is to put a price on the employee classification itself. A firm that engages the same labor as independent contractors pays no unemployment insurance tax, generates no claims, and carries no experience rating at all.
We would not overstate this. Classification is driven by many things — payroll taxes, workers' compensation, benefits, wage-and-hour exposure, and genuine differences in how work is organized. Unemployment insurance is one line in that calculation and not the largest. But it is the line that determines whether the worker appears in the claims series, and it is the only one that runs in a single direction. No firm has ever reclassified a contractor as an employee in order to raise its unemployment insurance experience rating.
The legal tests that police this are stricter for unemployment insurance than for most other purposes, which is the system defending itself. Most states apply some version of the ABC test for unemployment insurance eligibility — a worker is presumed an employee unless the hiring entity proves all three of: freedom from control in fact and under contract; that the work is outside the usual course of the hiring entity's business; and that the worker is customarily engaged in an independently established trade of the same nature. The middle prong is the one platforms lose on in litigation, and it is the one they have spent most heavily to legislate around, most visibly through California's Proposition 22 in 2020.
So the trend has a motor. The measurement problem is not a passive artifact of changing tastes in how people want to work. There is a tax wedge pushing in one direction, a litigated boundary that moves when enough money is spent on it, and a statistical system anchored to whichever side of that boundary the work lands on.
The recipiency rate is the number nobody quotes, and it has been falling for seventy years
The share of unemployed Americans actually receiving unemployment benefits was roughly 50% in the 1950s, about 40% in the 1960s and 1970s, roughly 30% by 1984, and 28% in 2025. The state range in 2025 ran from 8% in Florida to 52% in Minnesota.
The ratio that makes it concrete: the insured unemployment rate divided by the unemployment rate was about 0.70 in 1971. On Friday it was 1.2 divided by 4.1, or 0.29.
Or in this month's arithmetic: continuing claims of 1,778,000 against 6,916,000 unemployed Americans is 25.7%. Roughly three of every four unemployed people in this country do not appear in the continuing claims count.
Some of that erosion is deliberate state policy rather than structural change, and we should say so. Minneapolis Fed work published this March finds overall eligibility fell 5.4% between 2000 and 2024, and that had states held their 2000-era maximum benefit durations the decline would have been 2.8% — so roughly half the erosion is a policy choice. More than a dozen states cut maximum duration; Florida and North Carolina cut to 12 weeks from the 26-week standard. Separate decomposition work suggests about 57% of the unemployed are eligible and only about 61% of the eligible actually claim.
But the direction is not in dispute and neither is the destination. A series that captured half of unemployment in the 1950s captures a quarter of it now. Calling it "an empirically robust real-time indicator" is defensible about its statistical properties and misleading about its coverage. It is a robust real-time measure of separations from unemployment-insurance-covered employee jobs. That is a narrower object than it was, and it is narrowing.
The pandemic ran the experiment for us
Pandemic Unemployment Assistance existed for exactly one reason: the population excluded from regular unemployment insurance was large enough to matter. Its statutory eligibility condition was ineligibility for regular UI. So its claimant counts are a direct measurement of the hole.
Some 15.5 million individuals received at least one week of PUA between March 2020 and its expiration in September 2021, against 30.6 million who received at least one week of regular state benefits. At its peak PUA accounted for something on the order of a third to 40% of all unemployment claims. Of the claimants whose eligibility was verified, 41% were self-employed in 2020 and 49% in 2021.
We would use those figures directionally and not as point estimates, and we would rather say so than be corrected on it. PUA claim counts were inflated by fraud and by states reporting retroactive backweeks as current claims; analysts documented a persistent gap of five to six million between reported continued claims and plausible claimant counts. The 15.5 million individuals figure, built from state administrative counts of persons rather than weekly claims, is the more robust number.
The conclusion survives the caveats. When the federal government briefly opened the claims system to people who normally cannot use it, something on the order of fifteen million Americans walked through the door. Those people did not stop existing on September 6, 2021. They stopped being counted.
PART TWO — THE UNEMPLOYMENT RATE HAS THE OPPOSITE PROBLEM
First the yardstick, then the reading: 4.1% is measured against an estimate, not a standard
A level means nothing without a benchmark, and the benchmark here is not observed. The rate at which the labor market is judged to be at full employment is inferred, revised, and disputed. That is the Chairman's own second principle — supply cannot be seen directly and must be inferred — applied to the other half of his own sentence.
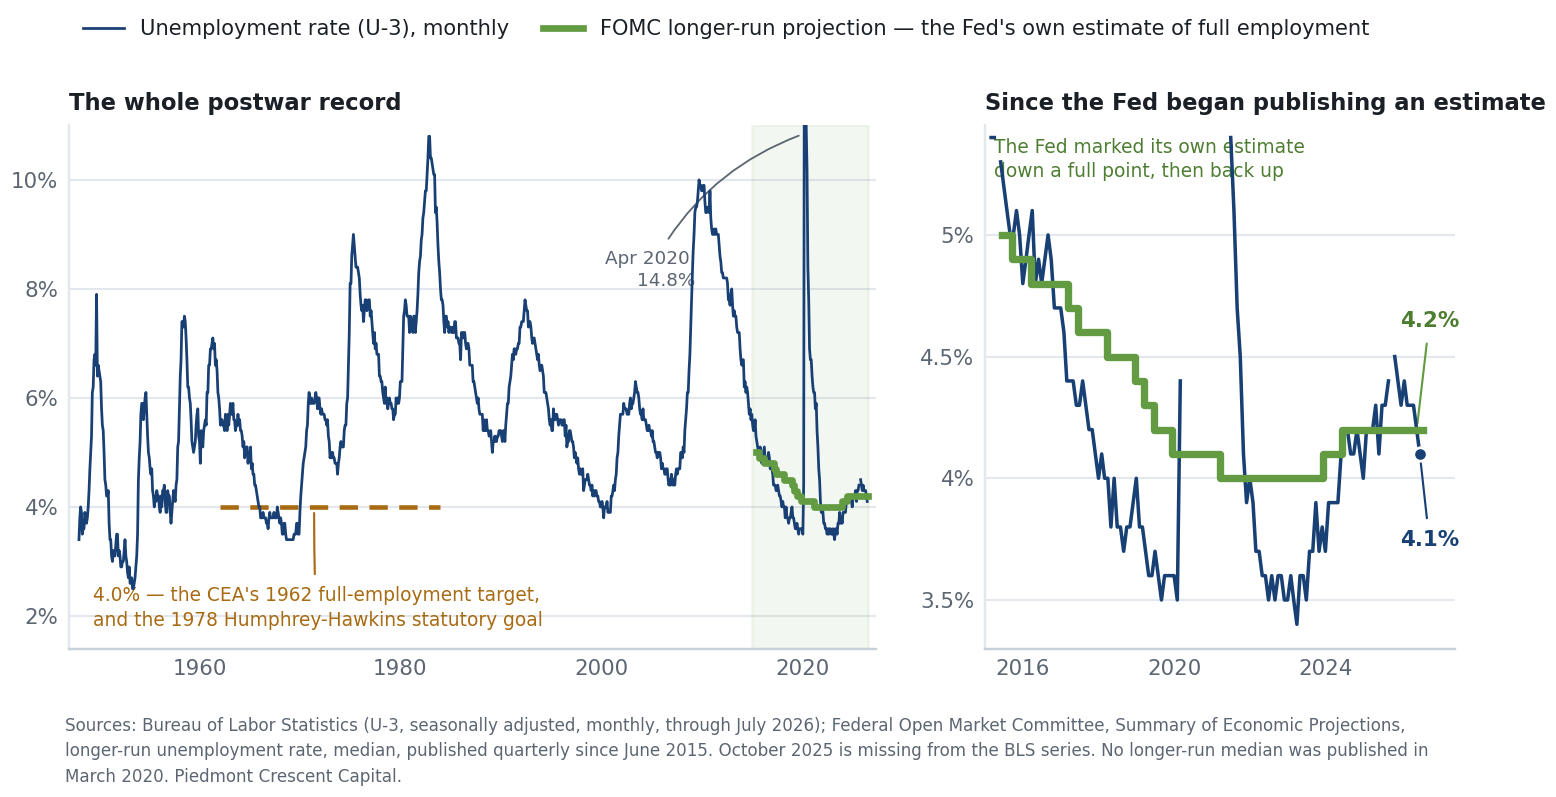
The historical standard sat below today's rate, not above it. From 1946 to 1956 the Council of Economic Advisers treated 3% as the marker of full employment. In 1962 the Council raised it, describing 4% as a reasonable and prudent target for stabilization policy. Sixteen years later Congress put a number in statute: the Full Employment and Balanced Growth Act of 1978 set an interim five-year goal of 3% unemployment for workers twenty and over and 4% for workers sixteen and over. On the standard the country legislated, 4.1% is not full employment. It is a tenth of a point worse than a target Congress set for 1983 and never reached.
We would not lean on that too hard. Those were political commitments rather than estimates of an equilibrium, they were written before the inflation of the 1970s discredited the idea that any unemployment rate could be targeted directly, and the labor force they described was younger, less educated and more heavily male than today's. But they are the source of the intuition that 4% is what full employment looks like, and that intuition is doing quiet work in a lot of current commentary.
Then the estimate moved the other way, hard. By the mid-1980s the Congressional Budget Office put the natural rate near 6%, on a younger workforce with higher turnover and slower job matching. It was still around 5% in the mid-2000s and the CBO's short-run measure rose to 6% by 2012 before falling back. For roughly thirty years, a 4.1% print would have been read not as full employment but as well through it — as the kind of overheating that precedes an inflation problem. The same number has meant three different things.
The Federal Reserve's own estimate has moved a full point in eleven years, and it has moved in both directions. The Committee first published a longer-run unemployment projection in June 2015 at 5.0%. It was marked down every year to 4.0% by March 2021, held there through September 2023, then marked back up — to 4.1% in December 2023 and 4.2% in June 2024, where it has stayed. Against that, July's 4.1%.
So the claim that the labor market is consistent with full employment rests on a gap of one tenth of one percentage point between a measured rate and an estimate the Committee has revised twice since the end of 2023, and by a full percentage point since it began publishing one. That is not a criticism of the estimate. Nobody has a better one. It is an observation about how much weight the sentence can carry.
And the dispersion inside the Federal Reserve System is wider than the gap. The FOMC's longer-run median is 4.2%. The Congressional Budget Office projection underlying recent Federal Reserve work on breakeven employment uses 4.4%. San Francisco Fed research published this month puts trend unemployment at 4.8% in 2024, falling from 7.8% in 1976. ⚠ These are not the same statistic and we would not stack them in a table — the San Francisco measure is a slow-moving trend rather than a policy-relevant equilibrium — but they are the range of defensible answers, and it is roughly sixty basis points wide. On one estimate the labor market is very tight. On another it is marginally tight. On a third there is slack. The Chairman's conclusion is not robust to the choice among them, and he did not say which he was using.
The demographic case says the benchmark should still be falling
This is the part we would press, and it cuts against the Committee's most recent revision. The forces that have pulled the trend down for fifty years have not stopped. The workforce is older and better educated, and both shift the composition toward groups that have always had lower unemployment rates. Kansas City Fed work attributes roughly half the decline in the natural rate between 1994 and 2017 to the aging of the labor force alone, the rest to changes in the skills employers demand. San Francisco Fed research projects the trend falling a further four tenths, to about 4.4%, over the next twenty years.
If the trend is still drifting down, the benchmark against which 4.1% is judged should be drifting down with it. A rate that reads as full employment today reads as slack in a decade without a single worker changing behavior. On that logic, today's 4.1% is more plausibly the upper end of the full-employment range than the lower end — which inverts the intuition inherited from 1962 and 1978, when 4% was a ceiling to get under rather than a floor to stay above.
The Committee moved its estimate the other way in 2024, raising it twenty basis points, and has not explained why in any published material we can find. ⚠ We are not asserting the revision was wrong; there are respectable reasons to think post-pandemic matching efficiency deteriorated. We are noting that the direction of the revision runs against the demographic arithmetic, that it happens to be the direction that makes the current rate look like full employment, and that no reasoning has been published alongside it.
One argument that is often merged with this one and should be kept separate
Slower labor force growth is a statement about payrolls, not about the unemployment rate. An aging population and lower net immigration reduce breakeven employment growth — the monthly job gain needed to hold the unemployment rate steady. Kansas City Fed work puts that number at 150,000 a month on the CBO's January 2024 population projection and 126,000 on the January 2025 projection, the revision driven almost entirely by immigration.
That is the argument the Chairman used, and on its own terms he is right: when labor supply barely grows, weak payroll prints are not evidence of weak demand. But it tells you how to read the payroll number. It does not tell you where full employment sits. The two get run together constantly, including in commentary that cites the breakeven figure as though it settled the level question. It does not. The level question is the one in the chart above, and the honest answer is that nobody knows it to within half a percentage point.
One hour of paid work makes you employed
The household survey counts a person as employed if they did any paid work at all in the reference week. A worker driving eight hours a week because full-time work is not available is in the numerator of "people who want to work, by and large, are holding or finding jobs."
The broader measures say something different from the headline, and the divergence is the tell.
| July 2026 | Level | Note |
|---|---|---|
| U-3 unemployment rate | 4.1% | 4.3% a year earlier |
| U-6 | 7.9% | 7.9% a year earlier — unchanged |
| Part-time for economic reasons | 4.8 million | |
| Multiple jobholders | 8,693,000 | |
| Multiple jobholders rate | 5.4% | 5.1% in March, rising every month since |
| Labor force participation rate | 61.4% | −0.7% since January |
| Employment-population ratio | 58.9% | −0.5% since January |
| Prime-age (25–54) participation | 83.4% | −0.5% since May |
| Prime-age (25–54) employment-population | 80.4% | −0.4% since May |
U-3 fell 0.2% over the year while U-6 did not move at all. Participation and the employment-population ratio have both fallen since January while the unemployment rate held. That is the signature of people leaving the count rather than finding work, and it is exactly the configuration in which the unemployment rate is least informative.
Boston Fed researchers made this point formally last year in a paper on assessing maximum employment: the employment-population ratio and the participation rate "become especially valuable during mature business cycles, when employment gains increasingly stem from participation increases rather than unemployment reductions." They retain U-3 as the key cyclical indicator and demonstrate its blind spot in precisely the configuration we are now in. Neither ratio appeared in the keynote.
And the one household series that responds directly to the phenomenon this essay is about — the multiple jobholders rate — has risen in every month since March and was not mentioned. A rising share of people working more than one job is consistent with a hot labor market offering abundant opportunity. It is equally consistent with a household economy in which one job no longer covers the bills. The unemployment rate cannot distinguish between those two readings. Nothing in the Chairman's list can.
PART THREE — HOW BIG IS THE PART WE CANNOT SEE
The official answer is a decade old and the agency has effectively conceded it
The Bureau of Labor Statistics measures this through the Contingent Worker Supplement, which it ran in July 2023 and published in November 2024.
| Sole or main job | July 2023 | Share | May 2017 |
|---|---|---|---|
| Independent contractors | 11.9 million | 7.4% | 6.9% |
| Contingent workers | 6.9 million | 4.3% | 3.8% |
| On-call workers | 2.8 million | 1.7% | 1.7% |
| Temporary help agency workers | 945,000 | 0.6% | 0.9% |
The platform-specific number is where it falls apart. The most recent published official estimate of electronically mediated work is 1.6 million workers, or 1.0% of employment, from May 2017 — and that figure is a manual recode, because the survey questions as fielded "did not work as intended and had a large number of incorrect 'yes' answers."
The July 2023 supplement included new app-based work questions written to replace the failed 2017 items. The Bureau has never published the estimates. The news release states they "are not included," and the technical documentation confirms no estimates have been issued. As of this weekend, the United States has no published official measure of digital platform work more recent than a recoded figure from May 2017.
The Bureau has since conceded the underlying problem, and the concession is more informative than any estimate. A Federal Register notice this February set out a redesigned module: the platform-work questions consolidated into a single section about half of which is new; the reference period extended from the survey week to the prior four weeks; and — decisively — the questions extended to people who are not employed at the time of the survey, in order to capture platform work "that might be of short duration or intermittent." It was fielded in July 2026.
Read what that redesign admits. The prior instrument could not see intermittent platform work, could not see it when it was not someone's main job, and could not see it at all among people the survey classifies as unemployed or out of the labor force. That last category is the one that matters for a full-employment judgment, and the agency responsible for measuring it has just told us its previous instrument could not.
Everything else we have suggests the official number is low
| Source | Estimate | What it counts |
|---|---|---|
| BLS supplement, 2023 | 7.4% | Independent contractors, main job, survey week |
| BLS, 2017 recode | 1.0% | Electronically mediated work |
| IRS tax records, 2016 | 11.8% | Anyone with any 1099 income in a tax year |
| Rockefeller Institute, survey of surveys | 10–36% | Range across the literature |
| McKinsey, 2022 | 36% | Self-identified independent or gig work |
| Upwork, 2026 | 39% | Self-identified freelancing |
Census nonemployer statistics — businesses with no paid employees, at least $1,000 of receipts, filing a federal return — counted roughly 30 million establishments in 2023, up from about 24 million in 2015. Nonemployer establishments in transportation and warehousing rose from 1.5 million to 4.0 million over that span, an increase of 165%.
Internal Revenue Service research found the share of the workforce with any 1099 income rose from 9.9% in 2000 to 11.8% in 2016, with more than half of that growth occurring between 2013 and 2016 — and 86% of the expansion since 2012 coming from platform-mediated participants with no other 1099 earnings.
The nine-fold spread between 4% and 36% is not sloppiness and we would not present it as such. It reflects five orthogonal design choices: main job versus any job; a survey week versus a tax year; structural classification versus self-identification; whether the question is asked only of the employed; and whether there is an income floor. A nurse who drives on weekends is a nurse to the Bureau of Labor Statistics and a gig worker to McKinsey. Both are right about their own question.
The defensible framing is this. The official range runs from 1% for platform-specific work in 2017 to 7.4% for independent contracting as a main job in 2023. The broader range, including supplemental work, runs from roughly 12% verified in tax records to roughly 36% self-identified. Both ends are relevant to a full-employment judgment. Neither is in the unemployment rate, and neither can file a claim.
PART FOUR — THE TWO SURVEYS, AND WHY THE BENCHMARK CANNOT RESCUE THEM
Neither survey measures the object the Chairman described
The establishment survey covers employees on nonfarm payrolls. It excludes proprietors, unpaid family workers, agricultural workers, private household workers, and — the relevant category — the unincorporated self-employed. In July that was 9,735,000 people who are invisible to the payroll count by construction. Add the incorporated self-employed and the total is roughly 16.4 million.
The household survey sees the person but not the arrangement. It counts a multiple jobholder once; the payroll survey counts them once per payroll. In July the household survey put civilian employment at 162,177,000 against nonfarm payrolls of 158,858,000 — but strip out the categories the payroll survey cannot see and the payroll count is roughly 8 million higher than household non-agricultural wage and salary employment, because it is counting jobs and the household survey is counting people.
The two surveys are not measuring the same object, and neither one measures labor demand in a platform economy. The payroll survey misses the workers entirely. The household survey sees the person and files their platform income under whatever they volunteer as their main activity.
And the benchmark revision runs on the same records
This is the part that makes the problem self-reinforcing rather than merely awkward, and Friday made it topical.
The payroll survey's sample frame is built from unemployment insurance tax records, which lag seven to nine months. The birth-death model that bridges the lag is estimated on unemployment insurance data. And the annual benchmark that corrects the whole thing is the Quarterly Census of Employment and Wages — which is itself built from unemployment insurance tax records.
The frame, the model and the correction all run on the same universe, and it is the universe that excludes independent contractors. The Census of Employment and Wages covers 97.2% of employees on nonfarm payrolls, and that figure is quoted constantly. It is a coverage ratio against a denominator that excludes the self-employed by construction. It does not mean 97% of workers. The 9.3 million unincorporated self-employed are in neither the numerator nor the denominator.
On Friday the Bureau published its preliminary benchmark revision for March 2026: −79,000, against a consensus near +138,000. The Street had positioned for the first upward revision since 2022. We would not overclaim the number — at −0.1% it is below the ten-year average absolute revision of 0.2%, it cuts average monthly payroll growth by only about 7,000, and the major forecasting houses expect it to shrink or reverse in the final estimate. What it does illustrate is the recursion. A benchmark built from the payroll universe can correct errors inside that universe. It cannot tell you anything about the workers who were never in it.
PART FIVE — THE MECHANISM THAT MAKES THIS CYCLICAL RATHER THAN MERELY UNTIDY
Everything to this point is a measurement complaint. This section is the reason it matters for policy.
If losing a payroll job pushes people into platform work, then the indicators the Chairman relied on improve during exactly the episodes when labor demand deteriorates. That is not speculation. It has been measured three separate ways.
First, unemployment claiming. A study published this year in the Journal of Financial Economics, using roughly a quarter of all United States job separations between 2011 and 2017 and identifying off Uber's vehicle-age rule and staggered city entry, finds that after a job loss, workers with platform access carried $689 less total debt, were 4.9% less likely to be delinquent, and were 3.3% less likely to collect unemployment insurance benefits. The effects were strongest in states with lower benefits. One of the authors put it in a sentence: "there are some people for whom unemployment insurance is not enough, but Uber is."
Second, participation and duration. Treasury and Internal Revenue Service research finds that among individuals with high propensity and maximum platform availability, gig participation rose 10.5% in the year of job loss and 19.8% two to four years later. Income fell about $3,000 less during the unemployment spell. But those workers were 5% less likely to regain wage employment, and prime-age household income was roughly $4,000 lower in years two through four. The estimated compensation forgone for flexibility is 39% of earnings.
Third, the classification error itself. Boston Fed work on informal work participation found that 16% of informal-work participants are classified as not in the labor force despite averaging 22 hours and about $340 a month, and that participation was highest — 49.6% — among workers already counted as part-time for economic reasons. Their estimate of the aggregate effect: if all informal work were counted as employment, the participation rate would be 2.0% higher, the employment-population ratio 2.5% higher, and the unemployment rate 1.0% lower. Follow-on work through 2022 put the range at 2.4% to 5.5% on the employment rate.
Put the three together and the shape is unambiguous. A worker who loses a payroll job and starts driving is less likely to file a claim, may not be counted as unemployed, is less likely to return to wage employment, and earns materially less for years afterward. Every one of those effects pushes the Chairman's three indicators toward "full employment" without a single unit of improvement in labor demand.
And the margin claims measure is not the margin that is moving
There is a second, better-established problem with resting on claims, and it has nothing to do with gig work.
St. Louis Fed research established more than a decade ago that 75% to 80% of changes in unemployment come from the job-finding rate rather than from separations. Claims measure separations. The series is therefore, in that author's words, "inherently a weak predictor of changes in unemployment."
Chicago Fed work published this April confirms the channel with current data: nearly 80% of the recent increase in unemployment is attributable to reduced job-finding rather than elevated separations, in what everyone now calls a low-hire, low-fire market. The June JOLTS report is the same fact from another angle — a quits rate of 2.0% and a hires rate of 3.4%, with 0.96 unemployed people per opening.
A further St. Louis Fed finding, from January of last year, deserves to be quoted at policymakers: since 1984, claims have become "more informative for gauging labor market conditions during expansionary rather than recessionary periods." The indicator is most reliable exactly when it matters least.
So the case against the claims series is doubled. It covers a shrinking share of the workforce, and within that share it measures the margin that is not currently moving.
PART SIX — THE CAROLINAS AND FLORIDA HAVE THE SHARPEST VERSION OF THIS
The national recipiency rate is 28%. It is a national average of a distribution that runs from 8% to 52%, and the low end of that distribution is in our coverage area.
Florida's recipiency rate is 8% — the lowest in the country. In 2019 the same table put North Carolina at 9.5%, the lowest in the nation that year. Minnesota was 52% in 2025 and 59.0% in 2019.
Both Carolina-adjacent outliers are policy, not economics. More than a dozen states cut maximum benefit duration after 2000. Florida and North Carolina cut furthest, to 12 weeks against the 26-week national standard, and Minneapolis Fed work published this March estimates the duration cuts drove eligibility down by as much as 17% in those states. Nationally, roughly half the 2000-to-2024 erosion in eligibility is attributable to state benefit-duration choices rather than to changes in the structure of work.
Put the two mechanisms together and the Southeast has the compound version of the problem.
First, the denominator. The region is the fastest-growing labor market in the country and the destination for most of the domestic migration of the past decade. Its claims series is measuring a shrinking share of a rapidly growing workforce.
Second, the industry mix. Nonemployer establishments in transportation and warehousing rose 165% nationally between 2015 and 2023, from 1.5 million to 4.0 million. The Southeast is the country's fastest-growing distribution corridor; Savannah moved 503,739 twenty-foot equivalent units in July alone, up 5.7% over the year. The occupations expanding fastest in the region are disproportionately the ones that classify as independent contract work — last-mile delivery, owner-operator trucking, warehouse-adjacent logistics, construction trades and residential services.
Third, the benefit level. The Fos, Hamdi, Kalda and Nickerson finding is that platform access reduces unemployment claiming after job loss, and that the effect is strongest in states with lower benefits. Florida and North Carolina are low-benefit, short-duration states. The substitution the study identifies should be strongest precisely where the claims series already captures the least.
We do not have state-level estimates of that interaction. What we can say is that the three mechanisms are aligned rather than offsetting, and that they are aligned in the region we cover.
The practical consequence for anyone reading Southeast labor data. The state and metro payroll benchmark revisions published Friday were large and regionally uneven, and Atlanta and Memphis were among the largest downward revisions while Richmond was revised up more than 1%. Those revisions come from the Quarterly Census of Employment and Wages, which is built from unemployment insurance tax records — so they correct the covered universe and are silent about the rest of it. In a region where the covered share is lower than the national average and falling faster, a benchmark that corrects only the covered part is doing less work than it appears to.
We will take this up properly in the Southeast Economic Weekly, where the state detail belongs. For a national audience the point is narrower: the state with the lowest recipiency rate in the country is the fourth-largest state economy, and the state that had the lowest rate before it cut benefits further is the one we live in.
PART SEVEN — WHAT PORTABLE BENEFITS WOULD AND WOULD NOT FIX
There is an active legislative response to the coverage gap, and it is worth understanding why none of it touches the measurement problem.
| Jurisdiction | Action | What it covers |
|---|---|---|
| Florida | HB 1067, February 2025 | Voluntary portable benefit accounts — health and retirement |
| Tennessee | Voluntary Portable Benefit Plan Act, April 2025 | Health insurance and retirement; roughly 1.5 million contractors |
| Alabama | Portable Benefit and Incentives Law, 2025 | Portable accounts, with a tax deduction for contributing hiring entities |
| Maryland | DoorDash pilot, April–June 2025 | Health, dental, vision, retirement, emergency funds and paid time off |
| Federal | Modern Worker Security Act, February 2025 | Safe harbor letting firms contribute without triggering reclassification |
Every enacted program is voluntary, funded at the hiring entity's discretion, and confined to health and retirement. California's Proposition 22 has the same shape — healthcare stipends and accident insurance. Not one of them includes unemployment insurance.
That is not an oversight either. Unemployment insurance is the one benefit whose financing requires a compulsory, experience-rated levy on an identifiable employer. A voluntary portable account can hold a health premium. It cannot hold a claim against a firm that has, by construction, denied being the employer. The Modern Worker Security Act's central provision is a safe harbor from reclassification, which is the opposite of bringing the work inside the covered universe.
So the direction of travel is toward giving independent workers benefits while keeping them outside the statistical system. From a worker's standpoint that may well be an improvement. From a measurement standpoint it entrenches the problem, because it removes the pressure that reclassification would otherwise create while leaving the claims series exactly as blind as it was.
There is one reform that would fix the measurement without touching the classification fight, and it costs almost nothing. Publish the coverage statistic. The Bureau of Labor Statistics could report, quarterly, the share of employed Americans in unemployment-insurance-covered employment — covered employment over total employment including the self-employed — alongside the recipiency rate. Neither series requires new collection. Both are computable from data the government already holds. Until they are published, every statement that the labor market is at full employment rests on a coverage assumption that has never been quantified.
PART EIGHT — WHAT WE WOULD USE INSTEAD
We would not abolish anything. We would demote the claims series from a headline read on labor market health to what it actually is — a high-frequency read on separations from covered employment — and we would put four things alongside the unemployment rate.
1. The employment-population ratio and the participation rate, prime-age. Boston Fed research makes the case and the current readings make the point: both have fallen since January while the unemployment rate held.
2. U-6, involuntary part-time work, and the multiple jobholders rate. These are the household series that respond when work fragments rather than disappears. U-6 has not improved in a year and the multiple jobholders rate has risen every month since March.
3. The job-finding rate directly, rather than separations. The Chicago Fed publishes twice-monthly labor market indicators combining thirteen streams — claims, insured unemployment, JOLTS hires and layoffs, two confidence differentials, search data, two job-postings series, weekly private surveys and payroll-processor data — and reports a 36% improvement over consensus and 52% over a random walk in forecasting the unemployment rate. It exists, it is free, and it is produced by the System.
4. Aggregate hours. When employment fragments into shorter and more numerous engagements, headcount and hours diverge. Hours are the honest quantity.
We would treat private payroll and postings data as complements rather than substitutes. Richmond Fed work this February assessed the private sources during last year's shutdown and found the divergence severe — for September 2025 one processor reported −32,000 jobs while a profile-based estimator reported +60,000. The Chicago Fed's own caveat is the right posture: alternative data are drawn from convenience samples, and representativeness concerns "can dominate statistical precision even in very large datasets." Their value comes from systematic combination anchored to official statistics.
And the missing statistic, restated because it is the cheapest fix available. We went looking for the share of American workers eligible to file an unemployment claim — coverage measured against all employment, including the self-employed. No federal agency publishes it. The Census of Employment and Wages expresses coverage against a payroll denominator that excludes the self-employed by construction, which is why the 97.2% figure circulates and misleads. The statistic that would answer "what fraction of working Americans can use this system" is not produced by anyone, and it is computable from data the government already holds.
PART NINE — THE MEASUREMENT QUESTION IS NOW BOTH HALVES OF THE MANDATE
Everything above concerns the employment side. It would be a narrower essay if the price side were secure. It is not.
On September 30 the Bureau of Economic Analysis restates the index the Chairman named as his target. As part of the annual national accounts update, the Bureau is changing the deflation methodology for three PCE components: portfolio management and investment advice services, computer software and accessories, and legal services. The changes apply retroactively to 2021, so five years of inflation history are rewritten in a single release.
The estimated effect on core PCE runs from about five basis points to about twenty, depending on whose work you read. Goldman Sachs marked its December 2026 core PCE forecast down from 3.2% to 3.0% on the change alone and left its core CPI forecast untouched. One specialist shop that reconstructed the portfolio-management series puts the effect at roughly five basis points and no more than ten. ⚠ The dispersion is the point rather than the level, and we would not print a single number for it.
Two things follow, and the second is the one worth carrying.
First, the component being repaired is the one that has been doing the work. The July core print was driven materially by portfolio management and investment advice fees — an imputed price no household pays, which rises when equity markets rise because the fee is levied on assets under management. That is precisely the distortion the Bureau is fixing, by deriving the quantity of services consumed rather than extrapolating from the value of the assets. The measure has been reading the stock market and calling it inflation, and it is about to stop.
Second, the restatement lands two weeks after the meeting it would have informed. The Committee votes September 15 and 16. The revised history publishes September 30. A Committee that hikes in September on a 3.3% core reading may find, a fortnight later, that the series it hiked against had been running a tenth or two lower all along. ⚠ We are not forecasting that it will change the decision, and the revisions are routine and long-scheduled rather than convenient. We are observing that the gauge is not fixed, that everyone has known it was not fixed since June, and that nobody has said out loud what a policy standard means when the standard is restated after the vote.
Which brings this back to the task forces
Put the two halves together and the shape is uncomfortable. The employment mandate was declared satisfied on Friday using three indicators that cannot see a growing share of American work, judged against an equilibrium estimate that has moved a full percentage point and on which the Federal Reserve System's own research spans sixty basis points. The price-stability mandate is anchored to an index whose construction changes in four weeks. Neither half of the dual mandate currently rests on a measure that a careful outsider could reproduce and defend.
The Chairman has already commissioned the people who would have to settle this. Five task forces were named on July 9. Three of them go directly at the question: Data — Raj Chetty, Doug McMillon and Kevin Murphy; Productivity and Jobs — Marc Andreessen, Charles Jones and Asha Sharma; and Inflation Frameworks — Greg Mankiw, Thomas Sargent and William White. In his July testimony the Chairman framed the first as asking how policymakers can be sure they are receiving accurate, relevant, contemporaneous and actionable data, and the third as asking whether the Fed's models give an empirically robust view of prices.
Those are the right questions. They are, almost word for word, the questions this essay is asking.
And on Friday he ruled them out of the current decision. The task forces were mentioned once, in the artificial intelligence section, with the qualification that their recommendations "will come later and have no bearing on decisions we make in the current policy conjuncture." We understand the institutional reason for saying that — a chairman cannot have every meeting relitigated by a review in progress, and the alternative is paralysis.
But it cannot be right that the measurement of both mandate halves is under active review by five outside panels, and that the review has no bearing on a decision that turns on a tenth of a point in each of them. If the instruments are good enough to declare the employment mandate satisfied in August, they are good enough not to need a task force. If they need a task force, the declaration should have been held more loosely. That is not a call for delay. It is a call for the confidence in the conclusion to match the confidence in the instrument, and on Friday it did not.
WHERE THIS ARGUMENT IS WEAKEST
We would rather print the objections rather than wait for the endless stream of notes to come in.
First, we cannot show that the labor market is weak, and we have not tried. Everything here establishes that the standard indicators have a widening blind spot. It does not establish which way the missing information cuts. It is entirely possible that Warsh is right about the level and wrong only about the instruments. Initial claims fell 4,000 in the latest week and continuing claims fell 18,000, which reverses a grind higher we had been flagging.
Second, the supply-side explanation is strong and the prevailing house view holds it. The consensus reading is of a balanced labor market — demand sluggish, but labor supply growth weaker still, with break-even job growth having noticeably dropped — and several published forecasts have the unemployment rate falling to 3.9% by the fourth quarter. More telling, houses that cut their payroll forecasts this month cut their unemployment forecasts in the same revision, which is an analyst quietly re-attributing weak hiring from demand to supply. The immigration evidence supports them: a worldwide pause on immigrant visa appointments through mid-September, H-1B issuance down 30%, student visas down 35% and green cards down more than 20% since early 2025. Low payroll growth against a falling break-even is not slack, and we accept that.
Third, the timing of the academic evidence. The strongest studies use data from 2011–2017 and 2015–2022. They establish the mechanism. They do not establish its current magnitude, and platform work has both grown and matured since.
Fourth, gig work is genuinely voluntary for many of the people doing it, most of whom already hold traditional jobs, roughly one in nine of whom report it as primary income, and who typically earn $300 to $400 a month from it. A supplemental income stream is not a hidden unemployment queue and we would not describe it as one.
None of that rescues the instruments. Whether the missing work represents distress or flexibility, it is missing, and a central bank that has declared one half of its mandate satisfied should want to know which.
WHAT WOULD CHANGE OUR MIND
We would adjust our thinking for any of the following.
1.The Bureau publishes app-based work estimates from the July 2026 supplement showing platform work at or below 2% of employment on the new four-week reference period, including among the non-employed. That would mean the phenomenon is smaller than the private estimates suggest and the official instruments are adequate. This is the decisive test and the data has already been collected.
2.U-6 falls back toward its pre-2020 relationship with U-3 while the multiple jobholders rate stops rising. That would mean work is not fragmenting and the headline is not flattering.
3.The prime-age employment-population ratio recovers its January level while participation holds. That would mean the January-to-July decline was noise rather than exit.
4.Research using post-2022 data fails to replicate the finding that platform access reduces unemployment claiming after job loss. The mechanism is the load-bearing element and it deserves a current test.
5.The recipiency rate stabilizes or rises. It has fallen for seventy years, but roughly half of the 2000–2024 erosion was state benefit-duration policy, which is reversible.
CONCLUSION
The Chairman's framework is better than his instruments, and the gap between them is the argument.
He told us on Friday that supply cannot be directly observed and must be inferred, and that a central bank should be humble about what it can know. He then used that principle to explain away weak payroll growth on the employment side of the mandate and set it aside entirely on the price side. We took up the second asymmetry in this week's View from the Piedmont. This is the first one, and it runs deeper, because the labor market is where the measurement problem is genuinely structural.
Unemployment insurance was designed in 1935 for a wage earner on one employer's payroll. It covered half the unemployed in the 1950s and covers 28% now. The unemployment rate counts an hour of paid work as employment. The payroll survey cannot see nine and a half million unincorporated self-employed Americans, the benchmark that corrects it runs on the same tax records, and the only official measure of platform work in existence is a hand-recoded figure from May 2017 that the agency has since redesigned out of existence.
Meanwhile the Census counts 30 million businesses with no employees, up 6 million in eight years, with non-employer establishments in transportation and warehousing up 165%.
Something significant has happened to the structure of American work, and the three indicators the Federal Reserve used on Friday to declare the employment mandate satisfied were all built before it. They are not wrong. They are narrow, and they are getting narrower, and the direction of the narrowing is the direction that flatters the reading.
We would not have the Committee conclude the opposite. We would have it hold the conclusion more loosely. A Chairman who has just retired forward guidance on the grounds that the Federal Reserve should be humble about what it knows, and who has staked his price-stability case on a diffusion measure of his own construction, is entitled to ask harder questions of the employment data than the ones the headline answers.
And there is a practical version of this for anyone setting policy in the next six weeks. The September decision now rests on the September 4 employment report and the September 11 consumer price index, because the Chairman has removed everything else. The payroll report will be read against a benchmark that was just revised down, using a survey that cannot see a tenth of the workforce, in a month when the household and establishment surveys are already 3.3 million apart. We would put less weight on the headline than the market is about to, and more on hours, participation and the household detail underneath it.
A View from the Piedmont and the Piedmont Perspective are published by Piedmont Crescent Capital for informational purposes only and do not constitute investment, legal, or tax advice. Views expressed are those of the author as of the date of publication and are subject to change.
SOURCE NOTES
Speech. Kevin M. Warsh, "In Our Time," keynote remarks, Federal Reserve Bank of Kansas City Economic Policy Symposium, Jackson Hole, Wyoming, August 28, 2026.
Official statistics. BLS Employment Situation, July 2026 (released August 7, 2026), including Table A-7 class of worker and the U-1 through U-6 series · BLS Contingent Worker Supplement, July 2023 (released November 8, 2024) and May 2017 · BLS electronically mediated work recode, May 2017 · Federal Register notice on the redesigned platform-work module, February 10, 2026, comment period closing April 13, 2026, fielded July 2026 · BLS Preliminary Benchmark Revision, March 2026, released August 28, 2026 · BLS Quarterly Census of Employment and Wages, 2024 coverage documentation · BLS JOLTS, June 2026 (released August 4, 2026) · Department of Labor Unemployment Insurance Weekly Claims, week ending August 22, 2026 (released August 27, 2026) · Department of Labor UI Chartbook · Census Bureau Nonemployer Statistics, 2023 (released May 15, 2025) and 2015 · BLS unemployment rate (U-3), seasonally adjusted monthly series, January 1948 through July 2026 · Federal Open Market Committee, Summary of Economic Projections, longer-run unemployment rate, median, June 2015 through June 2026.
Research. Fos, Hamdi, Kalda and Nickerson, "Gig Labor: Trading Safety Nets for Steering Wheels," Journal of Financial Economics, 2025 · Jackson, "Availability of the Gig Economy and Long Run Labor Supply Effects for the Unemployed," Internal Revenue Service and Treasury, November 2022 · Bracha and Burke, Federal Reserve Bank of Boston Working Paper 16-29, December 2016, and Burke's Survey of Informal Work Participation, 2015–2022 · Foote, Fujita, Michaud and Montes, "Assessing Maximum Employment," Federal Reserve Bank of Boston Working Paper 25-9, 2025 · Wiczer, Federal Reserve Bank of St. Louis, September 2014 · McCracken and Trần, Federal Reserve Bank of St. Louis, January 14, 2025 · Brave, Henken, Karger and Safi, Federal Reserve Bank of Chicago Working Paper 2026-09, April 2026 · Macaluso, Federal Reserve Bank of Richmond Economic Brief 26-04, February 2026 · Cramer, Narayan and Nunn, Federal Reserve Bank of Minneapolis, March 19, 2026, and the Minneapolis Fed recipiency explainer, February 24, 2026 · Collins, Garin, Jackson, Koustas and Payne, "Is Gig Work Replacing Traditional Employment?", March 2019 · JPMorgan Chase Institute, "The Online Platform Economy through the Pandemic" · The Century Foundation and JPMorgan Chase Institute on Pandemic Unemployment Assistance · Bipartisan Policy Center on recipiency · Rockefeller Institute of Government survey of gig workforce estimates · McKinsey American Opportunity Survey, 2022 · Upwork Future Workforce Index, 2026 · Yale Law Journal Forum on gig worker unemployment insurance eligibility, January 2022.
On the full-employment benchmark in Part Two. Council of Economic Advisers, Economic Report of the President, 1962, on the 4% target, and Duboff (1977) on the Council's earlier 3% marker · Full Employment and Balanced Growth Act of 1978, interim goals of 3% for workers 20 and over and 4% for workers 16 and over · Congressional Budget Office, "The Natural Rate of Unemployment," Working Paper 2007-06, and CBO long-term budget outlook appendices on the compositional markdown of the trend · Tüzemen, "Job Polarization and the Natural Rate of Unemployment," Federal Reserve Bank of Kansas City Working Paper 18-03, and the associated Economic Bulletin · Aaronson, Hu, Seifoddini and Sullivan, "Changing Labor Force Composition and the Natural Rate of Unemployment," Chicago Fed Letter 338, 2015 · Federal Reserve Bank of San Francisco, "What's Behind the Declining Trend Unemployment Rate?", Economic Letter, August 2026 · Federal Reserve Bank of Kansas City, "Declining Immigration and an Aging Population Are Reducing Breakeven Employment Growth," Economic Bulletin, February 2026.
On Part Nine. Board of Governors press release naming the five task forces and their members, July 9, 2026 · Chairman Warsh, testimony on the semiannual Monetary Policy Report, July 14–15, 2026, on the charge to the data and inflation-frameworks task forces · Warsh, "In Our Time," August 28, 2026, on the task forces having no bearing on the current policy conjuncture · Bureau of Economic Analysis announcement of methodological changes to the deflation of portfolio management and investment advice services, computer software and accessories, and legal services, to be incorporated in the annual update of September 30, 2026 and applied retroactively to 2021 · Goldman Sachs and independent estimates of the effect on measured core PCE.
State and policy material in Parts Six and Seven. Minneapolis Fed on state benefit-duration cuts and eligibility, March 19, 2026 · Bipartisan Policy Center and Minneapolis Fed state recipiency ranges, 2019 and 2025 · Florida HB 1067, February 2025 · Tennessee Voluntary Portable Benefit Plan Act, April 2025 · Alabama Portable Benefit and Incentives Law, 2025 · the Maryland DoorDash portable benefits pilot, April to June 2025 · the Modern Worker Security Act, February 2025 · California Proposition 22, 2020 · BLS state and metropolitan area preliminary benchmark revisions, August 28, 2026 · Georgia Ports Authority July 2026 volumes.
Two cautions carried in the text rather than in a footnote. Pandemic Unemployment Assistance claim counts were inflated by fraud and by retroactive backweek reporting; we use the 15.5 million individuals figure and treat the weekly claim shares as directional. And the core academic evidence on the counter-cyclicality of platform work uses data through 2017 and 2022; it establishes the mechanism, not its present magnitude.
METHODOLOGICAL APPENDIX
This appendix supports the ratios computed in the text. Every figure below is either published or is arithmetic on published figures, and we identify which.
1. The recipiency ratio. We report three related quantities and they are not interchangeable.
| Measure | Construction | Latest |
|---|---|---|
| Recipiency rate (administrative) | Regular-program insured unemployed ÷ total unemployed, Department of Labor basis | 28% (2025) |
| Continuing claims ÷ unemployed | 1,778,000 (week ended August 15) ÷ 6,916,000 (July) | 25.7% (our calculation) |
| Insured unemployment rate ÷ U-3 | 1.2 ÷ 4.1 | 0.29 (our calculation) |
The second and third are our own arithmetic on published series and are offered as a current-month check on the first, which is annual. They are not the same statistic and should not be quoted as though they were. The administrative recipiency rate uses a twelve-month average covered-employment denominator and a different reference period from the household survey; a difference of two or three points between our ratio and the official rate is construction, not news.
2. The historical recipiency series. Roughly 50% in the 1950s, roughly 40% in the 1960s and 1970s, roughly 30% by 1984, 28% in 2019, 29% in 2023, 28% in 2025, from the Department of Labor's unemployment insurance chartbook and Bipartisan Policy Center and Minneapolis Fed compilations. One source puts the 1950s figure nearer 55%. We use "roughly 50%" and would not defend a decimal.
3. The decomposition of the 28%. St. Louis Fed work decomposes recipiency into eligibility and take-up: roughly 57% of the unemployed are eligible and roughly 61% of the eligible claim. Note that 0.57 × 0.61 is about 35%, above the administrative 28%. The gap reflects differing definitions of the eligible population and differing reference periods. We report both and do not reconcile them, because they cannot be reconciled without microdata we do not have.
4. The Boston Fed adjustment. The estimate that counting all informal work as employment would raise the participation rate 2.0%, the employment-population ratio 2.5% and lower the unemployment rate 1.0% comes from the 2015 Survey of Informal Work Participation and depends on an inclusive threshold. At a 20-hours-a-month threshold the same source gives 0.7% and 0.8%. We cite the inclusive figures in the text and disclose the threshold sensitivity here. The follow-on range of 2.4% to 5.5% on the employment rate, through 2022, is a different construction again and is the widest claim in this essay.
5. The two-survey gap. July 2026: household civilian employment 162,177,000; nonfarm payrolls 158,858,000; difference 3,319,000. Household non-agricultural wage and salary employment 150,852,000, against which nonfarm payrolls are 8,006,000 higher. The two gaps have opposite signs and different causes — the first is dominated by the self-employed and agricultural workers the payroll survey cannot see, the second by second and third jobs the payroll survey counts separately. Neither difference is an error and neither is a measure of anything by itself.
6. Gig workforce estimates. The nine-fold spread between 4% and 36% is definitional, and we set out the five design choices in the text. We report the range rather than a point estimate and we would treat any single number offered without its definition as unusable.
7. The chart in Part Two. The unemployment rate is the published monthly seasonally adjusted U-3 series; October 2025 is absent from the official series and is left as a gap rather than interpolated. The step line is the median longer-run projection from the Summary of Economic Projections, plotted at each release date and held flat until the next; the FOMC published no longer-run median in March 2020, and the series does not exist before June 2015, which is why the panel on the right begins there. The 1962 and 1978 reference line is drawn only across the years in which those benchmarks were the operative standard, and it is a policy target rather than an estimate of an equilibrium. The three current estimates quoted in the text — 4.2%, 4.4% and 4.8% — are constructed differently and are reported as a range of defensible answers rather than as a distribution.
8. What we did not do. We have not estimated the current size of the measurement gap, we have not attempted a corrected unemployment rate, and we have not modelled the state-level interaction described in Part Six. Each is doable and none is done here. The July 2026 Contingent Worker Supplement, when the Bureau publishes it, is the input that would make the first of those worth attempting.
Download the full reportPDF, 18 pages.