
Building Fewer Factories, Buying More Equipment
Construction spending slipped 0.5 percent in July and is 3.8 percent below a year ago, with factory construction down 22 percent so far this year and a third below its 2024 peak, even as orders for the equipment that goes inside those buildings reached a high.
Early Signals
- The headline decline is not statistically significant. Construction spending fell 0.5 percent in July to a $2,157.6 billion annual rate, but Census puts the confidence interval at plus or minus 0.8 percent, so the monthly change cannot be distinguished from zero. The 3.8 percent decline from a year earlier can be.
- Factory construction is the weakest category in the report. Manufacturing construction fell 1.0 percent in July to $169.8 billion and is down 22.2 percent in the first seven months of the year, more than twice the decline in the next weakest category. It has now fallen 32 percent from its September 2024 peak.
- Ninety-five percent of that decline is a single subcategory. Computer, electronic and electrical construction fell 45.4 percent for the year to date, $27.7 billion of a $29.1 billion drop in private manufacturing construction. Strip it out and the rest of factory building is down 2.1 percent.
- The equipment side of the same capital cycle set a high. Orders for nondefense capital goods excluding aircraft reached $85.9 billion in July, up 12.9 percent from a year earlier and the highest monthly reading in a series that begins in 1992.
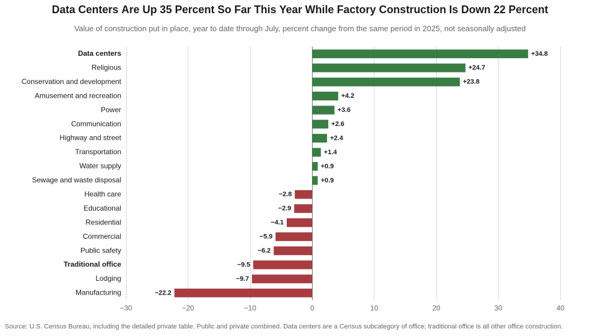
- Data centers are the fastest growing category in the report. Census reports them separately from other office construction in its detailed table. Data center construction ran $37.2 billion in the first seven months of the year, 34.8 percent above the same period in 2025, while every other kind of office building fell 9.5 percent. Data centers were 57 percent of private office construction, against 47 percent a year earlier.
- Residential kept sliding and single-family led it down. Private residential construction fell 1.3 percent to $859.0 billion, and is down 4.1 percent in the first seven months of the year. New single-family construction fell 3.2 percent in July, the largest monthly decline of any private category in the report.
Key Takeaways
| Key Concept | Findings |
|---|---|
| Total Construction | $2,157.6 billion at an annual rate, down 0.5 percent from June’s revised $2,167.7 billion and 3.8 percent below July 2025. Spending in the first seven months of the year totaled $1,244.6 billion, 3.5 percent below the same period in 2025. |
| Private Construction | Down 0.5 percent to $1,614.2 billion, one of only two figures in the release text that clears its confidence interval. Residential fell 1.3 percent to $859.0 billion and nonresidential rose 0.4 percent to $755.2 billion. |
| Manufacturing | Down 1.0 percent in July to $169.8 billion, and 22.2 percent below the same seven months of 2025, the weakest of the 17 categories Census publishes. Computer, electronic and electrical construction is 95 percent of the decline; everything else is down 2.1 percent. The level is still more than double the 2019 average of $81.0 billion, so this is a boom unwinding rather than a sector in trouble. |
| Data Centers | Up 34.8 percent in the first seven months of the year to $37.2 billion, the fastest growing category in the report, and accelerating: July alone ran 57.2 percent above a year earlier and 118 percent at a three-month annualized rate. Data centers were 57 percent of private office construction against 47 percent a year ago, and 8.6 percent of all private nonresidential construction against 6.0 percent. |
| Traditional Office | Down 9.5 percent in the first seven months of the year to $37.6 billion, one of the weakest categories in the report. General office building alone fell 11.8 percent. The office aggregate, up 8.2 percent, is the average of a boom and a bust and describes neither. |
| Announcements vs. Starts | More than $5 trillion of foreign investment has been pledged, but the Peterson Institute finds fewer than 30 percent of those dollars have an identified project. The lag from announcement to groundbreaking runs nine months for electrical equipment, seventeen for steel and twenty-eight to thirty-nine for semiconductors, so the announced plants are 2027 and 2028 spending, not 2026. |
| Peak Data Center? | Not in anything this release measures. The political constraint is real and growing, with 56 formal public actions across 25 states and Texas pausing all new grid interconnections on August 3, but almost all of it raises the cost of a data center without reducing the number of them, and 80.4 percent of the record capacity under construction is already preleased. |
| Residential | Down 1.3 percent to $871.2 billion including public, 4.1 percent below the same seven months of 2025 and 7.3 percent below July 2025 alone. New single-family fell 3.2 percent to $395.2 billion. New multifamily rose 0.2 percent to $115.1 billion and is close to flat over the year. |
| Public Construction | Down 0.2 percent to $543.4 billion, within the confidence interval, and up 0.8 percent in the first seven months of the year. Highway and street spending is up 2.4 percent and conservation and development 23.8 percent. Public spending sits within a whisker of its June record. |
| Breadth | Ten of the 17 categories Census publishes grew in the first seven months of the year and seven declined. The distribution runs from religious at plus 24.7 percent to manufacturing at minus 22.2 percent, and splitting data centers out of office puts the top of the range at plus 34.8 percent. |
| Alongside the ISM | This morning’s ISM report showed factory production expanding for a tenth month and new orders for an eighth. Factories are running harder while fewer new ones are being built, which is the rotation from structures to equipment that this release measures from the other side. |
| Policy Signal | The weakness is concentrated in two categories with causes a rate cut does not address. We continue to look for the Fed to hold through the meetings before the November 3 midterm elections and to raise the target range in December, with one further increase in 2027 to a terminal 4.00 to 4.25 percent. |
The Overview
Construction spending fell 0.5 percent in July to a seasonally adjusted annual rate of $2,157.6 billion, and the first thing to say about that number is that it may not be a decline at all. Census puts the 90 percent confidence interval on the monthly change at plus or minus 0.8 percent, which contains zero, and its own explanatory note says it can take two months to establish an underlying trend for total construction and as long as eight months for individual categories. The 3.8 percent decline from a year earlier does clear its interval, as does the 3.5 percent shortfall in the first seven months of the year against the same period in 2025. Read the year, not the month.
The categories run from plus 34.8 percent to minus 22.2 percent so far this year. A single figure covering a $2.2 trillion aggregate is going to bury a spread that wide, and in this release it buries the whole story. Two categories account for nearly the entire decline, and both are unwinding booms of their own making, while one category is growing faster than anything else in the report and is now large enough to hold up the aggregate on its own.
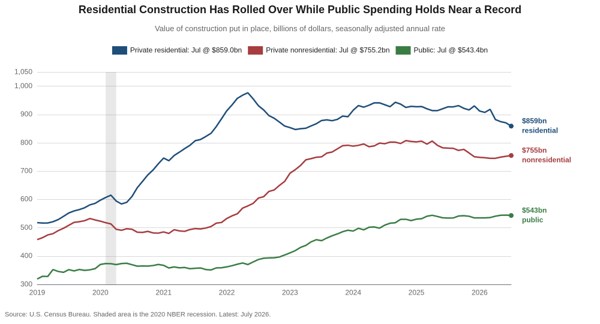
Private nonresidential construction actually rose in July, by 0.4 percent to $755.2 billion, and that is one of only two figures in the release text that clears its confidence interval. Public construction was essentially flat at $543.4 billion, a whisker below the record it set in June. What fell was private residential, down 1.3 percent to $859.0 billion, and inside private nonresidential the composition did far more work than the total.
The Factory Building Cycle Has Turned
Manufacturing construction fell 1.0 percent in July to $169.8 billion and is 22.2 percent below the same seven months of 2025, the weakest reading of the 17 categories in the report. The private share, which is almost all of it, fell 22.5 percent. Against its September 2024 peak of $250.2 billion, spending on factories has fallen 32 percent in twenty-two months.
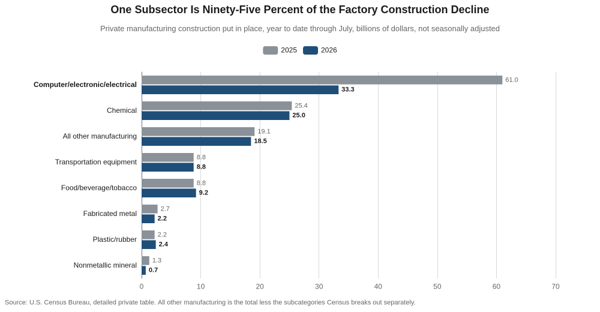
One subcategory is 95 percent of the decline. Census breaks private manufacturing construction into seven subcategories, and one of them accounts for almost the whole decline. Computer, electronic and electrical construction ran $33.3 billion in the first seven months of the year against $61.0 billion in the same period of 2025, a fall of 45.4 percent and $27.7 billion. Private manufacturing construction as a whole fell $29.1 billion. That subcategory has gone from 47 percent of factory construction to 33 percent in a year.
The other six subcategories moved by less than a billion dollars each. Chemical plant construction, the second largest subcategory at $25.0 billion, is down 1.2 percent. Transportation equipment is down two tenths. Food, beverage and tobacco is up 5.1 percent and plastic and rubber up 11.0 percent. Strip out computer, electronic and electrical and the rest of factory construction is down 2.1 percent for the year, which is close to flat. Chemicals matter more than their share suggests, because chemical output is an input to most other manufactured goods, so a stable chemical build is a better read on the breadth of industrial investment than the manufacturing headline is.
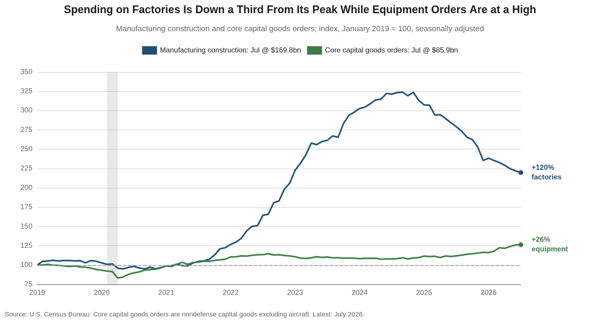
The subsidies did not start the boom, but they doubled it. The CHIPS and Science Act and the Inflation Reduction Act were both signed in August 2022, and the shorthand is that they created the boom. The data say they extended one already running. Factory construction was $76.4 billion in January 2021, essentially its 2019 level, and had reached $128.1 billion by the month the two acts were signed, a gain of 68 percent before either took effect. It then nearly doubled again, to the September 2024 peak of $250.2 billion. The subsidies did not start the cycle; they roughly doubled it and concentrated it in one subcategory.
A semiconductor fab takes three to five years to build, and the 2022 cohort is finishing now. Nothing behind that cohort matches it in scale, which is what the Census subcategory is measuring. The 2019 average for all factory construction was $81.0 billion, so at $169.8 billion the sector is still building at more than twice the pre-pandemic rate. A boom unwinding toward a higher base ends somewhere above where it started, and a sector in trouble does not.
Unfilled orders for capital goods reached a record $953.2 billion in July. The capital cycle did not stop when the buildings did. Orders for nondefense capital goods excluding aircraft reached $85.9 billion in July, up 12.9 percent over the year and the highest monthly reading in a series that begins in 1992. Manufacturing construction has fallen back, however, to 120 percent above its January 2019 level from a peak of 224 percent above it, while core capital goods orders have climbed to 26 percent above the same base and are still rising. That backlog is 9.2 percent above the same month last year and the highest the series has recorded. Firms have stopped adding walls and are filling the ones they built, which is what the house forecast of 6.1 percent growth in nonresidential fixed investment this year has been describing all along.
From Announcement to Groundbreaking
The gap between what has been announced and what has been built appears to be the widest on record. The Peterson Institute counted more than $5 trillion of foreign investment pledges made to the United States in the past two years, about 18 percent of last year’s gross domestic product, from the United Arab Emirates at $1.6 trillion down through Japan at $550 billion, Taiwan at $500 billion and South Korea at $350 billion. Fewer than 30 percent of those dollars have an identified project attached to them, and Peterson says the metrics for verifying the pledges are unclear. Set against the flows these countries actually sent before the pledges, the numbers are large. Japan averaged $39 billion a year of direct investment into the United States between 2020 and 2024, so $550 billion is 14 years of it. South Korea averaged $6.4 billion, so $350 billion is 55 years of it.
The structures matter more than the headline figures. Japan’s $550 billion is not equity. The St. Louis Fed read the structure and found cash flows split evenly until Japan recovers its principal and a deemed rate of interest and 90 to 10 in favor of the United States after that, with Japan taking no ownership in the projects, which makes the commitment resemble a loan. Korea’s agreement carries a $20 billion annual cap, which turns $350 billion into a program lasting more than seventeen years. Commerce named the first tranche of Japanese projects in February, $35.7 billion, or 6.5 percent of the total, and it was a natural gas power plant in Ohio, a crude oil export terminal on the Gulf and one small industrial facility in Georgia. Only the third of those is manufacturing.
Several of the largest figures in circulation are not capital spending at all. Apple’s $600 billion covers direct hiring, supplier and partner purchases across all fifty states, data centers and component partnerships, with no published split among them. Nvidia’s $500 billion is a target for the value of American-made equipment the company intends to sell over four years, which is a revenue figure rather than a capital budget. Micron’s $250 billion runs through 2035. These are not comparable to one another and none of them is an annual number, so adding them tells you nothing about what will be poured next year.
What separates an announcement from a construction dollar is time, and the lags are long. Toyota announced its Liberty, North Carolina battery plant in December 2021, broke ground eight months later and started production in November 2025, four years after the announcement, and that is the fast case. Micron announced its Clay, New York site in October 2022 and broke ground in January of this year, thirty-nine months later. SK Hynix announced West Lafayette, Indiana in April 2024 and started construction on August 29, twenty-eight months later, with mass production scheduled for 2029. Susan Spence, who chairs ISM’s survey committee, puts it at three to five years from deciding to build a factory to opening it, and every completed case we could date is consistent with that.
The Backlog That Has Not Broken Ground
The largest steel mill announced last year has taken seventeen months to reach groundbreaking. Hyundai Steel announced a $5.8 billion electric arc furnace mill at Donaldsonville, Louisiana on March 24 of last year. Ground has still not been broken; the ceremony is scheduled for this Friday, seventeen months after the announcement, with production slated for 2029. Nippon Steel has committed $11 billion in the United States by 2028 and has publicly allocated about half of it, including up to $2.5 billion at Mon Valley announced in June for a new hot strip mill and the replacement of an eighty-seven-year-old one. That is a two-year build that has not started. Cleveland-Cliffs announced a $1 billion modernization at Middletown, Ohio on August 21, half of it Department of Energy money, with construction beginning within weeks and the blast furnace rebuild finishing in the first quarter of 2030.
One steel project is nearly finished, and it shows what the difference looks like. Nucor’s $4 billion sheet mill at Apple Grove, West Virginia was 85 percent complete in April and is commissioning through this year for a commercial start in early 2027. It absorbed 40 percent of the company’s capital spending in the first quarter. One mill at that stage is worth more to next year’s construction spending than a dozen announcements.
Hitachi Energy went from announcement to groundbreaking in nine months. Hitachi Energy broke ground on a $457 million transformer plant at South Boston, Virginia on June 29, nine months after announcing it, as part of a commitment of more than $1 billion. GE Vernova is spending close to $600 million across ten American sites over two years, including gas turbine capacity at Greenville and Schenectady and switchgear at Charleroi. Siemens Energy is building transformer capacity at Charlotte. These move faster than the steel and semiconductor projects because most of them expand plants that already exist on sites that are already permitted and already connected to the grid.
Siemens Energy’s turbine backlog runs four and a half years deep at current delivery rates. GE Vernova’s gas equipment backlog and slot reservations went from 100 to 116 gigawatts in a single quarter, though the two are not the same thing and the firm order book is the smaller 53 gigawatts of it. Siemens Energy carries a 69 gigawatt gas turbine backlog against 15 to 16 gigawatts of annual deliveries, which is four and a half years of work, and says lead times across the company now run three years or more. Mitsubishi’s large-frame backlog went from 23 to 35 gigawatts and the orders it booked last quarter deliver between 2028 and 2030. Lead times published last year ran 128 weeks for power transformers and 143 weeks for generation step-up units, and demand for the latter had risen 274 percent since 2019. None of that shows up in a construction spending report for years.
The counterweight is that the pipeline is thinner than the announcement flow suggests. Dodge expects manufacturing construction starts to fall 24 percent this year. The Clean Investment Monitor, which separates capital actually deployed from capital announced, put announced clean manufacturing investment down 79 percent from a year earlier in the first quarter and actual investment down 34 percent, the weakest quarter of real spending in nearly three years, with cancellations of $1.6 billion in the first quarter and $1.7 billion in the second. Contractors with data center work carry 11.4 months of backlog against 7.5 months for those without, and only 12 percent of Associated Builders and Contractors members have any of that work.
Both things are true, and they resolve on different timetables. Read the two together and the announcements are neither the mirage the cancellation figures suggest nor the boom the pledge totals suggest. A transformer plant announced last autumn is being poured now, on a nine-month lag; a steel mill announced last spring becomes construction spending in 2027 and 2028, on a seventeen-month lag; and a semiconductor fab announced this year does not reach the data until the end of the decade, on a lag of twenty-eight to thirty-nine months. We expect factory construction to keep falling through the first half of 2027 and to find a floor as the steel and grid-equipment cohort starts pouring, unless the policy that justified those projects changes first.
Where the Money Is Still Going
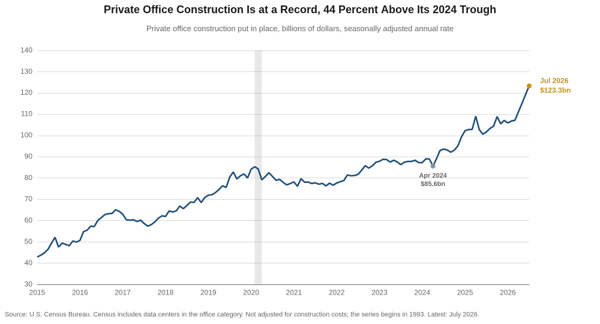
Office construction was the strongest of the large categories, up 2.9 percent in July to $140.1 billion and 8.2 percent for the year to date, and the private share reached a record $123.3 billion. Nothing in the leasing market explains that, and the detailed Census table shows why it does not have to. Census reports office construction in three parts, general, data center and financial. Data centers came to $37.2 billion in the first seven months of the year against $27.6 billion in the same period of 2025, a gain of 34.8 percent, while every other kind of office building fell 9.5 percent. The category is two businesses moving in opposite directions, and the aggregate is the average of a boom and a bust.
Power construction passed manufacturing in May and is now $11.7 billion above it, $181.5 billion against $169.8 billion, having been $65 billion below it as recently as December 2023. Power rose 0.5 percent in July and is up 3.6 percent for the year to date. Highway and street spending is 2.4 percent higher than the same seven months of 2025, conservation and development 23.8 percent higher, and communication construction 2.6 percent higher. These are the categories that serve the same buildout, and they are the reason public construction has risen in each of the past five years.
The categories that are not part of that buildout are flat to lower. Health care fell 0.5 percent in July and is down 2.8 percent for the year to date, educational construction is down 2.9 percent, and lodging is down 9.7 percent. The eds-and-meds categories that carried nonresidential construction through the last cycle are no longer contributing, and neither is anything tied to discretionary consumer spending.
Are We at Peak Data Center?
Data center construction accelerated through the summer, and the July figures answer the question in the direction the political coverage would not suggest. Data center construction rose 6.2 percent in July, its fifth consecutive monthly gain of more than 6 percent, and is running at a 118 percent annualized rate over the past three months. Spending has gone from $58.1 billion in March to $75.2 billion in July. Whatever is happening at the leading edge of this buildout, nothing has slowed in the spending data.
Office and data centers are two different businesses inside one Census line, and separating them changes what the category says. Census separates them in its detailed private table, in a subcategory covering buildings that contain the hardware needed for storing, processing and transmitting digital information. Data centers came to $37.2 billion in the first seven months of the year against $27.6 billion in the same period of 2025, up 34.8 percent, while general office building fell 11.8 percent and every other kind of office construction taken together fell 9.5 percent. Data centers passed the halfway mark of the category this year, at 57 percent of private office construction for the year to date against 47 percent a year earlier, and 61 percent in the month of July alone.
The category is now large enough to move the aggregate on its own. Private nonresidential construction is down 5.6 percent in the first seven months of the year. Take data centers out of both ends of that comparison and the remainder is down 8.2 percent. Data centers added $9.6 billion against the same period last year while manufacturing gave up $28.8 billion, so one category offset a third of the largest decline in the report. At the July run rate the offset is larger still, $27.4 billion against $46.5 billion at annual rates. Private nonresidential construction excluding data centers is having a considerably worse year than the headline suggests.
Census measures work put in place, which is the last thing to happen rather than the first. A project pouring concrete this month was financed a year ago and permitted before that, so put-in-place spending is a record of decisions taken a year or more ago. The leading edge sits in the interconnection queue and the permit docket, and both have tightened this year.
One private tracker counts 56 formal public actions against data center projects across 25 states, most of them taken between May and August of this year, running from local moratoria to state bills to outright project rejections. Tax incentives are being reconsidered where they are largest, with Virginia’s exemption costing about $1.6 billion in the most recent year, up 118 percent, and Georgia putting its foregone revenue at $2.5 billion, several times an earlier estimate. The largest single action came on August 3, when the governor of Texas directed the state utility commission and ERCOT to audit every data center seeking a grid interconnection. That queue holds more than 1,800 projects representing over 474 gigawatts, more than five times the state’s record peak demand, and roughly 90 percent of new power requests in Texas now come from data centers. The Energy Information Administration cut its forecast for Texas load growth in 2027 to 6 percent from 14 percent in its August outlook, citing the pause.
The pipeline already under contract is large enough to carry spending for another year whatever happens to new approvals. CBRE puts North American data center vacancy at 1.4 percent, a record low, with 7,481 megawatts under construction, also a record, and 80.4 percent of that capacity already preleased. Fewer than 1,500 megawatts are uncommitted across the primary markets, which is about six months of absorption. The four largest hyperscalers raised their 2026 capital budgets through the year, and did so against visible investor resistance. If new approvals stopped tomorrow, construction spending on this category would keep rising well into next year.
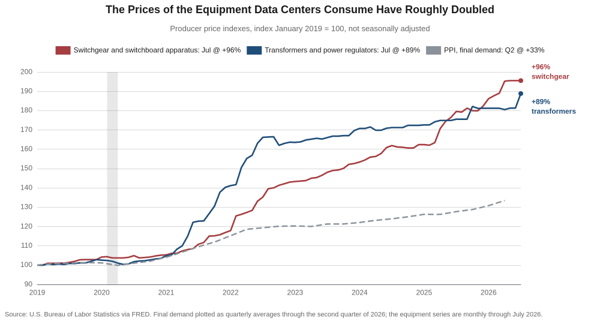
Producer prices for the equipment the buildout consumes have risen nearly three times as fast as producer prices generally. The producer price index for transformers and power regulators rose 7.6 percent over the year through July and has climbed 89 percent since January 2019. Switchgear and switchboard apparatus rose 8.9 percent over the year and 96 percent since 2019. The producer price index for final demand rose 33 percent over the same period. Transformer prices jumped 4.2 percent in July alone after four flat months, which is worth watching in the September 10 release.
Electricity is the second channel. PJM’s most recent capacity auction cleared at $333.44 per megawatt-day for the 2027 to 2028 delivery year at a total cost of $16.4 billion, and nearly all of the roughly 5,250 megawatt increase in its forecast peak load was attributable to data centers. The Dallas Fed estimates that existing data centers have already raised wholesale generation costs by 5 to 15 percent nationally, and that the pass-through to consumer inflation through retail electricity amounts to about five hundredths of a percentage point on PCE this year, rising toward a tenth of a point by 2030. The Committee named the channel itself in the minutes of the July meeting, observing that materials for data centers such as chips and steel had registered large price increases and that electricity had been subject to price pressures as well.
The blowback so far raises the cost of the buildout without reducing its size, which points the wrong way for anyone hoping it cools inflation. State moratorium bills failed in all eleven states that filed them, and local moratoria have proven vulnerable to litigation, with one Texas county rescinding its own within weeks of a developer lawsuit and a second abandoning its plans on the strength of that example. What has passed instead is cost allocation. Oregon’s new large-load tariff requires customers above 20 megawatts to fund distribution upgrades in full, pay minimum demand charges on 90 percent of contracted capacity, sign contracts running as long as 30 years and pay a surcharge of one cent per kilowatt-hour above 100 megawatts. Virginia and North Carolina have added electricity taxes, and several states are repealing sales tax exemptions. Every one of these raises the cost of building and running a data center. None of them reduces the demand for transformers.
The Texas interconnection pause is the exception, because it constrains quantity rather than price, and the EIA has already marked its forecast to it. Whether it binds is not yet known. The directive came as a letter with no stated end date, and it exempts projects with on-site generation and everything outside ERCOT. It is the one action in the set large enough to move the national figures, however.
None of this changes what we expect the Committee to do on September 16. We have looked for a hold at the meetings before the November 3 midterm elections since late August, and nothing here changes that. The argument bites on December, and there it cuts both ways. If the buildout is the marginal source of the goods and electricity price pressure the Committee named in July, a genuine slowdown would remove a reason to move. The Dallas Fed’s estimate of the size of that pressure, roughly five hundredths of a point on PCE this year, is not large enough to hike over on its own, and it is not large enough to hold over either.
Two things would tell us the peak has arrived, and we would want to see them in this order. Transformer and switchgear prices rolling over would say the equipment bottleneck is clearing. A second state following Texas into an interconnection pause would say the quantity constraint is spreading beyond one market. Neither has happened. Until one does, the July data say the buildout is running at the fastest pace of this cycle and that its constraint has moved from capital to permission, which raises its cost rather than lowering it.
Residential Is the Other Drag
Private residential construction fell 1.3 percent in July to $859.0 billion and is 4.1 percent below the same seven months of 2025, and 7.3 percent below July 2025 alone. New single-family construction fell 3.2 percent to $395.2 billion, the largest monthly decline of any private category in the report, and is down 5.7 percent for the year to date. New multifamily rose two tenths to $115.1 billion and is down three tenths for the year to date, so the weakness is entirely on the single-family side.
Single-family starts fell to 808,000 in July from 1,017,000 in March. Builders are cutting production against an inventory of completed new homes for sale that peaked at 128,000 in January and stood at 117,000 in July. That level is higher than any month in the series before 2025, when the previous record was 96,000 in January 2010. Builders are working down a record overhang, and the construction spending data are the arithmetic of that decision showing up two quarters after the decision was made.
Reading the Two Releases Together
The ISM Manufacturing PMI and the construction spending report landed within an hour of each other this morning, and they describe the same economy one month apart. ISM is an August survey of what purchasing managers saw last month, while Census is a July count of dollars actually put in place, which lags the decision to spend by months. The two are measuring different ends of the same process, however, so the places where they agree carry more than either does alone.
ISM had factory production expanding for a tenth consecutive month in August, at 58.3, and new orders for an eighth, at 53.7. Census has factory construction down 22.2 percent so far this year. Existing plants are running harder while fewer new ones go up, and core capital goods orders at a high say the money has moved inside the buildings. That is the conditional capital argument we made in our data center work, seen from the construction side.
The demand for what the buildout consumes shows up in both releases. ISM panelists described photonics, high-speed connectors, semiconductors and AI infrastructure demand expanding significantly, and ISM’s Computer & Electronic Products industry reported higher new orders in August. Census has private office construction, which is where data centers are counted, at a record level and up 10.2 percent in the first seven months of the year, with power construction up 3.6 percent alongside it.
The residential signal agrees as well. We wrote in this morning’s ISM note that we suspected much of the deceleration in new orders was coming from the slowdown in residential construction, and this release supports it from the other direction. Wood Products was one of only two industries ISM shows contracting in August, with lower new orders, lower production and lower backlogs, and Census has new single-family construction posting the largest monthly decline in the report.
Neither release adjusts for prices. Census states that its data are adjusted for seasonality but not for price changes, and the ISM Prices Index has signaled rising input costs for 23 consecutive months, with steel, aluminum and tariffs named as the primary drivers. Nominal construction spending 3.8 percent below a year ago, against input costs that have risen over the same period, means the decline in real activity is larger than these figures show.
The composition of this release matters more than its level, and the composition is not weak across the board. Two categories account for nearly all of the year-over-year decline, and both are working off booms of their own. Factory construction is 32 percent below its peak and still more than double its 2019 level, and single-family building is adjusting to a record inventory of completed homes. Meanwhile private nonresidential spending rose in July, public construction sits beside a record, and office construction is at one. We expect total construction spending to keep drifting lower into the fourth quarter on the residential and factory categories while the aggregate understates what the rest of the sector is doing.
We are holding the nonresidential investment call, and this release is why. The construction data measure the structures half, and it is falling. Core capital goods orders measure the equipment half, and it is at a high. Our forecast of 6.1 percent growth in nonresidential fixed investment this year requires exactly that split to hold, since structures are a smaller share of the total than equipment and intellectual property together. Nothing in the July figures argues against it, and the ISM production and new orders readings this morning argue for it.
A construction sector 3.8 percent smaller than a year ago is the case for a rate cut. We are not taking it. The weakness sits in two categories whose causes a quarter-point cut does not reach, a subsidy-driven factory building boom unwinding on its own schedule and a housing market working through the largest overhang of finished homes on record. The parts of construction least sensitive to the funds rate, which are public works, power and data centers, are at or near records. We look for the Fed to hold through the meetings before the November 3 midterm elections and to raise the target range in December, with one further increase in 2027 to a terminal 4.00 to 4.25 percent.
Two readings would change the view. If private nonresidential spending falls for two more months while manufacturing keeps sliding, the rotation described here stops being a rotation and becomes a downturn in business fixed investment, and our nonresidential investment forecast would be too high. The second is public construction, which has carried the aggregate for three years on federal infrastructure money that is now largely obligated. A rollover there would remove the one steady support in this release, and it would arrive without a boom to blame.
Mark P. Vitner – Chief Economist, Piedmont Crescent Capital
mark.vitner@piedmontcrescentcapital.com · (704) 458-4000
Disclaimer: This report is provided for informational purposes only and does not constitute investment, legal, tax or accounting advice, nor an offer or solicitation to buy or sell any security. Information is drawn from sources believed to be reliable, including the U.S. Census Bureau, the Institute for Supply Management, the U.S. Bureau of Labor Statistics and the Federal Reserve Board, but its accuracy and completeness are not guaranteed. Views expressed are those of the author as of the date of publication and are subject to change without notice. Past performance is not indicative of future results.