
August Employment Report: Not the Blowout It Appears
Payrolls rose 162,000 on wider-than-usual seasonal swings in leisure & hospitality and local education, the payback we warned about. The three-month average is the number to carry, manufacturing is broadening, hours worked jumped, and nothing here should change the Fed’s thinking for September.
Early Signal
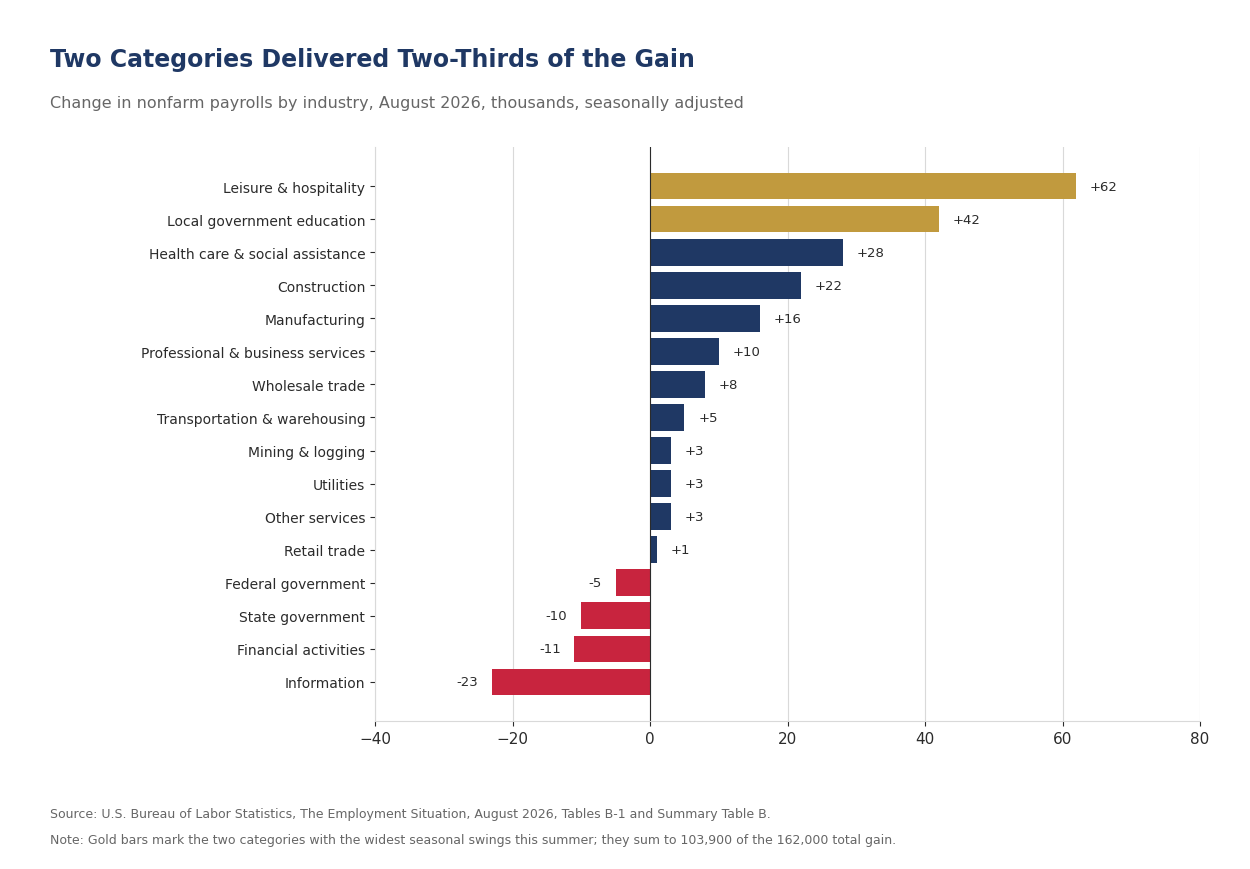
- Nonfarm payrolls rose 162,000 in August, and this report is not the blowout it appears on the surface. The gain was roughly three times the consensus call near 50,000, and the two prior months were revised up a combined 55,000, but 104,000 of the 162,000 came from two categories, leisure & hospitality and local government education, whose seasonal swings have been wider than usual all summer. June was revised to a gain of 31,000 from 20,000 and July to a gain of 21,000 from a decline of 23,000, so the first outright decline since February has been revised away. The three-month average is 71,000 and the average over the twelve months through July is 31,000.
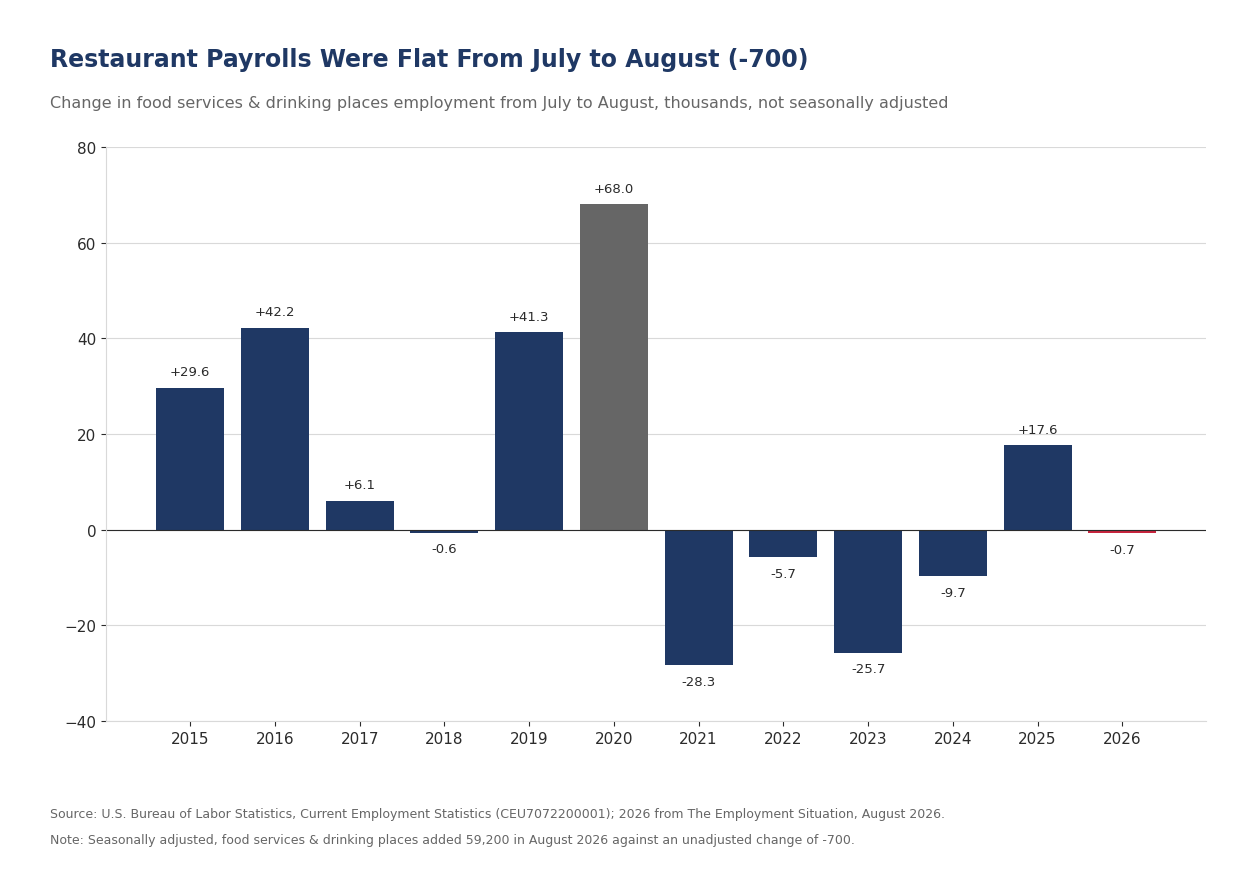
- Leisure & hospitality added 62,000 jobs, the payback we have warned about since July, and the three-month average is the right way to read it. After revised declines of 54,000 in June and 21,000 in July, the industry has lost 13,000 jobs over three months, about 4,000 a month, the pace to carry for a summer stretched to 105 days by the earliest Memorial Day and the latest Labor Day the calendar allows. Before seasonal adjustment restaurants and bars shed just 700 workers in August, and against factors built for a midsummer roll-off that printed as a 59,200 gain.
- Local government education added 41,900 jobs after its 57,500 July drop, the second half of a seasonal swing that BLS describes as largely offsetting and that has no counterpart in the unadjusted data. Unadjusted, districts added 327,300 workers as the school year began, fewer than in any of the past three Augusts, and district payrolls are 51,100 below last August’s.
- Set the two calendar categories aside and payrolls rose roughly 58,000, close to the 67,000 underlying pace we estimated for July and above the zero to 40,000 breakeven range we adopted on August 28. Hiring breadth widened as well, with the one-month private diffusion index at 55.6 from 52.8 and the factory index at 61.1.
- Manufacturing payrolls rose 16,000 and are up 58,000 from December’s low, and the gains are broadening. The one-month manufacturing diffusion index jumped to 61.1 from 52.1, meaning roughly six of every ten factory industries added workers, with machinery (+6,100) and fabricated metals (+5,700) leading and motor vehicles & parts giving back 4,500. Construction added 22,000, with heavy & civil engineering up 4,400 on the month and 27,200 over the year and nonresidential specialty trades up 7,800, the payroll signature of the AI buildout and the factory projects still under way. Tech-centric employment was the weak spot, with information shedding 23,000, including 7,700 at computing infrastructure and data processing providers, and computer systems design down again and 31,300 below a year ago.
- The unemployment rate held at 4.1% as the labor force grew 683,000 and household employment rose 569,000. Participation rose to 61.6% from July’s 61.4%, and the count of people working part time for economic reasons fell 414,000, pulling U-6 down to 7.7%. The labor force is 973,000 smaller than a year ago on a population 1.4 million larger.
- Average hourly earnings rose 10 cents, or 0.3%, to $37.75 and are up 3.1% over the past year, a pace consistent with the Fed’s 2% inflation mandate once productivity growth is taken into account. The year-over-year rate, from 3.2% in July, is the slowest of the year. Hours worked jumped, with the workweek up a tenth to 34.4 after four months at 34.3 and the index of aggregate weekly hours up 0.3%, a large move for a series that had been flat all summer; a tenth of an hour on 136 million private payrolls is worth roughly 400,000 jobs. Production workers in manufacturing held a 41.7-hour week for a third month.
- Layoffs are still low. Initial claims were 206,000 in the week ended August 29 and continuing claims 1.78 million in the week ended August 22. Job leavers rose 121,000 to 914,000, the kind of increase that comes when workers are confident of finding the next job, and job losers fell 64,000.
The Print the Calendar Owed Us
August’s employment report was the strongest of the year on the surface, and it arrived in the two categories we said it would, which is why we would read its composition before its headline. Nonfarm payrolls rose 162,000 against a consensus near 50,000, and June and July were revised up a combined 55,000, with July’s first print of -23,000 now a gain of 21,000. Private payrolls added 127,000 and government 35,000, nearly all of it local education. The three-month average now stands at 71,000 and the twelve-month average at 31,000, measured over the twelve months through July, which is the window BLS uses. We said on August 10 to expect a surprisingly strong report in one or both of August and September and on August 23 put the bar at 125,000. August cleared it, and the composition does not support claiming more. Leisure & hospitality and local government education together account for 104,000 of the 162,000, and both are categories where the seasonal swings this summer have been wider than usual in both directions.
The bar this print had to clear moved on August 28, and it moved lower. The preliminary benchmark revision to March 2026 payrolls came in at -79,000, or 0.1%, against -911,000 a year earlier, and the composition mattered more than the level. Transportation & warehousing, information and financial activities were revised higher while retail, wholesale and private education & health were revised lower, so the jobs added paid an average of $2,769 a week and the jobs removed paid $1,518. Applied to the published data, the underlying pace of hiring over the revision year was between 11,000 and 16,000 jobs a month, and we marked our estimate of breakeven payroll growth down to a range of zero to 40,000 a month from 50,000 to 75,000. The benchmark does not enter the published series until February, so today’s revisions to June and July are the ordinary sample revisions and not the benchmark.
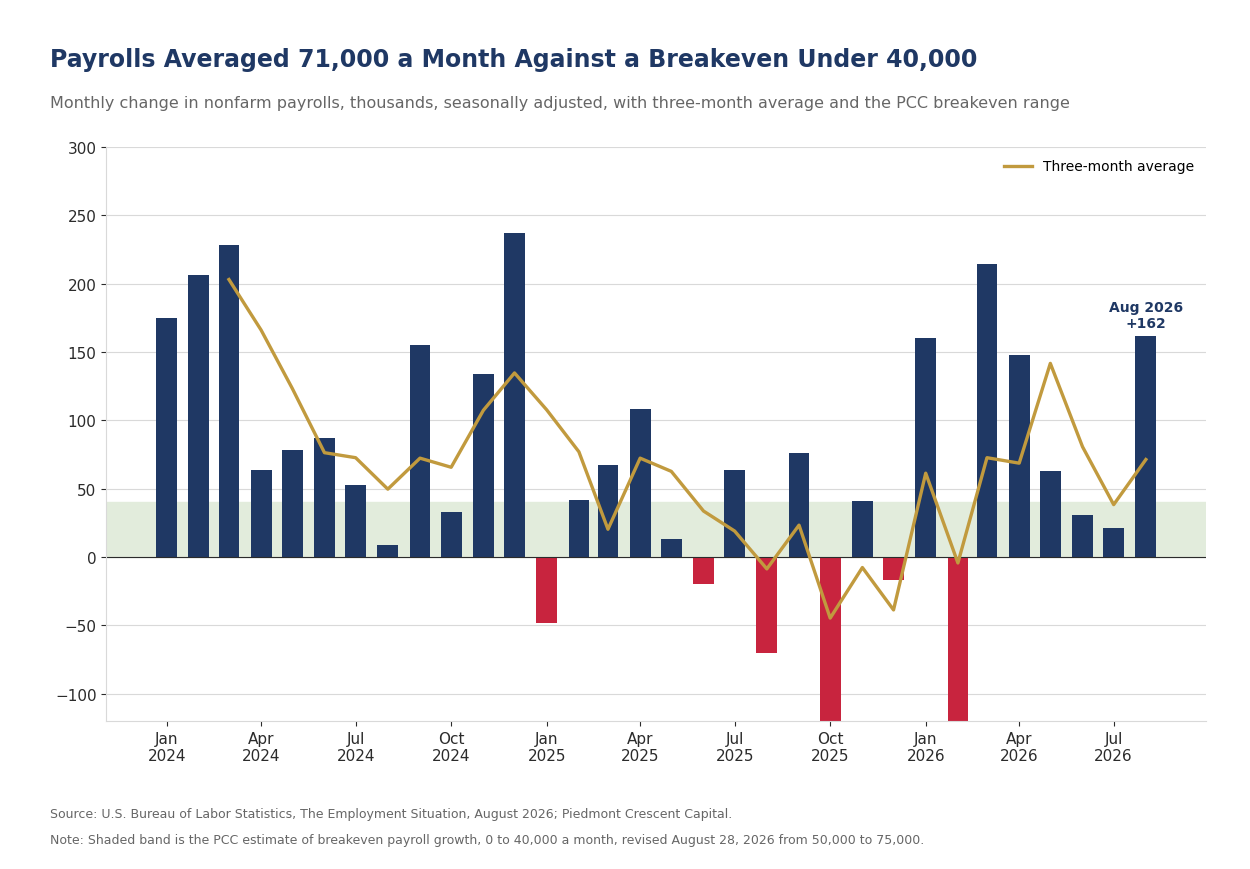
Hiring breadth widened more than the headline alone would suggest. The one-month diffusion index for private industries rose to 55.6 from a revised 52.8 in July, and the manufacturing index jumped to 61.1 from 52.1. Health care added 12,900 jobs, a second straight month near 13,000 and well below the 32,000 monthly average of the prior year, and social assistance added 15,500. Health care has carried the payroll count for two years; a month in which restaurants, factories and construction sites did the hiring while hospitals took a smaller share is a better month than the same headline built the other way around.
The Summer Unwinds
Leisure & hospitality added 62,000 jobs in August, and with June and July now at -54,000 and -21,000 the three months together are the only sensible way to read a summer whose hiring came early. Over the three months together the industry has lost 13,000 jobs, roughly 4,000 a month, against a gain of 131,000 over the past year, and that is the number we would carry into the fall. An extraordinarily long summer, with Memorial Day on May 25 and Labor Day on September 7, pulled hiring into May and left less to shed in August. The industry shed 91,000 jobs between July and August before seasonal adjustment, against declines of 73,000 last August, 107,000 in August 2024 and 125,000 in August 2023. Restaurants and bars held their July head count, losing just 700 workers, against declines of 25,700 in 2023 and 9,700 in 2024 and a gain of 17,600 last year, and the seasonal factors, which look for restaurant staffing to roll off from a midsummer peak, turned a flat month into a 59,200 gain. The unadjusted record makes that gain look less remarkable than the adjusted one, since restaurants and bars have held or added staff into August in most recent years, so part of the printed gain is where the re-estimated factors set the bar after this summer. Arts, entertainment & recreation ran a normal August, down 68,700 unadjusted against 68,800 a year earlier, and printed a 6,300 decline seasonally adjusted. Accommodation added 8,600.
The arithmetic was set out in advance, and it ran the way we said it would. Restaurants and bars did not hire as many people as they usually do in June and July. They therefore have far fewer people to let go as the summer winds down in August and September. The seasonal factors for leisure and hospitality jobs in August and September compensate for jobs that are expected to decline. Since fewer jobs were added during the prior two months, the end-of-summer decline will be less than usual, resulting in a larger seasonally adjusted job gain. The World Cup appears to have been the largest single reason the hiring came early, though it is likely not the only one, and Memorial Day on May 25, the earliest date the calendar permits, pulled the season’s start forward by a week. The same logic applies to the headline, and the 71,000 three-month average sits comfortably above our breakeven range.
Labor Day’s half of the argument lands in the September report. September 7 is the latest date the calendar permits, which leaves the summer workforce on payrolls through the September survey week. Taken together, 2026 runs 105 days from Memorial Day to Labor Day against 98 in each of the prior two years, the longest span possible, so the calendar effect runs through both prints and the September report, due October 2, carries the second half. That report will also carry the payback in local government education, where the August rebound has run ahead of the unadjusted data.
Local government education posted an outsized 41,900 gain as districts re-hired for the new school year, and the unadjusted data argue for reading it as the other half of July’s swing. BLS describes the August gain as largely offsetting July’s 57,500 decline, the largest July drop in at least a decade, and says the category has shown little net change since January 2025. Unadjusted, districts added 327,300 workers between July and August against 362,100 a year ago, 368,300 in 2024 and 372,500 in 2023, the smallest August re-entry in the past four years, and the category is 51,100 smaller than it was in August of last year. School payrolls are shrinking with enrollment, and we look for part of August’s 41,900 gain to come back out in the September report.
The Factory Sector, After the Order Book Cooled
Manufacturing payrolls rose 16,000 in August and have added 58,000 jobs since December’s low after shedding 56,000 over the second half of last year. Durable goods added 15,000 and nondurables 1,000. Machinery (+6,100), fabricated metals (+5,700) and computer & electronic products (+1,300) led, while motor vehicles & parts gave back 4,500 of July’s 10,700 gain and transportation equipment slipped 1,000 in total, leaving the balance in aerospace and other transportation equipment modestly higher. July’s factory gain was revised up to 14,000 from 5,000 and June’s to 13,000 from 11,000, so the sector’s momentum was stronger through the summer than the first prints showed.
The ISM employment index slipped to 51.2 from 52.8 in July, its second month above the 50.3 threshold ISM associates with rising factory payrolls, so the survey pointed to a small gain and the payroll data delivered a larger and broader one. The orders-to-backlogs-to-hours-to-hiring sequence we described in Tuesday’s ISM report still holds. With the manufacturing diffusion index at 61.1, roughly six of every ten factory industries added workers in August, and the gains came in machinery and fabricated metals, the capital-goods end that responds to the orders and backlogs ISM reported through July. Manufacturing is showing some strength, and it is broadening. New orders fell 3.0 points to 53.7 and backlogs 3.2 points to 51.8, the two largest declines in the report, but hiring follows orders with a lag of several months, so a softer order book in August is a statement about fourth-quarter hiring. The production-worker factory week held at 41.7 hours for a third month, the highest since June 2019, and the all-employee week edged up to 40.5 hours with overtime steady at 3.1. Six tenths of an hour above December’s 41.1-hour production week is worth roughly 184,000 workers at that workweek, against the 58,000 the sector has actually added, so the workweek is still doing work that hiring has not. This remains a productivity-led expansion, and we look for manufacturing employment to post small gains through the fall.
Construction added 22,000 jobs, and the nonresidential side did the hiring. Heavy & civil engineering construction, the category that builds data center campuses, substations, transmission and the site work for large plants, added 4,400 jobs in August, 12,200 before seasonal adjustment, and is up 27,200, or 2.3%, over the past year. Nonresidential specialty trades added 7,800 and are up 86,000, or 3.0%, over the year, and nonresidential building added 26,000 over the same span. Taken together the nonresidential side of construction has added roughly 139,000 jobs in a year in which residential specialty trades lost 20,700, and the same split shows in Tuesday’s construction spending report, where factory construction spending is down 22.2% year to date while data centers and power generation keep rising. Plants announced in 2023 and 2024 are still being finished even as new factory starts have slowed, and the electricity to run the data centers has become its own construction cycle.
Changes elsewhere were small, with professional & business services adding 10,000, temporary help up 6,800 for a third month, transportation & warehousing adding 5,000, wholesale 7,800 and retail 1,400, while financial activities lost 11,000 for a second month.
Tech-centric employment was the weak spot, with information losing 23,000, the largest decline of any industry, as computing infrastructure, data processing and web hosting providers were down 7,700. Publishing, which includes software publishers, lost 6,700, broadcasting 5,000 and telecommunications 2,100. Computer systems design and related services, the largest tech industry outside the information sector, lost 900 jobs and is down 31,300 over the past year, and computer & electronic products manufacturing added just 1,300. Information payrolls are 115,000, or 4.0%, below a year ago, and the two software-heavy categories, computing infrastructure and computer systems design, are down a combined 57,000. The data centers going up across the Southeast are a construction story first and an information-sector payroll story hardly at all, and the firms building them are shedding people in the parts of the business that AI reaches first. The labor-market signature of the capital-led expansion shows up there first, and it is not a bullish one for white-collar hiring.
The Labor Force Is Still the Story
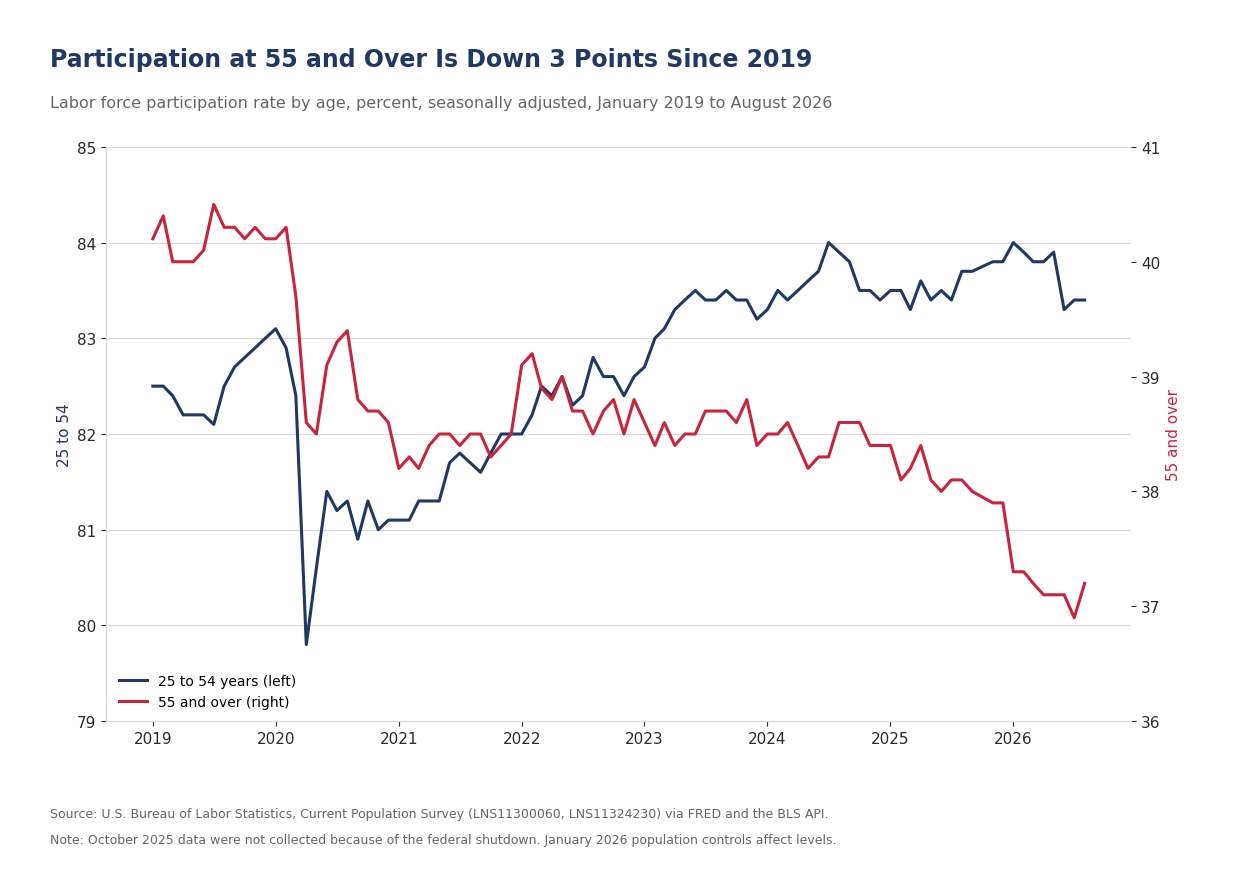
The unemployment rate held at 4.1%, and for once the household survey moved in the same direction as the payroll count. The labor force rose 683,000 and household employment 569,000, so the unemployment rate held on flows in the right direction rather than on a shrinking denominator, and the number of people not in the labor force fell 551,000. Employment among workers 55 and over rose 354,000 while prime-age employment was flat, so the month’s gain came from older workers. The labor force is still 973,000 smaller than a year ago while the adult population is 1.4 million larger, though the January population controls, which raised the 55-and-over population 1.25 million and cut the 25-to-54 population 1.48 million, overstate the year-over-year withdrawal, so rates are comparable across January and levels are not.
The participation rate rose two tenths to 61.6% from July’s 61.4%, the lowest reading outside the pandemic since 1976, and the age split still points to retirement rather than discouragement. The 55-and-over rate rose three tenths to 37.2% from July’s 36.9%, its lowest since March 2005, which accounts for most of the month’s increase, while prime-age participation held at 83.4% and the prime-age employment-to-population ratio at 80.4%. A one-month rebound among older workers does not change the trend. Participation is still down half a point since January, and a cohort with a participation rate near 37% keeps taking a larger share of the adult population from cohorts whose rates exceed 83%, so the aggregate rate falls even if no one changes their mind about working. Peak 65 adds 4.1 million people a year to that cohort through 2027, roughly 11,200 a day, and the retiree tide is still rising. The foreign-born labor force is 379,000 smaller than a year ago, a narrower gap than July’s 550,000, with its participation rate at 65.7% from 66.4% and its unemployment rate down a full point to 3.4%; the native-born labor force is down 608,000 over the same span, a decline that is mostly retirement.
The headline rate is a narrower gauge of the labor market than it used to be, and the broader measures improved with it this month. U-6 fell to 7.7% from 7.9% as the number of people working part time for economic reasons dropped 414,000 to 4.4 million, below the 4.8 million of a year ago, and the employment-to-population ratio rose two tenths to 59.1%. Multiple jobholders were 5.2% of the employed in August, unchanged from a year ago. Continuing claims cover roughly one unemployed worker in four, against half in the 1950s, because independent contractors cannot file a claim in any state, and one hour of paid work is enough to count someone as employed, so we would keep reading those measures beside the headline. None of that says the labor market is secretly weak, and this month none of it says it is secretly strong either; it says the 4.1% rate carries less information than the Committee is asking of it.
A shrinking labor force lowers the bar for what counts as adequate job growth, and the bar has now been lowered in print. If breakeven sits between zero and 40,000 a month, a run of prints in the 20,000 to 50,000 range is a labor market in balance, and a 162,000 print, even one built on a seasonal rebound, is a labor market that has tightened. We feel the breakeven is now slowly rising, however, as jobs are being created in parts of the economy, manufacturing in particular, where they have been lagging, and as workers with valid documentation return as processing normalizes. Neither force is large enough to change the arithmetic this year, and both argue for a higher breakeven by 2027.
Wages, Hours and the Fed
Wage growth cooled again in August even as hours rose. Average hourly earnings rose 10 cents, or 0.3%, to $37.75, and the year-over-year rate slipped to 3.1% from 3.2% in July and 3.5% in June, the slowest pace of the year. Production and nonsupervisory pay rose 11 cents to $32.53. A 3.1% rate of wage growth is consistent with the Fed’s 2% inflation mandate after taking productivity growth into account: nonfarm business productivity rose 2.2% over the year through the second quarter and unit labor costs just 1.4%, according to Thursday’s revised productivity report, and unit labor costs are what firms pass through to prices. Wages are no longer the channel through which this labor market threatens the inflation target, and a Committee looking for a reason to hold in September can find it in this table. Against core CPI at 2.5% and core PCE at 3.3% in July, pay is running ahead of the narrower price measure and slightly behind the broader one, and the gap between those two gauges, the widest since April 2022, is the subject of Sunday’s Perspective. Hours worked jumped, with the workweek up a tenth to 34.4 hours after four months at 34.3, the index of aggregate weekly hours up 0.3% after readings of 0.0% and 0.1% in June and July, and aggregate weekly payrolls up 0.7%. A tenth of an hour across 136 million private payrolls is the equivalent of roughly 400,000 jobs at the July workweek, so third-quarter output is tracking better than the summer payroll prints implied. Employers are paying more people for more hours at a slower rate of pay growth, the combination we would expect from a labor market in balance.
The report landed six days into a debate about whether to wait one meeting, and the calendar makes it two. Governor Waller said Thursday that his vote turns on the August CPI on September 11 and that if disinflation holds he would support leaving the funds rate at 3.50% to 3.75%, and we agree with him. The meeting after September is October 27 and 28, six days before the midterm elections, and this Committee is not going to move the funds rate in that window, so a September hold is a hold until December 8 and 9. Futures put the odds of a September increase at 53% after the release, from 49% on Thursday, roughly two-thirds after Jackson Hole and near even after Waller spoke, so the report moved the market by about four percentage points and left the decision a toss-up. The 2-year yield rose about 6 basis points to 4.41% and the 10-year about 3 basis points to 4.79%, leaving the 2s-10s spread near 38 basis points, a bear flattening. The hawks will cite the headline and the workweek. The doves will cite wage growth at 3.1% and a participation rate that finally rose. Nothing in this report argues for moving in September. A 162,000 print built on two categories swinging back from distorted July readings is not evidence of a labor market re-accelerating, and on the question in front of the Committee, which is inflation, the report leans the other way.
Our Call · Wider Swings, Same Trend, No Change for September
Yields rose and the odds of a September increase edged up to 53% from 49% within minutes of the release. We would not extrapolate this print any more than we extrapolated July’s. Restaurants and bars had far fewer summer workers to shed in August because they hired so few in June and July, and the seasonal factors turned a flat month into the largest gain in the report, which is the arithmetic we set out on August 10; local government education swung back by an outsized 41,900 after its July drop. Those two categories are 104,000 of the 162,000, and both have swung harder than usual in both directions this summer. The three-month average of 71,000 is the number to carry, and leisure & hospitality has lost 13,000 jobs over the three months of the summer. Without the two calendar categories payrolls rose roughly 58,000 in August, against a breakeven we now put at zero to 40,000 a month, manufacturing hiring is broadening across six of every ten factory industries, and hours worked jumped. A labor market that holds its unemployment rate at 4.1% on that much hiring is small, not weak, and the binding constraint is still a labor force that is nearly a million smaller than a year ago, and no setting of the funds rate changes the size of the labor force. Nothing here changes our forecast, and we do not believe it should change the Federal Reserve’s thinking for September. We look for the Committee to hold on September 16, no cut in 2026 and a first quarter-point increase in December, after the midterms, with one more in 2027 to a terminal 4.00% to 4.25%. Waller asked what it costs to wait one meeting; this report does not answer his question, the August CPI on September 11 does, and wage growth at 3.1%, a pace consistent with the 2% mandate once productivity is counted, argues that the answer will be very little. The condition that would move us on rates is two or three more months of core services outside of shelter running near 0.4% with shelter no longer decelerating, and the first of those readings arrives on September 11. September’s print carries the second half of the calendar, with Labor Day on September 7 holding summer staff into the survey week, and we would wait for it before calling the trend higher.
Mark P. Vitner – Chief Economist, Piedmont Crescent Capital
mark.vitner@piedmontcrescentcapital.com · (704) 458-4000
Sources: U.S. Bureau of Labor Statistics, The Employment Situation, August 2026, Current Employment Statistics preliminary benchmark revision and Quarterly Census of Employment and Wages; U.S. Department of Labor, Unemployment Insurance Weekly Claims; Institute for Supply Management; Board of Governors of the Federal Reserve System; Federal Reserve Banks of Atlanta, Dallas and St. Louis; CME Group. Disclaimer: This report is provided for informational purposes only and does not constitute investment, legal, tax, or accounting advice, nor an offer or solicitation to buy or sell any security. Information is drawn from sources believed to be reliable, but its accuracy and completeness are not guaranteed. Views expressed are those of the author as of the date of publication and are subject to change without notice. Past performance is not indicative of future results.