
Q1 GDP Holds Up Better Than Feared; Final Demand Tells the Cleaner Story

Q1 GDP Holds Up Better Than Feared; Final Demand Tells the Cleaner Story
A 2.0% headline print after a brutal February, an oil shock, and a residual government shutdown drag is more durable than it looks. The labor market data confirm it.
| Indicator (q/q SAAR, %) | Q1 2026 | Q4 2025 | Change |
|---|---|---|---|
| Real GDP | +2.0% | +0.5% | +1.5 pp |
| Final Sales to Pvt. Domestic Purchasers | +2.5% | +2.9% | −0.4 pp |
| Personal Consumption | +1.6% | +1.9% | −0.3 pp |
| Nonresidential Fixed Investment | +10.4% | +5.0% | +5.4 pp |
| Residential Investment | −8.0% | −1.7% | −6.3 pp |
| Core PCE Price Index (y/y) | +3.2% | +3.0% | +0.2 pp |
| Employment Cost Index (q/q) | +0.9% | +0.7% | +0.2 pp |
Headline Print
Real GDP grew at a 2.0% annualized pace in the first quarter, according to the advance estimate from the Bureau of Economic Analysis. That came in slightly below the 2.3% consensus and our own forecast, but it was substantially better than feared. The Atlanta Fed’s GDPNow tracking model had drifted as low as 0.5% in mid-April, and Q1 prints have come in mysteriously weak in each of the past several years, with seasonal-adjustment quirks that the BEA continues to wrestle with. Q1 also had to overcome a brutal February, the oil shock from the war with Iran, and the residual drag from the federal government shutdown that disrupted activity in the closing months of 2025.
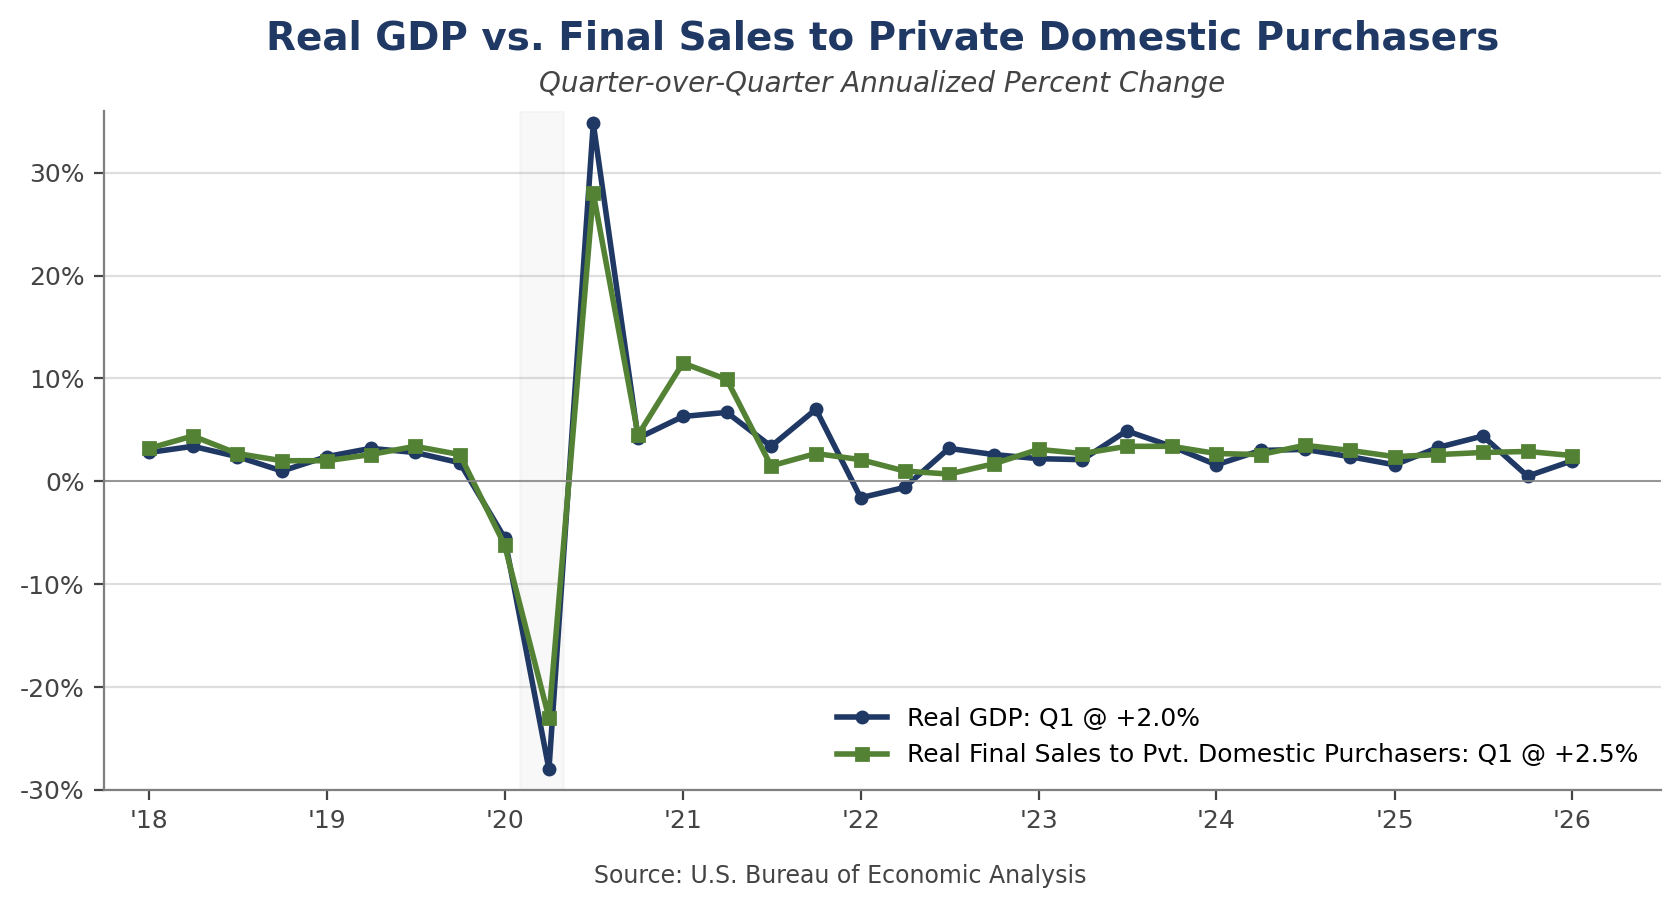
That makes the 2.0% print, in our view, a thoroughly reassuring report. The composition is cleaner than the headline. Real final sales to private domestic purchasers — the sum of consumer spending and gross private fixed investment, and our preferred read on the underlying pace of demand — rose 2.5% in Q1 after a 2.9% gain in Q4. That is consistent with the trend that has held since mid-2023 and suggests the private-sector economy is still expanding at a pace just above 2.5%, even as inventories and net trade introduced their usual quarter-to-quarter noise into the headline.
The 2.5% gain in real final sales to private domestic purchasers is the cleaner read on the underlying pace of demand.
Composition: Where the Growth Came From
The standout strength was business investment. Nonresidential fixed investment surged at a 10.4% annualized pace in Q1, contributing 1.4 percentage points to GDP growth. Equipment spending led the gain, with information processing equipment driving the bulk of the increase. The surge in equipment purchases likely reflects the buildout of AI, as well as efforts to reshore production in semiconductors, pharmaceuticals, and advanced manufacturing. Software prices declined sharply in the quarter, which mechanically boosted real software investment, but the underlying capex story is real. Capital deepening, particularly tied to AI infrastructure, is becoming the most durable feature of this expansion.
Government spending added 0.8 percentage points to GDP growth, primarily reflecting a partial rebound in federal nondefense outlays from the Q4 shutdown drag. The bounce was smaller than expected — federal spending in Q1 remained more than 2% below its mid-2025 level — and the recovery from the shutdown is likely to extend into Q2. Inventory accumulation contributed 0.4 percentage points, less than many had penciled in heading into the print. Net exports subtracted 1.3 percentage points, with imports of AI-related electronics rising sharply ahead of the resolution of certain tariff disputes earlier in the year.
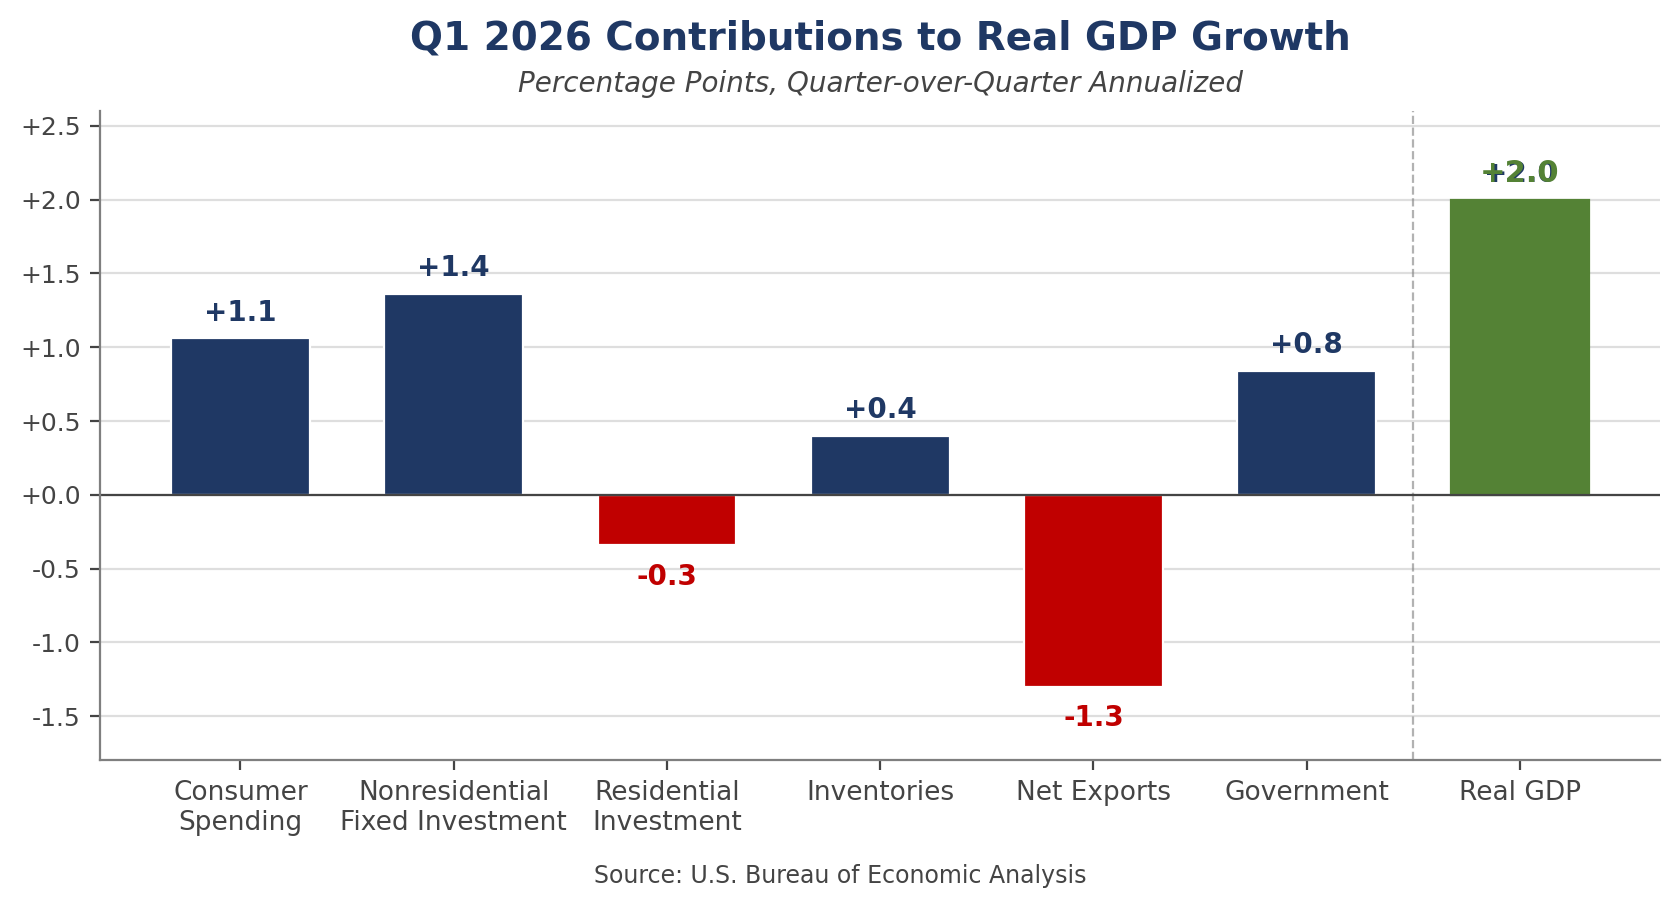
Residential investment fell at an 8% annualized rate, consistent with the declining volume of homes and apartments under construction, as well as the slide in Q1 starts and permits that we wrote about yesterday. The slide in home building has not ended, but the pace of deterioration is moderating.
Labor Market: Confirmation From the High-Frequency Data
If the headline GDP number invites a debate about whether the underlying expansion is durable, this morning’s labor market data settle that debate decisively in favor of the bulls. Initial jobless claims fell to 189,000 in the week ending April 25, down 26,000 from the prior week and well below expectations. The four-week moving average dropped to 208,000, the lowest reading in months. Continuing claims declined to 1.785 million.
The week’s print was flattered by a meaningful decline in New York claims that more than reversed a spike the prior week, likely a seasonal-adjustment artifact tied to spring break timing. Even adjusting for that, the broader trend in claims is consistent with a labor market that has stopped weakening and may even be firming a touch. That is a meaningful piece of corroborating evidence. When jobless claims, which arrive weekly and require no seasonal-adjustment heroics from the BEA, line up with what real final sales to private domestic purchasers are saying about the underlying pace of demand, the case for the resiliency narrative is much stronger than the GDP headline alone would suggest. The claims data are confirming what the income side of the GDP report is telling us: businesses are not laying off workers at any meaningful rate, and the demand side of the economy continues to support employment.
The Employment Cost Index, the cleanest measure of labor cost pressures, rose 0.9% in Q1, a tenth above expectations and an acceleration from the 0.7% pace in Q4. Wages and salaries rose 0.8%; benefits costs rose 1.2%, the strongest quarterly gain in some time. The benefits component is volatile quarter to quarter, but the trend is worth thinking about. Slower voluntary turnover is likely a meaningful contributor. When fewer workers quit for new jobs, employers carry more of the long-tenured workforce, and benefit costs — which are heavily seniority- and tenure-weighted, particularly for health insurance and retirement contributions — naturally rise. The same dynamic that is pushing benefits costs higher is also reducing training and onboarding costs and, plausibly, supporting productivity growth. That second-order effect deserves more attention.
The Consumer: Goods Held Up, Services Moderated
Personal consumption rose at a 1.6% annual rate in Q1, a step down from the 1.9% pace in Q4. The aggregate number is solid given the headwinds, but the composition is what matters. Goods spending held up, helped by a strong March print that reflected the warmer weather, tax refunds running roughly 17% above last year’s pace, and some pull-forward of big-ticket purchases ahead of further price increases. Services spending, by contrast, has clearly moderated. The early read is that higher gasoline prices, which have averaged above $4 per gallon since the war began, are doing what they typically do — pulling discretionary dollars away from things like restaurants, travel, and other away-from-home activities.
Households appear to be staying in a little more, dining out a little less, and trading down within the categories where they continue to spend. That pattern is a familiar response to an energy shock, and it tends to persist for several quarters after the initial price impulse. Real disposable income rose just 0.2% in March, with most of the headline gain in personal income reflecting payments under the Farmer Bridge Assistance program rather than broad-based wage gains. The personal saving rate fell to 3.6%, the lowest since 2022, which means consumers are saving incrementally less of every dollar earned. At the micro level, middle-income and lower-middle-income households are likely dipping into savings to support spending. That is not sustainable indefinitely, but with the labor market firm and tax refunds still flowing, it is sustainable for now.
Inflation: Energy Doing the Work
The PCE price data released alongside GDP showed headline PCE up 0.66% month-over-month and 3.50% year-over-year in March, reflecting a 12% monthly surge in energy prices. Core PCE rose a more measured 0.29% month-over-month and 3.20% year-over-year, which was no worse than expected. The Dallas Fed’s trimmed-mean PCE, which strips out the most volatile categories on either side of the distribution and is the cleanest filter on the FOMC’s preferred index, ran at an estimated 2.4% year-over-year in March.
The underlying disinflation story remains intact. Core goods prices have firmed somewhat, partly reflecting the AI-related demand pulse for electronics and partly the early pass-through from higher fuel costs into transportation and freight. Core services inflation continues to moderate as housing services finally cool meaningfully. The Fed will look through the headline energy spike, as it should. The harder question is whether the war-related cost impulse begins to lodge itself in core categories during the second half. So far, the trimmed-mean evidence says no, but the next two PCE prints will be closely scrutinized.
Outlook: Q2 Held at 2.8%
We continue to look for Q2 real GDP growth at 2.8%, unchanged from our prior forecast. The composition shifts modestly. Base effects and tax refunds are expected to pull consumer spending up at a 2.2% pace, with most of that gain concentrated at the start of the quarter as refunds fade after Memorial Day. Real final sales to private domestic purchasers should rebound back above a 3% pace, as capital spending remains strong and housing stabilizes somewhat. Several of the Q1 drags reverse: net trade improves as the tariff-related import surge fades and U.S. petroleum exports rise on the Hormuz disruption; inventories rebuild after the smaller-than-expected Q1 contribution; and government spending continues its catch-up from the shutdown.
The risks remain skewed to the downside, but less than they did a month ago. The war is the dominant variable. A negotiated reopening of the Strait of Hormuz by late May or early June would bring Brent back toward $90 over the summer and remove the principal headwind on services consumption. A breakdown in those talks would push Brent toward $120 or higher and meaningfully cut into Q3 growth. The labor market and underlying business investment, particularly in AI infrastructure, look durable enough to absorb a moderate energy shock without breaking. They would not absorb a severe one easily.
Implications
The expansion is more durable than the headline suggests, and the labor market confirms it. Real final sales to private domestic purchasers rose 2.5% in Q1, in line with the underlying trend. Initial jobless claims at 189,000 — the lowest in months — corroborate that signal. The economy can absorb a moderate energy shock and a brutal February without rolling over, and the AI-related capex cycle is showing no signs of fading.
The consumer slowdown is visible in services. Goods spending is holding up, supported by tax refunds and some pull-forward demand. Services spending, particularly in the away-from-home discretionary categories — restaurants, travel, recreation — has clearly moderated. Watch the May and June numbers for confirmation. If gasoline stays above $4 per gallon into the summer driving season, the services drag will broaden.
The Fed remains on hold through summer. The 2.0% growth print, the firm labor market, and the slight acceleration in the ECI on benefits all argue against any near-term move. A September cut is still our base case, but the bar is higher than it was a quarter ago. Headline inflation will run hot through Q2 on the energy pass-through, and the FOMC will want to see that the underlying trimmed-mean trend remains contained before easing.
Slower voluntary turnover is a quiet productivity tailwind. It boosts benefit costs visible in the ECI, but it also reduces training and onboarding costs and allows longer-tenured workers to compound their experience. That tradeoff probably nets positive for productivity in 2026, even if it is not yet showing up in the headline labor compensation data.
Bottom Line
The Q1 GDP report is best read as a reassuring sign that the U.S. economy can weather a meaningful energy shock and a difficult winter. Past oil shocks have tripped up the economy with surprising regularity; this one, so far, has not. A 2.0% headline print after a brutal February, a largely unforeseen oil shock, and a residual government shutdown drag is a more durable result than the headline alone suggests. Real final sales to private domestic purchasers rose 2.5%, consistent with the trend that has held since mid-2023, and business investment surged on the AI buildout. The labor market is firm — initial claims at 189,000 are the lowest in months — and the underlying disinflation story remains intact. The consumer is moderating, with services bearing the brunt of higher gasoline prices, but moderation is not weakness.
We continue to look for Q2 growth at 2.8%, with the composition shifting toward inventories and net trade and away from the consumer. The Fed remains on hold through summer. A September rate cut remains our base case, but headline inflation running above 3% in the near term will keep the FOMC patient. The expansion is intact. The questions are about pace, not direction.

March Housing Starts Surge as Builders Make Up for a Brutal February; Permits Tell a Softer Story
March Housing Starts Surge as Builders Make Up for a Brutal February; Permits Tell a Softer Story
Single-family construction surged to a 13-month high as builders made up for ground lost during a brutal February. The bigger story is in permits, where the trend is unmistakably softer.
| Indicator (SAAR, 000s) | March 2026 | February 2026 | Change |
|---|---|---|---|
| Total Housing Starts | 1,502 | 1,356 | +10.8% |
| Single-Family Starts | 1,032 | 941 | +9.7% |
| Multi-Family Starts (5+) | 446 | 407 | +9.6% |
| Total Building Permits | 1,372 | 1,538 | −10.8% |
| Single-Family Permits | 895 | 930 | −3.8% |
| Multi-Family Permits (5+) | 427 | 544 | −21.5% |
| Total Completions | 1,366 | 1,364 | +0.1% |
Headline Print
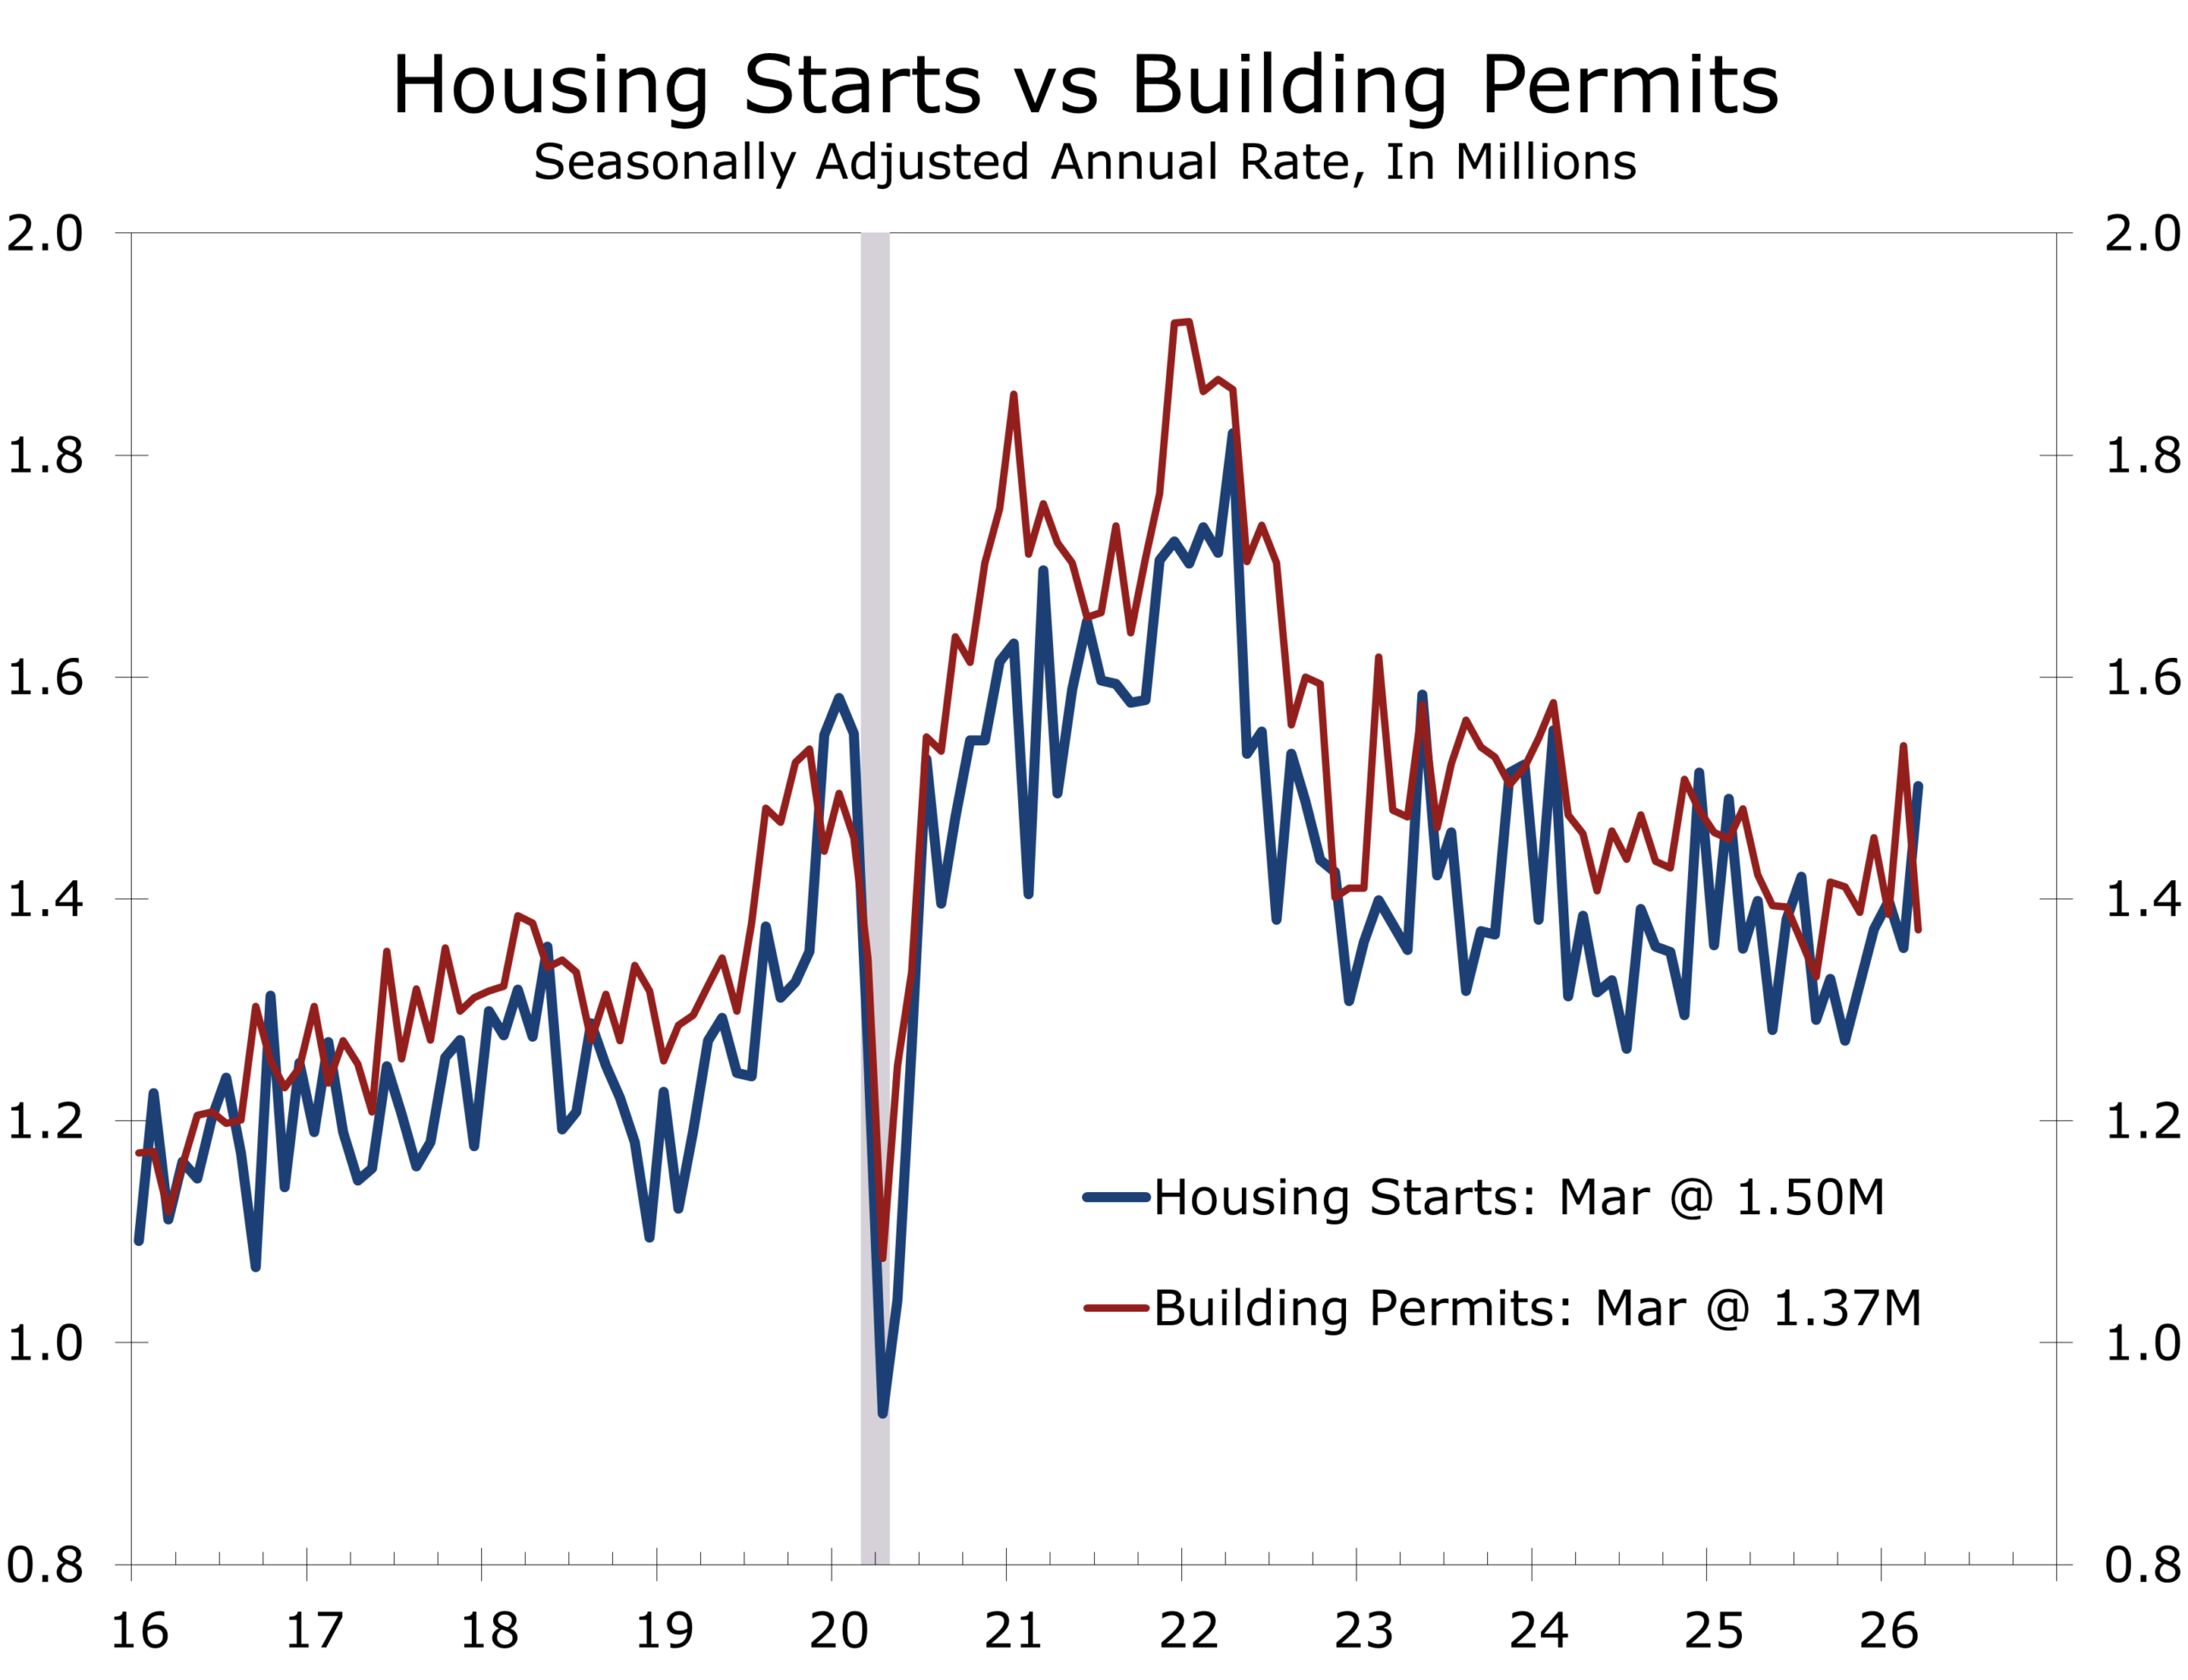
Privately-owned housing starts climbed 10.8% to a seasonally adjusted annual rate of 1.502 million in March, the strongest reading in fifteen months and well above the 1.40 million consensus. The Census Bureau released February data with this report, originally scheduled for March 17 but delayed alongside the March release as part of the Bureau’s adjusted indicator calendar following the recent lapse in federal funding. February starts came in at 1.356 million, with January revised down to 1.398 million from 1.487 million originally reported.
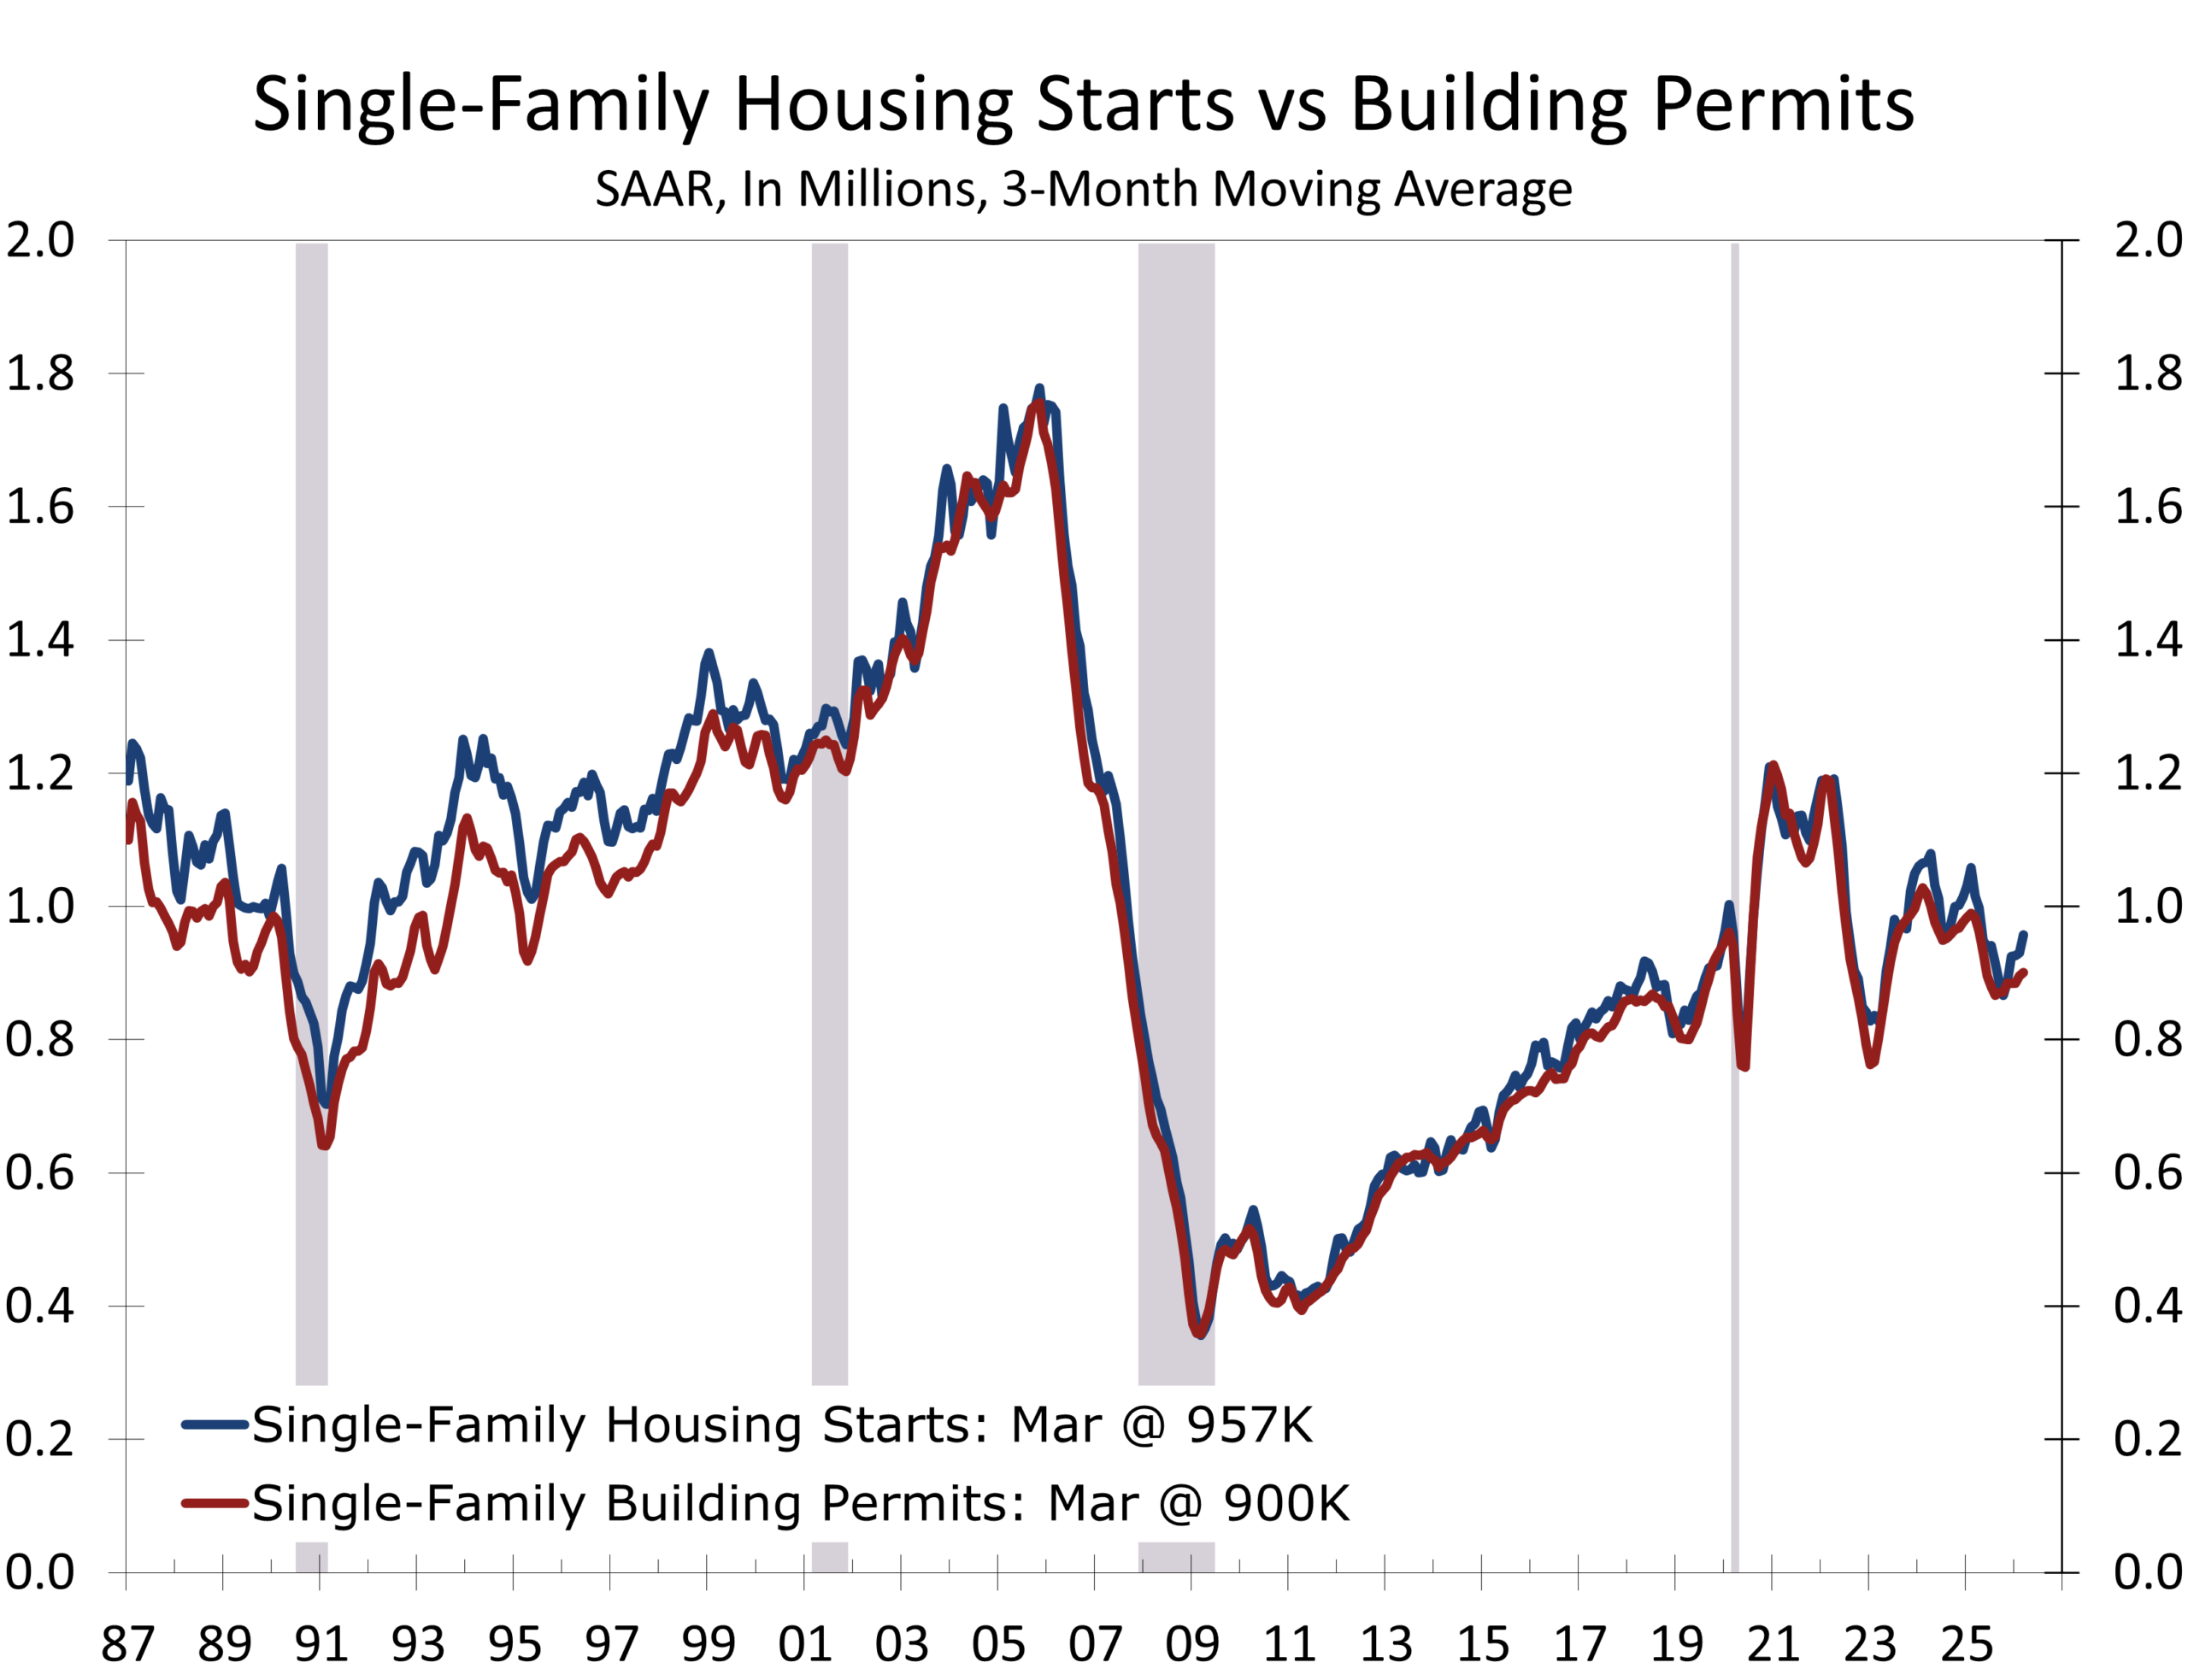
Single-family starts surged 9.7% to 1.032 million, the highest pace since February 2025. Multi-family starts in buildings with five or more units rose 9.6% to 446,000. The advance was broad-based regionally — the Northeast jumped 24.8%, the Midwest rose 12.2%, the South — which is by far the largest region — advanced 9.1%, and the West gained 7.2%.
The headline gain is real, but most of it reflects payback from a weather-impaired February. The polar-vortex collapse in mid-February, the late-month Northeast blizzard that dropped one to three feet of snow from Philadelphia to Boston, and a string of cold-air outbreaks that pushed snow as far south as the Carolinas, Texas, and Florida sidelined construction across much of the country. By contrast, March brought near-ideal building conditions across most of the South and Mountain West, regions that account for well more than half of national single-family activity. The pattern of the rebound, with the strongest gains in the regions hit hardest in February, is the giveaway.
The cleaner way to read the underlying pace is to look through the weather noise. Combined Q1 starts averaged 1.42 million SAAR, above the 1.35 million we had been tracking but only modestly so. For the Q1 GDP residential investment line specifically, the level of homes already under construction during the quarter matters more than the rate at which new units broke ground in March, since the bulk of construction spending occurs three to five months after groundbreaking. The starts surge therefore matters more for Q2 and Q3 spending than for Q1. With units under construction at 1.264 million — gradually drifting lower — Q1 residential investment is on track to decline at roughly a 0.5% annualized pace, in line with our prior forecast. The Q1 starts average lends only modest upside risk to that estimate.
March’s strong starts print is a payback from a weather-disrupted February — not a turning point in the housing cycle.
Builder Sentiment: A Step Lower
The April NAHB/Wells Fargo Housing Market Index fell four points to 34; the lowest reading since September 2025 and a meaningful step down from the early-2026 hopes that the sector was stabilizing. All three sub-indices declined: current sales conditions fell to 37, future sales dropped seven points to 42, and prospective buyer traffic eased three points to 22.
Two factors are weighing on builders. First, the war with Iran has driven oil prices higher and pushed up the cost of nearly everything that arrives at a job site by truck. Sixty-two percent of builders reported their suppliers had raised material costs because of higher fuel prices, and energy inputs account for roughly 4% of residential construction costs. Seventy percent of builders said they were having trouble pricing homes given the uncertainty around materials. Second, mortgage rates, while off the post-war peak, remain elevated. The retracement has gotten about halfway back toward pre-war levels, but with inflation set to run higher for longer and the FOMC almost certainly on hold through mid-year, further declines are unlikely in the near term.
Builder concessions remain a defining feature of this cycle. Thirty-six percent of builders cut prices in April, with an average reduction of 5%, and 60% offered some form of sales incentive; the 13th consecutive month at or above that threshold. Affordability is being delivered through builder margin compression rather than through lower mortgage rates or lower asking prices, and that is not a model that scales easily as input costs rise.
Regional Picture: The Sunbelt Bent but Did Not Break
On a year-to-date basis, combined single- and multi-family starts are 36% higher in the Northeast, 7.8% higher in the Midwest, 3% higher in the South, and 15.5% lower in the West. The South’s modest YTD gain understates the underlying picture in much of the Carolinas, Georgia, Florida, Texas, and the broader Sunbelt, where continued strong in-migration and resilient job growth, particularly in Texas and the Carolinas, continue to support demand even as price reductions and incentives have become standard. The Midwest has been the only region to post positive year-over-year single-family starts growth on a sustained basis, a notable reversal of the past several years’ Sunbelt-led pattern.
On the permit side, the year-to-date data are softer: permits are up 15.4% in the Northeast (the smallest new home market) and 1.1% in the Midwest, but down 9.1% in the South and up only 6% in the West. The South’s permit weakness is the data point worth watching most closely. Inventories remain high throughout the region and Florida’s economy has slowed in a major way. The South accounts for roughly 55% of national single-family construction, and a sustained pullback in Southern permitting would mean more for the national pace than gains elsewhere can offset. We do not yet treat the Southern slowdown as a trend break, but it warrants close attention through the spring.
Inventory Dynamics and the Path Ahead
There are now 587,000 single-family units under construction and 677,000 multi-family units — a combined 1.264 million, which is 451,000 below the October 2022 peak but still modestly elevated compared with the 1.1 to 1.2 million range typical of the three years preceding the pandemic. Composition matters more than the level. Builders are now completing slightly more single-family homes than they are starting on a 12-month basis, gradually working down the inventory of unsold completed homes. On the multi-family side, completions have been running ahead of starts for several quarters, and that trend will persist into 2027.
For starts to improve on a sustained basis from here, builders need to continue working through their inventory of completed but unsold homes, and the affordability picture needs to improve. There are only a few ways to accomplish that: lower mortgage rates, slower price appreciation, faster wage growth, or some combination of the three. None of those is likely to deliver decisively this year. Mortgage rates appear range-bound while the Fed waits for inflation to cool. Builder margins have already absorbed about as much price reduction as the math supports. Wage growth is solid but no longer accelerating.
Implications
Q1 GDP tracking modestly higher. The stronger-than-expected March single-family starts, alongside the upward revision to February, lend slight upside risk to residential investment in the Q1 print. We continue to expect real residential investment to decline at roughly a 0.5% annualized pace, with the upside risk concentrated in inventory accumulation rather than the headline.
April starts will give some of March’s gain back. The permits read points to a pullback, and seasonal patterns suggest the South and Sunbelt’s March outperformance will normalize. We would not be surprised by a starts print in the 1.35 to 1.40 million range for April.
Multi-family deserves separate attention. Completions are running ahead of starts on a 12-month basis, the apartment pipeline is being drawn down, and the April permits reading was particularly weak. The apartment construction cycle has moved past its peak. New supply will continue to arrive through 2026, which will keep effective rents in check, but the supply tap will be much smaller in 2027 and 2028. That sets up favorable rent dynamics in apartment markets with steady demand, including across much of the Carolinas, Georgia, and Florida.
Bottom Line
March’s strong starts print is best understood as a snapback from a weather-impaired February that was amplified by seasonal adjustment rather than as a signal that the housing market has turned the corner. The three-month Q1 average of 1.42 million is a more honest read of the underlying pace, and that pace is consistent with residential investment subtracting modestly from Q1 GDP rather than contributing to it.
Permits, builder sentiment, and the affordability arithmetic all argue against extrapolating March’s strength into the spring. The April permits read suggests starts will pull back. We do not look for a sustained recovery in housing activity until either mortgage rates move materially lower or the inventory of completed unsold homes comes down further, and neither is likely to happen quickly. The cycle has not turned. The deterioration in starts has merely stabilized.
Confidence Holds Its Ground as Middle East War Pressures Prices and Rebound in Equities Cushions Sentiment

Confidence Holds Its Ground as Middle East War Pressures Prices and Rebound in Equities Cushions Sentiment
Mark P. Vitner, Chief Economist | mark.vitner@piedmontcrescentcapital.com · April 28, 2026
| Indicator | April 2026 | March 2026 | Change |
|---|---|---|---|
| Consumer Confidence Index | 92.8 | 92.2 | +0.6 |
| Present Situation | 123.8 | 124.1 | −0.3 |
| Expectations | 72.2 | 71.0 | +1.2 |
| Labor Market Differential | +7.5% | +6.1% | +1.4 ppt |
| Jobs “Plentiful” | 27.3% | 27.4% | −0.1 ppt |
| Jobs “Hard to Get” | 19.8% | 21.3% | −1.5 ppt |
| 12-Mo. Inflation Expectations | 6.1% | 6.2% | −0.1 ppt |
Headline Print
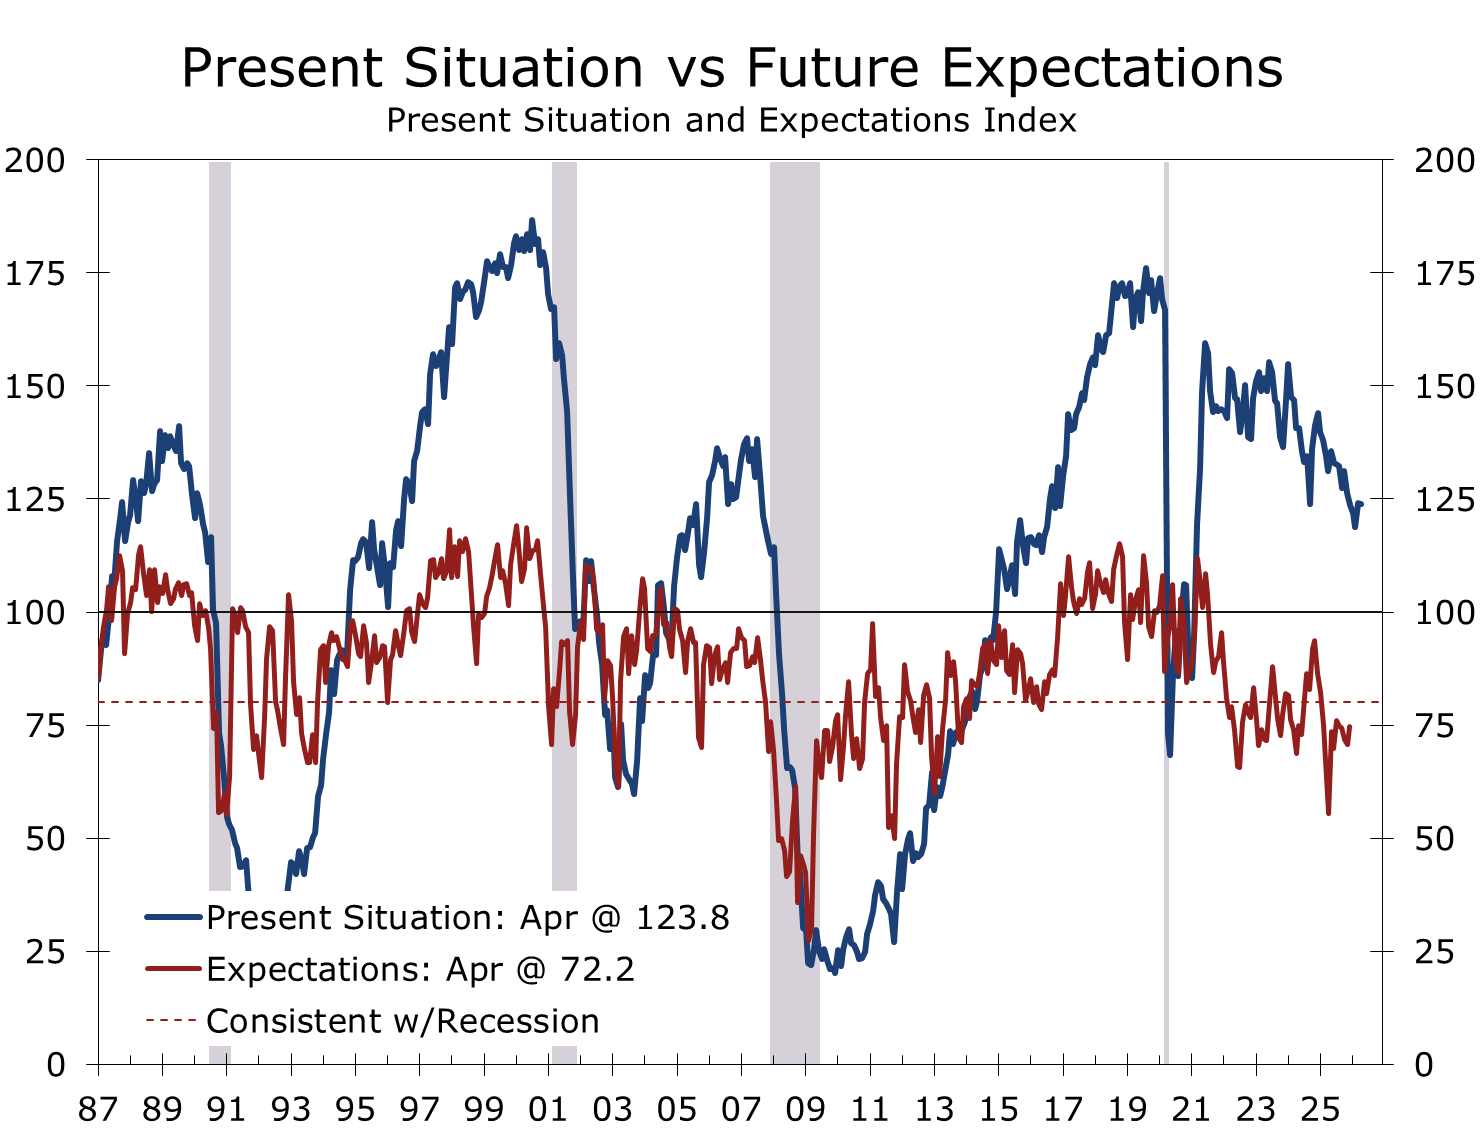
The Conference Board Consumer Confidence Index® rose 0.6 points to 92.8 in April, with March revised up to 92.2 from 91.8 originally reported. The result topped the Bloomberg consensus of 89.0 and represented the third straight monthly gain following the early-2026 trough. The improvement was driven by the forward-looking Expectations Index, which climbed 1.2 points to 72.2, while the Present Situation Index slipped 0.3 points to 123.8 on softer assessments of current business conditions.
Expectations remain below the 80-point recession threshold for the fifteenth consecutive month, but the trajectory has clearly shifted. After bottoming earlier this year amid heightened geopolitical uncertainty, the index has now retraced a meaningful share of its decline. The survey window (April 1–22) captured both the two-week ceasefire that began on April 8 and the equity rebound that followed, and consumers responded in kind. The ceasefire has done more for hope than for hard data, and consumers appear to be reading the situation accurately—willing to mark up forward-looking expectations while keeping their assessment of present conditions anchored.
Confidence has now risen for three straight months, with the labor differential climbing to its highest level since December.
Two Surveys, Two Stories
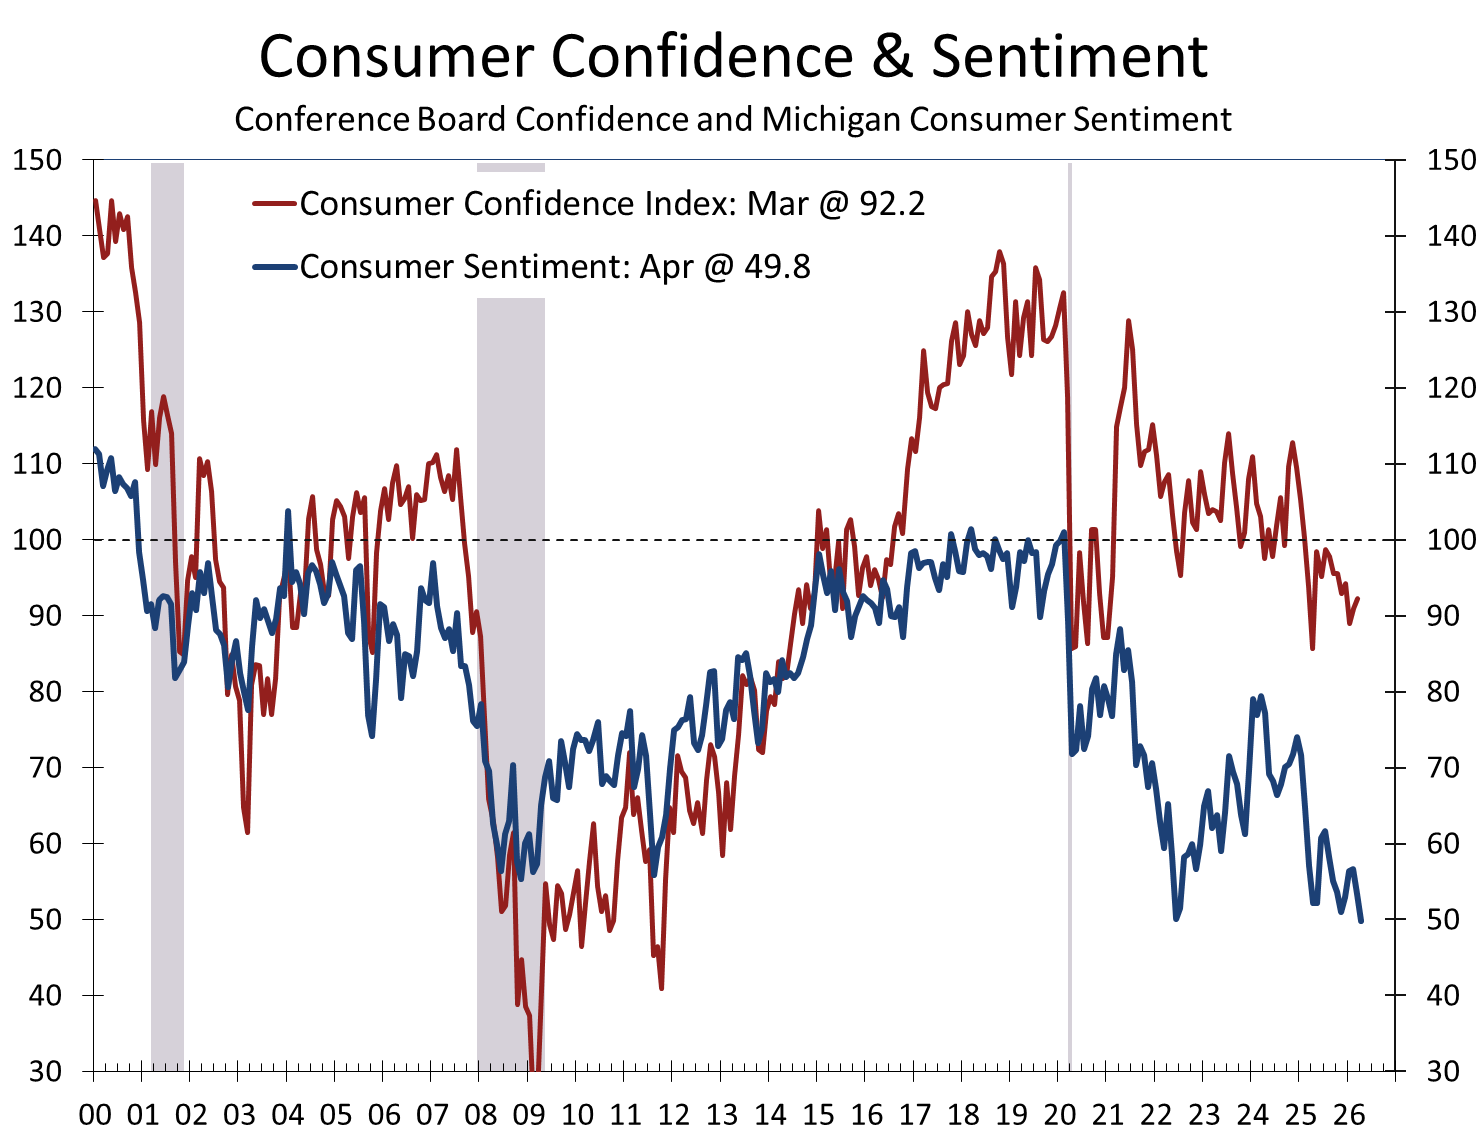
April's Conference Board print stands in stark contrast to the University of Michigan's Survey of Consumers, which fell to 49.8—the lowest reading on record in data going back to 1952, and below the prior 50.0 trough set in June 2022. The divergence is mostly methodological. Michigan leans heavily on inflation expectations and personal finances—both rattled by the surge in gasoline prices, with Michigan's year-ahead inflation expectation jumping from 3.8% to 4.7% in April. The Conference Board weights labor-market conditions more heavily, and labor has been firming. Survey timing played a smaller supporting role: Michigan's preliminary reading of 47.6 was largely completed before the April 7 ceasefire announcement (Hsu noted 98% of those interviews predated it), and although the final reading's interview window extended through April 20 and incorporated a modest post-ceasefire bounce, sentiment still hit a record low. We continue to weight the Conference Board index more heavily for forecasting consumer spending; its labor-market sensitivity has historically tracked actual outlays more reliably than Michigan's inflation-driven swings. The honest read is that consumers are simultaneously alarmed about the price level and reassured by the job market. Both can be true. The spending data will adjudicate.
Labor Market: A Quiet Strengthening
The labor market differential—the share of consumers saying jobs are plentiful minus those saying jobs are hard to get—rose 1.4 points to +7.5%, its highest reading since December 2025. The improvement was driven almost entirely by the “hard to get” share, which fell to 19.8% from 21.3%. The “plentiful” share was essentially flat at 27.3%. With voluntary quits still running below pre-pandemic norms, our read is that workers see fewer attractive outside options—a labor market that is firm at the surface but with diminishing churn underneath.
This is a constructive signal. The labor differential typically moves in step with the unemployment rate, and a rebound here is consistent with a stabilization rather than further deterioration in hiring conditions. Forward-looking labor market views also improved, with 16.1% of consumers expecting more jobs available six months from now (up from 15.4%) and the share expecting fewer jobs falling to 26.9%. Net income expectations turned slightly more positive as well, with the “declining income” cohort dropping to 12.3%.
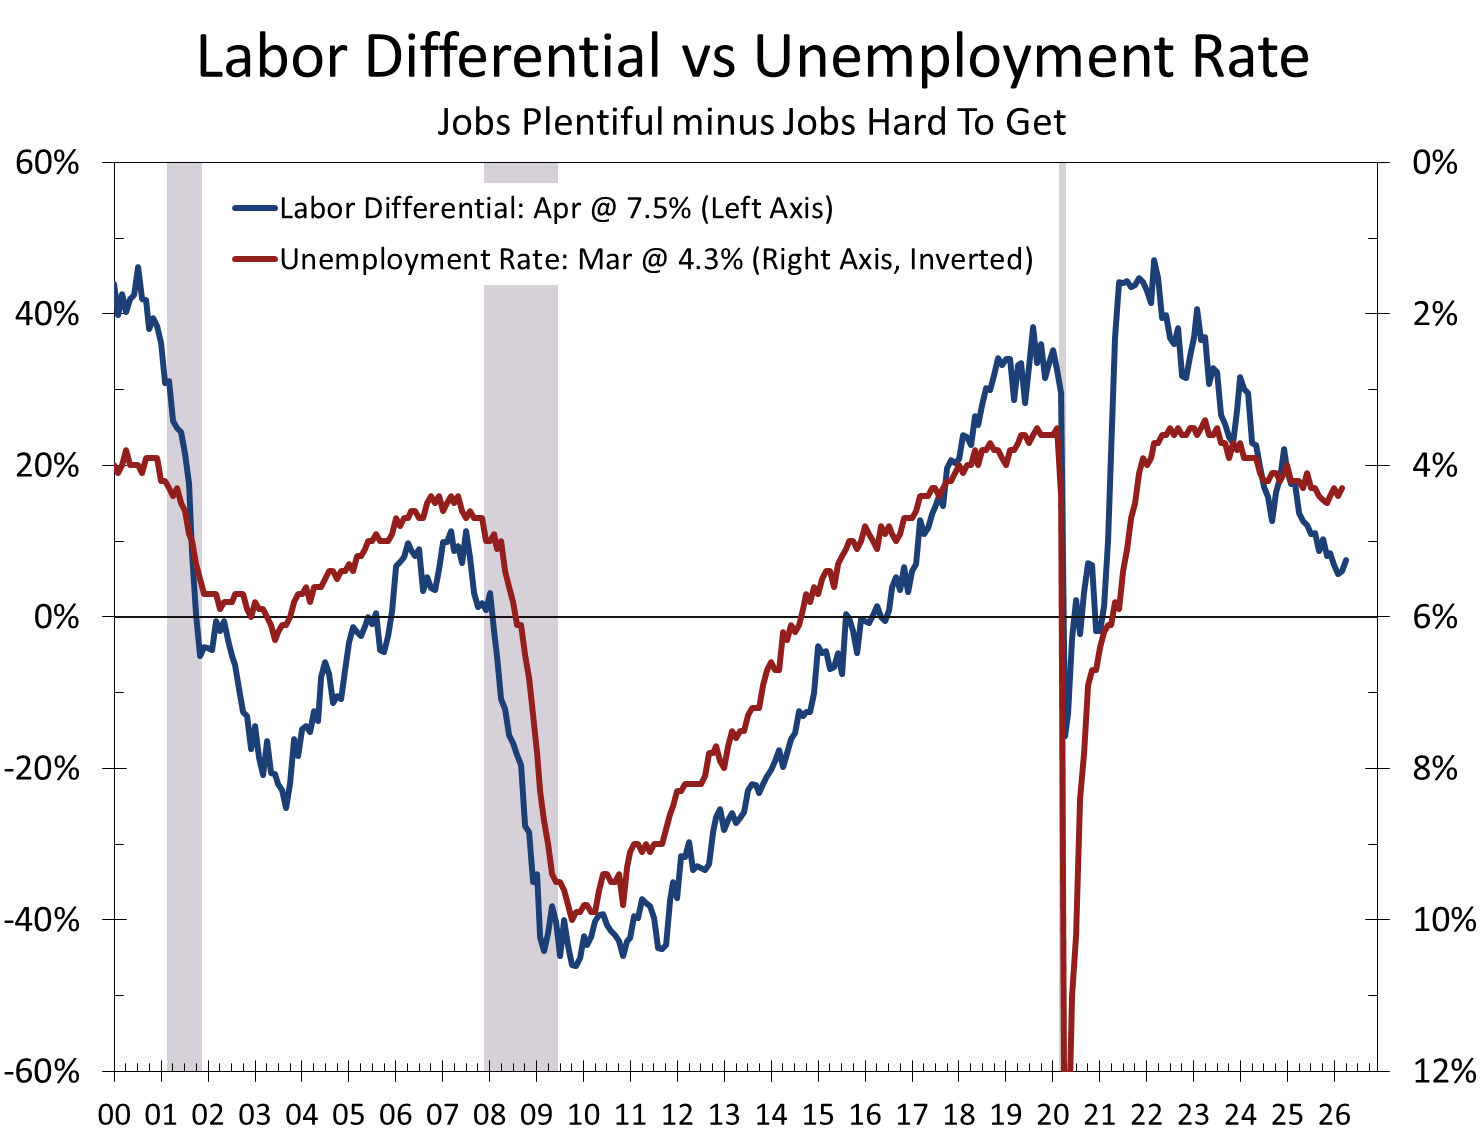
We continue to expect the unemployment rate to drift modestly higher into mid-year as labor demand softens, but the pace of any rise should be cushioned by slower labor-force growth. Today's report supports that view.
Inflation Expectations: Still Elevated, But Stable
Twelve-month inflation expectations ticked down to 6.1% from 6.2% in March, which had been the highest reading since May 2025. The recent run-up reflects the surge in Brent crude prices that followed the escalation of Middle East hostilities, which has lifted retail gasoline prices to roughly 30% above year-ago levels. Stabilization in pump prices during the April survey window appears to have arrested the upward drift in expectations, though the level remains well above the pre-conflict baseline near 5.5%.
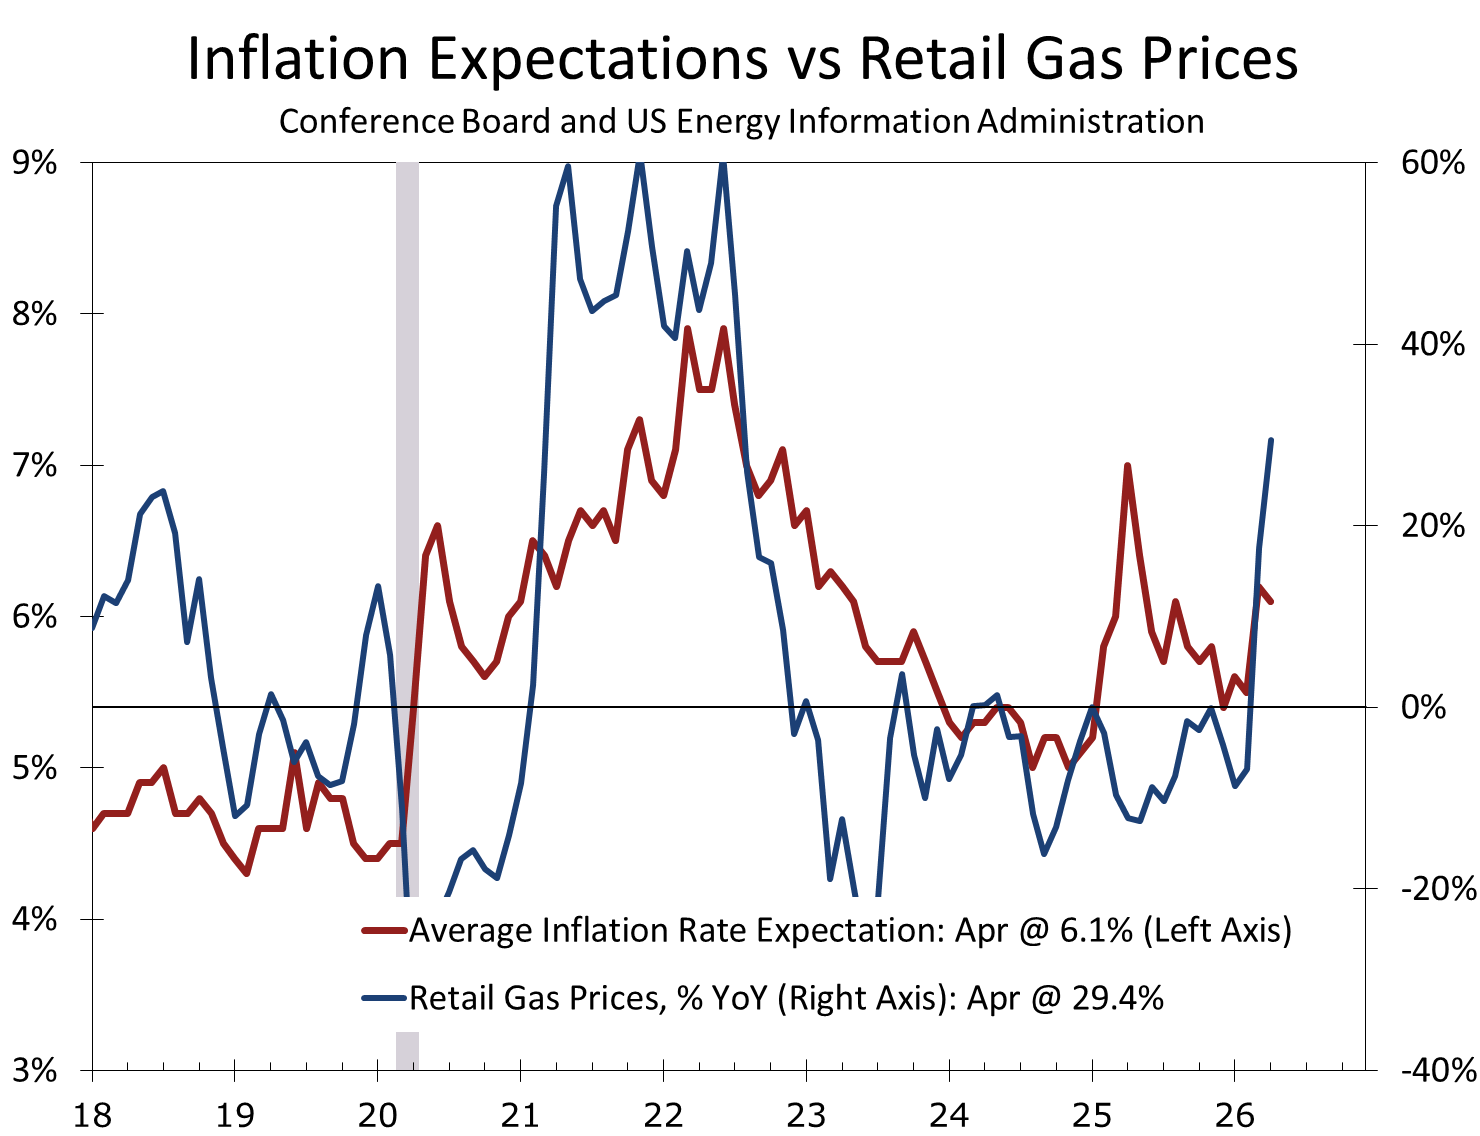
The composition of consumer write-in responses tells the same story. References to prices, oil and gasoline, and the Middle East conflict rose in frequency from March. These remain the dominant household concerns, but their salience appears to have plateaued rather than intensified. The share of consumers expecting interest rates to be higher 12 months from now climbed to nearly 50%, a reflection of the lingering inflation overhang.
Buying Intentions: Selective, Not Defensive
Plans to purchase big-ticket items softened on a month-over-month basis in April, with the share of consumers saying “no” rising relative to “yes” and “maybe” responses. However, the proportion answering “yes” remains comfortably above the other categories, and the more reliable six-month moving averages tell a different story. On that basis, auto-buying plans continued to rise, homebuying intentions for both new and existing units staged a mild recovery, and plans for furniture, appliances, and electronics improved further. Used cars remain the clear preference over new in the auto category, and existing homes—a far larger market—continue to lead new construction.
Services spending plans painted a more cautious picture. Anticipated outlays fell across nearly every category in April, with pet care the lone exception. Restaurants, beauty and personal care, and streaming retained the top spots, but the displacement of personal travel by utilities and healthcare in the top-five future spending list points to a household that is prioritizing the necessary over the discretionary. Domestic travel intentions have largely tracked sideways through the first four months of the year, while foreign travel partially recovered in April after a Q1 collapse.
The pattern is consistent with what we have called “cheap thrills” spending: consumers continue to participate in the economy, but they are increasingly drawn to lower-cost goods and essential services. Energy price spikes have historically prompted trade-down behavior even within higher-margin discretionary categories—beer, soft drinks, snacks—and that channel bears watching as long as pump prices remain elevated. This is a more measured posture than outright retrenchment, and it explains why goods consumption has held up better than many forecasts anticipated even as services growth moderates.
Demographics & Cross-Currents
On a six-month moving average basis, confidence improved among Millennials and Gen Z while continuing to soften among older cohorts. Respondents under 35 remain the most optimistic and those 55 and over the least—a pattern that has held for several months and is largely a function of what the Conference Board survey measures. The CCI weights labor-market conditions heavily, and younger workers have benefited disproportionately from wage growth concentrated at the bottom and middle of the distribution. Older cohorts, by contrast, are more exposed to the variables the index does not weight as heavily: the cumulative inflation hit to the price level, fixed-income returns that have lagged, and the equity volatility earlier this spring. By income, results were mixed but most groups expressed somewhat less optimism on a trend basis.
Confidence rose modestly among Democrats and held steady among Republicans, while Independents pulled back. The dispersion across political affiliations remains wide, and we continue to view the partisan gap as a noise factor that warrants caution when interpreting month-to-month moves in headline confidence.
Recession Perceptions and the Wealth Effect
The share of consumers describing a US recession over the next 12 months as “very likely” rose again in April, while “somewhat likely” and “not likely” responses fell. The cohort believing the US is already in recession edged higher. These measures are not part of the headline index calculation, but worth watching: they have historically led the headline by several months at cyclical inflection points.
Offsetting that caution, the equity rebound during the survey window appears to have provided a meaningful lift to perceived household financial conditions. Expectations for higher stock prices a year from now ticked up. The S&P 500 has recovered fully from its roughly 9% drawdown earlier this spring and pushed to new all-time highs in April, neutralizing the negative wealth effect that had been weighing on high-income household sentiment in the first quarter.
Bottom Line
April's report reinforces a constructive read on the consumer. The third straight monthly gain in headline confidence, the firming labor differential, and the stabilization in inflation expectations all point to a household sector that is absorbing the geopolitical and price shocks of recent months without breaking. The contrast with Michigan's record-low sentiment is best understood as a story about survey timing and methodology, not as evidence the consumer is on the brink.
Risks remain—expectations are still below 80, recession concerns are drifting higher, and energy prices will hinge on developments in the Middle East. But the data in hand suggest a consumer that is cautious rather than capitulating, and an expansion with more durability than the headlines often imply. We continue to expect real consumer spending to slow in 2026 from last year's pace, but to remain solidly in positive territory.

A View from the Piedmont: Hot Headline, Patient Core, and a Cleared Runway
A VIEW FROM THE PIEDMONT
Hot Headline, Patient Core, and a Cleared Runway at the Fed
Highlights of the Week
- Economic Pulse: Strong consumer in the data, weakening confidence in the surveys. The expansion is holding even as the war embeds itself in headline prices.
- Consumer: March retail sales beat expectations at +1.7% headline and +0.7% control group, the strongest since August. Tax refunds are doing real work.
- Inflation: Headline CPI jumped to 3.3% YoY on a 21% gasoline surge, but core CPI was 0.2% m/m and Cleveland median and trimmed-mean both ran 0.2%. The trend signal is intact.
- Markets: 10-yr at 4.31%, equities at all-time highs, Brent ~$104. Risk and rate markets disagree on the war's trajectory. Bonds look right.
- Geopolitics: Strait of Hormuz remains effectively closed. U.S. naval blockade of Iranian ports enters its third week. Talks collapsed Saturday after Iran's foreign minister left Islamabad; the ceasefire holds in name but both sides are still seizing vessels.
- Fed: DOJ dropped the Powell probe Friday; Tillis ended his block on Warsh Sunday. Senate Banking Committee votes Wednesday. Markets price ~8 bps of cuts through year-end. FOMC meets next week.
- CFO/Treasurer: Fixed-rate issuance window remains open but is no longer improving. Stress-test floating-rate exposure for a 10-year sustained at or above 4.30%.
Market Snapshot
- Brent Crude:
- ~$104 / bbl
- WTI:
- ~$95 / bbl
- 10-Yr Treasury:
- 4.31%
- 2-Yr Treasury:
- 3.78%
- Yield Curve (2s10s):
- +53 bps
- Gold:
- ~$4,722 / oz
- Fed Funds Target:
- 3.50–3.75%
- Next cut priced:
- ~8 bps priced through year-end
Hot Headline, Patient Core, and a Cleared Runway
"The spike in headline inflation is the noise. The underlying trend is the signal. The hard part is determining which price measure best reflects the trend." — Reflecting on Warsh's Senate testimony
This past week was light on key economic data but heavier on geopolitics and policy shifts. March retail sales surprised to the upside. Gasoline station receipts rose with pump prices, the same 21% gasoline surge captured in the March CPI report. Core retail sales jumped 0.7%, showing more resilience than expected and sending Q1 GDP forecasts higher. After testing lower levels, long-end Treasury yields held at 4.31%. On the policy front, the Justice Department dropped its criminal probe of Chair Powell, and the Strait of Hormuz remains effectively shut. The story is no longer about a Fed easing cycle. It is about whether the United States can keep its economy steady through an oil shock, an active naval blockade, and a leadership transition at the central bank.
Equities finished the week at record highs while bonds priced essentially no Fed cuts through year-end. The two markets are looking at the same set of inputs and arriving at materially different conclusions. Brent settled near $104 after touching highs above $109. Gold ended near $4,722, off about 3% on the week as the indefinite ceasefire extension softened the safe-haven bid. Retail gasoline is over $4 per gallon. Consumer sentiment hovers near record lows even as the hard data is coming in well ahead of expectations.
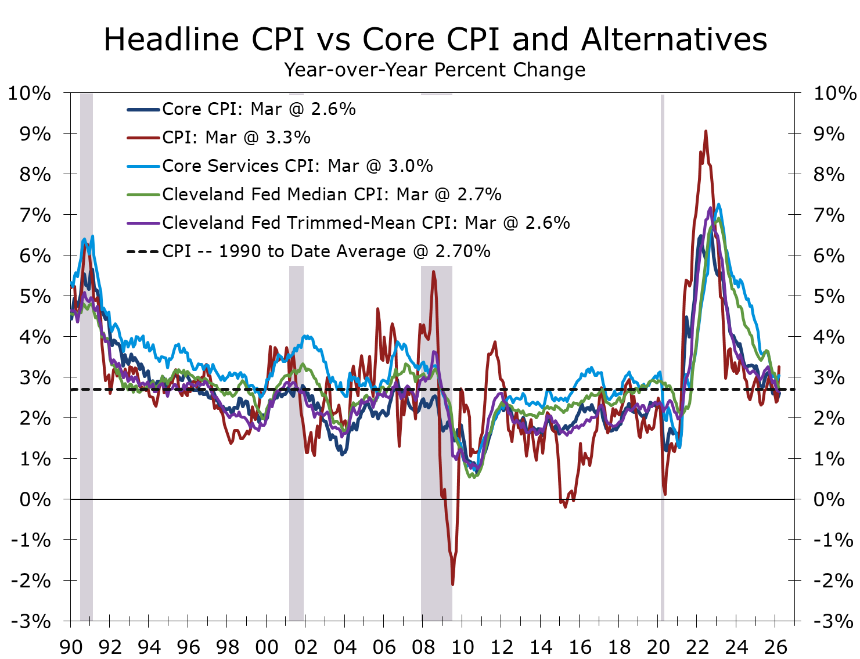
Source: BLS and Federal Reserve Bank of Cleveland
The Macro Backdrop
Retail sales for March came in well above expectations. Headline rose 1.7% versus the 1.4% consensus, and the control-group measure that feeds GDP rose 0.7%, the strongest since August. Tax refunds running roughly 17% above last year are doing meaningful work, offsetting the initial bite from higher gasoline prices. Nonstore retailers led the gain. Restaurants and bars eked out a small increase but have been roughly flat for the quarter, which bears watching as a discretionary-spending bellwether. The composite picture is a capital-led expansion with a steady consumer, slower hiring, and output that has held up better than sentiment.
The labor market has normalized rather than weakening further. The Beige Book described employment as flat to slightly up across most districts, with wages still in the modest-to-moderate range. Balance sheets are thinner than a year ago but not stretched. The forward question is whether the war-related inflation impulse begins to flow through to discretionary categories in Q2. So far, it has not. The University of Michigan sentiment index sits near a record low at 49.8, but the hard data has yet to roll over. That divergence is the central tension going into next week's Q1 GDP and PCE prints.
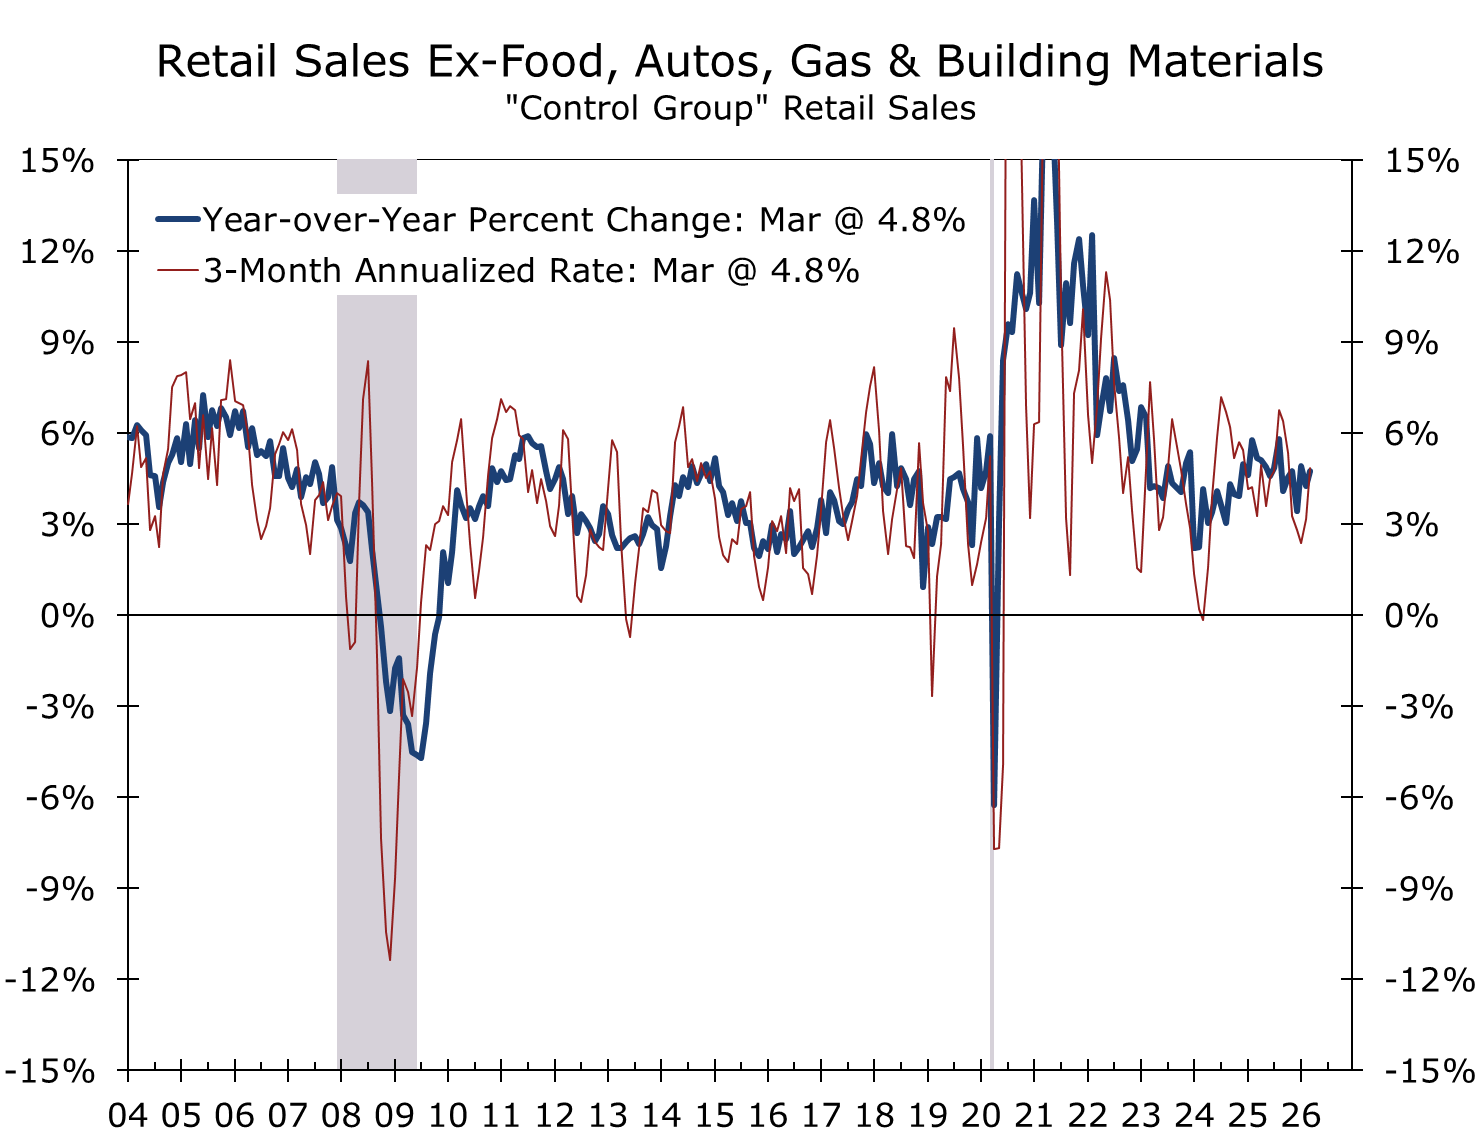
Source: U.S. Census Bureau
Geopolitics & Energy Markets
The geopolitical backdrop is no longer fluid. It is structurally hostile. Following the February 28 air war and the death of Supreme Leader Khamenei, Iran closed the Strait of Hormuz. The U.S. responded with a naval blockade of Iranian ports beginning April 13, now entering its third week. President Trump extended a fragile ceasefire on April 21 but talks collapsed Saturday when he called off sending Witkoff and Kushner to Pakistan after Iran's foreign minister left Islamabad. On Monday, Iran offered through Pakistani mediators to reopen the strait in exchange for the U.S. lifting its blockade and ending the war, with nuclear talks deferred to a later phase; Trump signaled the offer was unlikely to be accepted, telling Fox News "we have all the cards." The dueling blockades remain in place. Both sides are seizing commercial vessels. President Trump last week ordered the Navy to "shoot and kill" any Iranian boat caught laying mines in the strait. The IEA this week characterized the disruption as the largest energy supply shock on record.
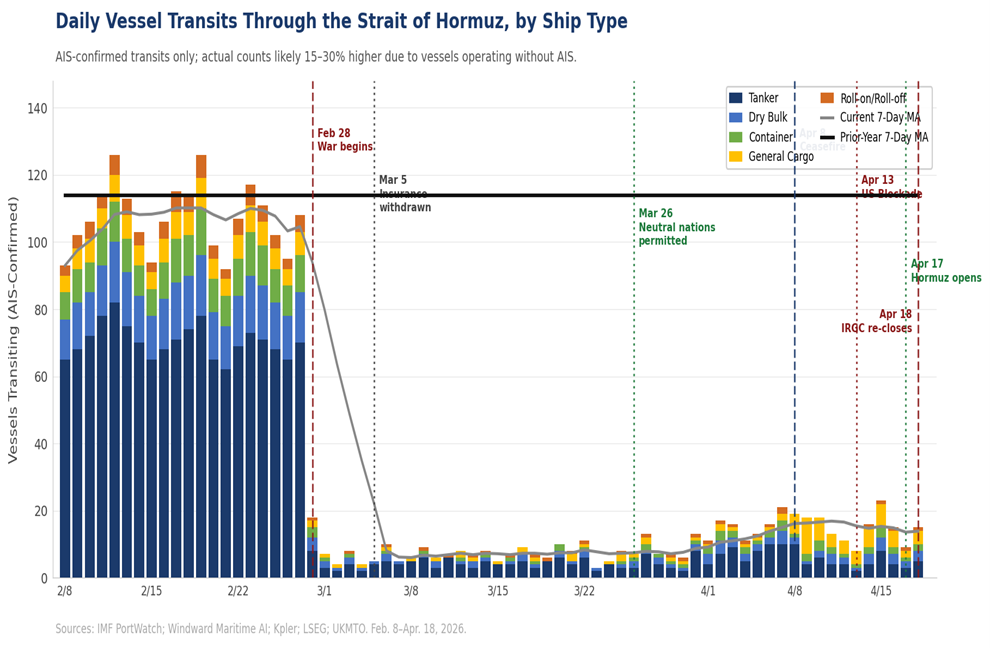
Roughly 20% of seaborne crude and LNG normally moves through Hormuz; current traffic is near zero. Brent traded near $104 by Friday on cautious ceasefire optimism but pushed back above $108 in Monday trading after the weekend talks collapsed, nearly 50% above pre-war levels. U.S. retail gasoline, which had been falling slightly, is back over $4 per gallon, compared to roughly $3 before the conflict. Consultancy and trader estimates put cumulative global oil draws since the start of the shock at 500 to 700 million barrels. Aviation reroutes have lengthened journey times across Europe-Asia corridors. Gulf Cooperation Council economies are under acute pressure, with Bahrain having required emergency UAE central-bank support earlier this month.
Supply-chain consequences extend beyond oil. Fertilizers, industrial gases, ammonia, and freight insurance are all exposed. War-risk premiums for Hormuz transits jumped from 0.125% to 0.2 to 0.4% of insured value before traffic stopped entirely. These pressures typically appear first in margins, then in prices, with a one-to-two quarter lag. The composition of the inventory picture matters more than the total. The U.S. is not short of crude in storage; it is increasingly tight in refined products, particularly diesel and middle distillates. Those are the bloodstream of freight, industry, agriculture, and aviation.
The supply-side math is starker than the headline price suggests. Consensus estimates put April global oil inventory draws at 11 to 12 million barrels per day, a record pace by a wide margin. Persian Gulf production losses are running near 14 to 15 million barrels per day. Most forecasters now project the global market swings from a small surplus in 2025 to a deficit of 8 to 10 million barrels per day in Q2, before any meaningful recovery in Gulf flows. Even in the most benign scenarios where the strait reopens by mid-June, global visible inventories are expected to reach the lowest level on record since satellite tracking began in 2018. The price one sees is the price after policy responses, sanctioned-oil releases, SPR draws, and demand destruction. Without those buffers, the price would be substantially higher.
The base case is that the ceasefire holds and a negotiated reopening of the strait eventually occurs. The risk case is escalation through miscalculation in a contested waterway with active blockades on both sides. Markets are priced closer to the base case than the risk case, particularly in equities. The Trump administration's incentive to lower energy costs ahead of the midterms argues for a path to de-escalation, but Iran's leverage from holding Hormuz is greatest precisely now. The window for a negotiated arrangement is real, but it is not wide. We expect the outlines of an agreement to come together by late May. The Memorial Day weekend marks the kickoff of the summer driving season and the unofficial start of summer in the U.S., and political pressure to ease retail gasoline prices will be at its peak. Nailing down the specifics will likely carry into June.
Europe remains the most exposed downstream economy. Qatar's LNG disruption has driven European benchmark gas prices sharply higher and regional storage remains critically low. A prolonged disruption strengthens Russia through higher energy revenues, complicates European support for Ukraine, and reminds investors that the continent's strategic ambitions remain well ahead of its energy security. History has a habit of sending the bill twice.
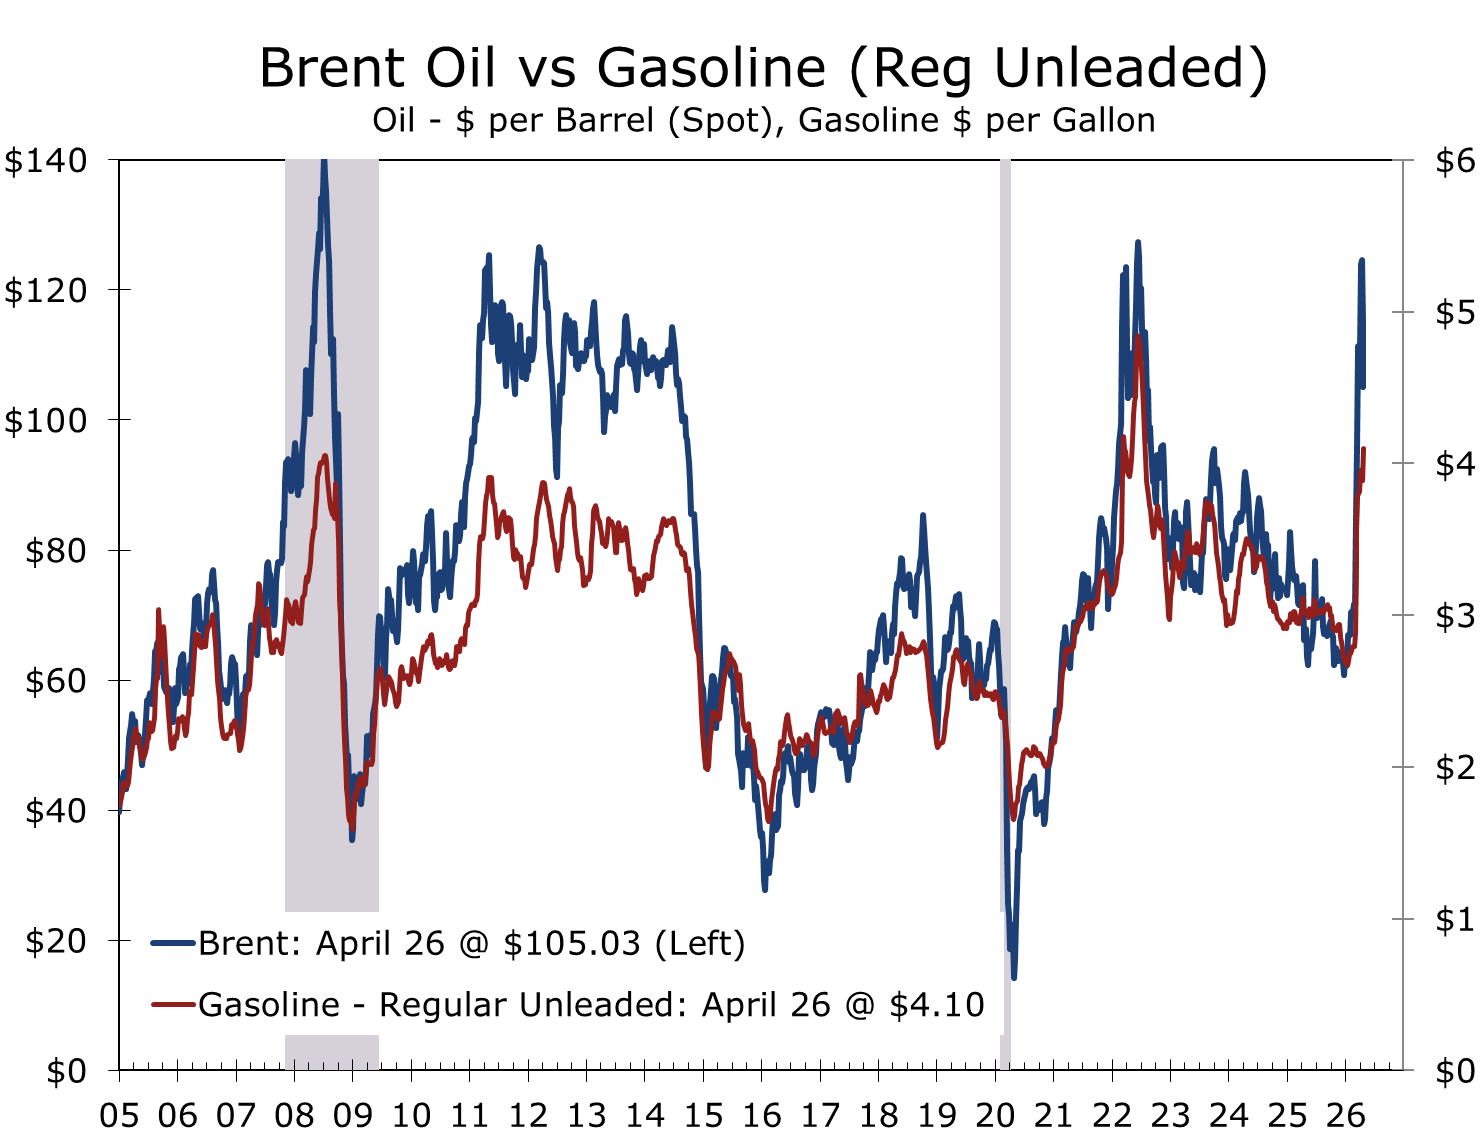
Source: Energy Information Administration (EIA)
Markets & Financial Conditions
Stocks and bonds rarely agree, but they rarely disagree by this much. The S&P 500 and Nasdaq closed Friday at record highs while the 10-year Treasury sat at 4.31%, near a one-week high. Both markets are looking at the same set of inputs and pricing them in fundamentally different ways. The list is familiar by now: the war, the inflation impulse, the Fed transition, the consumer, and the AI capex cycle. The equity bull case rests on three assumptions: that the ceasefire holds, that energy stabilizes, and that AI proves a net stimulus to growth rather than a near-term disruption to labor markets and capital allocation. Bonds are not convinced on any of the three. The divergence itself is unremarkable. The size of it is.
The 10-year ended the week at 4.31%, the 2-year at 3.78%, the 30-year at 4.91%. The curve is positively sloped by 53 basis points. Three forces are pushing long-end yields. First, energy prices are keeping inflation expectations sticky; the Michigan one-year measure sits at 4.7%. Second, term premium continues to rebuild on persistent deficits and heavy issuance. Third, geopolitical risk is being priced as a duration risk, not a flight-to-quality story, which is unusual and worth noting.
The bond market's caution looks well-grounded. Even forecasters most concerned about the war's persistent effects expect Brent to ease toward roughly $90 by year-end as Gulf flows recover, with risks tilted to the upside. That is below current spot but well above the long-run average, and it is consistent with sticky inflation expectations and a Fed that cannot ease quickly without losing credibility. The shape of the curve fits that path. Equity index pricing assumes a smoother return to normal.
The Justice Department's Friday decision to drop its criminal probe of Chair Powell removes the principal hurdle to Warsh's confirmation. Senator Tillis announced Sunday he will end his block on the nomination, and the Senate Banking Committee is scheduled to vote on Wednesday at 10 a.m. ET. With Republican Banking Committee members outnumbering Democrats 13 to 11, Warsh is expected to advance to the full Senate, with confirmation likely in time to chair the June FOMC meeting. Powell's term as Chair ends May 15. Markets read Warsh's confirmation testimony as more hawkish than expected. Fed-funds futures price roughly 8 basis points of cuts through year-end. The probability of a move at the April 28–29 FOMC meeting is effectively zero.
Gold finished the week near $4,722 per ounce, down roughly 3% on the week as the indefinite ceasefire extension softened the safe-haven bid. The metal has now given back about 10% from its post-war peak, which is itself a useful signal. The market is not pricing the war as a regime change. It is pricing it as a fat-tailed but bounded disruption.
The funding-side conclusion is straightforward. The opportunity to lock in fixed rates remains, but conditions are no longer improving. Firms with floating-rate exposure should reassess downside scenarios where the 10-year remains at or above 4.30% through year-end. The market is demanding more compensation for duration, and that tends to persist.
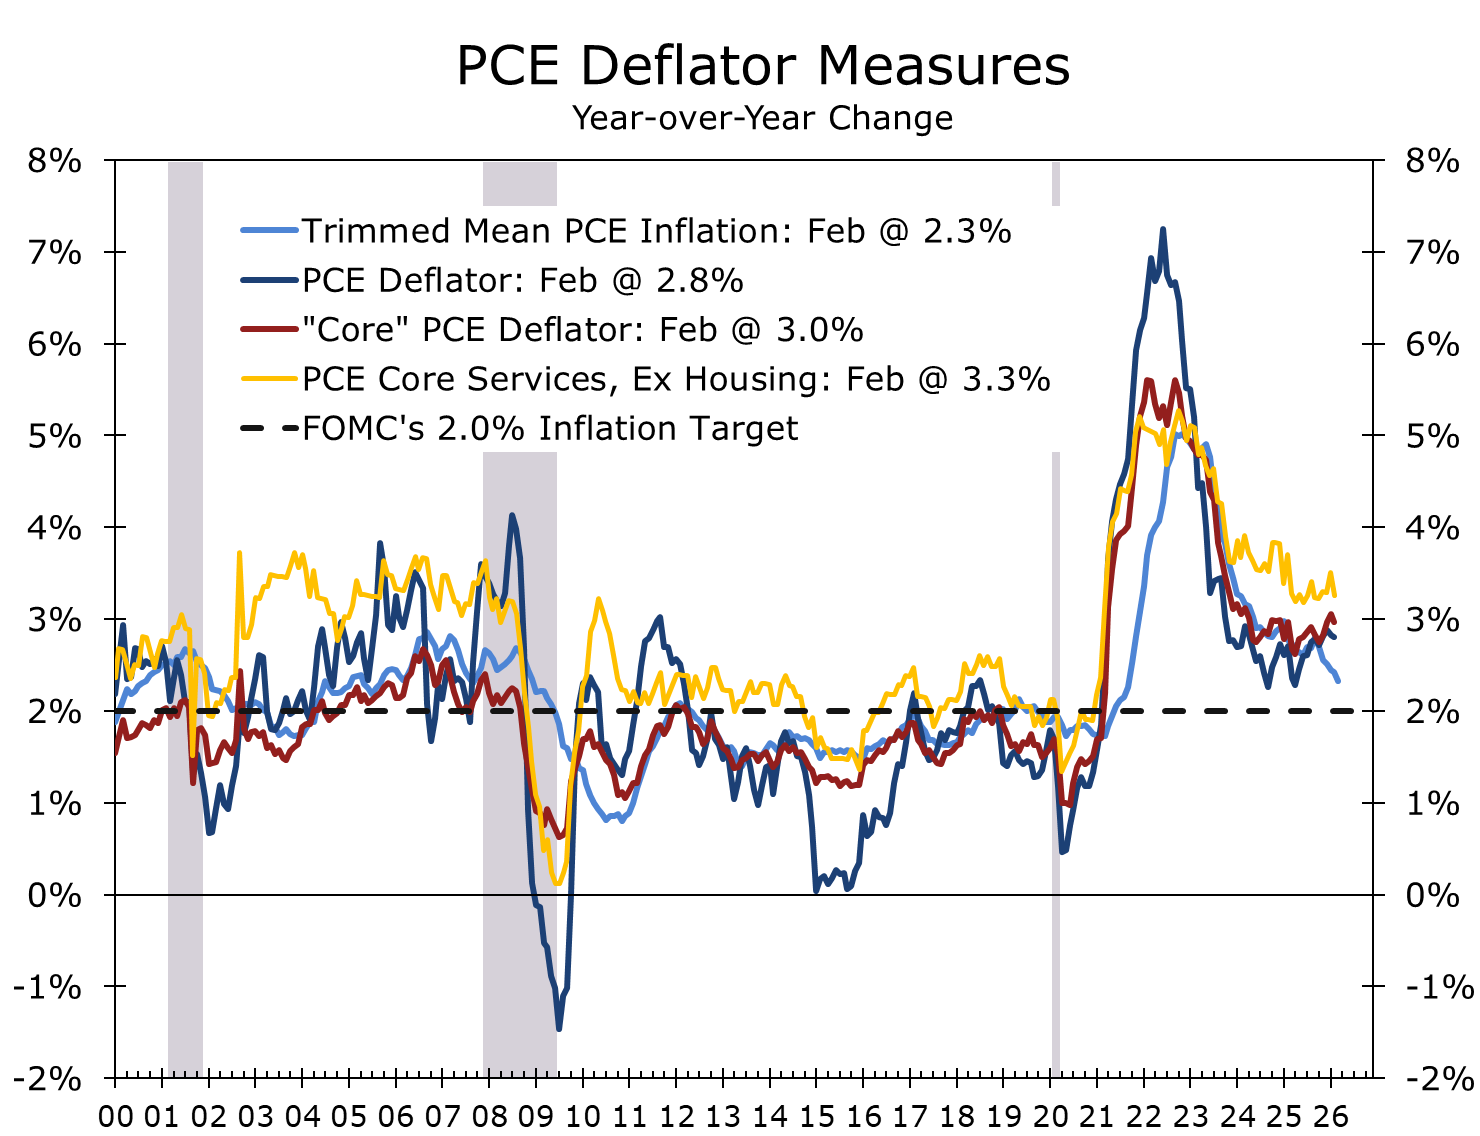
Source: Bureau of Economic Analysis (BEA) and Federal Reserve Bank of Dallas
Piedmont Perspective: Warsh, Measurement, and the Stance of Policy
It is worth pausing on inflation this week, because the conversation about it has become muddled. Headline CPI is being pushed around by an oil shock. Core CPI is doing what it has done for the better part of a year, drifting slowly in the right direction. The Cleveland Fed's median CPI and 16% trimmed-mean CPI each rose 0.2% month-over-month in March, the same as core, suggesting the underlying signal is unchanged by the war.
The Dallas Fed's trimmed-mean PCE, the cleanest filter on the FOMC's preferred index, ran at 2.3% year-over-year through February, against a 2.8% headline PCE and a 3.0% core PCE. Strip out the energy distortion and a single core read carrying more noise than signal, and the trend is reasonably benign.
Three points are worth making, each tied to themes Kevin Warsh laid out in his Senate testimony this week. First, the 2% target may be more aspirational than descriptive. CPI inflation has averaged roughly 2.7% per year from 1990 through today — the disinflationary era, the period most often invoked as the proof of concept for inflation targeting. Even with all of that pulling the average down, the long-run number sits well above 2%. The Fed has not spent nearly as much time at target as the casual narrative suggests.
Second, what the Fed measures matters as much as what it targets. Warsh dismissed core PCE as "a rough swag" and called for newer methodologies. The work has been there for two decades: the Cleveland Fed's median and trimmed-mean CPI and the Dallas Fed's trimmed-mean PCE. Cleveland's own research has shown median CPI to be a better forecaster of future PCE inflation than core PCE itself. Third, policy is restrictive but only modestly so. With funds at 3.50–3.75% and the better trend measures of inflation running between 2.3% and 2.6%, the implied real rate sits roughly 1.0 to 1.4 percentage points above zero. That is restrictive, but not punishingly so. The room for cuts is narrower than markets have been hoping for but in line with our expectations.
Fourth, Warsh's framework includes a structural optimism that has not received enough attention. He has argued that AI is boosting the economy's supply side and will deliver large productivity gains and called for the Fed to do considerable additional work to assess the productivity boom. This view could hardly be labeled hawkish. It connects directly to the equity bull case discussed above and complicates a simple read of Warsh as restrictive. A central banker who believes the economy's potential is rising should, all else equal, tolerate higher actual growth without pulling rates higher. The implication is that the gap between Warsh's framework and Powell's may be narrower than markets are pricing, particularly if the labor market remains close to full employment, as Warsh characterized it in his testimony. Warsh has room to cut rates. The real test will come once the economy moves past the Iran War distractions and growth firms as inflation moderates. We expect a Warsh Fed to let the economy run hot a bit, particularly if growth is being driven by capital spending, which raises the speed limit for potential growth.
CFO & Treasurer Corner
What This Means for Corporate Finance
Funding & Liquidity: The fixed-rate issuance window remains open. The trajectory is no longer improving. Markets price almost no Fed cuts through year-end and term premium continues to rebuild. The case for locking in fixed-rate financing is strengthening. Floating-rate borrowers should review covenant headroom and stress-test interest coverage if the 10-year holds above 4.30% through year-end.
Energy & Input Costs: Brent has settled near $104 after briefly touching highs above $109. Diesel and middle distillates remain the choke point. Firms with exposure to freight, logistics, or petrochemical inputs should stress-test 2026 cost assumptions now. The window to pre-buy or hedge inputs may be short. Fertilizer and LNG-linked supply chains require immediate review.
Working Capital: Higher energy and freight costs are creating a slow-moving squeeze on working capital. Transportation and warehousing firms absorbed the first wave. Consumer goods and industrial firms are next. Just-in-time supply chains with limited inventory buffers face the greatest risk. Margin pressure is likely to build in Q2 and Q3, even as headline retail spending holds up.
Planning Assumption: Base case. Ceasefire holds and a negotiated path eventually reopens Hormuz. Brent stabilizes in a $95 to $110 range by June and then eases over the summer. The market generally begins to build in rate cuts over the summer, and the Fed follows through with a quarter point cut in September, followed by another quarter-point cut at the December FOMC meeting. GDP growth runs around 2.5%, driven largely by capital spending, stabilization in residential investment, inventory building, and a resilient consumer. Stress case. Blockade persists or escalates through Q3. Brent rises to $120 to $140. Headline CPI re-accelerates above 4%. Credit spreads widen 50 to 75 basis points. Build both scenarios into Q2 board discussions.
Looking Ahead
| Day | Release / Event | Why It Matters for CFOs & Markets |
|---|---|---|
| Monday | Dallas Fed Manufacturing Activity (April); Treasury QRA preview | Regional Fed surveys are the cleanest read on whether the war's cost impulse is showing up in firms' prices and capex plans. Treasury's quarterly refunding announcement will set issuance tone for Q2. |
| Tuesday | S&P CoreLogic Case-Shiller home prices (Feb); JOLTS (March); Conference Board Consumer Confidence | JOLTS will inform the labor-market normalization story. Confidence has lagged the hard data badly; convergence in either direction is the question. Case-Shiller will speak to shelter inflation, which has been the dominant disinflationary force in core CPI. |
| Wednesday | FOMC Day 1; ADP Employment; Q1 GDP advance estimate; Treasury Refunding Announcement | Q1 GDP is the consumer story rendered as one number. Nowcasts have diverged: Atlanta GDPNow sits at 1.2% as of April 21 while the St. Louis Fed and Survey of Professional Forecasters cluster nearer 2.3 to 2.6%. Energy-shock effects on Q1 are limited because the bulk of the price impulse hits in Q2; the surprise risk lies in revisions and inventories rather than the consumer headline. Treasury issuance composition matters as much as the totals; longer duration in the issuance mix would add term-premium pressure. |
| Thursday | FOMC Decision and Powell Press Conference; ECI (Q1); Initial Claims | This may be Powell's last meeting as Chair. Watch for tone on inflation measurement, the war, and any signal on his future on the Board of Governors. ECI is the cleanest read on labor cost pressures and matters to the underlying inflation story. Q1 often is the highest print of the year. |
| Friday | PCE & Personal Income/Spending (March); ISM Manufacturing (April) | Friday's PCE is the most important data point of the week. The Dallas Fed trimmed-mean PCE update will arrive with it; a stable trend reading near 2.3% would reinforce the case that underlying inflation is contained even as headline runs hot. ISM provides the other side of the picture. Look for evidence of growing supply chain strains and margin pressure. |
The interpretation of next week's data will matter more than the numbers themselves. The headline narrative — strong consumer, hot inflation, Fed on hold — is largely settled. The unsettled questions are whether the labor market continues to normalize without breaking, whether the better measures of underlying inflation continue to drift lower, and whether the Powell-to-Warsh transition introduces volatility into long-end pricing. The shoals are visible. The task ahead is to navigate them.
Scenario Framework
| Scenario | Macro & Market Implications | Corporate Finance Action |
|---|---|---|
| Base Case (50%) | Sloppy ceasefire holds; phased Gulf reopening from mid-May through end-June; Brent settles near $90 by Q4 with risks skewed higher; Fed on hold through summer with one to two cuts likely in H2 if underlying inflation cooperates; GDP near 2.5%; headline CPI peaks above 3.5% in Q2, then moderates toward 3% by year-end. | Lock in fixed-rate maturities now. Stress-test energy and freight in 2026 budgets. Maintain liquidity buffers above minimums. Use this period of relative calm to prepare for the alternatives. |
| Downside (30%) | Blockade persists or escalates through Q3; Brent $120–130; headline CPI re-accelerates above 4% with stickiness in core; credit spreads widen 50–75 bps; Fed pinned with no cut path. | Accelerate issuance ahead of wider spreads. Model demand destruction in revenue forecasts. Limit new floating-rate exposure. Revisit dividend and buyback assumptions. |
| Tail Risk (20%) | Direct strike on Gulf energy infrastructure or full Hormuz closure into Q4; Brent $140+; global recession risk rises sharply; dollar surges; EM stress; equity drawdown of 15–20%+. | Maximize liquidity; draw revolvers preemptively; halt discretionary capex; model severe demand contraction; review counterparty exposure in EM and energy-importing economies. |
US Economic & Financial Outlook
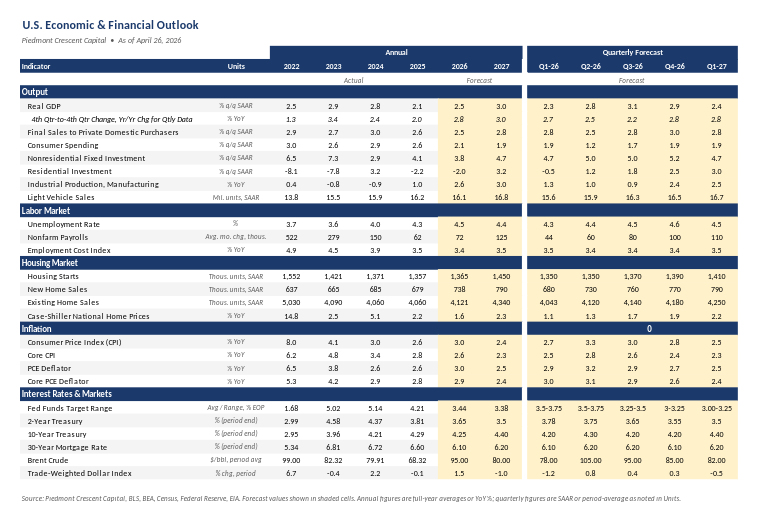
Source: Piedmont Crescent Capital, BLS, BEA, Census, Federal Reserve, EIA. Forecast values shown in shaded cells. Annual figures are full-year averages or YoY %; quarterly figures are SAAR or period-average as noted in Units.
Piedmont Crescent Capital · April 26, 2026 · For informational purposes only. Not investment advice.
Ceasefire at the Brink: IRGC Strikes Back, April 22 Deadline Looms
THE CAVU COMPASS | Monthly macroeconomic insights and market commentary by CAVU Securities and Piedmont Crescent Capital
THE CAVU COMPASS
Monthly macroeconomic insights and market commentary provided by CAVU Securities and Piedmont Crescent Capital.
Mark P. Vitner, Chief Economist
Ceasefire at the Brink: IRGC Strikes Back, April 22 Deadline Looms
April 19, 2026
The IRGC Reversed Course. The April 22 Deadline Is Now the Only Thing That Matters.
- The IRGC has reversed the Hormuz opening and attacked commercial shipping. Within hours of Iran's Friday declaration that the Strait was "completely open," the IRGC reversed course Saturday morning. Iranian gunboats fired on vessels attempting to transit — at least one tanker, the VLCC Sanmar Herald, was fired upon despite receiving prior clearance to pass. A U.S. defense official confirmed at least three IRGC attacks on commercial ships. The UKMTO reported two attacks. Brent crude surged back toward $99–100. The 24-hour window from Hormuz opening to Hormuz re-closure is the most dangerous sequence in the conflict since the April 8 ceasefire began.
- The U.S. port blockade remains in full force. President Trump, while welcoming Iran's Hormuz announcement, immediately posted on Truth Social that the naval blockade of Iranian ports "will remain in full force and effect as it pertains to Iran, only, until such time as our transaction with Iran is 100% complete." Negotiations "should go very quickly," he said. This is the correct posture: use Iran's concession as leverage to close a permanent deal, not a reason to stand down.
- This is a negotiating ploy, not a strategic reversal — but ploys have consequences. The IRGC's logic is reconstructable: Iran opened the Strait as a goodwill gesture tied to the Israel-Lebanon ceasefire; Washington immediately declared the port blockade would stay regardless; IRGC hardliners concluded Iran conceded too much and restored leverage by reversing. This is almost certainly tactical, not a decision to re-enter full hostilities. But Iranian gunboats have fired on commercial ships carrying prior clearance. That creates facts on the water that matter independently of intent.
- The April 22 ceasefire deadline is now the fulcrum. Pakistani mediators are working urgently on a second round of talks. Both sides have given "in principle" agreement to extend the ceasefire for at least two more weeks, per AP sources, but that signal predates the IRGC's Saturday reversal. Whether the extension holds now depends on whether Pezeshkian's civilian government or Vahidi's IRGC has the decisive voice in Tehran this week.
- The Fed is on hold, and it is not going to hike. FOMC minutes confirmed that almost all participants view current policy as well-positioned. With unemployment heading toward 4.6% and PCE toward 3.1%, the committee is not looking for reasons to tighten. We still see room for at least one quarter-point cut during the second half of the year, most likely in late summer, well ahead of the midterm elections.
- The global recession threshold is closer than the IMF is letting on. The IMF cut their 2026 global economic forecast to just 3.1%, just above the threshold that marks a global downturn. Many large forecasting shops have forecasts closer to 2.5%. Our own is slightly higher, at 2.8%. Our forecast for U.S. growth remains well above consensus.
- Housing has missed its spring season. NAHB homebuilder sentiment fell to 34 in April, lowest since September. Completed unsold inventory is back to Great Recession levels. Spring is typically the difference between a good year and a bad one in housing. This one is largely gone.
- Our scenario probabilities, revised for the IRGC reversal. Base Case (45%, down from 55%): ceasefire extension and second-round talks materialize; Brent stabilizes $85–$100. Downside (35%, up from 30%): ceasefire lapses April 22, Brent re-accelerates toward $115–$130, consumer spending enters genuine contraction. Tail Risk (20%, up from 15%): IRGC actions against U.S. naval assets trigger immediate U.S. military response; oil above $140; global recession risk surges.
Market Snapshot
| Indicator | Level | Context |
|---|---|---|
| Brent Crude | ~$97–100 / bbl | Surged back toward $100 after IRGC reversed Hormuz opening Saturday; erased most of Friday's relief |
| WTI Crude | ~$93–96 / bbl | Recovered most of Friday's decline after IRGC gunboat attacks Saturday; physical markets remain extremely tight |
| 10-Yr Treasury | 4.25–4.30% | Drifted down from 4.35% peak; bond market pricing limited near-term resolution |
| 2-Yr Treasury | ~3.82% | Curve +43–50 bps (2s10s); modest steepening on growth fears |
| Natl Avg Gasoline | $4.16 / gal | ↑ from $3.41 pre-war; $10.4B weekly drain on consumer budgets |
| Natl Avg Diesel | $5.67 / gal | ↑ sharply; record territory; freight cost surge is now embedded |
| Gold | ~$4,760 / oz | Safe-haven premium holds; clearest market signal of persistent risk |
| Fed Funds Target | 3.50–3.75% | On hold; PCC still sees room for one to two quarter-point cuts in the second half |
| UMich Sentiment | 47.6 (Apr prelim) | Record low; 1-yr inflation expectations 4.8%; long-run 3.4% |
| NAHB Sentiment | 34 (April) | Lowest since September; spring selling season effectively lost |
| Retail Sales (Mar) | Delayed to Apr 21 | Census Bureau delay; cleanest read on discretionary spending still pending |
| Industrial Production | −0.5% (Mar) | Third consecutive monthly decline; manufacturing down 0.1% |
| Initial Jobless Claims | 207–210k | Labor market holding; no sign yet of energy shock reaching payrolls |
| Empire State Mfg | Modestly negative | Early April snapshot; new orders and shipments declined |
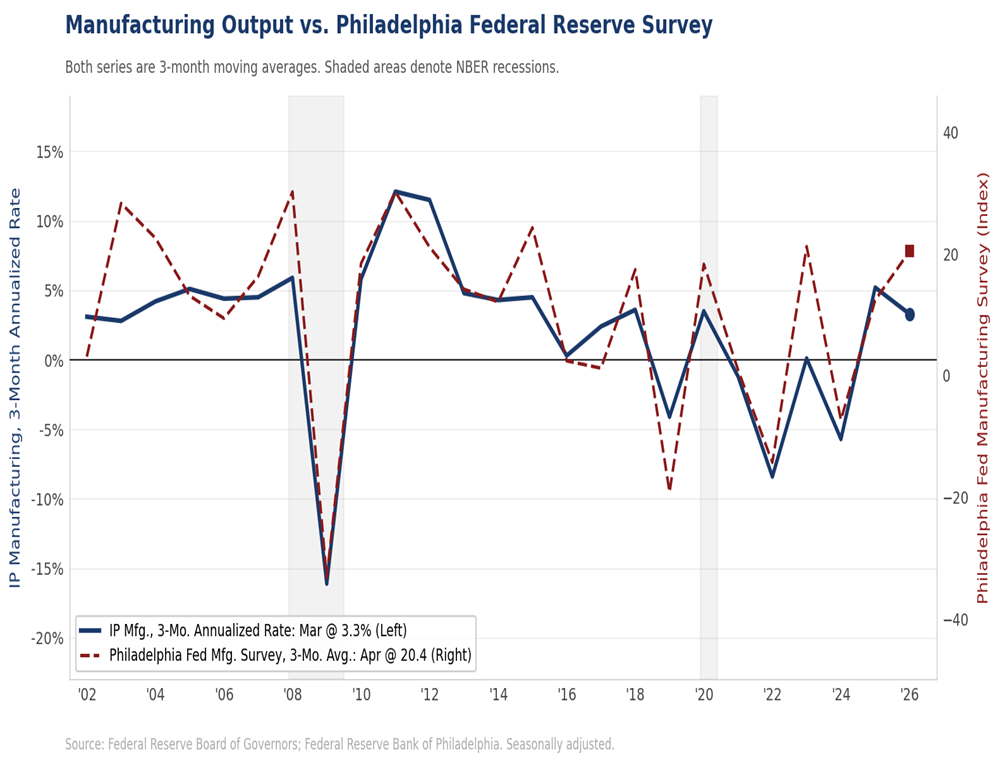
| Philly Fed Mfg | 26.7 (April) | Surged well above expectations of 10.0; new orders and shipments hit multi-year highs; employment fell |
| S&P 500 | +4.8% for week | Risk-on surge on Hormuz news; Nasdaq +6.8%, DJIA +3.5%; all-time high intraday |
| Corp Bond Issuance | ~$100bn this week | Massive risk-on signal; banks led with BofA, JPM, Morgan Stanley each pricing $10bn deals |
"Iran's 'leadership' blinked on the Strait. The war is not over. But the arithmetic just shifted decisively in Washington's favor, which the IRGC does not like."
— Mark P. Vitner, Chief Economist, Piedmont Crescent Capital
The Consumer: From Sentiment to Behavior
March Retail Sales land April 21 — the day before the ceasefire expires — making the timing of this data release unusually consequential. We expect control group retail sales (ex-autos, gas, building materials) to rise +0.3%, driven by the generous 2025 tax refund season, with average refunds running more than 10% above year-ago levels. The headline figure will be misleadingly strong, perhaps +1.3% to +1.5%, because gasoline prices inflated the gas-station line item. The number to watch is the control group. A reading above +0.3% means the consumer was holding in March despite the energy shock; below +0.2% signals the energy drain was already overwhelming underlying spending before the IRGC reversal raised the risk of another oil price surge. Bank of America's internal card data for March showed per-household spending up 4.3% year-over-year, with discretionary categories ex-gas still growing at 3.6% YoY. April will be a harder test. Gasoline prices have fallen modestly in April, however, which may provide some modest relief to consumers' psyche and wallets. The cleanest measure of consumer health is hours away.
Consumers do not need to see a monthly spending report to know something has changed. They feel it at the pump. At $4.16 a gallon for gasoline and $5.67 for diesel, the $10.4 billion weekly income transfer from household budgets to the energy sector is large enough to matter in the aggregate. It does not cycle back into the consumer economy. It goes to refiners, producers, and governments. The personal saving rate was 4.0% heading into the conflict, well below the post-pandemic average. Middle- and lower-income households, who were already running lean, are most exposed.
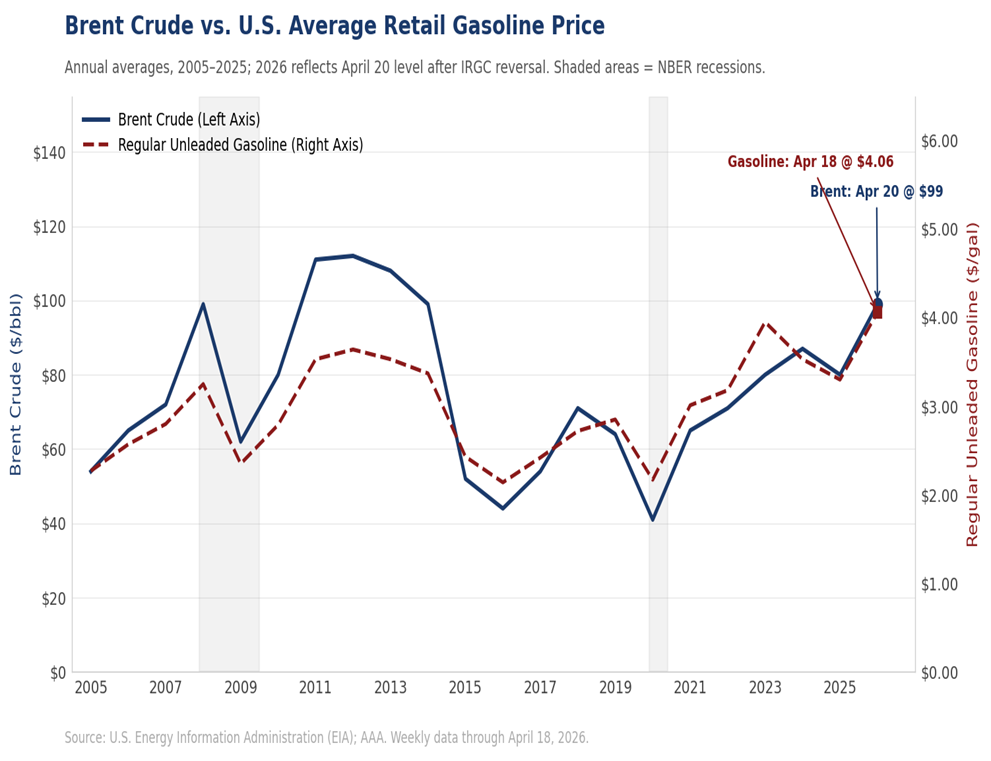
Since peaking in early April, U.S. gasoline prices have fallen slightly. The national average climbed as high as $4.16 per gallon the week of April 9 — the highest level since August 2022 — before easing to $4.09 on April 16 and $4.06 as of April 18, according to AAA data. That represents a decline of roughly 7 to 10 cents from the recent high. Even so, the national average remains more than $1.00 higher than a month ago and roughly 30% above year-ago levels, keeping the energy shock's drag on real disposable income intact.
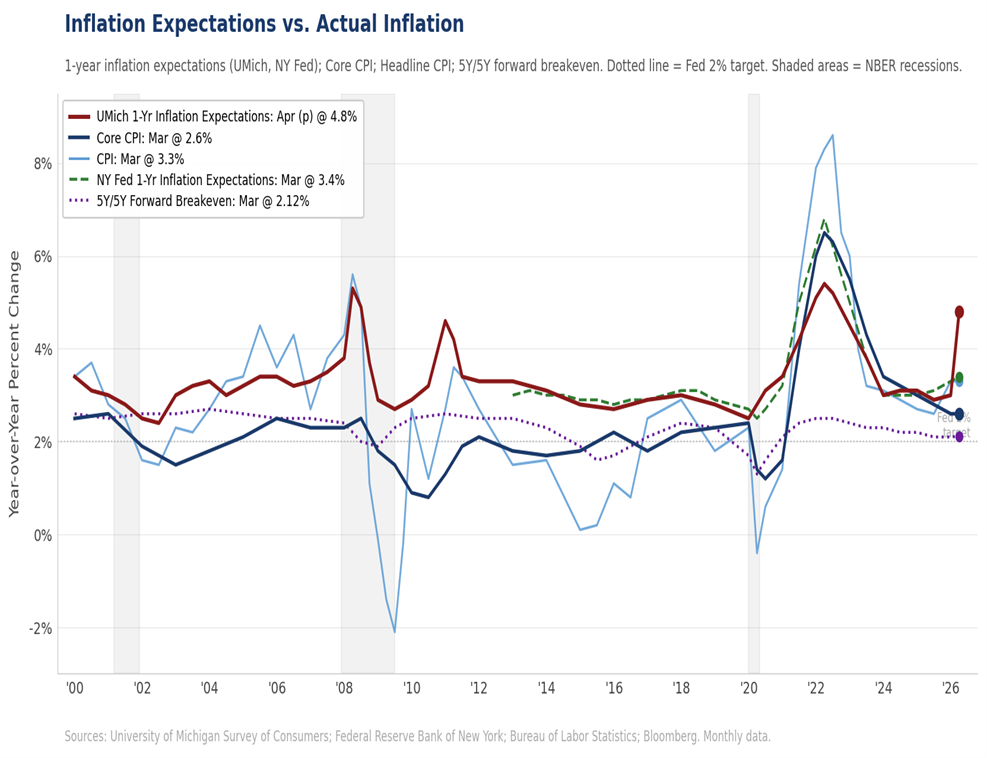
Higher gasoline prices are clearly weighing on consumer confidence. The University of Michigan preliminary April Consumer Sentiment reading of 47.6 is consistent with recent headlines from retailers, small business owners and homebuilders. One-year inflation expectations have jumped to 4.8%, the highest since 2023. Long-run expectations have moved to 3.4%, territory not seen since 2008. The Fed's entire justification for tolerating an energy-driven headline spike without tightening policy rests on the assumption that long-run expectations stay anchored near 2%. At 3.4%, that assumption is under genuine stress. That said, the Fed gives far more credence to more stable measures — the 5-year forward breakeven rate and the New York Fed consumer survey — both of which show medium- and long-term expectations remain anchored.
Risk Factor
The Savings Rate Cannot Absorb Another Month of This
The personal saving rate was 4.0% entering the conflict, well below the post-pandemic average. The roughly 40% jump in gasoline prices from pre-war levels has already begun to offset the benefit from sizable individual tax refunds flowing from last year's tax legislation. Within weeks, the pump-price drag will likely more than offset that tailwind. Without a meaningful retreat in energy prices, the path for consumer spending in Q2 leads to something worse than a slowdown.
The Beige Book: A Ground-Level Portrait of the Shock
The Federal Reserve's April Beige Book, released Wednesday, April 15, described slight-to-moderate growth across most districts but with a wait-and-see posture that has become increasingly pronounced since the blockade took effect. All twelve districts reported the same basic pressures: energy and freight costs up, discretionary consumer spending softer, businesses pulling back on hiring and capital projects, and uncertainty rising. Against that backdrop, the Philly Fed manufacturing survey for April was a genuine positive surprise: the headline index surged to 26.7, well above the consensus of 10.0 and the prior reading of 18.1. New orders jumped 24 points to 33.0, and shipments rose nearly 12 points to 34.0 — both at their strongest readings since 2021 and 2022, respectively. Employment fell. The takeaway: production and orders are holding, but firms are not adding headcount, and the cost picture is worsening. Initial jobless claims fell 11,000 to 207,000 for the week ended April 11, consistent with our view that oil price shocks affect employment with a two-to-three quarter lag.
Transportation and logistics contacts in Dallas, Kansas City, and Chicago reported fuel surcharges near pre-pandemic highs. Food producers in Atlanta and Richmond flagged diesel and fertilizer as their primary cost pressures. Retailers in New York and Boston reported weaker foot traffic and softer card spending since the blockade. The breadth is the notable part. This is not a sector-specific problem or a regional one.
The Beige Book also documented an income split that is becoming more pronounced. Higher-income households in New York, San Francisco, and Boston continue to spend, supported by equity-market wealth effects. Middle- and lower-income households in Kansas City, Dallas, and Atlanta are pulling back. Gasoline prices consume a proportionally larger share of lower-income budgets, and those households had less savings to draw on at the outset.
Key Signal
The Bond Market Remains the Definitive Signal
Treasury yields fell 3 to 12 basis points through Friday on the Hormuz opening announcement, with the 10-year briefly breaking below 4.25% and the 2-year trading near 3.65 to 3.69%. Corporate issuance surged to approximately $100 billion for the week — the largest of the year — and spreads had tightened to pre-war levels. Then the IRGC reversed the Hormuz opening Saturday and Brent surged back toward $99–100. Watch the April 21 close: yields holding above 4.30% signal the bond market is pricing a ceasefire lapse. A fall back below 4.20% would signal the market believes a last-minute extension is coming. Until a deal is formally signed and the blockade visibly unwinding, financial conditions remain tighter than equities are pricing.
Breaking: Hormuz Declared Open — What It Means and What It Doesn't
The situation has moved sharply in the past 72 hours. Iran's Friday announcement that the Strait of Hormuz was "completely open" for commercial traffic produced a genuine, if brief, de-escalation. Markets priced it immediately: oil fell toward the high-$80s, equities surged, corporate spreads tightened to pre-war levels. More than a dozen commercial vessels actually transited — the most traffic since February 28. Then, early Saturday, the IRGC reversed course. Iran's joint military command declared that "control of the Strait of Hormuz has returned to its previous state." Iranian gunboats fired on at least one tanker that had received prior clearance to pass — the VLCC Sanmar Herald — and at least two additional attacks on commercial vessels were confirmed by both the UKMTO and a U.S. defense official. The 24-hour window from opening to re-closure is the most dangerous sequence in the conflict since the ceasefire began.
What the IRGC's reversal reveals about Iran's internal politics matters as much as the tactical situation it creates. Iran International has documented a widening rupture between President Pezeshkian's civilian government and IRGC hardliners. The Soufan Center has described the negotiating dynamic at Islamabad as reflecting a structural power struggle between Vahidi's IRGC hardliners and the more pragmatic officials aligned with Pezeshkian. Critically, the Stimson Center's Kaitlyn Hashem has documented how Israel's assassination campaign against IRGC leadership has had an ironic consequence: it elevated a generation of hardliners pulled from semi-retirement who are "more hardline, anti-U.S., and anti-Israel than those they replaced" and "less nimble in negotiating an end to the war." These are not pragmatists who got outmaneuvered — they are the hardliners themselves.
The IRGC's logic is straightforward: Iran opened the Strait Friday as a goodwill gesture tied to the Israel-Lebanon ceasefire. Washington immediately declared the port blockade would remain regardless. IRGC hardliners concluded the U.S. was banking the concession without offering anything in return — and reversed course to restore leverage. But 'almost certainly a negotiating ploy' and 'therefore risk-free' are not the same thing. Iranian gunboats have fired on tankers carrying prior clearance. A misjudgment, or a single incident involving an allied-nation vessel, could trigger a response that neither the IRGC's civilian handlers nor Washington's diplomats can contain in real time.
The U.S. port blockade, which CENTCOM says has completely halted Iran's seaborne trade and costs Tehran an estimated $400 million per day, remains fully in force. Iran has now conceded the central demand (Hormuz access) without getting what it wants in return. That puts Washington in a stronger position for the next round of talks. The port blockade, now in its seventh day, has completely shut off Iran's seaborne trade, which powers roughly 90% of its economy. Iran's onshore oil storage was already approaching saturation before Friday's Hormuz declaration. Iran had a closing window in which to act and opened the Strait Friday — then the IRGC reversed that decision within 24 hours, trading a genuine concession for a negotiating ploy.
The diplomatic picture as of Sunday, April 19: Pakistani mediators are working urgently. AP sources report both sides gave an 'in principle' agreement to extend the ceasefire for at least two weeks, though that signal predates Saturday's IRGC reversal. The nuclear impasse at Islamabad remains: the U.S. proposed a 20-year enrichment suspension; Iran countered with five years, which Washington rejected. Iran's economy, per Pezeshkian's own assessment on March 28, cannot withstand more than three to four weeks of current conditions without risk of collapse.
If the ceasefire lapses on April 22, Washington's response will be swift. Our assessment: the most likely military response scenario does not deepen the conflict into full-scale war. It does push oil back above $110, widen credit spreads 75 to 125 basis points, and set back any ceasefire extension by at least two weeks. We expect Brent crude to average around $100 per barrel through the middle of this year, with a potential peak near $120 should the April 22 ceasefire expire. For the United States, we see only a 0.5 percentage point addition to headline inflation and a roughly 0.5 percentage point subtraction from GDP growth. U.S. growth remains capital-driven, powered by the ongoing AI buildout, Boeing's ramp-up in aerospace assemblies, the GLP-1 pharmaceutical and life-sciences boom, elevated defense spending, and continued reshoring activity. These structural tailwinds leave the U.S. better insulated than Europe or Asia.
Geopolitical Framework
| Scenario | Probability | Macro & Market Implications | Corporate Finance Action |
|---|---|---|---|
| Base Case | 45% ↓ from 55% | Framework agreement before or shortly after April 22. Mine-clearing begins under IMO coordination. Ceasefire formally extended. Brent falls toward $75–$95 as supply-risk premium compresses. Consumer spending stabilizes in Q2, recovers in H2. Economic damage from the seven-week shock is real but bounded. | If a deal closes quickly, the fixed-rate issuance window reopens. Monitor Brent: a sustained move below $85 changes the cost-of-capital calculus materially. Hold liquidity buffers in place until a formal agreement is signed. Do not unwind hedges. |
| Downside | 35% ↑ from 30% | Ceasefire lapses April 22 with no extension. IRGC hardliners retain control. Hormuz remains effectively closed. Brent re-accelerates toward $115–$130. Consumer spending enters genuine contraction. Fed policy becomes nearly impossible to calibrate. Credit spreads +75–125 bps. | Accelerate fixed-rate issuance ahead of wider spreads. Model demand destruction in revenue forecasts. Limit new floating-rate exposure. Review covenant headroom urgently. |
| Tail Risk | 20% ↑ from 15% | Iranian military retaliation against U.S. naval assets or Gulf port infrastructure. Oil $140+. Global recession risk surges. Dollar surges; EM stress. Possible Chinese air-defense weapons delivery to Iran adds great-power dimension. Fed caught between 5%+ inflation and recession. | Maximize liquidity immediately. Draw revolvers preemptively. Halt discretionary capex. Model severe demand contraction. Accelerate supply-chain diversification away from Gulf-dependent inputs. |
Inflation & Monetary Policy: A Stagflationary Bind
The March CPI and PPI together confirm that the energy shock is now embedded in the producer pipeline, not merely at the consumer level. Final Demand PPI rose 4.0% year-over-year, the hottest reading since February 2023. Goods prices jumped 1.6% month-over-month on energy; services prices were flat. Margins are being squeezed, not prices being passed through broadly. Small businesses are absorbing the cost hit rather than raising prices, which is exactly what the NFIB data shows: net profits dropped 11 points in March, and NFIB Chief Economist Bill Dunkelberg pointed directly at the oil price spike as the cause.
March CPI rose 0.9% for the month, with the 3.3% year-over-year reading driven almost entirely by the 21.2% surge in gasoline prices. Our year-end 2026 headline PCE forecast of 3.1% and core PCE forecast of 2.5% reflect the pass-through of energy costs into goods prices and, eventually, services. We expect PCE to peak near 3.5% year-over-year in April before energy base effects begin pulling it lower in the second half. Consumer inflation expectations have moved sharply across multiple surveys: UMich 1-year expectations rose to 4.8%, the New York Fed survey moved up 0.4 points to 3.4%, and the Conference Board survey rose 0.7 points to 6.2%. Our view is that the unemployment channel wins: the demand destruction from sustained energy prices is more likely to force the Fed's hand than the inflation pass-through.
Gasoline prices have declined modestly since peaking in early April, which may slow or even partially reverse the rise in inflation expectations. The impact on the April CPI could be even more dramatic, as gasoline prices typically rise in April as driving increases for springtime activities.
PCC's view has not changed. The Fed will not hike. The current shock is narrower than 2021 to 2022, the labor market is in better balance, and the funds rate already sits 50 to 75 basis points above the FOMC's own median neutral estimate. We continue to see room for one or two quarter-point cuts in the second half of the year, most likely beginning in late summer, with a possible second cut after the midterm elections. The Senate Banking Committee holds a confirmation hearing for Kevin Warsh next week, which may provide early signals on the next Fed Chair's views on monetary policy and central bank independence. The more consequential test of Fed independence is the ongoing Supreme Court case over the White House's attempt to remove Governor Lisa Cook.
Key Signal
This Is Not Yet a Generalized Inflation Breakout
Core CPI at 2.6% and flat PPI services prices tell us the energy shock has not yet run into wages or broad services costs. Small businesses are absorbing the hit through lower margins. Second-round inflation effects should be smaller than in 2022, given looser labor markets and more financially stretched lower-income households. The April CPI release will be the next meaningful test. If core clears 2.8% year-over-year, the argument for rate cuts this year becomes very hard to sustain.
Housing & Capital Investment: War Casualties in the Spring Season
The NAHB homebuilder sentiment index fell four points to 34 in April, its lowest reading since September and well below the consensus of 37. Every component was down: current sales, expected sales six months out, and buyer traffic. Builders cited higher energy-related material costs (diesel especially), higher mortgage rates, and buyers who are simply not showing up. The share offering incentives fell from 64% to 60%. Margins are already too thin for builders to give anything more away.
The Census Bureau's housing data lag the conflict by six to eight weeks. Housing starts for February and March will be released April 29; new home sales on May 5. Spring accounts for a disproportionate share of annual builder volume. This spring is largely gone. Completed but unsold inventory, which had been rising steadily since mid-2025, was at its highest level since the post-financial crisis period as of January. It will go higher.
Capital investment is the most bifurcated sector in the economy right now. AI-linked infrastructure, semiconductor manufacturing, aerospace, defense-tech, and advanced manufacturing reshoring are holding up well. On the other side, projects tied to supply-chain normalization are being staged and delayed, particularly those dependent on Gulf commodity inputs: nitrogen fertilizer, sulfur, and naphtha. AI investment alone is likely to contribute close to half a percentage point to U.S. GDP growth this year, providing a meaningful structural offset to the energy drag.
The Global Picture: Downgrade Cascade
The global growth outlook has deteriorated sharply. Our own forecast puts world GDP growth at roughly 2.8% for 2026 on a dollar-weighted basis. The U.S. at 2.5% (2.7% Q4/Q4 basis) is well above consensus; the Eurozone and UK are tracking closer to 0.7% and 0.3%, respectively. The IMF has already cut Germany's 2026 growth outlook to 0.8% and the Eurozone to 1.1%. The Gulf Cooperation Council faces a GDP contraction of roughly 8% relative to the pre-war baseline. The only economies avoiding meaningful downgrades are China, India, and a narrow group of commodity exporters.
The Eurozone faces a particularly acute version of the same stagflationary squeeze. Eurozone headline CPI was revised up to 2.55% year-over-year in March, with core at 2.29%. A notable development in Europe this week: Hungary's opposition Tisza party won a decisive parliamentary victory, ending Viktor Orbán's 16-year rule. The change in government is immediately positive for EU-Hungary relations and potentially unlocks the vetoed 90 billion euro loan to Ukraine.
China's direct exposure to the Hormuz disruption is limited. Roughly half of its crude oil imports transit the Strait, but coal accounts for about 60% of China's primary energy consumption and is sourced almost entirely domestically. Oil through Hormuz represents only about 5% of total Chinese energy consumption. The indirect risks — weaker global demand for Chinese exports, tighter financial conditions, and the possibility that Chinese air-defense weapons deliveries to Iran prove accurate — are more significant. That last development would give the conflict a great-power dimension that Beijing has so far avoided.
CFO & Treasurer Corner: The Action Checklist
| Focus Area | Action & Rationale |
|---|---|
| Funding & Liquidity | The window for advantaged fixed-rate issuance is closed. The 10-year at 4.25% to 4.30% is likely to reprice toward 4.50% if the blockade stalemates or the April 22 ceasefire lapses without extension. Draw revolvers now. Build cash buffers against a scenario where EBITDA weakens 20% to 30% in the second half. Floating-rate borrowers should model credit spread widening of 75 to 125 basis points. For many CFOs, the question has shifted — it is no longer whether to lock in rates, but whether the market will still be open at acceptable spreads by May. |
| Energy & Input Costs | The pre-buy and hedge window for Q2 is gone. Firms that did not act during the ceasefire week missed the best entry. The priority now is revising stress-test assumptions and modeling 2026 cost scenarios at $115 and $140 Brent. Prices are likely to stay elevated through year-end regardless of how the conflict resolves. Clearing mines, repairing infrastructure, and rebuilding inventories takes time regardless of when a ceasefire takes hold. |
| Working Capital | Higher energy and freight costs are working their way through supply chains in waves. Transportation and warehousing have taken the first hit. Consumer goods manufacturers, food producers, and light industrials are next. Companies with just-in-time supply chains and thin inventory buffers are most exposed in Q2 and Q3. Map those exposures now, lengthen your cycle-time assumptions, and get the cost impact into Q2 cash flow models before the next board meeting. |
| Consumer Demand | Industrial production declined sharply in March. The Beige Book shows discretionary spending softening across most districts. UMich sentiment is at 47.6, a level historically associated with spending contraction. Revenue forecasts built on 2025's trajectory need to be revised to reflect the lagged impact of higher fuel costs. The one mitigant: higher-income consumers, supported by equity-market wealth, are still spending. Firms with concentrated higher-income exposure in luxury goods, premium travel, and financial services are better insulated than mass-market peers. |
| Scenario Planning | Build three explicit scenarios aligned with our probability framework: Base Case — Deal or Extension (45%), Downside — Ceasefire Lapses (35%), Tail Risk — Full Escalation (20%). For the downside, use Ken Griffin's framing from the Semafor Summit: a 6 to 12 month Hormuz shutdown makes global recession inevitable. All three are live today and even if an agreement is reached, normalization of energy markets and supply chains will take time. |
Variables to Watch
| Variable | Why It Leads |
|---|---|
| 1. IRGC attacks — is the ceasefire survivable? | The IRGC reversed Iran's Friday opening within 24 hours and fired on tankers. Watch three signals: (1) whether IRGC gunboat activity ceases in the next 24–48 hours; (2) whether a second round of talks is confirmed before April 22; (3) whether any attack touches a U.S. asset (Tail Risk activation). Our view is the IRGC is trying to strengthen their current weak hand going into the 'final' negotiations. |
| 2. March Retail Sales (April 21, 8:30am ET) | Headline will be inflated by gasoline prices — possibly +1.3% to +1.5% MoM. Focus on the control group (ex-autos, gas, building materials). We project +0.3%, driven by the tax refund tailwind. Above +0.3% means the consumer was holding in March; below +0.2% signals genuine contraction already underway. BofA card data for March showed spending per household +4.3% YoY, with ex-gas still +3.6% YoY. |
| 3. Retail pump prices | The $10.4 billion weekly transfer from household budgets to fuel costs will not reverse until the Strait reopens. Track AAA daily and GasBuddy regional data, which has fallen 7 to 10 cents from its peak. A national average below $4.00/gal on gasoline is the first genuine consumer relief signal, and remaining there requires oil to fall durably below $85/bbl. |
| 4. April CPI (May release) | The April print will be the first to capture a full month of post-blockade gasoline prices. We expect headline PCE to peak near 3.5% year-over-year in April before energy base effects pull it lower. The key number is core CPI. A move above 2.8% year-over-year signals the energy shock is propagating into services and broad goods prices, making rate cuts this year very difficult to sustain. |
| 5. 10-Year Treasury yield | At 4.25% to 4.30%, the bond market is pricing a diplomatic pause. A move above 4.50% signals the market has given up on near-term easing. A decisive move below 4.20% tells you growth fears are overtaking inflation concerns. Our base case has the 10-Year averaging 4.25%. |
| 6. UMich long-run inflation expectations | At 3.4%, the long-run anchor is loosening but not broken. Two more readings at this level would narrow the Fed's room to support growth without triggering a credibility question. The Fed is unlikely to cut interest rates when UMich long-term inflation expectations are rising. |
Piedmont Crescent Capital Economic Forecast
| % change unless noted | 2024 Actual | 2025 Actual | 2026 Forecast | 2027 Forecast | 2028 Forecast |
|---|---|---|---|---|---|
| Output | |||||
| Real GDP | 2.8% | 2.1% | 2.5% | 3.0% | 2.8% |
| Consumer Spending | 2.9% | 2.6% | 2.0% | 1.9% | 2.4% |
| Business Fixed Inv. | 2.9% | 4.1% | 3.8% | 4.5% | 4.0% |
| Residential Inv. | 3.2% | −2.1% | −1.8% | 4.0% | 3.5% |
| Housing Market | |||||
| Housing Starts (000s) | 1,371 | 1,357 | 1,365 | 1,480 | 1,460 |
| New Home Sales (000s) | 685 | 679 | 738 | 790 | 820 |
| Existing Home Sales (000s) | 4,067 | 4,076 | 4,160 | 4,350 | 4,480 |
| Inflation (Year-over-Year) | |||||
| CPI | 2.9% | 2.7% | 3.0% | 2.4% | 2.2% |
| Core CPI | 3.2% | 2.6% | 2.6% | 2.3% | 2.2% |
| PCE Deflator | 2.6% | 2.6% | 3.0% | 2.5% | 2.0% |
| Core PCE Deflator | 3.0% | 2.8% | 2.9% | 2.4% | 2.0% |
| Labor Market | |||||
| Unemployment Rate (%) | 4.1% | 4.3% | 4.6% | 4.4% | 4.2% |
| Nonfarm Payrolls (000s/mo) | 122 | 10 | 40–70 | 60–90 | 90–120 |
| Interest Rates (End of Period) | |||||
| Fed Funds Target (EOP) | 4.25–4.50% | 2.75–3.00% | 3.00–3.25% | 3.25–3.50% | 3.50–3.75% |
| 10-Year Treasury (EOP) | 4.58% | 4.18% | 4.20% | 4.20% | 4.10% |
| Conv. Mortgage Rate | 6.72% | 6.42% | 6.25% | 6.10% | 5.90% |
Strategic Takeaway
The situation as of Sunday, April 19 is materially more dangerous than it was 72 hours ago. Iran opened the Strait of Hormuz on Friday — a genuine strategic concession that markets priced immediately and correctly. Then the IRGC reversed course within 24 hours, fired on commercial shipping, and declared the Strait back under its previous control. The brief opening was real; more than a dozen vessels transited. The reversal is equally real, and it reveals something important: the IRGC hardliners, not President Pezeshkian's civilian government, hold decisive authority over Iran's military posture. Stimson Center analyst Kaitlyn Hashem has documented how Israel's assassination campaign against IRGC commanders elevated a generation of hardliners pulled from semi-retirement who are more hardline and less nimble than those they replaced. These are not pragmatists constrained by hawks. They are the hardliners.
The economic damage from the seven-week shock is real and already embedded. The factory sector saw industrial production decline in March, though output still rose solidly for the first quarter as a whole. The April Beige Book shows a wait-and-see posture on hiring and capital spending across all twelve Fed districts ahead of the ceasefire deadline. Housing has missed its spring selling season, causing us to reduce our second half GDP forecast. Oil price shocks of this magnitude tend to weigh most heavily on business investment and hours worked with a lag of two to three quarters, meaning the employment and capex consequences of the past seven weeks will not be fully visible in the data until Q3 and Q4. Even if a ceasefire is signed this week, that damage does not reverse.
We are revising our probability distribution back toward the pre-Friday balance. The Base Case falls from 55% to 45% — not because a deal is impossible, but because the IRGC's reversal has made it harder to achieve before April 22 and raised the cost of failure if the deadline lapses. The Downside rises from 30% to 35%, and the Tail Risk rises from 15% to 20%, reflecting the IRGC's demonstrated willingness to attack commercial shipping. A ceasefire extension remains possible — AP sources report both sides gave an in-principle agreement before Saturday's reversal — but that agreement is now under stress. The April 22 deadline is the fulcrum.
Five indicators will tell you which scenario is materializing. First: whether IRGC gunboat activity ceases in the next 24 to 48 hours — a stand-down signals the hardliners made their point and are prepared to let diplomacy run. Second: whether Pakistani mediators confirm a second round of talks before April 22. Third: March Retail Sales on April 21 — watch the control group; above +0.3% means the consumer was holding in March. Fourth: where Brent oil closes on April 21 — above $105 means the market is pricing a lapse; below $95 means the market expects an extension. Fifth: any signal from Washington of flexibility on the port blockade as leverage to empower Iran's civilian government.
Mark P. Vitner, Chief Economist, Piedmont Crescent Capital · Updated April 19, 2026
Questions? Email: CompassReport@cavusecurities.com
© 2026 CAVU Securities, LLC
Disclaimer: This publication has been prepared for informational purposes only and is not intended as a recommendation, offer, or solicitation with respect to the purchase or sale of any security or other financial product nor does it constitute investment advice. Any forward-looking statements or forecasts are not guaranteed and are subject to change at any time. Information from external sources has not been verified but is generally considered reliable.
A View from the Piedmont: Islamabad Ends Without a Deal, Blockade Begins, Iran Signals Willingness to Talk
Piedmont Crescent Capital | A View from the Piedmont
Islamabad Ends Without a Deal, Blockade Begins,
Iran Signals Willingness to Talk
The Prior Tail Risk Has Become the Base Case
Mark P. Vitner, Chief Economist · Piedmont Crescent Capital · April 14, 2026
Highlights of the Week
| Key Theme | This Week's Read |
|---|---|
| Inflation | March CPI surged 0.9% MoM (largest in 2 years); Core CPI 2.6%. March PPI: Final Demand +0.5% MoM, +4.0% YoY — hottest since Feb 2023. Goods prices jumped +1.6% MoM on energy. The energy shock is now feeding into the producer pipeline. |
| Consumer | U Mich Sentiment hit record low 47.6 (Apr prelim); 1-yr inflation expectations rose to 4.8%. NFIB Small Business Optimism fell 3.0 pts to 95.8 in March, below its 52-yr average for the first time since April 2025; Uncertainty Index spiked to 92. The NFIB cited the "dramatic spike in oil prices" as the primary driver. |
| Hormuz | U.S. naval blockade of all Iranian port traffic effective 10 a.m. ET April 13. Iran calls it "piracy" and warns no Persian Gulf port will be safe if Iranian ports are threatened. Oil initially surged back above $100/bbl. before retreating into the upper-$90s on reports of renewed back-channel contacts. |
| Markets | The relief rally appeared to be over early Monday but reasserted itself by the close. WTI opened the week above $103 and Brent above $101 on the blockade announcement; hopes for a second round of talks have since pulled prices back toward last week's lows, with WTI at $95.73 and Brent at $97.89 Tuesday morning. |
| Diplomacy | Islamabad failed definitively on Sunday. Vance: Iran "chosen not to accept our terms." Nuclear disarmament and Hormuz control remained unbridged. Trump announced a naval blockade of all Iranian port traffic Sunday evening; CENTCOM confirmed it begins April 13 at 10 a.m. ET. U.S. also weighing resumption of limited military strikes. The two-week (through April 22nd) ceasefire status looked extremely uncertain at the start of the week but returned late Tuesday morning. |
| Fed/Policy | Fed is expected to hold rates steady. Inflation remains above target and energy costs pressures will persist. The central bank cannot look through an energy shock that is simultaneously squeezing household budgets and raising inflation expectations. The bar for hiking rates is exceptionally high, however, and a rate cut is unlikely while inflation expectations are rising. |
| Risk Signal | The naval blockade has moved from tail risk to operational reality. WTI and Brent both rose back above $100 to start the week but retreated sharply on word of quiet overtures from Iran. PCC revises its scenario framework: the former downside scenario (blockade/escalation) is now the base case. The ceasefire is in limbo. Iran's threat to retaliate against any Gulf port raises the stakes of every vessel movement. |
Market Snapshot
| Indicator | Level | Context |
|---|---|---|
| Brent Crude | $97.89 / bbl | Stabilized $95–$100; post-blockade range |
| WTI Crude | $95.73 / bbl | Mid-$90s; blockade-day spike partially retraced |
| 10-Yr Treasury | 4.30% | 4.30–4.35%; sticky inflation premium |
| 2-Yr Treasury | 3.82% | Curve +51 bps (2s10s) |
| National Avg Gasoline | $4.16 / gal | ↑ from $3.41 pre-war |
| National Avg Diesel | $5.67 / gal | ↑ sharply; record territory |
| Gold | ~$4,760 / oz | Safe-haven premium; clearest market signal |
| Fed Funds Target | 3.50–3.75% | On hold; no cut priced 2026 |
| UMich Sentiment | 47.6 | Record low (prelim. April) |
| 1-Yr Inflation Exp. | 4.8% | Highest since 2023 |
Sources: Reuters, WSJ, EIA, CME Group, University of Michigan. As of market open April 14, 2026.
“A truce is not the same as peace. A ceasefire stops the shooting. It does not restart the tankers.”
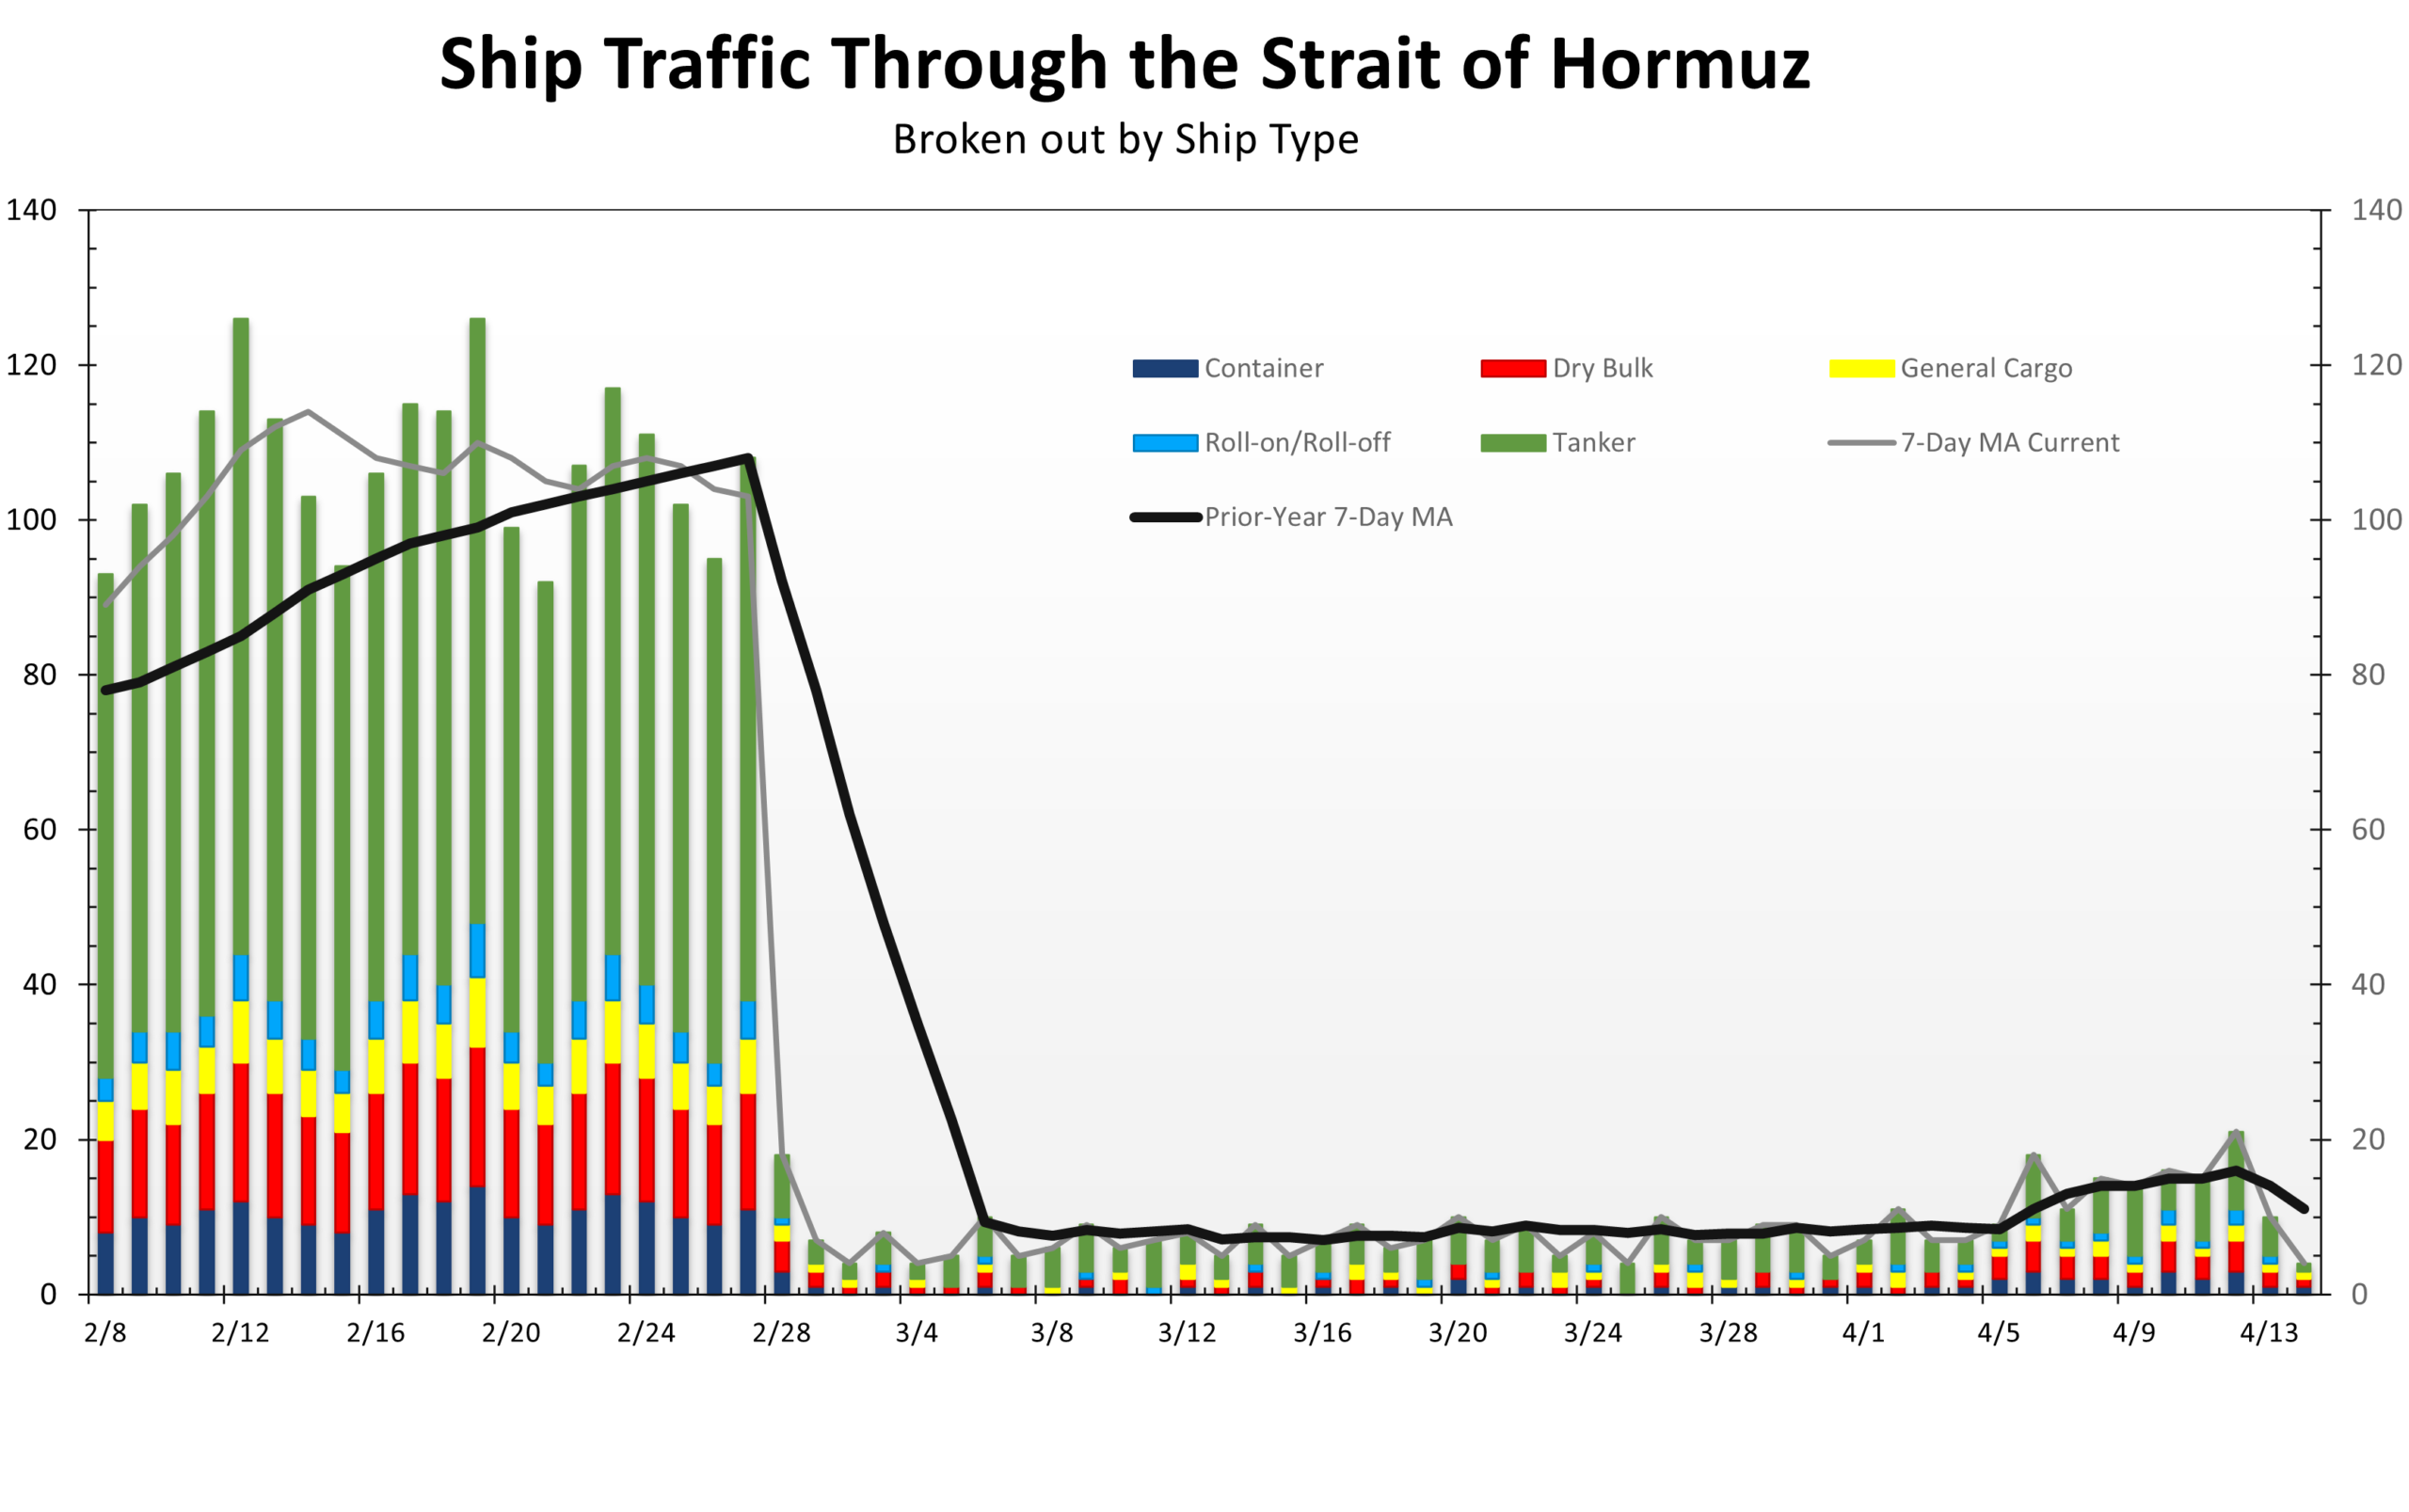
The Macro Backdrop: The Shock Is Gaining Traction
Two weeks ago, the economy appeared to have the forward momentum to outrun the energy shock. This week's data suggests otherwise. The transmission from higher energy prices is showing up, unevenly, in consumer prices, consumer sentiment, and behavior at the pump. The economy still has forward motion, but it is now more dependent on long-lived business fixed investment than it was a month ago.
March CPI was the week's pivotal release. Headline consumer prices surged 0.9% month over month, the largest gain in nearly two years, lifting the year-over-year rate to 3.3%. The composition, however, tells the most important story. Gasoline prices jumped 21.2% — the single largest monthly increase ever recorded for that series. The price of diesel fuel rose 30.8%. Together, energy accounted for nearly three-quarters of the entire monthly advance. Strip out energy (food prices were unchanged), and inflation rose just 0.2%, the same as it rose in February. Core CPI held at 2.6% year-over-year.
The composition of the release matters more than the headline itself. The first-round energy shock is now fully embedded in the March data, and the next question is whether the broader pass-through follows. Higher fuel costs raise transportation and logistics expenses, which feed into goods prices, services, and ultimately wages. We expect elevated fuel costs to work their way through the production channel over the next two to three months. Iran has every incentive to extend the conflict, knowing that pain at the pump will exert political pressure on President Trump.
Key Signal
This Is Not Yet a Generalized Inflation Breakout
Core CPI at 2.6% is stable and the energy shock has not yet propagated into wages or broad services — that remains the good news. But Tuesday's PPI data adds an important new layer: Final Demand PPI accelerated to +4.0% YoY, goods prices surged +1.6% MoM on energy, and the pipeline transmission from energy to wholesale costs is now confirmed. The next two CPI prints and the April PPI will determine whether this remains an energy-led squeeze or the beginning of a sustained breakout. We expect something in between — with near-term pressure concentrated in logistic-sensitive goods — but the bar for the Fed to look through this has risen materially.
The Consumer: From Sentiment to Behavior
The consumer side of the economy deteriorated sharply this week, and in a way that matters more than a single data point normally would. The University of Michigan's preliminary April sentiment index fell to a record low of 47.6. One-year inflation expectations rose to 4.8%. Long-run expectations moved to 3.4%.
The long-run reading is the one to watch. Long-run inflation expectations are the anchor of the Fed's credibility framework, and the entire argument for looking through an energy-driven headline spike rests on households and businesses believing inflation will return to target. At 3.4%, that anchor is loosening. Consumer expectations for inflation have always run well ahead of financial market measures and the Fed's preferred gauges, such as the New York Fed's consumer survey, so a single reading is not itself a policy trigger. Even so, rate cuts are likely off the table while consumer inflation expectations are drifting higher.
More importantly, the deterioration is no longer confined to surveys. It is now visible in behavior. Drivers are cutting back as average gasoline prices reached $4.16 nationally and diesel hit $5.67. The estimated increase in consumer spending on gasoline and diesel has reached $10.4 billion; money that is no longer being spent on restaurants, entertainment, appliances, travel, or any of the categories that support service sector employment. This is the classic mechanism by which an oil shock converts from an inflation headline into a growth headwind.
The latest personal income and spending data showed the economy had a little less momentum ahead of the conflict. Nominal personal income fell 0.1% in February, largely reflecting sharp declines in personal dividend income ($39.7 billion) and government transfer receipts ($21.6 billion, led by lower Affordable Care Act-related social benefits). This was only partly offset by solid gains in compensation. Personal spending, which tends to more closely track wages and salaries, rose 0.5%, which still outpaced the 0.2% rise in wages and salaries. The saving rate slipped to 4.0%, leaving households little cushion.
Risk Factor
Inflation Expectations Are the Fed's Red Line — and They Are Moving
The Federal Reserve can look through a temporary energy-driven headline spike. It cannot look through deteriorating long-run inflation expectations. At 3.4%, the University of Michigan's long-run measure has not crossed the threshold that forces a policy response. Two more readings at or above current levels would restrict the Fed's ability to counteract the drag on spending. The Fed will have a hard time cutting interest rates while long-term inflation expectations are rising.
Key Data: PPI & NFIB (Released April 14)
Two key data releases this morning sharpen the economic picture. The March Producer Price Index came in softer than the headline feared but still alarming in its composition: Final Demand PPI rose +0.5% MoM (below consensus of +1.1%), but the 12-month rate accelerated to +4.0% YoY — the hottest reading since February 2023 and up sharply from February's +3.4%. Goods prices jumped +1.6% MoM, driven heavily by energy and gasoline, while services prices were flat. The message is clear: the energy shock is now feeding directly into wholesale costs and the producer pipeline, even as month-over-month momentum was somewhat softer than feared. Flat PPI services prices suggest margins are being squeezed initially, as higher energy prices reduce real incomes and make it more difficult for businesses to pass along their higher costs. April Core CPI read will reveal whether this pipeline pressure is accelerating into final consumer prices.
The NFIB Small Business Optimism Index for March fell 3.0 points to 95.8, slipping below its 52-year average of 98.0 for the first time since April 2025. The Uncertainty Index surged 4 points to 92, far above its long-term average of 68. Net profits dropped sharply (–11 points to net –25%). NFIB Chief Economist Bill Dunkelberg explicitly blamed the "dramatic spike in oil prices" for raising input costs, spooking business owners, and forcing price pass-throughs. Taken together, PPI and NFIB confirm that the energy shock has moved beyond the pump and is now embedded in wholesale price dynamics while visibly eroding Main Street confidence and margins. The economy is beginning to transition from an inflation shock to a growth headwind.
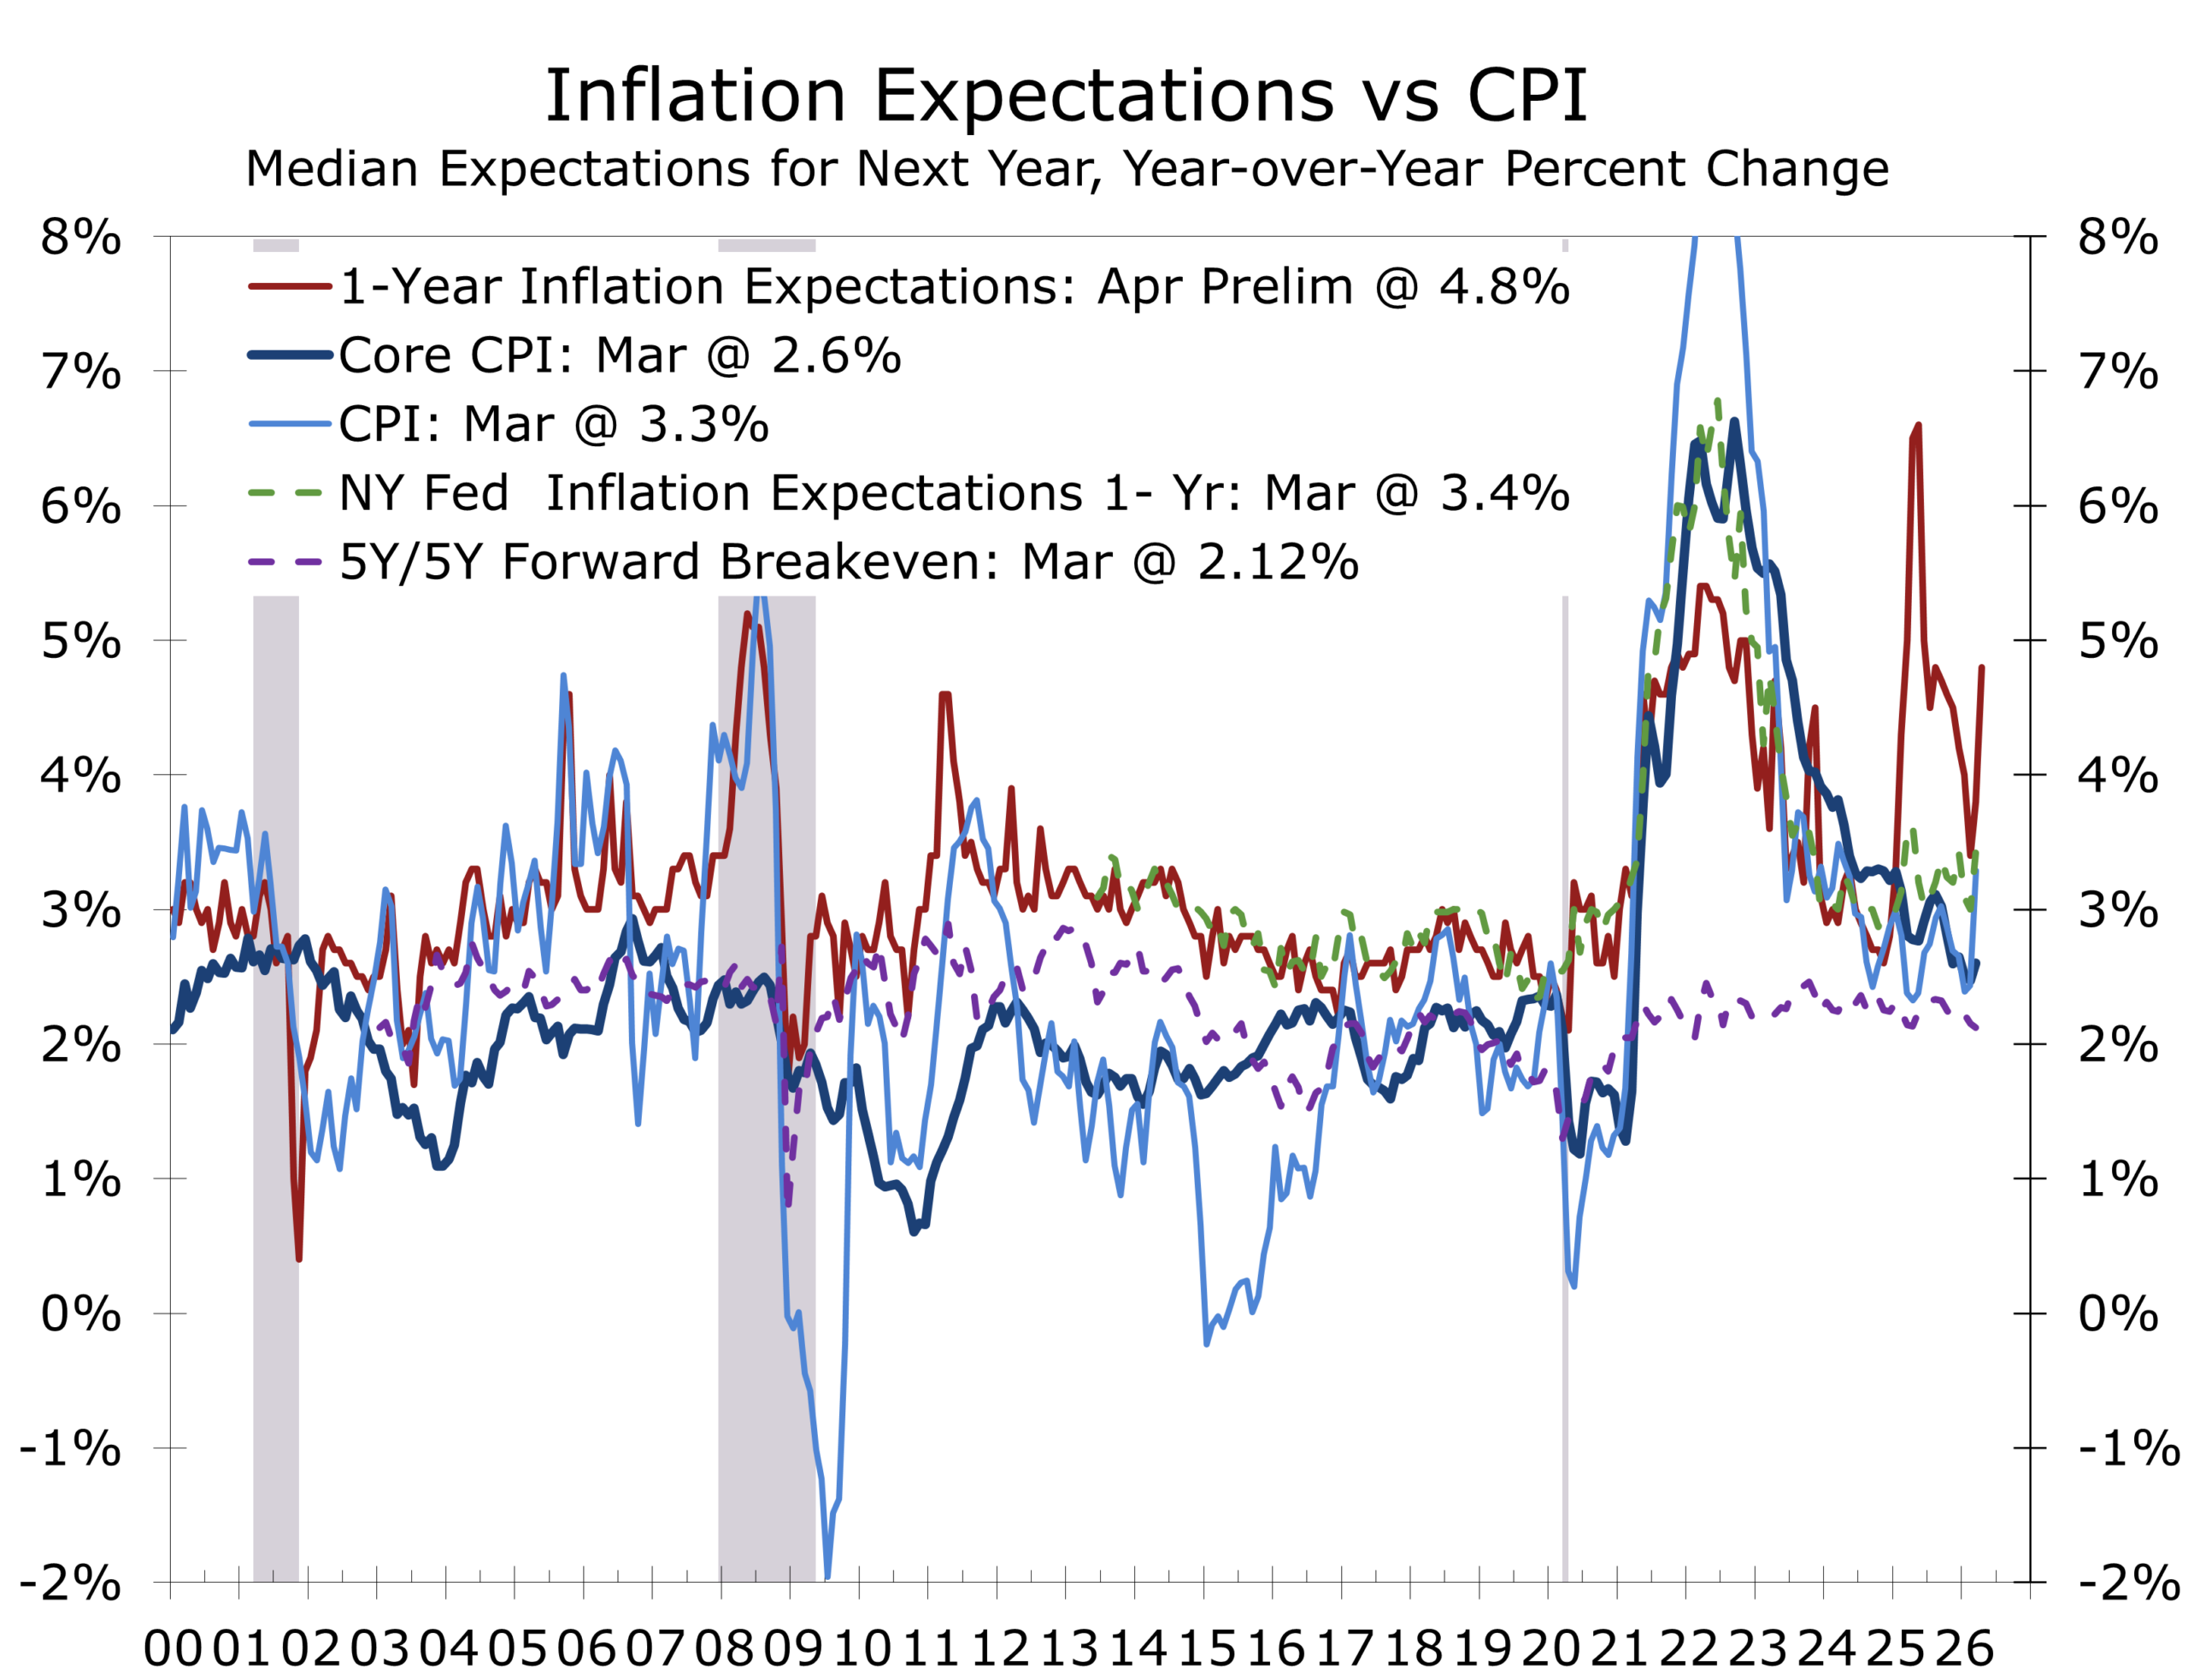
Geopolitics & Energy: A Ceasefire Is Not a Resolution
The relief rally built on ceasefire optimism has fully reversed. Markets were still pricing lower risk as late as Friday, with WTI at $95.73 and Brent at $97.89. That tone changed dramatically after 21 hours of direct talks in Islamabad collapsed on Sunday. The U.S. delegation — led by Vice President JD Vance, Steve Witkoff, and Jared Kushner — walked away without a deal. Iran's team, led by Parliament Speaker Mohammad Bagher Ghalibaf and Foreign Minister Abbas Araghchi, refused to surrender control of its nuclear enrichment program or cede leverage over the Strait of Hormuz. Tehran appears convinced that time is on its side and has internalized the pervasive "TACO" narrative circulating in social media and parts of the legacy press.
President Trump responded Sunday evening by announcing a naval blockade of all vessels entering or departing Iranian ports on the Arabian Gulf and Gulf of Oman. CENTCOM confirmed enforcement began April 13 at 10 a.m. ET. In the first 24 hours, no ships breached the blockade and six merchant vessels were directed to turn around. Oil prices immediately surged above $100 in early Asian trading Monday before partially retreating Tuesday to roughly $95–$98 as diplomatic signals resurfaced. President Trump stated that Iran had reached out seeking a deal, and a second round of talks in Pakistan is reportedly under active discussion.
Diplomatic channels remain open but narrow. Back-channel contacts have narrowed gaps on the nuclear file, though core differences persist: the U.S. proposed a 20-year suspension of all Iranian nuclear activity with strict verification; Iran countered with a 3-to-5-year halt. Ending Iran's nuclear ambitions and curbing its support for terrorist proxies remain non-negotiable for President Trump. The blockade is now operational, yet talks may resume as early as this week. Iran's next move remains the single most important variable for markets. The prior base case of a quick ceasefire extension has been overtaken by events.
The bond market's skepticism of last week's equity relief rally has been vindicated. The 10-year Treasury yield, which held steady near 4.30–4.35% through the ceasefire week, has now traded back down to 4.254%. Fixed income was pricing only a pause, not a resolution — and that caution looks increasingly prescient.
The Strait of Hormuz remains the central transmission channel to the real economy. Iran has effectively closed the waterway to nearly all foreign vessels since the war began on February 28, demanding control and fees for passage. The brief ceasefire produced only a trickle of commercial traffic (roughly 15 ships total versus a pre-war daily average of 138), with Iran charging $1–2 million tolls per vessel and conditioning passage on political relationships. The new U.S. blockade — targeting all maritime traffic to and from Iranian ports as well as any vessels paying Iranian tolls — adds a second layer of restriction. Tankers in the Persian Gulf have already begun diverting. Iran's military has warned that any threat to its port security will render "no port in the Persian Gulf and the Arabian Sea safe." This is an operational constraint in effect today, not rhetoric.
The standoff has prompted sharp downward revisions from multilateral institutions. The IMF has cut its global growth outlook and warned that sustained oil prices above $100 into 2027 would push the world economy to the brink of recession. The IEA has similarly slashed its forecasts for global oil supply and demand growth. IEA Executive Director Fatih Birol has warned that April could prove twice as difficult as March for global energy supplies, with diesel and jet-fuel shortages the most acute near-term risks in Asia and Europe. At the Semafor World Economy Summit, Birol described the Hormuz crisis as one that will "redraw the global energy map."
The Strategic Petroleum Reserve merits close attention. The U.S. executed a second SPR loan of 8.48 million barrels this week. The SPR now stands at 413.3 million barrels — its lowest level since the 1980s. Washington still has tools, but it does not have unlimited cushion.
Geopolitical Framework
The naval blockade — previously viewed as a 15–25% tail risk — is now an operational reality. Our revised probability distribution is as follows:
- 40% chance the blockade produces Iranian concessions within 10–15 days and talks resume before April 22;
- 40% probability the blockade holds, the ceasefire lapses on April 22, and hostilities resume at higher intensity (Iran remains convinced time is on its side);
- 20% tail risk of Iranian military retaliation against Gulf port infrastructure or U.S. naval assets, triggering full re-escalation.
The Islamabad outcome was a definitive breakdown, not a pause. Both sides exchanged written positions in the most intensive engagement between the two countries in 47 years. Vance left the U.S.'s "final and best offer" on the table; future offers will be less generous and may include demands for a permanent U.S. military presence on strategic islands in the Strait.
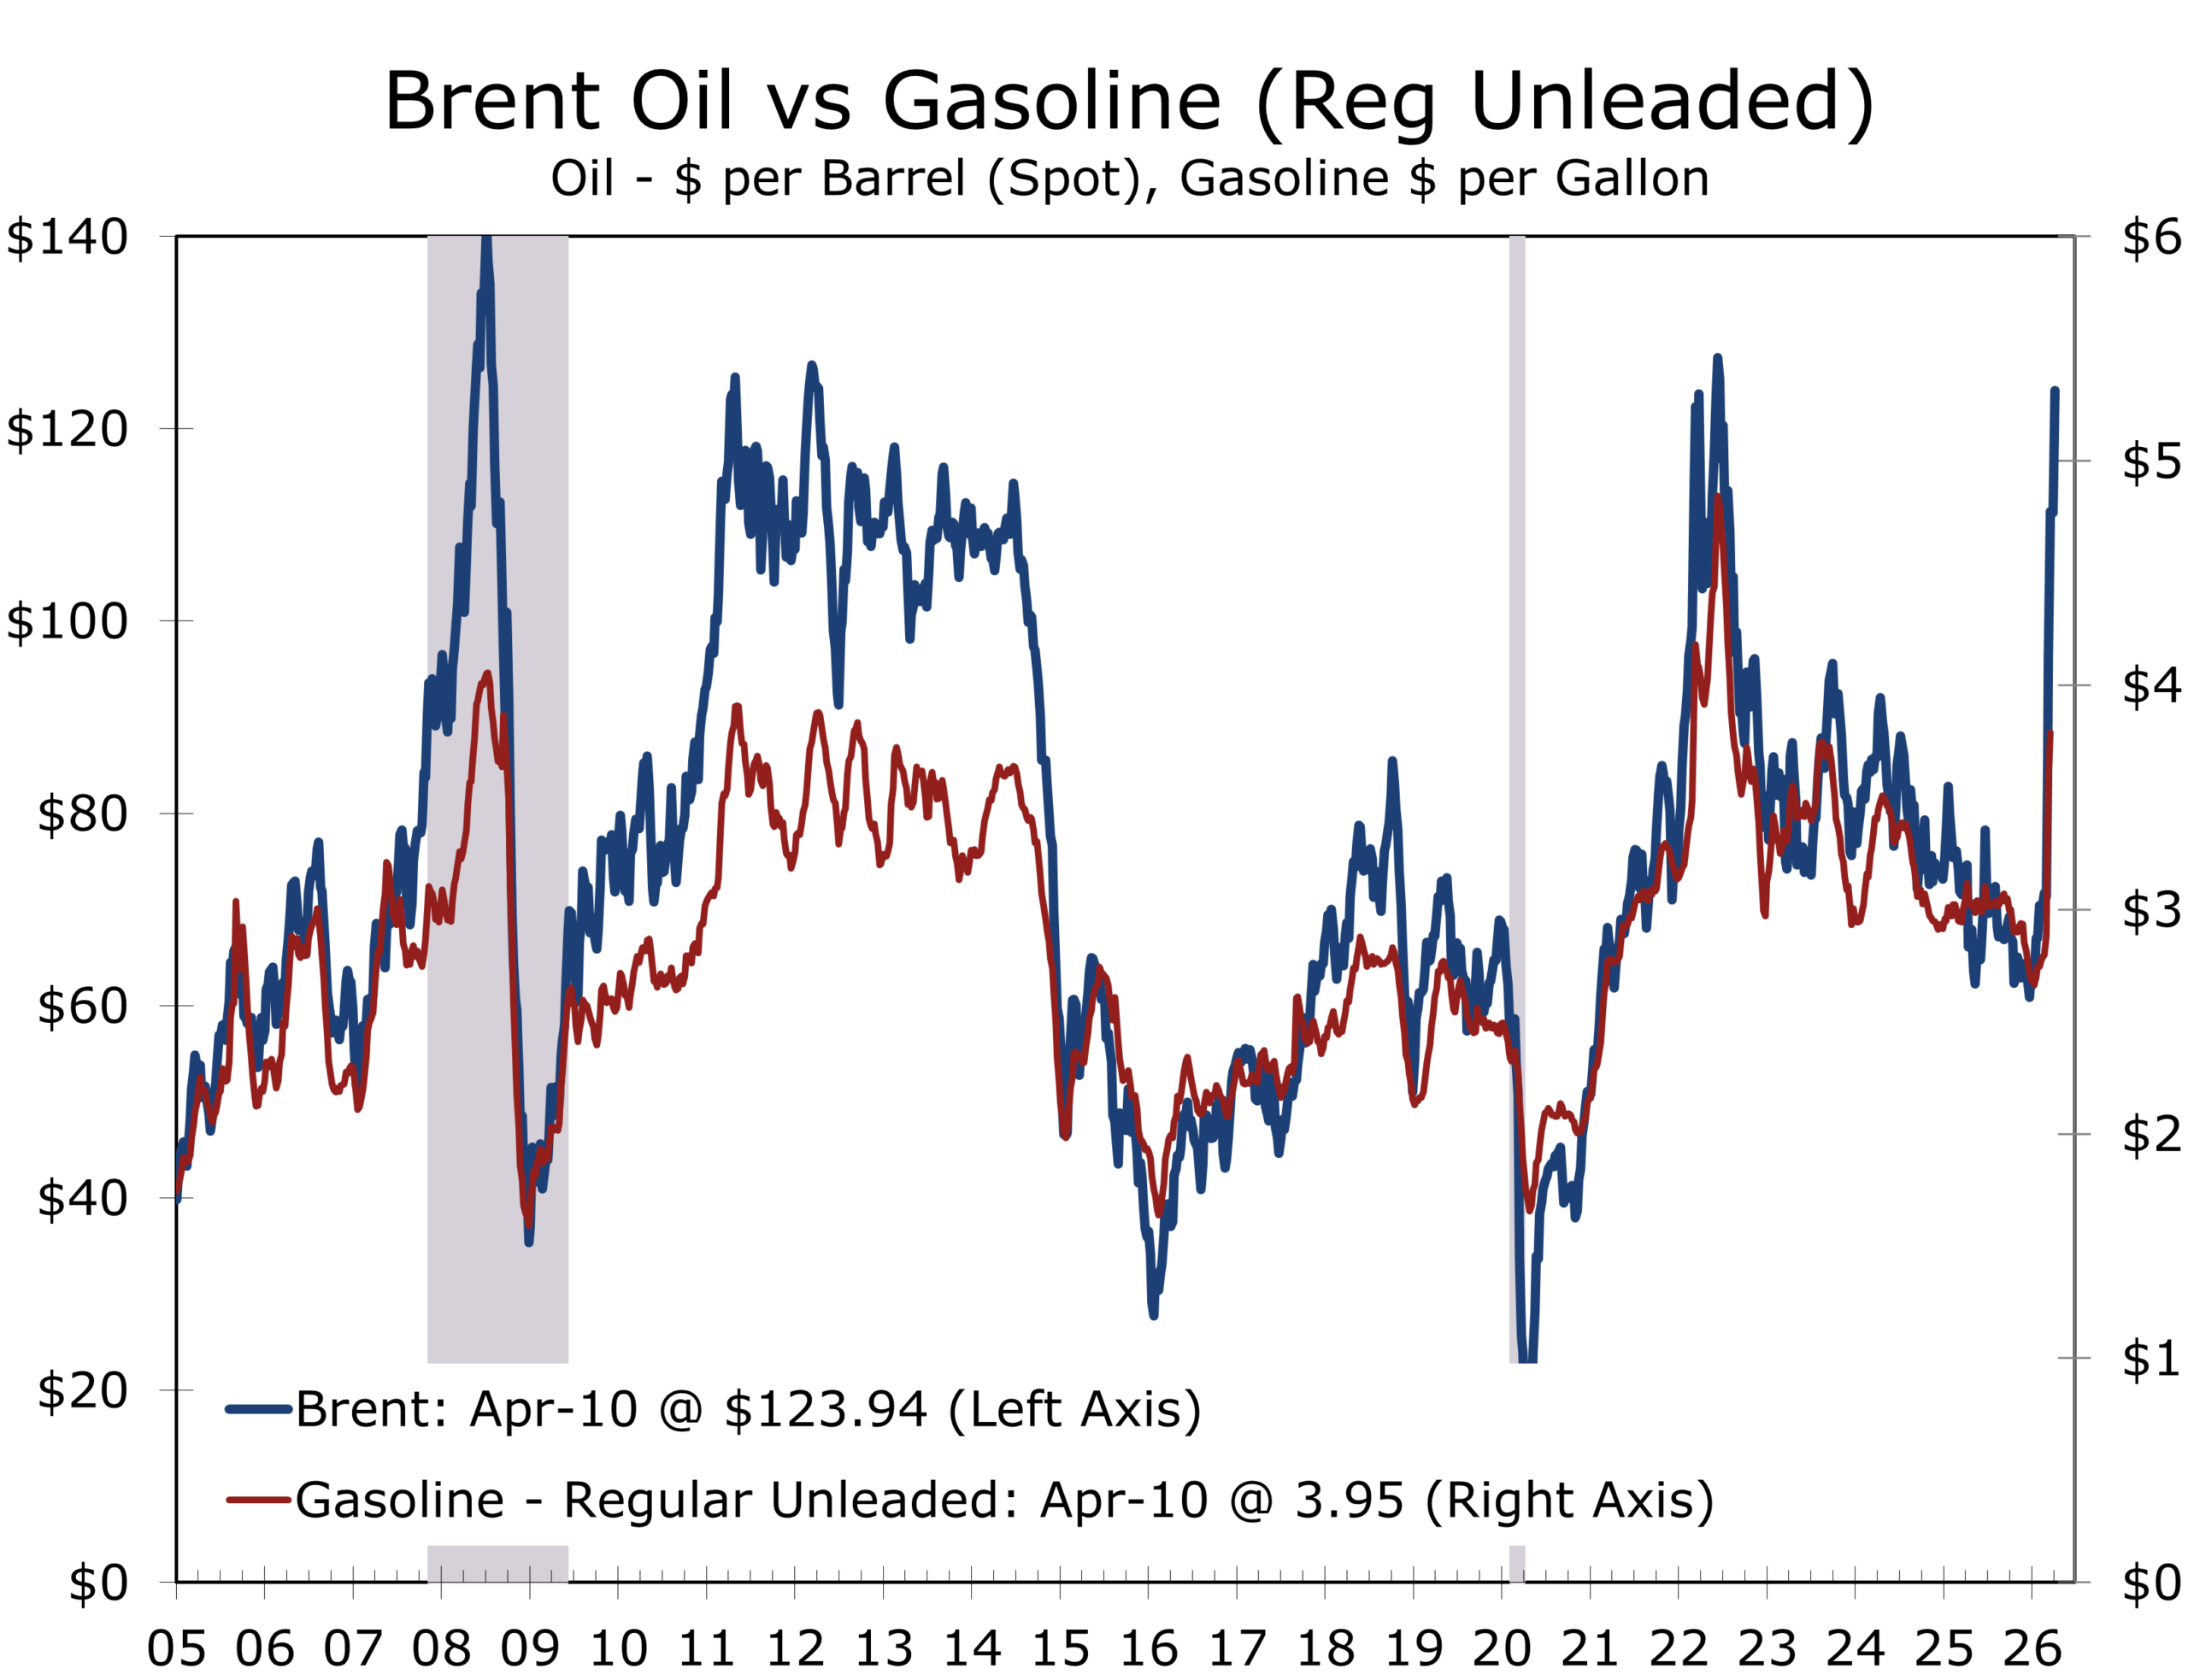
Markets & Financial Conditions: Relief, Not Resolution
The ceasefire-week equity rally was genuine in magnitude but has proven short-lived. As of Monday morning, markets are repricing the blockade reality: oil surged above $100 Monday before partially retracing to ~$96–98 Tuesday on Iran deal signals.
Today's energy shock differs structurally from the 1970s, thanks to a robust U.S. domestic production base, greater non-OPEC supply diversity, and a more aggressive SPR posture. None of those advantages ease the immediate supply arithmetic and impact on prices. The blockade has removed Iranian export volumes from global markets on top of the existing Hormuz transit disruptions, leaving open questions of how high oil prices go and how long they stay there.
The Federal Reserve remains firmly on hold. The FOMC had no analytical cover to cut rates even during last week's brief ceasefire window, with core CPI at 2.6% and inflation expectations drifting higher. With the naval blockade adding fresh supply pressure, rate cut discussion is off the table for the foreseeable future. Gold's resilience near $4,760 per ounce, with only modest give-back during the relief rally, is arguably the clearest signal in the market. A Columbia University energy analyst warned on Sunday that elevated oil prices are likely to persist through year-end 2026, regardless of how the conflict resolves, given the time required to reopen the strait, repair damaged infrastructure and rebuild depleted stockpiles.
Key Signal
Watch the Bond Market, Not the Equity Market, for the Definitive Signal
Equities are pricing the probability of a ceasefire, while the bond market is pricing inflation persistence. Until the 10-year Treasury yield moves meaningfully below 4.20%, on confirmed Hormuz normalization and easing energy prices, the financial conditions signal is tighter than the equity tape suggests. Corporate borrowers and CFOs should calibrate to the bond market's read rather than the equity market's relief.
CFO & Treasurer Corner: What This Means for Corporate Finance
| Focus Area | Action & Rationale |
|---|---|
| Funding & Liquidity | The fixed-rate issuance window has narrowed materially. With the naval blockade live and oil holding in the mid-$90s with upside risk, the 10-year Treasury is likely to reprice higher from 4.30%. Issuers who acted last week captured a window that may not reopen for months. Priorities now are drawing revolvers, building cash buffers, and reviewing covenant headroom against a scenario in which EBITDA weakens 20–30% in H2. Floating-rate borrowers are fully exposed and should model credit spread widening of 75–125 bps. For many treasury teams, the operative question is no longer whether to lock in rates but whether the market is still open. |
| Energy & Input Costs | Brent jumped back above $101 on the blockade announcement before retracing into the upper $90s (currently $97.89) on reports of renewed back-channel contacts. Much of the ceasefire-week pullback has been given back, and the window to hedge or pre-buy fuel and freight inputs has narrowed. Firms that did not act should revise stress-test assumptions upward and model 2026 cost scenarios at $115 and $140 Brent. Prices are likely to remain elevated through year-end 2026 regardless of resolution, given the time required to clear mines, repair infrastructure, and rebuild depleted inventories. The pre-buy and hedge window is closing; act now or model sustained pain. |
| Working Capital | Higher energy and freight costs are a slow-moving working capital squeeze. Transportation and warehousing absorbed the first wave, with consumer goods, industrials, and food producers next in line. Companies running just-in-time supply chains with thin inventory buffers face the greatest margin risk in Q2–Q3. Map exposures now and build cycle-time assumptions into cash flow models. |
| Consumer Demand | This week's Michigan Sentiment reading is not a soft data concern to be dismissed. At 47.6, it is at levels associated with genuine demand contraction, not merely caution. Consumers who are paying $4.16 at the pump and expecting 4.8% inflation a year from now do not increase discretionary spending, particularly middle and lower middle-income households, where budgets were already exceptionally tight. Revenue forecasts built on 2025 trajectory assumptions need to be revisited. One bit of caution, however: the UMich survey has been much lower than other measures and may be more reflective of persistent pressures on middle and lower-middle income households. Higher-end consumers appear to be holding up reasonably well. |
| Scenario Planning | Revise Q2 board scenario materials now, as the prior base case is obsolete. Ken Griffin of Citadel argued at the Semafor World Economy Summit that a 6–12 month Hormuz shutdown would make a global recession "inevitable," which is a reasonable way to calibrate the downside. Build three explicit scenarios: Blockade Succeeds (40% probability), with Iran conceding within 10–15 days, talks resuming, Brent $95–115, and consumer spending at 1.4–1.9%; Blockade Stalemates (40%), with the ceasefire expiring April 22, hostilities resuming, Brent $120–140, credit spreads +75–125 bps, and a contracting consumer; Full Escalation (20%), with Iranian military retaliation against Gulf ports or U.S. vessels, oil above $140, rising global recession risk, and the Fed in a nearly impossible bind. All three are live scenarios today and should be treated as such. |
Scenario Framework
| Scenario | Probability | Macro & Market Implications | Corporate Finance Action |
|---|---|---|---|
| Base Case | 40% | Blockade produces Iranian concessions within 10–15 days; back-channel contacts reopen talks before April 22. Ceasefire formally extended. Mine-clearing accelerates. Partial Hormuz commercial reopening by early May. Brent $100+ | Draw revolvers now. Fixed-rate issuance window narrowed; may reopen if blockade resolves quickly. Stress-test energy/freight at $115 Brent. Liquidity buffers are not optional. Prepare for demand contraction through Q2. |
| Downside | 40% | Blockade stalemates; Iran does not concede. Ceasefire expires April 22 without extension; hostilities resume. Both U.S. blockade and Iranian counter-restrictions remain simultaneously. Brent $120–140. Inflation re-accelerates past 4%; consumer spending in genuine contraction. Fed in impossible bind. Credit spreads +75–125 bps. This scenario has moved from 30% downside to co-equal with the base case. | Accelerate fixed-rate issuance ahead of wider spreads. Model demand destruction in revenue forecasts. Limit new floating-rate exposure. Review covenant headroom. |
| Tail Risk | 20% | Iranian military retaliation against U.S. naval assets or Gulf port infrastructure triggers full re-escalation. Iran's military has already warned that no Gulf port will be safe if Iranian ports are threatened. Oil $140+. Global recession risk rises sharply. Dollar surges; EM stress. Possible Chinese involvement following reported air-defense weapons delivery to Iran. Fed in impossible position: recession and 5%+ inflation simultaneously. | Maximize liquidity. Draw revolvers preemptively. Halt discretionary capex. Model severe demand contraction. Accelerate supply-chain diversification. |
Variables to Watch — In Order of Importance
| Variable | Why It Leads |
|---|---|
| 1. Iran's military response to the blockade (next 24–48 hours) | The blockade went live at 10 a.m. ET Monday. Iran's military has already warned that if Iranian ports are threatened, "no port in the Persian Gulf and the Arabian Sea will be safe." Whether Iran retaliates kinetically against U.S. naval assets or Gulf port infrastructure is the single most consequential variable in global markets right now. A kinetic response would mark the definitive end of the ceasefire and trigger the tail-risk scenario. Silence or a back-channel contact would signal Iran is reassessing. Critically, Iran's onshore oil storage fills to capacity within roughly 13 days of the blockade, after which fields must shut in — a process that carries long-run negative consequences for Iranian oil production. Iran has a finite window before the economic pain becomes irreversible. Watch CENTCOM statements, Gulf shipping advisories, and any signal from Tehran's oil ministry in real time. |
| 2. Retail gasoline and diesel prices | Where households and freight operators feel the war. The $10.4B per-week drag on consumer spending will not reverse until pump prices decline. Track AAA daily and GasBuddy regional data for a real-time assessment. |
| 3. 10-Year Treasury yield | The bond market's verdict on whether this is transitory. If the 10-year holds above 4.30% as oil falls, the market is telling you that the inflation risk is moving beyond energy. A move above 4.50% would signal a materially tighter financial conditions environment. The latest move, back down to 4.25%, suggests a near-term agreement would limit damage to the economy this year. |
| 4. University of Michigan inflation expectations | At 4.8% one-year expectations, we are approaching the threshold where the Fed's credibility becomes a greater question. The risk is that higher gasoline prices become embedded in wage demands. If expectations rise further in the next two readings, the policy calculus changes, with the Fed remaining on hold for longer being the most likely result. |
| 5. Islamabad negotiations (April 22 deadline) | The most consequential non-data variable on the calendar remains the next phase of the standoff: ceasefire extension, a broader framework agreement, or outright collapse. Each outcome carries a distinctly different macro signature. Markets should be prepared for any of the three. Iran will test President Trump's resolve, betting that domestic political pressure will eventually force him to cave. We believe the President sees no acceptable alternative to an outcome that permanently denies Iran both a path to a nuclear weapon and the ability — or desire — to threaten commercial shipping through the Strait of Hormuz or its regional neighbors, whether directly or via proxies. This remains a tall order. One notable development on Monday: Trump said the "right people" in Tehran had reached out seeking a deal. If that proves to be a genuine back-channel signal rather than a tactical ploy, the probability distribution would shift materially toward the base case. Watch for any announcement of a second meeting before April 22. |
Looking Ahead: Week of April 14
| Day | Release / Event | Why It Matters |
|---|---|---|
| Monday Apr 13 | Hormuz ship count update (EIA/Reuters) | Blockade entered its first full day. Oil surged above $100 in Asian trading before settling in the mid-to-high $90s as Trump signaled renewed back-channel contacts with Tehran. Enforcement was confirmed across the Gulf, with no Iranian kinetic response; U.S. equity markets absorbed the news with modest pressure and bond yields held 4.30–4.35%. Iran's first meaningful response will be the critical read, with credit spreads, the VIX, and the 10-year Treasury confirming which scenario is being priced. |
| Tuesday Apr 14 | PPI (March); NFIB Small Business Optimism (March) | PPI (March): Final Demand +0.5% MoM, +4.0% YoY — hottest since Feb 2023; goods +1.6% MoM on energy, services flat. Confirms energy-to-producer-pipeline transmission is live. NFIB Optimism fell to 95.8, below 52-yr average; Uncertainty Index hit 92. Empire State Mfg and Retail Sales (March) still to come; focus on the control group ex-autos, gas, and building materials. |
| Wednesday Apr 15 | Empire State Manufacturing (April); Retail Sales (March); Industrial Production (March); Beige Book | Retail Sales will show whether consumers have already begun pulling back on discretionary categories, with the control group (ex-autos, gas, and building materials) the cleanest read. Empire State gives an early April snapshot of factory conditions post-blockade. The Beige Book will offer the most textured view yet of how the energy shock is flowing through supply chains, labor costs, and corporate pricing. |
| Thursday Apr 16 | Initial Jobless Claims; Housing Starts (March); Philadelphia Fed | Claims above 220K would begin to crack the 'no-hire, no-fire' equilibrium. Housing starts will show whether rate sensitivity has been overtaken by sentiment deterioration. |
| Friday Apr 17 | Leading Indicators (March); Existing Home Sales (March) | Leading Indicators will offer an early read on whether the energy shock is pulling the broader cycle lower. Existing Home Sales will show how quickly the deterioration in sentiment is spreading to housing. Any Islamabad communiqué released over the weekend should be read carefully Monday morning. |
| April 22 | Ceasefire Expiration Deadline | Ceasefire expiration. Islamabad produced no deal and no scheduled follow-on, and the U.S. has left its final offer on the table. Iran's posture in the strait, in back-channels, and in its public statements between now and April 22 is the single most consequential variable for Q2 macro and markets. Positioning for each scenario should not wait until this date arrives. |
Piedmont Crescent Capital Economic Forecast
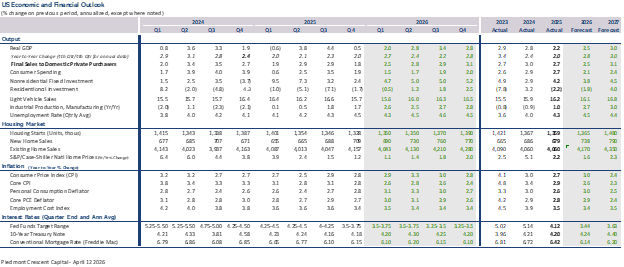
Concluding Thoughts
The prior read on CPI, Michigan sentiment, and the pump-price drain still stands. This morning's data has made each element harder to dismiss. March PPI accelerated to +4.0% year-over-year — the hottest print since February 2023 — with goods prices surging on energy even as the month-over-month headline came in slightly softer than feared. NFIB Small Business Optimism fell below its 52-year average for the first time since April 2025, and the NFIB chief economist pointed directly at the "dramatic spike in oil prices" for weakening confidence and forcing price pass-throughs. The energy shock is now showing up simultaneously in wholesale prices, Main Street margins, and small-business hiring intentions.
Diplomacy ran out of room relatively quickly in Islamabad as both sides tested one another's resolve. The picture on Tuesday was more encouraging than the blockade rhetoric might suggest. U.S.-Iran talks could resume as early as this week, even with the blockade in place, though both sides remain far apart on nuclear enrichment and Hormuz leverage. The blockade is imposing a steep daily cost on Iran's economy as onshore storage approaches capacity. Citadel's Ken Griffin has called a prolonged Hormuz shutdown a plausible path to global recession, though the drag would fall more heavily on the rest of the world than on the U.S. IEA Director Birol says the episode will "redraw the global energy map." Both views assume no negotiated resolution — which we believe is too pessimistic. The back-channel contacts reported this week leave room for an off-ramp, and the Iranian public has its own reasons to prefer a government that is not treated as a pariah.
The question that defined last week — whether back-channel contacts would produce a second round of talks before April 22 — has been replaced by a harder one: whether a naval blockade can extract the concessions that 21 hours of direct talks could not. The Strait of Hormuz remains the single most important indicator for global markets, though the relevant variable has shifted from the daily ship count to Iran's next move. Trump's suggestion on Monday that senior Iranian figures had reached out is worth watching closely. If that back-channel contact is genuine and produces a second meeting before April 22, our probability distribution shifts toward resolution. If it is merely a delaying tactic, the economic arithmetic of the blockade will force Iran's hand before much longer.
Variables to Watch (in order of immediacy)
- Iran's military response in the next 24–48 hours. This is the immediate escalation test. Tehran has already warned that no port in the Persian Gulf and the Arabian Sea will be safe if its own ports are threatened. Whether that warning turns kinetic will determine if we are in a coercive negotiation or a hot war.
- Any signal of Iranian flexibility via back channels before April 22. Vance has said diplomacy is not over, but the U.S. is now negotiating with a blockade rather than a proposal. Trump's claim that Iran's "right people" reached out — and U.S. confirmation that a second meeting is being discussed — is the most important signal of the day.
- Retail pump prices. The $10.4 billion weekly transfer from household budgets to fuel spending will not reverse until the Strait reopens. A Columbia University energy analyst warned Sunday that meaningful relief is unlikely before late 2026. Energy Secretary Wright echoed this at the Semafor World Economy Summit, saying prices will be "high and maybe even rising" until meaningful ship traffic resumes.
- Long Treasury yields. Watch whether the 10-year breaks above 4.50%. That would confirm the market has abandoned near-term easing hopes and is pricing persistent inflation into 2027.
- Chinese policy signals. Beijing buys the bulk of Iran's oil and has the most to gain from a negotiated resolution. Yet U.S. intelligence now suggests China may be preparing to supply air-defense weapons to Iran, adding a great-power dimension to the conflict.
Mark P. Vitner, Chief Economist, Piedmont Crescent Capital · Updated April 14, 2026
© 2026 Piedmont Crescent Capital. For informational purposes only.
Consumer Price Index — March 2026: Energy Shock Lifts Headline; Core Inflation Remains Contained

| Key Concept | Findings |
|---|---|
| Headline CPI | +0.9% MoM in March 2026 — the largest monthly increase in nearly two years, lifting the year-over-year rate to 3.3%, up sharply from 2.4% in February. |
| Energy | Prices surged 10.9%, led by a 21.2% spike in gasoline — the largest single-month jump on record — and accounted for nearly three-quarters of the overall monthly increase. |
| Core CPI | +0.2% MoM (slightly less than expected), holding the annual rate at 2.6%. Core inflation remains stable and consistent with the Fed's disinflation trajectory. |
| Shelter | Rose 0.3%, with rent and owners' equivalent rent advancing at a similar pace. Year-over-year shelter inflation has declined to 3.0%, continuing its gradual cooldown. |
| Food | Flat for the month, with grocery prices declining modestly. Year-over-year food inflation stands at 2.7%, well below peak levels, though cumulative price levels remain approximately 30% above pre-pandemic levels. |
| Policy Signal | The March spike is energy-driven and unlikely to derail the broader disinflation trend. The Fed will focus on core inflation, not volatile headline readings. Rate cuts, if pursued, represent insurance, not stimulus. |
A Headline Surge Driven by Energy, Not Demand
March's CPI report carries a misleading headline. At +0.9% month-over-month — the largest monthly gain in nearly two years — it pushed the year-over-year rate to 3.3%, up sharply from 2.4% in February.
The composition tells a very different story.
Energy prices surged 10.9%, with gasoline alone jumping 21.2% — the largest single-month increase on record for that series and responsible for nearly three-quarters of the total CPI advance.
Strip out energy, and inflation remains well-behaved. The distinction matters. Energy functions as a tax on household budgets and a source of headline volatility, but it does not generate sustained inflation unless it propagates into wages and expectations. Provided the Fed does not accommodate the spike — and there is no indication it intends to — the broader inflation impact should prove modest. Higher gasoline prices simply crowd out spending elsewhere, reducing pricing power across the rest of the economy.
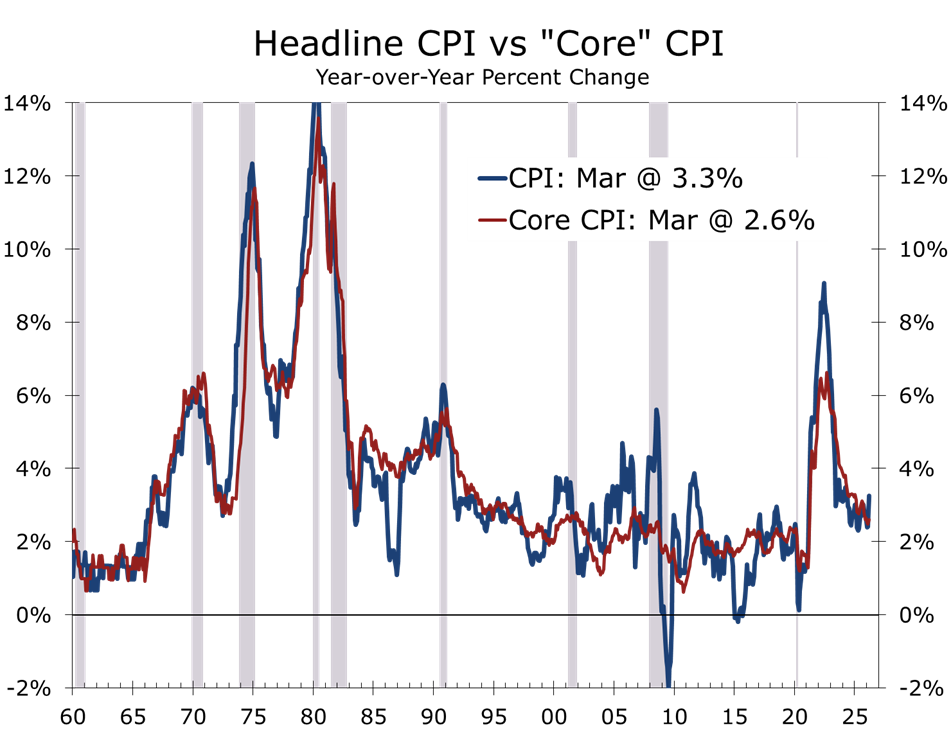
Core Inflation: Steady and Contained
Core CPI rose 0.2% in March, matching February's pace and extending the disinflation trend. At 2.6% year-over-year — roughly in line with the series' long-run average — core inflation is within striking distance of the Federal Reserve's 2% objective.
The composition is favorable on balance. Core goods prices continue to deflate — used vehicles fell 0.4% and are down more than 3% year-over-year — and supply chains remain stable. Squeezed household budgets and elevated uncertainty are prompting consumers to defer discretionary purchases, further dampening pricing power across non-energy categories.
Services inflation remains the stickiest element of core, but momentum is fading. Airline fares jumped 2.7%, and education costs edged higher, but medical care prices declined, providing a meaningful offset. The trend within services is one of gradual, uneven moderation.
Full CPI Component Breakdown — March 2026
Sources: U.S. Bureau of Labor Statistics, CPI-U, March 2026 release. All figures seasonally adjusted (MoM); YoY figures non-seasonally adjusted per BLS convention.
| Component | MoM Change | YoY Change |
|---|---|---|
| All Items (Headline) | +0.9% | +3.3% |
| Core CPI (ex-Food & Energy) | +0.2% | +2.6% |
| Energy | +10.9% | +12.5% |
| Gasoline | +21.2% | +15.8% |
| Electricity | +0.9% | +3.6% |
| Fuel Oil | +5.5% | +8.2% |
| Food (All) | 0.0% | +2.7% |
| Food at Home (Grocery) | −0.2% | +2.3% |
| Food Away from Home | +0.3% | +3.4% |
| Shelter | +0.3% | +3.0% |
| Rent of Primary Residence | +0.2% | +3.1% |
| Owners' Equivalent Rent | +0.2% | +3.0% |
| Services (ex-Energy) | +0.3% | +3.8% |
| Airline Fares | +2.7% | +1.4% |
| Medical Care Services | −0.2% | +2.1% |
| Goods (ex-Food & Energy) | −0.1% | −0.4% |
| Used Cars & Trucks | −0.4% | −3.2% |
| Apparel | +0.2% | +1.0% |
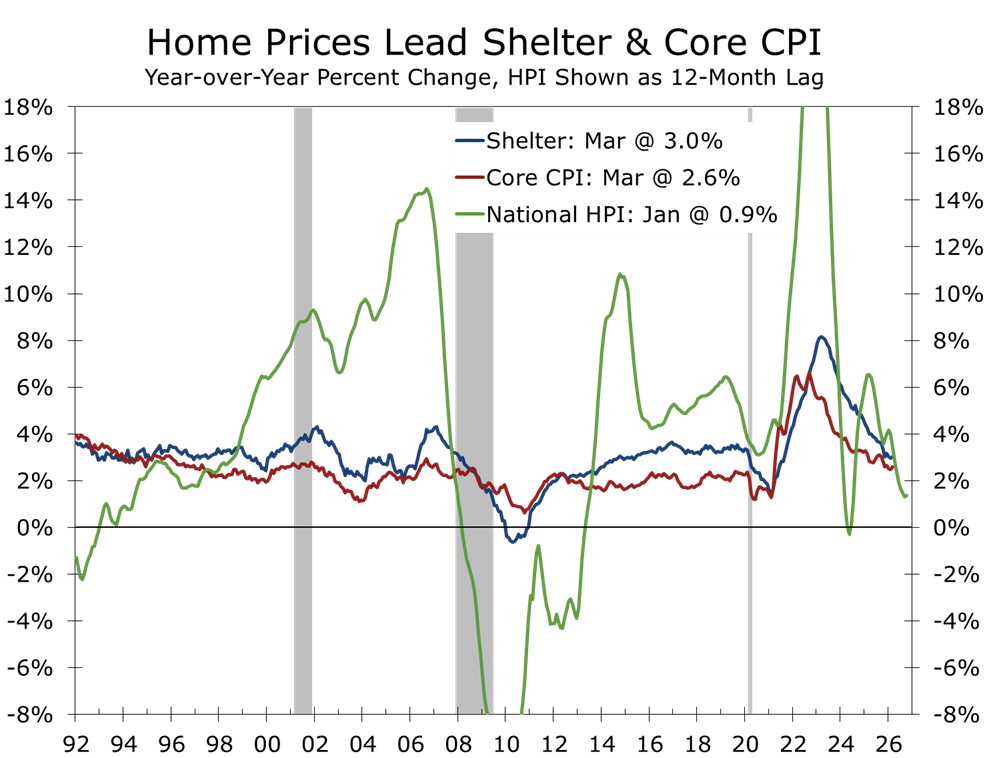
Shelter: Gradual Cooling Continues
Shelter rose 0.3% in March — rent and owners' equivalent rent each up approximately 0.2% — continuing the slow but durable deceleration from the 8%-plus peaks reached in 2023.
The underlying drivers remain intact. Market rents have softened across many regions, particularly in areas with elevated multifamily supply. Demand for rental apartments remains strong but has lost some momentum over the past year, reflecting the slowdown in job growth. Home price appreciation has slowed, and affordability constraints are limiting upward pressure on housing costs. Home prices feed into shelter costs with a long lag, so the recent improvement has more room to go.
Given shelter's outsized weight in CPI — roughly one-third of the overall index and 44% of the core CPI — this gradual cooling remains central to the broader disinflation narrative. While it may seem counterintuitive given long-running affordability challenges, the moderation in home price appreciation and rents will likely continue to be a potent force for disinflation over the next year to 18 months.
Food: Stable, With Relief at the Grocery Store
Food prices were unchanged in March, with grocery prices falling 0.2%. Declines were broad-based, including meats, cereals, and dairy products. Restaurant prices rose modestly, reflecting ongoing wage pressures in food services.
On a year-over-year basis, food inflation stands at 2.7%, well below peak levels. However, the cumulative burden remains significant: grocery prices are still roughly 30% higher than they were prior to the pandemic, continuing to shape consumer sentiment more broadly.
Energy: Volatility Returns
Energy prices rose sharply in March, reversing the disinflationary contribution seen earlier in the year. Gasoline surged 21.2% — the largest monthly jump on record for that series — fuel oil spiked, and electricity rose modestly.
On a year-over-year basis, energy inflation now stands at 12.5%, reintroducing meaningful volatility into the inflation outlook. The geopolitical backdrop — including the U.S./Israel war with Iran and its attendant supply disruptions — is the proximate driver.
Supply-driven energy shocks have historically proven transitory absent a sustained geopolitical disruption or a policy accommodation error. The U.S. economy is substantially less energy-intensive today than in the 1970s, and the Federal Reserve's commitment to price stability is considerably more credible. We do not expect the current energy spike to upend the longer-run disinflation trend, which remains clearly evident in core CPI and core services.
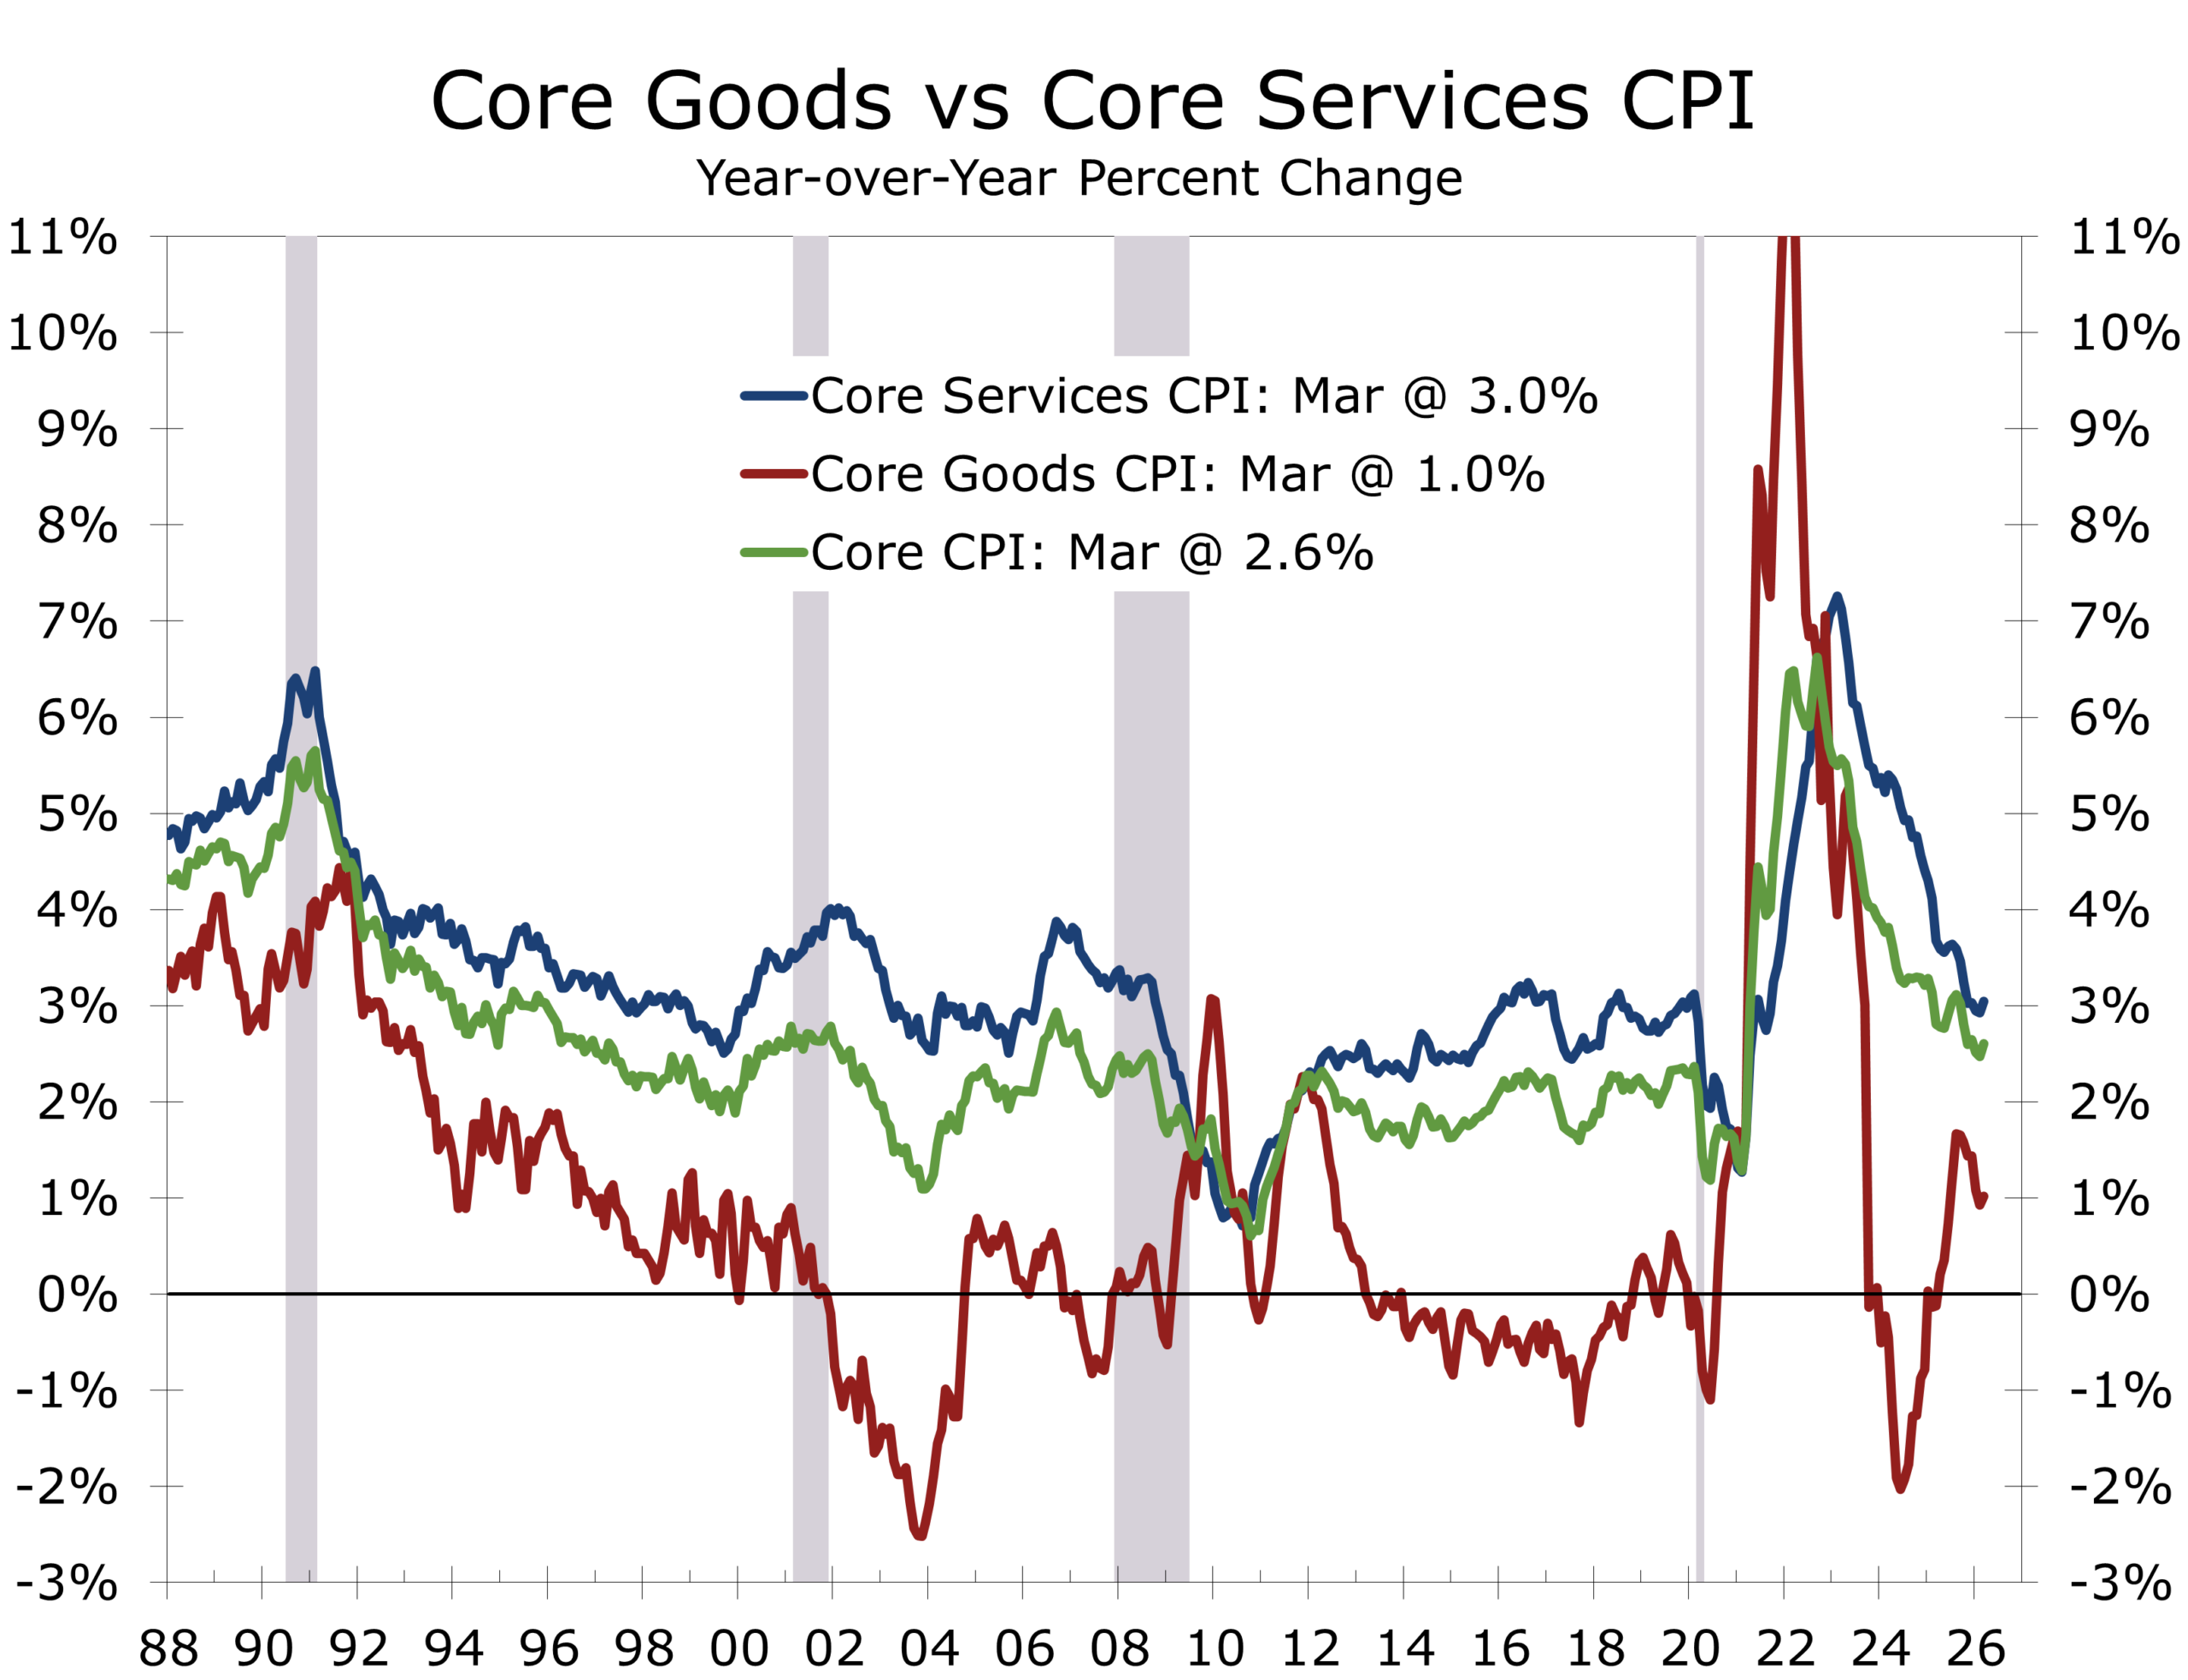
Inflation Is Narrowing, Not Reaccelerating
The March data reinforce a structural shift that has been building for over a year. The broad-based price pressure that defined the 2021–2022 inflation episode has given way to a far more concentrated pattern of price increases.
Energy is volatile. Goods prices are soft. Shelter is easing. Services remain the primary area of persistence, but even there, momentum is slowing as wage growth moderates and post-pandemic normalization runs its course.
Inflation is narrowing to fewer categories, and the categories still showing persistence are moderating. March should be read as a temporary deviation from a declining trend, not a reversal of it.
Policy Implications: Look Through the Noise
The operative question for the FOMC is whether to respond to the headline or the underlying trend. The data argue clearly for the latter. Core inflation is contained. Disinflation is proceeding. There is no evidence of a demand-driven resurgence.
Energy shocks do not ordinarily warrant a monetary policy response unless they trigger second-round effects in wages and inflation expectations. Neither dynamic is currently present. Five-year breakeven inflation rates have edged higher but remain well-anchored relative to 2022 levels, and wage growth is decelerating on trend.
The underlying economy remains two-speed. Structural investment in AI, defense, pharmaceuticals, and aerospace continues to support growth, while rate-sensitive sectors — housing, consumer durables, and small business formation — remain under pressure. Given the well-established lags in monetary policy transmission, the case for easing rests on cyclical support, not inflation containment.
Perspectives from Piedmont Crescent Capital
The following views represent our current assessment of the inflation landscape and its implications for monetary policy and portfolio positioning.
Bottom Line: Noisy but Not Alarming
March's CPI headline is louder than the signal it carries. The 0.9% monthly surge was driven almost entirely by the largest single-month gasoline price increase on record — a geopolitical supply shock, not a reflection of reaccelerating domestic demand.
Beneath the headline, the inflation landscape is constructive. Core CPI held at 2.6%. Shelter is decelerating. Food prices are flat. Goods deflation is broadening. The Federal Reserve's preferred inflation gauges have not materially deteriorated.
Energy is driving the noise, not the narrative. The disinflation trend remains intact. Policymakers and investors should resist the temptation to overreact to a print that should look considerably better in 60 to 90 days as the energy base effect fades.
Key Data Releases to Monitor
April 30 — Q1 Employment Cost Index
The single most important wage data point for the Fed's reaction function. Will clarify whether wage growth is decelerating on schedule.
April 30 — March PCE Deflator
Should rise less dramatically than the CPI — likely +0.6% to +0.7% — but will still register the energy shock. Core PCE should align with core CPI given moderation in medical care.
May 6–7 — Federal Reserve FOMC Meeting
Will clarify the Committee's intended posture: look through the energy spike (our base case), or lean gently against it. An outright policy response to energy-driven headline inflation would, in our view, be a policy error.
May 13 — April CPI
First test of whether energy prices are stabilizing or intensifying. The critical read for confirming the transitory thesis.
May 15 — April Retail Sales
Will show whether the energy shock has meaningfully curtailed discretionary spending.
(704) 458-4000
Full report — 8 pages, includes all charts & data tables
A View from the Piedmont: Navigating Growth Through an Energy Shock

A VIEW FROM THE PIEDMONT
"A shoal is not a storm. Storms are remembered. Shoals are run aground on slowly, while the crew debates whether the chart is wrong."
The past week brought a familiar but increasingly consequential divergence between the data we have and the risks we are still learning to price. The March employment report showed payrolls rising by 178,000, a strong reversal from February's revised decline of 133,000 and well above the consensus estimate of 59,000. On the surface, this looks like a resilient economy. But the underlying details, combined with what is happening in energy markets, tell a more measured and sobering story.
Oil ended the week with Brent near $109 per barrel and WTI above $111 — the market's highest sustained levels since 2022 — following President Trump's pledge to escalate military action against Iran with no concrete plan to reopen the Strait of Hormuz. Treasury yields held near 4.31% on the 10-year even as growth concerns persisted, and gold settled around $4,677 per ounce after a volatile week shaped by stronger than expected reports on nonfarm employment, retail sales, and consumer confidence. Financial conditions have tightened, reflecting higher energy prices and their likely near-term spillover into grocery prices.
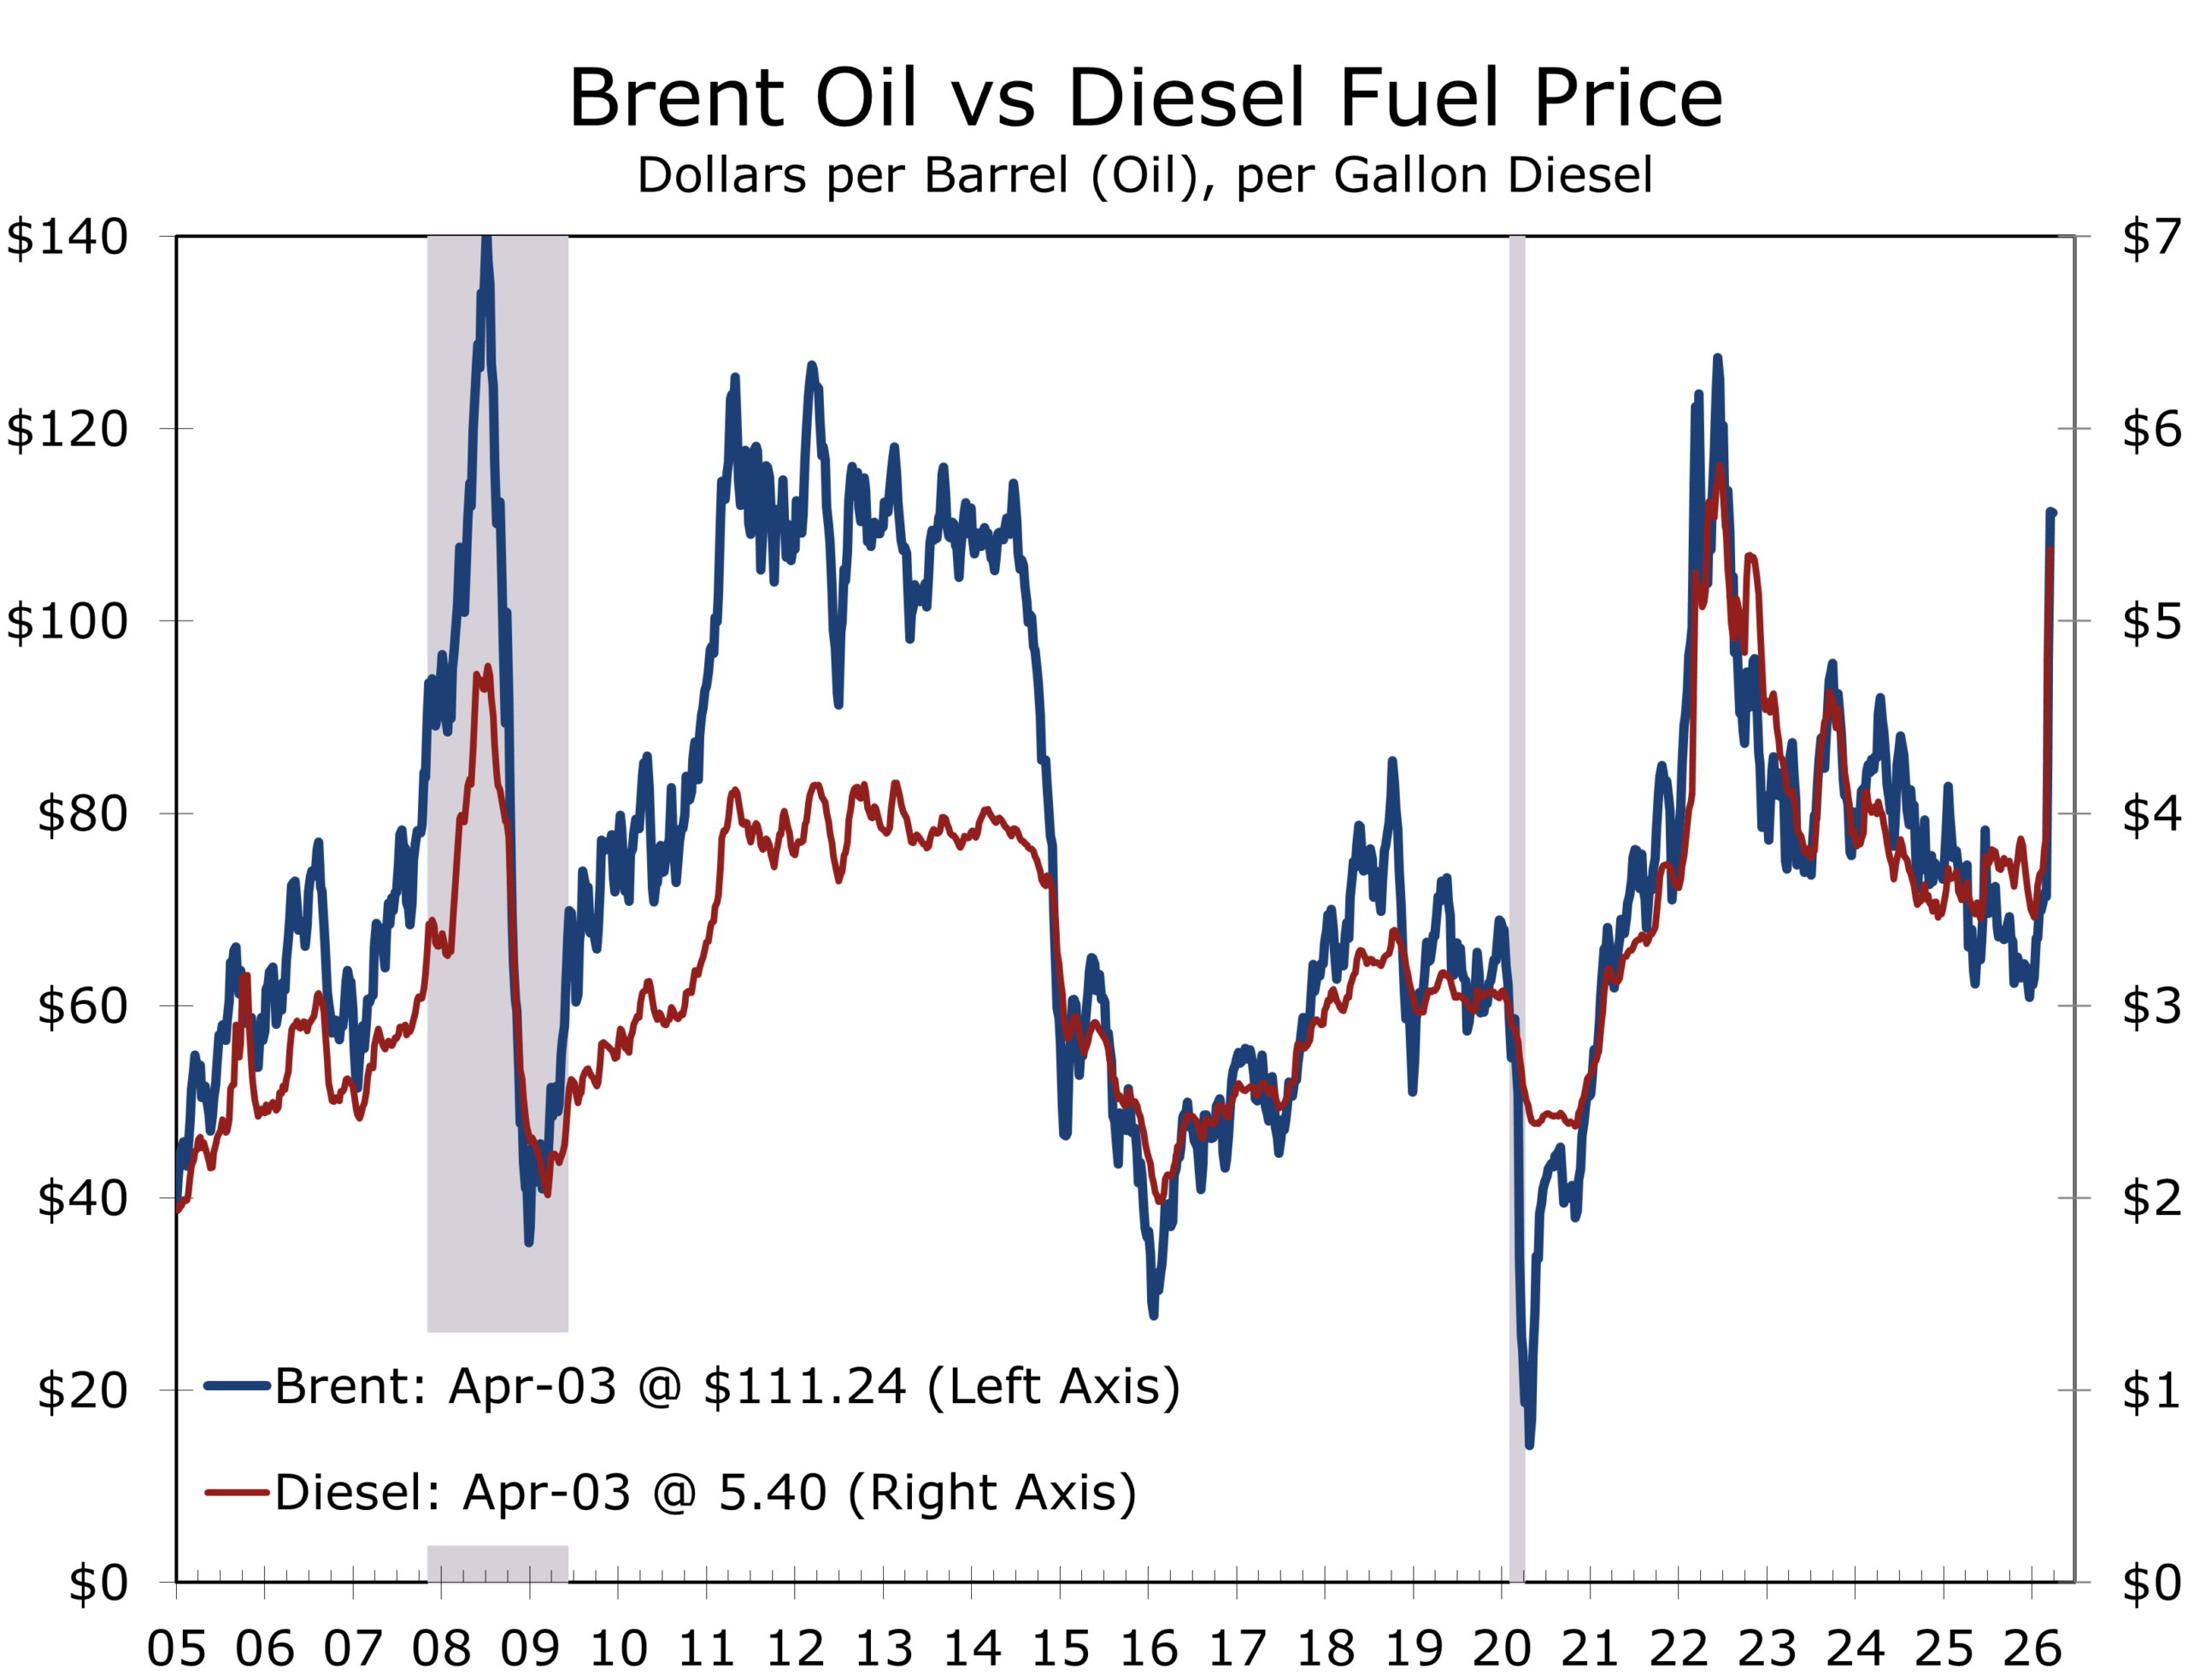
The U.S. economy entered this energy shock in better shape than many feared, but that is different from saying it can absorb it without cost. The March employment report confirmed a labor market that is resilient on the surface and fragile underneath. The 178,000 gain was driven largely by a rebound in healthcare — where 76,000 jobs returned after strike-related losses in February — along with construction (+26,000), transportation and warehousing (+21,000), and manufacturing (+15,000). Federal government employment declined again (-18,000), extending a trend that has now persisted for months. The three-month average of roughly 68,000, well below the 200,000-plus pace of late 2025, tells the more accurate story: hiring has slowed to a crawl. The unemployment rate edged down to 4.3%, but that improvement reflected a drop in labor force participation to 61.9%, not a broad improvement in demand.
The 'no-hire, no-fire' equilibrium remains the defining feature of the labor market. Firms are producing more with fewer workers, supported by capital investment and ongoing productivity gains. Reduced voluntary turnover is playing an underappreciated role — with separations exceeding hires in February on a net basis, businesses are retaining incumbent workers at higher rates, lowering onboarding costs and raising average experience levels. Wage growth of 3.8% year-over-year remains firm and has run slightly above that pace over the past three months. With the war and higher gasoline prices front and center, spending is likely to stay restrained. The drag from $4-plus gasoline and financial market volatility will probably offset the lift that larger tax refunds are expected to provide in April and May.
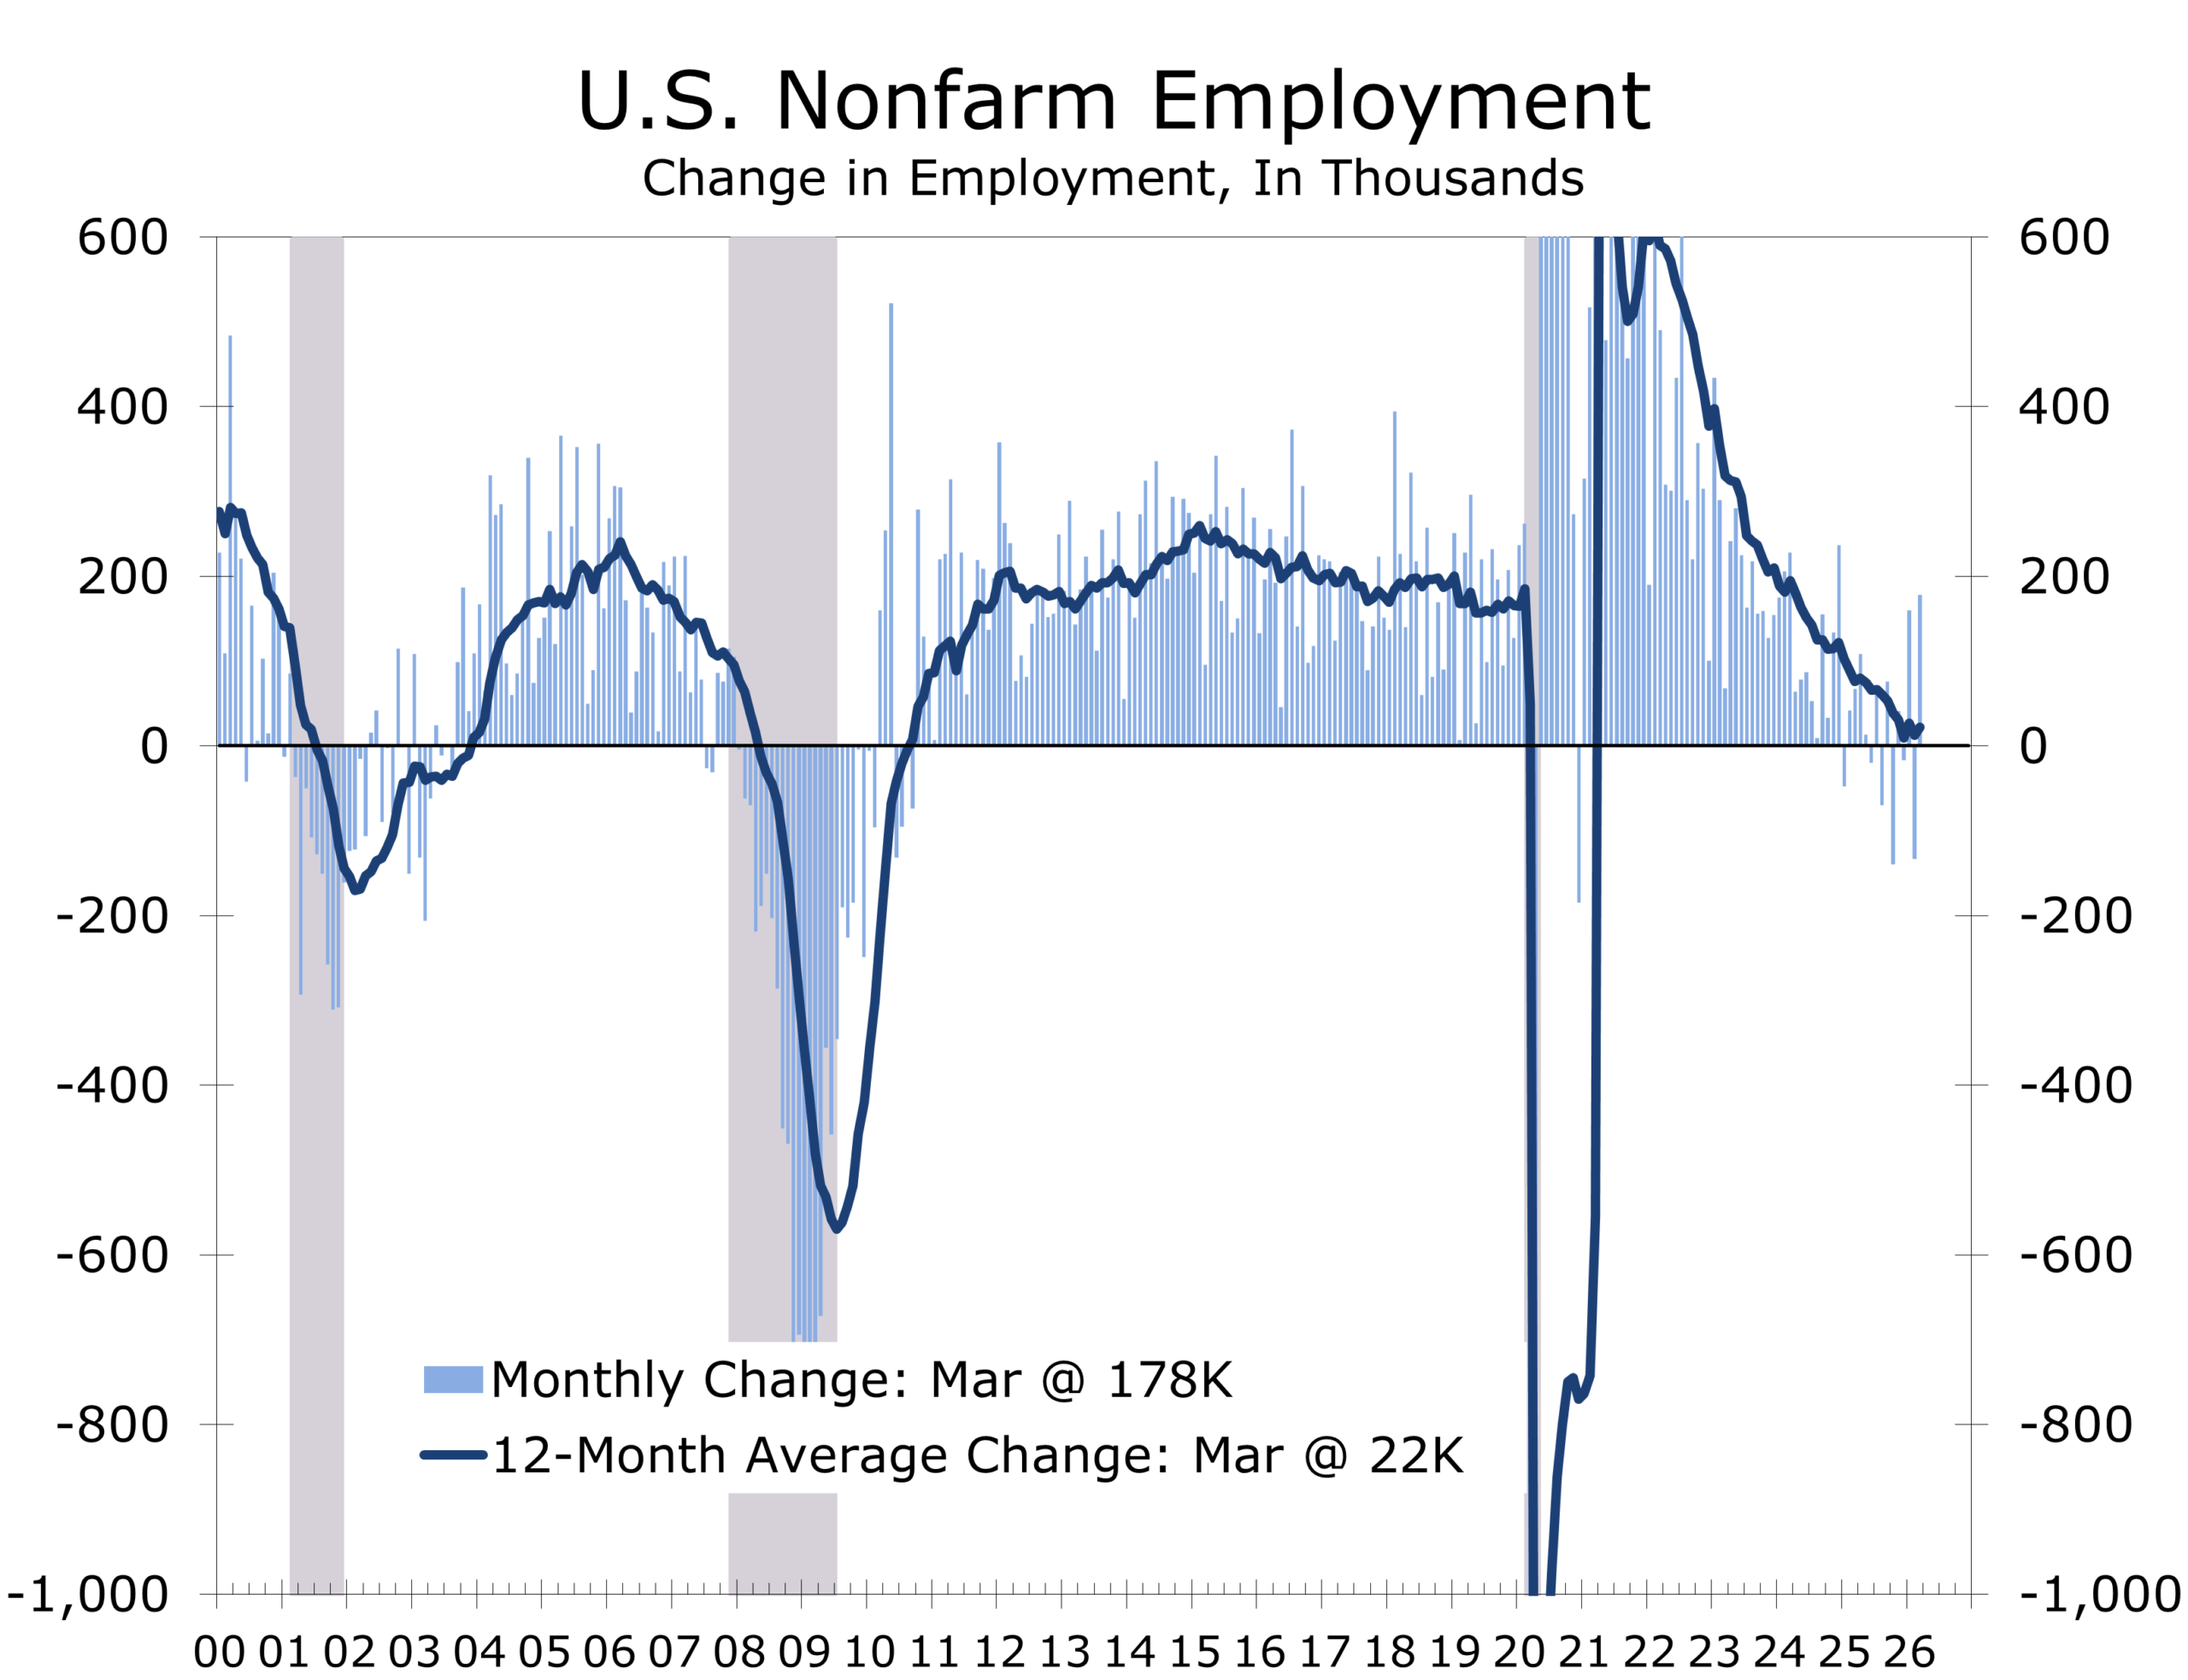
The Strait of Hormuz has moved from tail risk to binding constraint. Ship traffic remains severely impaired, hundreds of tankers are idle, and Middle Eastern producers have slashed output by an estimated seven to twelve million barrels per day since the conflict began. WTI briefly surged above $111 per barrel this week after President Trump pledged more aggressive action against Iran and offered no concrete plan to reopen shipping lanes — crossing the threshold that markets have historically associated with regime change in global energy pricing, not merely volatility. A report that Iran is drafting a monitoring protocol with Oman provided brief relief, but the ceasefire optimism has repeatedly proven premature.
What matters now is less the price level than the nature of the disruption. Even partial impairment of Hormuz introduces delays, raises insurance and transport costs, and fractures supply chains extending well beyond crude oil. Fertilizers, liquefied natural gas, industrial gases including helium, and a range of petrochemical inputs are all exposed. Market estimates suggest OECD commercial crude inventories are set to decline sharply through April and into early May, potentially approaching operational minimums. At that point, the dynamic shifts. The market is no longer absorbing the shock. It is beginning to ration supply. Storms pass; shoals remain. The risk is not a price spike that corrects. It is a sustained period of elevated costs and constrained logistics that slowly erodes growth.
The inventory picture deserves careful reading. U.S. crude stocks rose by 5.5 million barrels in the week ending March 27 to 461.6 million barrels — the highest since June 2023 — and that headline number has tempted some observers toward complacency. It should not. The composition matters more than the total. Gasoline inventories fell by 586,000 barrels, distillate inventories fell by 2.1 million, and petroleum product exports hit a record high as overseas buyers scrambled for refined fuel. OPEC output plunged by 7.3 million barrels per day in March to its lowest level since June 2020. The United States is not short of crude in storage. It is increasingly tight in refined products, particularly diesel and middle distillates — which are the bloodstream of freight, industry, agriculture, and aviation. The IEA's Fatih Birol warned that April could be twice as difficult as March for global energy supplies, with diesel and jet fuel shortages the most acute near-term risk, especially in Asia and Europe by May. The national average for gasoline has reached $4.12 per gallon and is rising.
Forecasts run the gamut. BCA Research's geopolitical team assigns a 70% probability to a continued massive oil shock scenario based on its decision tree analysis, with only 30% probability of meaningful de-escalation in the near term. Their key insight is that the conflict's resolution hinges on a narrow window: President Trump has a political incentive to reduce energy costs before the midterms, but Iran's incentive to hold Hormuz leverage is greatest precisely now — before a U.S. election, not after. The window for a temporary Hormuz monitoring arrangement is real, but it is closing. If Iran keeps striking regional energy supply through mid-April, BCA argues the conflict will shift from an election constraint to a regime-change objective, a fundamentally different and more dangerous footing for markets.
Europe is once again in the most exposed position. Qatar's LNG disruption has driven European benchmark gas prices sharply higher, and regional storage remains critically low, with Germany at roughly 27% capacity, the Netherlands near 10%, against a seasonal norm above 50%. A prolonged disruption would simultaneously strengthen Russia through higher energy revenues, complicate European support for Ukraine, and remind investors that the continent's strategic ambitions remain well ahead of its energy security. History has a habit of sending the bill twice.
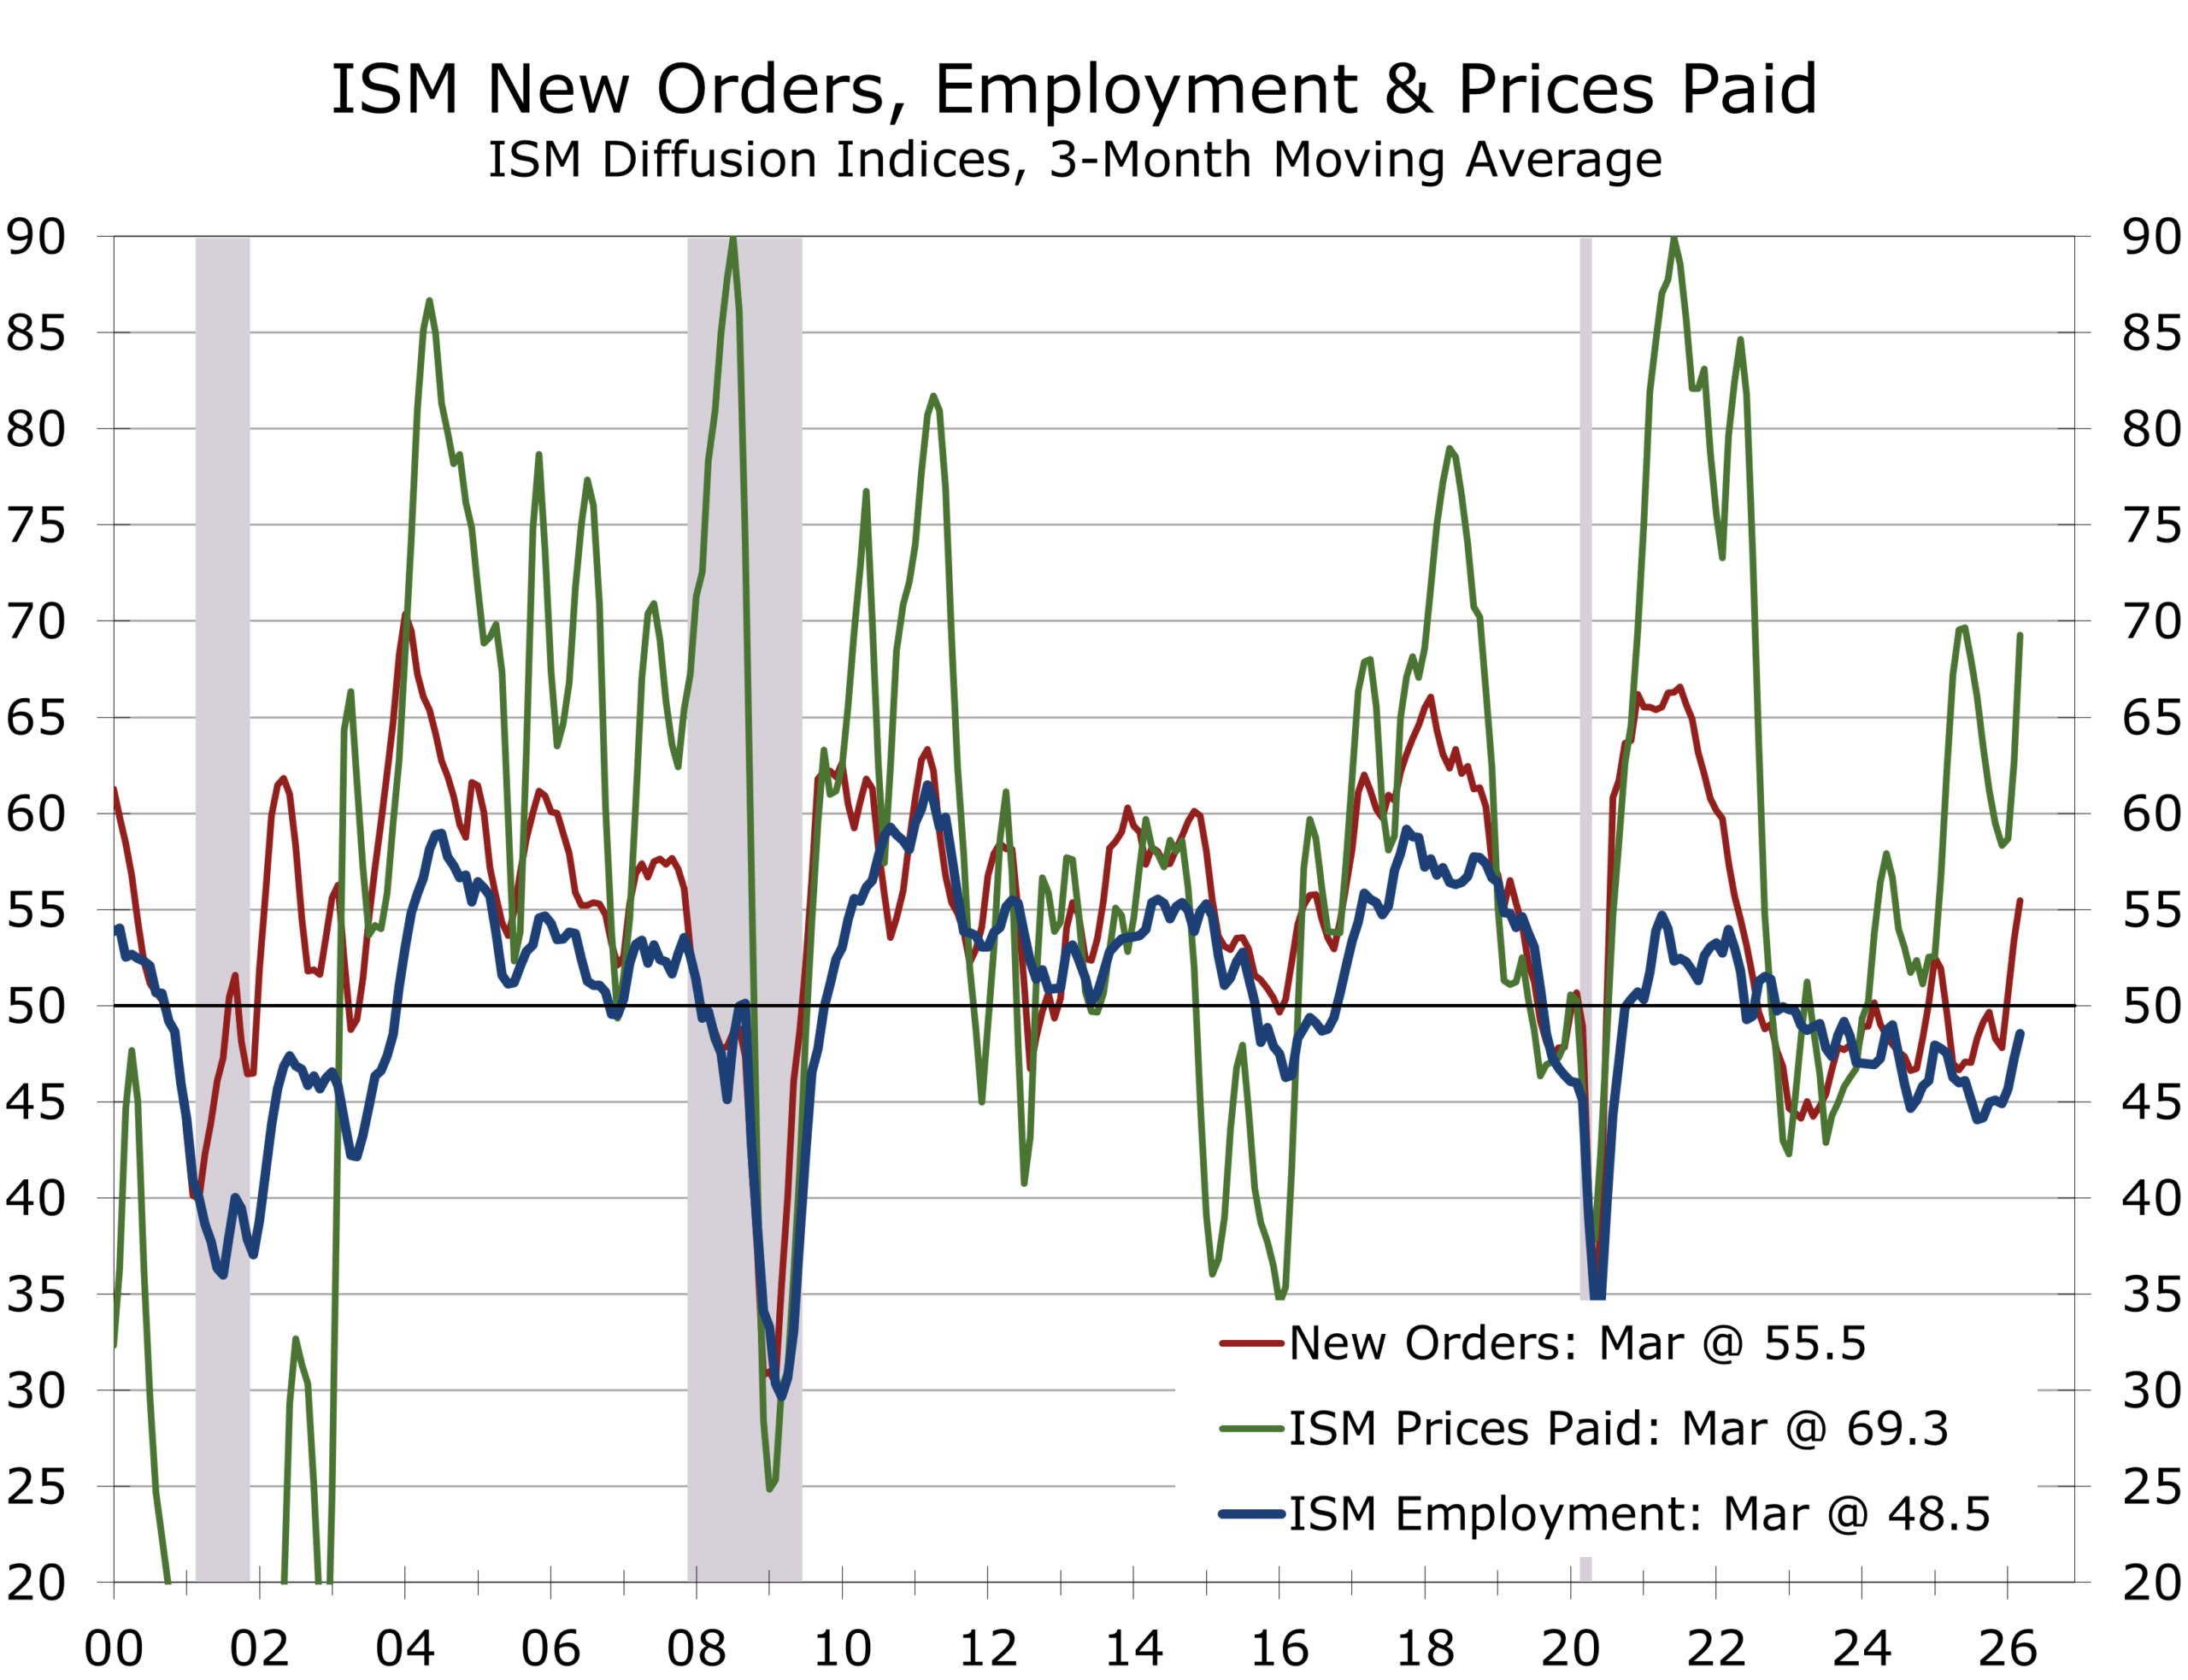
Financial markets are not simply reacting to this shock. They are repricing it. The distinction matters. Initial reactions often overshoot and reverse. Repricing tends to persist. Oil, the dollar, Treasury yields, equity markets, and gold are no longer moving independently. They are moving as a system. That system is sending a consistent message. Financial conditions are tightening materially, even without a rate increase from the Federal Reserve.
The 10-year Treasury yield held near 4.31% this week. The 2-year stood at 3.79%. The curve is now positively sloped by 52 basis points. That reflects both near-term growth expectations and a rising term premium.
The nomination of Kevin Warsh as the next Fed chair, often called the "Warsh Shock" by traders, has reinforced the view that monetary accommodation is further off than markets expected at the start of the year. CME FedWatch now shows a 77.5% probability that the Fed remains on hold through year-end. The probability of a cut at the April 28–29 FOMC meeting is effectively zero.
Gold's behavior has been equally instructive. Prices swung between $4,622 and $4,720 within a single week. The move reflects more than geopolitical risk. It signals a broader reassessment of real yields, dollar strength, and the fiscal outlook.
When oil, gold, the dollar, and long-term yields tighten at the same time, the transmission is direct. Corporate borrowing costs rise. Equity valuations adjust quickly.
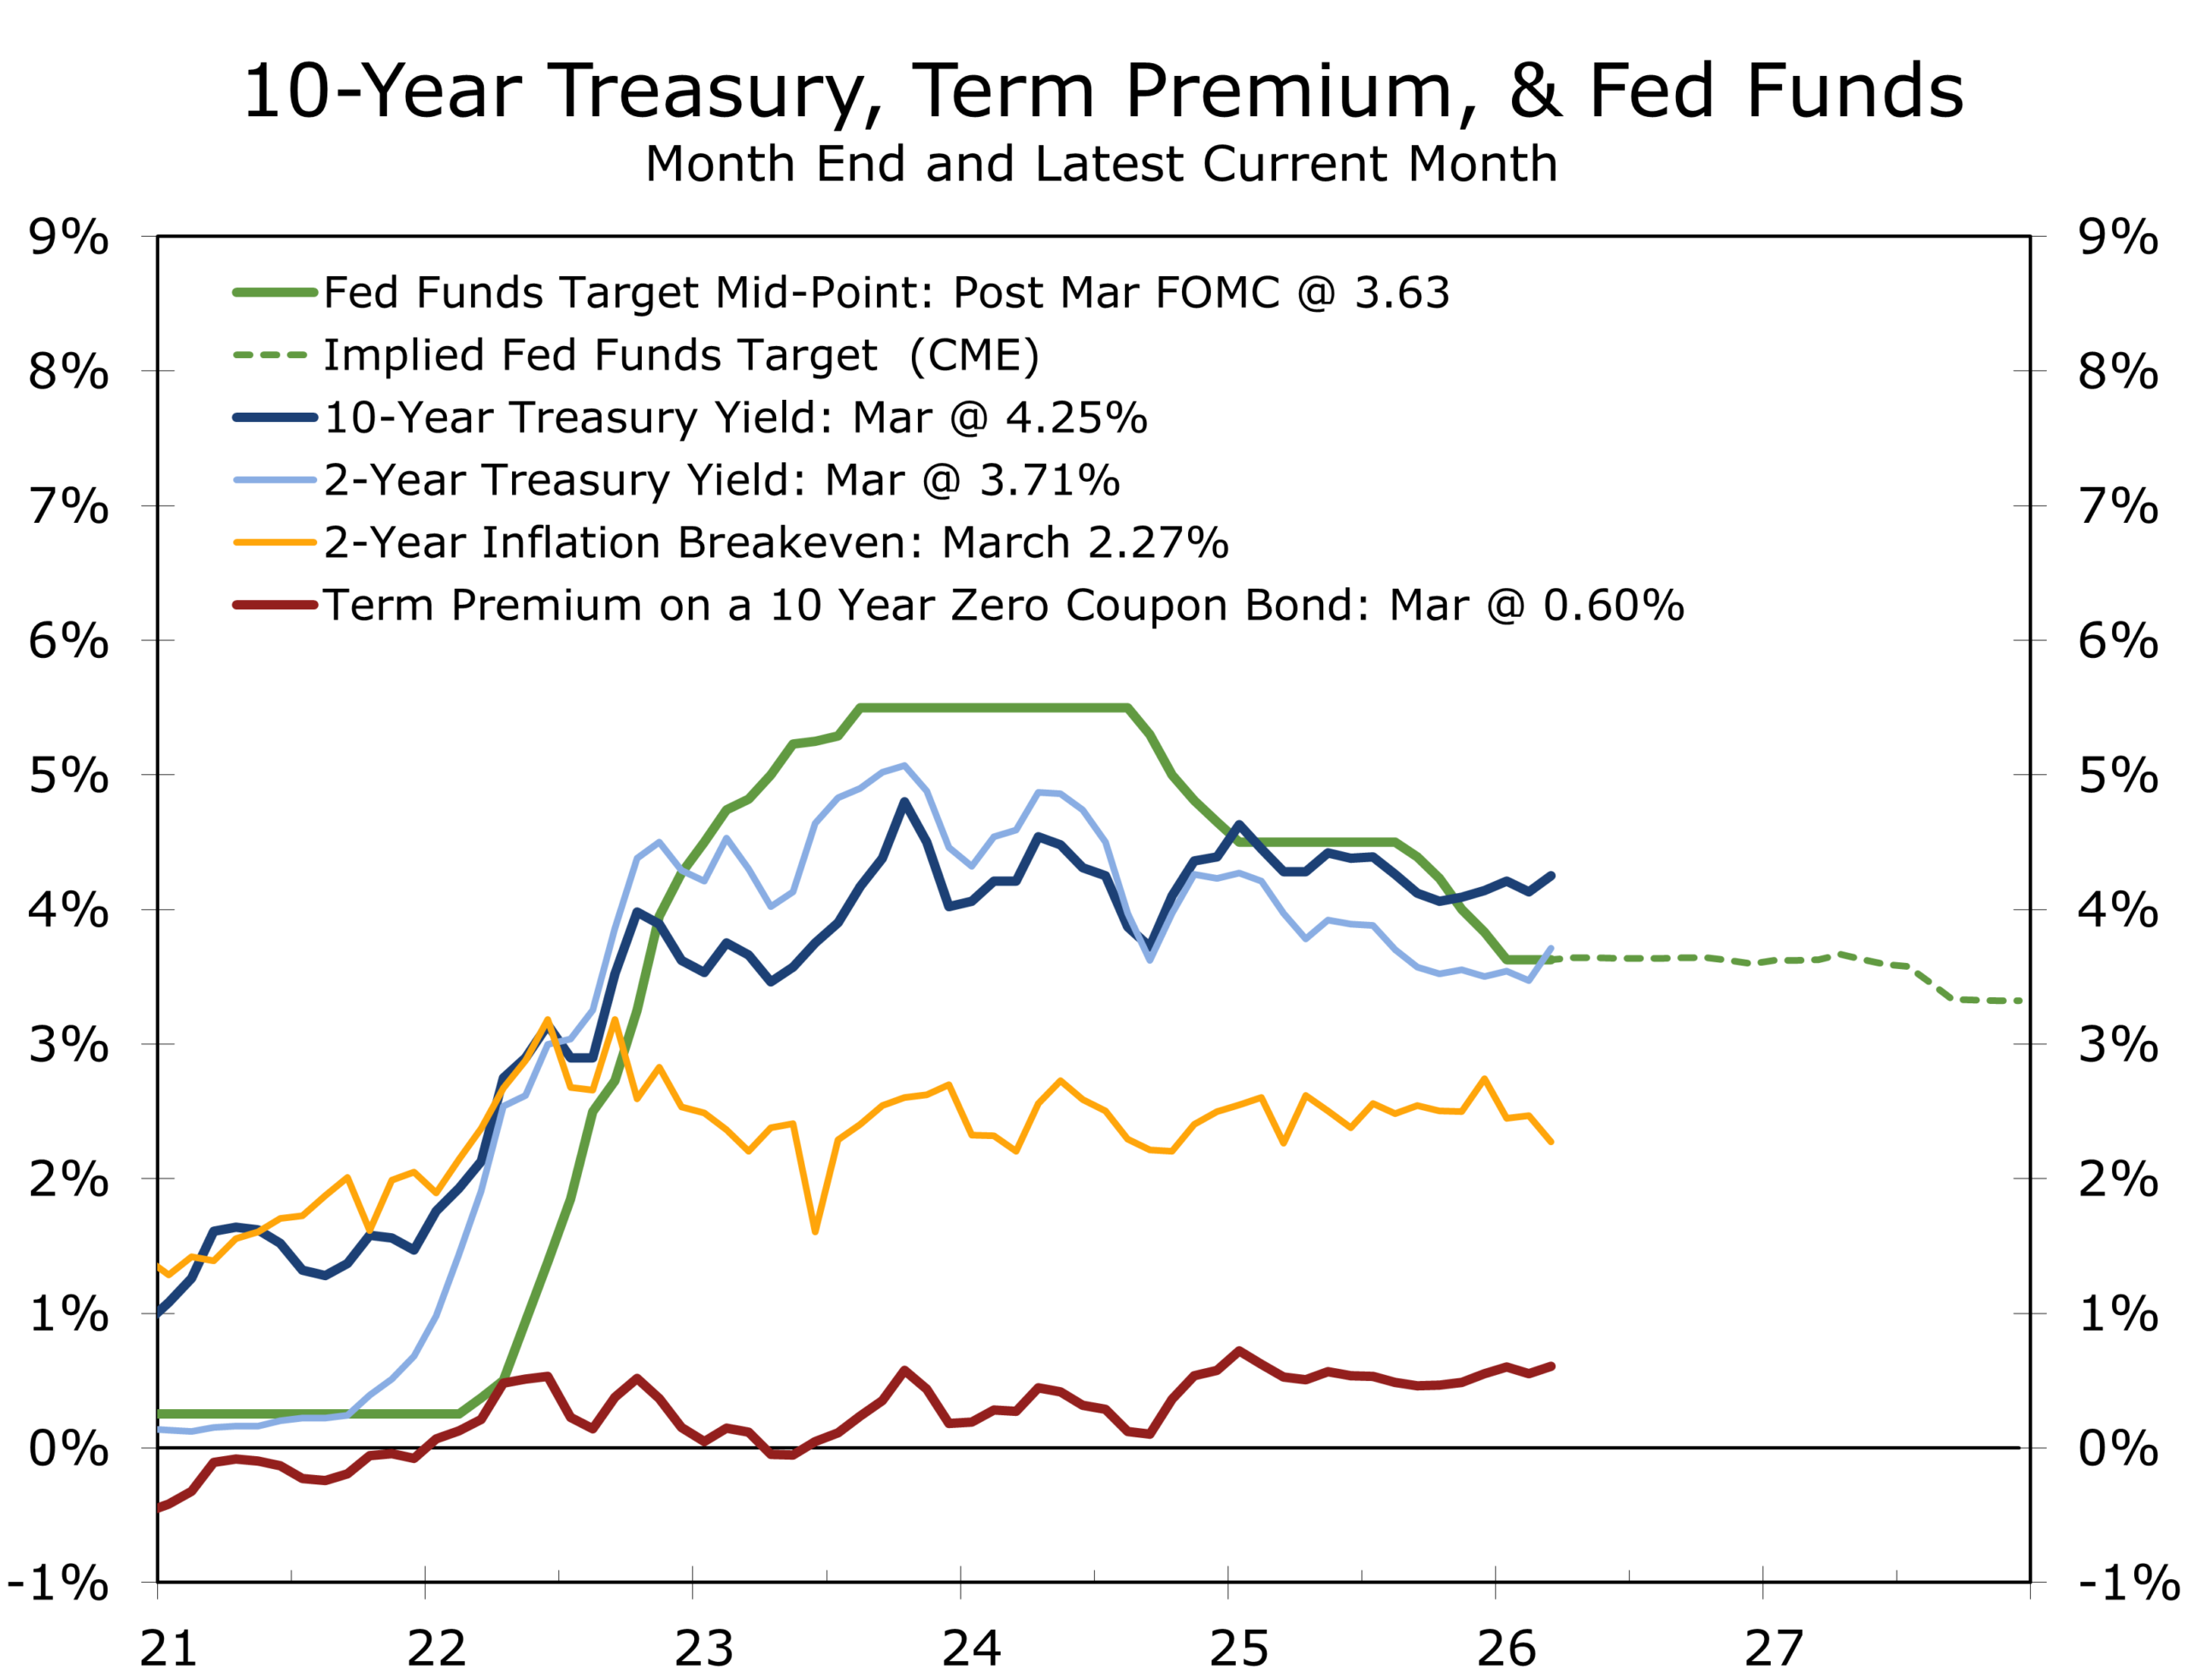
Manufacturing data reinforced the friction theme this week. The ISM Manufacturing Index rose modestly to 52.7 in March. That marks a third consecutive month of expansion. The internal composition is becoming more concerning.
The Prices Paid component surged 19.3 percentage points over the past two months to 78.3. That is the highest reading since June 2022. Seventeen of eighteen industries reported higher costs.
ISM Chair Susan Spence noted that the employment index remains "stubbornly stuck in contraction" at 48.7. Firms are holding headcount steady rather than adding staff. New orders softened. Supplier delivery times lengthened. Respondents cited Middle East shipping delays directly.
This is not the profile of an overheating economy. It is the profile of an economy encountering friction. The topline is expanding. Cost pressures are building. Those pressures will show up in margins, hiring decisions, and pricing behavior.
Funding & Liquidity: The fixed-rate issuance window remains open. The trajectory is becoming less favorable. Markets are pricing no Fed cuts in 2026. Term premium is rising. The case for locking in fixed-rate financing is strengthening. Floating-rate borrowers remain exposed. Review covenant headroom. Stress test interest coverage if the 10-year holds above 4.5% through year-end.
Energy & Input Costs: Brent is above $109. Diesel prices remain elevated. Firms with exposure to freight, logistics, or petrochemical inputs should stress test 2026 cost assumptions now. OECD inventories are drawing toward operational minimums. The window to pre-buy or hedge inputs may be short. Fertilizer and LNG-linked supply chains require immediate review.
Working Capital: Higher energy and freight costs are creating a slow-moving squeeze on working capital. Transportation and warehousing firms absorbed the first wave. Consumer goods and industrial firms are next. Companies with just-in-time supply chains and limited inventory buffers face the greatest risk. Margin pressure is likely to build in Q2 and Q3.
Planning Assumption: Base case — Hormuz risk is contained but not resolved. Brent stabilizes in a $95 to $110 range. The Fed remains on hold through 2026. GDP growth runs near 2.0% to 2.5%. Stress case — Disruption persists through Q3. Oil rises to $120 to $130. Inflation re-accelerates. Credit spreads widen by 50 to 75 basis points. Build both scenarios into Q2 board discussions.
| Day | Release / Event | Why It Matters for CFOs & Markets |
|---|---|---|
| Monday | ISM Services PMI (March): Look for a pullback from last month's strong reading. | Services have held strong at around 56. We will likely see a pullback. Any softening here signals demand erosion that manufacturing data cannot yet show. |
| Tuesday | Durable Goods Orders, Feb. prelim.: Look for a headline drop, focus on core capital goods; Fed Vice Chair Jefferson speaks. | Factory orders will provide a cross-check on capex momentum. The headline orders will likely come in soft as commercial aircraft orders reverse, but core capex orders should rise 0.5%. Jefferson's remarks on energy and inflation will be parsed closely for any shift in the Fed's patience threshold. |
| Wednesday | FOMC Minutes (Mar. 17–18); Wholesale Inventories; Consumer Credit. | The minutes are the policy signal of the week. The March meeting was slightly hawkish. Look for how much weight the committee is placing on energy-driven inflation versus labor market softening. Rising inventories would suggest weakening final demand. |
| Thursday | Personal Income & Spending (Feb); PCE Inflation (Feb); GDP Q4 third est.; Initial Claims. | The PCE will likely come in slightly below consensus — a softer reading would be the first data point suggesting the inflation impulse is lagging the energy shock. GDP Q4 revised to +0.8%. Claims above 220K would begin to challenge the no-fire labor equilibrium. |
| Friday | CPI (March): Look for the headline CPI to jump 0.7% on sharply higher gasoline prices, core +0.3%; Michigan Sentiment prelim. | Sharply higher gasoline prices will boost the headline CPI, but not as much as the markets currently fear. The energy shock will take a few months to be fully reflected in the CPI data. The critical question is whether core services accelerate, signaling the shock is embedding in broader pricing. Michigan inflation expectations will reveal whether household psychology is shifting. |
The interpretation of the CPI will matter more than the number itself. A firm reading alongside stable labor market data supports the narrative of resilient growth with higher inflation. A softer services print or rising claims shifts the focus to demand erosion — a much harder environment for policymakers to navigate. The expansion is not ending. But it is entering a more difficult phase. The shoals are now visible. The task ahead is to navigate them.
| Scenario | Macro & Market Implications | Corporate Finance Action |
|---|---|---|
| Base Case (50%) | Oman monitoring protocol or something similar is enacted by late spring; Brent stabilizes $95–110; Fed on hold; GDP 2.0–2.5%; CPI rises to 3.3–3.5% on energy, then moderates. | Lock in fixed-rate maturities now. Stress-test energy/freight in 2026 budgets. Maintain liquidity buffers above minimums. Use this time to take precautions against the alternatives. |
| Downside (30%) | Disruption persists through Q3; oil $120–130; inflation re-accelerates to 4%+; credit spreads widen 50–75 bps; Fed forced to hold or hike. | Accelerate issuance ahead of wider spreads. Model demand destruction in revenue forecasts. Limit new floating-rate exposure. |
| Tail Risk (20%) | Infrastructure damage or Hormuz closure extends through year; oil $140+; global recession risk rises sharply; dollar surges; EM stress. | Maximize liquidity; draw revolvers preemptively; halt discretionary capex; model severe demand contraction scenarios. |
(% change on previous period, annualized, except where noted)
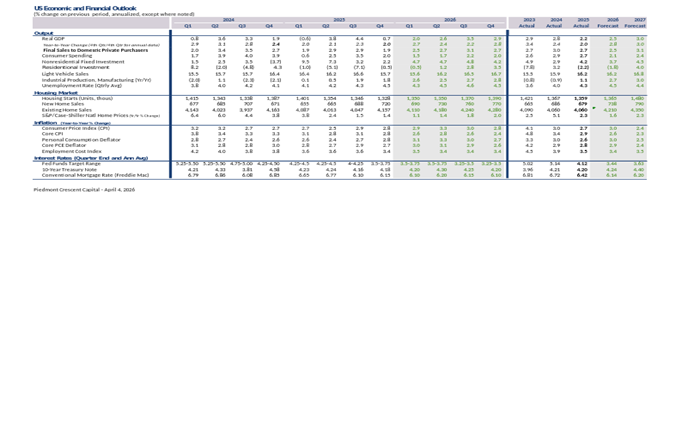
Piedmont Crescent Capital — April 6, 2026
This publication has been prepared for informational purposes only and is not intended as a recommendation, offer, or solicitation with respect to the sale of any security or other financial product, nor does it constitute investment advice.
February Retail Sales: : Broad-Based Rebound Masks Geopolitical and Tariff Headwinds
Consumer Spending Was Solid Ahead of the Iran War
- Retail sales rose 0.6% MoM in February 2026, a broad-based rebound following January’s upwardly revised –0.1% decline; the gain beat consensus estimates across all major categories.
- Core retail sales rose solidly. Sales excluding autos, gasoline, building materials, and restaurants rose +0.4% — the best reading since August 2025. Along with our estimate of services outlays, this points to a +0.6% nominal and +0.2% real increase in PCE for Februaryf.
- We have lowered our Q1 real GDP forecast by 0.1 percentage point to a 2.0% annual rate. Real PCE is tracking a 1.5% annualized gain in Q1, consistent with our previously published forecast. We expect growth to strengthen modestly in Q2 and to end the year with solid momentum.
- The U.S./Israel war with Iran will begin weighing on March data, as gasoline prices averaged approximately 75 cents per gallon higher than in February. The near-term buffer comes from income tax refunds, which are running +12.5% YoY — cushioning discretionary spending for another month or two.
- Import prices surged +1.3% in February, the largest monthly jump since March 2022, compressing real purchasing power — most acutely for lower- and middle-income households who face a disproportionate tariff burden.
- Our 2026 outlook remains essentially the same as was published in March. We see real personal consumption expenditures rising at just a 1.6% pace in the first half of 2026, but look for spending to rebound to a 2.1% pace in the second half, aided by larger tax refunds and lower energy prices.
Data Note
Source and Methodology
This report draws on the U.S. Census Bureau’s Advance Monthly Retail Trade Survey (MARTS) released April 1, 2026, covering February 2026 activity. The release was rescheduled from March 16 following a lapse in federal appropriations. All figures are seasonally adjusted and not adjusted for price changes unless stated. Oxford Economics/Haver Analytics commentary (April 1, 2026) provides the analysis of cumulative year-over-year tax refunds, which helped influence the forecast for personal consumption expenditures.
| +0.6%
Total retail & food services, MoM — February 2026 |
+0.4%
Control group (ex-auto, gasoline, building material, food services) — 6-month high |
| +1.5%
Real PCE, Q1 2026 annualized — consistent with prior forecast |
2.0%
Piedmont Crescent Capital Q1 real GDP forecast (annualized rate) |
The February Rebound: Sales by Category
February’s +0.6% gain was the broadest monthly advance since mid-2025. The increase was broad-based and includes gains in categories where spending was likely depressed by weather in January — automobiles and restaurants and bars in particular. The only two categories to register outright declines were furniture, which continues to be weighed down by elevated mortgage rates and weak existing-home sales, and grocery stores, where deflation in some food categories is depressing the nominal total. Motor vehicles drove the headline increase, but the control group’s +0.4% print — which strips out autos, gas, building materials, and food services — confirms that the underlying demand signal is broad and genuine.
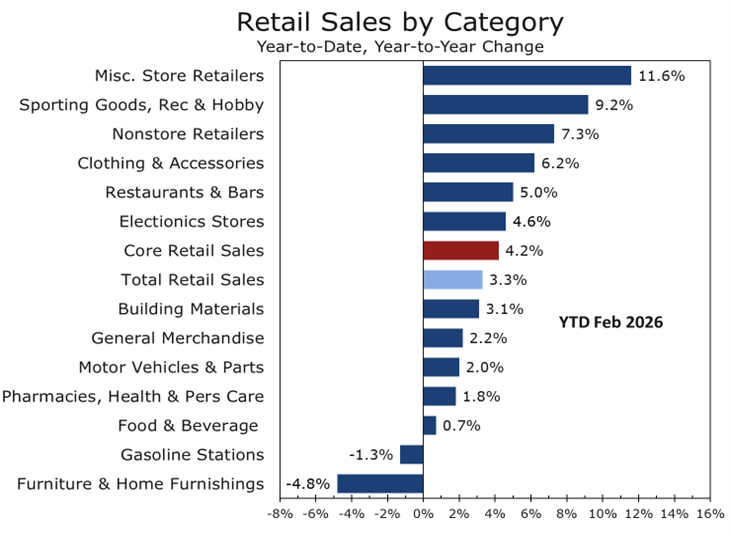
Full Category Breakdown — February 2026
| Category | MoM Change | YoY Change |
| Total Retail & Food Services | +0.6% | +3.2% |
| Control Group | +0.4% | +3.5% |
| Motor Vehicles & Parts Dealers | +1.5% | +2.8% |
| Food & Beverage Stores | –0.3% | +2.9% |
| General Merchandise Stores | +0.2% | +2.6% |
| Clothing & Accessories | +1.5% | +3.8% |
| Health & Personal Care | +1.7% | +4.5% |
| Nonstore Retailers (e-Commerce) | +0.8% | +10.9% |
| Food Services & Drinking Places | +0.5% | +4.2% |
| Gasoline Stations | +0.9% | –2.1% |
| Furniture & Home Furnishings | –1.0% | –0.4% |
| Electronics & Appliances | +0.3% | +1.8% |
| Building Materials & Garden | +0.8% | +2.3% |
Key Signal
Control Group at 6-Month High: PCE Pointing to +0.2% Real Gain in February
The control group — ex-auto, gasoline, building materials, and food service sales — rose +0.4% in February, its strongest reading since August 2025. Combined with our estimate of services outlays, this points to a +0.6% nominal and +0.2% real increase in PCE for February. For Q1 as a whole, real consumer spending is tracking an annualized rate of approximately 1.5%, consistent with our previously published forecast. This metric feeds directly into the BEA’s GDP consumption estimate and is the single most important data point in the retail report for near-term GDP tracking.
Forces Shaping the Consumer Outlook
The February retail print is constructive at face value. However, three forces are converging to pressure consumer spending through the spring and into summer: the U.S./Israel war with Iran and the attendant energy price shock, continuing tariff passthrough into consumer goods prices, and a bifurcation in real income growth that is concentrating spending gains at the upper end of the income distribution. Recent financial market volatility and disruptions around spring break travel may also sideline some discretionary spending by upper-income households in the near term.
Consumer confidence data presents a mixed picture. The University of Michigan Consumer Sentiment Index has plummeted in recent months, while the Conference Board Consumer Confidence measure has shown more resilience. We suspect that concerns about rising gasoline prices and uncertainty about what the war’s implications for supply chains and inflation will weigh on actual spending this spring, even among households whose balance sheets remain relatively healthy.
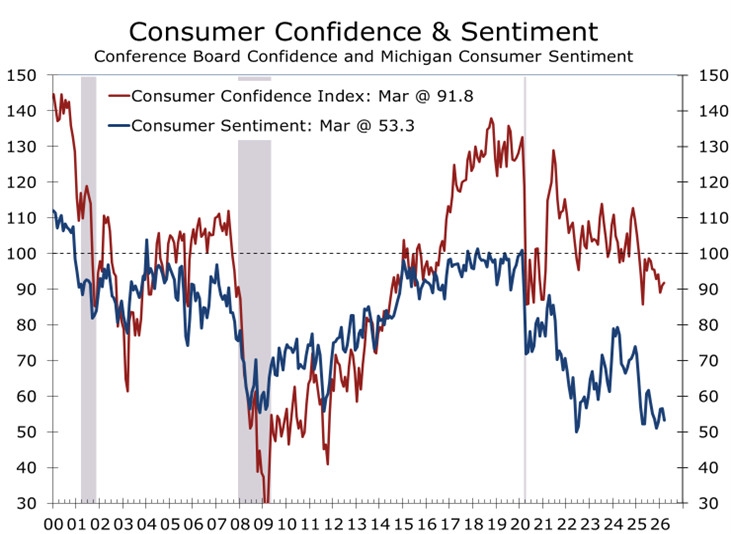
The War with Iran: A More Immediate Risk to Consumer Spending
The U.S./Israel war with Iran introduces a risk that is more immediate in its consumer spending impact than tariff pressures. Gas prices averaged approximately 75 cents per gallon higher in March compared to February — a swift, regressive increase in household energy costs. Higher energy prices should become evident in the March retail sales data, with spending on durable goods and discretionary services bearing the brunt of the adjustment. We left our consumption forecast unchanged, however, as we had already assumed a substantial pullback in spending would take hold in March and persist through much of the second quarter.
The near-term impact is cushioned by a powerful, if unusual, buffer: income tax refunds. Refund issuance is running approximately +12.5% YoY through late March, a notable departure from the typical pattern in which the YoY increase peaks early in the filing season and then fades. The One Big Beautiful Budget Act is expected to generate a jump in refund issuance of approximately 20% for the full year. Crucially, the increase is occurring more gradually than usual, meaning a disproportionate share will accrue to upper-income households who tend to file later in the season.
| Risk Factor
War and Tariffs: Twin Pressures Compressing Real Spending Power Import prices jumped +1.3% in February 2026 — the largest monthly increase since March 2022 — even before the Iranian war’s energy price shock has fully registered. Gasoline prices will likely remain elevated through Memorial Day, weighing on consumer spending through at least mid-Q2. The Yale Budget Lab estimates current tariffs represent a 9.8–13.7 percentage point increase in the effective U.S. tariff rate, the highest since 1941, creating an effective cost burden of $600–$1,300 per household annually. Lower-income cohorts bear approximately three times the proportional tariff burden of top-decile earners, underscoring the regressive nature of the combined energy and trade policy shock. |
The Tax Refund Buffer: Buying Time, Not Immunity
The unusual pattern of tax refund issuance is central to understanding why consumer spending has held up despite sharply deteriorating sentiment and rising energy costs. In a typical year, the YoY increase in cumulative refund issuance peaks early in the filing season — when lower-income households, who tend to file first, receive their refunds — and then gradually fades. In 2026, the opposite is occurring: the YoY increase has been rising through late March, reaching approximately +12.5% compared to the same period in 2025.
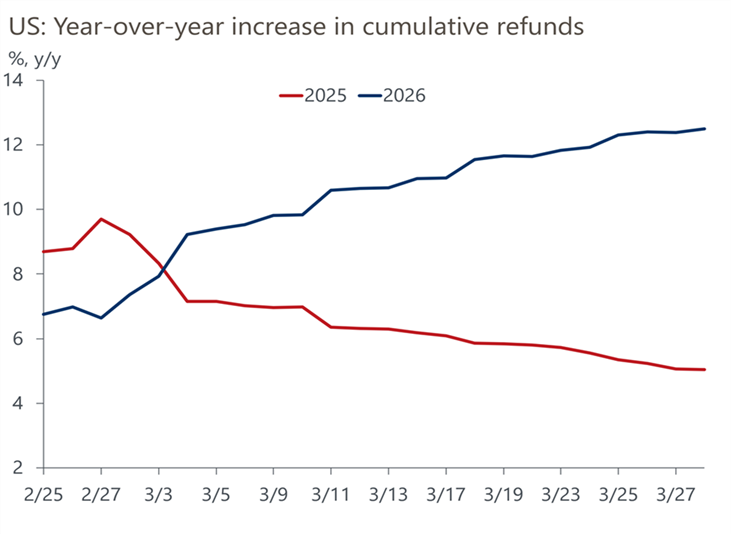
This pattern has significant distributional implications. A disproportionate share of the 2026 refund increase will accrue to upper-income households who file later in the season. The One Big Beautiful Budget Act created a structural increase in refund issuance estimated at approximately 20% for the full year. Higher-income filers receiving larger-than-normal refunds is providing support for spending in premium retail and warehouse-club formats even as lower-income cohorts face simultaneous tariff, energy price, and food inflation pressures. This dynamic reinforces the K-shaped character of the current consumer environment: aggregate spending metrics hold up reasonably well, while conditions for a large share of American households are materially more difficult.
The structural shift toward e-commerce continues to shape the distribution of retail gains. Nonstore retailers posted +10.9% YoY growth in the latest reading, maintaining substantial outperformance over brick-and-mortar formats. Q4 2025 e-commerce reached $316.1 billion seasonally adjusted — equivalent to 16.6% of total retail sales, up from 15.8% a year earlier. This channel shift has important implications for commercial real estate, logistics infrastructure, and labor demand across the retail sector.
| Structural Context
E-Commerce and Income Bifurcation Are Reshaping the Retail Landscape Full-year 2025 U.S. e-commerce totaled approximately $1.23 trillion, up +5.4% from 2024. NRF data indicate that the top 10% of earners now account for approximately 50% of all U.S. consumer spending. Clothing (+1.5% MoM) and health and personal care (+1.7% MoM) led the February gains, categories that skew toward higher-income consumers. Meanwhile, furniture (–1.0% MoM) and grocery stores (–0.3% MoM) — categories more broadly consumed across the income distribution — were the only segments to register outright declines. These divergences will likely widen as the energy price shock from the war with Iran takes hold in coming months. |
Conclusion: Consumer Resilience in a Crosscurrent Environment
The February 2026 Advance Retail Sales report underscores the fundamental resilience that has characterized U.S. consumer spending throughout this economic cycle. A broad-based +0.6% headline gain, a six-month high in the control group measure, and an Oxford Economics PCE nowcast pointing to +0.2% real consumer spending growth confirm that the January weakness was weather-driven rather than structural. The consumer entered the spring in solid shape.
Our assessment of Q1 GDP and the near-term outlook remains constructive. Real PCE is tracking a 1.5% annualized rate in Q1 2026, consistent with our previously published forecast, and underpins our Q1 real GDP forecast of 2.0% annualized. We expect growth to strengthen modestly in Q2 as the tax refund buffer continues to support upper-income spending, and we look for the economy to end 2026 with solid momentum as energy prices gradually recede and real incomes recover.
| Never Underestimate the American Consumer
“The American consumer has repeatedly defied expectations of a meaningful slowdown. Despite declining sentiment, rising energy costs, and the cumulative weight of tariff-driven price increases, aggregate spending has remained positive. February’s broad-based rebound reinforces our view that the structural foundation of consumer spending — employment, income growth, and household net worth — remains sufficiently intact to sustain positive growth through 2026.” — Mark P. Vitner, Chief Economist, Piedmont Crescent Capital |
Three considerations shape our near-term outlook. First, the energy price shock from the war with Iran will be visible in the March retail data, and we expect it to restrain discretionary spending through at least Memorial Day. Second, the tax refund buffer — while real and meaningful — is a stock rather than a flow; once deployed, households will face the underlying pressures of elevated goods prices and rising energy costs without this cushion. Third, the coincidence of tariff passthrough and energy inflation creates a compounding price burden that falls most heavily on lower- and middle-income consumers, limiting the breadth of any spending recovery.
| The Economy Keeps Chugging Along, Despite Significant Drags from the War and Tariffs
“We are maintaining our forecast for Q1 real GDP growth of 2.0% annualized, supported by a 1.5% annualized gain in real consumer spending and 4.7% rise in business fixed investment. Looking ahead, we expect growth to strengthen modestly in Q2 as refund-supported spending by upper-income households partially offsets the energy price drag, and to build further into year-end as oil prices gradually recede and real household income growth resumes a more supportive trajectory. The full year is shaping up to be one of moderate but durable expansion.” — Mark P. Vitner, Chief Economist, Piedmont Crescent Capital |
Key data releases to monitor: March retail sales (April 16) will provide the first direct measure of the war’s impact on consumer spending; the Q1 GDP advance estimate (April 30) will confirm whether the February control group strength flowed through to final demand; April CPI will indicate the velocity of energy and goods price passthrough; and the Federal Reserve’s May communications will clarify whether policymakers intend to ‘look through’ the war- and tariff-driven inflation or respond to it.
mark.vitner@piedmontcrescentcapital.com
(704) 458-4000
April 1, 2026
Disclaimer: This publication has been prepared for informational purposes only and is not intended as a recommendation offer or solicitation with respect to the purchase or sale of any security or other financial product nor does it constitute investment advice.
April 1, 2026
Mark Vitner, Chief Economist
(704) 458-4000
Home Prices: Losing Momentum, but Still Rising, and Splitting Along Regional Lines
Key Takeaways
-
- Home price appreciation continued to decelerate in early 2026, with both S&P CoreLogic Case-Shiller Home Price Index and FHFA House Price Index showing low-year-to-year single-digit gains.
- Monthly momentum is soft. Prices are drifting higher on a seasonally adjusted basis but slipping slightly on an unadjusted basis.
- Regional divergence has widened. The Midwest and Northeast are now leading, while several Sun Belt markets are flat to declining. Florida is a notable soft spot.
- Real home prices are falling modestly as inflation runs ahead of nominal appreciation.
- The housing market remains constrained by affordability. Higher mortgage rates are offsetting any benefit from slower price growth.
Price Growth Is Positive, But Fading
January’s data reinforces a theme that has been building for several quarters: the housing market has cooled but the overall supply of homes for sale remains tight, which is supporting home prices.
The S&P CoreLogic Case-Shiller Home Price Index rose 0.9% year over year in January, down from 1.1% in December. The 10-city and 20-city composites slowed to 1.7% and 1.2%, respectively. The FHFA House Price Index showed a similar pattern, rising 1.6% year over year, with a modest 0.1% monthly gain.
The signal is clear. Home prices are still rising, but only marginally. The market has shifted from strong price appreciation to something closer to stall speed as demand remains constrained by affordability constraints and a weaker job market
Nominal home price appreciation has slowed enough that inflation is now outpacing home prices.
On a monthly basis, the Case-Shiller national index declined slightly on a non-seasonally adjusted basis and rose just 0.2% after seasonal adjustment. FHFA reported a similarly modest 0.1% increase.
This is not the profile of a market under stress. It is the profile of a market constrained to the point that it is stalling. Buyers are sensitive to monthly payments, not just prices, and the recent back up in mortgage rates has likely caused many would-be buyers to pause.
The result is a low-velocity market. Transactions are limited, inventories are gradually rising off historically low levels, and prices are drifting rather than moving decisively in either direction.
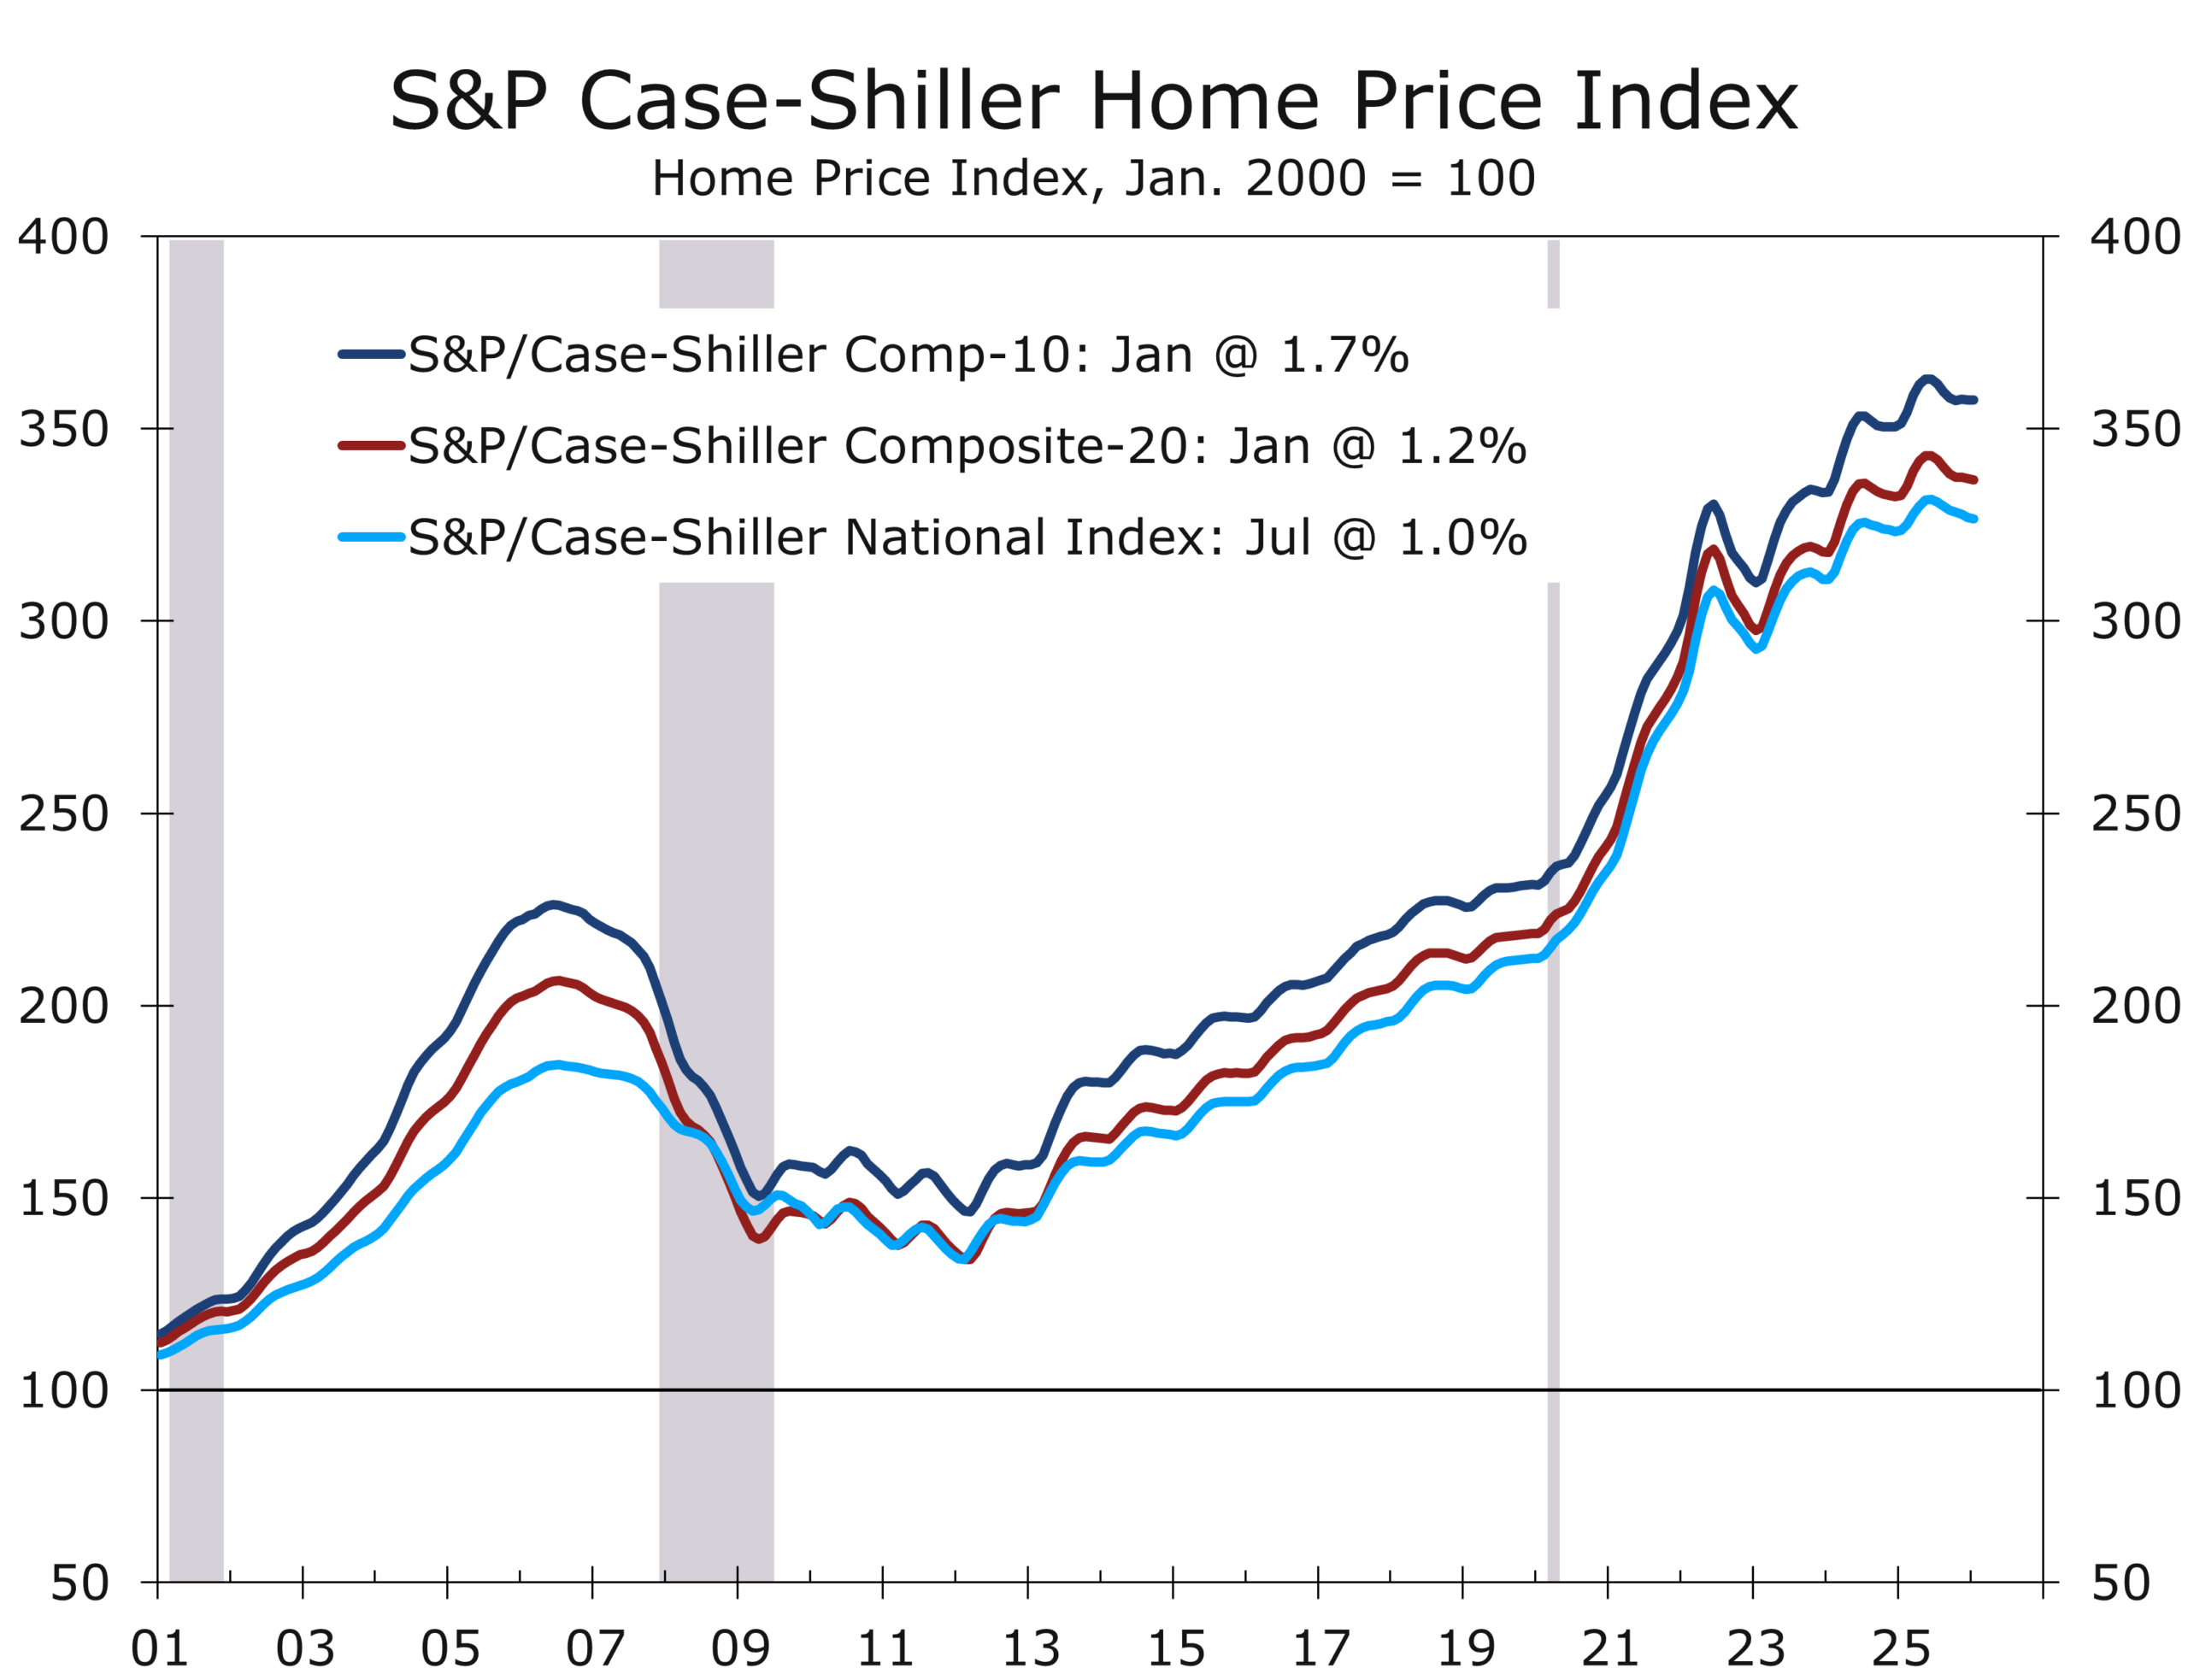
Regional Divergence Is Now the Defining Feature
Variations in regional price performance offer confirming evidence on the most recent Census data, which should population growth remaining strong Texas, the Mountain West and the Southeast, with the exception of Florida. The Midwest is showing more resilience, as housing is relatively more affordable compared to other regions. New York’s prices reflect the full return to the office amid a scarcity of homes available for sale.
In the Case-Shiller 20-city index, New York, Chicago, and Cleveland posted the strongest gains, while Tampa remained firmly negative year-over-year. Prices were flat or down in several formerly high-flying Sun Belt markets, including Phoenix, Dallas, and Seattle.
Leadership has shifted from Sun Belt hot spots to the Midwest, Northeast, and more affordable parts of the South.
FHFA’s regional data tell the same story. The East North Central division posted the strongest annual gains, while West South Central, which includes Texas, was negative. The East South Central, which includes Tennessee and Alabama, shows more resilience, however.
The pandemic-era leaders are no longer carrying the market. Instead, price growth has rotated toward regions where affordability remains less strained, and valuations did not overshoot as dramatically.
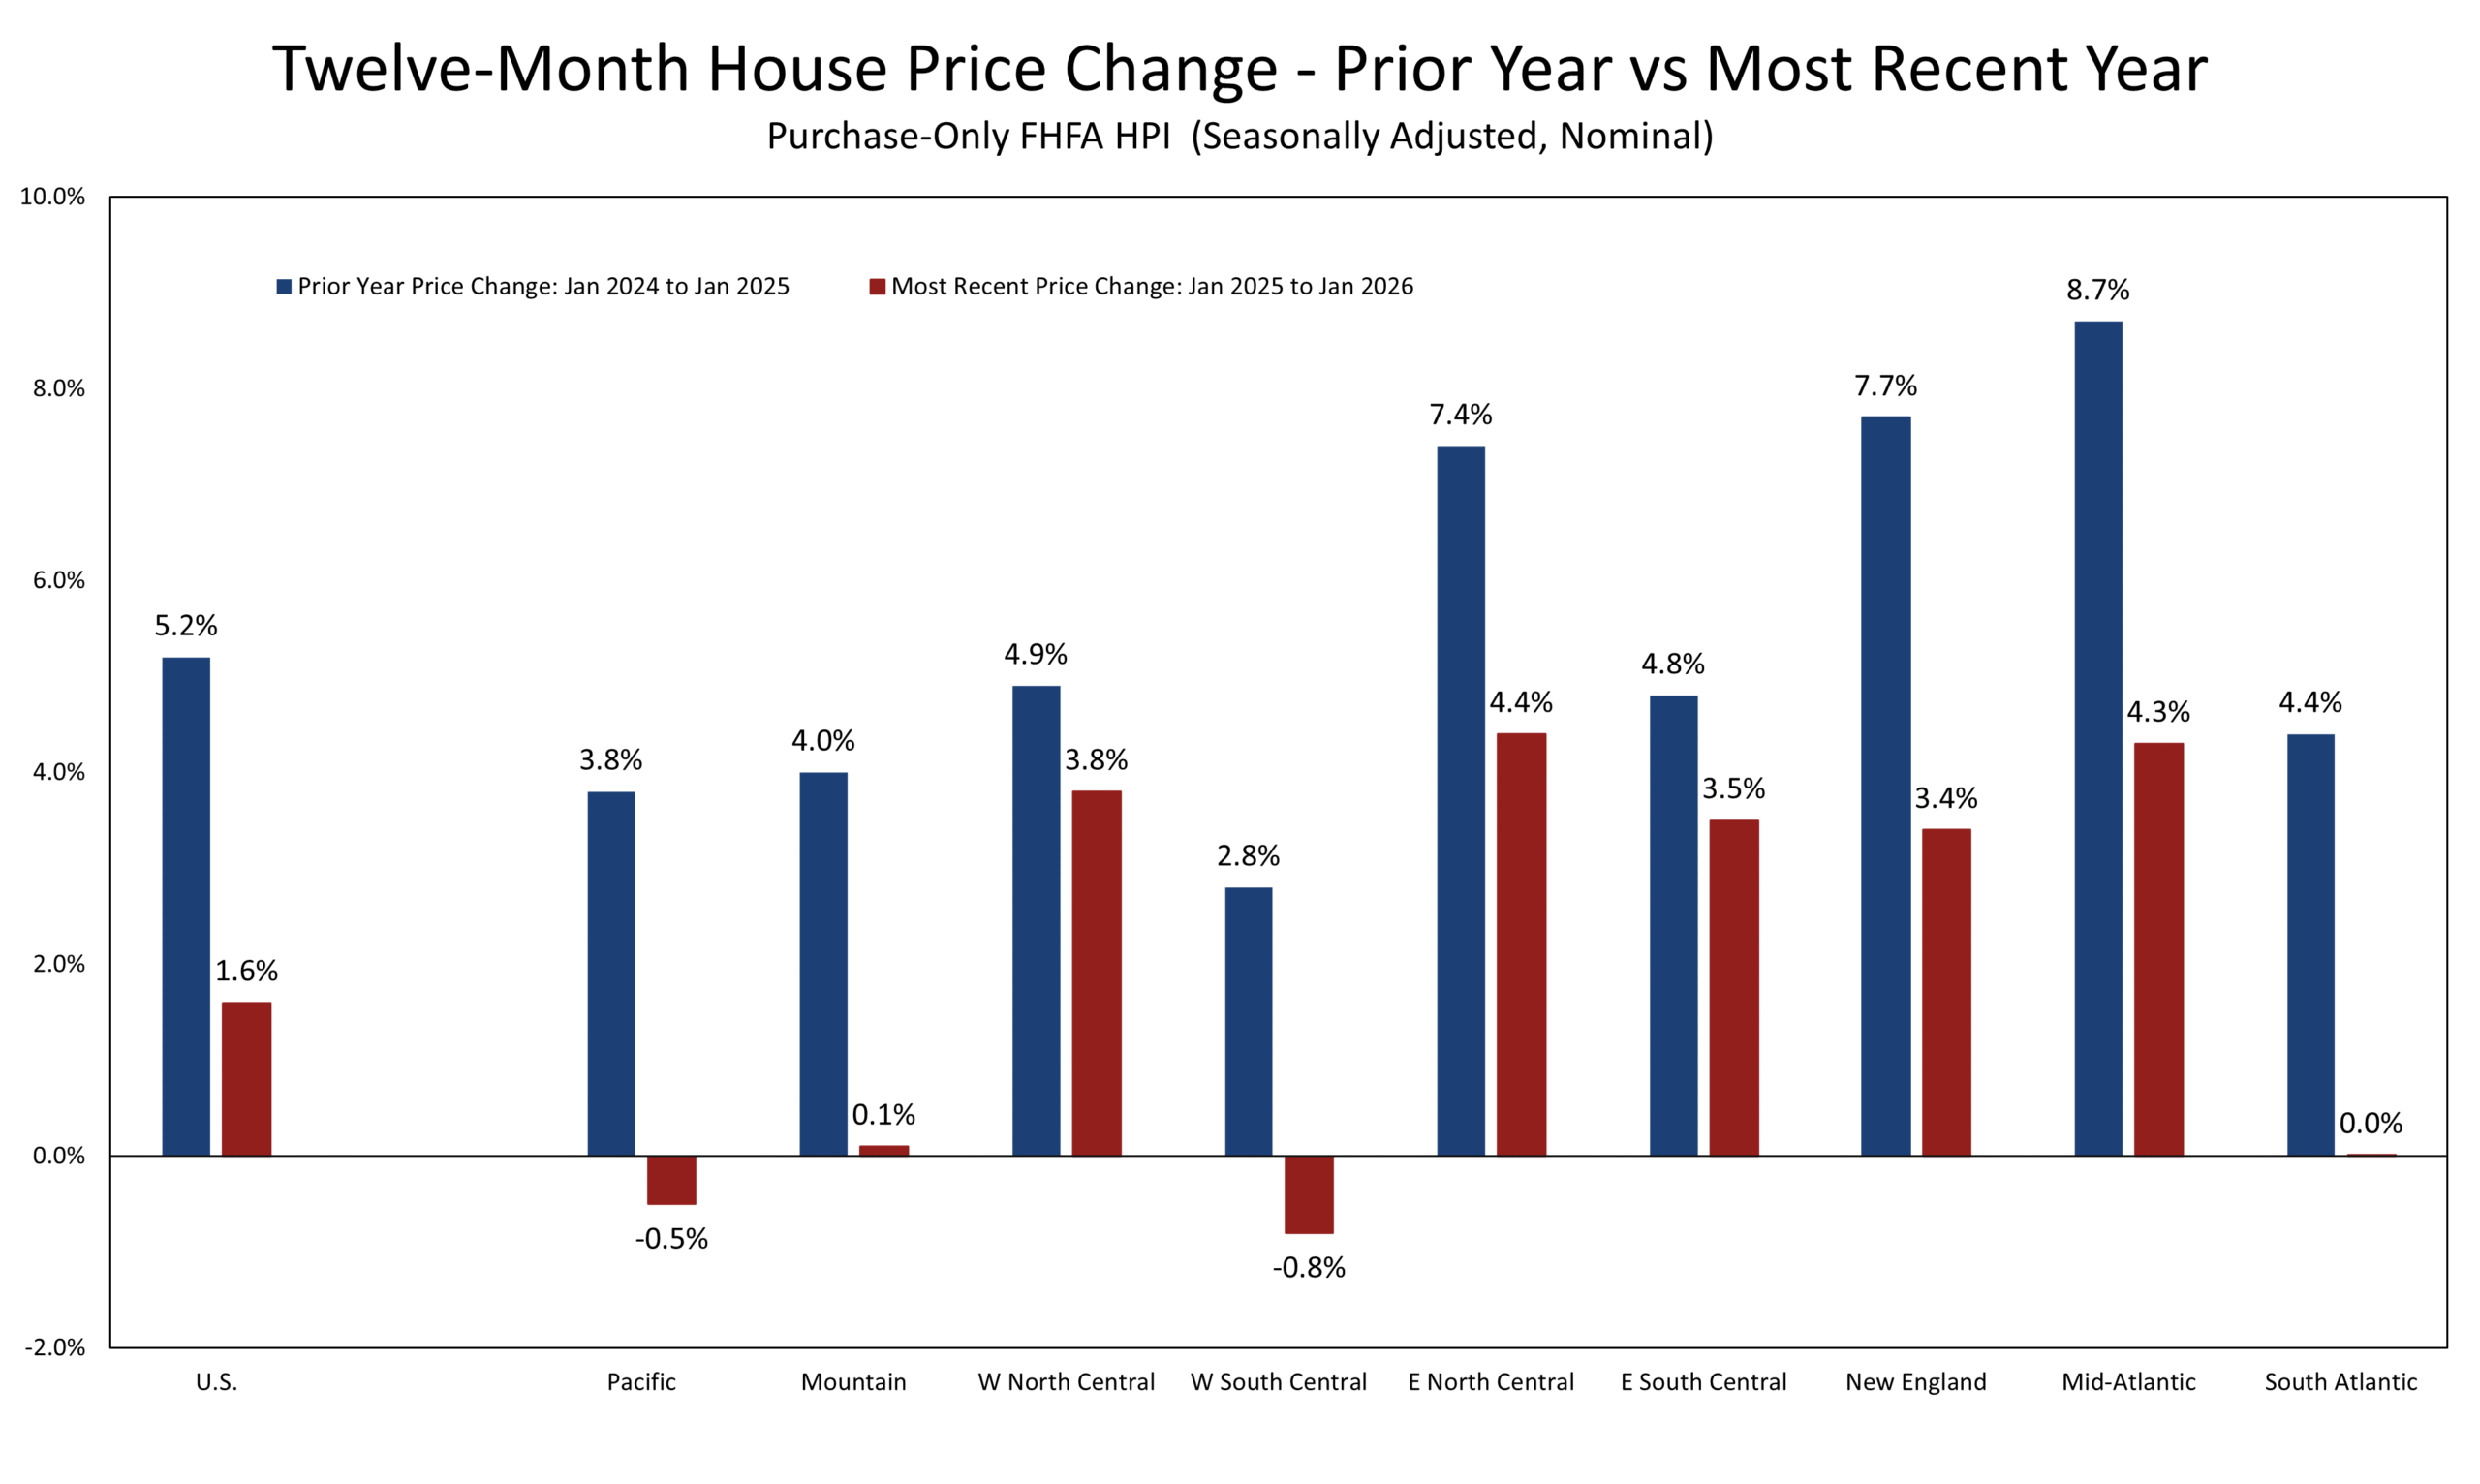
Real Prices Are Quietly Declining
With the CPI running above the pace of home price appreciation, inflation-adjusted values have edged lower over the past year. This marks a notable shift from the prior two years, when housing was a primary driver of household wealth gains.
Real home prices are declining modestly, even as nominal prices remain positive.
This adjustment is doing some of the work that outright nominal declines would otherwise accomplish. It is easing valuation pressures, albeit slowly and unevenly.
Despite the moderation in price growth, affordability has not meaningfully improved. Mortgage rates remain elevated, and in recent weeks have moved higher alongside Treasury yields. That keeps monthly payments high and limits the pool of qualified buyers.
This dynamic explains why slower price growth has not translated into stronger activity. The constraint is not price levels alone, but the cost of financing those prices. The market is caught between two forces: limited supply from rate-locked homeowners and constrained demand from payment-sensitive buyers.
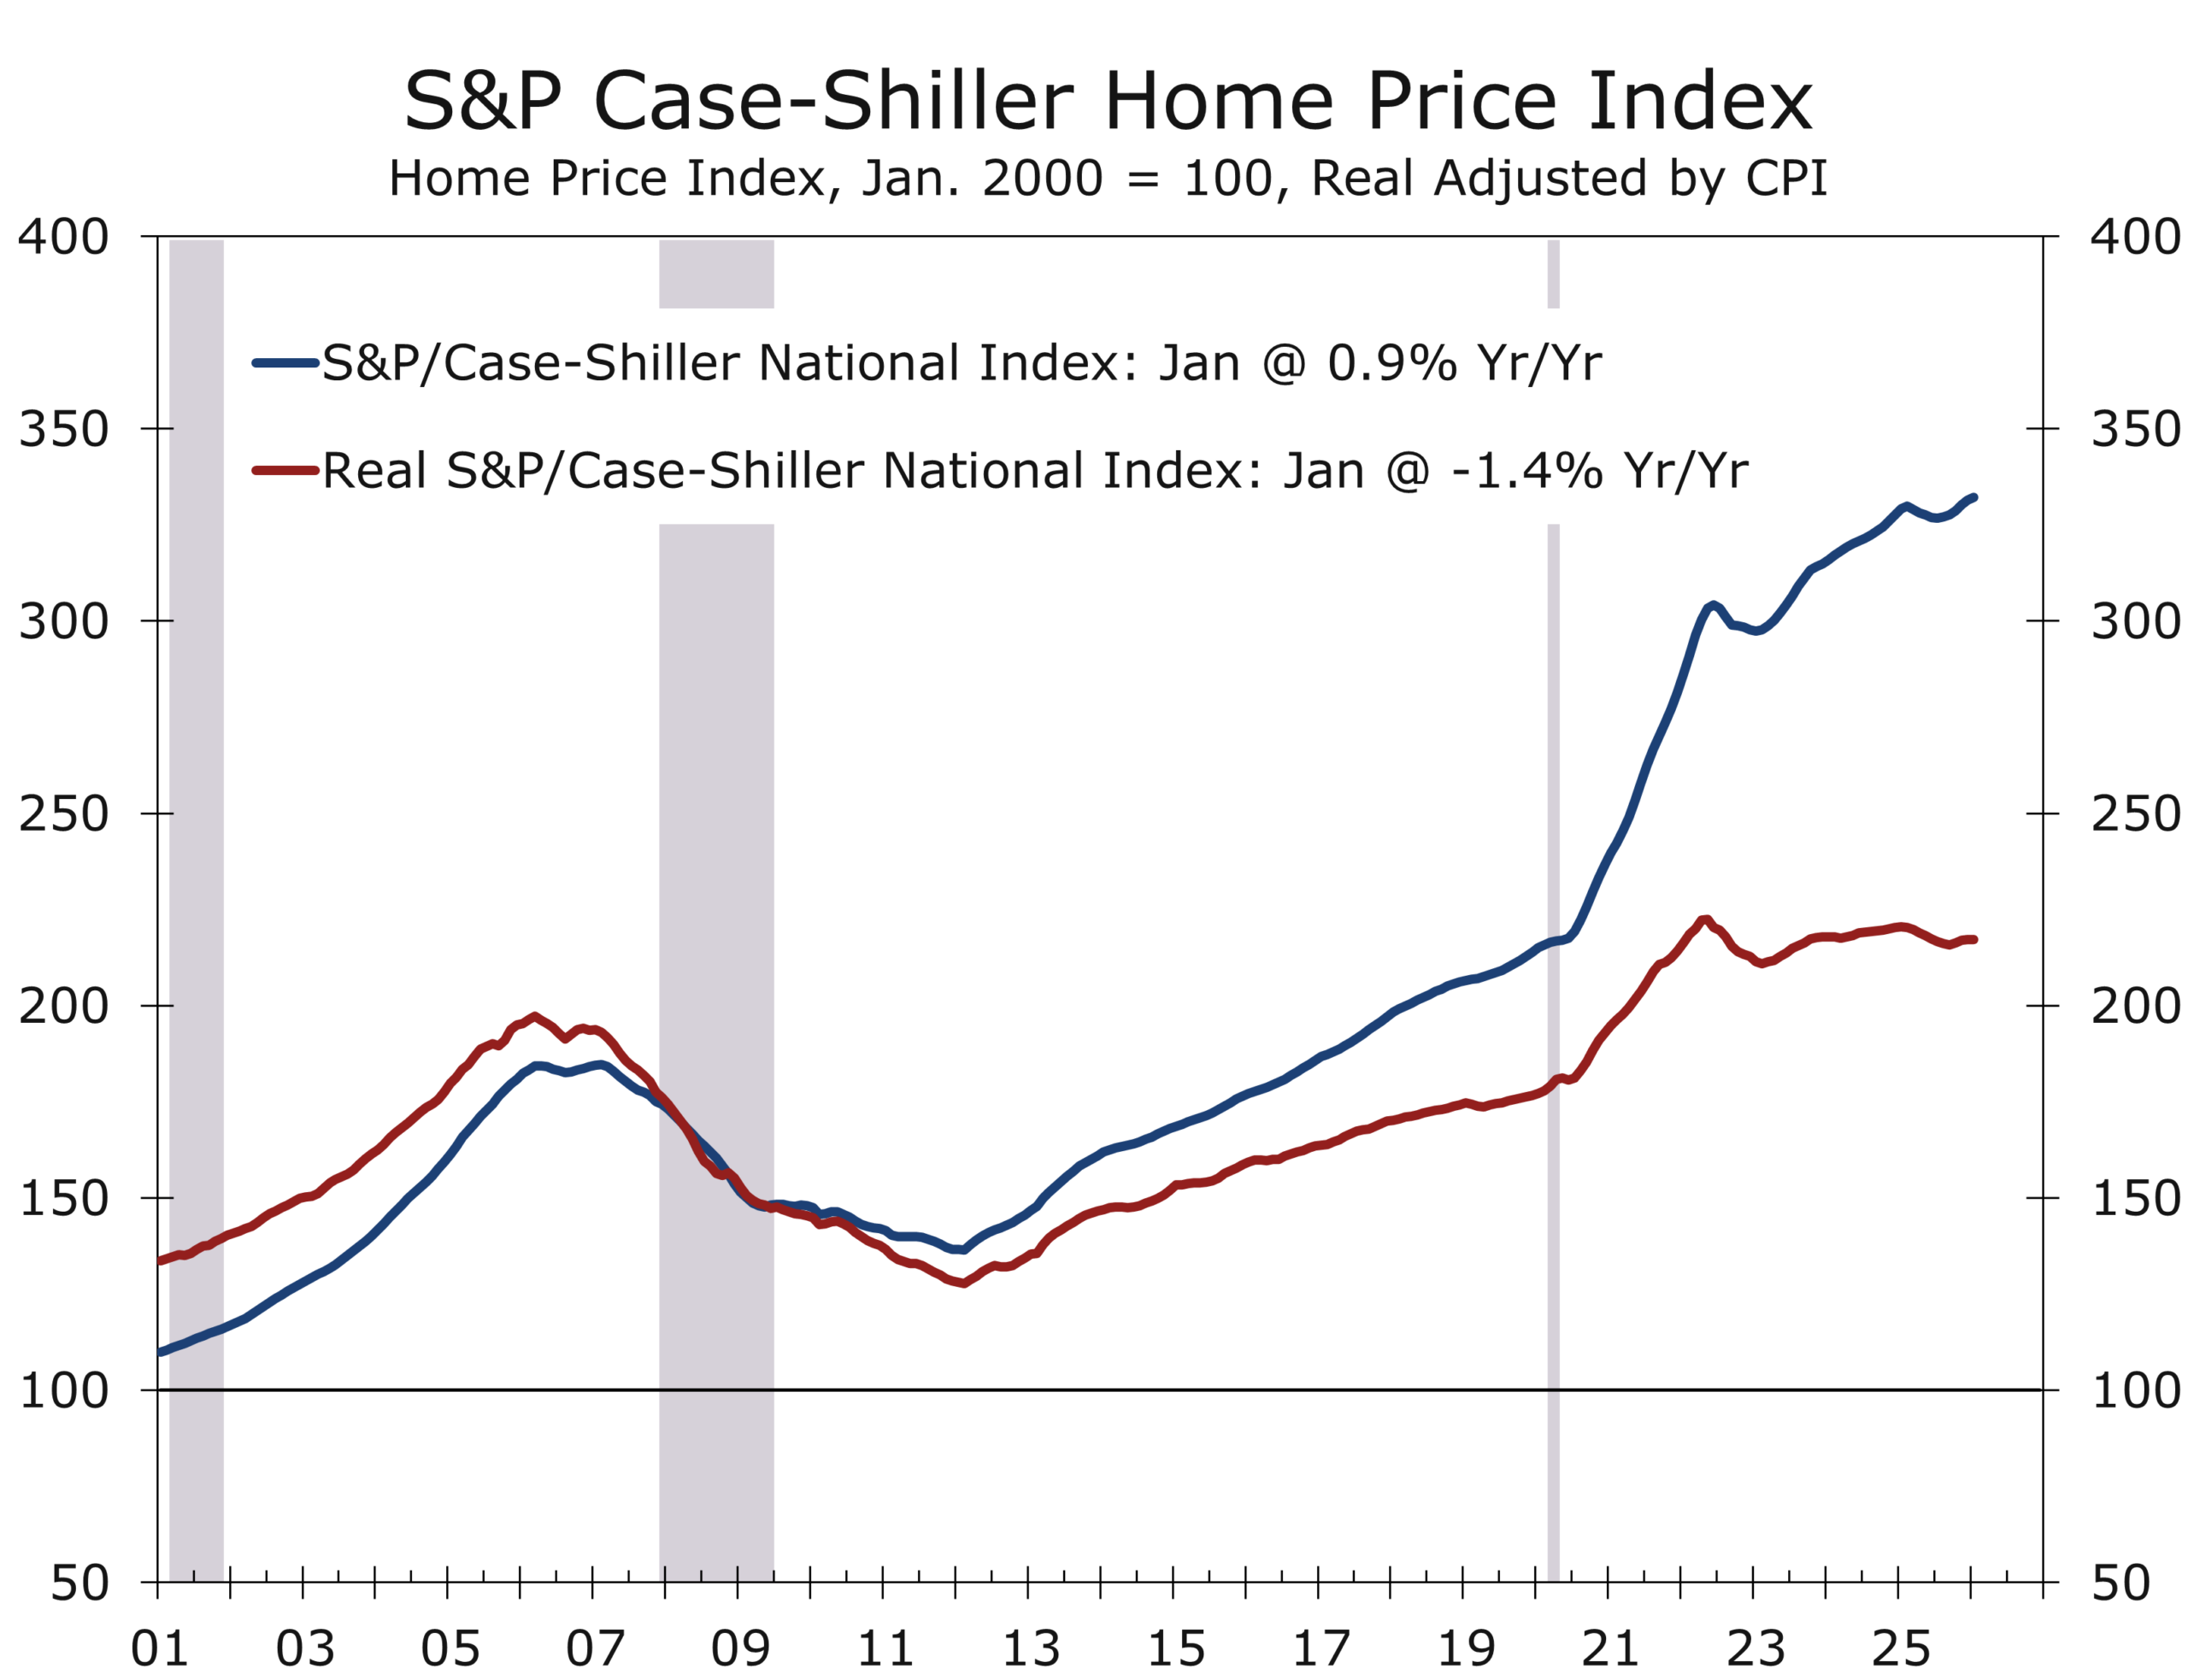
Disclaimer: This publication has been prepared for informational purposes only and is not intended as a recommendation offer or solicitation with respect to the purchase or sale of any security or other financial product nor does it constitute investment advice.
March 31, 2026
Mark Vitner, Chief Economist
(704) 458-4000