
The Strikes Stop, the Barrel Breaks, and Washington Discovers the Power Bill
A View from the Piedmont — Weekly Economic Commentary
Summary
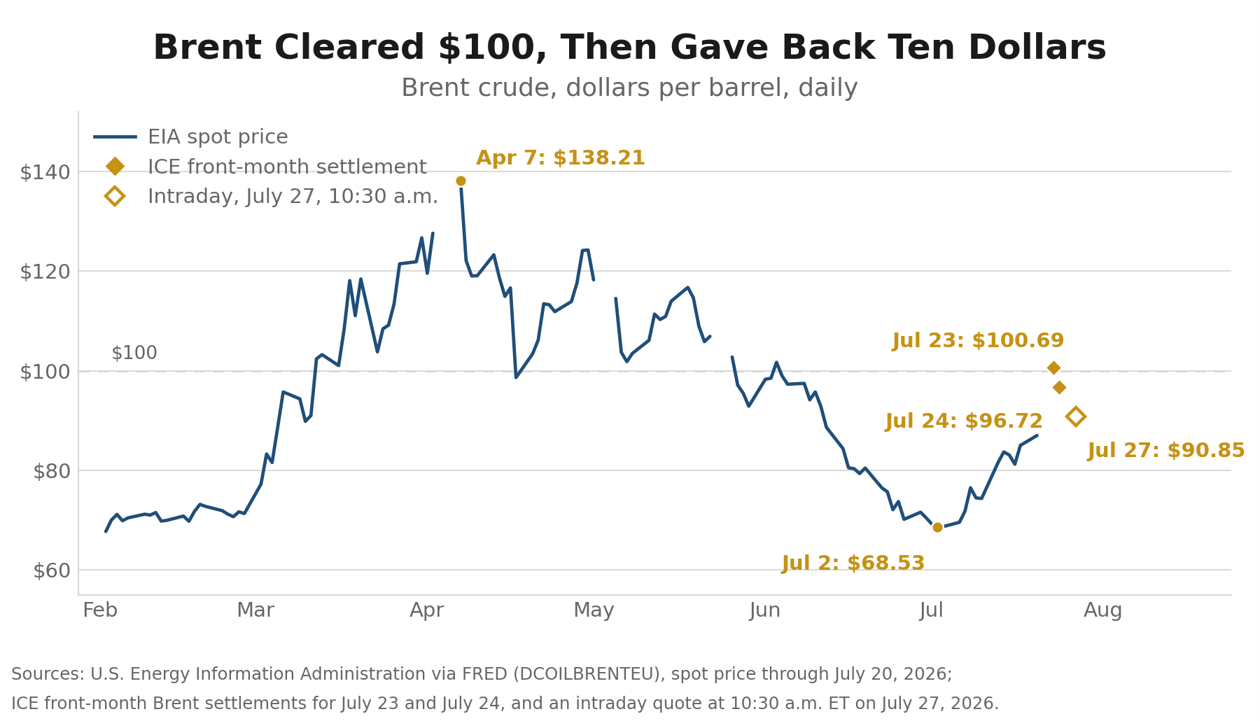
- The air campaign stopped after thirteen nights, and the barrel broke. There were no U.S. strikes on Iran Saturday, Sunday or overnight into Monday, and Tehran halted its retaliation in kind. Brent gapped lower at the Sunday open and was trading near $90.85 Monday morning, roughly $10 below Thursday’s settle of $100.69. This is quiet for quiet rather than an agreement, and nothing in the Strait of Hormuz has reopened.
- Brent settled above $100 last week for the first time since May. Crude closed Thursday at $100.69 and finished the week at $96.72, up 9.7%. Iran rejected the American ceasefire proposal on Friday, refusing any temporary deal that does not settle the final status of the strait, and that refusal is what the weekend pause has parked rather than resolved.
- A second maritime front opened in the Red Sea. The Houthis declared a naval blockade of Saudi Arabia on July 20 and struck Saudi tankers two days later. War-risk premia for vessels calling at Jizan and Al Shuqaiq have run as high as 3% of hull value, from 0.30% a week earlier.
- Initial claims fell to 187,000, the lowest weekly total since 1969. The last reading below that level came in September 1969. Claims of 187,000 alongside a flash composite PMI at an eight-month high describe an economy that was accelerating into the third quarter.
- The hike is back on the table. Futures-implied odds of a rate increase at the July 28-29 meeting roughly tripled to about a third, and selling-price inflation in the July flash PMI ran at its steepest pace since August 2022. We still expect no move in 2026, but the risk to that call has shifted decisively toward an earlier hike.
- Equities have a capital spending problem, not a Gulf problem. Alphabet raised its 2026 capital budget to $195 billion to $205 billion and posted its first negative free cash flow quarter since the 2004 initial public offering. Tesla’s operating margin fell to 1.4%. The Nasdaq had its worst session since April 2025 on Thursday, even as 86% of early reporters beat on earnings.
- Washington moved to get in front of the power bill. The Tennessee Valley Authority, twenty-three Republican governors and 188 signatories including every large hyperscaler joined the administration’s Ratepayer Protection Pledge on Thursday and Friday, a week after the House Energy and Commerce Committee sent the bipartisan Ratepayer Protection Act to the floor by 52 to 0. The binding constraint on the AI buildout in 2027 is looking less like chips or capital and more like local permission.
Monday Morning Update, 10:30 a.m.
The weekend changed the lead story in our outlook. The American air campaign against Iran stopped after thirteen consecutive nights, with no strikes Saturday, Sunday or overnight into Monday. President Trump ordered a halt around the strait late Friday, and Central Command’s Admiral Brad Cooper had advised that the campaign was reaching the limit of its effectiveness with designated targets largely exhausted. Reporting also points to a shortage of air-defense interceptors as a constraint on protecting American forces and Gulf allies, which is a more sobering explanation than the diplomatic one. Iran reciprocated Sunday, with an army spokesman saying Tehran had halted its retaliatory operations and warning that the war would expand geographically if the strikes resume.
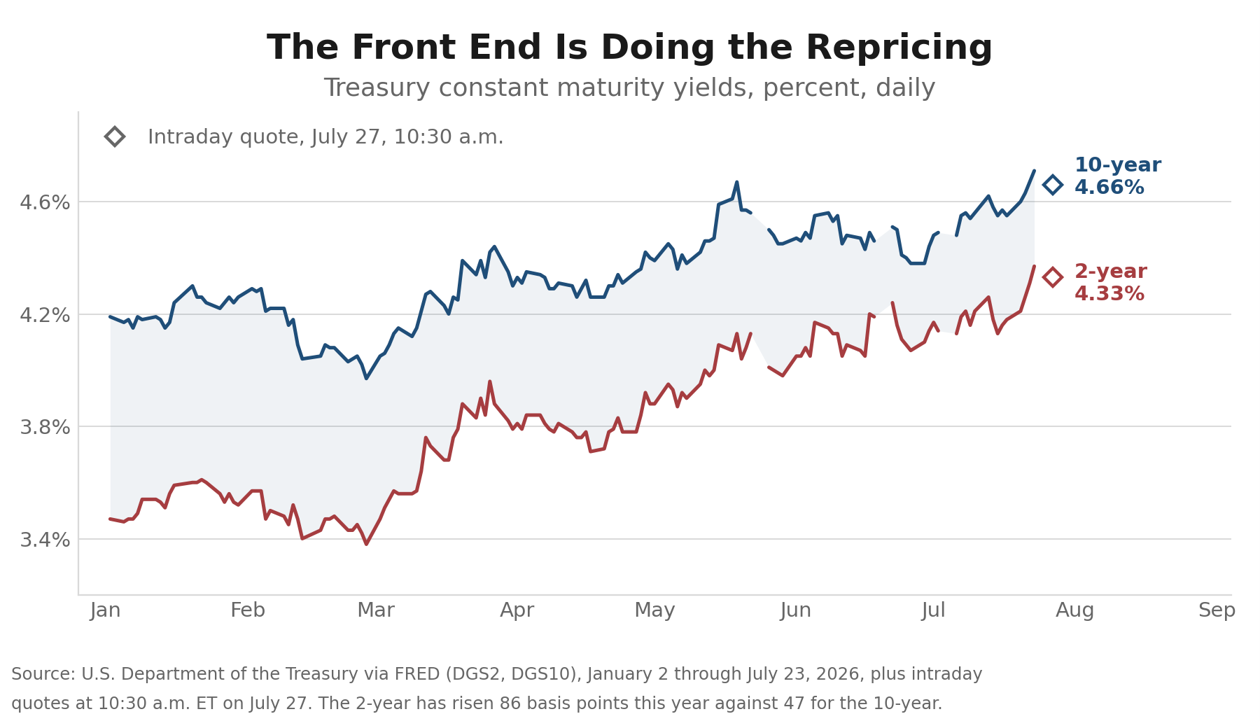
Markets priced the pause aggressively. Brent gapped lower at the Sunday open and was trading at $90.85 by mid-morning, down about 6% from Friday’s settle and nearly $10 below Thursday’s, with West Texas Intermediate at $84.33. Stocks opened higher, the ten-year eased to 4.66% from 4.68% after touching 4.63% before the bell, the two-year held at 4.33%, and gold firmed anyway. Futures-implied odds of a hike Wednesday trimmed to about a third from nearly 39% on Friday, and September still prices better than an 80% chance of at least one increase. The market took the tail off rather than the hike.
Nothing has actually reopened. Transits through Hormuz did not recover on the news, with one liquefied petroleum gas carrier and one Iranian-linked product tanker counted overnight into Sunday and no vessels using the southern corridor, and the Revolutionary Guard fired warning shots at six ships attempting to transit outside the designated lane. Iran’s foreign ministry spokesman said Monday morning that talks with Oman on shipping mechanisms are bilateral, have nothing to do with Washington, and that the strait is closed because of insecurity the United States imposed. The threat level is unchanged at severe.
The escalation migrated rather than ended. The Houthis struck Saudi Aramco facilities at Jizan and Yanbu on Saturday in retaliation for Friday’s coalition strikes on Hodeidah, with two ballistic missiles intercepted at Yanbu by a Greek-operated Patriot battery, and Pakistani mediators say halting those attacks is now a precondition for any resumption of American and Iranian talks. Ukraine separately struck Iranian vessels carrying military cargo in the Caspian, killing a sailor, and Tehran has promised an answer. The pause is worth what the next provocation says it is worth, and there are now three theaters that can supply one.
Market Snapshot
| Indicator | Level | Our Read |
|---|---|---|
| Brent Crude | $96.72 / bbl | Up 9.7% on the week after settling at $100.69 Thursday. Down about 6% to $90.85 by Monday mid-morning on the strike pause. |
| WTI Crude | $89.42 / bbl | Up 8.4% on the week, and back to $84.33 Monday mid-morning. The three-month Brent timespread widened to $9.26 last week, the widest since May 22. |
| S&P 500 | 7,411.98 | Off 0.6% on the week and 2.6% below the June 2 record close of 7,609.78. Futures up about 1% Monday morning. |
| Nasdaq Composite | 24,975.82 | Down 2.1%, with Thursday’s 2.15% drop the worst session since April 2025. Nasdaq 100 futures up more than 1.5% Monday. |
| 10-Yr Treasury | 4.68% | Up 13 basis points on the week and 4.71% at Thursday’s peak, then 4.66% Monday mid-morning. The move tracks the price of a barrel of oil, not the growth outlook. |
| 2-Yr Treasury | 4.33% | Up 15 basis points, more than the ten-year, and unchanged Monday mid-morning. The curve has flattened to 35 basis points from 72 at the start of the year. |
| Gold | ~$4,066 / oz | Touched $4,150 midweek and gave most of it back, then firmed above $4,090 Monday even as crude fell. |
| 30-Yr Mortgage | 6.58% | Up 3 basis points. New home inventory sits at 9.3 months’ supply. |
| Fed Policy | July 28-29 FOMC | No change expected Wednesday. Hike odds trimmed to about a third Monday from nearly 39% Friday, with September still above 80% for at least one increase. No updated projections. |
Crude Cleared $100, and Then the Bombing Stopped
The oil market spent the week discovering that the Strait of Hormuz is not the only chokepoint that matters. Brent traded up every session through Thursday, settling at $100.69 for the first time since May 26 and touching $101.01 intraday, before giving back nearly 4% Friday on reports that Pakistan, with Chinese backing, is trying to revive negotiations. U.S. strikes on Iranian targets ran for a thirteenth consecutive night on Friday, hitting Ahvaz, Omidiyeh, Bandar Abbas and Qeshm Island, and Tuesday’s wave reached seven provinces including an electrical installation near the Bushehr nuclear plant. American deaths since the war began in February now stand at 18. Iraq’s prime minister carried a ceasefire proposal to Tehran on Thursday, and Iran rejected it on Friday, saying it would not accept a temporary arrangement that leaves the final status of the strait unsettled. That refusal, more than any single strike, is what changed the week’s arithmetic.
Traffic through Hormuz has thinned to a trickle. The Joint Maritime Information Center counted 5 transits on July 19 and 3 a day from July 22 through Friday, against a historical norm the center puts near 138 vessels a day. Fourteen Iranian attacks on commercial shipping have been confirmed since June 25, mine danger areas remain active inside the traffic separation scheme, and the threat level has been held at severe. The blockade of Iranian ports reimposed on July 14 has redirected six ships and disabled one. The strait has never been formally closed, however, and formal closure is not necessary when war-risk premia are already rationing the passage more tightly than a port authority could.
The genuinely new development came roughly 1,300 miles to the southwest. The Houthis declared a naval blockade of Saudi Arabia on July 20 in retaliation for the Saudi strike on Sanaa airport, struck two Saudi tankers on July 22, and by Thursday had prompted the Joint Maritime Information Center to raise the Bab el-Mandeb threat level from moderate to substantial. War-risk premia for vessels calling at Jizan and Al Shuqaiq climbed to as much as 3% of hull value, from roughly 0.30% on July 17, and five Saudi cargoes diverted. The Saudi-led coalition struck Hodeidah on Friday and announced that its military response was over. The two-strait scenario we have been treating as a tail risk has arrived, and the cushion that would normally absorb it is gone. The International Energy Agency puts effective OPEC+ spare capacity at 0.17 million barrels a day, and the Strategic Petroleum Reserve stands at 311.4 million barrels, the lowest level since 1983.
We are moving our scenario probabilities to 50/15/35, having carried 55/15/30 into last week and 45/15/40 out of it. The weekend’s pause is worth something, and it is worth less than the six-dollar break in the barrel implies. The base case, at 50%, has the pause holding long enough for the Oman channel to produce a transit mechanism, and Brent settling near $82 by year-end as the risk premium bleeds off. The upside case, unchanged at 15%, has a durable framework agreement pulling crude into the low $70s. The adverse case, at 35%, carries the disruption into the fall with Brent back in the triple digits, gasoline pushing past its spring peak, and the June inflation relief looking like the exception it probably was.
Three things argue against moving all the way back. The strait has not reopened, and Tehran restated Monday that it considers the closure Washington’s doing rather than its own. The Red Sea got worse over the weekend, not better, and Saudi Arabia now has refinery damage to answer for. And the campaign appears to have stopped because targets ran short and interceptors ran shorter, which is a supply constraint on the American side rather than a decision to settle. A pause built on exhaustion reverses faster than one built on terms.
The Hike Is Back on the Table
The pump has already turned. The AAA national average for regular gasoline crossed $4.00 on July 20 and reached $4.091 by Thursday, up 15 cents in a week and 94 cents from a year ago, after sitting at $3.83 as recently as July 2. Diesel is the more serious problem. The Energy Information Administration’s on-highway average reached $5.134 on July 20, up 34 cents in a single week and $1.32 over the year, with Gulf Coast diesel up 40 cents. Fuel surcharges reset weekly off the diesel index, so that part of the pass-through is mechanical rather than discretionary. Contract linehaul rates reset on a much slower cycle, which means freight pricing would have stayed firm into the fall even if diesel had not rebounded. Now it stays firm longer.
The market repriced the July meeting inside of a week. Futures-implied odds of a rate increase at the July 28-29 meeting climbed to roughly a third by Friday, from about one in eight a week earlier and 18% at the start of the month. September now prices better than 80% for at least one increase. The two-year note rose 15 basis points on the week and the ten-year rose 13, a repricing driven by the barrel and by tariffs rather than by any improvement in the growth outlook. This meeting arrives without an updated Summary of Economic Projections, so the statement language and the press conference carry the entire signal. We would offer one caution on this logic, however, since tighter monetary policy will do little to suppress supply-driven price increases.
The tariff news deserves the same care as the barrel. The Trade Representative announced Section 301 duties on 60 trading partners on July 23, effective the following morning, at 10% for the seventeen economies that maintain forced-labor import bans and 12.5% for the rest, covering 99.4% of imports with carve-outs for energy, autos, steel, aluminum and qualifying North American entries. Read as a fresh escalation of ten to twelve and a half points, that would be a serious new inflation impulse on top of the oil shock. It is better read as a backfill. The Supreme Court struck down the emergency-powers tariffs in February, the 10% balance-of-payments bridge that replaced them expired on July 24, and this action steps into that gap, recovering less than 60% of the lost revenue by the Committee for a Responsible Federal Budget’s estimate. The effective rate is roughly where it was, which is why markets barely moved, and two suits filed at the Court of International Trade on Friday will decide whether it stays there.
Our call is unchanged. We expect no move in 2026, and we expect the next move to be a hike. What has changed is the balance of risk around that call, which now leans clearly toward an earlier increase than the first half of 2027 we have penciled in. If the July price detail repeats in the August surveys, September becomes a live meeting rather than a hypothetical one. A tightening aimed at containing inflation expectations does not appear warranted this year, and the market does not think it is needed. Five-year breakevens ended last week at 2.24% and the five-year forward measure at 2.28%, both close to target with headline inflation at 3.5% and an oil shock in progress. The case for the hike we expect rests on demand meeting a full-employment economy, not on expectations coming unmoored. The Warsh Fed has abandoned forward guidance, which cuts both ways: it will not talk itself into a corner, and it will not warn anyone before it moves.
Claims at 187,000, and a Flash PMI That Cut Both Ways
Initial jobless claims fell 22,000 to 187,000 in the week ended July 18, the lowest weekly total since 1969. We checked the full history rather than trusting the headline, and the last reading below this one came in September 1969, when claims registered 182,000. The four-week average fell to 207,500 and continuing claims eased to 1.796 million, holding the insured unemployment rate at 1.2%. The layoff channel is doing nothing to loosen the labor market. The claims data fit our out-of-consensus call for a cyclical rebound to lift job growth and output over the next six to eight quarters, which is the driver of the rate hikes in our forecast, since it arrives at a time when the economy is already operating at full employment.
The activity surveys pointed the same direction. The S&P Global flash composite index for July jumped to 53.6 from 51.9, an eight-month high, with services doing the work at 53.6 against 51.2 in June and manufacturing about flat at 53.8. S&P Global’s Chris Williamson read the survey as consistent with growth near a 2.0% annualized pace in the third quarter, against the 1.2% the survey signaled for the second. Employment rose marginally after two months of decline. The price detail underneath was considerably less friendly. Input cost inflation reached a fourteen-month high, services-led, on energy, shipping and tariffs, and selling-price inflation accelerated to its steepest pace since August 2022, with services charge inflation near a four-year peak. Firms that spent the spring absorbing higher costs have started passing them along.
Durable goods orders landed this morning and cut the same way. Headline orders rose 0.3% in June against a 1.6% consensus, held down by transportation, while orders excluding transportation rose 0.6%. The number that matters for the growth arithmetic was better than the headline: core capital goods orders rose 0.9% against a 0.5% consensus and core shipments jumped 1.9%, which feeds directly into equipment spending in Thursday’s advance estimate of second-quarter output. May was revised up across the board. Business investment is not what is soft.
Housing again ran against the grain. New home sales rose 1.6% in June to a 628,000 annual pace, better than the 610,000 consensus but 5.6% below a year ago, with the median price down 2.7% over the year to $398,300 and inventory at 9.3 months’ supply. Builders are carrying a record number of homes that have been authorized but not started, which is what a cautious builder does when the sales pace will not support the next foundation. The South, which accounts for most of the nation’s population growth, was the exception within the exception, at a 412,000 pace and up 9.9% for the month, the strongest region in the country.
The AI Trade Got Its Capital Spending Bill
Thursday’s selloff had nothing to do with Iran. Alphabet reported Wednesday evening with revenue of $119.8 billion, up 24%, and Google Cloud up 82% to $24.8 billion against a $514 billion backlog, and the stock fell 7.1% anyway. Second-quarter capital spending came in at $44.9 billion, roughly double a year earlier, and management raised full-year guidance to a range of $195 billion to $205 billion from $180 billion to $190 billion, well above the $188 billion the Street carried. Free cash flow swung to negative $5.9 billion from positive $10.4 billion, the first negative quarter since the company went public in 2004, and the chief financial officer said capital spending will rise significantly again in 2027. At the midpoint of the new guidance, Alphabet is spending roughly 42 cents of every revenue dollar on plant, a ratio more familiar from regulated utilities than from software companies.
Tesla reported the same evening, logging record 480,126 deliveries and revenue of $28.24 billion, up 26%, but still missed badly on the bottom line at $0.33 a share against roughly $0.52 expected. Operating income fell 57% to $398 million and the operating margin slid to 1.4% from 4.1%, while capital spending rose 142% to $5.79 billion and free cash flow turned negative for the first time in more than two years. The stock fell 14.5% Thursday, erasing roughly $140 billion of market value, and the Nasdaq fell 2.15% in its worst session since April 2025. Intel made the point most cleanly. It beat on Thursday evening with revenue of $16.13 billion, up 25%, and earnings of $0.42 against $0.22 expected, rose as much as 13% after hours, and closed Friday down 6.5%.
The earnings season underneath all this is quite strong. With 27% of the index reported, 86% have beaten on earnings against a five-year average of 78%, and 80% have beaten on revenue against an average of 70%. Blended revenue growth of 13.2% is the best since 2022. Investors are not questioning the demand. The question has moved to who funds the capacity that serves it, and for how long. Alphabet’s answer, 42 cents of every revenue dollar with more promised for 2027, is what the market will price against when Microsoft, Meta and Apple report this week.
Lessons from the South
The South is running the country’s data center experiment first, which makes it the most useful read available on how the buildout goes everywhere else. The region’s June employment report landed Tuesday and looked much as it has all year. Unemployment rates ran from 3.2% in Alabama and 3.4% in Georgia up to 4.4% in South Carolina and Texas and 4.7% in Florida, against 4.2% nationally. Texas was the only state in the region with a statistically significant monthly payroll gain (+43,400), and one of only four in the country. North Carolina added 62,900 jobs over the year (+1.2%), though manufacturing gave back 10,000 of them. Virginia was the outlier, shedding 43,600 jobs over the year (-1.0%) with participation slipping to 63.1%. The lesson generalizes past the map: the labor market is tight where private capital is landing and soft where federal payrolls dominate, and that divergence is about employer mix rather than geography.
The first lesson from the buildout itself is about the arithmetic of the jobs. OpenAI announced a $20 billion campus in Effingham County, Georgia on Wednesday, with 3.2 gigawatts contracted from Georgia Power under a 25-year agreement phased from 2028 through 2032, and about 400 permanent jobs at opening rising to 1,000 by 2032. Meta began operations at a $1.2 billion campus in Temple, Texas with 100 permanent jobs. Google filed for two Vernon, Texas facilities at $1 billion combined, CyrusOne announced a sixth San Antonio campus at $500 million, and Hut 8 leased 352 megawatts at Beacon Point to take that campus to a fully leased 704. These are capital projects rather than employment projects, and a county evaluating one on direct payroll will always be disappointed. Cushman & Wakefield published useful work on Monday putting the indirect effect at roughly 1,300 local jobs and $110 million of annual wages per 100 megawatts, which is the honest case for the buildout, and it rests on the supply chain and the tax base rather than on the badge scans at the fence line.
The second lesson is that the binding constraint is electricity, and the fight is over who pays for it. Georgia Public Service Commission staff have warned that the special industrial pricing structure could raise the average residential bill by as much as 11% by 2028. North Carolina’s attorney general rejected the Duke Energy Carolinas rate settlement on Tuesday, which would raise residential rates about 9.5% over two years against Duke’s original 18% request. "We did our own independent analysis of what Duke will need to meet demand, and we think they overshot the mark," Jeff Jackson said, and his approval is not legally required. Virginia’s commission is weighing how much transmission cost data centers should carry. The clearest signal came from the grid itself: PJM’s capacity auction for 2028 and 2029 cleared at $325 per megawatt-day, and for the first time in the market’s history the entire regional transmission organization fell short of its reliability requirement, by 6,831 megawatts.
The third lesson is that the local veto works, and it is spreading faster than the projects are. More than two dozen North Carolina counties and cities have passed moratoriums, and more than twenty Florida jurisdictions have rejected projects outright. Spartanburg County, South Carolina passed the second reading of a one-year moratorium unanimously on Monday before a standing-room crowd. Dougherty County, Georgia approved a 45-day pause, Albany is weighing six to eighteen months, and Frederick County, Virginia is drafting an ordinance that would remove data centers as an allowed use in every zoning district. In Texas, Diode Ventures withdrew a Henderson County project on Thursday after residents objected to a projected 5 million gallons a day of lake water, and Governor Abbott sided with the residents rather than the developer. Capital is arriving in jurisdictions that in many cases have no zoning authority and no experience negotiating with counterparties this size, and the response has been the only tool those jurisdictions have.
The leverage runs the other way too, and the veto is what created it. What the hyperscalers are short of is increasingly firm power and water rather than land, and a county that has both, and that arrives at the table already understanding the load, the water draw and the tax arithmetic, now negotiates from a much stronger position than it would have two years ago. A community in revolt can block a project, but it cannot bargain with one. Effingham County shows what the bargaining produces. Alongside the property tax abatement, OpenAI put up an $80 million community fund and $71 million in software credits for Georgia college students, and proposed a compact carrying annual independent audits, though it has not named the auditor.
The Power Bill Becomes a Midterm Issue
The politics caught up on Thursday and Friday. The Tennessee Valley Authority signed the administration’s Ratepayer Protection Pledge on Thursday, with chief executive Mike Skaggs committing to keep data center costs off the bills of the ten million people TVA serves and noting that data center load is expected to double by 2030. Twenty-three Republican governors signed on Friday, including Brian Kemp and Henry McMaster, while Ron DeSantis, Kelly Ayotte and Phil Scott declined. The pledge now carries 188 signatories, 106 of them rural cooperatives, alongside Google, Microsoft, Meta, Oracle, xAI, OpenAI and Amazon. The week before, the House Energy and Commerce Committee had sent the bipartisan Ratepayer Protection Act to the floor by a vote of 52 to nothing. A unanimous committee vote in late July of an election year is a tell. Both parties have read the same polling, and the industry signed because being at the table beats being on the menu.
The bill itself is narrower than the coverage suggests, and the gap matters. H.R. 9340, from Gabe Evans of Colorado and Kathy Castor of Florida, amends the Public Utility Regulatory Policies Act to require states to consider a ratemaking standard under which loads of 100 megawatts or more at a single site cover the full incremental cost of the generation, transmission and distribution needed to serve them. Consider is the operative verb. It is a consideration mandate rather than federal preemption, the Senate companion has no markup scheduled, and the pledge itself is voluntary. North Carolina’s attorney general put the enforceability problem more plainly than any analyst has: a promise in Washington does not lower a power bill in North Carolina. He and Governor Stein are pressing to convert the federal pledge into a binding tariff at the state commission, which is where this will actually be decided.
The timing is not mysterious. The two prices American households can quote from memory are both moving the wrong way at once. Gasoline crossed $4.00 on July 20 and reached $4.091 by Thursday, up 94 cents from a year ago, and the pump is a war problem that no administration can fix on a political calendar. The electricity bill is a problem it can be seen acting on. The polling has moved fast: Emerson College, in the field July 19 and 20, found 63% of likely voters opposed to an AI data center in their own community, against 42% last December. The empirical case exists too. Council incumbents in Spartanburg County who approved data center tax breaks lost their primaries in June, and a late retreat to a moratorium did not save them. Texas shows how quickly this nationalizes, with the Senate nominee calling for repeal of the state’s data center sales tax exemption, the gubernatorial nominee calling for a moratorium until the Legislature returns in January, and Governor Abbott separately proposing to repeal the exemption himself.
Two findings complicate the tidy version of this story, and both are worth carrying. Gallup finds that only about 15% of the people who object to data centers cite higher utility bills as their reason, which suggests the opposition is at least as much about water, noise, land and the sense of being negotiated around as it is about price. And new work from the Electric Power Research Institute finds that between 2015 and 2024 data center expansion was associated with lower retail electricity prices rather than higher ones, on the order of a 3.5% national decline for each doubling of capacity, as fixed costs spread across a larger base. The authors supply their own caveat, which is the one that matters here: if the grid builds for demand that does not arrive, the arithmetic runs the other way. That is the real risk in the buildout, and it is not the one the pledge addresses.
For the economy, none of this stops anything already under construction. Data center building has been one of the few genuinely strong categories of nonresidential construction while offices and retail sit out, and that contribution is locked in for 2026. The exposure is to what gets sited in 2027 and 2028, and a slower approval pace would land on the category that has been carrying the sector. That is a growth question for next year and the year after, not for this quarter, which is precisely why it is easy to underweight now.
For financial markets, the AI trade has picked up a second risk this month that was not priced at the start of the year. The first is return on capital, which is what Alphabet’s negative free cash flow quarter surfaced on Wednesday. The second is permission, which is what Henderson County surfaced on Thursday. Neither is a demand question, and that distinction is what makes them harder to underwrite than a soft revenue print. The test arrives Wednesday evening, when Meta reports against capital spending guidance of $125 billion to $145 billion for this year, a number large enough that the political conversation will move with it. Utilities carry the mirror image of the same risk, since the earnings case for large-load growth rests on cost allocations that state commissions and now a congressional committee are actively revisiting.
For policy, the cost allocation question has jumped from state dockets to a bipartisan bill, and whatever emerges will set the terms for a decade of load growth. For the Fed, the relevance is narrower but real. Household utility bills carry more weight in how people describe inflation than they do in the index itself, and a year of rising power bills would complicate the argument that this inflation episode is a war shock that unwinds on its own. We do not expect the pledge to stop a single project already in the ground. We do expect it to change what gets approved between now and November, and the projects most likely to slip are the ones whose economics assumed a friendly county commission.
Trading Efficiency for Security, and Not Yet Getting It
The slowest-moving story in this letter is probably the most consequential, and the war has made it harder to argue with. Firms and governments are rebuilding supply chains around security rather than cost, and the reallocation has been fast. China’s share of American goods imports has fallen from 21.6% in 2017 to about 9% last year and roughly 7% through April, while Mexico has risen to nearly 16% and Vietnam to almost 7%. The reallocation is not free, and that is the entire point. Laura Alfaro and Davin Chor, in work published through the National Bureau of Economic Research, find that where China lost five percentage points of share in a product, unit values rose 9.8% from Vietnam, 3.2% from Mexico and 2.3% from high-income Asia. Buying somewhere other than the cheapest place costs more. That is the efficiency being traded away.
What the money has not yet bought is the security. Research at the Bank for International Settlements finds that the average supply chain got longer rather than shorter after 2021, from 9.67 links to 10.03, with no increase in the number of suppliers per firm. Federal Reserve staff reported this month that Chinese-owned firms have gone from 11% to 25% of Vietnam’s exports to the United States while domestic Vietnamese firms fell from 33% to 23%, which is production changing address rather than dependence changing hands. And the buffer stocks never appeared. Adjusted for inflation, business inventories relative to sales sit below where they stood in December 2019 and roughly level with 2018, and the Richmond Fed finds no structural difference in inventory management before and after the pandemic. Six years after the chains broke, American business carries no more cushion than it did going in.
The inflation arithmetic deserves more precision than it usually gets. Most of what has been measured is a price level, not a rate. The European Central Bank’s modelling of fragmentation along geopolitical lines puts the effect at roughly 5% on global consumer prices in the short run and about 1% in the long run, and Federal Reserve staff put the entire tariff round at 0.8% on core personal consumption expenditure prices. Core goods prices are running 0.8% above a year ago, which is where a structural break would show up first and does not. The stronger version of the argument is not that reconfiguration adds to inflation every year. It is that it takes the give out of the supply side, so a given increase in demand produces more inflation than it would have in 2015. That is precisely the setup we expect: a cyclical rebound arriving at full employment against a supply curve with less slack in it than the last one had.
The interest rate conclusion is right, and the reason is not the one usually given. The Richmond Fed’s estimate of the neutral real rate rose from 1.33% in 2021 to 2.17% in mid-2024 and sits at 1.74% now, and the committee’s own longer-run projection implies a real rate near 1.1% against roughly half that before 2022. But the capital demand doing the work is not coming from factories. Manufacturing construction peaked at a $250 billion annual rate in September 2024 and has fallen to $175 billion, down 30%, with manufacturing payrolls still below where they stood in February 2020. Data center construction is running near a $50 billion annual rate and up more than a third over the year, and the five largest hyperscalers will spend more than a trillion dollars on artificial intelligence capital across 2025 and 2026. The construction boom did not end. It moved from factories to server halls. If real rates are structurally higher for the next decade, the buildout described three sections above is a larger part of the reason than the one described here, and both are the same story: capital being spent on something other than the cheapest way to make a thing.
What CFOs and Treasurers Should Do Now
Extend the contingency review to the Red Sea. Red Sea war-risk premia tripled in a week and the Bab el-Mandeb threat level was raised on Thursday. Freight surcharges reset weekly and pass through faster than contract rates, so routing alternatives and war-risk coverage should be priced as sticky through year-end rather than as an episodic add-on.
Use this break to hedge, rather than to celebrate. On-highway diesel rose 34 cents in a single week and is up $1.32 over the year, running well ahead of gasoline, and the pump has not yet seen the crude decline. Monday’s six-dollar break in the barrel is the cheapest calendar 2027 distillate and jet coverage anyone has been offered in two weeks, and it is priced off a pause that neither side has put terms under.
Term out funding now, and stop waiting for cuts. Credit spreads did not widen with equities, with high yield holding near 268 basis points through the drawdown, and the beat rate is running at 86%. With hike odds near one third and September pricing above 80%, the issuance window is more likely to narrow than to widen.
Reprice contracts before the surveys make it obvious. Selling-price inflation is at its steepest since August 2022 and services charge inflation is near a four-year peak. Firms that have been holding price to protect volume are about to find their competitors have stopped.
Scrutinize capital plans the way the market just did. Two of the country’s largest capital allocators were punished this week for what they are spending, and both had beaten on revenue. Boards should expect the same question, and the answer needs to include the payback period and the free cash flow bridge, not the strategic rationale alone.
Price siting and permitting risk as a real line item. Any capital plan that depends on a county commission, a water allocation or an interconnection queue now carries schedule risk it did not carry a year ago, and the approval calendar between now and November is the tightest part of it. Build the delay case, and know which jurisdictions have already moved.
The world is trading efficiency for security, and has not bought the security yet. Near-shoring and friend-shoring are supplementing re-shoring, and the reallocation is real, but chains have lengthened rather than shortened and the inventory buffers never arrived. Plan for a supply side with less give in it, which means firmer underlying inflation and higher underlying real rates, and audit whether your own diversification moved the dependence or only the address.
Budget for tight labor even with hiring soft. Claims at 187,000 are a 57-year low and the flash survey showed employment turning up after two months of decline. Wage pressure in labor-intensive functions is not going to ease because the payroll headline is modest.
The Week Ahead
The Fed has the week to itself. The Federal Open Market Committee announces Wednesday at two o’clock without updated projections, which puts the whole burden on the statement language and Chair Warsh’s press conference. A hold would be the fifth consecutive one, and the interesting question is the dissents, which for the first time in this cycle are expected to run hawkish. Second-quarter gross domestic product and the June personal consumption expenditures deflator both arrive Thursday morning, and the deflator is the one that matters for September. Home price indexes and consumer confidence come Tuesday, metro-area employment Wednesday, and the employment cost index Friday. The Atlanta Fed’s nowcast updates today off this morning’s durable goods, having sat at 1.7% since July 17.
Microsoft and Meta report Wednesday after the close and Apple and Amazon follow Thursday, which will tell us whether Alphabet’s capital budget was an outlier or a template. The geopolitical calendar is heavier than the economic one. Prime Minister Netanyahu is at the White House Wednesday, the United States and United Kingdom are convening an international conference this week on protecting the strait and clearing mines, and OPEC+ meets Sunday, August 2, with roughly 188,000 barrels a day of additional September supply expected and very little behind it.
Two things outside the calendar will matter more. We will be watching the transit count through Hormuz, which has not moved off two or three ships a day despite the pause, and whether the Saudi-Houthi exchange finds a floor after the weekend strikes on Jizan and Yanbu. Neither will appear on an economic calendar, and both will do more to set the third quarter than anything that does. The pause is the market’s story this morning. The strait is still the economy’s.
U.S. Economic & Financial Outlook
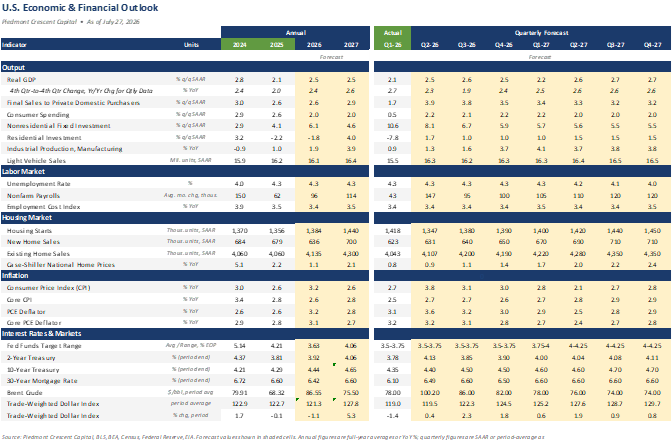
Source: Piedmont Crescent Capital, BLS, BEA, Census, Federal Reserve, EIA. Forecast values shown in shaded cells. Annual figures are full-year averages or year-over-year percent changes; quarterly figures are seasonally adjusted annual rates or period averages as noted in Units.
Forecast disclaimer: The projections above reflect Piedmont Crescent Capital’s views as of the date shown and are subject to change without notice. They are provided for informational purposes only, are not a guarantee of future results, and do not constitute investment advice or a recommendation to buy or sell any security. Actual outcomes may differ materially.
Mark P. Vitner – President & Chief Economist, Piedmont Crescent Capital
mark.vitner@piedmontcrescentcapital.com · (704) 458-4000
About Piedmont Crescent Capital. Piedmont Crescent Capital provides economic research and advisory services covering U.S. and regional economic conditions, financial markets, housing and commercial real estate. A View from the Piedmont is published weekly. Sources: U.S. Bureau of Labor Statistics; U.S. Census Bureau; U.S. Department of Labor; U.S. Energy Information Administration; International Energy Agency; Federal Reserve Board; Federal Reserve Bank of Atlanta; S&P Global; FactSet; AAA; UKMTO/Joint Maritime Information Center; PJM Interconnection; Bank for International Settlements; European Central Bank; Federal Reserve Banks of Richmond and Atlanta; Georgia and North Carolina utility regulators; Cushman & Wakefield; company reports. Market levels are Friday, July 24, 2026 closes unless noted; Monday figures are as of 10:30 a.m. ET, July 27, 2026. Chart sources appear beneath each exhibit. This commentary is for informational purposes only and does not constitute investment advice. © 2026 Piedmont Crescent Capital, LLC. All rights reserved.