
July Employment Report: Out of Season
A weak July headline rests on two seasonally distorted categories. Manufacturing is hiring again, and the slide in labor force participation is mostly a retirement story.
Early Signal
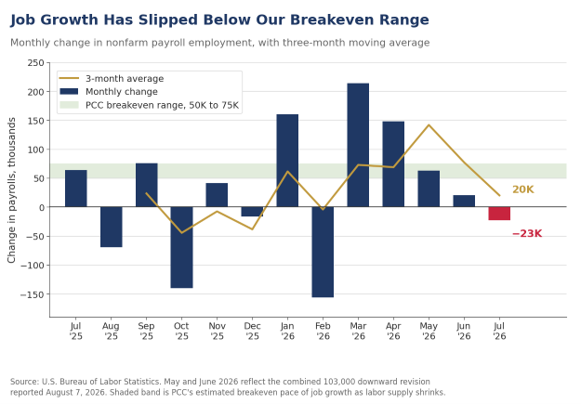
- Nonfarm payrolls fell 23,000 in July, the first outright decline since February, against a consensus call of 83,000. May was revised down 66,000 to 63,000 and June down 37,000 to 20,000, leaving job growth at an average of 20,000 a month over the past three months and 34,000 over the prior twelve.
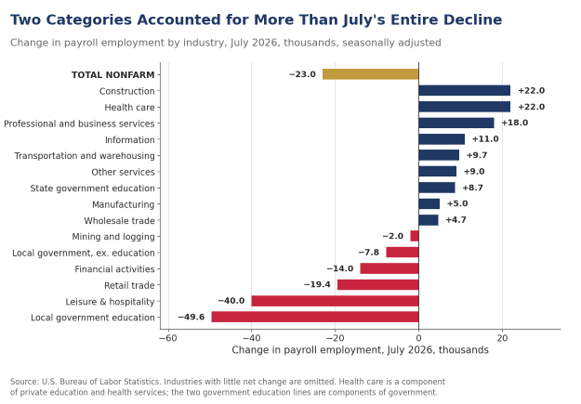
- Local government education and leisure & hospitality subtracted a combined 89,600 jobs, more than the entire decline in overall payrolls. The school calendar and the World Cup appear to explain both. Setting the two aside, payrolls rose roughly 67,000.
- Leisure & hospitality has now fallen in back-to-back months, by 43,000 in June and 40,000 in July. Before seasonal adjustment, however, the industry still added 9,000 jobs in July, against gains of 59,000 last July and 60,000 the year before.
- The entire midsummer shortfall sits in arts, entertainment & recreation, where unadjusted payrolls added 4,900 jobs against 56,200 last July, while accommodation and food services staffed a normal summer. The World Cup ran from June 11 through July 19, and much of the staffing around it appears to have been hired ahead of the tournament.
- Local government education fell 49,600, its largest seasonally adjusted July decline in at least a decade. Unadjusted, school districts shed 1,037,700 workers as the school year ended, the largest July exit since 2019 and more than the 969,000 average of the past five years. Measured against the same month last year, unadjusted school employment was down just 28,500.
- Manufacturing payrolls rose 5,000 and are up 31,000 since December, after falling 56,000 over the second half of last year. Durable goods added 18,000 jobs, led by transportation equipment (+11,900), reflecting motor vehicles and parts (+7,900) with the balance in aerospace and other transportation equipment, and construction added 22,000, nearly all of it nonresidential.
- The unemployment rate fell to 4.1%, its lowest reading since June of last year, but the labor force shrank another 264,000 and the participation rate slipped to 61.4%, the lowest since February 2021. The labor force is 1.3 million smaller than a year ago even though the adult population is 1.5 million larger.
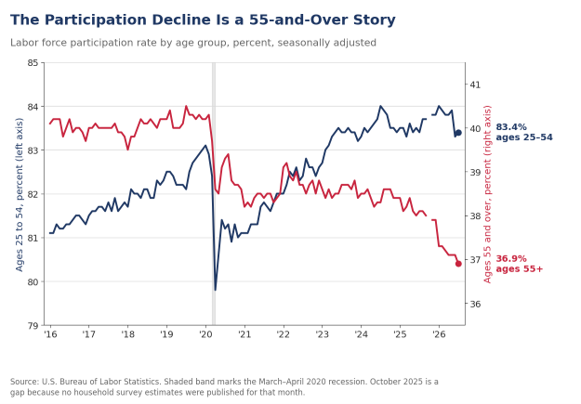
- The labor force participation decline is concentrated among older workers. The 55-and-over rate fell to 36.9%, the lowest since March 2005, while prime-age participation rose to 83.4%, matching its year-ago reading. Average hourly earnings rose 2 cents and are up 3.2% over the past year, down from 3.5% in June.
A Headline Made in Two Categories
July’s employment report was the weakest of the year, but its composition is far less troubling than the headline. Nonfarm payrolls fell 23,000, the first decline since February and well short of the 83,000 gain the consensus expected. Private payrolls rose 30,000 while government fell 53,000. The revisions did more damage to the trend than the July figure itself, with May marked down 66,000 to 63,000 and June marked down 37,000 to 20,000. Job growth has now averaged 20,000 a month over the three months ending in July and 34,000 a month over the prior twelve, against a three-month pace of 111,000 as the data stood a month ago. Revisions have run in one direction for most of the past year, and we expect that pattern to matter more than any single month’s print. We will get a preview of the annual revisions later this month, when first quarter QCEW data are released on August 28.
Two categories account for more than the entire decline. Local government education fell 49,600 and leisure & hospitality fell 40,000, a combined 89,600 against an overall drop of 23,000. Retail trade lost 19,400 jobs, with warehouse clubs, supercenters and other general merchandise retailers down 20,600 and gasoline stations down 4,600, partly offset by a 9,500 gain at sporting goods, hobby, book and miscellaneous retailers. Financial activities fell 14,000 and is now down 121,000 from its May 2025 peak. On the other side of the ledger, construction added 22,000 jobs, health care 22,000, professional and business services 18,000, information 11,000 and transportation and warehousing 9,700.
Hiring breadth held up better than the headline suggests. The one-month diffusion index for private industries slipped to 51.8 from 53.2 in June, but the three-month measure rose to 55.0 from 51.6, and both stand well above the 45.8 reading of a year ago. More industries are adding workers than cutting them, and more of them are doing so consistently. The factory diffusion index slipped to 50.0 from 56.9, which we read as noise around a turn, since the three-month factory measure held at 50.7.
Health care’s contribution keeps shrinking, and that matters more for the trend than either seasonal quirk. The industry added 22,000 jobs in July against an average of 36,000 a month over the prior twelve, with ambulatory care services accounting for 18,100 of the gain and hospitals essentially flat. Health care has added 391,900 jobs over the twelve months through July, more than the 316,000 the economy added in total over the same span, which means every other industry in aggregate has shed workers over the year. A slower pace in health care pulls down the economy’s whole run rate even when the cyclical industries are improving.
The Cup Empties Out, and So Do the Schools
Leisure & hospitality has declined in back-to-back months, by 43,000 in June and 40,000 in July, and the two-month drop matches the industry’s entire gain over the past twelve months. Leisure & hospitality employs roughly one worker in ten, and a decline of that size would ordinarily be a warning. Before seasonal adjustment, the industry added 9,000 jobs in July, against gains of 59,000 last July, 60,000 in July 2024 and 92,000 in July 2023. Payrolls kept climbing, well short of the pace the seasonal factors expect in the middle of the summer, and the factors turned a shortfall of roughly 50,000 hires into a 40,000-job decline.
The entire shortfall sits in arts, entertainment & recreation. That group added 4,900 jobs on an unadjusted basis in July against 56,200 last July and 59,400 the year before. Within it, amusement, gambling and recreation added 23,400 against a four-year average of 57,800, and performing arts and spectator sports lost 21,500 against a four-year average decline of 2,800. Accommodation added 39,100 unadjusted jobs, almost exactly its 40,100 gain a year ago, and food services and drinking places shed 34,900, in line with declines of 37,100 and 36,900 in the prior two Julys. Hotels and restaurants staffed a normal summer. Stadiums, arenas and the venues around them did not.
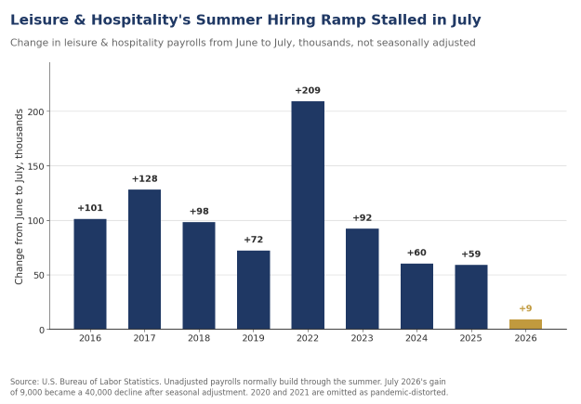
The World Cup appears to be the largest single cause, though it is likely not the only one. The tournament ran from June 11 through the final at MetLife Stadium on July 19, and the establishment survey counts the pay period including the twelfth of the month. Venues, concessionaires, security firms and the hospitality businesses around the eleven American host cities staffed up before the opening match, which put those hires into the May and June counts, and there was little left to add by July even with the tournament still underway. What reads as a July decline is more likely the unwinding of hiring that came early. The calendar is working the same way at the other end of the summer, with Labor Day falling on September 7, the latest date it can fall, which will keep summer staff on payrolls into the September survey week. The seasonal factors were also re-estimated with this release, and the revised factors raised the bar in June as well, when leisure & hospitality added 388,000 unadjusted jobs, more than the 378,000 it added a year earlier, and still printed a seasonally adjusted decline of the same size.
Local government education produced the report’s largest single decline, and it is the same kind of artifact. Public school payrolls fell 49,600 on a seasonally adjusted basis, the largest July decline in the series in at least a decade and a sharp break from gains of 4,600 last July and 34,200 in July 2024. Unadjusted, districts shed 1,037,700 workers between June and July as the school year ended, the largest July exit since 2019 and more than the 969,000 average of the past five years, and June’s unadjusted decline of 379,000 was the largest since at least 2018. The seasonal factors are estimated off the recent norm, so a summer exit that ran larger than that norm in both months came out the other side as a seasonally adjusted decline. It was still well short of the 1.14 million July exit that was routine from 2016 through 2019, which suggests school staffing calendars are drifting back toward their pre-pandemic shape. Measured against the same month a year ago, unadjusted local government education employment was down just 28,500, and we would not read a staffing retrenchment into that.
The Factory Sector Is Hiring
Manufacturing payrolls rose 5,000 in July and have added 31,000 jobs since December, after shedding 56,000 over the second half of last year. The gains are landing where the cycle says they should. Durable goods added 18,000 jobs, led by transportation equipment (+11,900), within which motor vehicles and parts added 7,900, and by computer and electronic products (+2,900), machinery (+2,600) and fabricated metal products (+2,500). Nondurables lost 13,000 jobs, with food processing down 6,200. Factory hiring is running ahead of what a still-soft nondurable side would suggest, and it is the durable, capital-goods end that is doing the work.
The sequence we described in Monday’s ISM report is playing out on schedule. Orders improve, order backlogs lengthen, hours worked increase and hiring follows. New orders turned up in January, backlogs lengthened decisively in July, the production-worker factory workweek stretched from 41.1 hours in December to 41.7 hours in July, and the ISM’s own employment index crossed 50 in July for the first time in 33 months. The all-employee manufacturing workweek held at 40.4 hours and overtime edged down a tenth to 3.1 hours, so July’s gain came through headcount, which is the last step in that sequence.
Construction added 22,000 jobs, nearly all of it in nonresidential work. Nonresidential specialty trade contractors added 15,400 and nonresidential building construction 4,200. Residential building construction slipped 500 and residential specialty trades added 2,600. Data centers, power projects and manufacturing plants are driving construction payrolls while housing treads water, the same split we described in the summer construction forecast. Manufacturing and construction together added 27,000 jobs in July, against a 23,000 decline for the economy as a whole.
A Smaller Labor Force, Mostly by Birthday
The unemployment rate fell a tenth to 4.1%, its lowest reading since June of last year, and once again it fell for unflattering reasons. Household employment declined 87,000 and the labor force contracted 264,000. The number of unemployed fell 178,000 and the number of people not in the labor force rose 381,000. The participation rate slipped to 61.4%, the lowest since February 2021 and, outside the pandemic months, the lowest since early 1976. The labor force is 1.3 million smaller than it was a year ago even though the civilian noninstitutional population is 1.5 million larger. The jobless rate has held between 4.1% and 4.5% for the past year, with hiring and layoffs both running weak.
Initial claims were 199,000 in the week ended August 1 and continuing claims 1.80 million a week earlier, so layoffs remain scarce. The long-term unemployed fell 166,000 to 1.8 million and now account for 25.5% of the jobless, down from 27.3% in June, reversing the deterioration we flagged last month. The number of people on temporary layoff rose 153,000 to 921,000 while permanent job losers were little changed at 1.7 million, a mix that fits a month dominated by seasonal separations. These data support our cyclical acceleration thesis.
Prime-age participation went the other way. Participation among 25-to-54-year-olds rose a tenth to 83.4% in July, matching its year-ago reading and standing about half a point above the 82.9% recorded in February 2020. Prime-age men held at 89.2% and prime-age women rose to 77.8%, within six-tenths of the record 78.4% set in August 2024. The 25-to-34 cohort, whose 1.6 percentage point drop in June we flagged as the number to watch, recovered 0.7 point to 83.1%. That is not a full rebound and leaves the cohort nine-tenths below its May level, but it does argue that June’s move was largely a measurement problem.
The decline is almost entirely a story about workers 55 and over. Their participation rate fell to 36.9% in July from 37.1% in June and 38.1% a year ago, the lowest since March 2005 and 3.3 percentage points below the 40.2% average of 2019. For those 65 and over, participation is 18.5% unadjusted against 19.0% a year ago. This is where Peak 65 appears in the data, though most of the falloff is likely among the first half of the Baby Boomers, now well into their seventies. The retiree tide is still rising. The Alliance for Lifetime Income counts more than 4.1 million Americans reaching 65 each year from 2024 through 2027, over 11,200 a day, exceeding any prior retirement wave. The 55-and-over population has grown by 633,000 in the six months since January alone. A cohort with a participation rate near 37% continues taking a larger share of the adult population from cohorts whose rates exceed 83%, so the aggregate rate falls even if no one changes their mind about working.
Two qualifications. The January 2026 population controls raised the estimated 55-and-over population by 1.25 million and lowered the 25-to-54 population by 1.48 million, largely on revised immigration assumptions, so year-over-year comparisons of labor force levels overstate how many people actually withdrew. The St. Louis Fed attributed 0.35 percentage point of the 0.82 percentage point participation decline between December and June to that revision alone. Aging also does not explain all of the rest. The Atlanta Fed attributes 57% of the 2.9 percentage point decline in older-worker participation since the eve of the pandemic to retirement behavior the pandemic changed and 43% to demographics, with the behavioral share alone worth roughly 1.7 million missing workers.
A shrinking labor force lowers the bar for what counts as adequate job growth. The Federal Reserve Board’s staff put breakeven payroll growth for 2026 at under 10,000 a month, the Dallas Fed puts it near zero and the St. Louis Fed’s range runs from 15,000 to 87,000 depending on the immigration assumption. Our own working range has been 50,000 to 75,000, and we have been skeptical that breakeven has fallen as far as the Fed banks suggest. The past year is harder to square with our range than with theirs, however. Payrolls grew an average of 34,000 a month over the twelve months through June and the unemployment rate still fell two-tenths of a point over the year through July, which is difficult to produce if the economy needs 50,000 a month simply to hold the rate steady. We are inclined to mark our own estimate lower. BLS’s own long-run projections, for their part, have the participation rate falling to 61.1% by 2034 and the 55-and-over rate to 36.9%, and the 55-and-over rate printed 36.9% in July.
Wages, Hours and the Fed
Wage growth cooled more than the payroll figures did. Average hourly earnings rose 2 cents to $37.62, a gain of less than 0.1%, and are up 3.2% over the past year, down from 3.5% in June and below the 3.5% the consensus expected. Earnings for production and nonsupervisory workers rose 4 cents to $32.40. The average workweek held at 34.3 hours for a fourth consecutive month, so aggregate hours were roughly flat. Core PCE inflation ran at 3.3% in June and core CPI at 2.6%, which puts pay slightly behind the broader price measure and slightly ahead of the narrower one, and leaves little argument that the labor market is generating cost pressure.
The report landed in a market that had been debating a rate hike, not a cut. The FOMC voted 9 to 3 last week to leave rates unchanged, with all three dissents favoring a quarter-point increase, and several officials have argued for a move higher as soon as September if inflation does not cool. Futures pricing after the release cut the odds of a September hike to 44%, with October at 58%, while equity futures rallied and Treasury yields fell.
Our Call · Wait for the Benchmark Before Rewriting the Trend
Bond yields fell and equity futures rallied within minutes of the release. We would not extrapolate this. Strip out local government education and leisure & hospitality, both of which were shaped more by the school calendar and the World Cup than by the demand for workers, and payrolls rose roughly 67,000 in July, close to where the underlying trend has run all year. Manufacturing and nonresidential construction are both hiring, and the three-month diffusion index rose to 55.0 from 51.6. Even with the headline this soft, however, the binding constraint on this labor market is on the supply side, where Peak 65 and a sharp slowdown in immigration are both subtracting from labor supply, and monetary policy has little to offer against either. We continue to look for no cut in 2026 and still believe the next move is more likely to be a hike than a cut, arriving in the first half of 2027. The August report, due September 4, will be noisy in the other direction as the late Labor Day holds summer staff on payrolls through the survey week. The date that matters more is August 28, when BLS publishes the preliminary benchmark revision to the past year’s payroll estimates, and we would want to see that revision before changing our forecast for the second half.
Mark P. Vitner – Chief Economist, Piedmont Crescent Capital
mark.vitner@piedmontcrescentcapital.com · (704) 458-4000
Disclaimer: This report is provided for informational purposes only and does not constitute investment, legal, tax, or accounting advice, nor an offer or solicitation to buy or sell any security. Information is drawn from sources believed to be reliable, including the U.S. Bureau of Labor Statistics, the U.S. Department of Labor, the Board of Governors of the Federal Reserve System and the Federal Reserve Banks of Atlanta, Dallas and St. Louis, but its accuracy and completeness are not guaranteed. Views expressed are those of the author as of the date of publication and are subject to change without notice. Past performance is not indicative of future results.