
The Month the Labor Force Left
A View from the Piedmont — Weekly Economic and Financial Commentary
Payrolls turn negative, the rate falls anyway, and the long end declines to care.
Key Points
- Nonfarm payrolls fell 23,000 in July against a median forecast of plus 80,000, landing 41,000 below the bottom of the published range. Nobody had this.
- The revisions were as large as the miss. May was cut 66,000 and June 37,000, a combined 103,000. May has been revised down twice and has surrendered 109,000 jobs since its first print. The trailing twelve-month average is plus 34,000 a month.
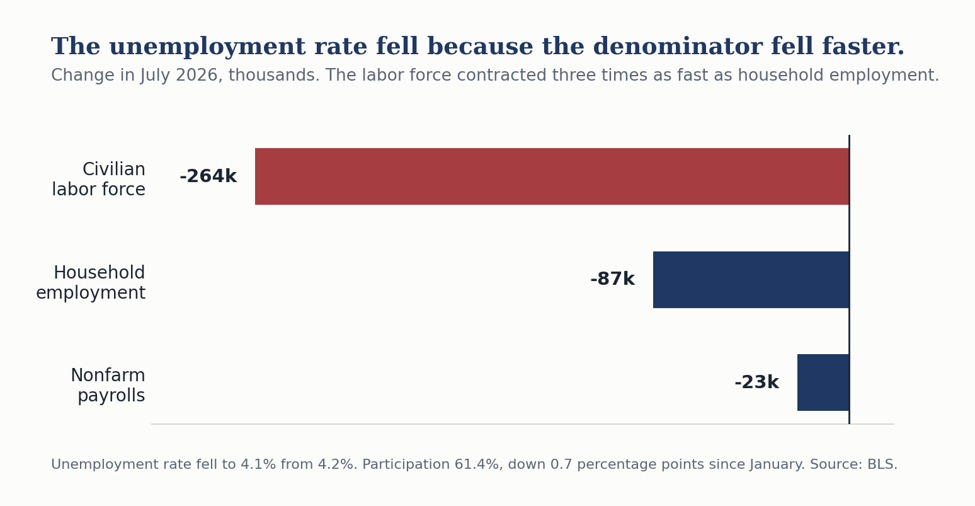
- The unemployment rate fell anyway, to 4.1%, because the civilian labor force contracted 264,000 while household employment fell only 87,000. The count of unemployed fell 177,000 and none of it came from hiring.
- We read July as a calendar artifact rather than a cycle turn. Memorial Day fell May 25, the earliest the calendar allows, and the World Cup pulled restaurant and bar hiring forward. Leisure and hospitality fell 43,000 in June and another 40,000 in July. A sector that never staffed to its seasonal peak has fewer people to shed in August and September, and Labor Day falls September 7, the latest possible, which keeps the summer workforce on payrolls through the September survey week. We expect a surprisingly strong print in September.
- Beneath the surface the most cyclical part of the economy is turning up. The ISM manufacturing employment index reached 52.8 in July, the first expansion in 33 months and the highest since August 2022, in the same month national payrolls went negative.
- The market moved the hike later, not away. September settled at 60% hold against 40% hike, but cumulative hike odds reach 55% by October and 75% by December. No cut is priced at any 2026 meeting. We look for the first hike in January and would not rule out December. We stay cautious on duration.
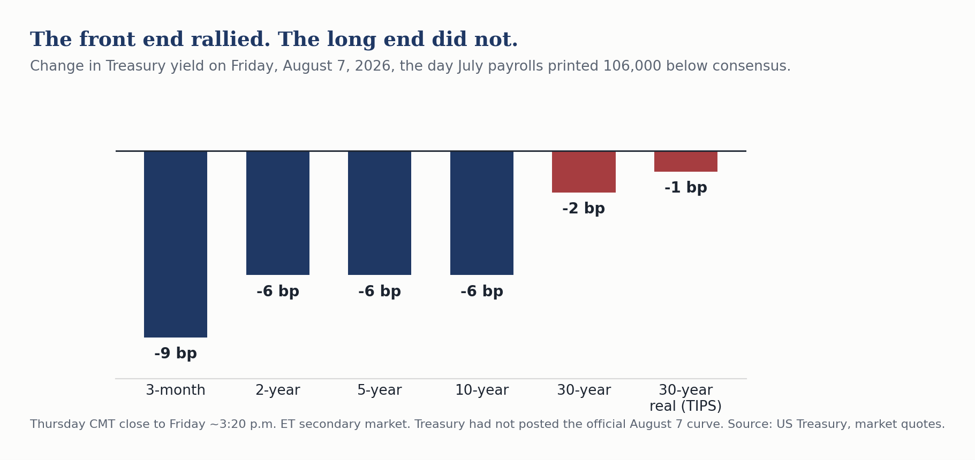
- The long end declined to participate. The thirty-year fell three basis points and the thirty-year real yield two, against six on the two-year, on a print more than 100,000 below consensus.
- The measurement problem is the live risk. Dallas Fed trimmed mean PCE ran 2.2% against core PCE at 3.3%, a 110 basis point gap. Chair Warsh has cited the trimmed mean as an example of the alternative measures the Fed should look into. His perceived affinity for the gauge has added to the market’s unease, particularly after the Dallas Fed noted in April that the measure turns downwardly biased when skewness flips from negative to positive.
Market Dashboard
Levels are official closes for Friday, August 7. Treasury yields are the published constant-maturity series.
| Indicator | Level | This Week |
|---|---|---|
| Fed funds target | 3.50-3.75% | Fifth consecutive hold; three dissents to hike on July 29 |
| September hike odds | 40% | Down from 54% Thursday. Hold at 60% |
| October, December hike odds | 55%, 75% | Cumulative. The market still expects a hike this year |
| 3-month bill | 3.87% | Down 3 bp Friday but up 4 bp on the week |
| 2-year Treasury | 4.19% | Down 6 bp on the day, 9 bp on the week |
| 10-year Treasury | 4.65% | Down 4 bp on the day, 10 bp on the week |
| 30-year Treasury | 5.19% | Down 3 bp Friday. The 20-year closed above it at 5.20% |
| 30-year TIPS real yield | 2.96% | Down 2 bp Friday. The week’s most important number |
| 30-year breakeven | 2.23% | At target. The long end is not an inflation story |
| 2s-30s | 100 bp | Bull steepener. 2s-10s widened to 46 bp |
| S&P 500 | 7,757.64 | A record close, up 3.6% on the week |
| Nasdaq Composite | 26,690.62 | Up 5.2%; duration and rate-sensitives led |
| Russell 2000 | 3,034.49 | Up 1.1% Friday |
| VIX | 14.90 | Closed under 15 |
| WTI crude | $78.18 | NYMEX September 2026, CLU26. Up 1.2% Friday, down 7% on the week |
| Brent crude | $83.55 | ICE Brent, October 2026. Down 7.1% on the week |
| Gold | $4,403.90 | COMEX December 2026, GCZ26. Up 7.2% on the week |
| US dollar (DXY) | 99.60 | Near a two-month low |
| Retail gasoline | $4.079 / gal | EIA survey August 3, down 1.7 cents |
| Retail diesel | $5.348 / gal | Up 3.5 cents even as crude fell 7% on the week |
| 30-year fixed mortgage | 6.69% | Freddie Mac, week ended August 6, before the rally |
This Past Week’s Central Thesis
Two things happened Friday that are usually mutually exclusive, and the market spent the day trading one of them.
The first is that the labor market printed its weakest month of this expansion, with the two prior months revised down by as much as the miss itself. The second is that the unemployment rate improved. Those are not in tension once you accept that the labor force is now the more volatile term in the ratio, which is the argument we lay out in this week’s Piedmont Perspective.
The market largely traded the weaker employment figures. The two-year fell six basis points, September hike odds fell by roughly a quarter, equities had their best week since April and gold rose 7.2%. What the market did not trade was the second fact, and the clearest evidence sits at the long end, where the thirty-year moved three basis points and the thirty-year real yield two. If the long end were pricing growth, it would have rallied. If it were pricing inflation, it would have rallied. It did neither. What anchors the long real yield near 3% is not the business cycle. It is term premium and Treasury supply. Uncertainty about the Fed’s intentions is adding a few basis points on top of all this.
That is why our positioning is unchanged. We continue to think the next move is a hike rather than a cut. We look for it in January, and December is certainly possible. We stay cautious on duration. A weak labor market has not lowered the cost of long money, and this week is the cleanest demonstration we have had. As for Warsh, our read is that he wants Fed policy back to a normal tempo after fifteen years of crisis posture.
This Week in Three Observations
1. The July print is a calendar story, and the calendar is unusually loud this year.
The summer almost always produces one surprising employment report. The end of the school year and the seasonal hiring around it generate the largest swings on the calendar, and the factors that adjust for them assume a normal year. This year was not normal at either end. Memorial Day fell on May 25, the earliest date the calendar permits, which started the season a week early and pulled seasonal hiring forward into the May survey week. The World Cup added a second pull, lifting hiring in the eleven host markets and in bars and restaurants well beyond them, earlier in the summer than that hiring normally arrives. That is why May’s original plus 172,000 print looked strong and June and July did not. Leisure and hospitality fell 43,000 in June and another 40,000 in July.
The arithmetic runs the other way from here. Restaurants and bars did not hire as many people as they usually do, so they have fewer to let go as the season winds down. The seasonal factors expect a wave of end-of-summer layoffs that restaurants will not need to make. Labor Day compounds it. September 7 is the latest date the calendar permits, which leaves the summer workforce on payrolls through the September survey week rather than off it. Taken together, 2026 runs 105 days from Memorial Day to Labor Day against 98 in each of the prior two years, the longest span the calendar allows. The add-back is far larger in September than in August, so that is where we would look for it. We expect a surprisingly strong employment report in September, possibly in August as well. Our forecast carries an underlying run rate near 65,000 a month, well above the plus 34,000 trailing average, and adds roughly 40,000 in each of August and September as leisure and hospitality sorts itself out and state and local government hiring normalizes. That is the size of the surprise we are looking for, and we would position for it rather than extrapolate July.
The outsized role seasonal adjustment played in the July data was a theme in most of the commentary. Goldman, Oxford Economics, First Trust and Fifth Third all located the distortion in school-calendar government education, which is real, rather than in restaurants and bars, where most summer jobs are created. Sonu Varghese at Carson Group is the only analyst we found who named leisure and hospitality and the World Cup together, and he has the World Cup boost rolling off in July where we have it pulling hiring forward into May.
2. The unemployment rate has stopped being a summary statistic.
The civilian labor force contracted 264,000 in July. Household employment fell 87,000. Participation slipped to 61.4% and is down seven tenths of a point since January. The employment-population ratio is 58.9%. Payrolls went negative and the rate still fell, because the labor force shrank three times as fast as the pool holding jobs.
We have argued for a year that the breakeven payroll pace fell toward zero as immigration collapsed. The Reserve Banks bracket a wide range. Dallas puts breakeven near negative 3,000 a month for August through December of last year, St. Louis at 15,000 to 87,000 for 2026, Kansas City at 29,000, and Oxford Economics now at roughly 50,000 for the year and 34,000 in the second half. When the System cannot agree within an order of magnitude, nobody knows precisely, us included. July is that argument demonstrated inside a single month.
There is a genuine fight underneath this that no one is covering. We and Fifth Third read a shrinking labor force as evidence the market is still tightening. Goldman reads the identical participation series as evidence of more slack than the unemployment rate alone suggests. Same data, opposite conclusion, and nobody has adjudicated it. We think the employment-population ratio settles it over the next two quarters, and we intend to lead with that measure rather than the rate.
3. The long end declined to participate.
Decomposing Friday the way we always do, the thirty-year TIPS real yield went from 2.98% to 2.96%, putting the implied thirty-year breakeven at 2.23%, which is at target. The real yield moved two basis points. The breakeven moved one. 2s-30s sits at 100 basis points and 2s-10s widened to 46 basis points. The twenty-year closed at 5.20%, above the thirty-year at 5.19%, after both sat at 5.22% Thursday. A small inversion reopened at the very long end on a day the rest of the curve rallied.
So the long bond is neither a growth instrument nor an inflation-expectations instrument. On Friday’s evidence it is barely a macro instrument at all. What anchors the long real yield near 3% is term premium, Treasury supply and the cost of capital for the AI and electrification buildout, and a payroll report touches none of the three. Investors positioning the long end off employment data are trading the wrong variable, and the Fed has less leverage over the thirty-year than the commentary assumes.
Note what the bill actually did. It fell three basis points Friday but finished the week four basis points higher, while every coupon maturity fell eight to ten. The front end is pricing a Fed that has not finished, whatever Friday’s headline said. Policy lives at the front end now. No house in the research we read this weekend cited the thirty-year real yield, and Friday’s divergence between the long end and the two-year passed without a single published comment.
Behind the Numbers
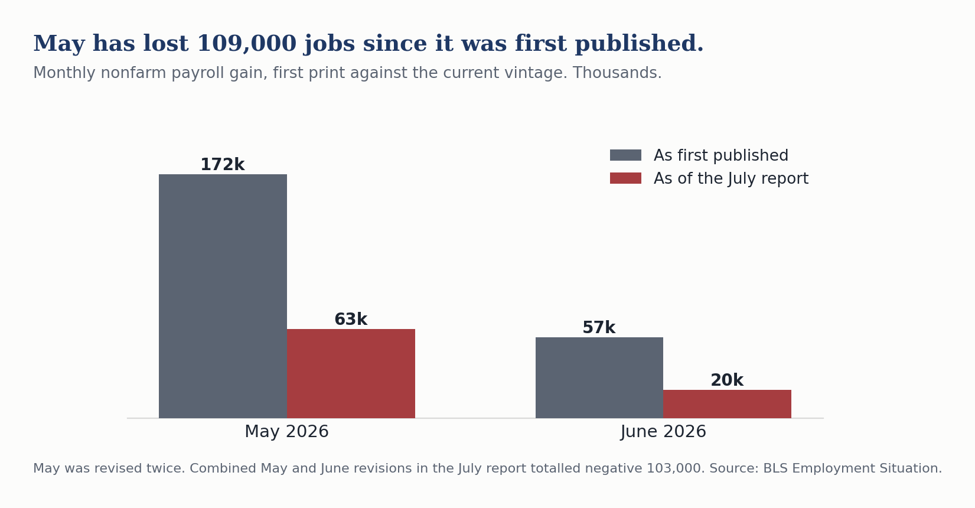
The revisions matter more than the print. May was cut from plus 129,000 to plus 63,000 and June from plus 57,000 to plus 20,000, a net 103,000. May has now been revised down twice and has surrendered 109,000 jobs since its first print of plus 172,000. Add the revisions to the miss and the market received roughly 206,000 fewer jobs Friday morning than it expected. The BLS puts the trailing twelve-month average at plus 34,000 a month. That is the number to carry, not the July print, which will itself be revised.
The industry detail is coherent rather than random. Local government education fell 50,000, which is largely a seasonal adjustment artifact. Retail trade fell 19,000 and financial activities 14,000. Health care added 22,000, below its own prior twelve-month average of plus 36,000. When the sector carrying this expansion prints under trend, the headline disappoints regardless of seasonal distortions. Challenger counted 33,429 announced job cuts in July, the lowest in two years, and initial claims were 199,000. This is not a firing cycle. It is hiring hesitancy.
The most cyclical part of the economy is turning up. The ISM manufacturing employment index reached 52.8 in July, up 3.1 points, the highest since August 2022 and the first month in expansion in 33 months. The headline index rose to 55.6 from 53.3, its highest in more than four years and above a 54.0 consensus, with production up 6.3 points to 58.5 and backlogs up 4.5 points to 55.0. ISM reads July as consistent with 2.8% annualized real GDP growth. Factories shed workers for the better part of three years and began adding them in the same month national payrolls fell 23,000.
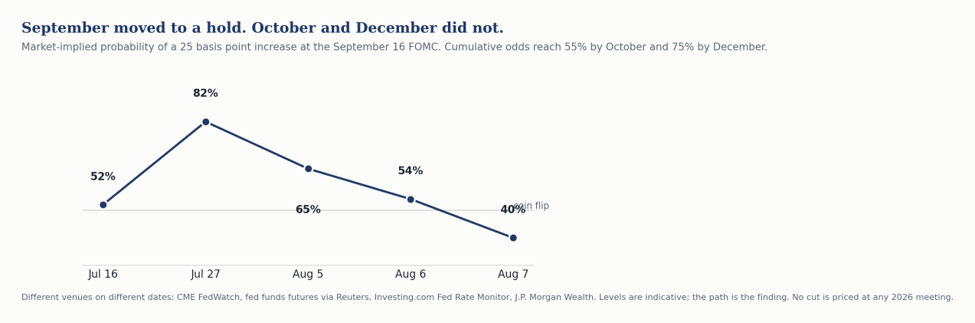
The Fed moved the hike to October and December. September hike odds ran about 52% on July 16, 82% on July 27, roughly 65% on August 5 and 54% Thursday evening. After Friday, CME FedWatch settled at 60% hold against 40% hike. But cumulative hike odds reach 55% by October and 75% by December, and there is still no cut priced at any 2026 meeting. Bank of America called the report “dovish on net” and did not move at all, keeping a call for 75 basis points of hikes this year starting in September.
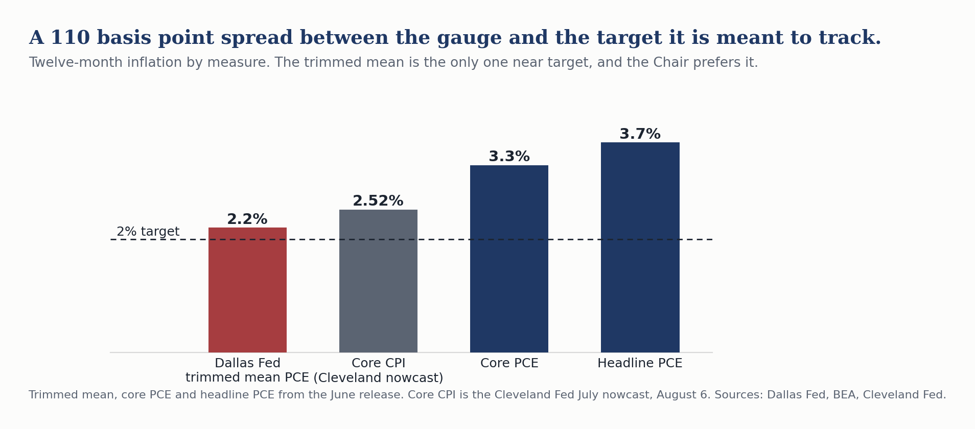
The measurement problem is now the live risk. Chair Warsh has scrapped forward guidance, calls conventional inflation measures “quite imperfect”, prefers alternative measures including trimmed averages, and has stood up five task forces, one on inflation frameworks reporting early in 2027. In the June release, Dallas Fed trimmed mean PCE ran 2.2% on the twelve-month against core PCE at 3.3% and headline at 3.7%. Read from the trimmed mean, inflation is nearly at target. Read from core, it is more than a point above. That 110 basis point gap is doing enormous work in the current debate. The Dallas Fed flagged the vulnerability itself on April 16, conceding that the twelve-month average of monthly skewness readings was roughly zero through February 2026, and that when skewness turns from negative to positive the trimmed mean can be misleading and downwardly biased. A trim discards the largest price increases in the distribution by construction. If the next inflation impulse arrives as a few very large increases in a narrow set of components, which is exactly the shape an electricity and data center capacity shock takes, the trimmed mean is structurally blind to it. Not lagging. Blind.
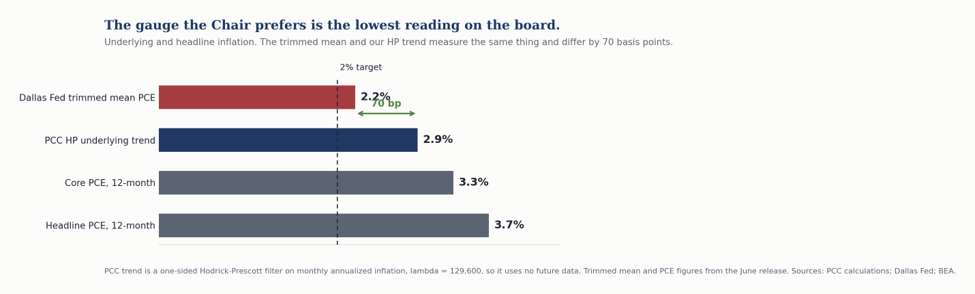
That is the case for the gauge we have run all year. Our HP filter works on the aggregate across time rather than on the cross-section within a month, so a price impulse concentrated in a handful of components moves it. Where a trim discards the right tail by construction, the filter cannot, because it never sorts components at all. The two are answering the same question with opposite machinery, and they no longer agree. The Dallas trimmed mean puts underlying inflation at 2.2%. Our latest one-sided HP run puts it at 2.9%. That is 70 basis points on the gauge the Chair has cited as a possible alternative inflation measure, and the trim is the mechanism producing the difference.
We would not oversell the instrument. The two measures are not rivals so much as tools for different problems. A trim is the better tool when the noise is idiosyncratic and passes, which is what it was built for and what it does well; a used-car spike or an airfare jump is exactly what you want discarded. A filter is the better tool when the signal is concentrated and persists. The risk in front of us is the second kind. Our filter has its own weakness at the end of the sample, where the trend estimate is least stable. We run it one-sided with the standard monthly smoothing parameter, so it uses no future data and reflects what was knowable in real time. We publish it alongside the Cleveland median and the Dallas trimmed mean rather than in place of them.
Bottom Line
The labor market is slowing but it is not breaking. July was distorted at both ends of the calendar and will look different in revision, as May and June already do. Manufacturing, the part of the economy that announces a genuine downturn first, turned up in the same month. The unemployment rate fell for a reason that has nothing to do with labor demand, and it will keep misleading anyone who reads it as a summary statistic.
For the Fed, Wednesday matters more than Friday did. Two inflation reports stand between here and September and the labor data have already had their say. We look for no cut in 2026 and we look for the first hike in January, with December certainly possible. For portfolios, the week changed nothing at the long end and should not change positioning there: a payroll report 103,000 below consensus moved the thirty-year real yield two basis points, and the case for waiting on long-dated funding is weaker today than it was Thursday.
CFO & Corporate Treasurers Corner
Six things that changed this week for anyone who funds a balance sheet or manages cash.
The wait to term out has not paid. The two-year fell six basis points Friday and the thirty-year three, leaving 2s-30s at 100 basis points. The three-month bill finished the week four basis points higher while every coupon maturity fell eight to ten. The front end responded to a labor market printing negative payrolls and the long end did not. Anyone who has been holding short-dated paper waiting for a better entry on ten- or thirty-year money has now watched the long end sit out a bond-bullish surprise. The curve is telling you that cheap long money is not coming from a soft labor market. If your capital plan needs thirty-year funding, the case for waiting is weaker today than it was Thursday.
Do not build a 2027 plan on a lower cost of funds. There is no cut priced at any 2026 meeting. Not one. Three weeks ago the live question was whether the Fed would hike in September, and even after Friday that probability sits near 40%. PGIM and Bank of America still carry three hikes this year, which seems extreme to us. If your 2027 budget assumes refinancing into a friendlier rate, it needs a second scenario, and the second scenario should be flat to higher rather than modestly lower.
The issuance window is open now and it narrows Wednesday. Equities had their best week since April, the VIX closed under 15, and the dollar softened. July CPI lands Wednesday, August 12. The Cleveland Fed nowcast has core CPI at 2.52% on the twelve month against core PCE of 3.3% in the June release, and a hot print reopens the September hike question that Friday’s payroll report had just closed. If you have paper to bring, Monday and Tuesday are a friendlier calendar than Thursday and Friday.
Your reinvestment assumption on cash is stale. The three-month bill is at 3.87%. Money fund yields follow the bill with a lag of weeks, not days, so the yield on your ladder today is not the yield on your next roll. If you are running a treasury forecast off current money fund yields, mark it down.
Labor cost budgeting got marginally easier. Average hourly earnings slowed to 3.2% over the year from 3.5%. Second quarter unit labor costs rose 1.3% against productivity of 1.4%. For the first time in several quarters, productivity is carrying compensation rather than the other way around. That is margin relief.
Power deserves a forecast now, not an assumption. This is the item most 2027 budgets get wrong. Ask your team what delivered electricity costs look like in 2027 and 2028 under the tariff structures being written this month. Virginia’s commission ordered a large-load transmission tariff on August 5. Texas paused data center interconnections on August 3. Georgia is reallocating fuel costs between industrial and residential classes with a decision due by year end. Florida legislated full cost of service on July 1. That is four different regulatory answers to the same question inside one regional footprint, and most budgets we see assume a single national trajectory. If power is a material input for you, that assumption is now a forecast error waiting to happen.
On the currency side, the dollar index closed near 99.60 at a roughly two-month low, EURUSD at 1.1567 and USDJPY at 157.57.
Piedmont Perspective
The Labor Force Is Shrinking from Both Ends
The July employment report did something that should not happen. Payrolls fell 23,000 and the unemployment rate fell too, to 4.1%. Most people read that as a statistical quirk. We think it is the first clean look at a structural change that will govern how we read labor data for the rest of the decade.
The mechanics are simple. The civilian labor force contracted 264,000 in July. Household employment fell 87,000. When the labor force shrinks three times as fast as the pool holding jobs, the ratio between them improves even as the economy sheds positions. The unemployment rate did not fall because the labor market strengthened. It fell because the denominator left.
What makes this structural rather than a one-month artifact is that two independent forces are pulling in the same direction, and neither is cyclical.
The first is immigration, and it is now well documented. The Dallas Fed puts net unauthorized immigration at negative 55,000 a month through the second half of 2025 and the breakeven payroll pace at roughly negative 3,000 a month for August through December. The St. Louis Fed brackets 2026 breakeven at 15,000 to 87,000. Kansas City has 29,000. The System cannot agree within an order of magnitude, which tells you how much uncertainty sits underneath every payroll forecast published today, ours included.
The second force gets almost no attention in this context, and it should. Peak 65 is the largest cohort of Americans ever to turn 65 in a single stretch, roughly 4.1 million a year and more than 11,000 a day, running through 2027. It is discussed endlessly as a retirement savings problem and almost never as a labor supply problem, which is what it is. Every month it removes people from the labor force who are not coming back, on a schedule that is known years in advance and is completely indifferent to the level of interest rates.
Put the two together and the labor force is being drained from both ends at once. Young workers are not arriving because the border closed. Older workers are leaving because they have reached an age and a wealth threshold where they can choose not to work. Participation is 61.4%, down seven tenths of a point since January. The employment-population ratio is 58.9%.
Here is the consequence that matters for anyone making a forecast or a hiring plan. The unemployment rate is a ratio, and it has become a ratio whose denominator is now the volatile term. That makes it a poor summary statistic for labor demand. It can fall in a genuinely weakening market, which is what it just did, and it can stay low through a downturn that shows up clearly in payrolls, hours and the employment-population ratio. A recession that leaves the unemployment rate between 4% and 5% is no longer a strange hypothetical. It is the base case for how the next one likely looks.
This has cost us something. We have carried a call for unemployment near 4.5% at year end, and Friday made it harder rather than easier. If the labor force can shed a quarter of a million people in a month, it can absorb negative payroll prints without the rate moving at all. We have marked that call down to 4.1% at year end. We did not cut it further only because we suspect July’s labor force decline was overdone and will partly reverse.
For the business audience there is a harder implication buried in this. If your workforce plan assumes that labor supply loosens when demand cools, that assumption held for forty years and does not hold now. The people leaving the labor force this cycle are leaving for reasons that have nothing to do with the business cycle, and they will not return when you start hiring again. The competition for workers in 2028 is unlikely to be easier than it is today, whatever the unemployment rate happens to print.
The Week Ahead
Monday, Aug. 10. EIA weekly gasoline and diesel survey. No major releases.
Tuesday, Aug. 11. NFIB Small Business Optimism for July.
Wednesday, Aug. 12. July CPI at 8:30 a.m. ET, the release that decides September. We are in line with consensus, looking for a 0.2% rise in the core. A surprise in the CPI report would matter more to expectations for Fed policy than the surprise in the employment report did.
Thursday, Aug. 13. July PPI and weekly jobless claims at 8:30 a.m. ET. Freddie Mac PMMS, the first reading to capture the post-payroll rally in the ten-year.
Friday, Aug. 14. July retail sales at 8:30 a.m. ET. Preliminary University of Michigan sentiment and business inventories at 10:00 a.m. ET. Atlanta Fed GDPNow update; the Q3 nowcast currently reads 5.8%, a figure driven substantially by trade-deficit arithmetic rather than underlying demand.
Thursday, Aug. 20. NAR existing home sales for July.
Friday, Aug. 21. BLS State Employment and Unemployment for July, the first state-level look since the national print turned negative.
Friday, Aug. 28. The preliminary benchmark revision to the establishment survey, three weeks before the FOMC. The last two cycles conditioned everyone to expect a large downward number; the prior preliminary was negative 911,000. The QCEW data for the first nine months of this benchmark period run roughly 200,000 above the payroll survey, which would make this revision slightly positive. That would land as a genuine surprise into a market that has stopped expecting good news from the BLS.
US Economic and Financial Outlook
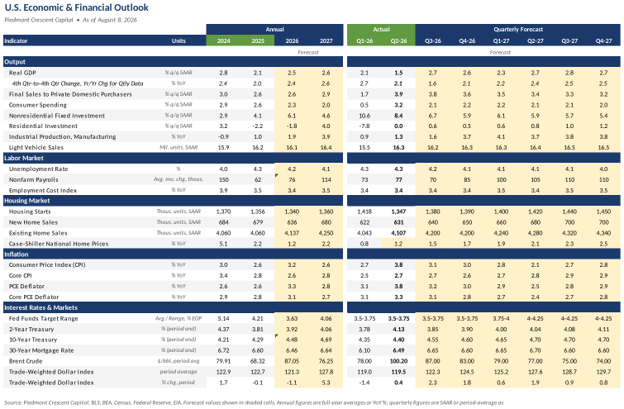
Our full forecast is below. We hold the year-end unemployment rate at 4.1% and look for real GDP growth of 2.5% this year and 2.6% next. The fed funds target stays in its current 3.50 to 3.75% range through 2026, with the first hike in January and December certainly possible.
Sources and Notes
Sources: Bureau of Labor Statistics; Bureau of Economic Analysis; US Treasury; Federal Reserve Board and CME FedWatch; Institute for Supply Management; Challenger, Gray & Christmas; Freddie Mac; NFIB; National Association of Realtors; University of Michigan; Energy Information Administration; the Atlanta, Cleveland, Dallas, Kansas City and St. Louis Federal Reserve Banks; Oxford Economics; Goldman Sachs; Bank of America; PGIM; Carson Group; First Trust; Fifth Third.
Notes: All market levels are official Friday, August 7 closes. Treasury yields are the published constant-maturity series and the thirty-year breakeven is derived from the nominal and real curves. Payroll figures are seasonally adjusted. The Memorial Day and Labor Day span is calculated from the statutory definitions, the last Monday in May and the first Monday in September. Copyright 2026 Piedmont Crescent Capital.
Mark P. Vitner
President & Chief Economist, Piedmont Crescent Capital
mark.vitner@piedmontcrescentcapital.com · 704-458-4000
A View from the Piedmont is published weekly by Piedmont Crescent Capital for informational purposes only and does not constitute investment, legal, or tax advice. Views expressed are those of the author as of the date of publication and are subject to change.