
Main Street Wants to Hire Again
Hiring plans post their best reading since 2022 and selling-price increases finally break. The small-business survey argues that July’s payroll decline measured the calendar, not the demand for workers.
Early Signal
- Optimism rose 2.4 points to 99.8, the highest reading since August 2025 and the first month above the 52-year average of 98.0 since February. Eight of the ten components improved.
- Hiring plans jumped nine points to a net 20%, the highest since October 2022 and nine points above the survey’s long-run average. Two months ago they sat at a net 9%, the lowest since May 2020.
- Job openings owners could not fill rose four points to 36%, the most since June 2025, with skilled-worker openings up four points to 31%. The Employment Index rose 1.9 points to 102.1, its first increase after four consecutive declines.
- The binding labor constraint flipped back to scarcity. Labor quality returned as the single most important problem at 27%, up eight points and 15 points above its 12% historical average. In May, labor cost held that spot at a record 14% while labor quality had fallen to 13%.
- Selling-price increases broke. The net percent of owners raising average selling prices fell seven points to 31% after four consecutive monthly increases, price plans fell four points to a net 28%, and inflation as the top problem fell seven points to 14%, its first decline this year.
- Capital spending plans rose five points to 25%, the highest since December 2024. In May they were 16%, the weakest reading since March 2009.
- The realized side of the business did not move. A net 4% of owners reported lower nominal sales, unchanged from June, a net 16% reported lower earnings, and a net 5% actually reduced employment, the weakest reading of the year. The Uncertainty Index rose two points to 91 against a norm near 68.
The Headline and the Internals Agree for Once
In May we wrote that the Small Business Optimism Index was doing a good job of hiding the action beneath it. July gives the reader no such trouble. The index rose 2.4 points to 99.8, eight of its ten components improved, and hiring plans contributed most to the gain. The two components that fell, real sales expectations and inventory satisfaction, gave up two points each. This is the first reading above the 52-year average of 98.0 since February and the highest since August 2025.
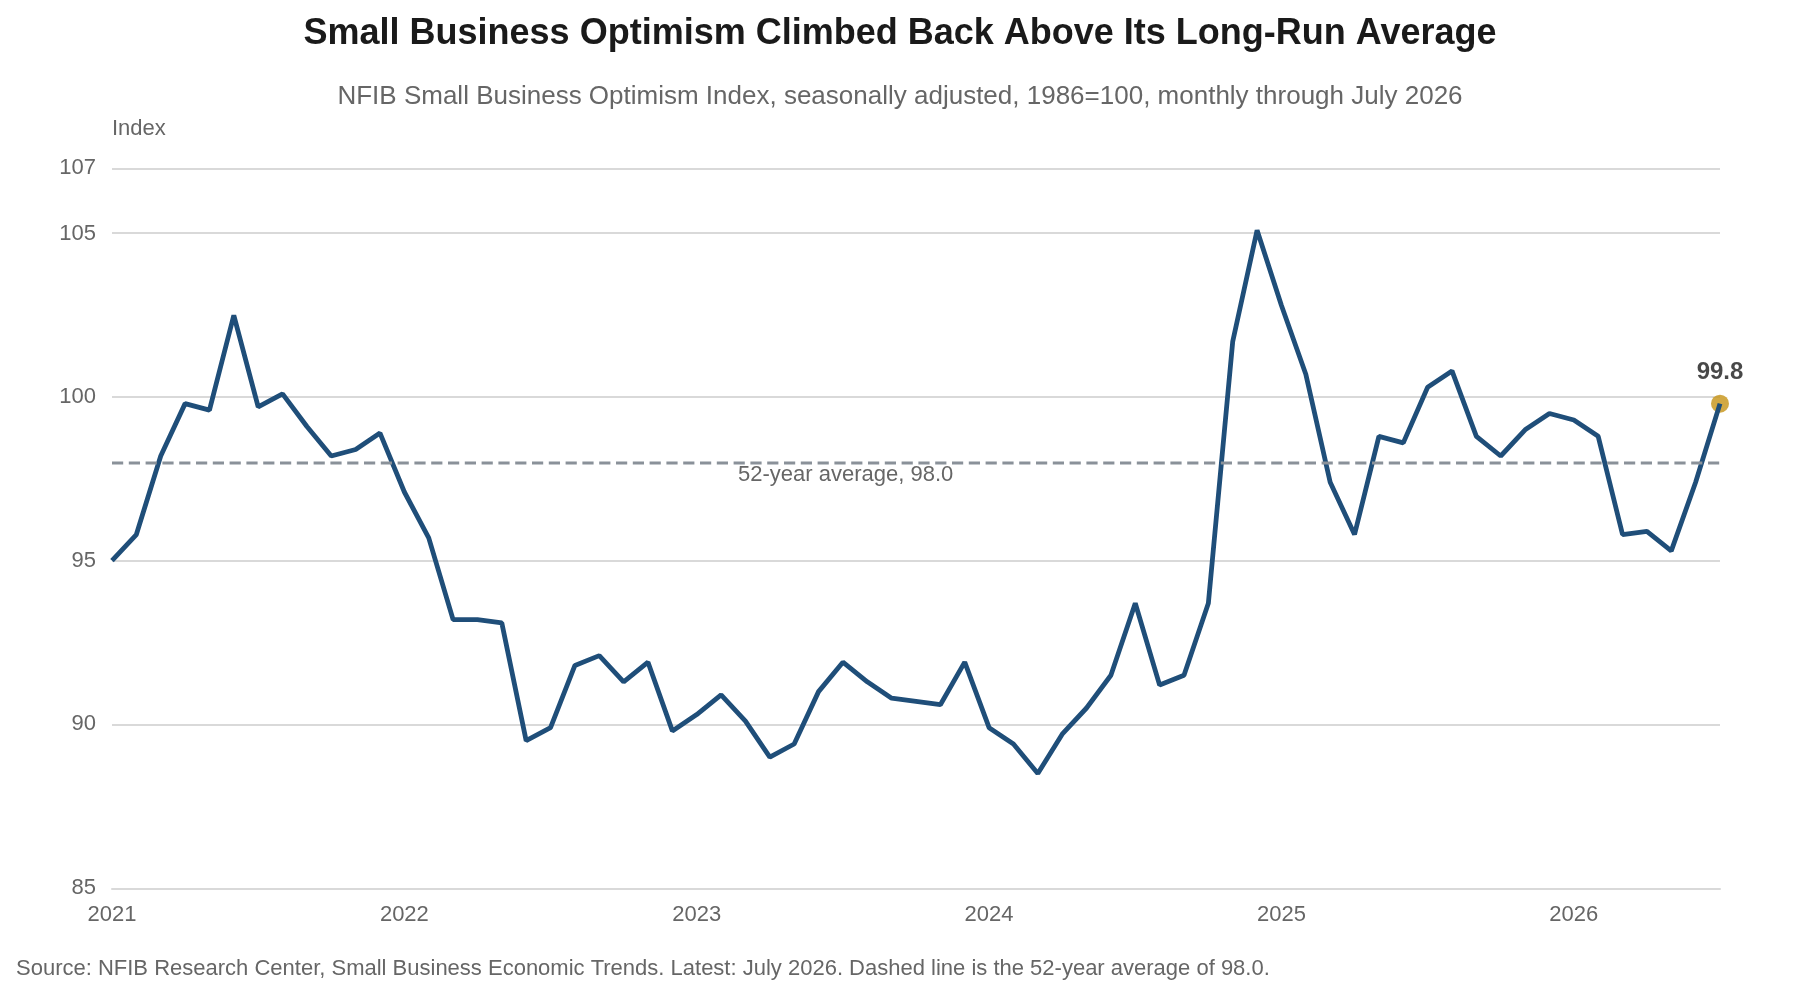
The index had been stuck between 95 and 98 since March, and 99.8 clears the top of that band. Which components moved matters more than the level. NFIB splits the ten into five hard measures, which describe what owners are doing or have committed to do, and five soft measures, which describe how they feel. The five hard components contributed 26 of the 29 points of total component change in July. The five soft components contributed three. Hiring plans, job openings, inventory plans, earnings and capital spending plans all rose. Owners are not simply feeling better about the economy in the abstract.
Hiring Plans Snap Back
A seasonally adjusted net 20% of owners plan to add jobs over the next three months, up nine points from June and the highest reading since October 2022. Hiring plans now sit nine points above their long-run average of a net 11%. Job openings owners could not fill rose four points to 36%, the most since June 2025, with openings for skilled workers up four points to 31% and unskilled openings up two to 14%. The Employment Index rose 1.9 points to 102.1, its first increase after four straight declines, and stands above both the 2025 average of 101.2 and the historical average of 100.0.
In May these same series stood at recession-grade levels, with hiring plans at a net 9% and openings at 29%, both the lowest since May 2020. We argued then that the readings described a labor market that had frozen instead of one that was shrinking, and that a freeze argues for patience. The thaw arrived faster than we expected.
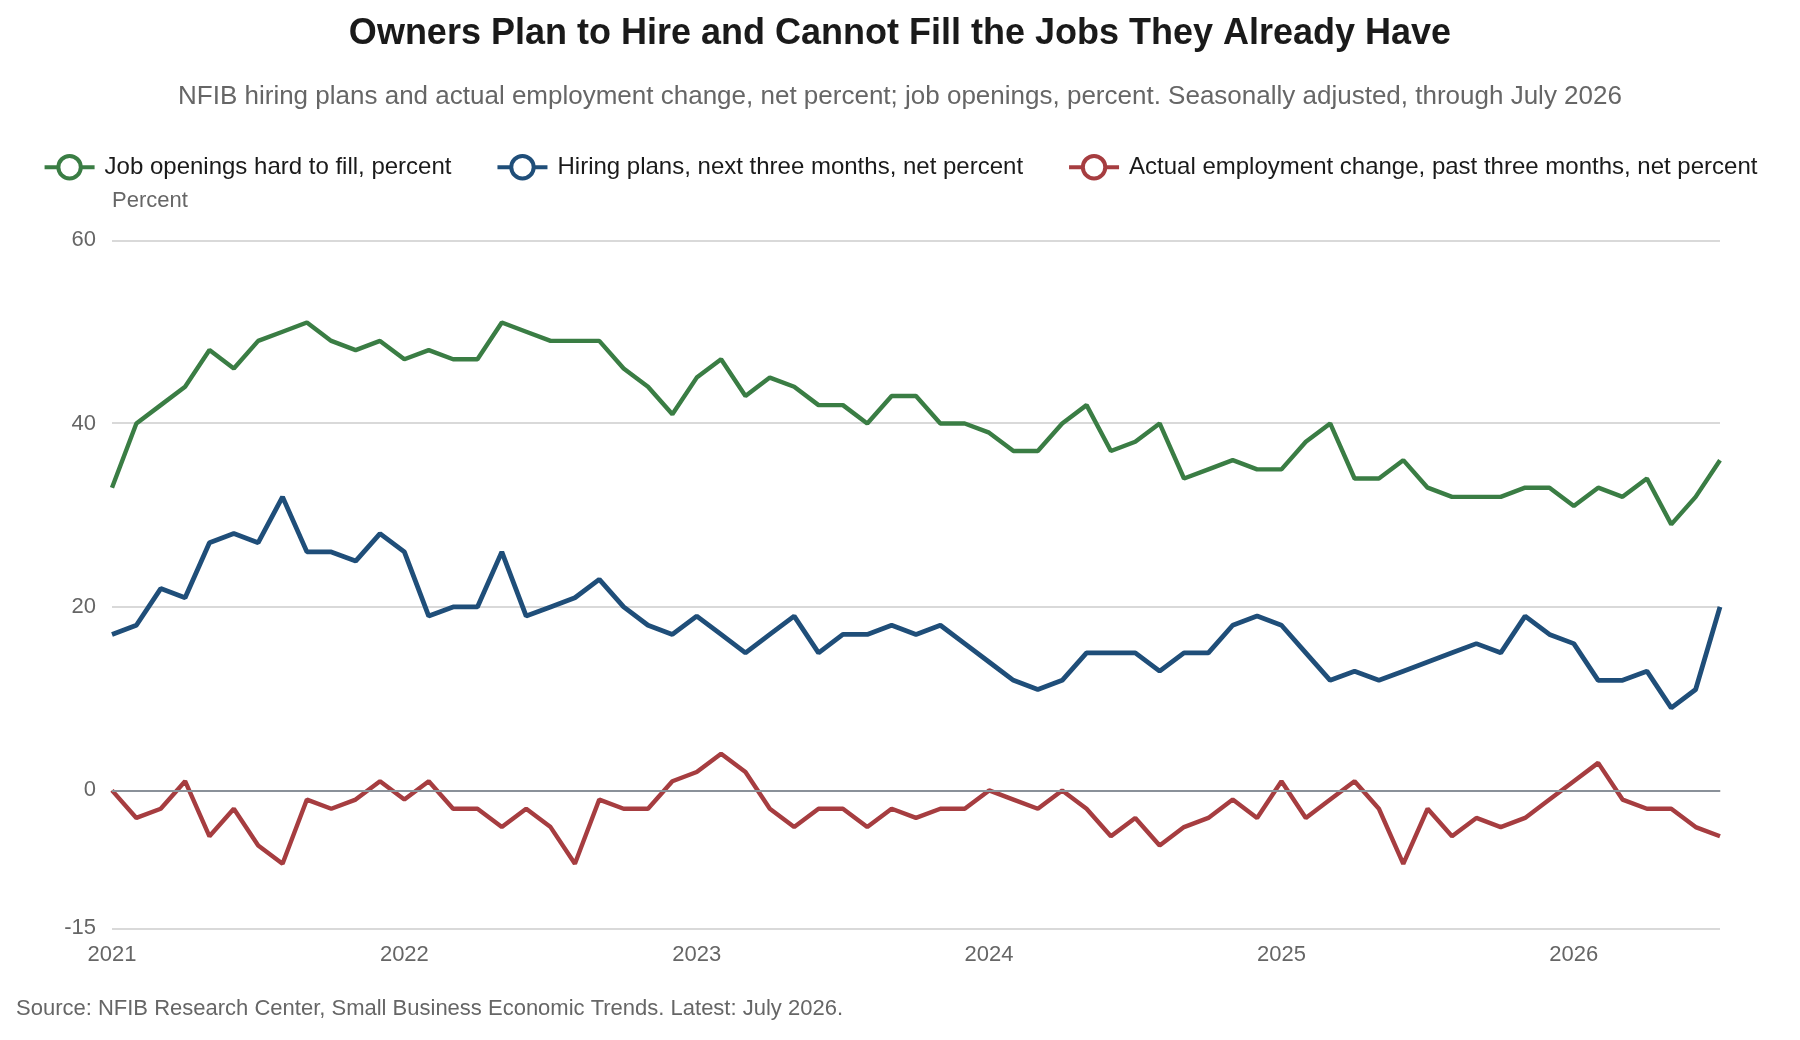
A net 5% of owners reduced employment over the past three months, the weakest realized reading of the year, in the same month a net 20% said they intend to add. Actual hiring activity slipped as well, with 61% of owners hiring or trying to hire, down a point. Intentions have failed to convert in this survey before. July is harder to dismiss, however, because the intention shows up twice, in the jobs owners plan to create and in the 36% of openings they have already posted and cannot fill.
The Constraint Flipped Back to Scarcity
Labor quality returned to the top of the single most important problem list at 27%, up eight points from June and 15 points above its historical average of 12%. Labor cost held at 8%. Taxes fell three points to 16%, the lowest reading since November 2025, and now hold second place on their own after sharing that spot with labor quality in June. In May, labor cost and labor quality had traded places, with cost at a record 14% and quality at 13%. The complaint has swung 14 points back toward scarcity in two months.
The hiring detail carries the same message. Fifty-one percent of all owners, and 85% of those trying to hire, reported few or no qualified applicants for their open positions, unchanged from June. Within that group, the share reporting few qualified applicants rose five points to 32% while the share reporting none fell five points to 19%. Owners are seeing more applicants and not more skills.
This is the small-business version of the supply-side argument we made in Friday’s employment report. The labor force is 1.3 million smaller than a year ago while the adult population is 1.5 million larger, participation among workers 55 and over is at its lowest since March 2005, and immigration has slowed sharply. A firm looking to add a skilled worker meets that shortage whether or not the aggregate payroll figure is rising, and no setting of the funds rate changes the size of the labor force.
A Third Read on July Labor Demand
Three surveys measured labor demand in July and two of them turned up. The ISM Employment Index crossed 50 for the first time in 33 months, reaching 52.8. NFIB hiring plans posted their best reading in nearly four years and job openings their best in more than a year. The establishment survey, taken in the same month, reported payrolls down 23,000.
We wrote on Friday that the payroll decline sat almost entirely in local government education and leisure & hospitality, that the two subtracted a combined 89,600 jobs against an overall drop of 23,000, and that the school calendar and the World Cup explained most of both. Set those two aside and payrolls rose roughly 67,000. The NFIB survey cannot settle the establishment survey’s arithmetic, but it does speak to the premise behind it. If the demand for workers had turned down in July, small firms would be the first to say so, and they said the opposite.
We hold our view that a strong employment report is coming in August or September, and this survey supports it. The mechanics are unchanged from what we laid out on Friday. An early Memorial Day and the World Cup pulled summer hiring forward into May, which left fewer seasonal workers to add in June and July and leaves fewer to release as the season ends. Labor Day falls on September 7, the latest date the calendar permits, which holds summer staff on payrolls through the September survey week. The August report arrives September 4.
The Price Signal Broke
The net percent of owners raising average selling prices fell seven points to 31% in July. Four consecutive monthly increases had carried the series from a net 24% in February to a net 38% in June, and July is the first break in that run. Unadjusted, 40% reported higher average prices, down seven points, and 8% reported lower prices, up one. Plans followed the same way, with a net 28% intending to raise prices over the next three months, down four points. Reports of inflation as the single most important problem fell seven points to 14%, the first decline this year, dropping inflation to third on the list behind labor quality and taxes.
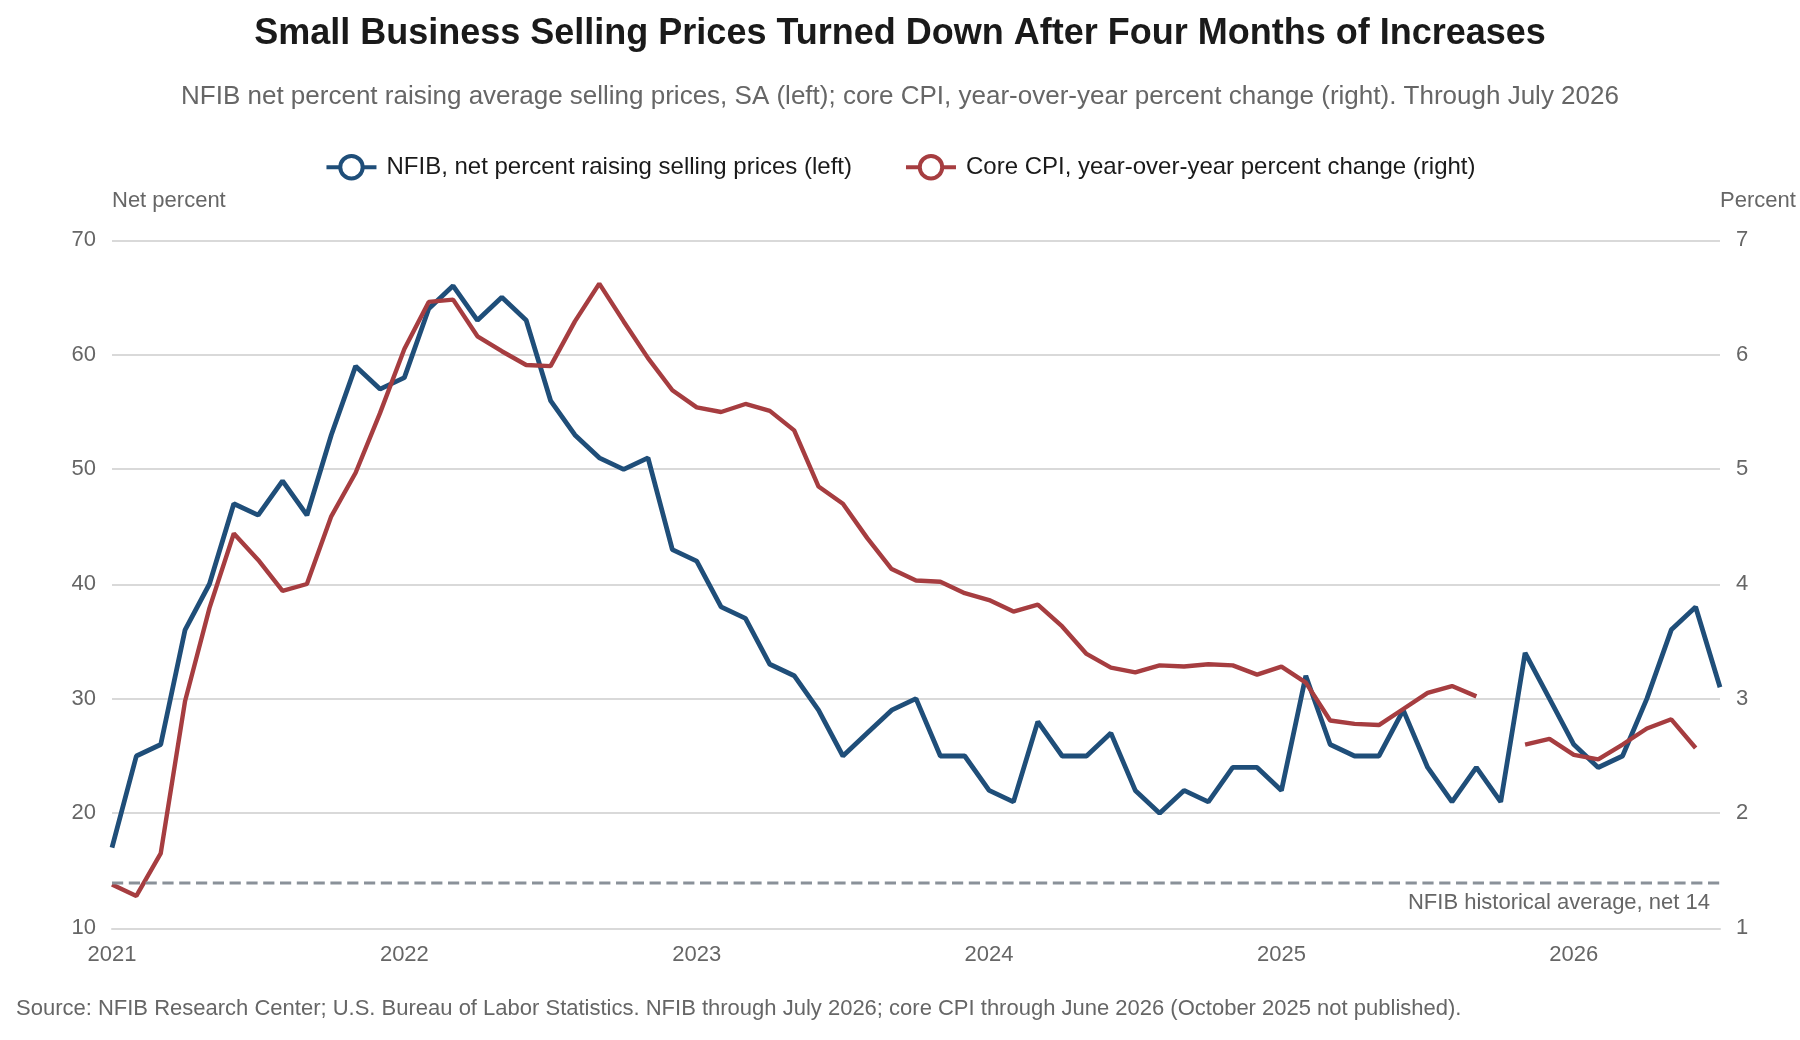
In the May survey we flagged the climb in this series as the confirming signature of cost-push inflation, with owners lifting prices to defend margins against energy and wage costs instead of in response to strong demand. July is the first evidence that the impulse is fading, and it counts for something, because the NFIB selling-price series has led realized core inflation at the major turning points of this cycle. It surged months ahead of the 2021 to 2022 spike in core CPI and rolled over months ahead of the disinflation that followed. The series is a better guide to goods and margin pressure than to the whole index, however, since it carries no shelter component and overstated how fast disinflation would run in 2024.
Two cautions. One month does not undo four, and at a net 31% the reading is more than double its historical average of 14 and well above where it sat through most of 2024 and 2025. The improvement is also not evenly sourced. Sixty-three percent of owners reported supply chain disruption of some kind, down five points, and 36% reported no impact at all, up six. That pattern fits an easing energy premium better than it fits resolved cost pressure, and an energy premium can return on a headline.
Investment Intentions Recover
Plans to make a capital outlay over the next three to six months rose five points to 25%, the highest reading since December 2024. In May the same series printed 16%, the weakest since March 2009. Realized spending improved alongside it. Fifty-four percent of owners made a capital outlay over the past six months, up three points, with 37% spending on equipment, up four, and 14% improving or expanding facilities, also up four.
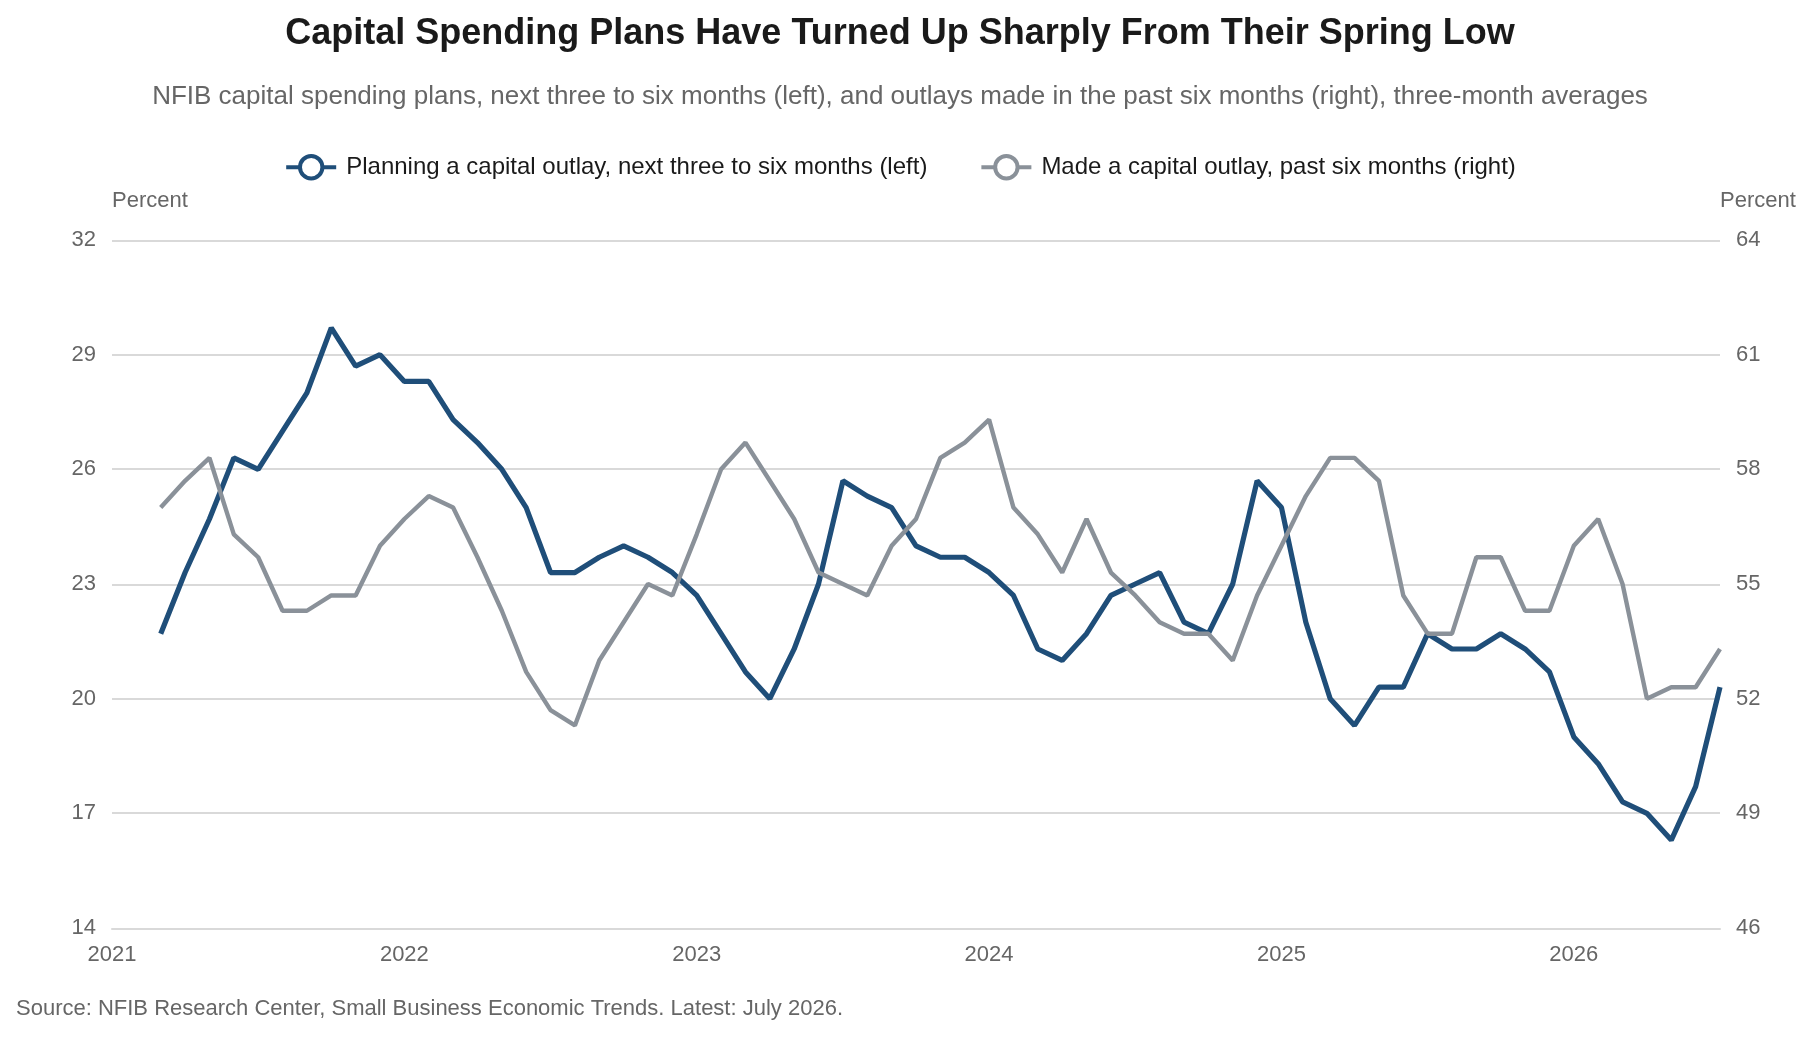
The composition is what makes the move credible, since equipment and facilities are the categories that require a view on demand a year out, and both rose. Vehicles held at 25% and purchases of new buildings or land eased a point to 4%, so this is not a rate-sensitive property story. It reads as the small-firm end of the capital goods cycle we described in the July ISM report, where new orders, backlogs and factory hiring all turned in the same month. NFIB’s own commentary draws the same line, tying the improvement to spillover from investment in chips and the structures built to house them.
What the Survey Does Not Say
None of the improvement has reached the income statement. A net 4% of owners reported lower nominal sales over the past three months, unchanged from June, and expectations for real sales over the next quarter fell two points to a net 7%. A net 16% reported lower earnings, an improvement of four points from a weak base. Only 12% called it a good time to expand, and the Uncertainty Index rose two points to 91, far above its norm near 68. Owners are planning to hire and invest against flat sales and shrinking earnings, so the July readings rest on a view of demand over the next two quarters.
Credit did not help either, with a net 5% of owners finding their most recent loan harder to get than previous attempts, up two points, and the average rate paid on short-maturity loans rising half a point to 7.9%, giving back June’s decline to the lowest level since October 2022. Twenty-seven percent of owners borrow regularly, up five points and still below the historical average of 34%. Financing and interest rates rank as the top problem for only 2% of owners, so the level of rates is not yet a constraint on the plans described above. It would become one if those plans convert.
What It Means for the Fed
After the May survey we described the Federal Reserve as boxed in, with a labor market soft enough to argue for patience and price data that refused to cooperate. July loosens one side of that box and tightens the other. The price data finally cooperated, with actual and planned increases both down and inflation falling out of the top two problems. Labor demand, the softness that made a cut arguable, turned up.
The FOMC voted 9 to 3 at its late-July meeting to hold, with all three dissents favoring a quarter-point increase, and futures pricing after Friday’s payroll report put the odds of a September hike at 44% and October at 58%. This survey argues against a cut at either meeting and does not add urgency to a hike. The committee got a piece of the evidence it wanted that the spring energy shock was not turning into a wage-price problem, with actual and planned price increases both down, and it got the opposite of the labor softening that would have made a cut arguable. We look for a hold in September unless the August employment report breaks against this survey.
Our Call · No Cut in 2026
The July survey supports the hold and takes the growth scare off the table. The two series that had made a cut arguable, hiring plans and job openings, reversed hard in July, and the two that had made a hike arguable, selling prices and price plans, both came down. That combination supports holding instead of moving in either direction, which is where we have been all year. We continue to carry no rate cut in our 2026 path and still believe the next move is more likely a hike than a cut, arriving in the first half of 2027 as rising manufacturing output flows through to the broader economy.
Two things would break the call. A net 31% of owners are still raising selling prices, more than double the historical average of 14, and the energy premium behind that can return with the next headline out of the Middle East. Running the other way, hiring plans have outrun realized employment in this survey before. If the net 20% has not converted by the October survey, we will read July as a mood swing.
Bottom Line
July’s NFIB survey is the cleanest month Main Street has had in more than a year. Optimism rose above its long-run average, hiring plans posted their best reading since 2022, job openings and capital spending plans both turned up, and the price series that had been climbing since February came down for the first time. The report also lands two business days after a payroll print that showed employment falling, and it argues that the payroll print measured the calendar and not the demand for workers. None of that has happened yet, however. Sales are flat, a net 16% of owners reported lower earnings, a net 5% cut staff last quarter and the Uncertainty Index sits 23 points above its norm. The August employment report on September 4 is the first place these intentions can show up.
What We Are Watching
| Series | The test |
|---|---|
| Hiring plans and job openings | A net 20% and a 36% that hold into August and September would separate a turn from a one-month spike. |
| Actual employment change | The net 5% reduction is where the intentions either convert or do not. |
| Selling prices and price plans | Whether the July declines extend, or whether the reading stabilizes above a net 30% and keeps core inflation from settling. |
| Capital spending plans | Whether 25% holds, which would confirm that the capital goods cycle reaches firms of every size. |
| August and September payrolls | Due September 4 and in early October, for the calendar reversal we have been describing since the July payroll release. |
Mark P. Vitner – Chief Economist, Piedmont Crescent Capital
mark.vitner@piedmontcrescentcapital.com · (704) 458-4000
Sources: NFIB Research Center, Small Business Economic Trends, July 2026 (released August 11, 2026); U.S. Bureau of Labor Statistics, The Employment Situation, July 2026, and Consumer Price Index; Institute for Supply Management, Manufacturing PMI, July 2026; CME Group. Historical series and chart calculations by Piedmont Crescent Capital.
Disclaimer: This report is provided for informational purposes only and does not constitute investment, legal, tax, or accounting advice, nor an offer or solicitation to buy or sell any security. Information is drawn from sources believed to be reliable, but its accuracy and completeness are not guaranteed. Views expressed are those of the author as of the date of publication and are subject to change without notice. Past performance is not indicative of future results.