Consumer Price Index — April 2026
Key Takeaways
| Key Concept | Findings |
|---|---|
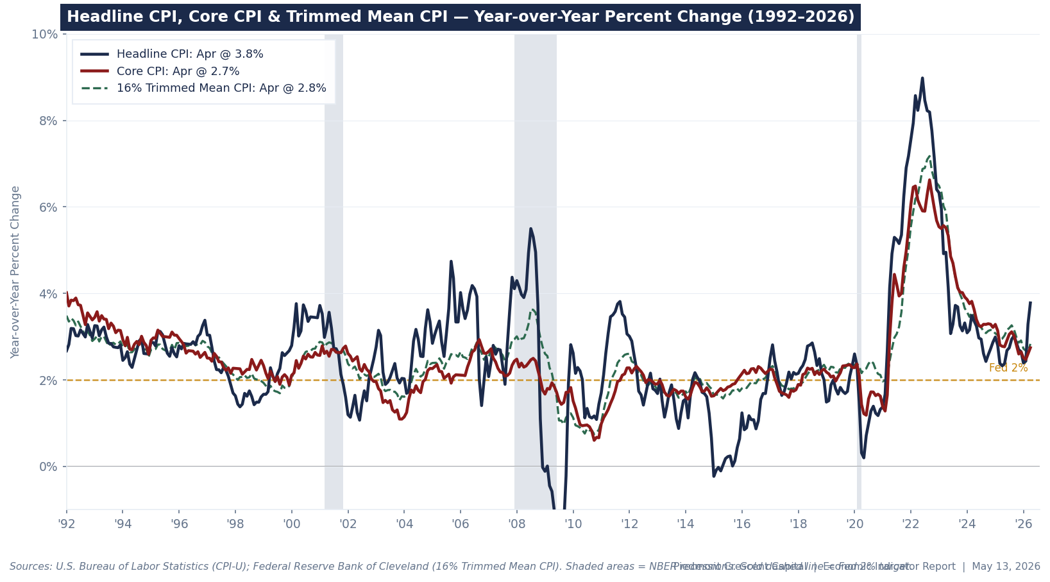
| Headline CPI | +0.64% MoM (+0.6% rounded); +3.81% YoY. Beat consensus of +0.60% MoM and +3.70% YoY. Year-over-year rate jumped 55 bps in a single month — fastest acceleration since mid-2024. |
| Core CPI | +0.38% MoM (+0.4% rounded); +2.75% YoY. Beat consensus of +0.30% MoM. Shelter catch-up (government shutdown) added ~13 bps; without it, clean core was closer to +0.25%. First upward acceleration in the annual core rate since 2025. |
| April PPI | +1.4% MoM; +6.0% YoY. Largest monthly advance since March 2022. Nearly 3× the consensus of +0.5%. Services PPI +1.2% (biggest since Mar 2022); goods PPI +2.0%; energy +7.8%. Stage 1 intermediate demand up 8.9% YoY — pipeline still filling. |
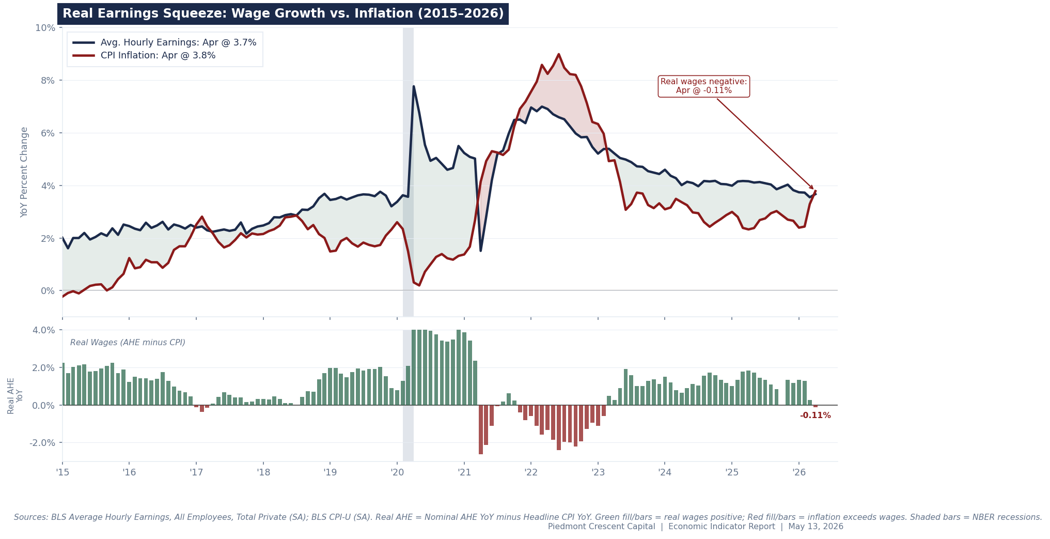
| Real Earnings | Real average hourly earnings fell 0.5% MoM in April. AHE of $37.41 rose just 0.2% (nominal), while CPI rose 0.6%. Year-over-year, real AHE are down 0.3%. For production workers, real AHE fell 0.3% on the month. Inflation is eating all wage gains. |
| Energy | +3.8% MoM; +17.9% YoY. Gasoline +5.4% following March’s record +21.2%. Fuel oil +54.3% YoY. Electricity +6.1% YoY. Energy pass-through into transportation, logistics, and food is the key second-round story. |
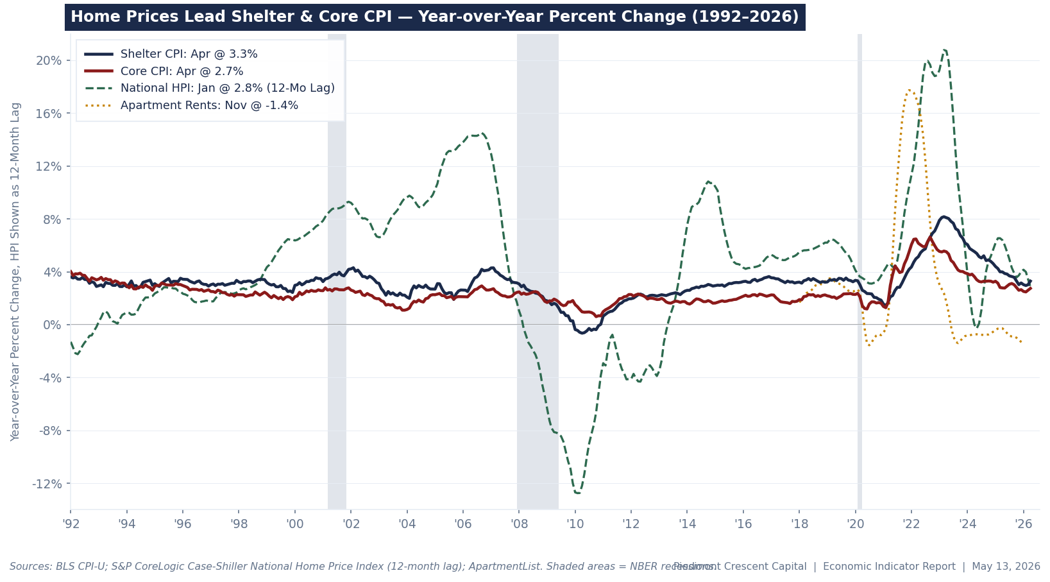
| Shelter | +0.6% MoM; +3.3% YoY. Distorted by BLS catch-up for missed October 2025 shutdown data. One-time effect. Structural disinflation in market rents remains intact. OER and rent will revert to 0.2–0.3% monthly pace in May. |
| Food | +0.5% MoM; +3.2% YoY. Restarted after March’s flat reading. Grocery prices +0.7%; beef +2.7%; fruits & vegetables +1.8%. Fertilizer and freight cost pass-through on 2–3 month lag. The food pipeline is full. |
| Trimmed Mean CPI | Cleveland Fed 16% Trimmed Mean: ~+0.5% MoM, ~4.4% annualized — accelerating sharply from March’s ~3.0% annualized. Incoming Fed Chair Warsh’s stated preferred signal. A second consecutive print at this pace would shift the FOMC debate from ‘when to cut’ to ‘whether to hike.’ |
| The Next Fed Move | Markets now price ~30% probability of a rate HIKE by year-end (CME FedWatch). FOMC voted 8-4 on April 29 — closest since 1992. Warsh confirmed as Fed Chair today. He will chair the June 16–17 meeting. We still see a narrow path to a September cut if Hormuz normalizes and energy prices recede materially by mid-summer. |
A Three-Report Inflation Indictment
Three BLS releases hit this morning, and all three pointed in the same direction. Consumer prices beat on both headline and core. The Producer Price Index came in nearly three times the consensus forecast. And real average hourly earnings fell 0.5% — the sharpest monthly real wage drop since the 2022 inflation surge. Rarely do CPI, PPI, and real earnings line up this cleanly. This morning they did, and none of it was good news.
April’s CPI is a more consequential print than March’s. March was ugly but explicable: a single energy shock from a record gasoline price surge drove three-quarters of the monthly increase. April is different. Headline CPI rose 0.6% month-over-month and 3.8% year-over-year, beating consensus. But the concerning story is beneath the headline: core inflation accelerated for the first time since 2025, the pass-through from energy into goods and services has begun, and food prices restarted after five months of flat or declining readings.
The Producer Price Index for final demand surged 1.4% in April — the largest single-month advance since March 2022, nearly three times the 0.5% consensus forecast, and an acceleration from March’s upwardly revised 0.7% gain. On a 12-month basis, wholesale prices are up 6.0% — the biggest increase since December 2022. Nearly 60% of the April PPI advance came from services, not goods — which makes it more persistent, not less. A services-led PPI surge is a leading indicator for future CPI services inflation, which is already firming. The goods component rose 2.0%, with energy up 7.8% and gasoline up 15.6%.
The 2-year Treasury note crossed 4% after these releases. The bond market has stopped pricing cuts and started pricing hikes. That is not a subtle shift — it is a repricing of the entire policy outlook, with direct implications for corporate borrowing costs, working capital, and how companies think about capital allocation for the rest of the year.
Inside the Numbers: Where Prices Are Moving
Energy remained the largest single contributor, though its role has shifted from dominating to compounding. Gasoline rose 5.4% in April after March’s extraordinary 21.2% surge, keeping energy’s year-over-year rate at +17.9%. Fuel oil — a critical input for heating, manufacturing, and freight — now stands 54.3% above a year ago. Electricity rose 2.1%. The energy pass-through into transportation, logistics, and manufacturing costs is accelerating on a lag, and the PPI confirms it is flowing upstream to downstream.
Shelter’s 0.6% monthly gain warrants careful interpretation. The BLS made a catch-up adjustment in April to compensate for the missed October 2025 report during the government shutdown. This is a one-time statistical correction, not a new trend. OER and rent each rose 0.5% — approximately twice the underlying run rate. The structural disinflation trend in market rents and the Home Price Index leading indicator shown in Chart 2 remains intact. The OER and rent components will revert toward their 0.2–0.3% monthly pace in May. Do not extrapolate April’s shelter print.
Food prices are the most concerning new development in this report. After five consecutive months of moderation or flat readings, grocery prices jumped 0.7% in April. Beef prices rose 2.7%. Fruits and vegetables jumped 1.8%. Non-alcoholic beverages rose 1.1%. The transmission from elevated fertilizer costs, higher freight rates, and energy-intensive food processing is flowing through the supply chain on the expected 2–3 month lag. The Purdue Center for Commercial Agriculture’s pipeline analysis — published publicly at ag.purdue.edu — places the food cost wave at Stage 3 intermediate demand, one node from retail, with consumer-level grocery price acceleration projected to continue through the May–August window.
Core goods were essentially flat on the month, providing one genuine point of relief. Used vehicles stabilized after a long deflation run, new car prices edged down 0.2%, and car rentals fell 3.7%. Computer software and accessories rose another 5% in April, driven by AI-related memory chip demand, but this category has almost no weight in core CPI. It matters more in the PCE deflator — where analysts have flagged it as likely overstating genuine consumer price pressure due to measurement difficulties the BLS has acknowledged around AI-driven product categories.
Services firmed across several categories. Airline fares rose 2.8% — carriers passing on jet fuel costs. Transportation services added 0.3%. Lodging rose 2.4%. Apparel continues to climb, reflecting tariff effects that appear to be winding down rather than broadening. On the other side of the ledger: internet services fell 1.4%, and medical care declined 0.1% for the second consecutive month. Those offsets are real but are not large enough to change the overall services trajectory.
The Producer Price Index: The Pipeline Is Still Full
Today’s PPI data compounds the CPI message rather than contradicting it. Final demand prices rose 1.4% in April, the largest single-month advance since March 2022. The prior month was revised upward from +0.5% to +0.7%. On a 12-month basis, wholesale prices are up 6.0%, marking the largest increase since December 2022 and nearly 1 percentage point above the March reading.
The composition is what matters. Nearly 60% of the PPI advance came from services, which rose 1.2% — the largest monthly gain since March 2022. This is the number that should trouble the Fed most. Services PPI leads CPI services inflation by one to three months, which means the services price acceleration already visible in April’s CPI is likely to continue into May and June. Two-thirds of the services gain was driven by a 2.7% jump in trade services margins, suggesting tariff costs are flowing through distribution channels more aggressively than earlier data indicated. Machinery and equipment wholesaling rose 3.5%, and truck freight, chemicals, legal services, and fuels retailing all contributed.
Final demand goods rose 2.0%, with energy driving roughly three-quarters of that gain — gasoline up 15.6%, energy overall up 7.8%. Jet fuel, diesel, fresh vegetables, and industrial chemicals also rose. Strip out energy and the underlying goods picture is still not clean: Stage 1 intermediate demand prices are up 8.9% over the past 12 months, the largest such increase since October 2022. Industrial chemicals, diesel, and truck freight — inputs that touch virtually every manufactured good and delivered product — are all climbing.
The PPI-to-CPI pass-through has weakened in recent years, and we are not forecasting a one-for-one translation. Consumers are already pushing back on price increases for discretionary goods, and with job growth concentrated in lower-wage sectors — nursing homes, home health care, social services — the wage-push channel is limited. The more immediate risk is a margin squeeze: companies absorbing higher input costs rather than passing them through, particularly in goods where pricing power is thin. But when wholesale inflation is running at 6.0% annually, it is naive to assume consumer prices will be fully insulated.
Wall Street Reaction: The Rate-Cut Consensus Has Collapsed
Hopes for a rate cut took a big hit this week. The back-to-back CPI and PPI reports appear to have been the tipping point. Before these releases, the debate was about the timing of cuts. Afterward, the debate shifted to whether the next Fed move is a cut at all. CME FedWatch now shows a nearly 30% probability of a rate increase by year-end 2026 — a probability that was essentially zero as recently as early April.
Several economists put it plainly. Joe Brusuelas, chief economist at RSM (Yahoo Finance, May 13): “We’re not getting rate cuts this year, guys. What you’re going to be doing is talking about changing the risk bias inside the statement, setting up two-sided risks, and building a bridge in case you do have to hike rates.” Heather Long, chief economist at Navy Federal Credit Union (CNBC, May 12): “For the first time in three years, inflation is eating up all wage gains. This is a setback for middle-class and lower-income households.” Chris Zaccarelli, chief investment officer at Northlight Asset Management (CNBC, May 12): “It’s very unlikely that the Fed will be able to lower interest rates any time soon, and it’s possible that we may start pricing in rate hikes for next year.”
| Firm | Fed Call | Key Takeaway (public source) |
|---|---|---|
| Goldman Sachs | First cut: Dec 2026 | Pushed cut forecast from Sep to Dec 2026 citing PCE near 3% through 2026. Sees AI-driven software prices temporarily overstating PCE inflation. Two total cuts in 2026–27, contingent on Hormuz normalization. Source: TheStreet, May 11 — thestreet.com/investing/goldman-sachs-sends-blunt-message-on-fed-interest-rate-cuts |
| Bank of America | No cuts 2026; first Jul 2027 | Aditya Bhave: "The data simply don’t warrant cuts this year. Core inflation is too high and moving up. The solid April jobs report was the last straw." Source: TheStreet, May 11 — thestreet.com/fed/bofa-drops-blunt-warning-about-fed-rate-cuts-for-remaining-of-2026 |
| JPMorgan | On hold; next move may be a hike | Jamie Dimon (Apr 28, public Norges Bank speech): "There are a lot of inflationary things out there, including the Iran War, the re-militarization of the world, the infrastructure needs of the world, and our deficits." JPM sees Fed on hold all year; next move possibly a hike. |
| Barclays | No cuts 2026; first Mar 2027 | Dropped Sep 2026 cut; first cut moved to Mar 2027. Energy, tariffs, and supply chain disruption compounding simultaneously. Source: TheStreet, May 11 — thestreet.com/investing/goldman-sachs-sends-blunt-message-on-fed-interest-rate-cuts |
| Morgan Stanley | Extended pause; monitoring | Ellen Zentner (MS Wealth Mgmt, quoted in Yahoo Finance): "The increase in the core CPI suggests high energy prices are making themselves felt throughout the economy. New Fed leadership won’t result in an immediate dovish shift." Source: Yahoo Finance, May 13 — finance.yahoo.com/economy/article/hot-cpi-report-likely-to-put-fed-on-guard-141806600.html |
| Citigroup | 2026 cut still possible | Contrarian view: a before-year-end cut remains possible if Hormuz normalizes and long-run inflation expectations stay anchored. The lone holdout among major banks. Source: Yahoo Finance, May 7 — finance.yahoo.com/economy/policy/articles/goldman-sachs-drops-cautious-signal-043700912.html |
| Wells Fargo | No cuts 2026; Fed on hold | Dropped 2026 cut forecast on April 6: "The balance of risks has shifted to incentivize patience from the Fed." U.S. Economic Outlook, Apr 8: "Oil shock revives consumer inflation, delays Fed easing." April CPI/PPI data confirms the call. Source: TheStreet, Apr 6 — thestreet.com/crypto/fed/wells-fargo-revises-its-forecast-for-fed-rate-cuts |
All sources publicly accessible. See URLs in table.
The Next Fed Move: Warsh’s Predicament
A New Chair, the Worst Possible First Week
Kevin Warsh was confirmed as the 17th Chair of the Federal Reserve today — the same morning the Bureau of Labor Statistics delivered the worst twin inflation reading in four years. The timing is brutally precise. Warsh has called for “regime change” at the Fed, has said he believes the central bank’s benchmark interest rate can be lower, and was nominated specifically because President Trump wanted a chair who would ease monetary policy. He is now the leader of an institution where two members have already voted to raise rates, where wholesale prices are up 6% year-over-year, and where markets are pricing a hike before a cut.
Warsh’s first FOMC meeting is scheduled for June 16–17. His confirmed 51–45 Senate vote was mostly party-line, with only Democrat John Fetterman of Pennsylvania crossing the aisle. Jerome Powell, whose term as chair ends Friday, is staying on as a governor in response to what he called “a series of legal attacks on the Fed which threaten our ability to conduct monetary policy without considering political factors.” An unusual but not unprecedented act that raises questions about Warsh’s independence. We feel this concern is overstated.
Warsh’s predicament is analytically clean but politically excruciating. Trump is on record demanding rate cuts. The data is demanding patience at minimum and potentially a hike. Warsh has said he “welcomes a family fight” at the Fed as policymakers work out the right response to economic conditions. His first press conference on June 17 will be among the most closely watched Fed communications in years. Mark Zandi, chief economist at Moody’s Analytics, told CNBC on May 12: “I just don’t see how he’s going to get any kind of support for cutting interest rates in the current environment.” That is a fair assessment. But Warsh is unlikely to pursue rate cuts in the current environment. Conditions on both sides of the Fed mandate — inflation and the labor market — will likely change considerably by Labor Day.
The September Scenario: Narrow but Alive
The path to a September cut is narrow but real. Our base case: a ceasefire framework emerges by Memorial Day; Hormuz traffic normalizes through June and July; energy prices recede materially by mid-summer; and shelter disinflation reasserts itself as the dominant trend in the May and June CPI prints. Under that scenario, headline CPI retreats toward 2.8–3.0% by August, core stabilizes at 2.5–2.7%, and the trimmed mean decelerates to 3.0–3.5% annualized. None of those assumptions require the economy to perform beyond its recent trend — only that the war's worst supply disruptions ease over the summer.
That would create just enough cover for Warsh to deliver a 25 basis point cut in September — framed not as capitulating to White House pressure but as recalibrating policy as a transitory supply shock passes. Such a cut would not be a response to a weakening economy. It would be insurance — a recognition that negative real wages are already creating demand destruction that will show up in the data over the summer. With real average hourly earnings now down 0.3% year-over-year, the consumer has already absorbed a real income cut. The question for September is whether the energy shock that caused it has materially subsided. Oxford Economics’ base case projects core CPI to trend sideways through 2026, not accelerate further. That sideways view is the necessary condition for September.
We do not yet view a rate hike as the base case. We view it as a live risk that was not on the table 60 days ago. The June 16–17 FOMC is, in our assessment, the most consequential meeting since the March 2022 liftoff.
Our Call: Hold in June; September Cut Scenario Conditional on Hormuz
Our base case: June — hold, with language shifting to acknowledge two-sided risks. September — 25bp cut, conditional on Hormuz normalization by end of July, energy prices below $95/bbl, and at least one more month of shelter disinflation re-establishing the trend. If the ceasefire fails and energy remains elevated, the September cut is off the table and the June hiking discussion becomes the policy mainstream. The 30% market probability of a year-end hike is no longer theoretical.
Real Income, the Midterms, and the Iran Incentive
The Consumer Is Being Squeezed in Real Time
The BLS Real Earnings report, released alongside today’s CPI data, delivers the starkest single number in the morning’s data cascade: real average hourly earnings fell 0.5% month-over-month in April. Nominal wages rose 0.2%, to $37.41, but the 0.6% CPI increase outpaced that gain entirely. On a year-over-year basis, real average hourly earnings are down 0.3%. For production and nonsupervisory workers — approximately 80% of the private-sector workforce — real hourly earnings fell 0.3% in April and are down 0.2% year-over-year, deflated by the CPI-W which gives more weight to energy and food, the two fastest-rising categories.
The April jobs report added context that matters. The 115,000 payroll gain looked solid on the headline but was driven almost entirely by health care — nursing homes and home health aides — and social services. These are important sectors, but they are not the high-wage, productivity-driven jobs that feed consumer spending and tax revenue. Transportation and warehousing also posted an outsized gain of 30,000 jobs, with more than all of that increase (38,000) coming in couriers and messengers, which looks to us as a seasonal quirk. Federal employment continued to shrink. The composition tells a story of an economy that is still generating jobs but not as fast as the past two month’s headlines suggests and not the kind of jobs that meaningfully expand purchasing power. Nominal wage growth at 3.6% is running below headline CPI at 3.8%. That means there is no wage-price spiral here. Workers are not driving this inflation by extracting outsized pay increases. This is a supply shock — energy and food costs imposed from outside the domestic economy — squeezing real incomes. The distinction matters enormously for Fed policy, though it offers no practical comfort to the household that spent $4.16 a gallon this month.
The Midterm Calculus: The Political Clock Is Running
The inflation story converges with the political story in a way that should focus the White House’s attention. A CNN/SSRS poll conducted April 30–May 4 found that 55% of Americans identify the economy and cost of living as the most important issue facing the country — more than double any other issue. Trump’s approval rating on the economy stands at 30% (CNN/SSRS) and on inflation specifically at just 26% (Newsweek/YouGov). A Brookings Institution analysis published in May found that approval for the president’s handling of inflation stood at 30% and the overall economy at 37%, levels that political analysts say endanger Republican House candidates in swing districts.
The YouGov weekly tracker shows the share of Americans saying the economy is “getting worse” has risen from 25% in January 2025 to 61% in May 2026. Only 18% say it is getting better. Critically, 77% of Americans — including a majority of Republicans — say Trump’s policies have increased the cost of living in their own communities (CNN/SSRS). Democrats now lead Republicans by 4 points on the generic House ballot, with the largest swings among independents, suburban voters, and households earning $50,000–$100,000 per year, precisely the people spending the most on gasoline and groceries as a share of income.
The Brookings analysis (William Galston, May 2026) finds that for the first time since 2010, Democrats are more trusted than Republicans to handle the economy. Democrats lead by double digits on trust to handle inflation, the cost of living, income inequality, and healthcare costs. Historically, economic conditions in the 12 months before a midterm are among the strongest predictors of House seat changes. The 2026 midterms are six months away. Gasoline prices that remain above $4.00, grocery bills that continue climbing, and real wages that are negative year-over-year represent an acutely difficult environment for the incumbent party’s congressional candidates.
The Iran Deal Incentive: Connecting the Dots
The political pressure to resolve the Iran war is not subtle, and Trump understands the economic mechanism as well as anyone. A ceasefire deal with Hormuz normalization before Memorial Day sets off a chain reaction that is favorable on every dimension that matters for the midterms: Hormuz traffic recovers over June and July; Brent crude retreats from the $95–110 range toward $75–85; gasoline falls below $3.50 by August; headline CPI retreats toward 2.5–3.0% in the August–September window; real wages turn positive before November; and Warsh delivers a September cut framed as insurance against demand destruction, not capitulation to the White House.
A deal with Iran also unlocks the Saudi spigot. It removes the primary constraint on Riyadh and the other Gulf producers. The Saudis and UAE have signaled, publicly and through diplomatic channels, that they are ready to increase production materially once Hormuz normalizes and sanctions relief is on the table. OPEC+ has roughly 5 million barrels per day of spare capacity that could come to market quickly. Cheaper gasoline before November is worth more to Republican House incumbents in competitive districts than any other policy outcome Trump can deliver.
Iran's incentives are just as visible. The country faces severe economic pressure and military degradation. The Islamabad talks produced no deal but did produce 21 hours of direct engagement — the most substantive U.S.–Iran diplomacy since 1979 — and both sides left written proposals on the table. Iran’s leverage lies precisely in the political and economic pain that the continued disruption inflicts on the U.S. economy. Every month of elevated oil prices, negative real wages, and deteriorating Trump approval ratings is leverage for Tehran. The ceasefire expiration on April 22 passed; the war has not resumed. That is not an accident. Both sides have something to gain from a deal before summer.
Perspectives from Piedmont Crescent Capital
— Mark P. Vitner, Chief Economist, Piedmont Crescent Capital
— Mark P. Vitner, Chief Economist, Piedmont Crescent Capital
— Mark P. Vitner, Chief Economist, Piedmont Crescent Capital
Bottom Line: The Inflation Thesis Has Changed
April’s CPI is not a repeat of March. March was a single-category shock. April is the early evidence of second-order effects: energy costs flowing through food, transportation, and services; core CPI accelerating; the trimmed mean moving in the wrong direction; and PPI confirming the pipeline is still full. Real wages have turned negative year-over-year for the first time in three years.
The disinflation story is not finished. Shelter is still slowing structurally. Goods prices are subdued. Tariff pass-through is winding down. If Hormuz normalizes, the energy pass-through should peak in Q2. None of that is trivial. But the margin for error has narrowed considerably. The disinflation path that looked gradual and nearly confirmed in Q1 is now in dispute.
For investors and policymakers alike, the operative framework must shift: from ‘when will the Fed cut’ to ‘how long can the Fed hold out before inflation breadth forces its hand’ — and from ‘will there be a good deal with Iran’ to ‘how quickly can it happen.’ The next twelve weeks will answer both questions.
Key Data Releases to Monitor
April PCE Deflator (May 30): The Fed’s preferred measure. Our estimate: core PCE +0.30% MoM, +3.2% YoY; headline PCE +0.45% MoM. AI-driven software prices may temporarily boost YoY PCE core by an estimated 0.17pp — likely a measurement artifact. Watch the “super core” PCE (services ex-housing ex-energy) for the cleanest underlying signal.
Warsh’s First Public Remarks as Chair: The most consequential Fed communication in years. Watch for his framing on: (a) whether April is a supply shock or a broadening trend; (b) whether he shifts the communication framework away from the dot plot; and (c) what conditions he sets for rate cuts. His answer to (c) is the September scenario’s critical variable.
May CPI (June 11): The most important inflation print of the summer, arriving six days before Warsh’s first FOMC meeting. Energy base effects should provide some headline relief if oil stays near current levels. The critical question: does core stabilize or continue climbing? A second consecutive +0.35%+ core print would materially raise the June hiking probability.
Hormuz Ship Traffic (Daily): The real-time indicator that underpins every scenario. USS Frank E. Peterson and USS Michael Murphy completed mine-clearing transit May 11. Iran has not resumed kinetic operations. But with only 15 vessels per day versus a pre-war average of 138, the economic blockage is still essentially complete. Watch EIA and Reuters daily shipping data for the first signs of commercial normalization.
Iran Ceasefire / Deal Timeline (Ongoing): Our base case projects deal outlines around Memorial Day, implementation over June, and Hormuz normalization by end of summer. This is the necessary condition for the September cut scenario, the reversal of real wage declines before November, and the political narrative Trump needs for the midterms. Every week of delay narrows all three windows.
mark.vitner@piedmontcrescentcapital.com · (704) 458-4000
May 13, 2026
© 2026 Piedmont Crescent Capital. Sources: BLS CPI-U, PPI, Real Earnings (May 12–13, 2026); Federal Reserve Bank of Cleveland; CME FedWatch; Brookings Institution; CNN/SSRS (Apr 30–May 4, 2026); CNBC; Yahoo Finance; TheStreet; Oxford Economics. For informational purposes only. Not investment advice.