The CAVU Compass · Monthly Macroeconomic Insights
The Capital Cycle Holds the Line as Inflation’s Breadth Sends Bond Yields Higher
Our 2.8% Q2 Forecast Holds. The April Inflation Breadth Is the Real Story. The 10-Year at 4.60% Is the Market’s Response.
By Mark P. Vitner, Chief Economist, Piedmont Crescent Capital · May 19, 2026
Download the Full PDF Report ↓
At a Glance
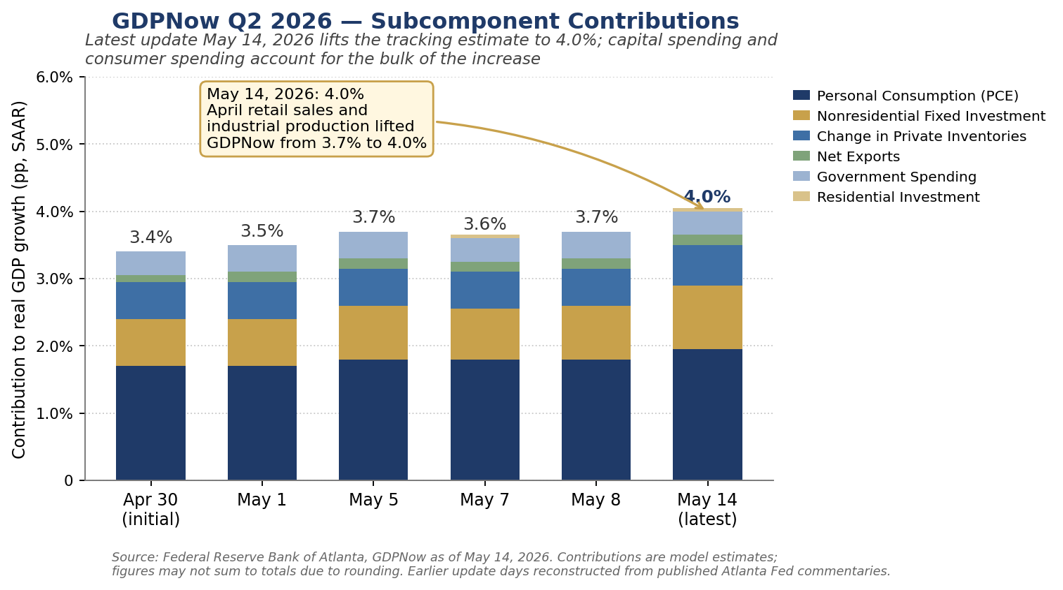
The capital-led expansion is real and broadening. Our Q2 real GDP forecast is 2.8%, unchanged for two months and supported by capital spending and resilient services consumption. April retail sales rose 0.5% on both headline and control, the third consecutive monthly increase and the data point most directly responsible for the Atlanta Fed’s GDPNow tracking estimate moving to 4.0% as of May 14, up from 3.7% on May 8. The composition matches the thesis we have been making since the start of the year: AI infrastructure, power, reshored pharma, an aerospace resurgence, and defense replenishment.
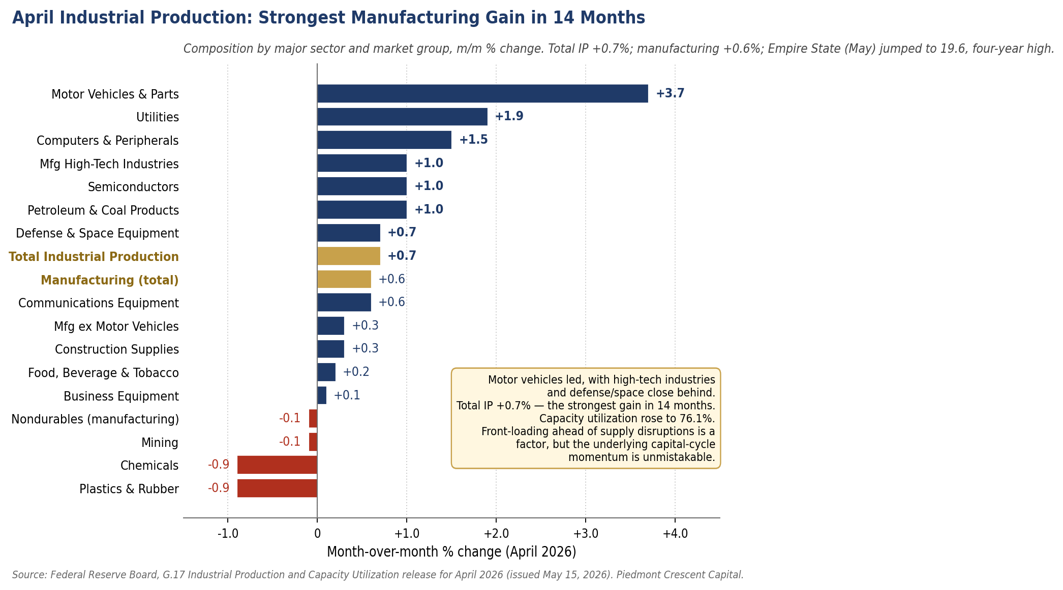
Industrial production posted its strongest gain in fourteen months. April industrial production rose 0.7% and manufacturing output rose 0.6%, the largest gain since February 2025. Motor vehicle production jumped 3.7% and high-tech output rose 1.0% for a second consecutive month. Capacity utilization moved up to 76.1%. The Empire State manufacturing index jumped to 19.6 in May, a four-year high.
Q1 GDP confirmed the bridge. Real GDP rose 2.0% in Q1, slightly below the 2.3% consensus, with investment the largest contributor. The bridge to a stronger Q2 runs through capital spending, inventory rebuilding, and a consumer that is resilient outside of durable goods.
The labor market did exactly what we thought it would. April nonfarm payrolls rose 115,000, well above the 55,000 consensus, with ADP corroborating at 109,000. Unemployment held at 4.3%. February payrolls were revised down again, to a net loss of 156,000. The low-hire, low-fire equilibrium continues. It is stable without being good, with the risks stacked to the downside and hiring confined to a narrow set of industries.
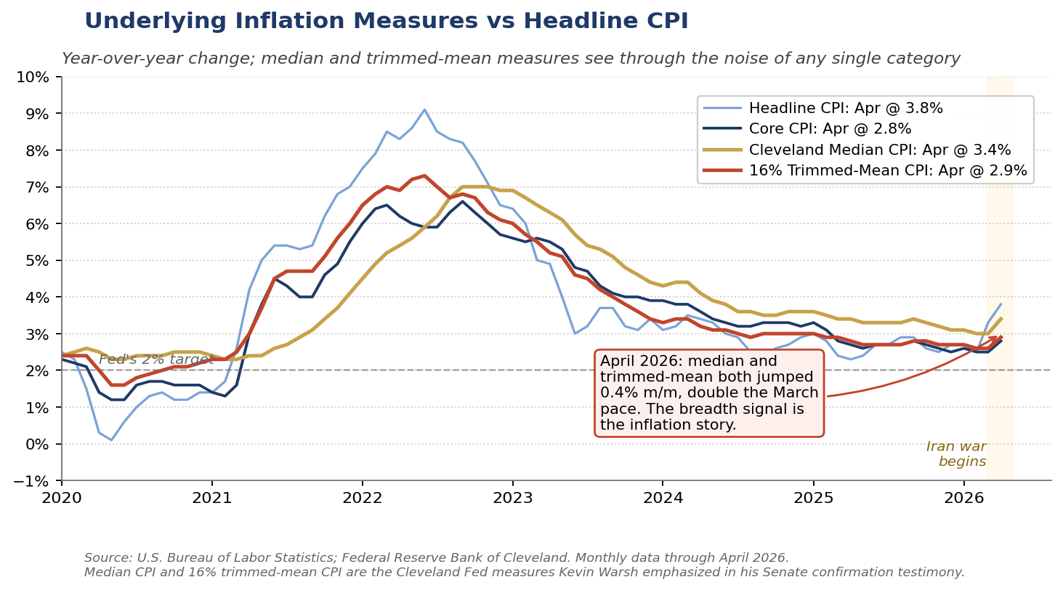
The underlying inflation picture received a major wake-up call in April. The breadth of the increase is the story. Headline April CPI rose 0.6% m/m and 3.8% YoY, the highest annual reading since May 2023. More consequentially, the Cleveland Fed median CPI and 16% trimmed-mean CPI both rose 0.4% m/m, double the March pace. When measures designed to see through any single category move in lockstep with the headline, the impulse is no longer confined to gasoline. This is the measurement issue Kevin Warsh raised in his confirmation testimony, and the very measures he chose to highlight. He will have to address that at the first meeting he presides over in June.
The April PPI surge points to margin compression more than substantial final-price acceleration. Headline PPI rose 1.4% m/m, the largest monthly gain since March 2022, with the year-over-year rate at 6.0%. Services PPI rose 1.2%, with two-thirds of the move coming from trade services. PPI at 6.0% YoY against headline CPI at 3.8% is the cleanest measure we have of margin compression in the producer pipeline. Firms without pricing power are absorbing the energy and tariff impulse rather than passing it through.
The 10-Year at 4.60% is the market’s read on the inflation debate. The 10-Year Treasury closed May 15 at 4.60%, the highest since January 2025. The 30-Year closed at 5.12%. The 30-year fixed mortgage rate has pushed to roughly 6.46%, well above where it sat at the end of February. The bond market has now ruled out a rate cut through 2026 and is pricing better than a 1-in-3 chance of a hike before year-end.
The Fed is genuinely divided, and the room to cut has narrowed. The 8-4 April 29 hold was the most dissents since 1992. Miran preferred a cut; Hammack, Kashkari, and Logan supported holding but objected to the easing bias. That move appears prescient today. Markets have moved from pricing roughly 8 basis points of cuts through year-end at our April 26 weekly to pricing essentially no cuts through 2026, with hike probability at roughly 39% post-PPI.
Powell stays on the Board through January 2028; Warsh chairs from June 17. Powell’s continued presence is a stabilizing factor for institutional continuity but is still unnerving. Warsh’s framework calls for restrictive policy until inflation is anchored, continued balance sheet normalization, stronger price discovery, and explicit recognition of Treasury-Fed interdependence. His structural optimism about productivity is the underappreciated element and is consistent with our capital-cycle thesis.
The Trump-Xi summit was a win, not just a non-harm. The May 14 Beijing meeting produced joint language that the Strait of Hormuz must remain open, H200 chip clearances for ten Chinese firms, Chinese commitments to purchase up to 200 Boeing aircraft and billions of dollars of U.S. agricultural products, and the restoration of Chinese imports of American beef. Xi’s framing of Taiwan as the “most important issue” in U.S.-China relations, with the warning that mishandling it risks “collision or conflict,” is the more consequential signal for CFOs with East Asia exposure.
Our scenario probabilities. Base Case (50%): outline agreement on Iran by late May or early June, with some additional military action likely along the way; Hormuz reopens by mid-summer; Brent retraces toward $80 by year-end; capital cycle drives Q2 and Q3 GDP at 2.5 to 3.0%; the Warsh Fed delivers one cut in September. Upside (15%): the summit’s Hormuz language translates into actual Chinese leverage on Tehran; agreement closes faster than expected; Brent returns to $75–$80 by Q3. Downside (35%): negotiations stall; Brent re-accelerates above $130; headline CPI re-accelerates above 4%; the consumer cracks visibly in lower-income segments; the Fed is pinned indefinitely.
Market Snapshot
| Indicator | Level | Context |
|---|---|---|
| Brent Crude | ~$107 / bbl | Off the May 4 mid-week peak above $114 after the UAE attack and Project Freedom launch; pulled back further post Trump-Xi |
| WTI | ~$102 / bbl | Net 7% higher on the week despite the Trump-Xi pullback |
| 10-Year Treasury | ~4.60% | Friday close; highest since January 2025; sharp move post CPI and PPI |
| 2-Year Treasury | ~3.88% | Curve steepening; markets pricing essentially no cuts through 2026 |
| 30-Year Treasury | ~5.12% | Term premium continuing to rebuild; through 5% for the first time since 2024 |
| Yield Curve (2s10s) | +72 bps | Bear-steepened materially on growth firmness and rate-cut repricing |
| 30-Year Fixed Mortgage | ~6.46% | Up from 5.98% on Feb 26; MBS spread now widest since December |
| Fed Funds Target | 3.50–3.75% | Held April 29 on an 8-4 vote; most dissents since 1992 |
| PCC Q2 Real GDP Forecast | 2.8% | Capital spending and resilient consumer leading; risks balanced |
| Atlanta GDPNow Q2 | 4.0% | Up from 3.7% on May 8; latest as of May 14; upside risk to our forecast |
| April Retail Sales | +0.5% m/m | Third consecutive monthly increase; control group also +0.5% |
| April Industrial Production | +0.7% m/m | Strongest in 14 months; manufacturing +0.6%; motor vehicles +3.7% |
| Empire State (May) | 19.6 | Highest reading in over four years |
| Headline CPI (April) | 3.8% YoY | Highest since May 2023 |
| Core CPI (April) | 2.8% YoY | Highest since September; m/m at 0.4% |
| Cleveland Median CPI | 0.4% m/m | Doubled from March’s 0.2%; the most consequential single data point |
| 16% Trimmed-Mean CPI | 0.4% m/m | Also doubled from March; the disinflation comfort narrowed |
| Dallas Trimmed-Mean PCE (Mar) | 2.4% YoY | 12-month rate; 1-month annualized 2.9% |
| Headline PCE Deflator (Mar) | 3.5% YoY | Pre-April CPI breadth; May 28 release captures more of the impulse |
| Core PCE Deflator (Mar) | 3.2% YoY | Same caveat as headline |
| Headline PPI (April) | 6.0% YoY | Largest annual increase since December 2022 |
| Brent vs. Pre-War | +47% | Pre-war reference: ~$73/bbl |
| Retail Gasoline | $4.54 / gal | National average; up from $4.30 a month ago |
| S&P 500 | ~7,440 | Record close above 7,500 on Thursday’s Cisco-led rally before Friday profit-taking |
| Hike Odds (CME) | ~39% | First meaningful hike probability since the 2023-24 cycle |
Sources: BLS, BEA, EIA, AAA, CME Group, Freddie Mac, Atlanta Fed, Cleveland Fed, Dallas Fed, Federal Reserve Board, FRBNY ACM, FactSet, U.S. Census Bureau. As of close Friday May 15, 2026.
The Macro Backdrop
The data since the April 19 Compass has clarified the picture along the lines we anticipated. The capital cycle is real and broadening. The labor market is cooling gradually without breaking. Underlying inflation took a meaningful step in the wrong direction. The geopolitical situation, which we sketched as approaching the brink last month, has shifted toward cautious optimism. We treat each on its own terms below.
Q1 GDP at 2.0% confirmed the bridge from a soft Q1 to a stronger Q2. April retail sales at +0.5% on headline and control, the third consecutive monthly increase, defied the consensus that the energy drag would begin to bite into discretionary categories. The April industrial production print at +0.7% headline, with manufacturing at +0.6%, was the most direct piece of evidence to date that the capital cycle is showing up in the hard data. Capacity utilization moved to 76.1%. Empire State at 19.6 in May, a four-year high, suggests the May data will keep this picture intact. The Atlanta Fed’s GDPNow at 4.0% as of May 14, lifted from 3.7% on May 8 by the retail sales and industrial production releases, is the upside marker we are watching. Risks to our 2.8% Q2 forecast are roughly balanced.
This remains a capital-led expansion of a sort the post-2008 economy rarely produced. Hyperscaler 2026 capex commitments now total roughly $725 billion across Microsoft, Meta, Alphabet, and Amazon, up from $416 billion in 2025, a 74% year-over-year increase. A meaningful share of the buildout is being met through imports of semiconductors and computing equipment, so the gross capex figure overstates the net contribution to measured GDP. We estimate that net contribution at 0.3 to 0.5 percentage points this year. The productivity story underneath the headline capex number is what matters most for the medium term. Pharmaceutical reshoring, aerospace assembly ramps, and defense replenishment reinforce the same theme. The economy is being fueled by protein, capital investment and intellectual capital, rather than by carbohydrates, consumer spending.
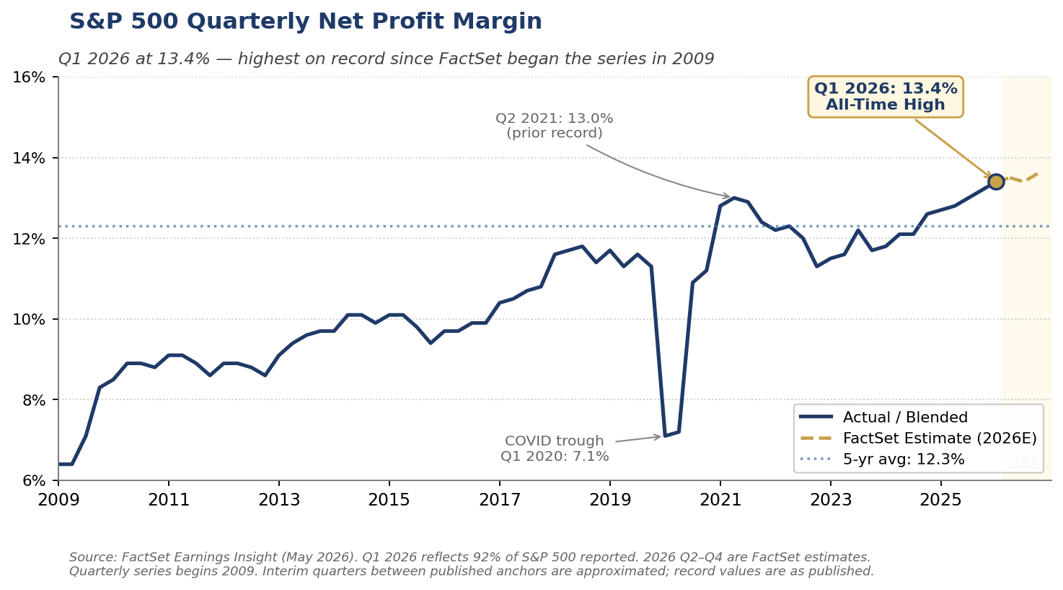
The Q1 earnings season corroborates the macro signal. With 92% of the S&P 500 reporting, blended earnings growth stands at 15.1% year-over-year, the sixth consecutive quarter of double-digit growth. Eighty-four percent of companies beat EPS estimates. The single most striking data point is the blended net profit margin of 13.4%, the highest reading on record since FactSet began tracking the metric in 2009 and a step up from the prior record of 13.2% set just one quarter ago. Information Technology led at 29.1%, up from 25.4% a year earlier. Firms that allocated capital toward automation, productivity, and AI-enabled process redesign during the post-pandemic period are now translating modest revenue growth into outsized earnings growth.
A new differentiation has emerged within mega-cap tech that bears watching. Alphabet rose roughly 34% in April after a Q1 beat across cloud, advertising, and Waymo. Meta Platforms fell roughly 9% despite beating earnings, after raising its 2026 capex guidance to $125 to $145 billion. The market is no longer rewarding the scale of AI commitment alone; it is demanding evidence of returns. That is healthy for the cycle and distinguishes the current capex boom from earlier ones, where spending itself was treated as a positive signal regardless of the back-end economics.
The consumer side of the story remains more nuanced than the aggregate data suggests. The split we flagged in the April Compass between services (holding up) and durables (soft) sharpened in April. Bars and restaurants rose 0.6% in the April retail sales report and broad services consumption is firm, while motor vehicle and parts sales fell 0.5%, furniture fell 2.0%, clothing fell 1.5%, and department stores fell 3.2%. The pattern reflects higher financing costs, the energy-shock lag on real income, and pull-forward of demand during 2024 and early 2025. The April Beige Book, bank credit card data, and the New York Fed Consumer Survey all document the same split by income, with higher-income households continuing to spend while middle- and lower-income households pull back.
The Milken Institute Global Conference at the end of April put a punctuation mark on the constructive view we have been making. The largest pools of capital in the world are leaning into this cycle. Blackstone President Jon Gray reminded the audience that markets have powered through pandemic, inflation, regional conflict, and now war with Iran, and saw no reason to expect anything different. Private credit got plenty of attention, both as enabler and as a source of nascent concern; the largest sponsors sounded constructive on direct lending volumes while acknowledging that the easy returns of 2022 to 2024 are behind them and that selectivity is back.
Where We Sit in the Consensus
Our 2.8% Q2 forecast and 2.5% full-year view sit on the constructive end of the Wall Street consensus. The range of major Wall Street forecasts published in the past two weeks runs from roughly 1.0% to 2.8% for Q2, with most clustering between 1.7% and 2.3%. The full-year range runs from roughly 1.6% to 2.6%, with the median near 2.2%. The Atlanta Fed’s Q2 GDPNow at 4.0% sits above the entire published range and is the upside marker. The dispersion is wider than at any point since the war began. The reason we are on the constructive side comes down to consumer composition. The bears anchor on the real-income hit from gasoline. We hold our view because the services-strong, durables-soft split is more nuanced than aggregate real income captures. If real income less transfers deteriorates further into Q2 and the durables weakness broadens into services, the 2.8% becomes harder to sustain.
The Labor Market: Low-Hire, Low-Fire Confirmed
The April employment report did not change the labor market story so much as confirm it. The 115,000 payroll gain was well above the 55,000 consensus, although February was revised lower by another 23,000, to a net loss of 156,000. Gains concentrated in healthcare, transportation and warehousing, and retail trade. Federal government employment fell another 9,000 in the month and roughly 348,000 since October 2024. Manufacturing payrolls edged down 2,000 even as industrial production posted its strongest gain in over a year, which is the productivity story in microcosm.
Questions about the quality of the April payroll gain have circulated, since the BLS birth-death model added 386,000 jobs in the unadjusted data, more than accounting for the entire reported increase. ADP’s independent read of +109,000 puts most of those concerns to rest. ADP’s sample is much larger than the BLS establishment survey and has historically aligned closely with BLS annual revisions. Wage growth for job-stayers in the ADP data held steady at 4.4% year-over-year. Our read is a bit more cautious. Most of the job gains within healthcare were in low-paying parts of the sector, most notably home health care and nursing homes. The gains in transportation and warehousing also look suspect, with an inexplicable spike in couriers and messengers more than accounting for all of that sector’s job gains.
Average hourly earnings rose 0.2% m/m and 3.6% YoY, slightly below headline inflation. That is the texture of a labor market in the equilibrium Powell, Waller, and Goolsbee have described. Hiring is slow, layoffs are limited, and the mix continues to skew toward lower-paying service sectors. Voluntary attrition has slowed to unprecedented lows, which reduces the need to hire new staff and likely lifts productivity. It also pushes wage and benefit expense higher as annual increases land on a more experienced workforce.
What growth there has been in manufacturing is concentrated in capital-intensive industries: semiconductors, machinery, chemicals, and related high-tech durables, where surging investment in equipment, automation, and AI-related infrastructure is driving output gains and value-added while delivering only modest net employment increases. The April industrial production breakdown reinforces that read. The ISM surveys do the same. Manufacturing held at 52.7, the fourth consecutive month of expansion. New orders strengthened to 54.1. Services rose to 53.6, the 22nd consecutive month of expansion. The two warning lights were the Prices Index, which surged at the fastest pace since April 2022, and the Employment Index, which fell to 46.4, the sharpest contraction in four months.
Inflation: The Breadth of the April Increase Is the Story
We argued in the April 26 weekly that the headline CPI spike was noise and the underlying trend was the signal. Through the March data, that framing held: Cleveland median and 16% trimmed-mean both ran at 0.2% m/m alongside core CPI, and the Dallas Fed trimmed-mean PCE for March came in at 2.4% YoY (1-month annualized 2.9%) against headline PCE at 3.5% and core PCE at 3.2%. The April CPI data complicates that read materially.
One month of bad inflation news would not generally change the narrative. What stands out with April is the breadth. Cleveland median and 16% trimmed-mean both rose 0.4% m/m, double the March pace and running at roughly a 5% annualized rate. The whole point of those measures is to exclude the largest moves at both tails of the distribution. When they jump in lockstep with the headline, the problem is no longer narrow. The middle of the price-change distribution moved higher in April. That is the signal that the energy and tariff impulse is spilling into the broader basket. This is precisely the measurement issue Warsh raised in his confirmation testimony, and the very measures he chose to highlight then turned higher in the first print he will have to address. The May 28 PCE release will be the first read on whether the breadth signal carries into the FOMC’s preferred index. The Dallas trimmed-mean reading for April will be the single data point to watch.
We continue to believe the bulk of the April move reflects pass-through from energy and from trade-services margins, rather than a broad re-acceleration driven by wages or demand. Three reasons. First, the labor market is not generating wage pressure consistent with sustained services inflation; AHE at 3.6% YoY is roughly consistent with the underlying trend in productivity growth. Second, longer-run inflation expectations remain reasonably anchored. The NY Fed three-year and five-year measures held at 3.1% and 3.0% in April, and the five-year forward TIPS breakeven sits near 2.1%. Third, the small-business data shows firms absorbing costs rather than passing them through cleanly. That brings us back to the PPI.
The April PPI’s 1.4% monthly gain, the largest since March 2022, alongside the 6.0% year-over-year rate, is the producer-pipeline signal. The composition is more revealing than the headline. Services PPI rose 1.2%, with two-thirds of that move coming from trade services, the wholesale and retail margin component. Producer prices at 6.0% YoY against headline CPI at 3.8% is as clean a measure of margin compression as we get. Pricing power has narrowed for firms without a clear productivity story. The Q1 net profit margin record of 13.4% disguises meaningful dispersion underneath, and the second derivative is moving in the wrong direction for firms whose costs are rising faster than their ability to raise prices. The Q1 Duke-Richmond Fed CFO Survey corroborates at the larger-firm level: tariffs the top concern for the fifth consecutive quarter, median own-product price expectation at 3.5% for 2026, lower expected employment and unit cost growth than the prior quarter. The Q1 NFIB data tell the same story at the small-business level. Sustained at current input costs through Q3, this becomes a hiring and capital investment constraint. The ISM Manufacturing Employment Index at 46.4 is already telling us that.
The implication is that April is more likely to give way to margin compression and slower hiring than to broad final-price acceleration, particularly if energy normalizes on our base-case timeline. But the path is not as clean as it was through March. The April readings narrow the room for cuts. We continue to expect one quarter-point cut in September if war risk subsides and the trimmed measures return to softer monthly readings. A second cut in December remains possible but only if the labor market weakens more materially than our forecast assumes. If the May CPI release does not show median and trimmed-mean measures returning to the 0.2 to 0.3 percent range, the September timetable shifts later this year, into next year, or off the table altogether.
Markets and Financial Conditions
The 10-Year at 4.60% and the Mortgage Spread Story
The 10-Year Treasury closed Friday at 4.60%, the highest since January 2025 and roughly 15 basis points higher than where it sat at the time of our April 26 weekly. The 30-Year cleared 5% for the first time since 2024 and closed at 5.12%. The 2-Year traded near 3.88% at mid-month, leaving the curve bear-steepened by roughly 72 basis points. Tuesday’s $52 billion 10-Year auction cleared at 4.468%, replacing $28 billion of notes issued in May 2016 at 1.71%, a textbook illustration of the term-premium and supply story that is becoming harder for the bond market to absorb. The bond market has effectively ruled out a Fed cut through 2026 and is pricing better than a 1-in-3 chance of a hike before year-end.
The sharp sell-off in the 10-Year acknowledges that the center has shifted in the inflation debate. The broader acceleration in the underlying measures, particularly the breadth signal in the Cleveland median and 16% trimmed-mean CPI, has lifted the hurdle for any near-term cut. The Wall Street Journal editorial board’s pointed view that the Trump administration’s Iran strategy has not produced the rapid resolution markets had hoped for is a real part of the picture. The WSJ has been blunt about the gap between the administration’s framing of the conflict and the reality on the ground. But that is not the whole picture. The larger part is the data. The April CPI and PPI together made the case that the inflation impulse is no longer narrow, and the 10-Year priced that in within 48 hours.
The mortgage market is amplifying the move in ways that matter for the housing sector and for any CFO whose business model depends on housing turnover. The 30-year fixed mortgage rate has pushed to roughly 6.46% from 5.98% on February 26, the day before the Iran war began. Some of that move is the 10-Year. The rest is the MBS spread, which has widened back to its widest level since December, more than offsetting the January spread tightening that had followed the administration’s directive for the GSEs to add $200 billion of MBS to their retained portfolios. Two channels are pulling in the same direction: a higher 10-Year and a wider spread. The combination has unwound the early-2026 mortgage-rate progress in roughly two months and is keeping housing in the cooler-for-longer environment we have been describing since the start of the year.
For corporate borrowers the message is the same as the message for households, in slightly different language. The fixed-rate issuance window is not closed but is no longer improving. Term premium is rebuilding on heavy issuance, fiscal deficits, and a growth picture that may be running structurally above the post-2008 framework. The bond market is pricing the war as a duration risk rather than a flight-to-quality story, which is unusual and worth flagging. The right move is to lock in fixed rates opportunistically rather than wait for the long end to improve.
Equities and the Equity-Bond Gap
Equities continue to take the constructive view. The S&P 500 closed above 7,500 on Thursday on a Cisco-led rally and is on track for a seventh consecutive weekly gain, the longest streak since 2024. Q1 earnings strength has broadened beyond a handful of mega-cap names, and cyclicals tied to power, grid, defense, and reshoring are leading. Caterpillar’s +10% reaction to its Q1 print on April 30 captured the broader read on the industrial complex. Higher rates that reflect stronger growth are different from higher rates that reflect inflation worries, and the current move reads closer to the former. But the gap between the two has narrowed since our April Compass.
The equity-bond gap remains wider than the data justifies in both directions. The bond market’s caution looks well grounded given the April inflation prints. The equity market’s strength looks well grounded given the capital cycle, the Q1 earnings, and the resilient consumer. Both can be right at the same time if the war resolves on the time frame our base case assumes. They cannot both be right if the war stretches into Q3 and the breadth of inflation persists.
Oil and the War Path
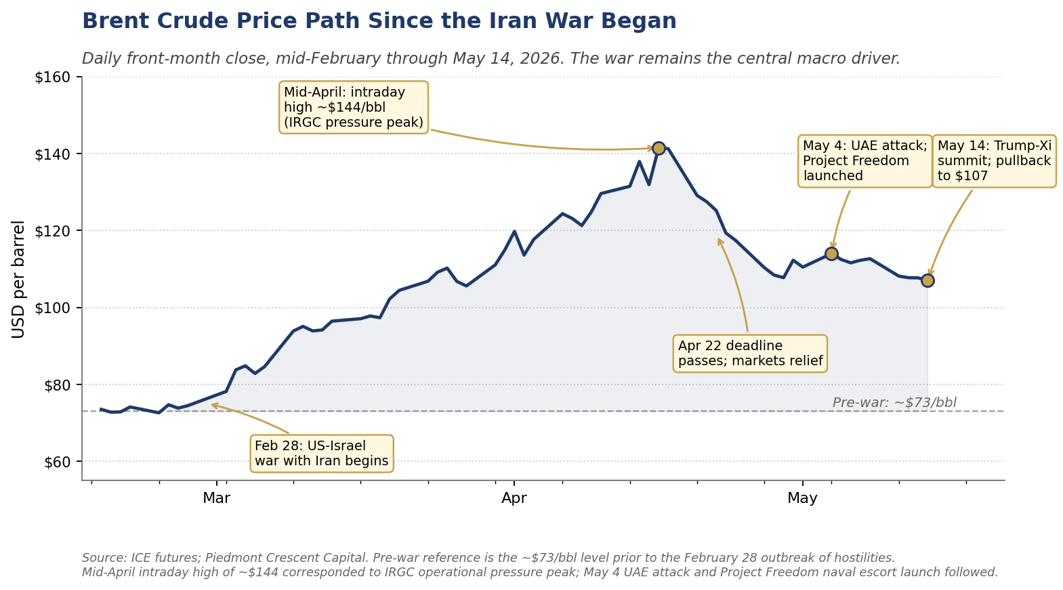
Brent settled near $107 in mid-May, off the May 4 wartime peak above $114 after Iran’s attack on the United Arab Emirates and the launch of Project Freedom. The Strait of Hormuz remains effectively closed. The IEA’s May Oil Market Report characterized cumulative supply losses from Gulf producers since late February at over one billion barrels, with 14 million barrels per day shut in. Saudi Arabia’s production is at its lowest level since 1990. The UAE departed OPEC on May 1 as scheduled. Saudi Aramco CEO Amin Nasser told investors on the company’s Q1 call that even if the Strait reopens today, normalization could extend into 2027.
The Trump-Xi Summit and What It Tells Us About U.S.–China
The Trump-Xi summit on May 14 produced more than the modal expectation and less than the bullish case. The two readouts deserve to be put alongside each other. The White House readout stated that the two sides “agreed that the Strait of Hormuz must remain open to support the free flow of energy” and that Xi “made clear China’s opposition to the militarization of the Strait and any effort to charge a toll for its use,” while expressing interest in purchasing more American oil to reduce China’s dependence on the Strait. Both countries agreed that Iran can never have a nuclear weapon. The U.S. cleared H200 chip shipments to ten Chinese firms. The Trump administration claimed Chinese commitments to purchase up to 200 Boeing aircraft and billions of dollars of U.S. agricultural products. China allowed the resumption of American beef imports at the outset of the summit as a goodwill gesture.
The Chinese readout described the meeting differently. The two sides “agreed to develop a constructive China-U.S. relationship of strategic stability,” and Beijing is treating that as the guiding framework for the next three years and beyond. The Chinese readout was notably quieter on Iran specifically, and Beijing characterized the trade outcomes as “an overall balanced and positive result, which is good news for the people of the two countries and the world.” Xi’s own framing of the moment was more philosophical and arguably more revealing. He invoked the “Thucydides Trap” and called for a new paradigm for great-power relations. He described 2026 as a “historic and landmark year.” He also noted that the international landscape is “chaotic and intertwined” and that the two countries had reached a “new crossroads.” The 43 hours of state visit, lengthy meetings, and a private lunch and tea at Xi’s residence in the Forbidden City compound were themselves the message.
One element of the summit has not yet been widely picked up in the coverage. The Iran war delayed the original meeting, which had been on track for a March bilateral. By the time the two presidents met on May 14, the agenda was operating against a tighter shot clock than either side wanted. The Hormuz language, the H200 clearance, the beef restoration, the Boeing commitments, and the agricultural and crude oil purchase pledges are the deliverables that survived that compression. The war shaping the timing meant the summit could not be the comprehensive reset some had hoped for in late 2025.
Within that constraint, the summit improved the relationship from where it stood a month ago. The most pointed critique we have heard from market participants and from China watchers we respect is that it did no harm, that nothing was lost and not much was gained. There is a particular version of that argument worth engaging with directly: the Chinese commitment to oppose Iran’s nuclear weaponization is “nothing new,” a reiteration of months-old Beijing policy rather than a fresh concession. That reading is technically accurate. China has held that position publicly since the start of the war. But the assessment understates what the summit produced. Doing no harm in the current environment is a low bar that markets had reason to fear could be missed. Moving the U.S.-China relationship forward, even modestly, against the backdrop of an ongoing regional war is constructive in its own right. The Hormuz language gives China a public commitment to point to, which gives Beijing something to lose if Iran tests the open-strait principle. The H200 clearance gives U.S. semiconductor firms an incremental opening in their largest external market. The Boeing and agricultural commitments give U.S. aerospace, ranchers, soybean farmers, and energy producers visibility into the back half of the year. Those are real outcomes.
The broader U.S.-China relationship is evolving and difficult to predict at any single moment in time. Three vectors are worth tracking for CFOs and treasurers in 2026 and beyond. The first is technology and export controls. The H200 clearance is real but narrow (ten firms, not the broader market), and Washington’s posture on advanced chip exports has tightened and loosened several times in the past three years. The direction of travel is unclear. The second vector is trade and tariffs. The current administration has used tariffs as both a revenue tool and a negotiating tool. The IEEPA tariffs have produced more than $100 billion of refunds in Q2 already, and Section 122 authority expires in July. The Q3 USMCA renegotiation and any further bilateral trade language with China sit alongside that backdrop. The third vector is Taiwan.
The Taiwan question sits inside the same evolving picture, and U.S. intentions in the event of a Chinese attempt on Taiwan are themselves moving in ways markets have only recently begun to discount. Xi made the point unambiguously at the summit. Per multiple readouts, he established Taiwan as China’s red line at the outset of the closed-door meeting, calling it “the most important issue in U.S.-China relations” and warning that “handle it well, the relationship holds; handle it badly, the two countries risk collision or conflict.” That is the sharpest language any senior Chinese official has used on Taiwan in the post-COVID period. The strategic ambiguity that has anchored U.S. policy for decades has been tested rhetorically by multiple administrations and is being tested operationally now by the Iran war’s demands on U.S. naval assets. CFOs whose supply chains run through Taiwan, which is most CFOs in technology, autos, and consumer electronics, whether they know it or not, have a Taiwan exposure that does not show up cleanly on a balance sheet. Our job is to help CFOs think through scenarios that materially affect their cost of capital, supply continuity, and hedging posture. The Taiwan question belongs on that list, even if the modal expectation remains continued ambiguity. The fact that 92% of advanced semiconductor production runs through Taiwan and that U.S. semiconductor capacity expansion is still measured in years rather than months means the contingent exposure is large enough to plan against.
The summit is a step forward in a complicated relationship that will continue to shape the macro and corporate-finance landscape for the balance of the decade. It is a modest, real improvement in a difficult environment. The broader trajectory will be determined by data and events still ahead of us.
The Warsh Transition
Powell’s tenure as Chair ended May 15. Warsh cleared Senate Banking on April 29 and will chair the June 17 FOMC meeting. Powell will remain on the Board of Governors through January 2028, a stabilizing factor for institutional continuity that is still unnerving.
Warsh’s framework, as laid out in confirmation testimony and subsequent commentary, rests on several core ideas: policy restrictive until inflation is anchored, continued balance sheet normalization, stronger price discovery, and explicit recognition of Treasury-Fed interdependence given the scale of current fiscal deficits. The most underappreciated element is his structural optimism about productivity. He has argued that AI is materially boosting the supply side and that the Fed needs additional work to assess the productivity boom in real time. A central banker who believes potential output is rising should, in principle, tolerate higher measured growth without raising rates. The implication is that the gap between Warsh’s stance and Powell’s may be narrower than markets are currently pricing, particularly if the labor market stays in its low-hire, low-fire equilibrium.
Warsh has also been a sharp critic of how the Fed measures inflation. He has called core PCE “a rough swag” and pointed to the Cleveland median CPI and Dallas trimmed-mean PCE as better filters. The April uptick in those very measures will sharpen the question of what the Fed is targeting in the early Warsh months. Our base case is a patient Warsh Fed through June, followed by a 25 basis-point cut in September if the war risk subsides and the trimmed measures return to a softer trend.
CFO & Treasurer Corner: What This Means for Corporate Finance
Looking Ahead
| Day | Release / Event | Why It Matters |
|---|---|---|
| Mon May 18 | NAHB Housing Market Index | Signals whether higher long rates are weighing further on residential investment. With the 30-year fixed back to 6.46%, NAHB will be the cleanest near-term read. |
| Tue May 19 | Building Permits, Housing Starts (April); EIA weekly | Starts signal whether the spring season has stabilized. EIA inventories are the cleanest read on supply-side math. |
| Wed May 20 | Target earnings; retailer commentary | Target and the wider retail complex will speak to consumer response to higher gasoline. Walmart’s May 14 print suggests the larger consumer is holding. |
| Thu May 21 | Initial jobless claims; Existing home sales; Philly Fed; LEI; Nvidia earnings (after close) | Philly Fed is the second regional manufacturing read after the four-year-high Empire State print. Nvidia’s data-center commentary, particularly on China re-access following H200 clearance, is the most important earnings release of Q2. |
| Fri May 22 | New home sales (April); May flash PMIs; FOMC May minutes (Wed) | Flash PMIs are the first May read on whether capital-cycle momentum is sustaining. May FOMC minutes will be parsed for the depth of the dissent on the easing bias. |
| Wed May 28 | April PCE release | The April PCE deflator and the Dallas trimmed-mean PCE for April are the cleanest test of whether the CPI breadth signal carries into the FOMC’s preferred index. |
The interpretation will matter more than the headlines. The capital-cycle thesis has been validated by GDPNow, ISM, the strong April industrial production print, the four-year-high Empire State reading, and Q1 earnings. The labor market is in equilibrium. The underlying-inflation question is now the live one. A return to 0.2 to 0.3% monthly readings in median and trimmed-mean CPI would restore the disinflation comfort. A second consecutive 0.4% print requires a more material revision. The April PCE release on May 28 is the cleanest single test.
Scenario Framework
| Scenario | Macro and Market Implications | Corporate Finance Action |
|---|---|---|
| Base Case (50%) | Outline agreement on Iran by late May or early June; Hormuz reopens by mid-summer; Brent retraces toward $80 by year-end. Capital cycle drives Q2 and Q3 GDP at 2.5 to 3.0%. Labor market stays in low-hire, low-fire equilibrium with unemployment at 4.3 to 4.5%. Warsh Fed delivers a 25 bp cut in September, holds in November and December. 10-Year retraces to a 4.30 to 4.60% range. Cleveland median and trimmed-mean CPI return to 0.2 to 0.3% monthly readings by June. | Lock fixed-rate funding opportunistically. Continue capex investment in productivity-enhancing projects. Use any back-up in long rates above 4.70% as an issuance window. Build moderate inventory buffers on energy-sensitive inputs. |
| Upside Case (15%) | Trump-Xi Hormuz language translates into actual Chinese leverage on Tehran; Iran agrees to verifiable concessions by early June; Hormuz reopens faster than expected. Brent returns to a $75 to $80 range by Q3. Capital cycle accelerates. Warsh Fed cuts 50 bp over H2. 10-Year retraces toward 4.25%. | Step up productivity-led capex. Reassess working capital toward growth. Refinancing window opens further. |
| Downside Case (35%) | Negotiations collapse or escalate through Q3; Brent moves to $130-plus. Headline CPI re-accelerates above 4% and median and trimmed-mean CPI hold at 0.4% monthly for a second print. Consumer cracks visibly in lower-income segments. Fed pinned indefinitely with hike odds rising. 10-Year pushes through 4.75% on inflation reacceleration. Credit spreads widen 50 to 100 bp. GDP slows to 1.0 to 1.5% in H2. | Stress-test floating-rate exposure. Build liquidity buffers. Defer non-essential capex. Hedge energy and freight inputs aggressively. Review covenant headroom on leveraged credits. Lengthen working-capital cycles. |
Note on revisions vs. the April 26 weekly
(1) The 2.8% Q2 GDP forecast has been steady for two months; the upside risk from GDPNow at 4.0% is real but not yet adopted. Durables remain a soft spot offsetting strength in capital spending, industrial production, and inventory rebuild. (2) Inflation trajectory revised modestly higher to reflect the April CPI and PPI breadth; March PCE (3.5% headline, 3.2% core, 2.4% Dallas trimmed-mean YoY) was in line with the prior trajectory before the April surprise. (3) Fed path unchanged in direction from April, with one cut in September and a possible second in December, but room for both has narrowed materially given the 10-Year move and the April breadth readings. (4) Brent annual average revised down to $92 from $95 as we increase the probability weight on a mid-summer Hormuz reopening following the Trump-Xi summit. (5) 10-Year forecast revised up to reflect Friday’s close at 4.60% and the term-premium and supply dynamics on display in this week’s auction.
Strategic Takeaway
The capital cycle held the line in April, and the May data has reinforced it. Our forecast sits on the constructive end of the Wall Street consensus, in line with the optimists and well above the bears. GDPNow at 4.0% remains the upside marker. The April inflation prints narrowed the room. Breadth in the Cleveland median and trimmed-mean measures is the development that matters most, while the PPI surge points to margin compression rather than final-price acceleration. The 10-Year at 4.60% is the bond market’s acknowledgment of both points at once. The path to a September cut now runs through softer monthly readings in the May and June trimmed-mean data and the April PCE release on May 28.
The geopolitical picture has shifted from the dangerous one we sketched in the April Compass. The April 22 deadline came and went. Project Freedom is operational. The Trump-Xi summit produced the strongest joint Hormuz language to date, real deliverables on Boeing and U.S. agricultural purchases, and an improved bilateral footing. The broader U.S.-China relationship and the Taiwan question both sit inside an evolving and complicated picture that will keep shaping the cost of capital and supply chain calculus for the balance of the decade. Our scenario probabilities have moved back to the April 26 weekly distribution: Base 50%, Upside 15%, Downside 35%. The downside risk remains real because the IRGC has not credibly stood down and the negotiating gap on enriched uranium and the U.S. port blockade remains structural. The trajectory is constructive, not deteriorating.
For CFOs and treasurers, four priorities. Lock fixed-rate funding while the window is open; year-to-date hyperscaler IG issuance has already exceeded all of last year, a reminder that the long end will be crowded for the balance of 2026. Continued capex investment in productivity-enhancing projects; the market is rewarding firms that deliver productivity gains, and the Q1 earnings data validates that allocation. Build the war-escalation downside into Q2 board discussions explicitly. A 35% probability is not a tail risk, and the operational hedge is more durable than the financial hedge. And add the China-Taiwan question to standing scenario work; the post-Trump-Xi-summit picture is modestly better, but the underlying relationship and the contingent Taiwan exposure are evolving in ways that warrant continued attention.