The Employment Situation – Losing Steam with Nowhere Left to Hide
Even Weaker than Lowered Expectations
-
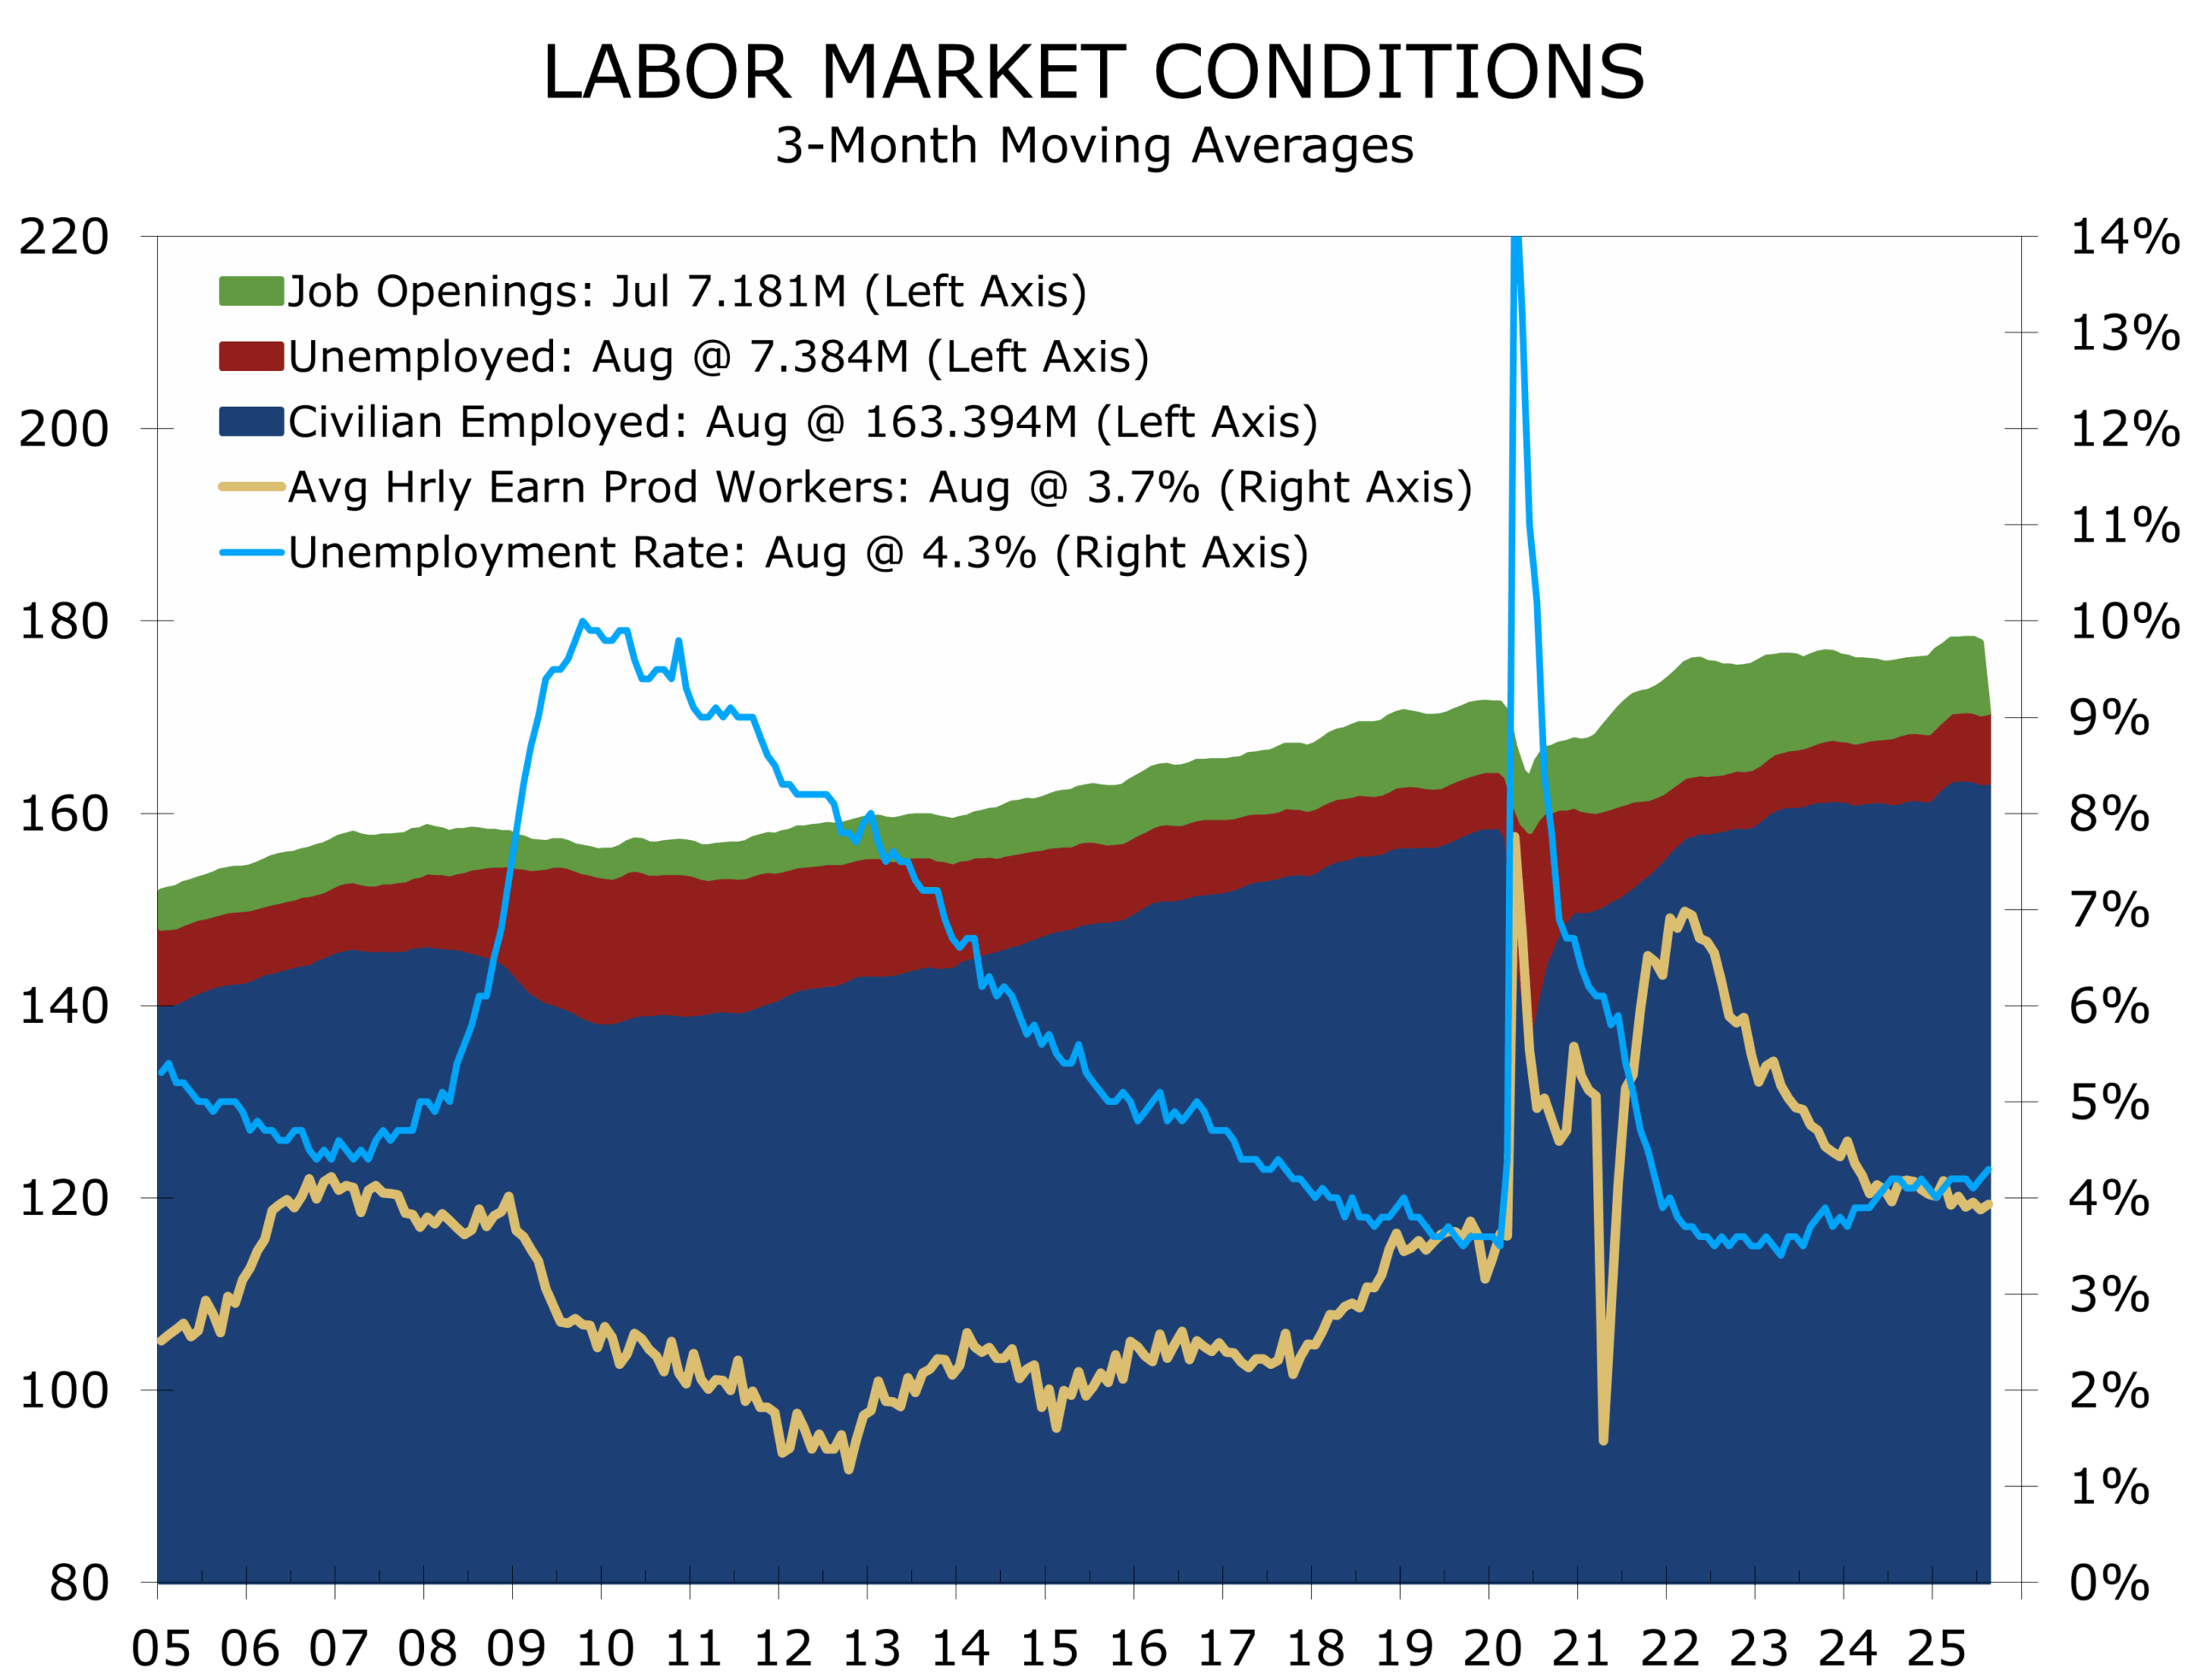
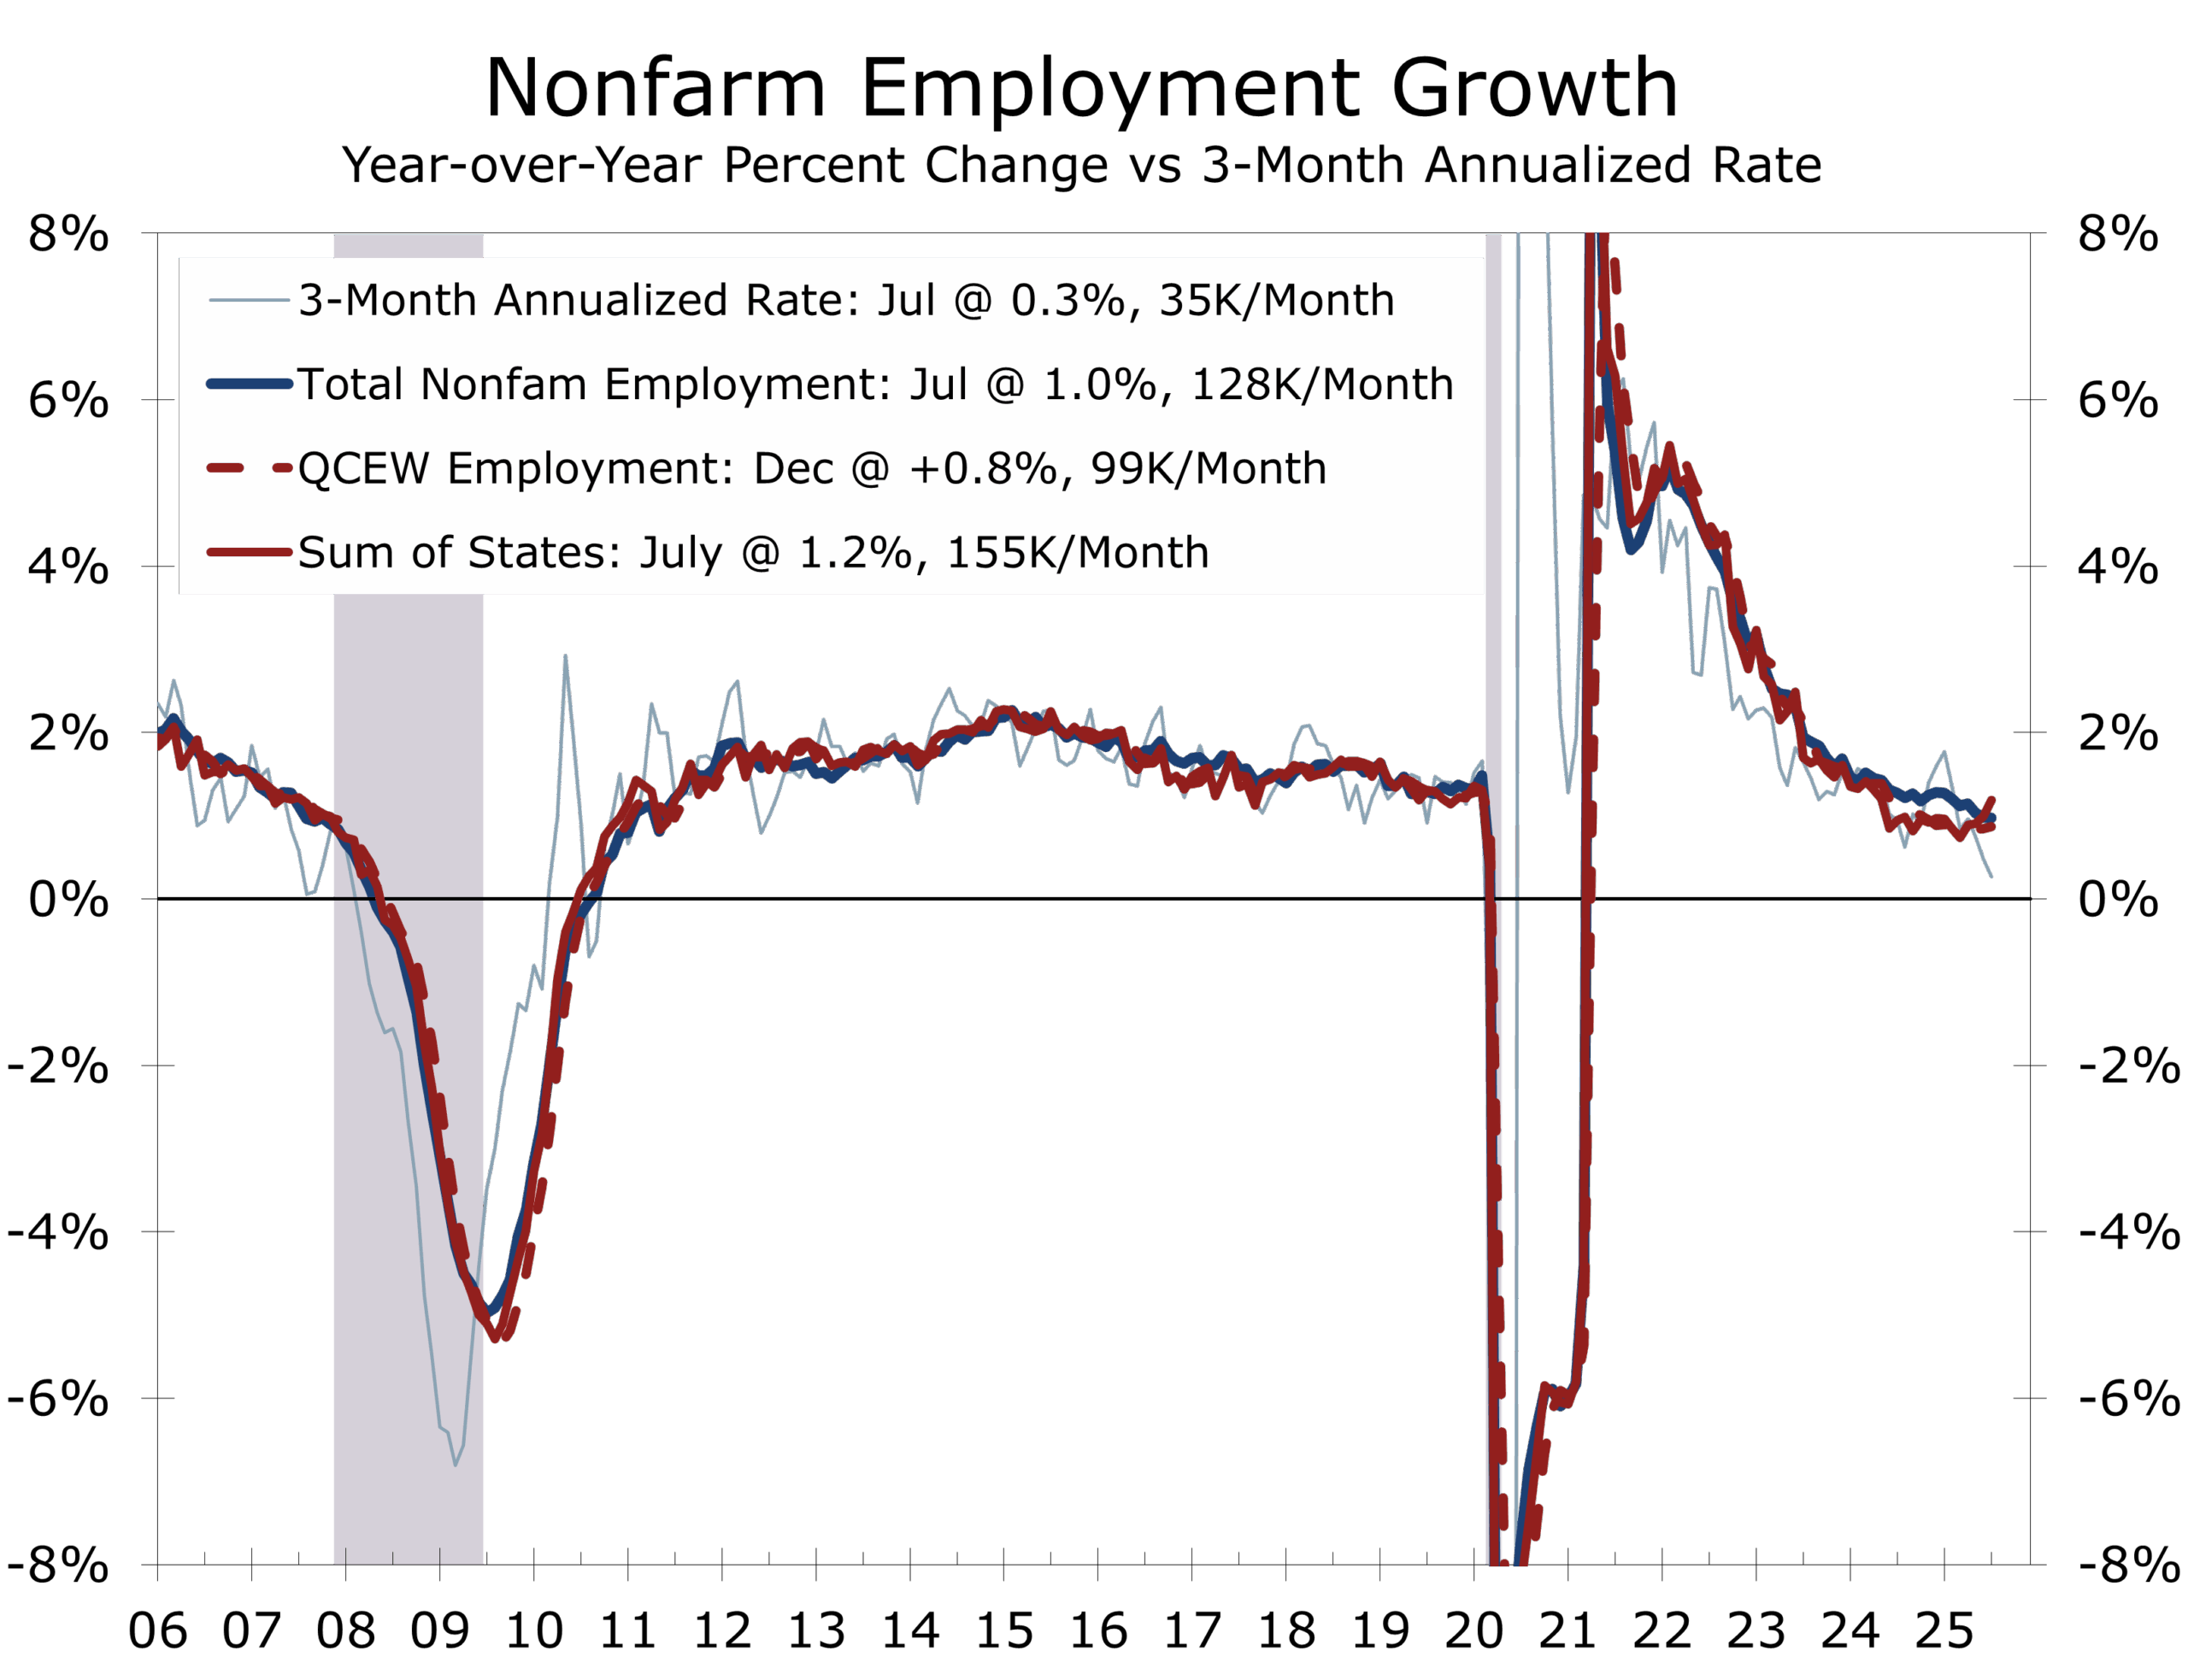
- Nonfarm payrolls rose just 22,000 in August, with downward revisions subtracting 21,000 from prior months. Job growth has averaged only 29,000 over the past three months.
- We had warned that August tends to be a rogue month, with initial estimates coming in inexplicably weak and typically revised higher. We expected a below-consensus 60,000-job gain.
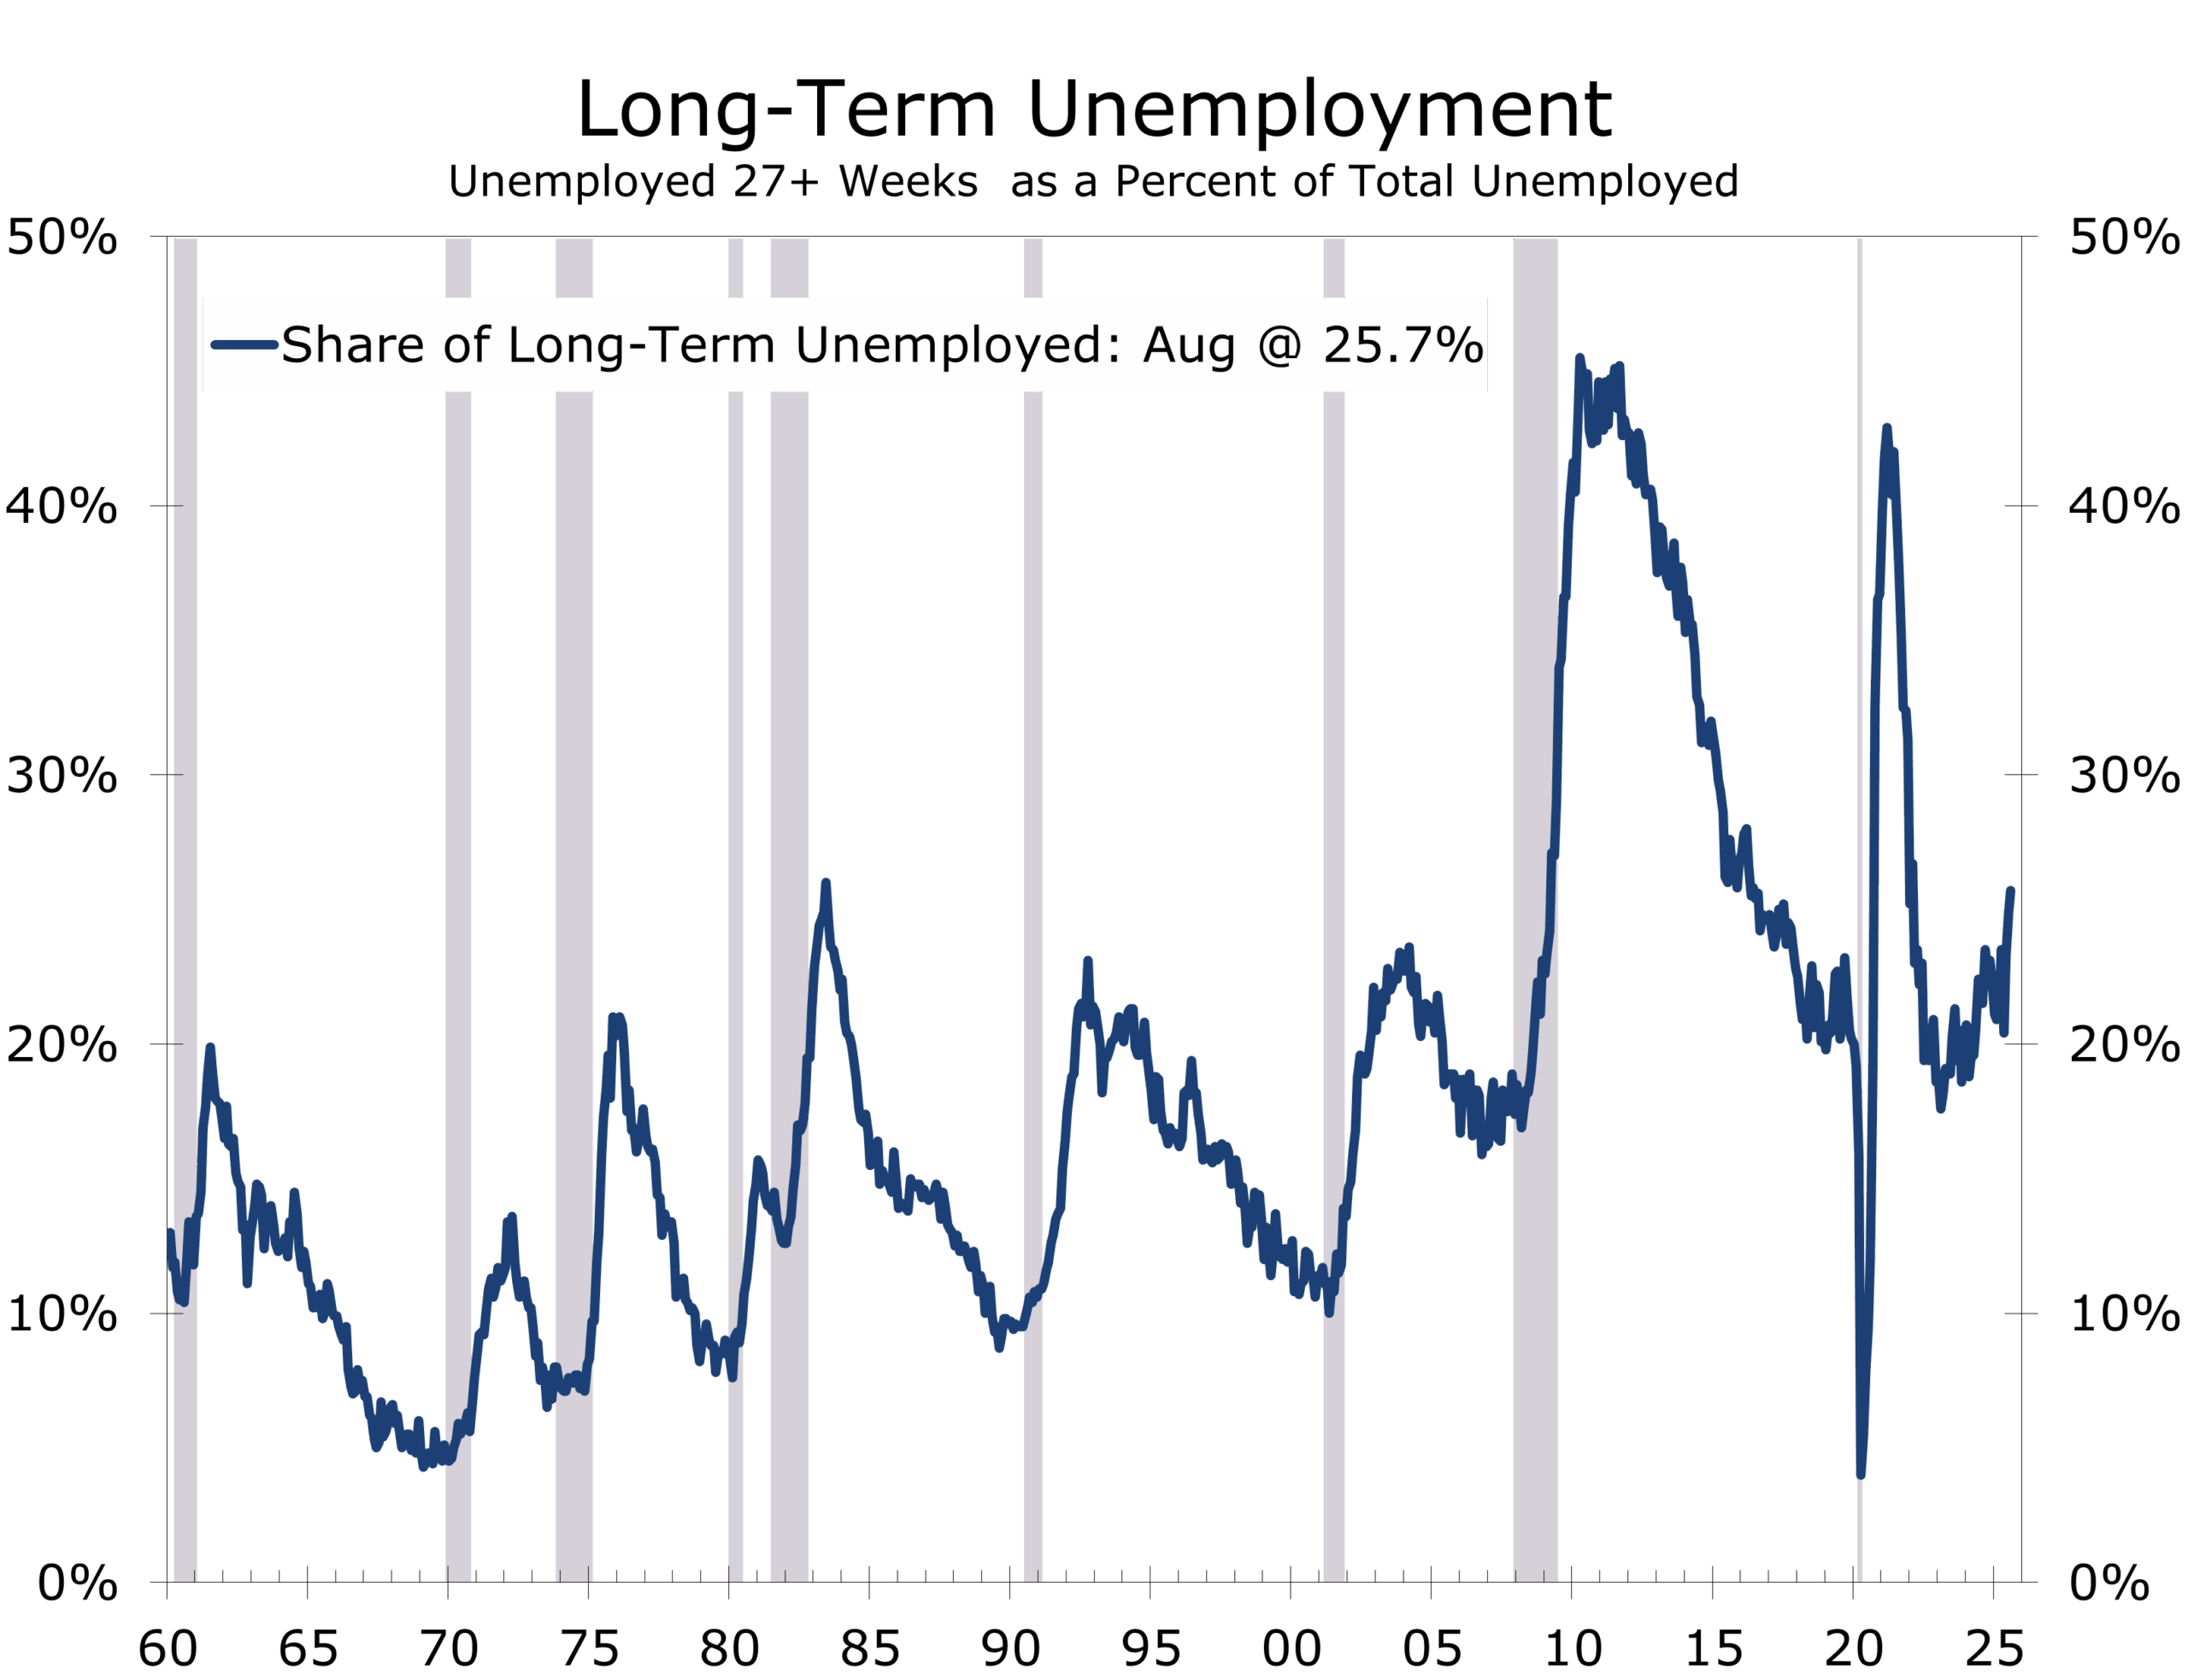
- The unemployment rate rose to 4.3%, its highest since late 2021. Long-term unemployment is elevated, with outsized growth in those jobless for extended periods.
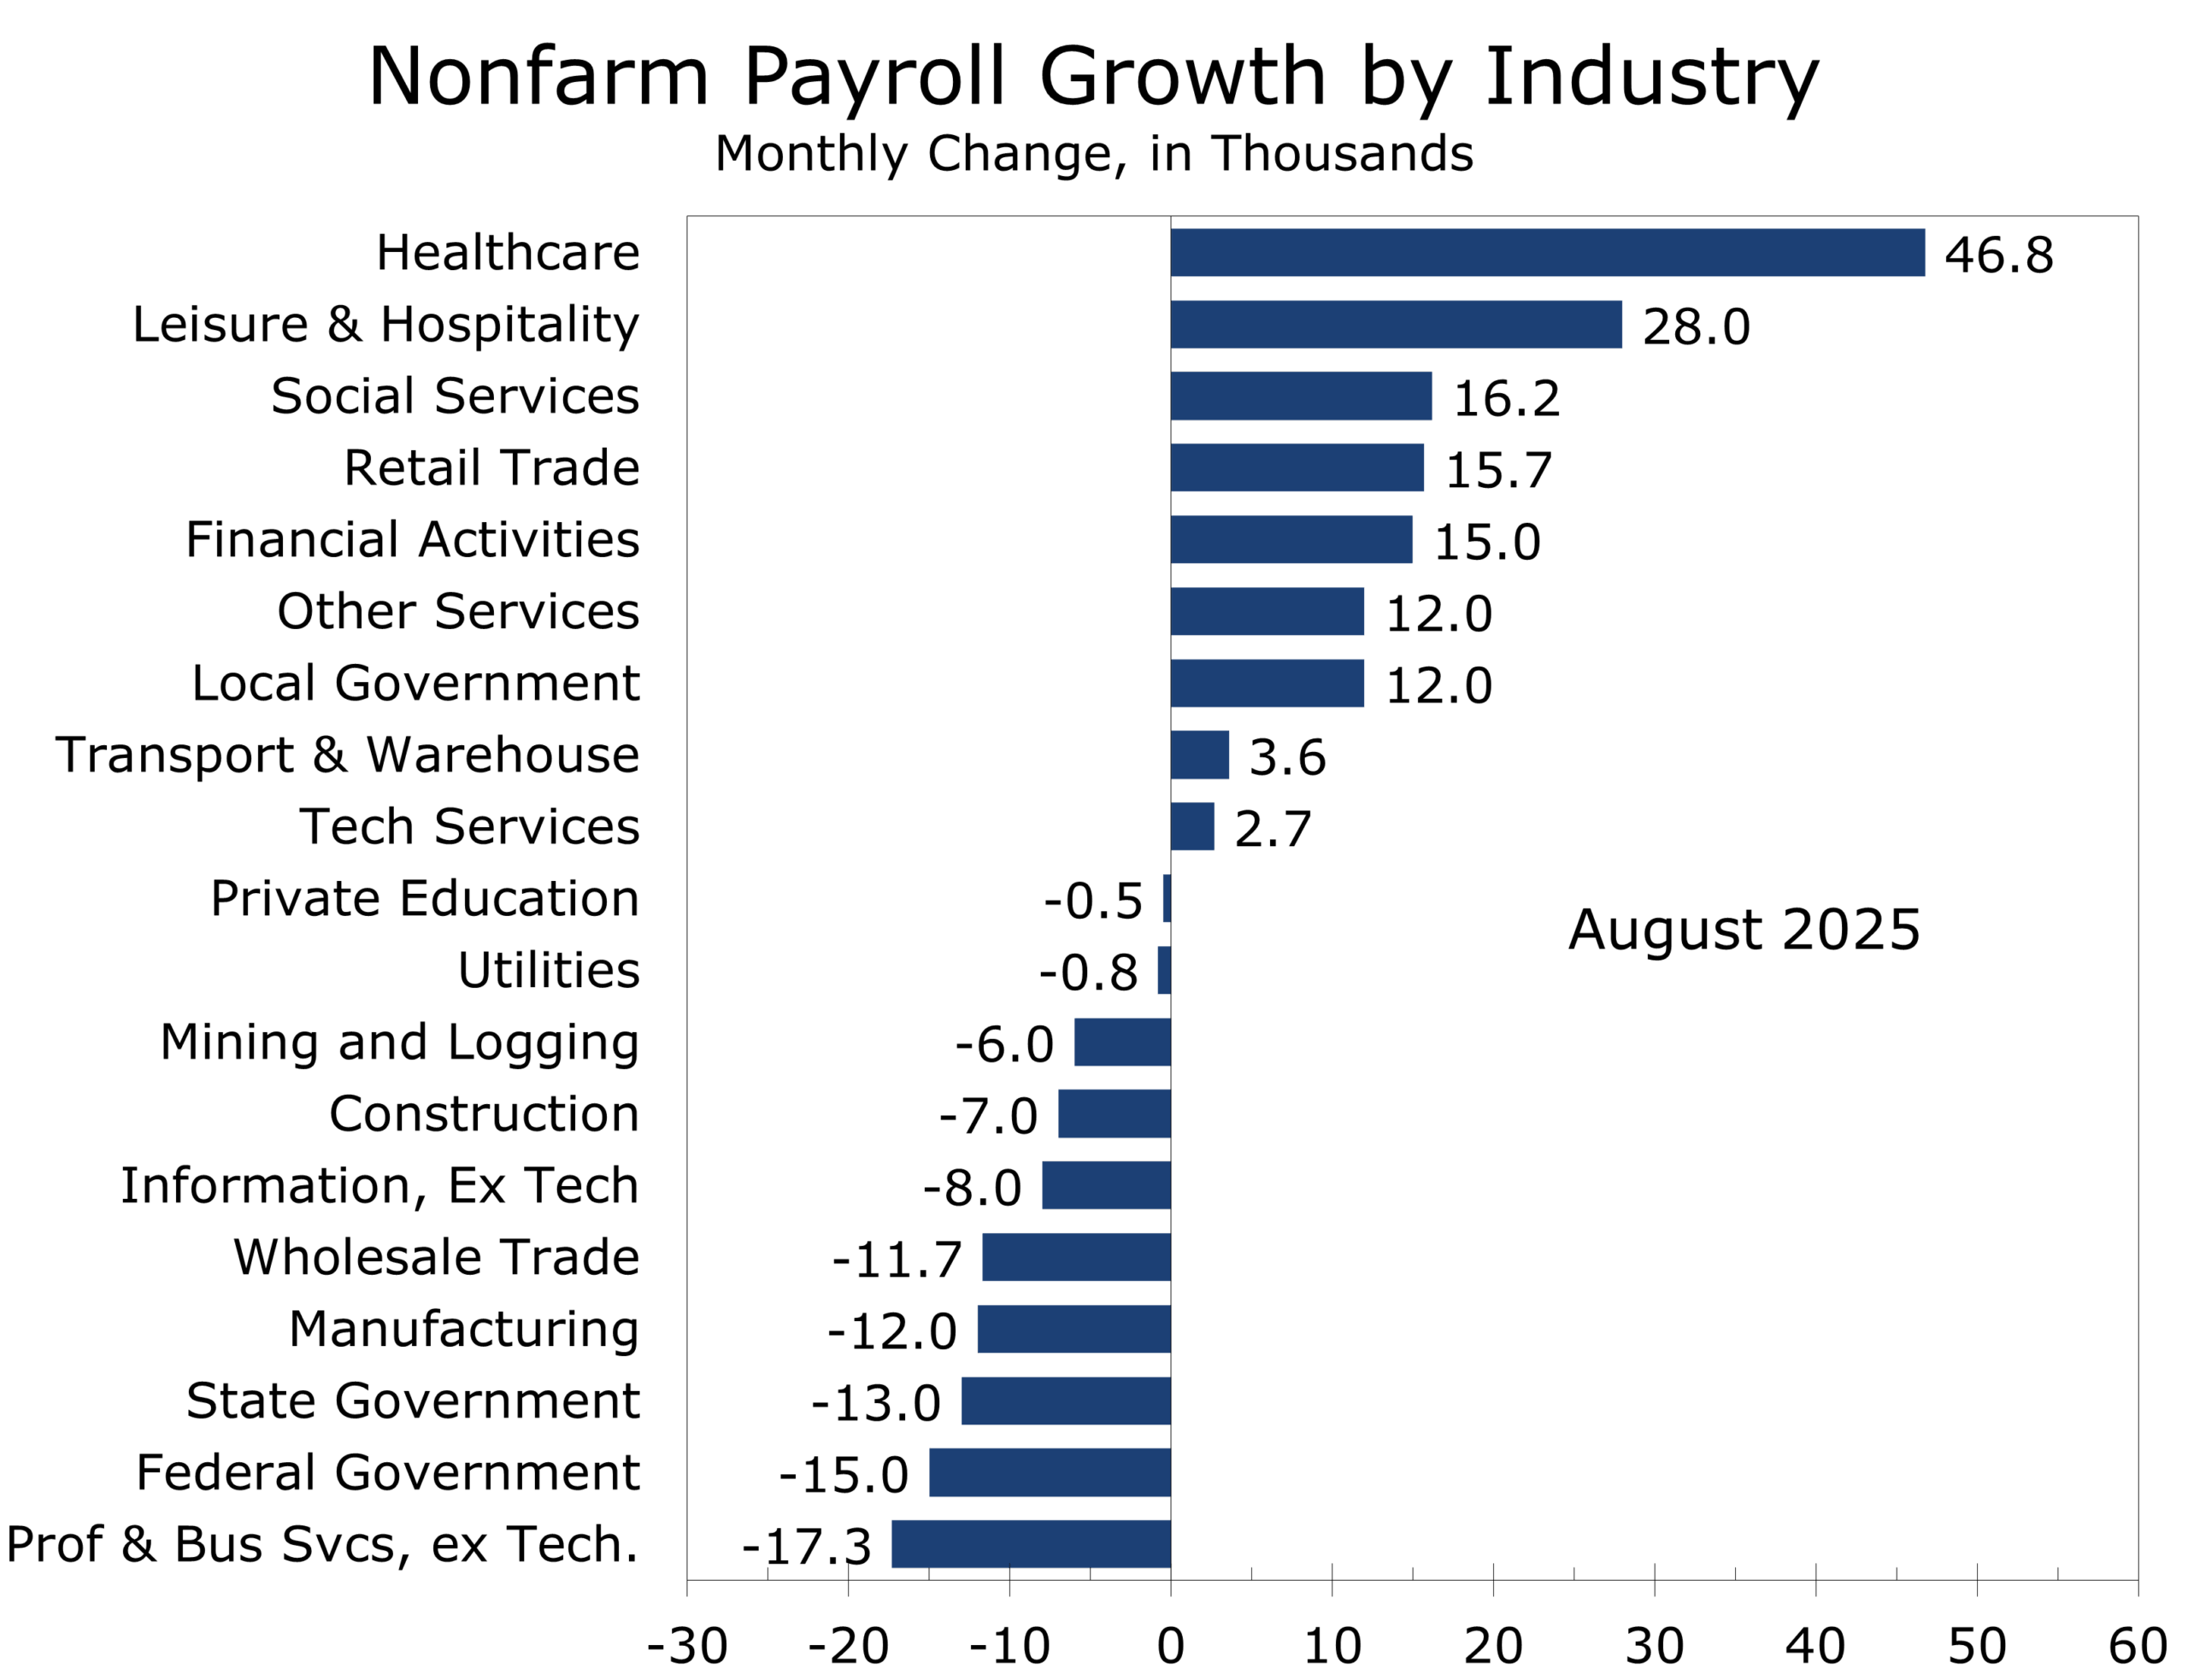
- Health care (+31,000) and social assistance (+16,000) again led job creation, offset by declines in federal employment (–15,000), manufacturing (–12,000), and mining (–6,000). Transportation equipment was held back by strikes (–15,000).
- Household measures remain soft: labor force participation stayed at 62.3%, the employment-population ratio held at 59.6%, and new entrants to the labor force fell.
- Immigration enforcement is slowing labor force growth, limiting supply and muting the signal from a still-low headline unemployment rate. Finding a job is becoming more difficult as job openings fall to pre-pandemic lows.
- Average hourly earnings rose 0.3% (3.7% y/y), while the workweek was steady at 34.2 hours.
- We continue to estimate payrolls are overstated by roughly 30,000 per month, meaning actual job growth since April may be near zero. Benchmark QCEW data, due September 9, will clarify the true trajectory heading into the tariff storm.
The Labor Market Is Losing Steam—with Nowhere Left to Hide
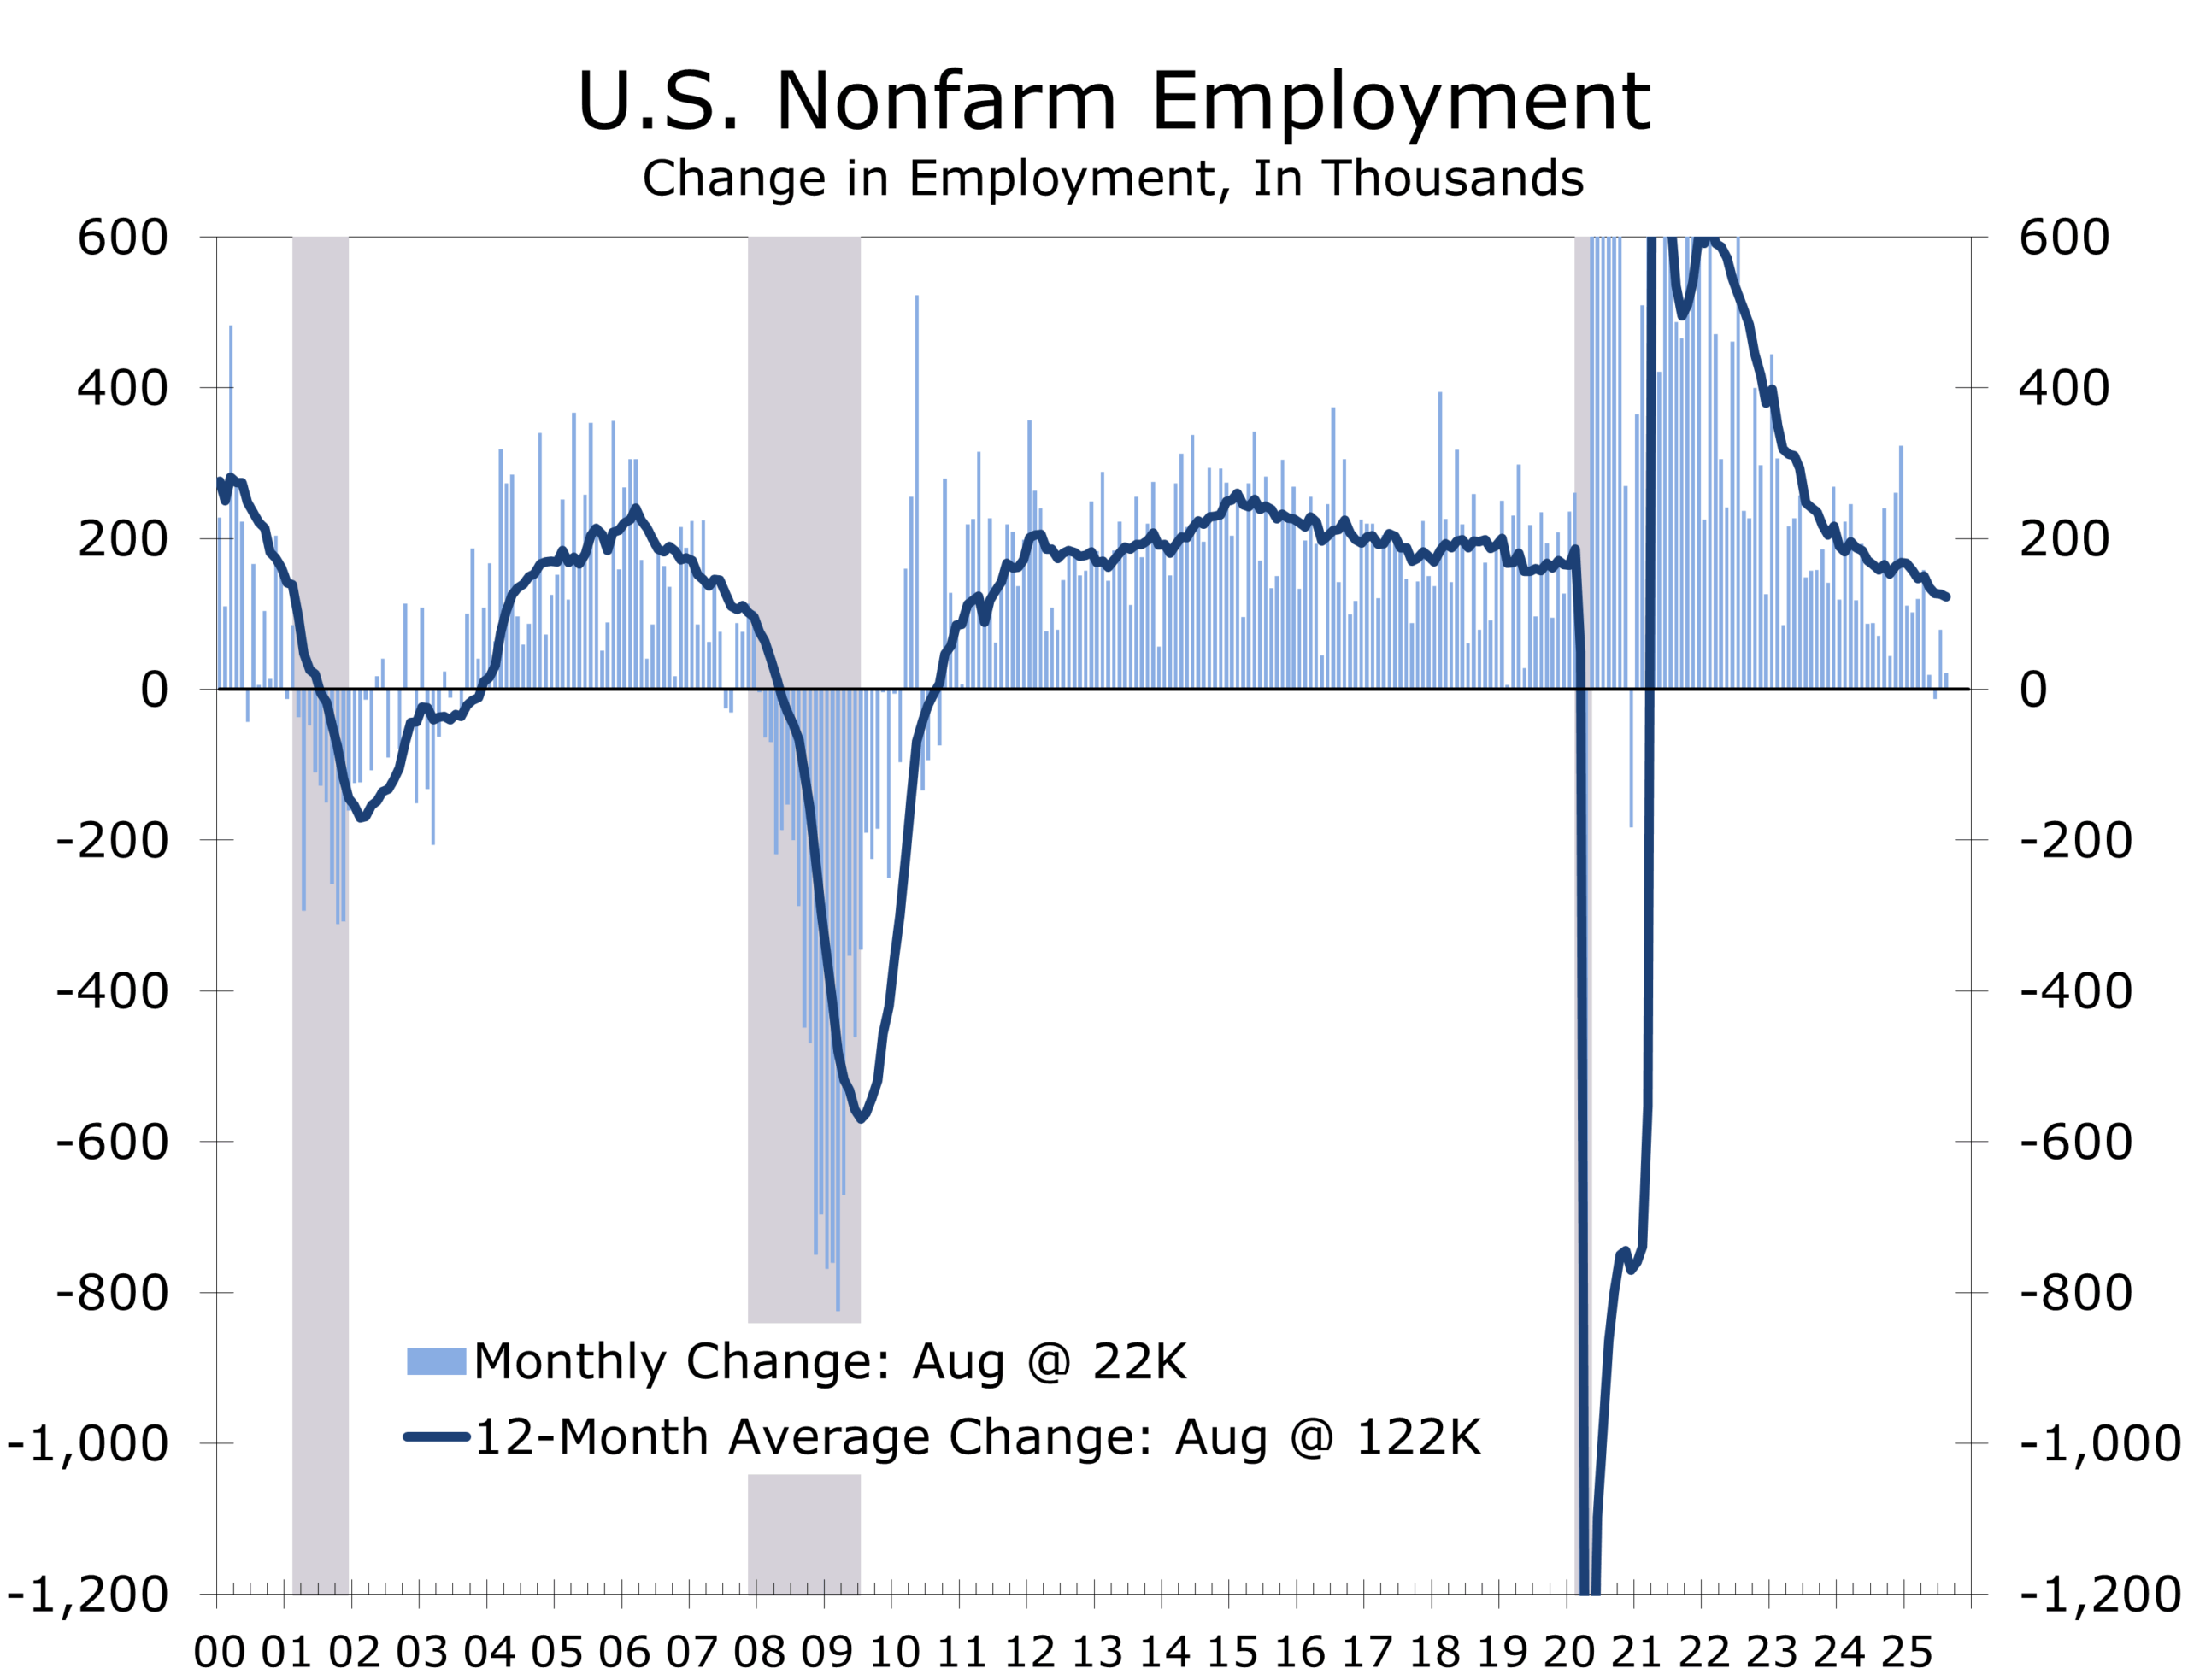
August employment data underscored a slowing labor market. Nonfarm payrolls rose by just 22,000, and revisions to June and July reduced prior gains by 21,000. Over the past three months, job growth has averaged only 29,000—well below the replacement rate needed to keep up with labor force growth.
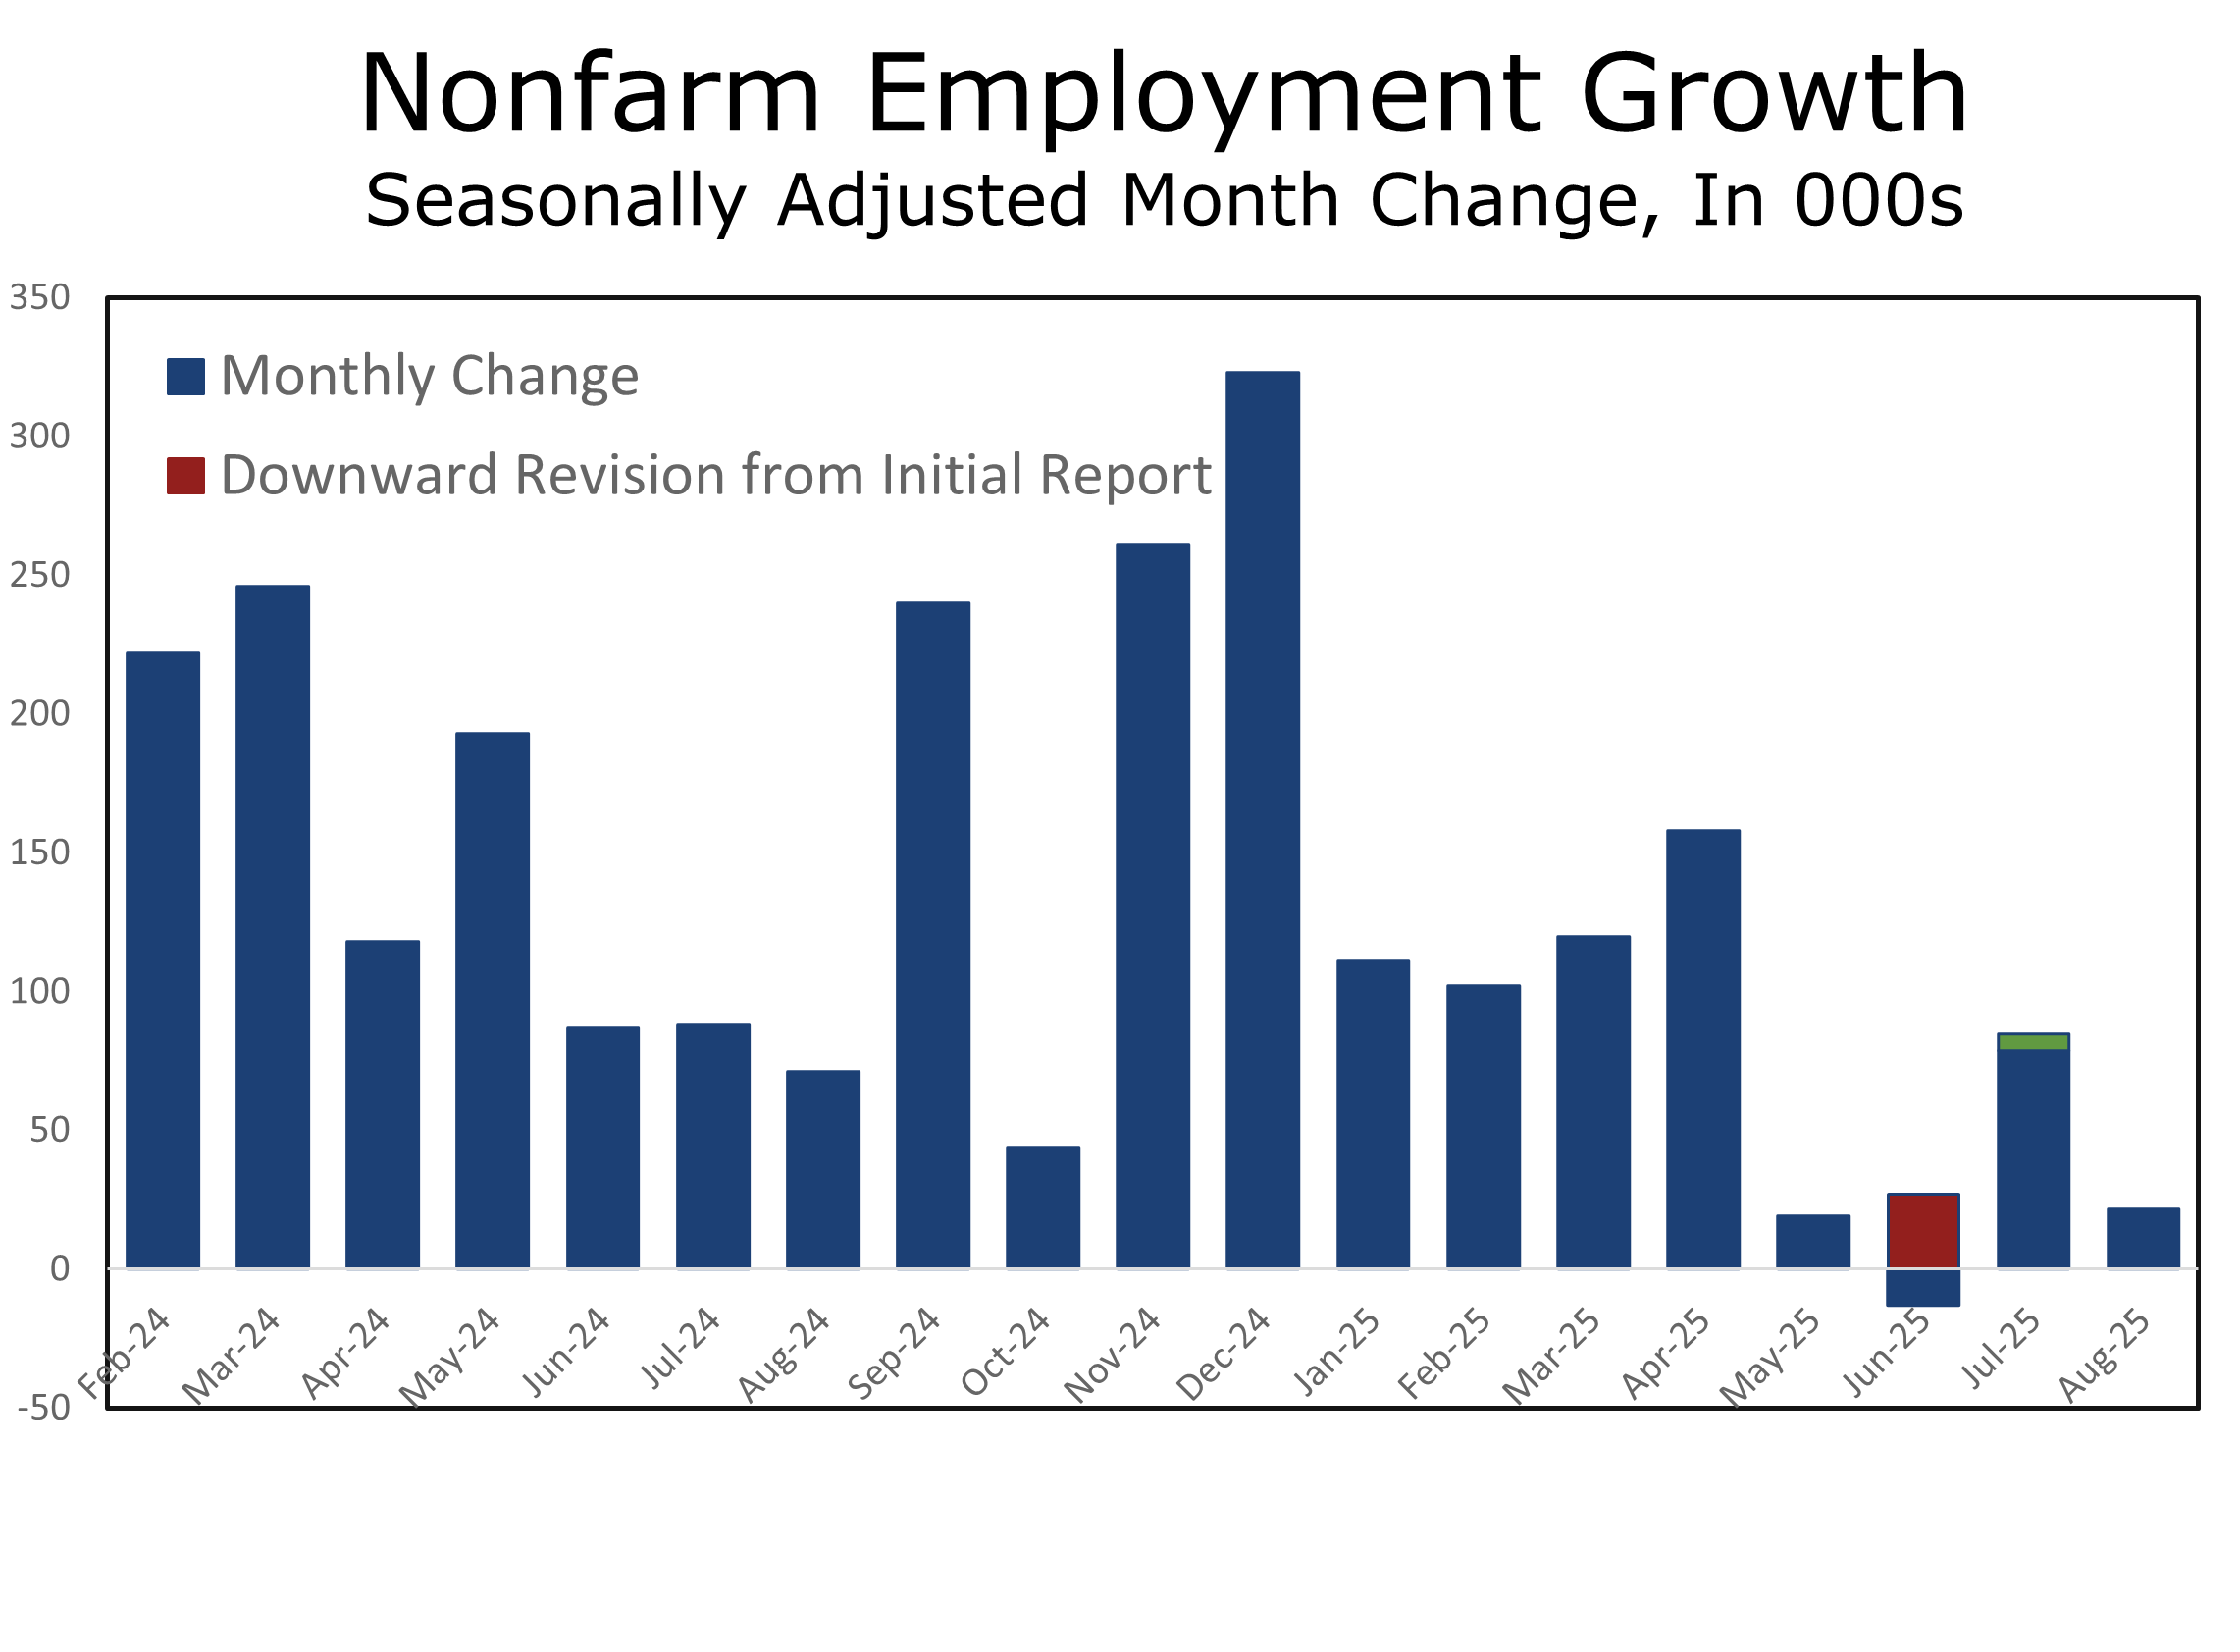
August is notoriously difficult to forecast. It coincides with the start of the school year, but the timing of when universities and public school systems report hiring varies year-to-year. It is also the peak of vacation season, which reduces the survey response rate. These quirks often depress the initial estimate, which is typically revised higher in subsequent months. That is why we had anticipated a below-consensus gain of 60,000 jobs, even before the data confirmed far weaker growth.
August’s first print is notoriously weak—revisions almost always move higher
Hiring continues to be narrowly concentrated. Health care added 31,000 jobs and social assistance added 16,000. Leisure and hospitality also posted a larger gain, adding 28,000 jobs in August. That game is a bit ephemeral, however, as weaker hiring earlier this summer meant there were fewer than usual seasonal separations. Several sectors posted outright job losses, including federal government (–15,000), manufacturing (–12,000), wholesale trade (–12,000), temporary held (-12,000) and mining (–6,000). Within manufacturing transportation equipment dropped 15,000, reflecting strike activity at a major defense contractor. Private sector hiring outside care-related industries remains flat.
.
Unemployment Creeps Higher, With Slack Deeper Than It Appears
The unemployment rate ticked up to 4.3%, the highest since December 2021. Labor force participation rose 0.1 point 62.3% but remains in its recent range and is down 0.4 percentage points from a year ago. The employment-population ratio held at 59.6% and has drifted lower since last summer.
Long-term unemployed now make up more than 1 in 4 jobless workers
Long-term unemployment rose to 1.9 million, accounting for more than a quarter of the unemployed—an unusually high share outside of recessions. Job openings have fallen to their lowest since before the pandemic, making it harder for workers to find new positions. New entrants to the labor force fell by nearly 200,000 in August, highlighting the fragility of supply.
Tighter immigration enforcement is compounding these pressures. Slower inflows of workers are constraining labor force growth, making the headline unemployment rate appear lower than underlying slack would normally justify. Meanwhile, the number of people not in the labor force but wanting a job rose to 6.4 million, up more than 700,000 over the past year.
AI Disruption and Budget Caution Continue to Reshape White-Collar Work
White-collar employment remains soft. Tech-related jobs Hiring also rebounded slightly in technology services, adding 2,700 jobs in August. The gain follows a long string of declines and hiring has been sluggish amidst to rollout and continuous improvement of various AI platforms. Professional and business services show no momentum, as firms curb use of consultants in response to AI-driven productivity, tighter budgets, and slower final demand.
This erosion contrasts with buoyant stock market headlines and points to deeper structural changes rippling through white-collar work.
FOMC Outlook: The Clock Is Ticking
The Fed now has multiple months of evidence showing a labor market that is not collapsing but is clearly losing momentum. Average hourly earnings are up just 3.7% from a year ago, and participation has stalled. The risks of overheating have receded; stagnation is now the larger concern.
Chair Powell has argued the labor market is “in balance,” but the balance appears increasingly fragile—maintained by weakness on both supply and demand sides. Further softness in consumer demand, renewed geopolitical risks, or a cooling housing market could tip that balance quickly.
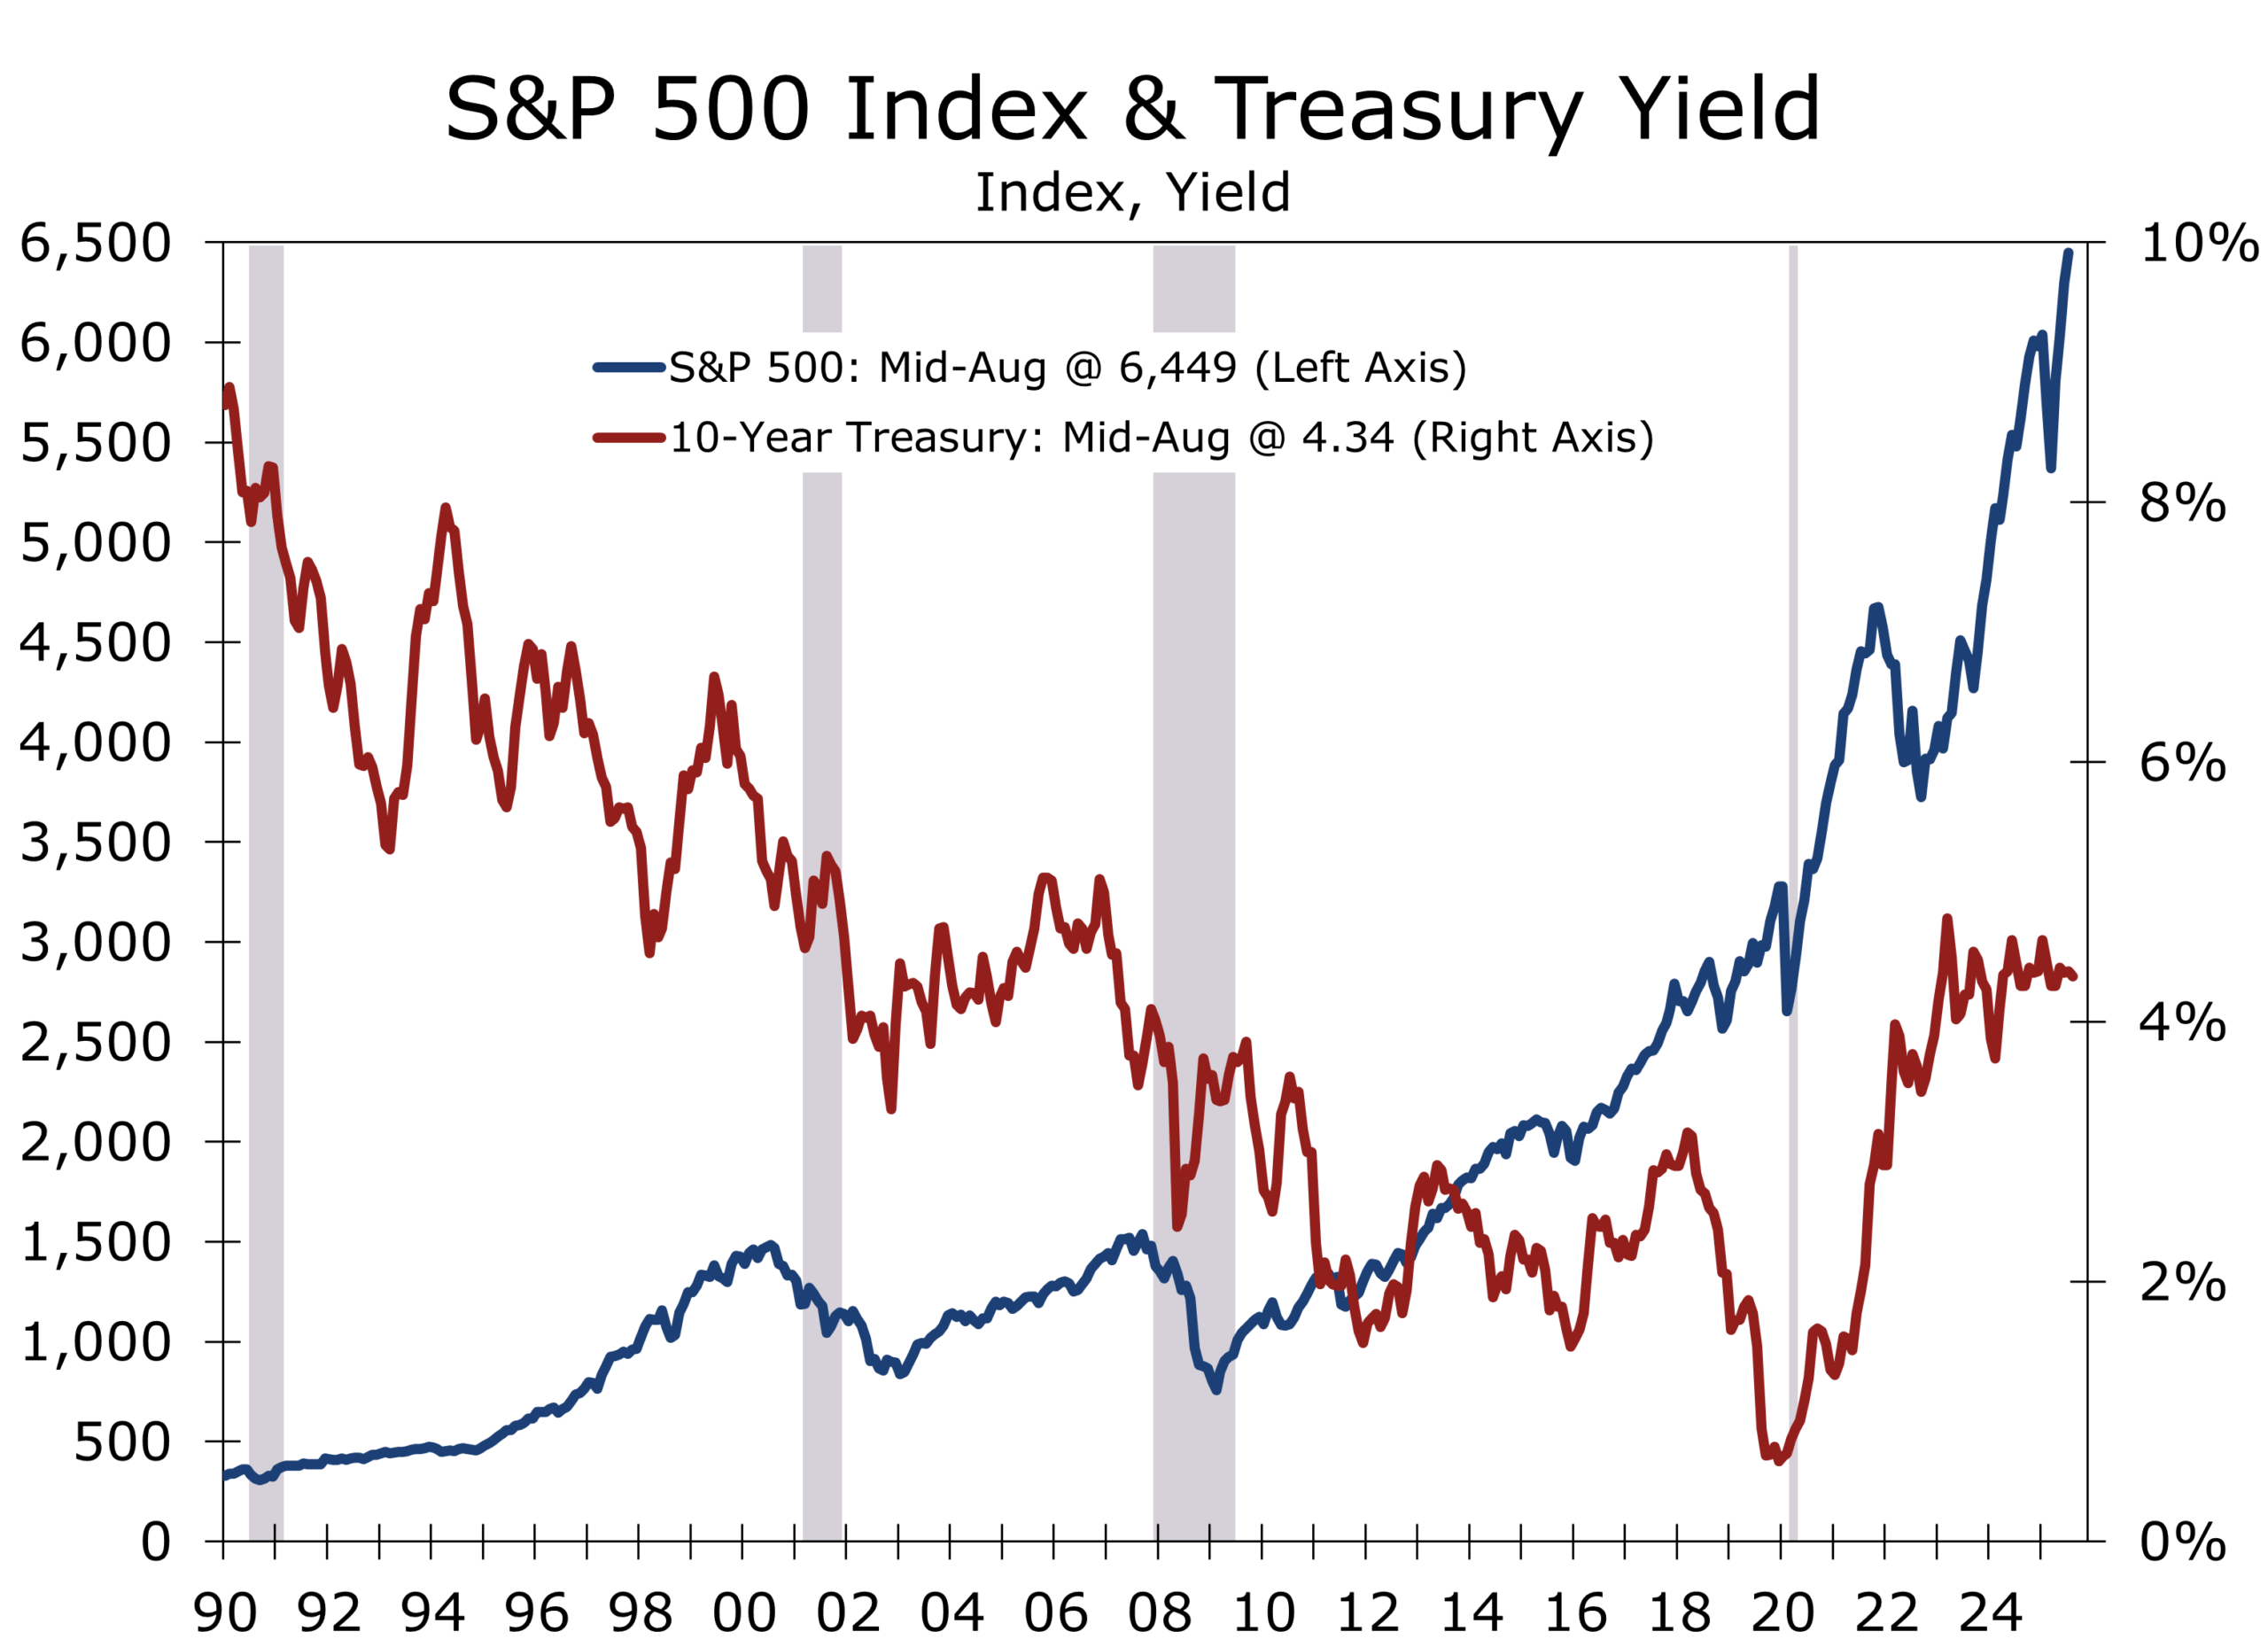
With unemployment edging higher, payroll growth near zero, and immigration limits tightening supply, the case for a September rate cut is strong. Waiting risks losing control of the narrative—and letting stagnation slip into contraction. The financial markets have now also fully priced in a second cut in October, which we believe the Fed will push back on in order to prevent an uptick in the 10-Year Treasury yield and mortgage rates.
Disclaimer: This publication has been prepared for informational purposes only and is not intended as a recommendation offer or solicitation with respect to the purchase or sale of any security or other financial product nor does it constitute investment advice.
September 5, 2025
Mark Vitner, Chief Economist
(704) 458-4000
July Construction Spending: Private Weakness Deepens, Public Sector Holds Firm
Key Takeaways: Construction Spending July 2025
-
- Headline softness: Total construction spending fell 0.1% in July to $2.139T SAAR, the third straight monthly decline. Outlays are -2.8% y/y and -2.2% YTD. Adjusted for input cost inflation, real activity is slipping faster than the headline suggests.
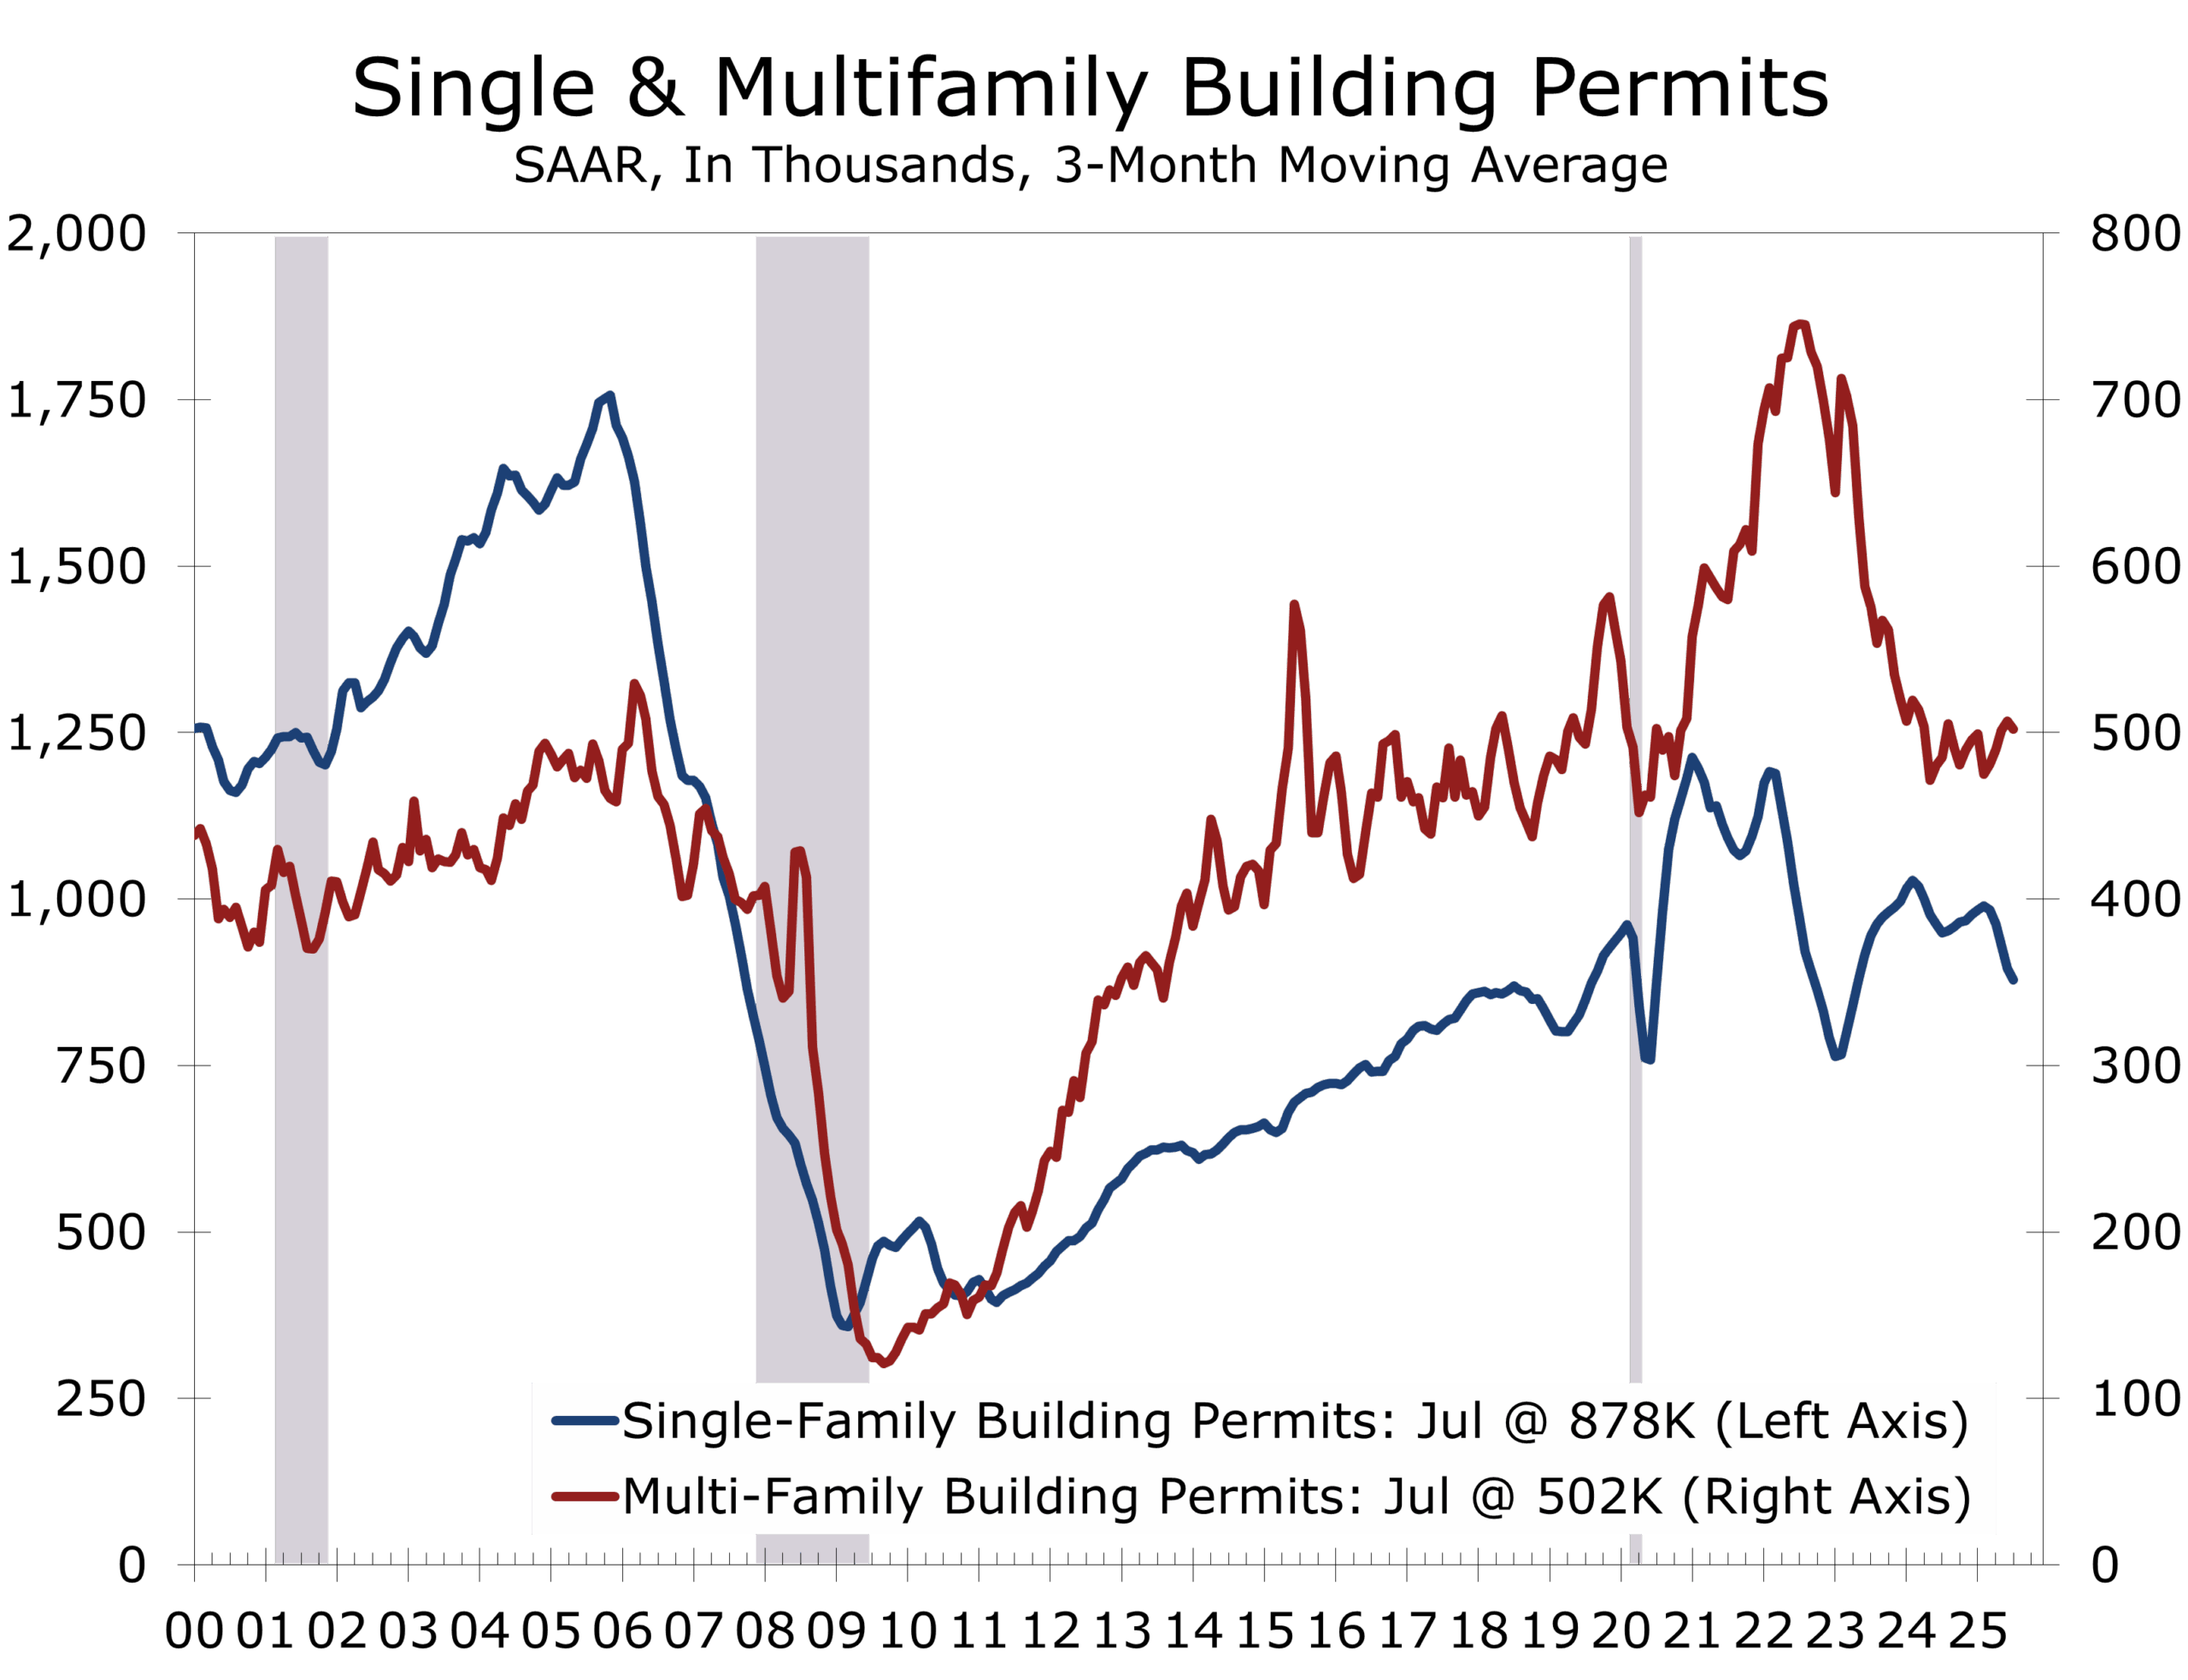
- Residential stabilization short-lived: Private residential rose 0.1% as single-family eked out a small gain while multifamily fell. A solid pipeline provides near-term support, but affordability pressures and weak builder sentiment (NAHB HMI 32 in August) point to renewed softness in Q3.
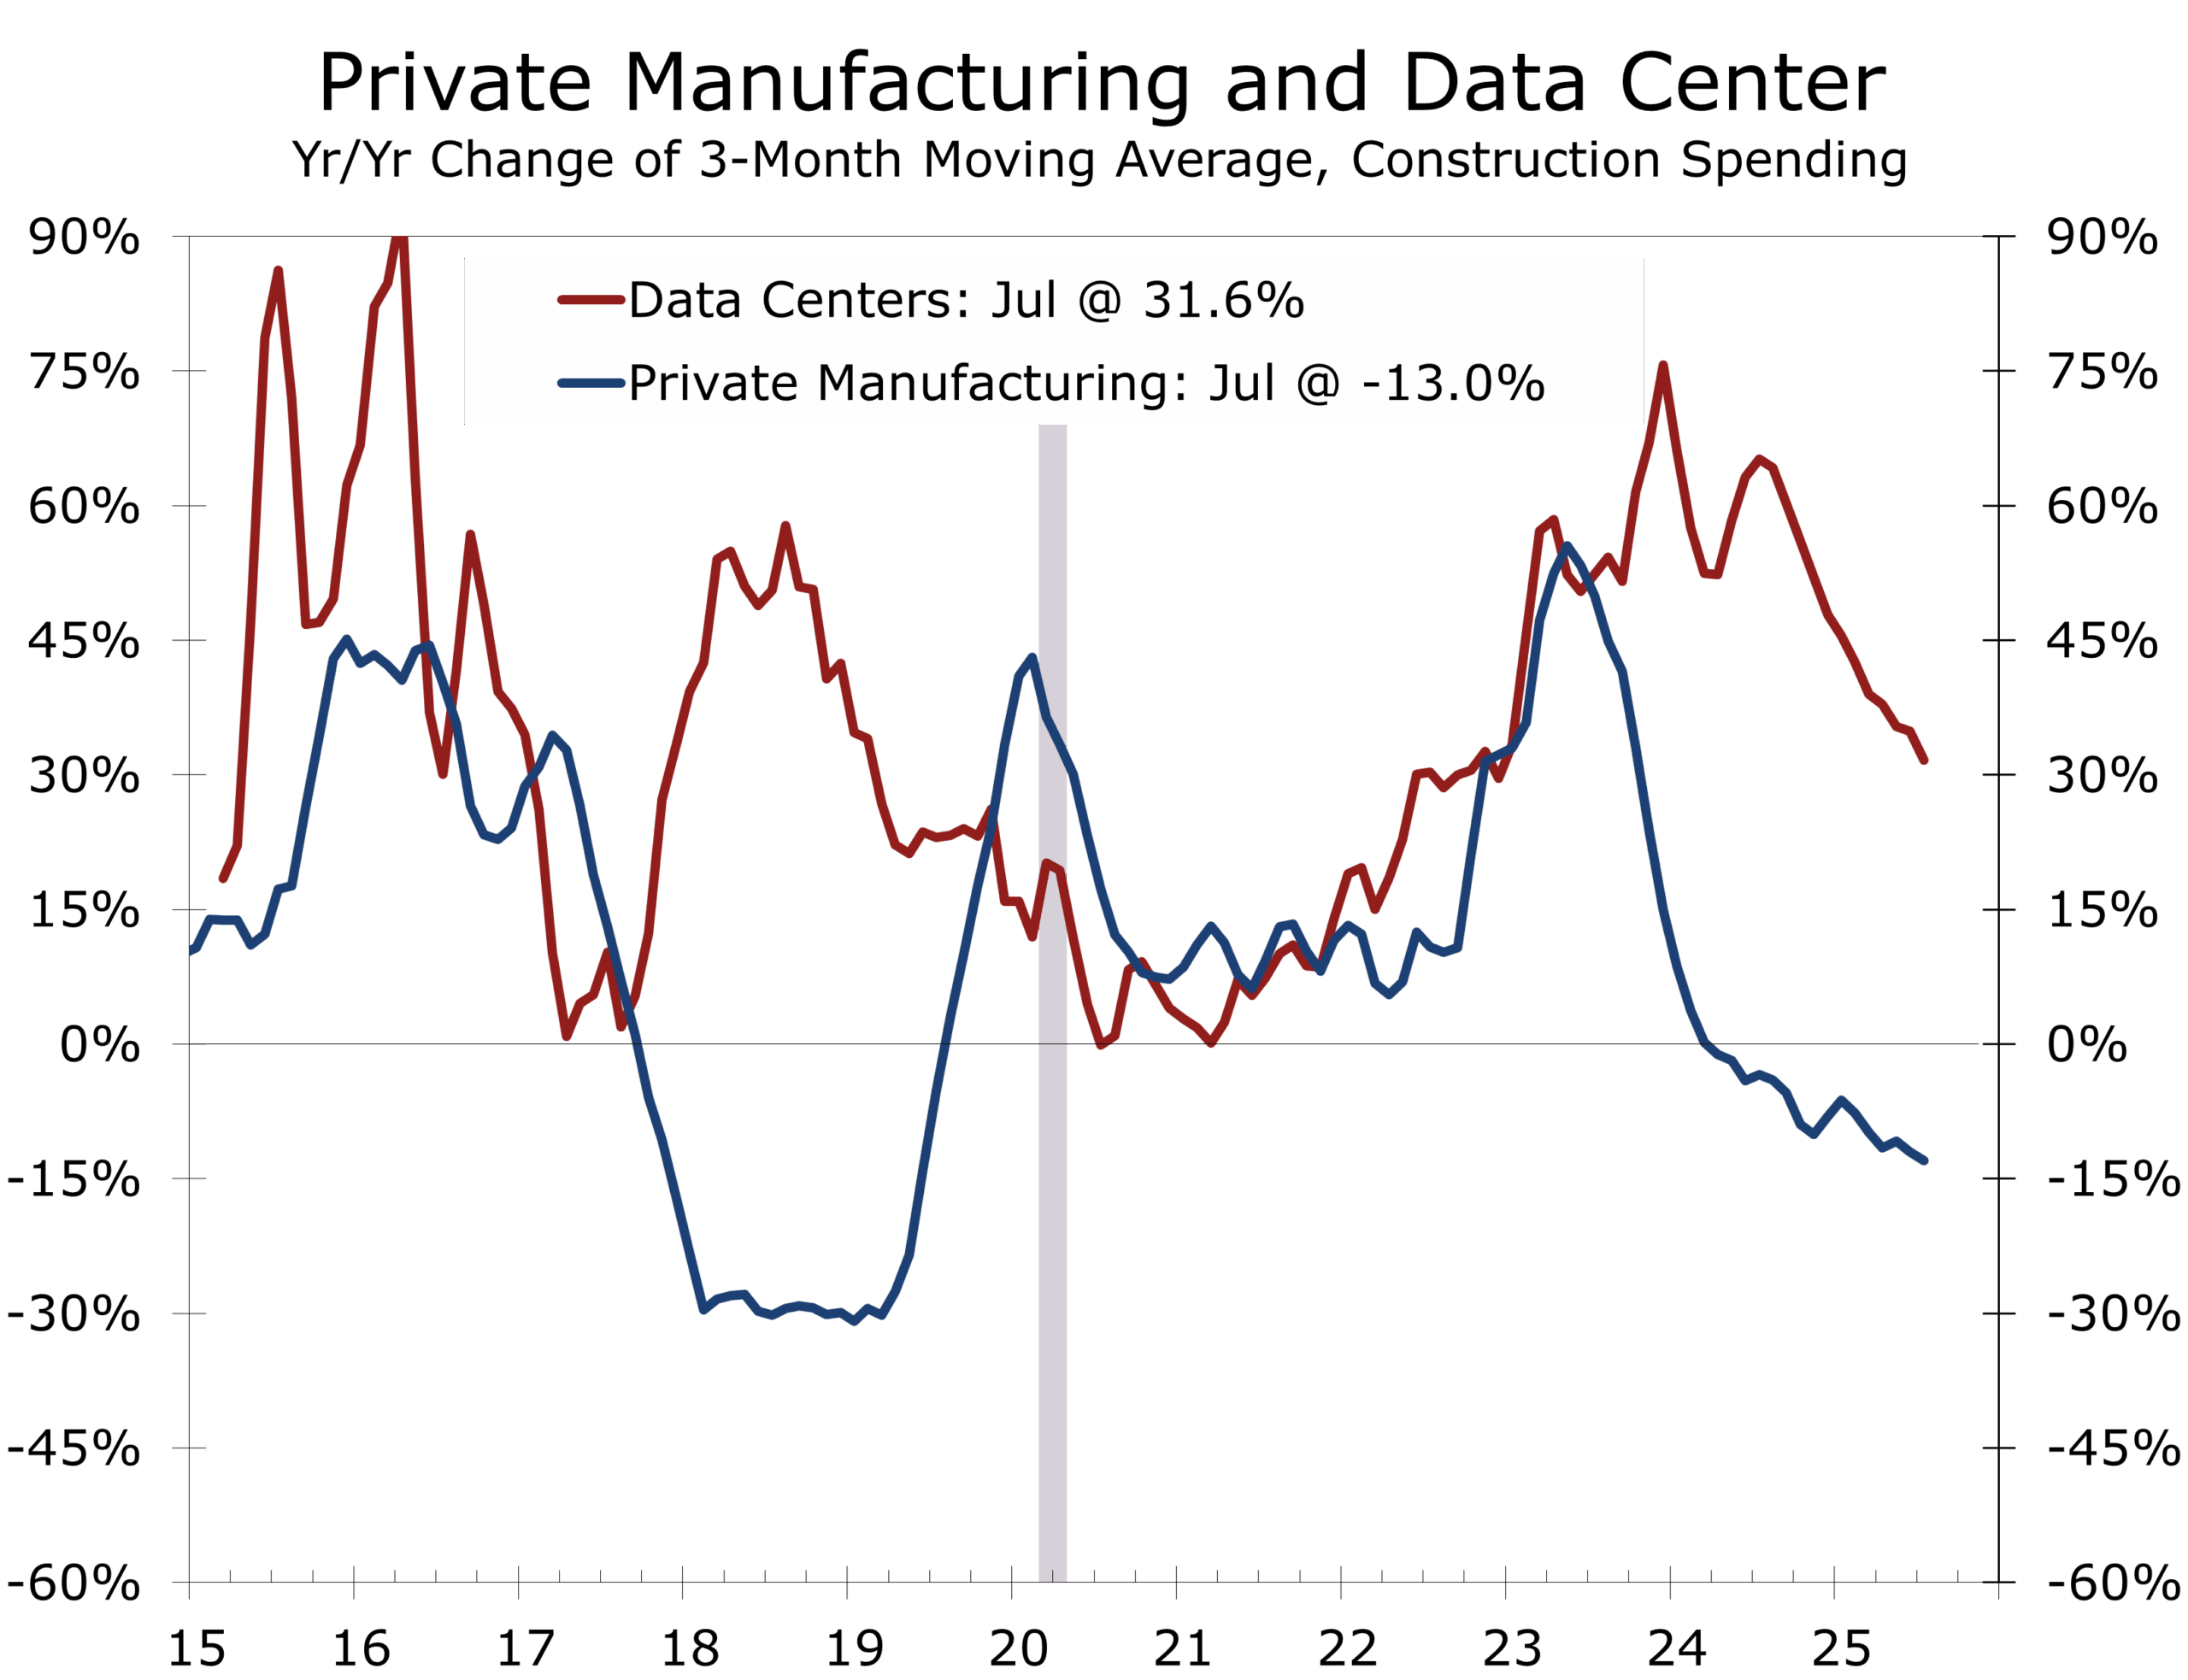
- Nonresidential drag: Private nonresidential fell 0.5%, with manufacturing (-0.7%) and commercial (-0.9%) leading the pullback. Fiscal tailwinds from CHIPS/IRA projects are fading, data center growth is slowing, and oil/gas exploration is weakening as rig counts fall with lower prices.
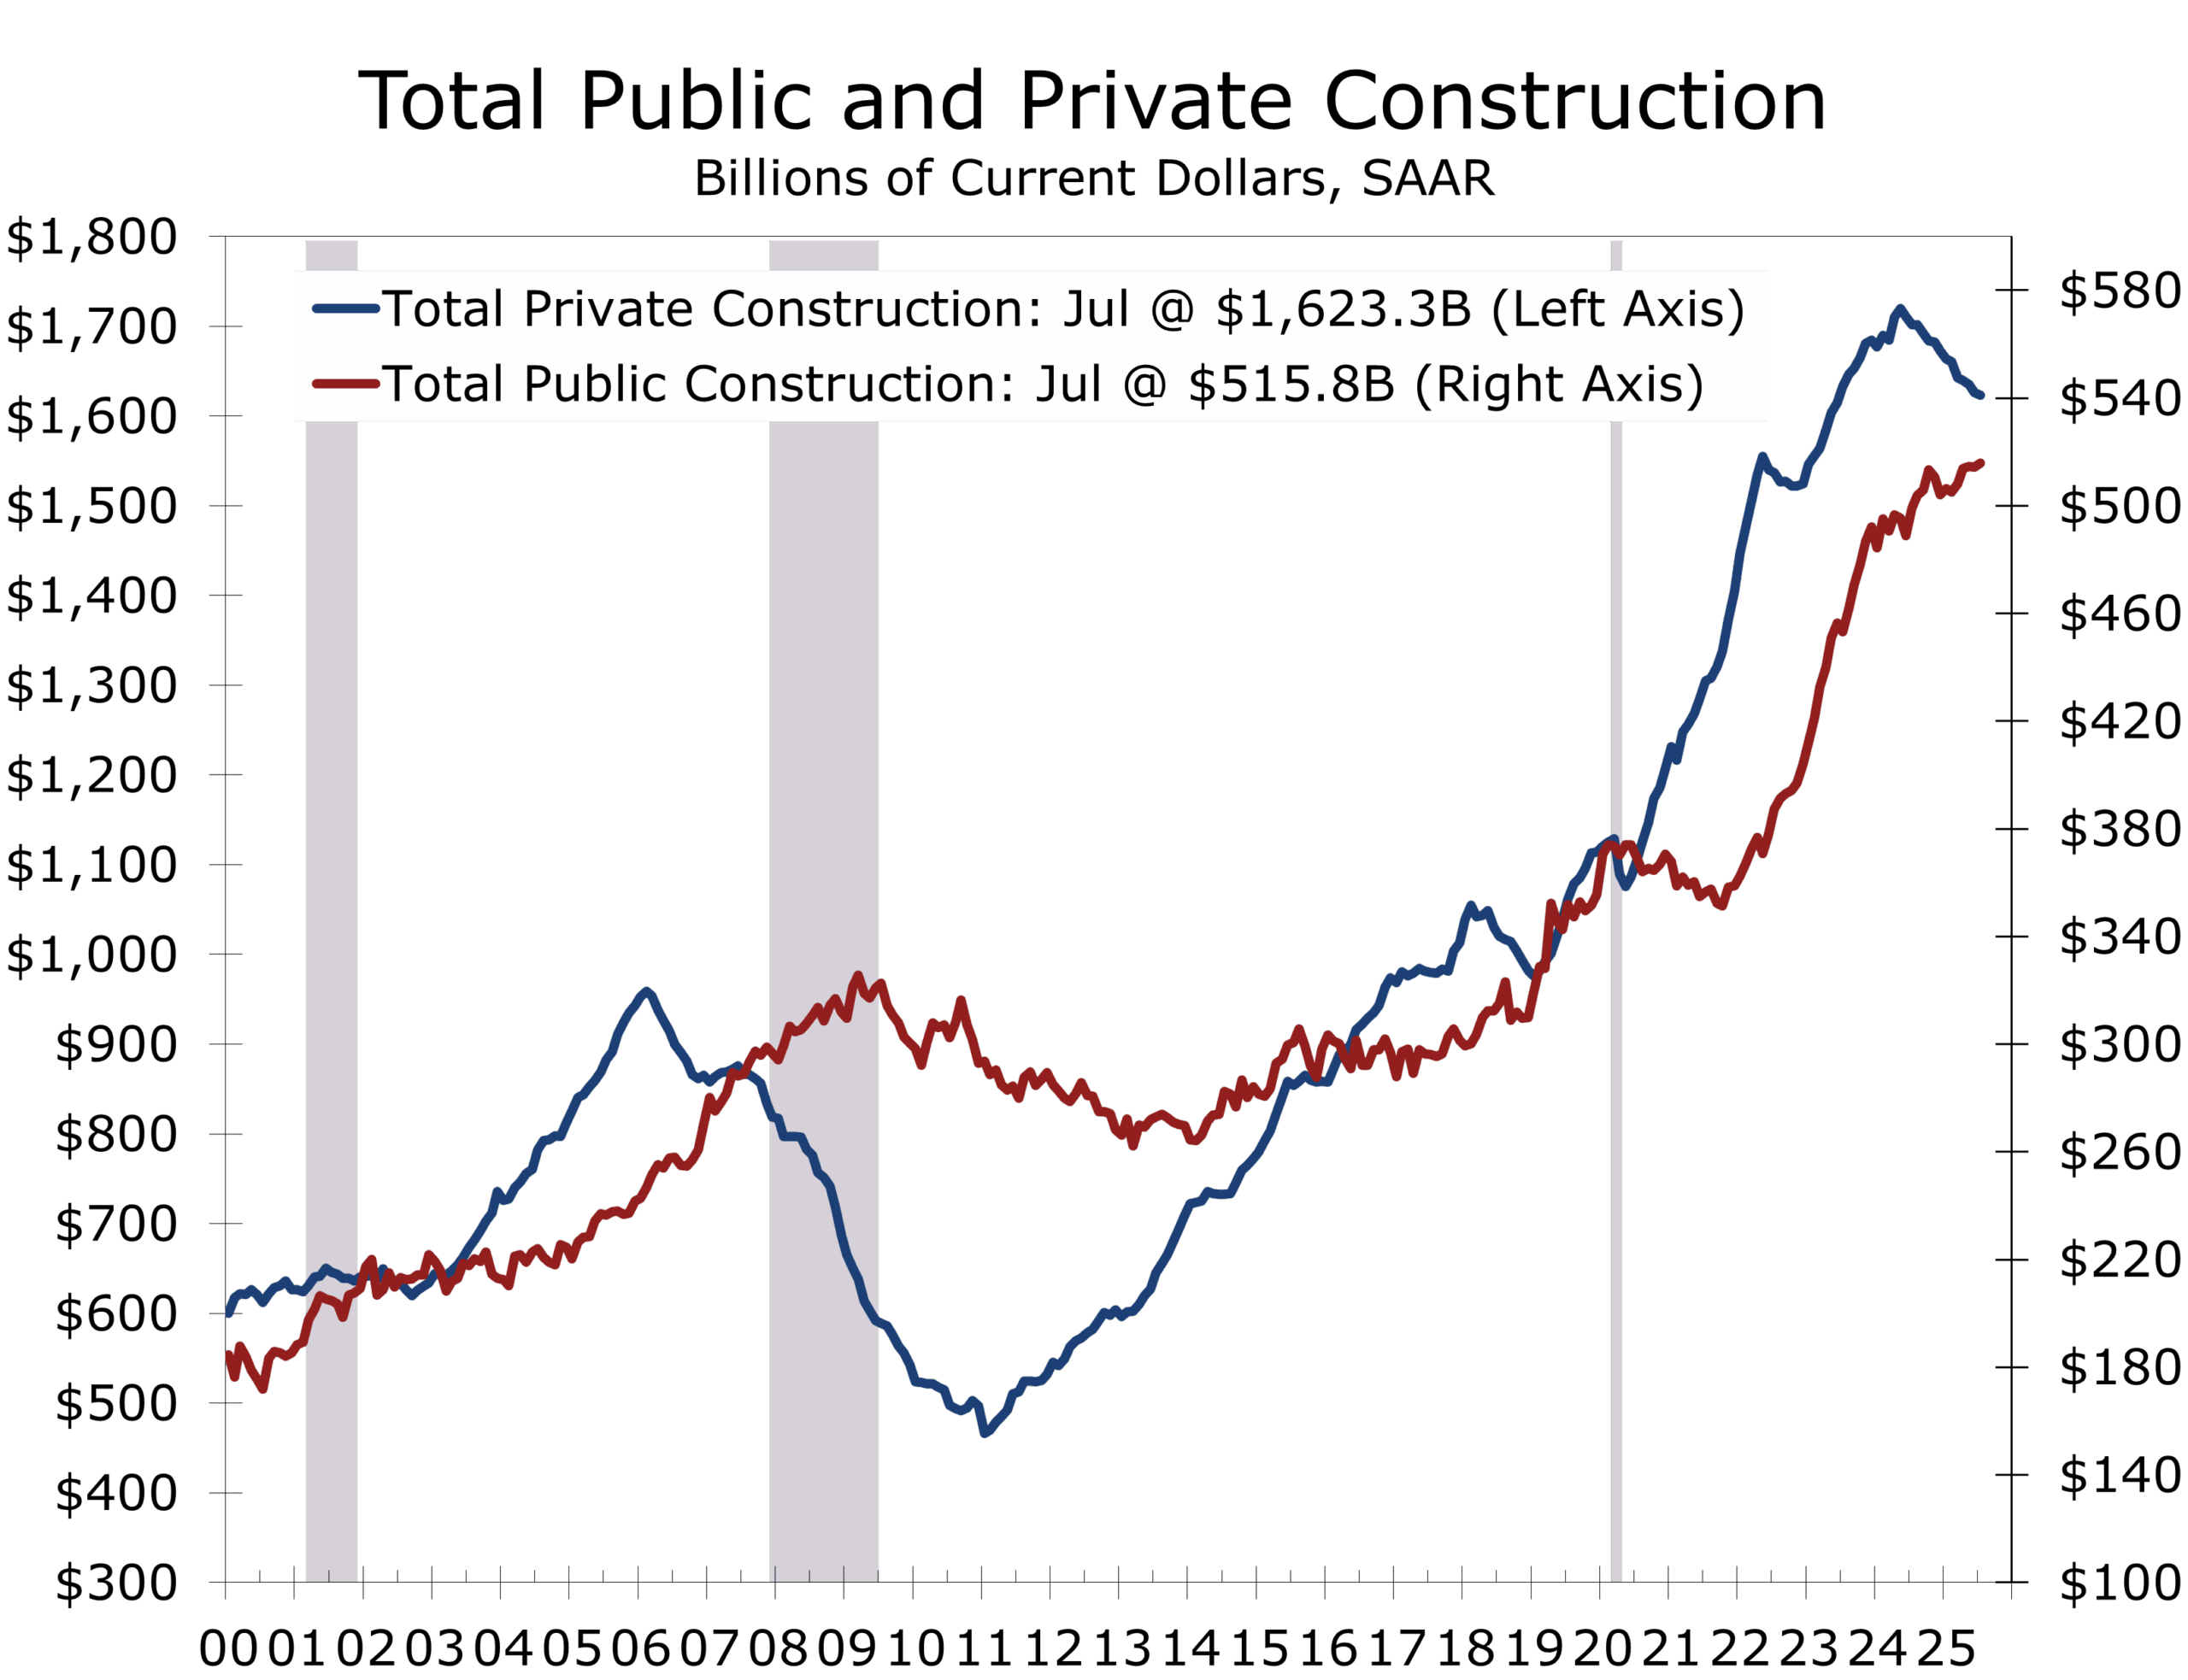
- Public support continues: Public outlays rose 0.3% in July, with transportation, water, and sewage projects benefiting from infrastructure funding. The sector is now +3.4% y/y, making it the most reliable area of support.
Housing Finds a Floor, Nonresidential Still Sinking
Construction spending edged lower in July, slipping 0.1% to a $2.139 trillion annual pace. That marks the third consecutive monthly decline and leaves outlays nearly 3% below last year’s levels. Once adjusted for higher input costs—up roughly half a percent on the month—the decline in real activity is even more pronounced, reinforcing the sector’s role as one of the economy’s weakest points heading into the second half of 2025.
Residential spending rose 0.1% in July, breaking a four-month losing streak.
The modest decline hides stark differences across categories. Residential spending ticked up 0.1% in July, breaking a four-month losing streak. Single-family construction posted a narrow gain while multifamily continued to contract. Yet the underlying fundamentals remain challenging. Home sales are subdued, price declines are spreading across more markets, and retail sales of building materials remain weak. The NAHB/Wells Fargo Housing Market Index slipped to 32 in August, with buyer traffic near cycle lows. While a strong pipeline of homes under construction will cushion activity in the near term, the broader outlook points to renewed weakness until mortgage rates ease meaningfully.
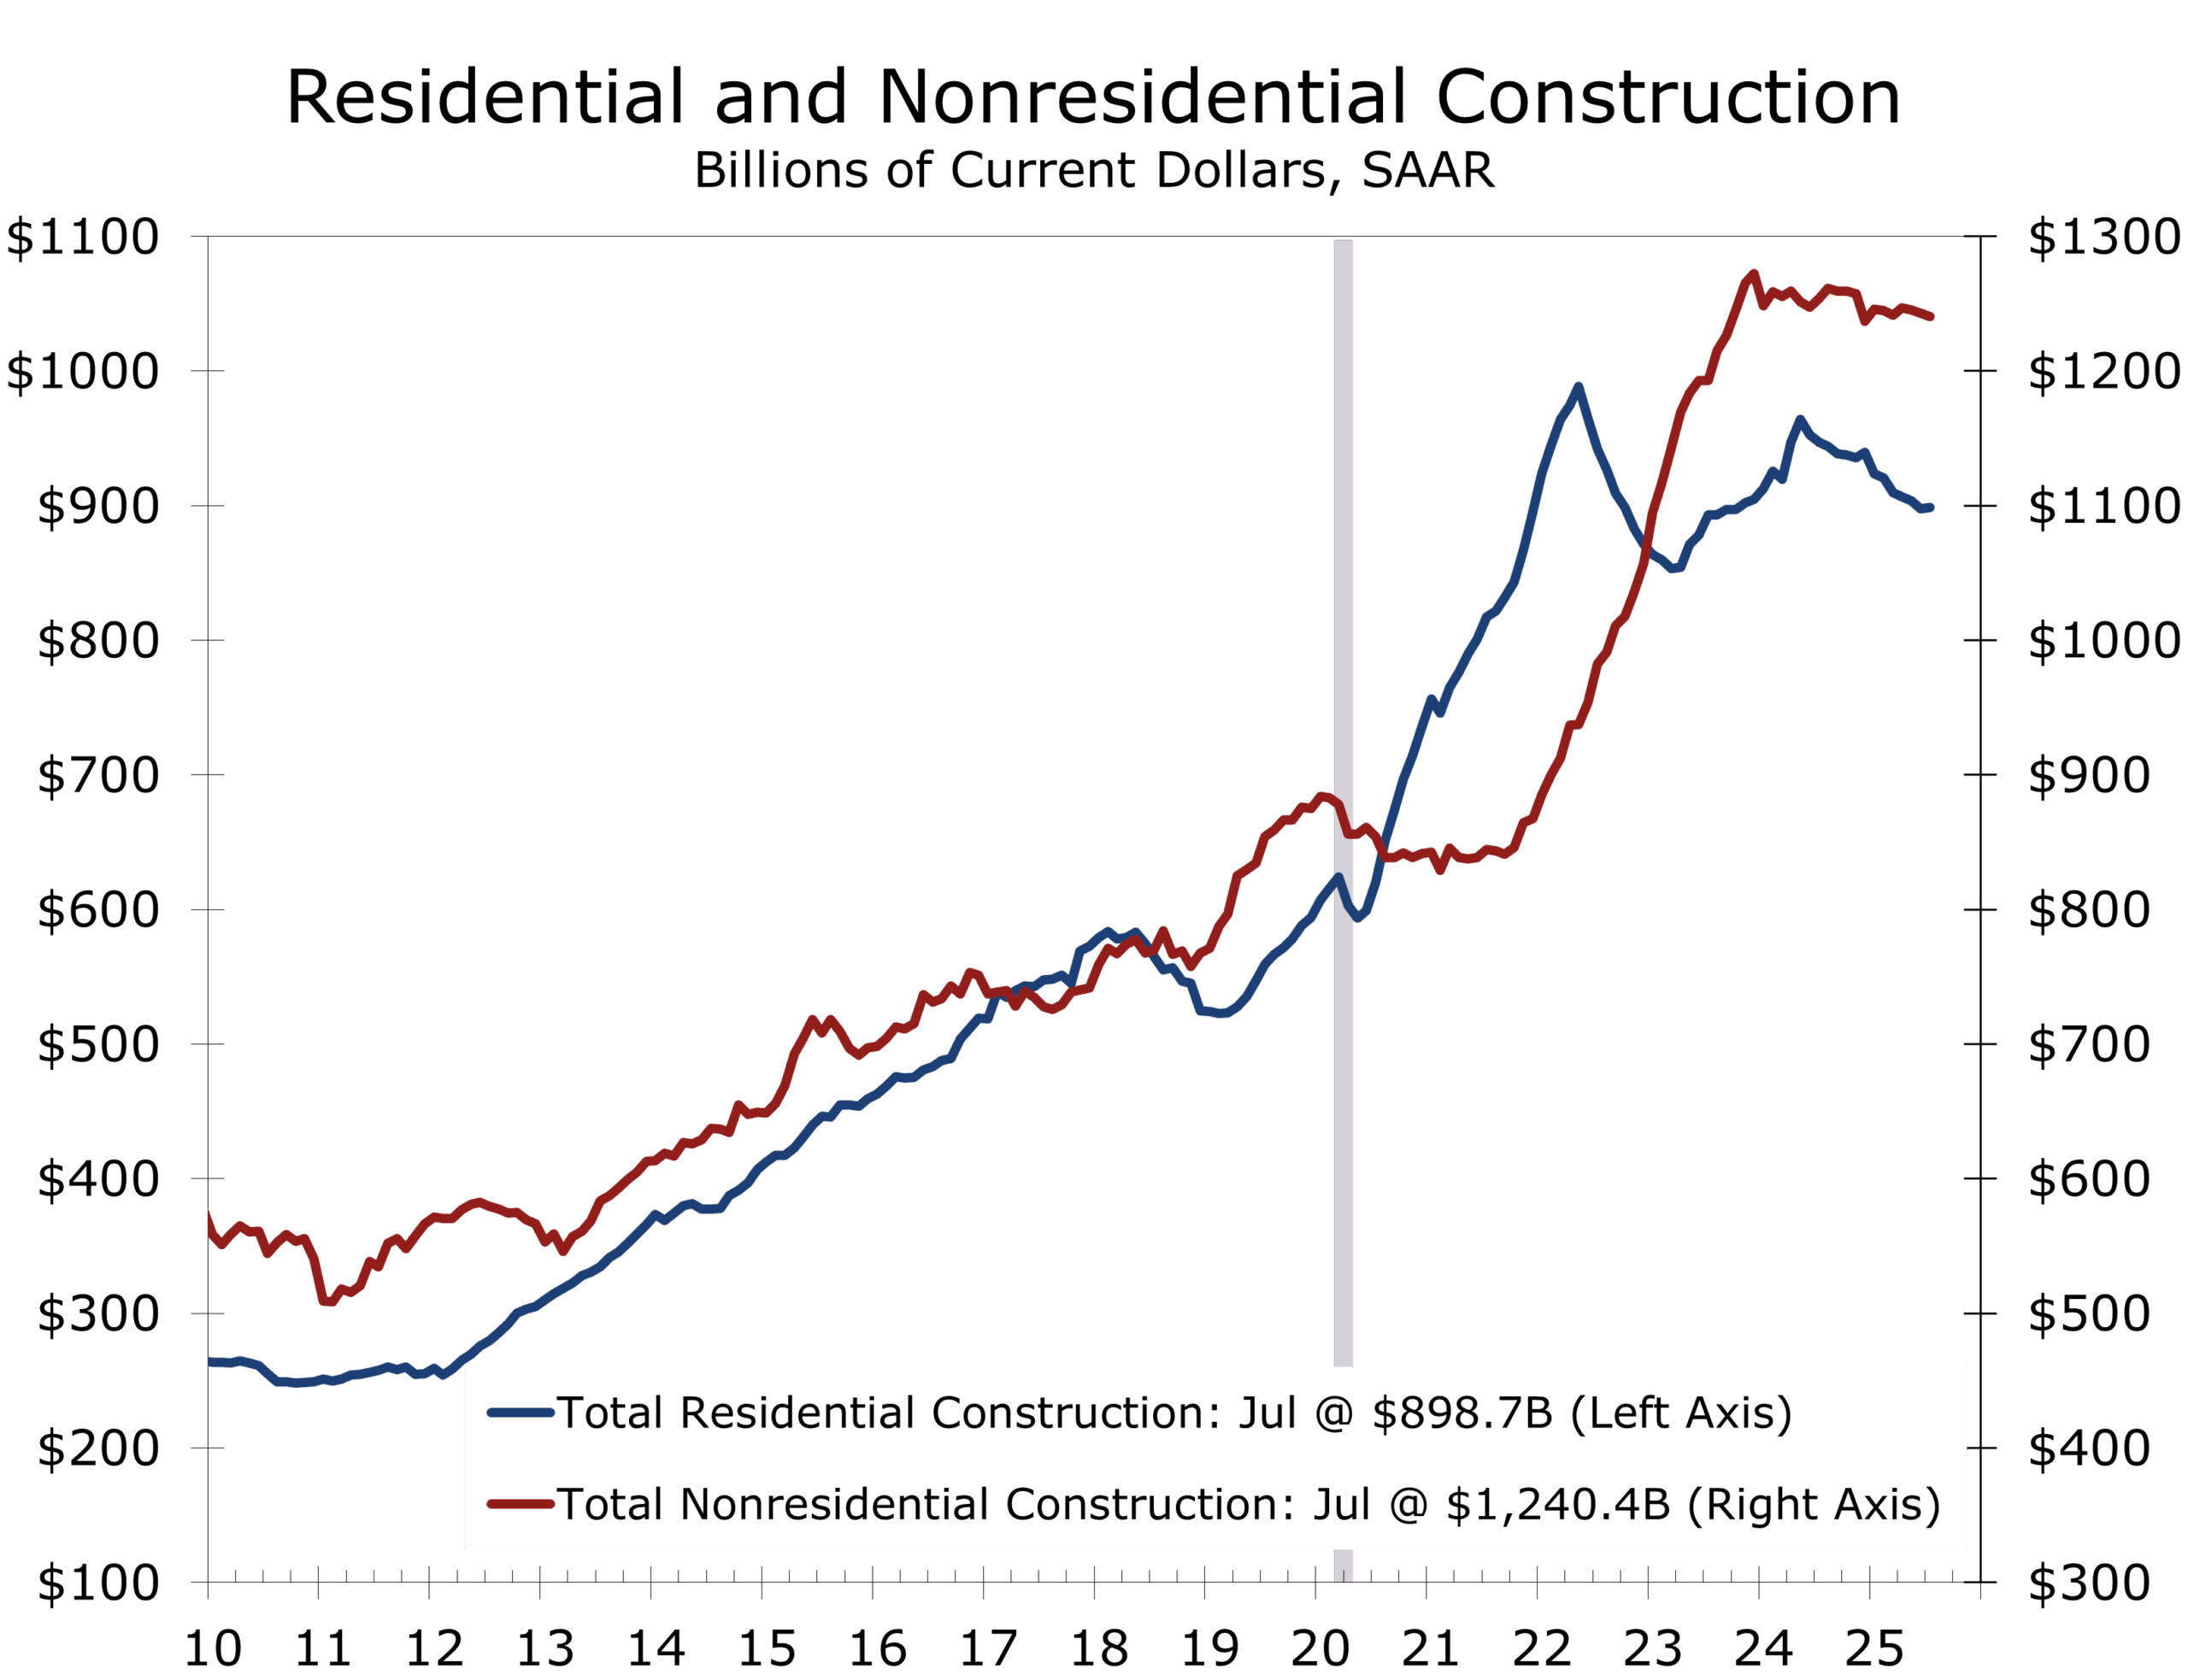
The heavier weight on the topline came from private nonresidential spending, which fell 0.5% in July. Manufacturing outlays dropped 0.7%, down nearly 7% from a year ago, as the wave of megaprojects tied to CHIPS and IRA incentives begins to crest. Commercial construction fell 0.9% in the month and is down nearly 10% year-over-year, with retail and warehouse categories struggling. Even data centers, which have been the most consistent growth engine, advanced at their slowest pace in months. Energy-related structures are also softening, with oil and gas drilling cutbacks reflecting profitability challenges at current crude prices.
Private nonresidential spending fell 0.5% in July as manufacturing and commercial weakened.
Public spending continues to serve as the sector’s stabilizer. Outlays advanced 0.3% in July, with gains concentrated in transportation, water, and sewage projects. Year-to-year, public construction is up more than 3%, supported by federal infrastructure dollars and relatively strong state and local balance sheets. While monthly figures remain volatile, the overall trajectory of public construction remains positive.
While current activity is contracting, forward-looking measures suggest the project pipeline is a bit healthier. The Architecture Billings Index slipped to 46.2 in July, consistent with near-term weakness in design activity, but the Associated Builders and Contractors backlog indicator climbed to 8.8 months, its highest since 2019. At the same time, the Dodge Momentum Index surged more than 20% in July to a record high, boosted by institutional and commercial planning—including another major Meta data center and multiple hospital projects. These indicators point to a late-2025 and 2026 rebound in construction activity.
For the broader economy, construction remains a modest but visible drag. The slowdown in nonresidential construction will likely pull structures investment down at around a 7% annualized pace in Q3, following an 8.9% decline in Q2. The combination of fading fiscal tailwinds, elevated financing costs, and policy uncertainty continues to weigh on private construction, while public infrastructure provides only a partial cushion. The message for contractors, developers, homebuilders, and construction supply firms is clear: the near-term environment will remain challenging, but the project pipeline suggests better opportunities ahead once financial conditions ease and long-duration projects in digital infrastructure and institutional construction ramp up.
Disclaimer: This publication has been prepared for informational purposes only and is not intended as a recommendation offer or solicitation with respect to the purchase or sale of any security or other financial product nor does it constitute investment advice.
September 2, 2025
Mark Vitner, Chief Economist
(704) 458-4000

A View from the Piedmont: Our Weekly Commentary on Money, Credit, Exchange Rates & Geopolitics – Holding Pattern Before the Cut - Markets Wait on the Fed
Highlights of the Week
- This past week’s data painted a mixed picture: personal income and spending were firmer, but confidence slipped on labor market and tariff concerns.
- Home prices lost momentum this summer, pending sales softened, and trade flows widened the goods deficit—all adding downside risks for Q3 GDP.
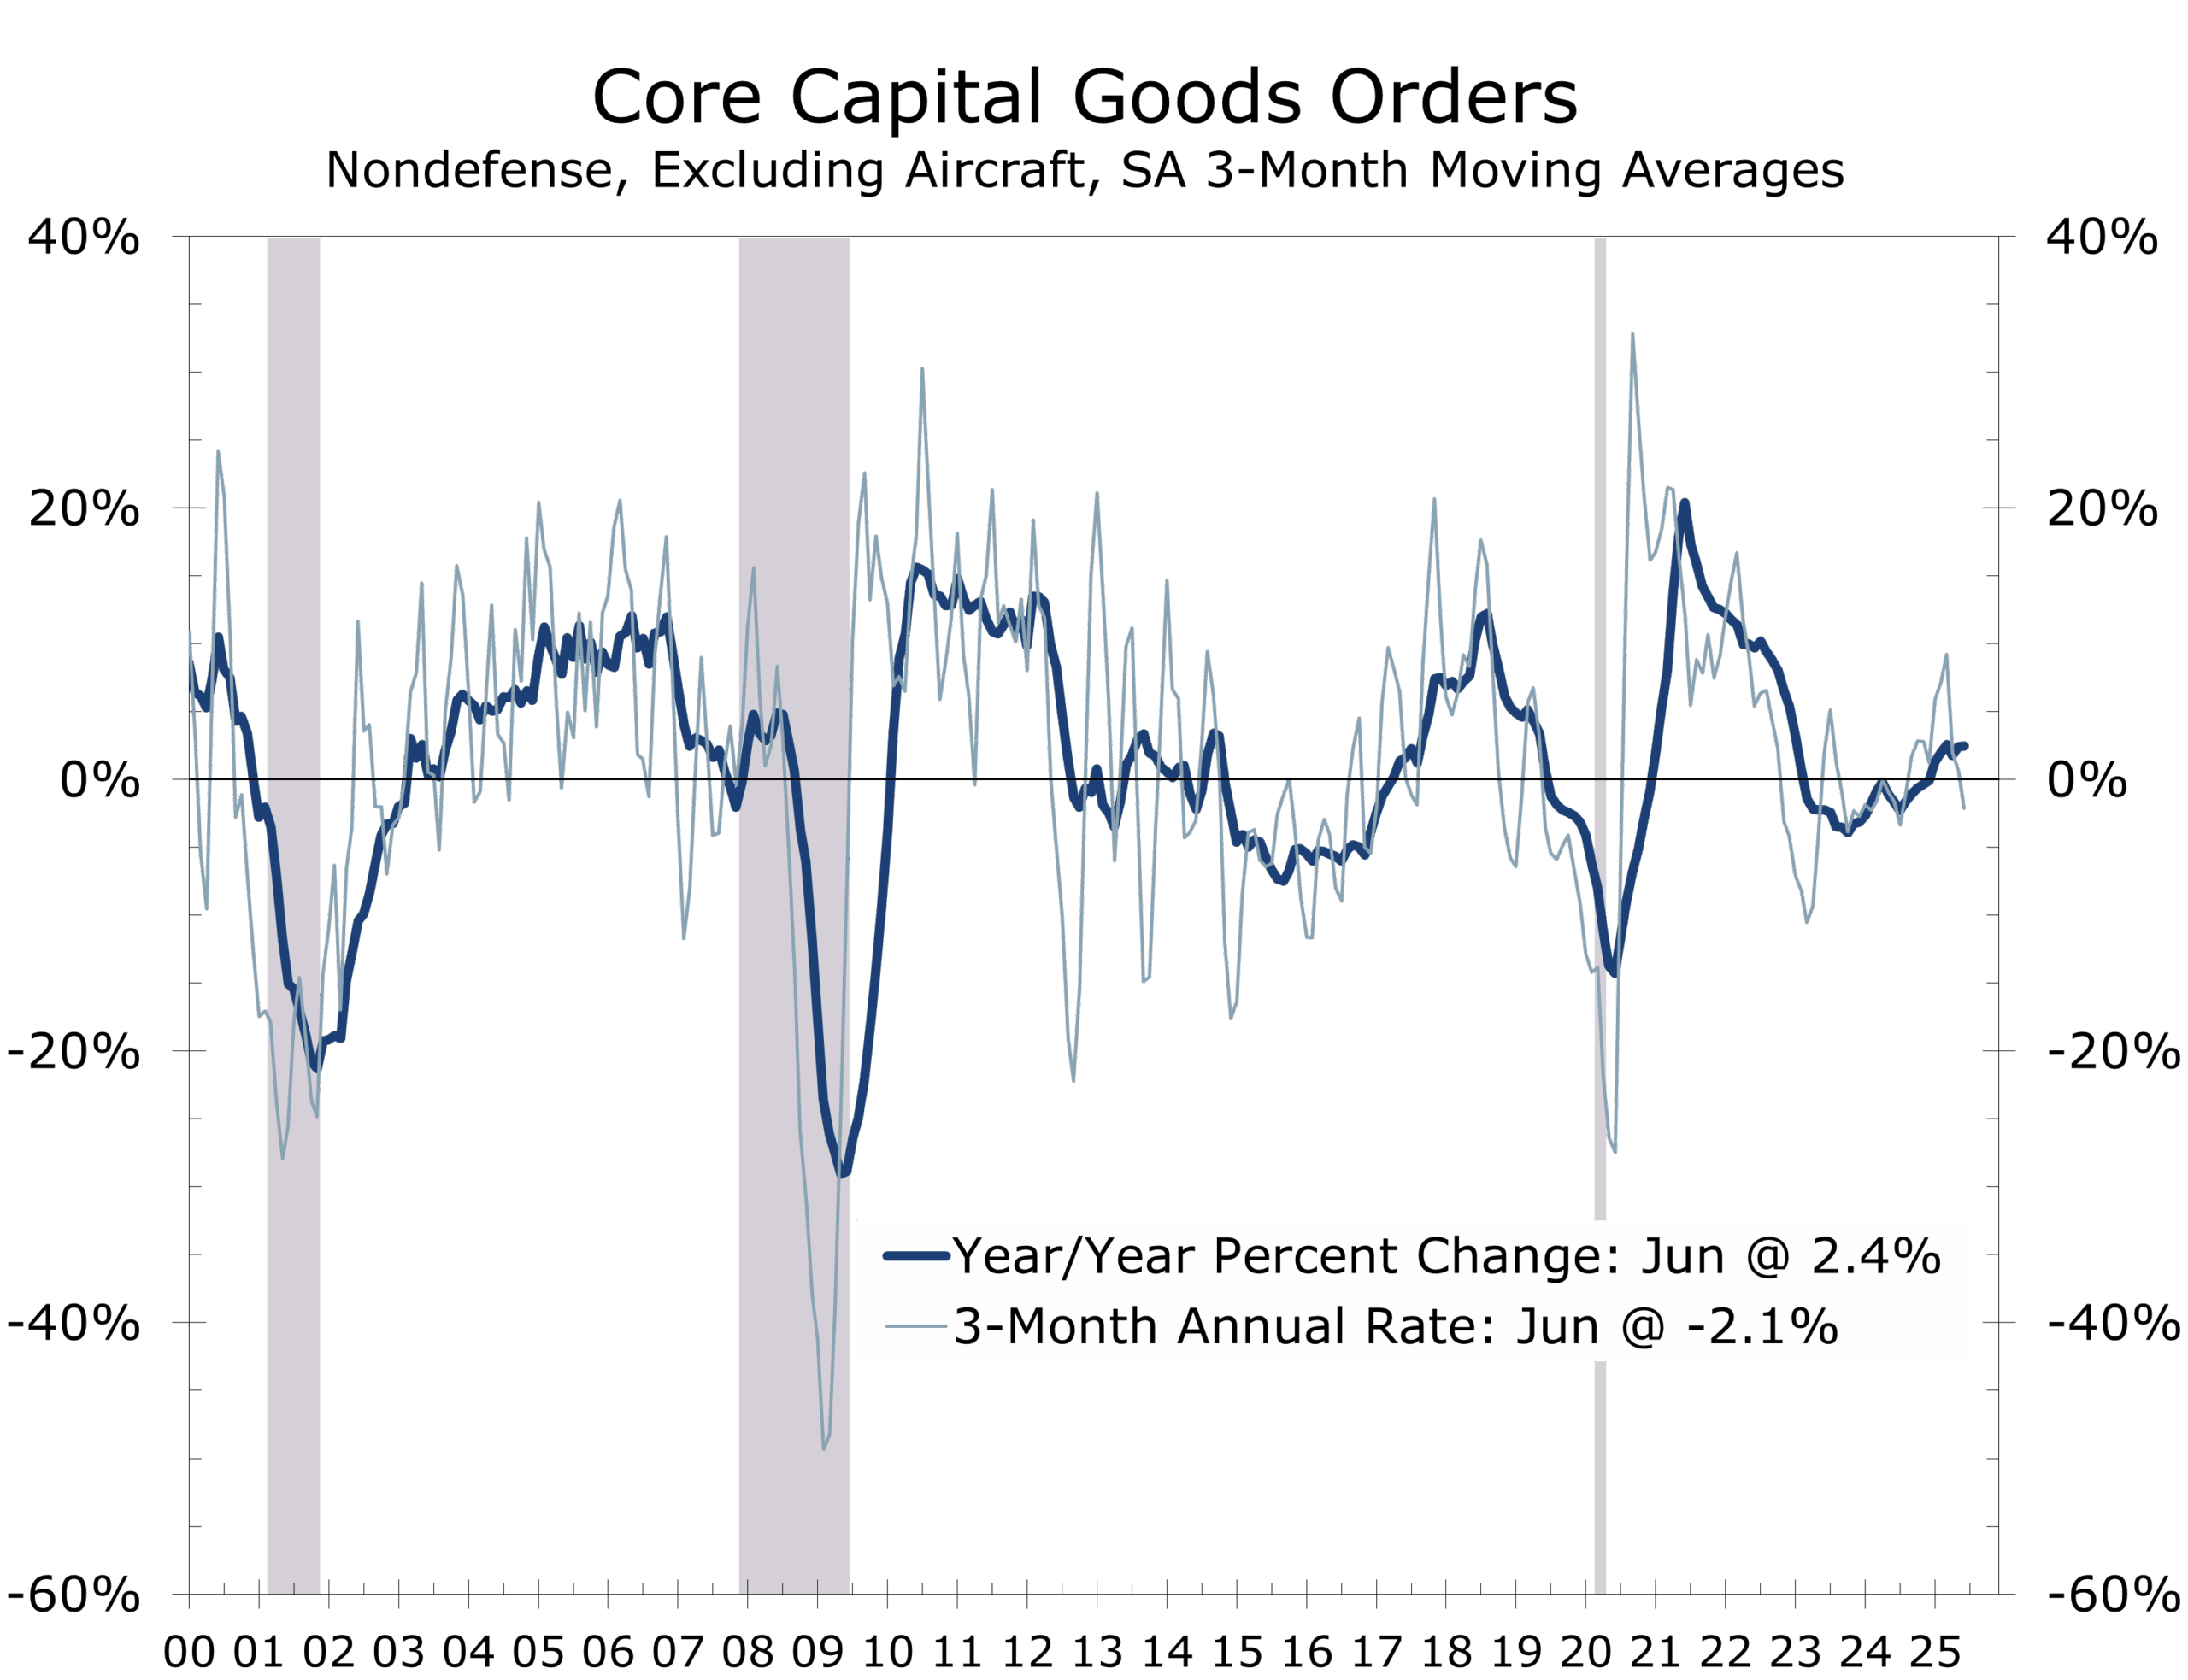
- Durable goods orders signaled resilience in equipment spending, with AI investment still a powerful driver.
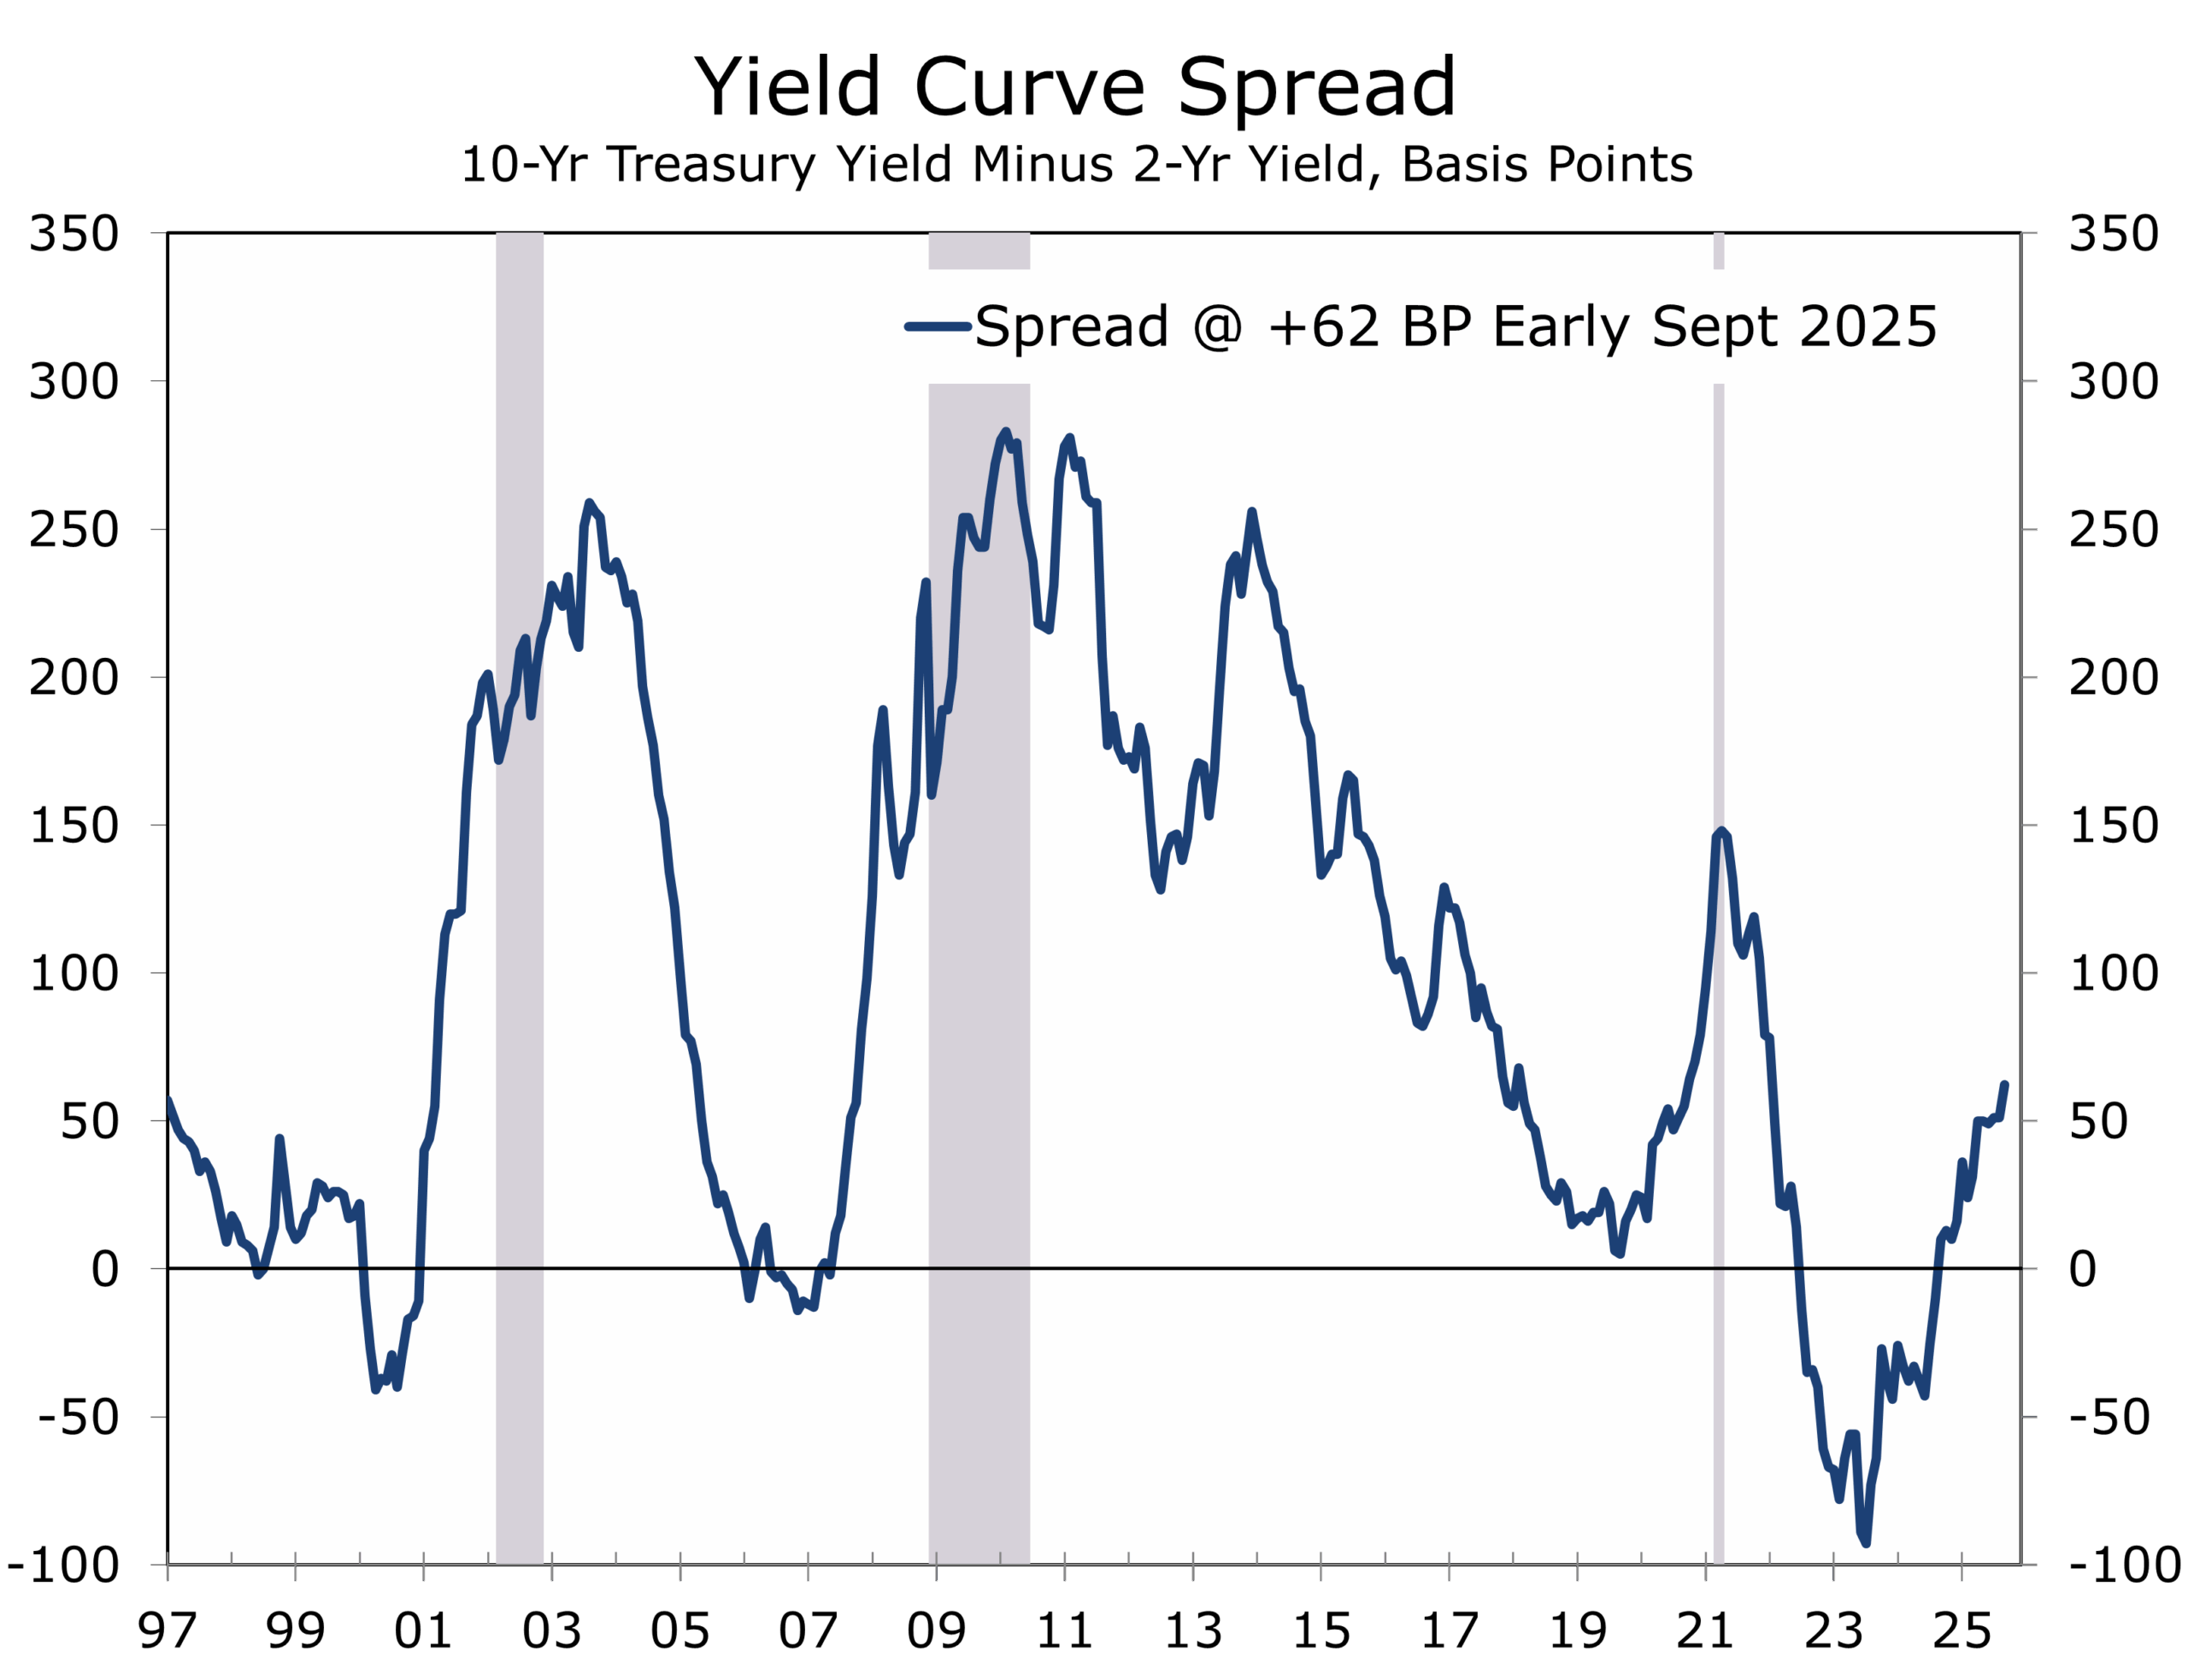
- Treasury curve steepening accelerated, fueled by expectations of a September Fed rate cut and political pressure on the Fed.
- Geopolitical tensions remain elevated: Israel widened strikes across the region, Russia increased missile and drone strikes on Ukraine and ramped up information warfare with Europe and the U.S., while the U.S. Navy increased its presence near Venezuela ahead of Guyana’s election.
- Risks to watch include tariff-driven inflation re-acceleration, further Fed independence challenges, Treasury market liquidity strains, and potential energy disruptions tied to geopolitics.
Consumer Sector: Dancing but Uneasy
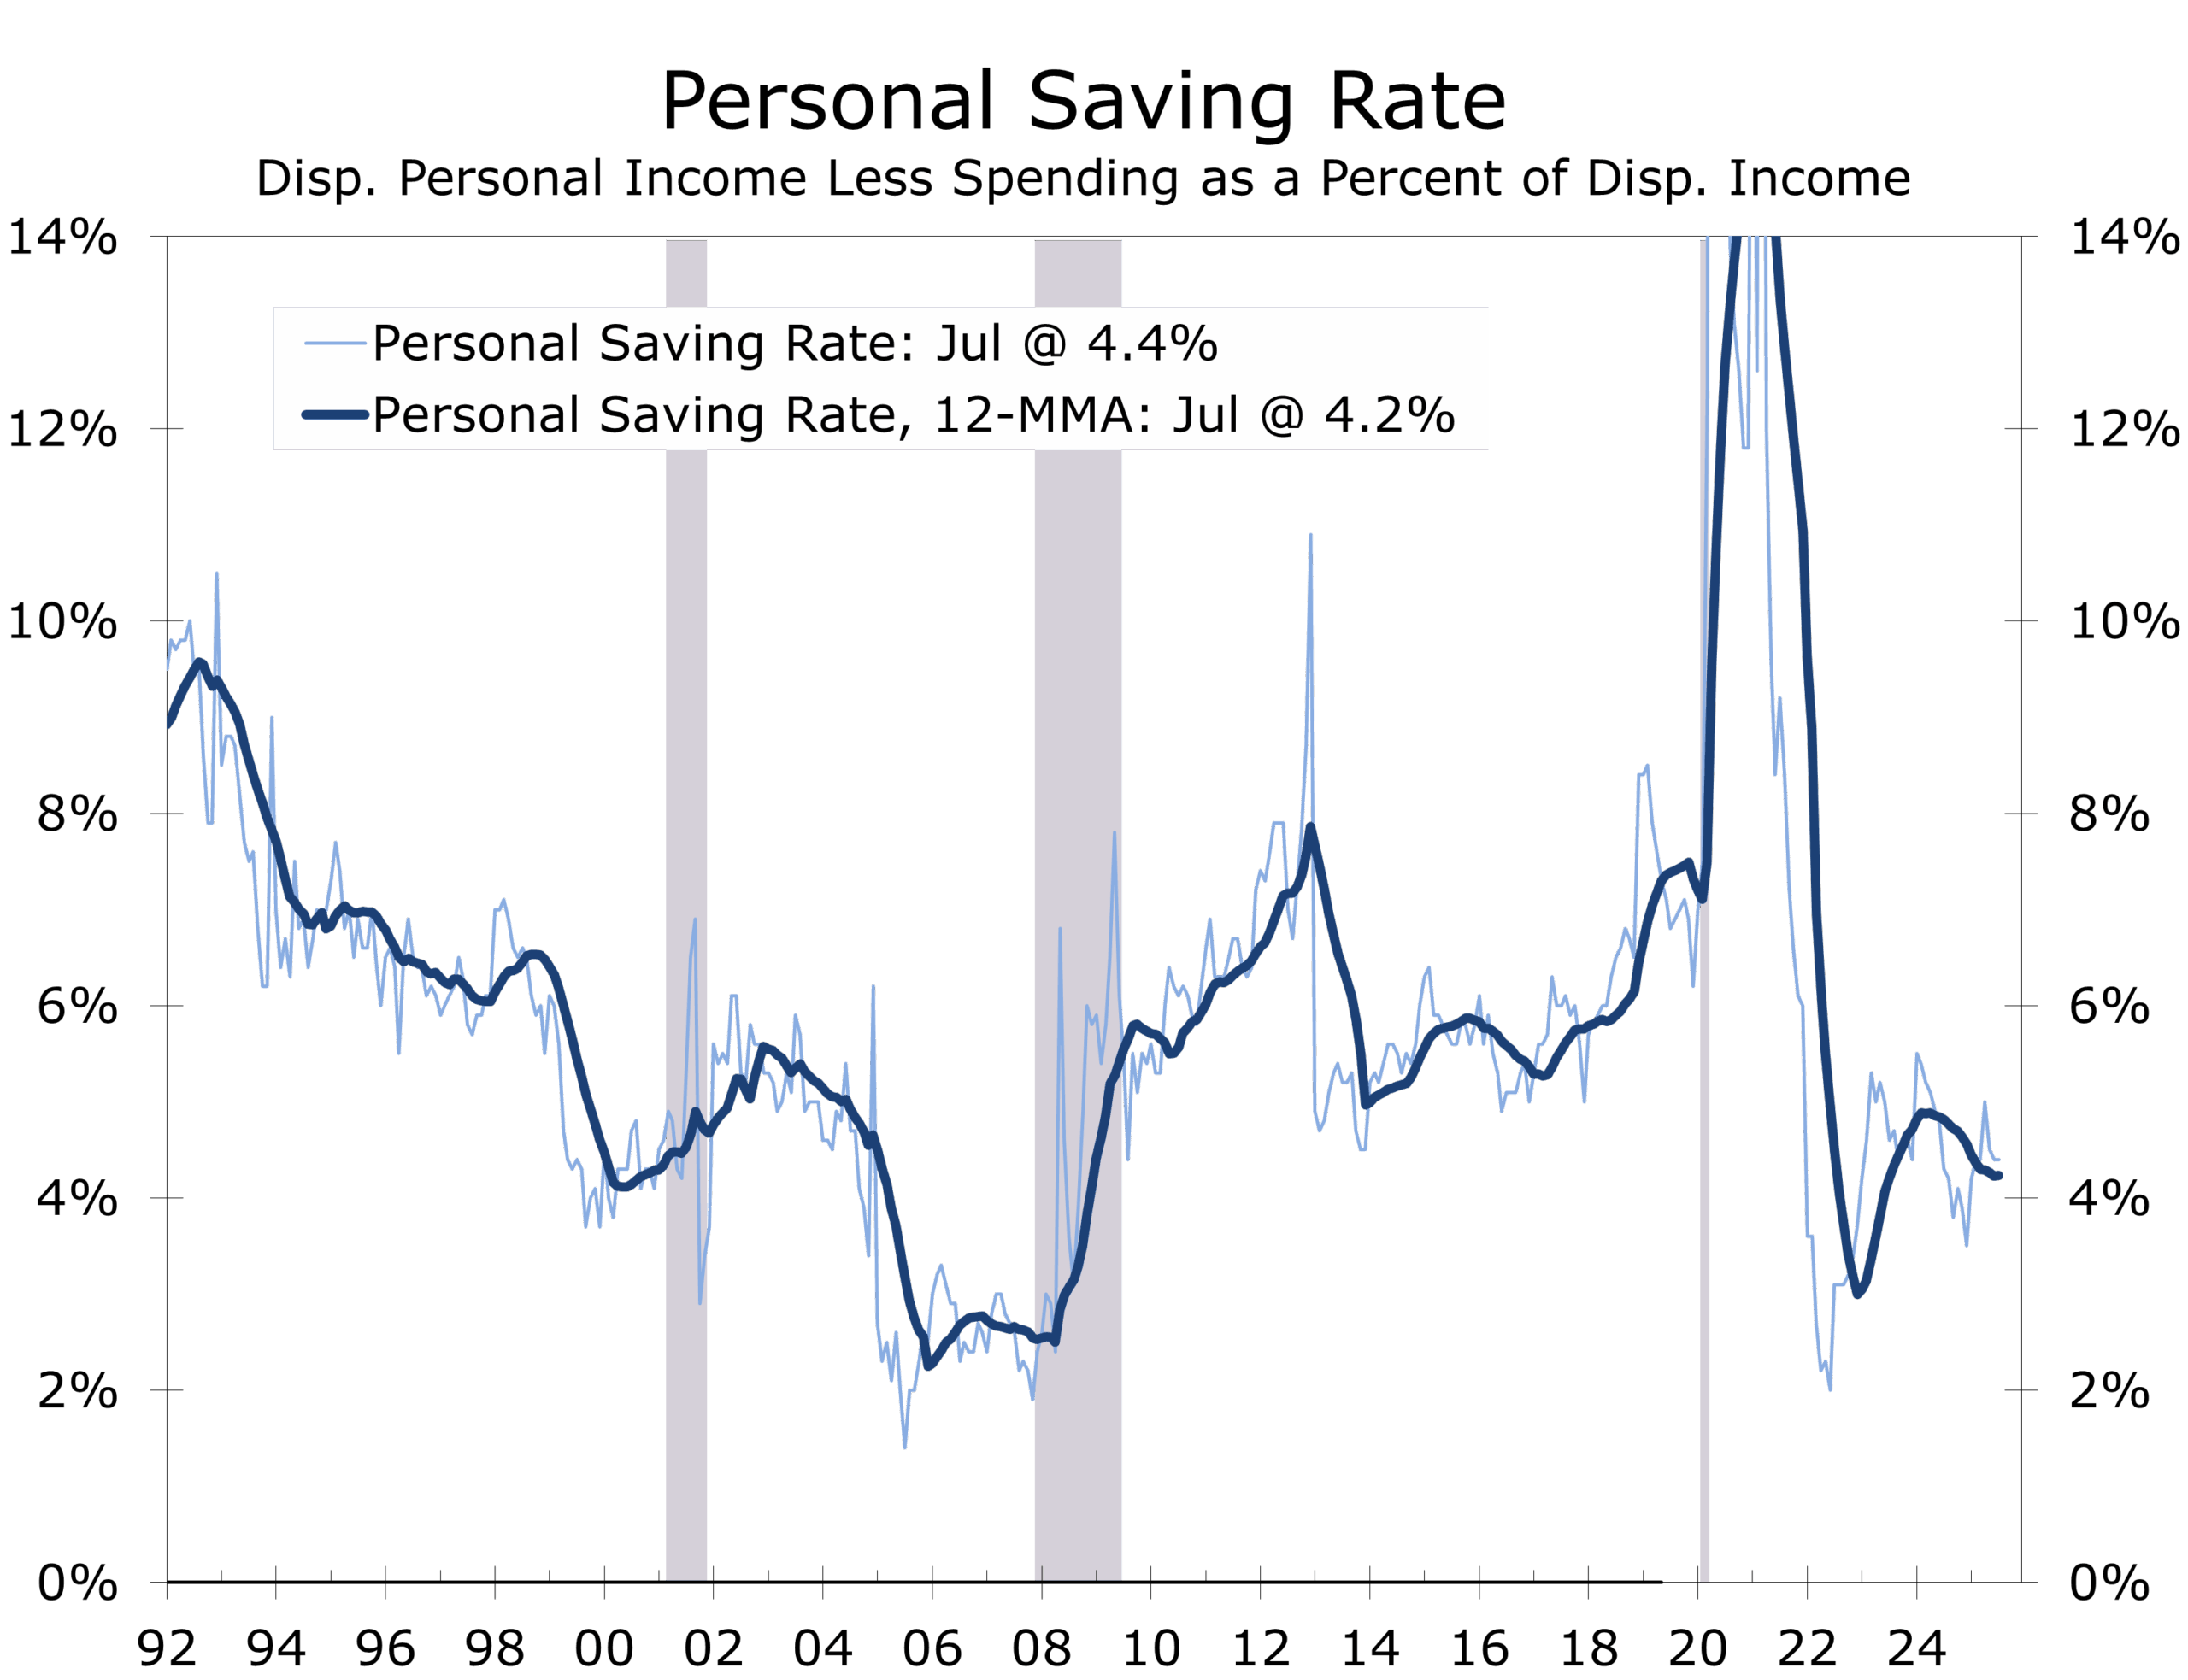
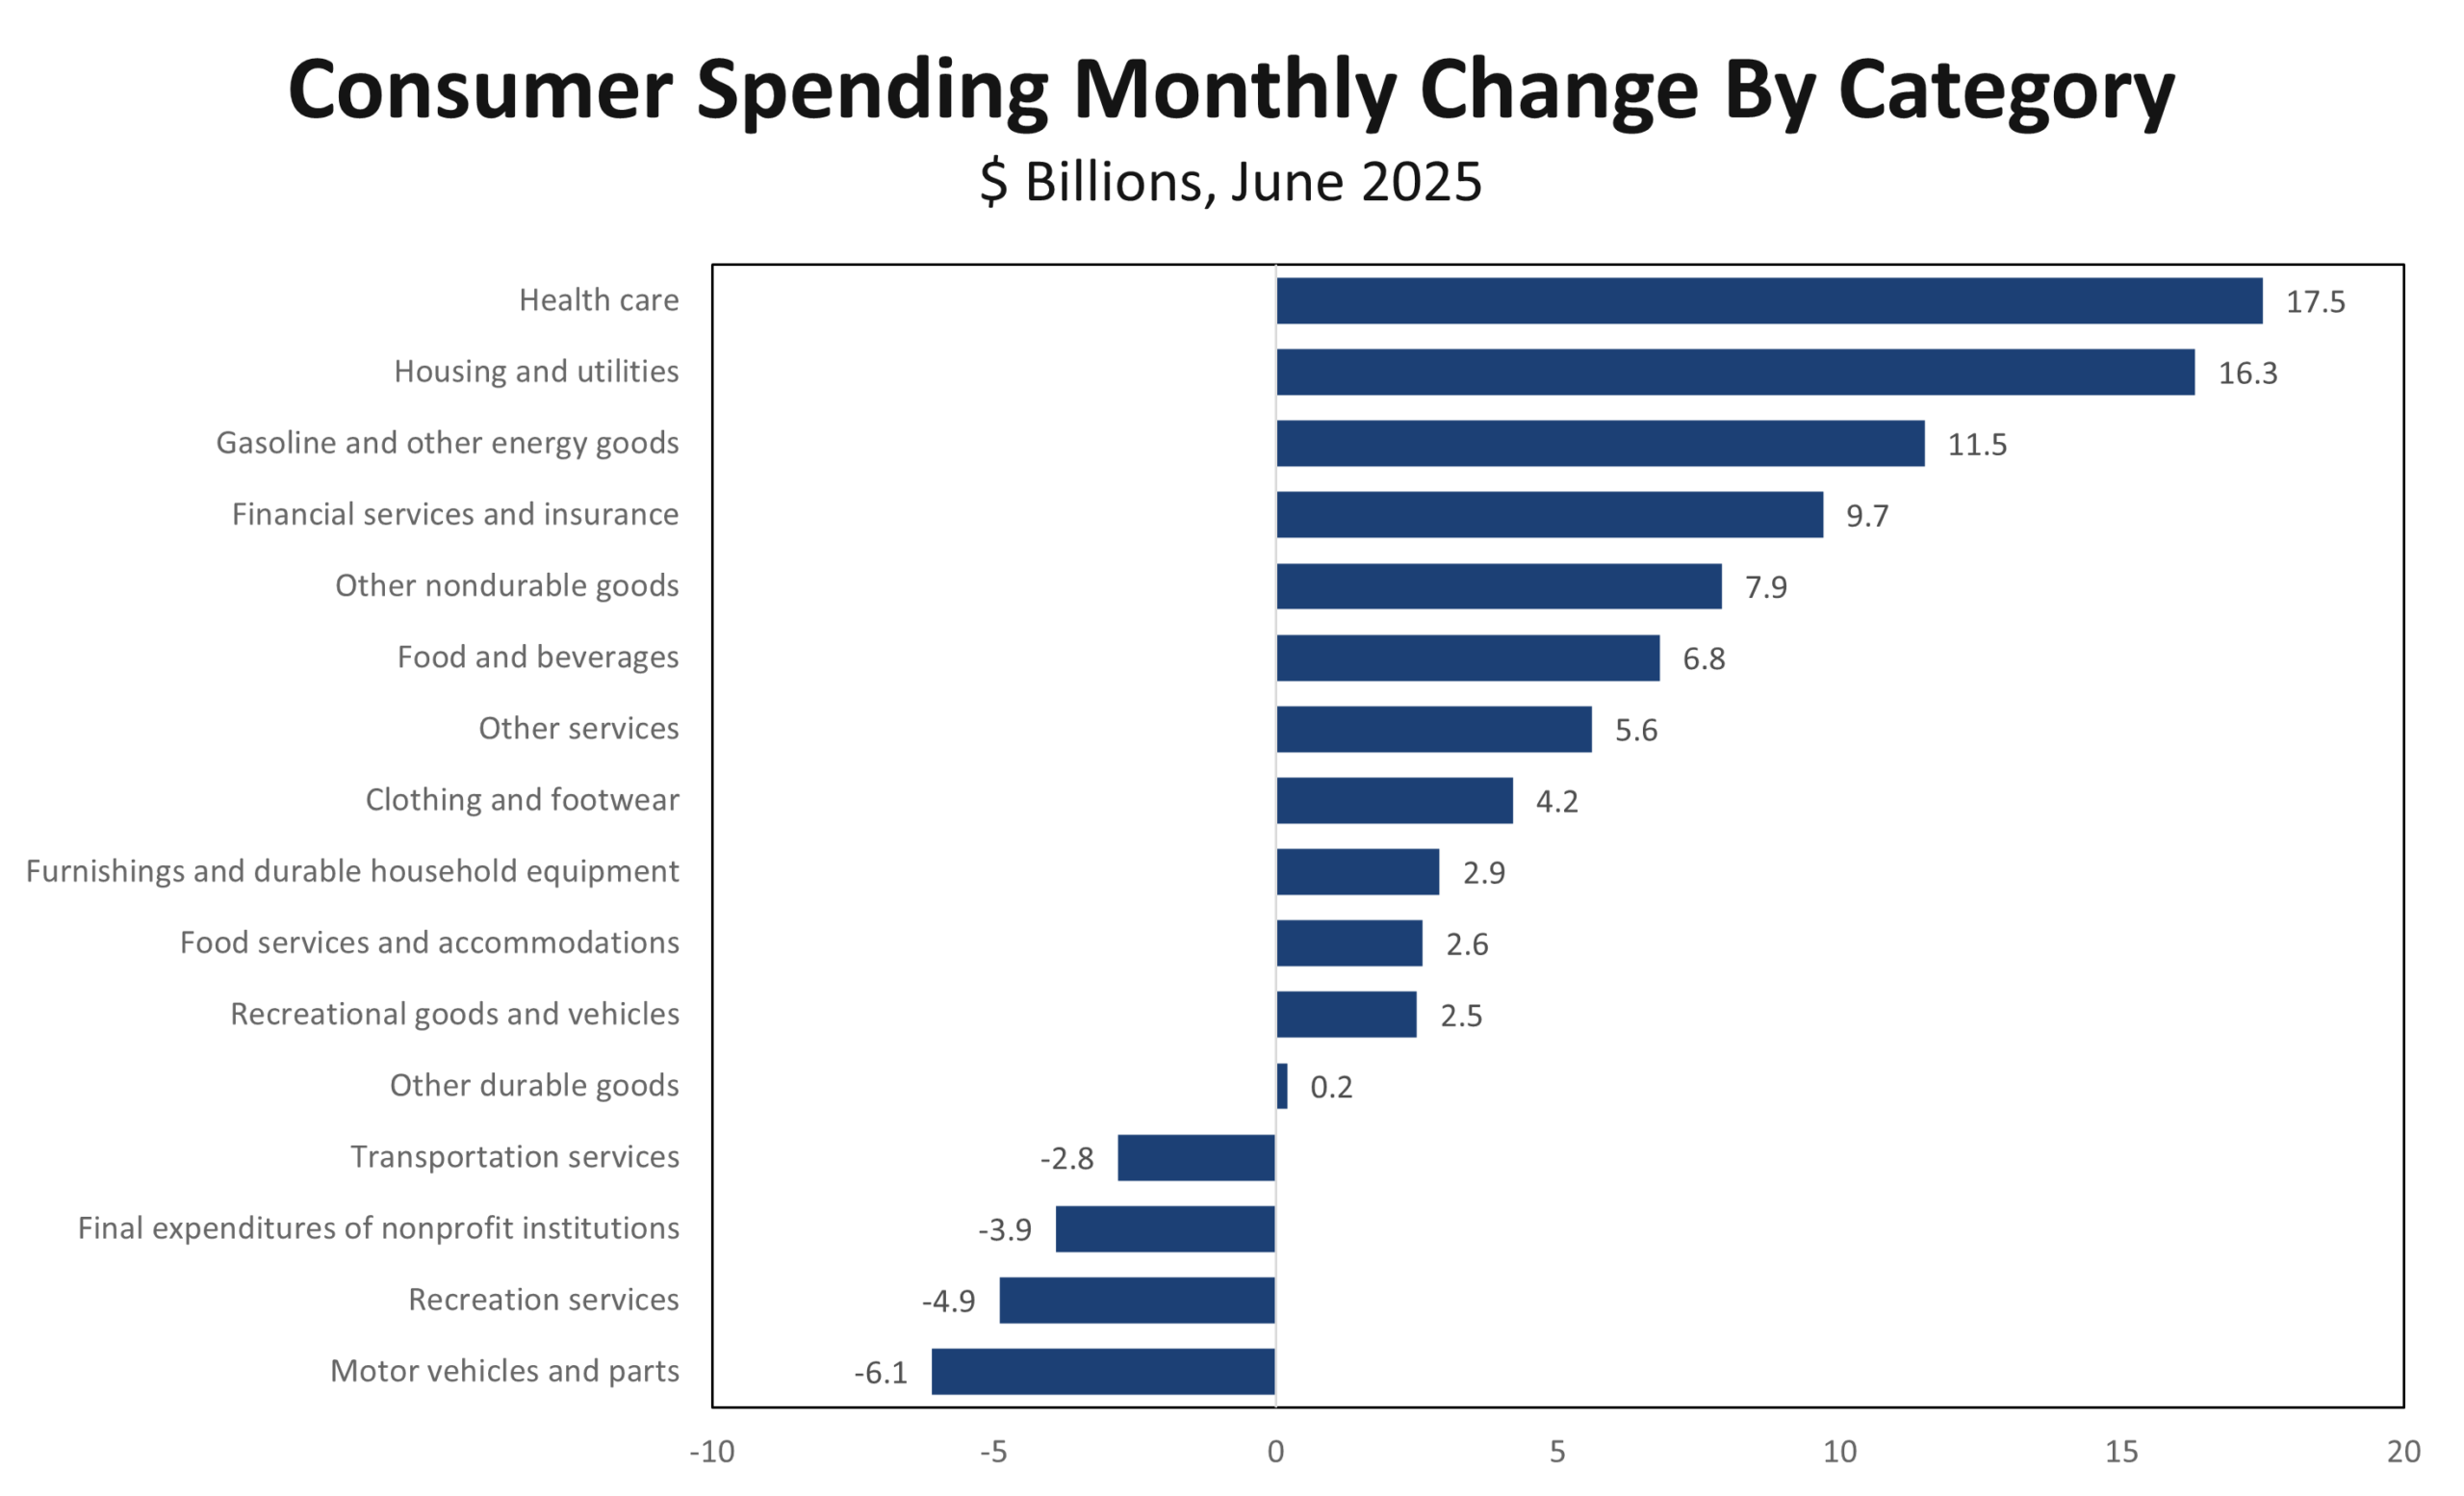
July’s personal income and spending report showed households still have stamina. Personal income rose 0.4%, wages and salaries 0.6%, and real spending advanced 0.3%, led by a 2.0% jump in durable goods. The personal saving rate ticked down to 4.4% but remains sturdier than the sub-4% lows of 2023.
Inflation surprised slightly on the soft side, with headline PCE up 0.2% and core PCE 0.3%, running near 2.9% y/y. Consumption is supported by wages, not savings drawdowns, reducing the risk of a sudden stop. Upside potential, however, looks limited.
Consumer spending is off to a solid start in Q3, despite concerns over tariffs and job growth.
Sentiment tells a different story. The Conference Board’s confidence index slipped, with households citing job worries and tariff-driven inflation fears. The University of Michigan’s final August sentiment reading echoed that unease, hitting its lowest since last fall. This divergence between steady data and sour mood underscores the risk that spending momentum might fade.
Housing: Momentum Slips Further
Housing markets cooled further in midsummer. Case-Shiller home prices fell 0.3% in June, slowing to their weakest annual gain since July 2023, with several Sun Belt metros seeing outright declines. The FHFA series posted its softest growth since 2012, and the Freddie Mac National Home Price Index fell 0.22% in July and is now up just 1.4% yr/yr. Pending home sales fell 0.4% in July, pointing to weaker existing sales in August.
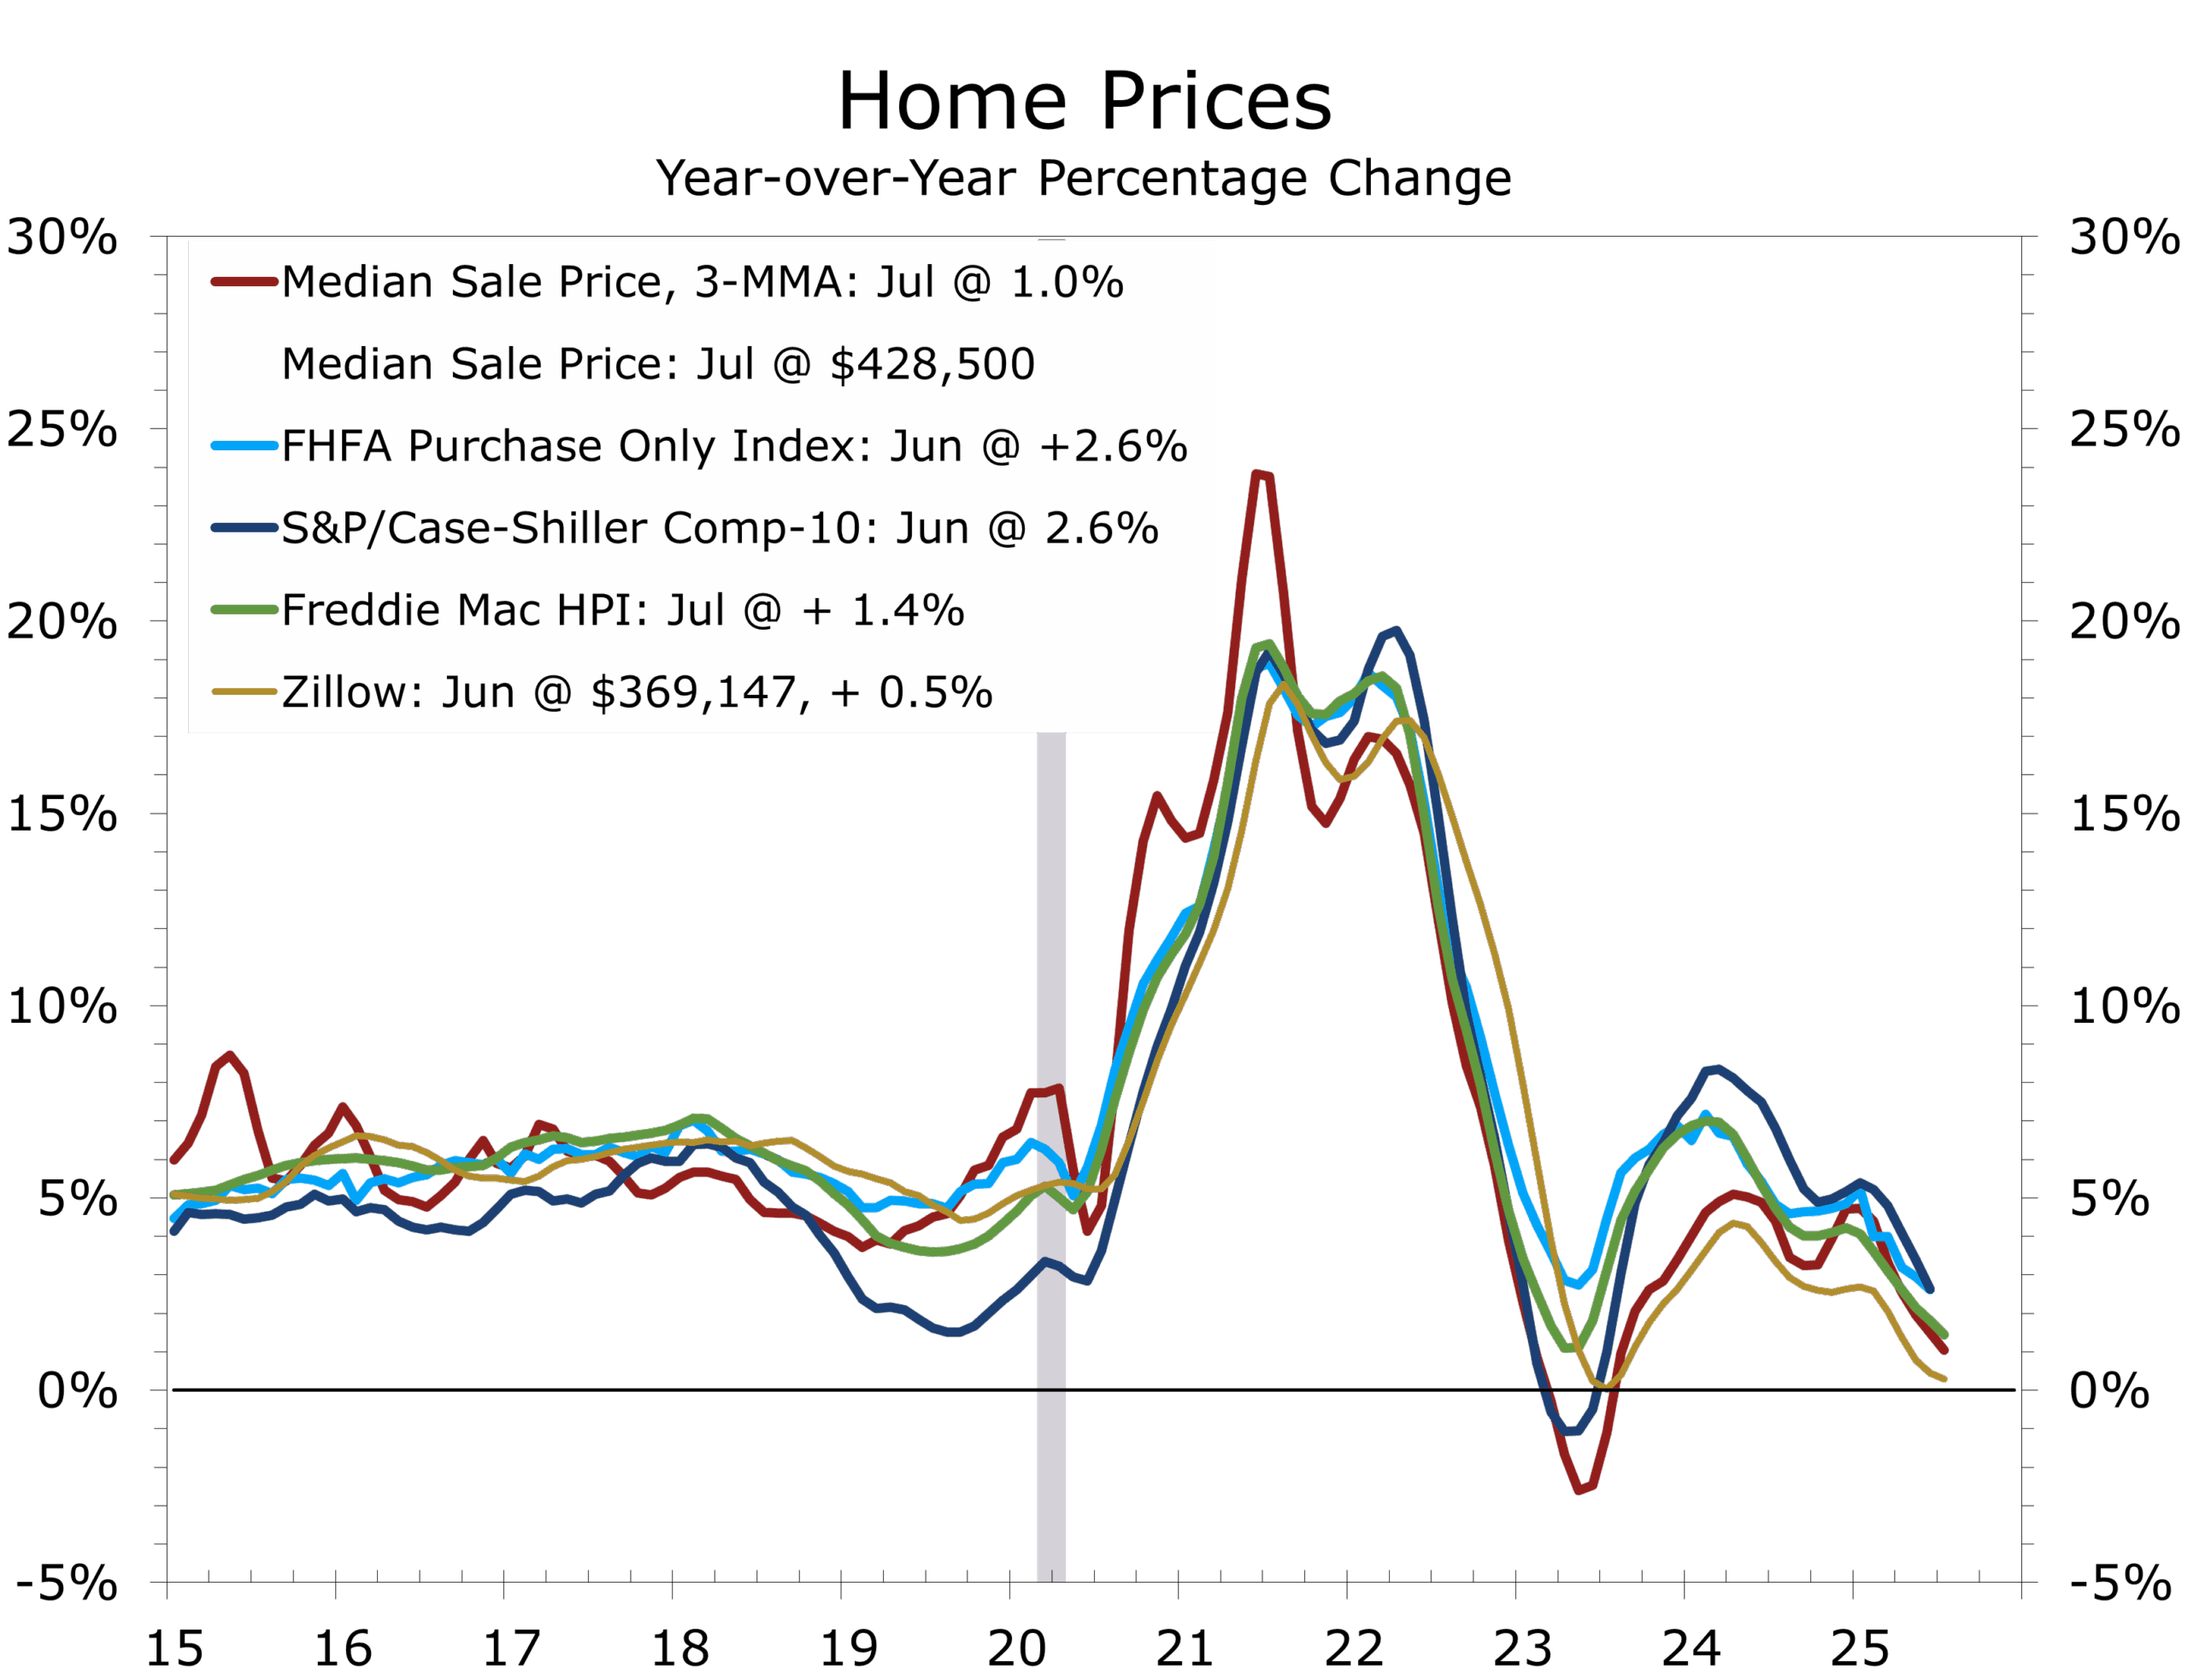
Affordability remains stretched, and with labor market worries mounting, buyers are staying cautious despite modest rate relief. For housing-related industries, the implication is a prolonged plateau rather than an imminent rebound. Mortgage rates would likely need to fall below 6% to produce a meaningful jump in sales, which looks unlikely before spring 2026.
Business Investment: Still Carried by AI
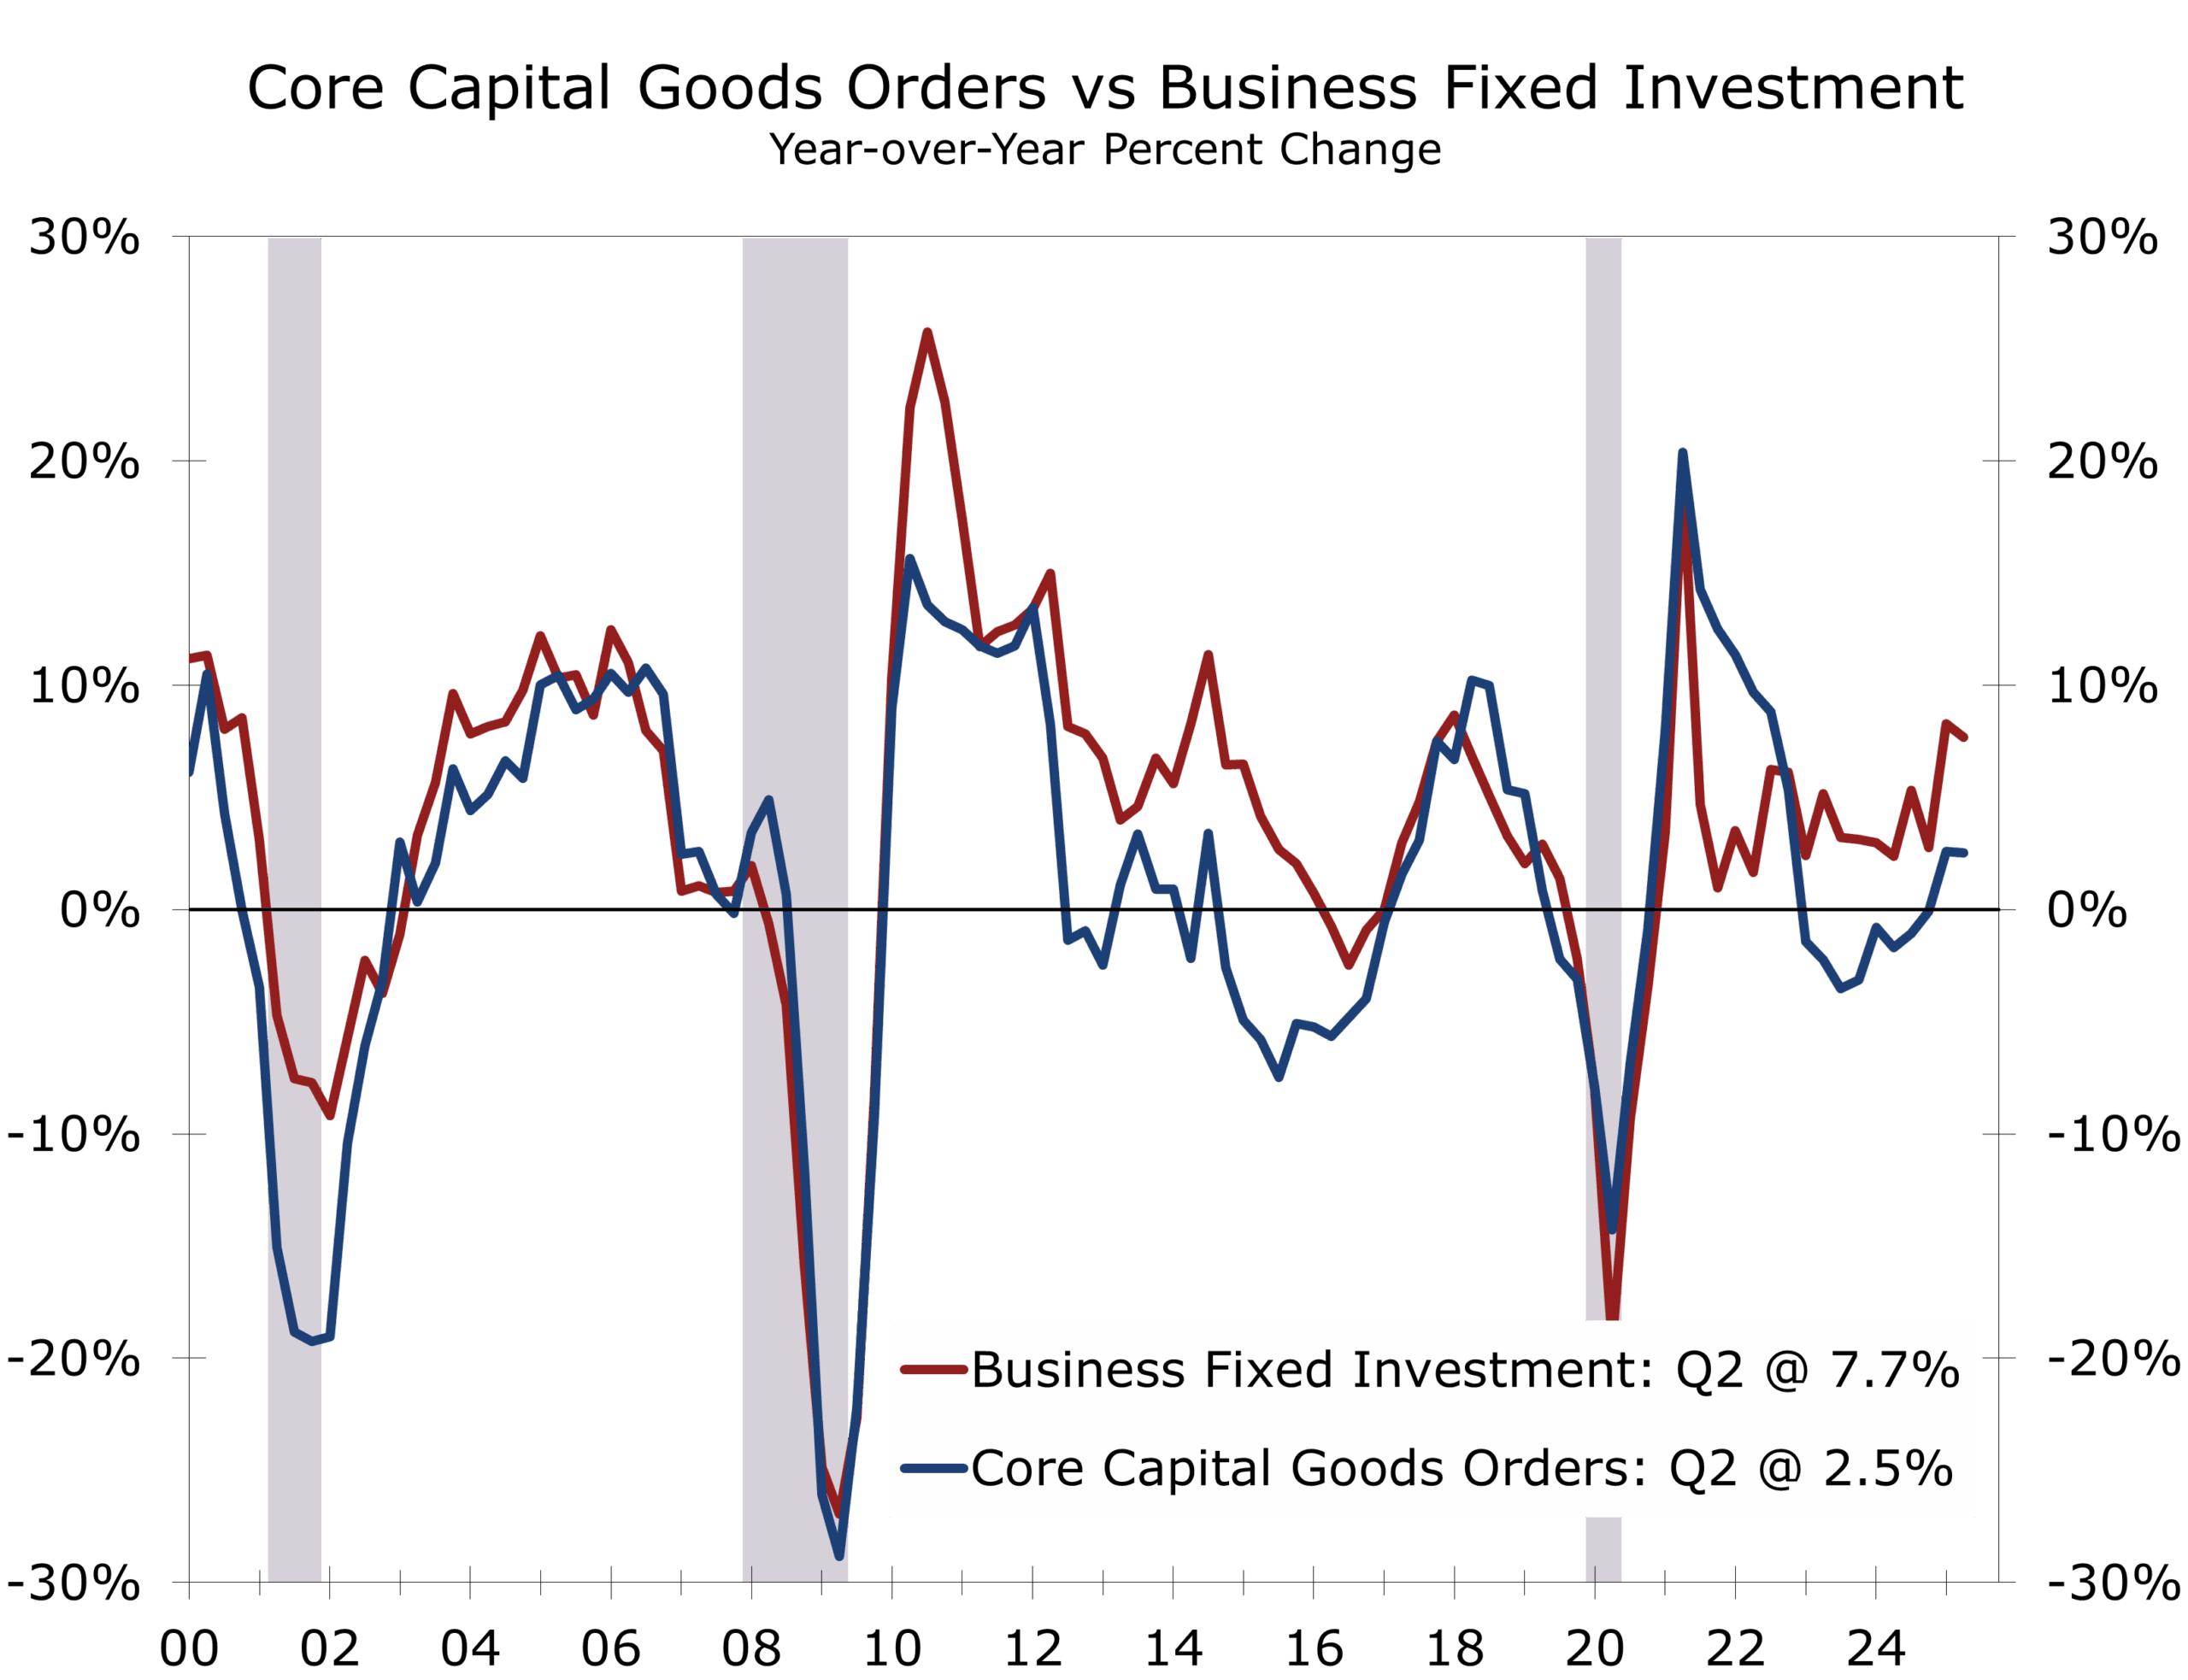
Durable goods orders continue to show resilience. Headline orders fell 2.8% in July on weak aircraft bookings, but core capital goods orders rose 1.1%, a stronger-than-expected sign that equipment spending is holding up. Shipments also improved, suggesting Q3 equipment investment may grow at a 3.2% pace versus 2.5% in Q2. While aircraft orders fell, they are up a whopping 139% year-to-date through July.
The AI buildout, aerospace, and defense continue to drive capital spending, which began Q3 strong.
Q2 GDP was revised higher, reflecting gains in structures, equipment, and intellectual property, with AI-related outlays masking broader softness. Corporate profits rebounded 1.7% in Q2, but tariff effects on margins are likely to show up in Q3. The equipment cycle remains intact, though narrowly concentrated in AI, electronics, and related capital goods. Aerospace and defense are other key drivers.
.
Trade: Import Surge Widens the Deficit
The July goods trade deficit widened by $18.7B to $103.6B, largely on industrial supplies and capital goods imports. Some of this reflects AI demand but also catch-up in orders previously delayed by tariff uncertainty. Exports were flat.
The larger trade deficit adds downside risk to Q3 GDP after Q2’s upside revision. Longer term, tariffs are providing meaningful federal revenue—estimated at $2.6T through FY2034—but at the cost of growth. Higher import costs and supply chain uncertainty are complicating capex decisions. Some major projects are moving forward under temporary tariff reprieves.
Labor Market: Cooling but Not Cracking
Weekly claims remain contained, but slower hiring remains a key theme. August payrolls are expected to rise by just 60,000, with unemployment edging up to 4.3%. Immigration declines are weighing on labor force growth, particularly in states that previously absorbed large inflows.
Slower payroll growth and higher unemployment signal easing wage pressures. But persistently low layoffs suggest firms are still hoarding labor, reflecting the high pace of retirements and tighter immigration enforcement. AI is also slowing hiring in IT fields, leading to a rising unemployment rate for young, college graduates.
Credit and Rates: The Curve Steepens
Treasury markets digested Powell’s Jackson Hole dovish tone, only to be jolted by President Trump’s firing attempt of Fed Governor Lisa Cook. The episode raised additional questions about Fed independence, pushing term premiums slightly higher, and accelerated curve steepening.
Markets are keeping an eye on threats to Fed independence but show minimal concern.
Two-year yields fell 6–8bps while long bonds edged higher. The 2s/10s spread broke out to 63bps, the widest since early 2022. Corporate spreads remain historically tight, with IG spreads near late-1990s lows. Funding remains accessible, but the risk of abrupt repricing lingers.
A September rate cut remains likely—but will not necessarily be the start of a deep easing cycle. Markets may be over-pricing cuts. Front-end relief is likely, but long-end volatility remains a risk.
Geopolitical Developments: A World on Edge
Israel expanded its proactive military posture, successfully striking targets in Yemen, Syria, and Gaza City. These operations underscore Israel’s view that it is fighting for its survival against adversaries determined to erase it from the map. The elimination of Hamas propagandist Abu Obeida was both a symbolic and operational success, weakening Hamas’s highly effective psychological warfare machine.
Russia has intensified its information warfare campaign across Europe and the U.S., leveraging nuclear threats, propaganda about “inevitable victory,” and divisive rhetoric aimed at weakening Western resolve. Ironically, the strong show of unity among European leaders during recent Oval Office meetings may have hardened Putin’s determination to divide the West. Look for the U.S. to boost armament shipments to Ukraine via European partners.
The Western Hemisphere is also in flux. Guyana’s elections highlighted the fragility of regional stability. Violence erupted when ballot boxes traveling through the disputed Essequibo border region—claimed by Venezuela and rich in hydrocarbons—came under fire from across the border. Venezuela, having ignored a UN ruling to refrain from holding referenda in the territory, continues to challenge Guyana’s sovereignty. Against this backdrop, the U.S. Navy’s deployment of destroyers, amphibious ships, and a submarine near Venezuela is more than counter-narcotics enforcement—it is a signal that Washington is prepared for contingencies in a region where disputed oil wealth and authoritarian governance collide.
Geopolitical pressures continue to fester on multiple fronts but with minimal market impact.
Recent developments point to persistent geopolitical tail risks. Israel’s widening front raises the prospect of an endgame in Gaza and renewed push for the Abraham Accords. Iran will likely attempt to disrupt that timetable. Russia’s disinformation efforts could inject volatility into European assets and policymaking. And in the Americas, Guyana’s elections and the U.S. Navy’s posture near Venezuela tie local politics to global energy dynamics, with potential consequences for oil supply and market volatility.
Appeals Court on Tariffs: Exec Authority Checked
The Court of Appeals for the Federal Circuit dealt the administration a setback last week, ruling 7–4 that the president exceeded his authority in imposing broad-based tariffs under the International Emergency Economic Powers Act (IEEPA). The decision effectively affirmed a lower court’s judgment that tariff authority resides with Congress, not the White House. For now, however, the tariffs remain in place. The court stayed its ruling until mid-October and further delayed enforcement should the administration, as expected, appeal to the Supreme Court. That appeal could extend the tariffs’ life until at least June 2026.
While the ruling clipped one legal avenue, it did not strip the president of tariff powers altogether. The administration could lean on other statutes, including Section 122, which permits tariffs of up to 15% for seven months, or Section 301, which allows for country-specific tariffs, as was used against China in 2018–2019. Both tools are more limited and cumbersome, and an eventual shift away from blanket IEEPA tariffs may push the administration toward narrower sectoral levies—particularly in areas like semiconductors, pharmaceuticals, or furniture—rather than sweeping reciprocal duties.
The administration will likely pivot on tariffs toward specific targeted industries and regions.
How the Supreme Court would rule is far from a sure thing. The majority of the Appeals Court judges were appointed by Democrats and two of the three Republican-appointed justices sided with the president. Treasury Secretary Bessent has argued that tariffs are a tax and would thus be deflationary, which provides a wedge for opponents to argue against tariffs in court. Only congress has the ability to levy taxes. The counter argument is that tariffs work like a tax and are allowed to be placed by the president for several reasons, including national defense and in response to unfair practices overseas.
The implications are threefold. First, the ruling introduces fresh uncertainty into the investment climate. Companies that front-ran imports to avoid tariffs are unlikely to adjust quickly given the possibility of a Supreme Court appeal and continued tariff exposure. Second, the prospect of refunds or retroactive claims if the tariffs are struck down creates fiscal and market volatility, with potential knock-on effects for Treasury issuance and long-term yields. Finally, the case reasserts judicial limits on executive trade powers, a reminder that tariff-first diplomacy, while potent, may prove less durable when tested in court. For markets, the net effect is more uncertainty rather than less.
Risks to Watch
- Tariff-driven inflation: Core PCE is expected to rise back slightly above 3% later this year. A larger move would complicate the Fed’s easing path and likely unnerve the financial markets.
- Fed independence erosion: The markets have largely ignored the Lisa Cook controversy. Further political interference could increase long-end yields, raising borrowing costs even as front-end rates fall.
- Treasury market liquidity: With deficits wide and issuance heavy, even modest shocks could trigger funding stress, ending what has been an unusually good borrowing environment.
- Energy and commodity shocks: Israel’s strikes and U.S. naval moves near Venezuela raise the risk of sudden supply disruptions. WTI oil appears anchored between $60 and $80 a barrel. The markets are pricing in a status quo for both issues, as well as Ukraine-Russia.
The Week Ahead
- Tuesday, Sept 2: ISM manufacturing and construction spending. Manufacturing remains near the 50 threshold; construction is soft, with upside from nonresidential projects like data centers and pharma.
- Wednesday, Sept 3: JOLTS job openings, Beige Book, Auto Sales. Look for continued declines in job openings and quits; Beige Book should reveal tariff effects. Auto Sales likely steady at 15.5–16.0m units.
- Thursday, Sept 4: ADP employment, productivity, jobless claims, trade balance, ISM services. ADP’s deviation from BLS is now seen as more realistic. Productivity should improve modestly; services index watched for hiring/pricing.
- Friday, Sept 5: August nonfarm payrolls, unemployment, wages. Expect around 60k payrolls, unemployment at 4.3%, and 0.2% wage growth. Initial August readings are often inexplicably weak and later revised higher.
Key Takeaways
Last week reinforced a central tension: the economy is resilient enough to keep consumers spending and businesses investing in select sectors, yet fragile enough that the Fed is poised to ease. The prudent course is to secure near-term funding at lower front-end yields, hedge long-end risk, and prepare for tariff-induced surprises.
Geopolitics remain a wild card. Israel’s regional strikes, Russia’s disinformation push, and U.S. naval maneuvers underscore the unpredictability of global risk. The appeals court ruling on tariffs adds another layer of uncertainty, reminding markets that policy made by executive fiat may not withstand judicial scrutiny.
The economy, like the dance floor in July’s income report, still feels steady—but the band is about to change tunes, and no one wants to be caught mid-step when the tempo shifts.
Disclaimer: This publication has been prepared for informational purposes only and is not intended as a recommendation offer or solicitation with respect to the purchase or sale of any security or other financial product nor does it constitute investment advice.
September 2, 2025
Mark Vitner, Chief Economist
mark.vitner@piedmontcrescentcapital.com
(704) 458-4000
July Personal Income and Spending: Consumers Appear Set to Keep Dancing Until the Music Stops
Still Dancing but to a Softer Tune
-
- Personal income rose 0.4%, with after-tax income also up 0.4%, led by healthy gains in wages & salaries, which jumped 0.6% on broad-based strength.
- Consumer spending rose 0.5% nominal, 0.3% real. Goods purchases solid — particularly durables (+2.0%) — while services slowed.
- PCE inflation rose 2% and is up 2.6% y/y, slightly softer than expected. Core PCE rose 0.3% and is up 2.9% y/y, broadly in line with expectations.
- The personal saving rate slipped to 4%, still well above the 2023 low of 3.5%, when recession fears were widespread.
- Consumer sentiment slipped in August, as inflation expectations edged higher despite softer PCE readings
- The latest data point to greater economic resilience heading into Q3, with optimism around back-to-school spending. A rate cut looks likely in September, but there is less urgency for the Fed to cut as aggressively as markets have priced in. Delivering fewer cuts could help bend the long end of the yield curve lower and provide more relief to housing.
From recession fears to resilience
In both 2022 and 2023, personal income and spending reports were read through the lens of imminent recession. Income growth was soft, often just +0.2% per month, as government transfer payments fell and disposable income stalled. The saving rate collapsed to 3.5% in July 2023, down sharply as consumers dipped into reserves to fund discretionary outlays on travel, concerts, and entertainment. Inflation, though moderating, remained sticky — core PCE was 4.2% y/y in July 2023, well above the Fed’s target.
By contrast, July 2025 shows the economy on a firmer footing. Income gains are broader, wages are accelerating, and real disposable income is rising modestly. Spending is advancing without relying heavily on saving drawdowns, and the saving rate — while still below pre-pandemic averages — is demonstrating resilience. Consumers are still dancing, but this time the floor feels steadier beneath their feet.
With the saving rate at 4.4% vs. 3.5% in July 2023, households appear less vulnerable.
With much of consumers’ pandemic-era savings drawn down, spending now more closely tracks wages and salaries, which are up a respectable 6.2% over the past year. Even factoring in 4% inflation, real consumption should remain solidly positive, providing some cushion against a likely slowdown in job growth. While hiring has slowed, firms are holding onto workers.
Spending headed into Q3: less boom, more balance
Real consumer spending rose +0.3% in July, led by durables (+2.0%). In 2023, spending was juiced by one-off events like Amazon Prime Day, blockbuster movie releases, and record travel demand. Today’s picture is steadier, with optimism around the back-to-school season giving Q3 momentum. That steadiness lowers the risk of an abrupt pullback and raises hopes for a solid holiday season.
Q3 consumer spending is tracking a 1.5% annualized rate, above earlier forecasts.
Motor vehicles and parts were a major contributor to July’s gains, and their tracking suggests real consumer spending could rise at a 1.5% annualized pace in Q3, versus their baseline of 1%. Part of July’s big increases was likely due to higher prices, however, with tariffs boosting new car prices, repair costs, and also the prices for major household appliances, such as washing machines. While one month doesn’t make a quarter, the stronger start lends upside risk to growth forecasts.
Inflation: better than expected, but risks ahead
The July PCE deflator rose +0.2% m/m, slightly below consensus, while the core deflator increased +0.3%, in line with expectations. Both headline and core are running in the “2s,” a marked improvement from 2022–2023, when core was above 4%.
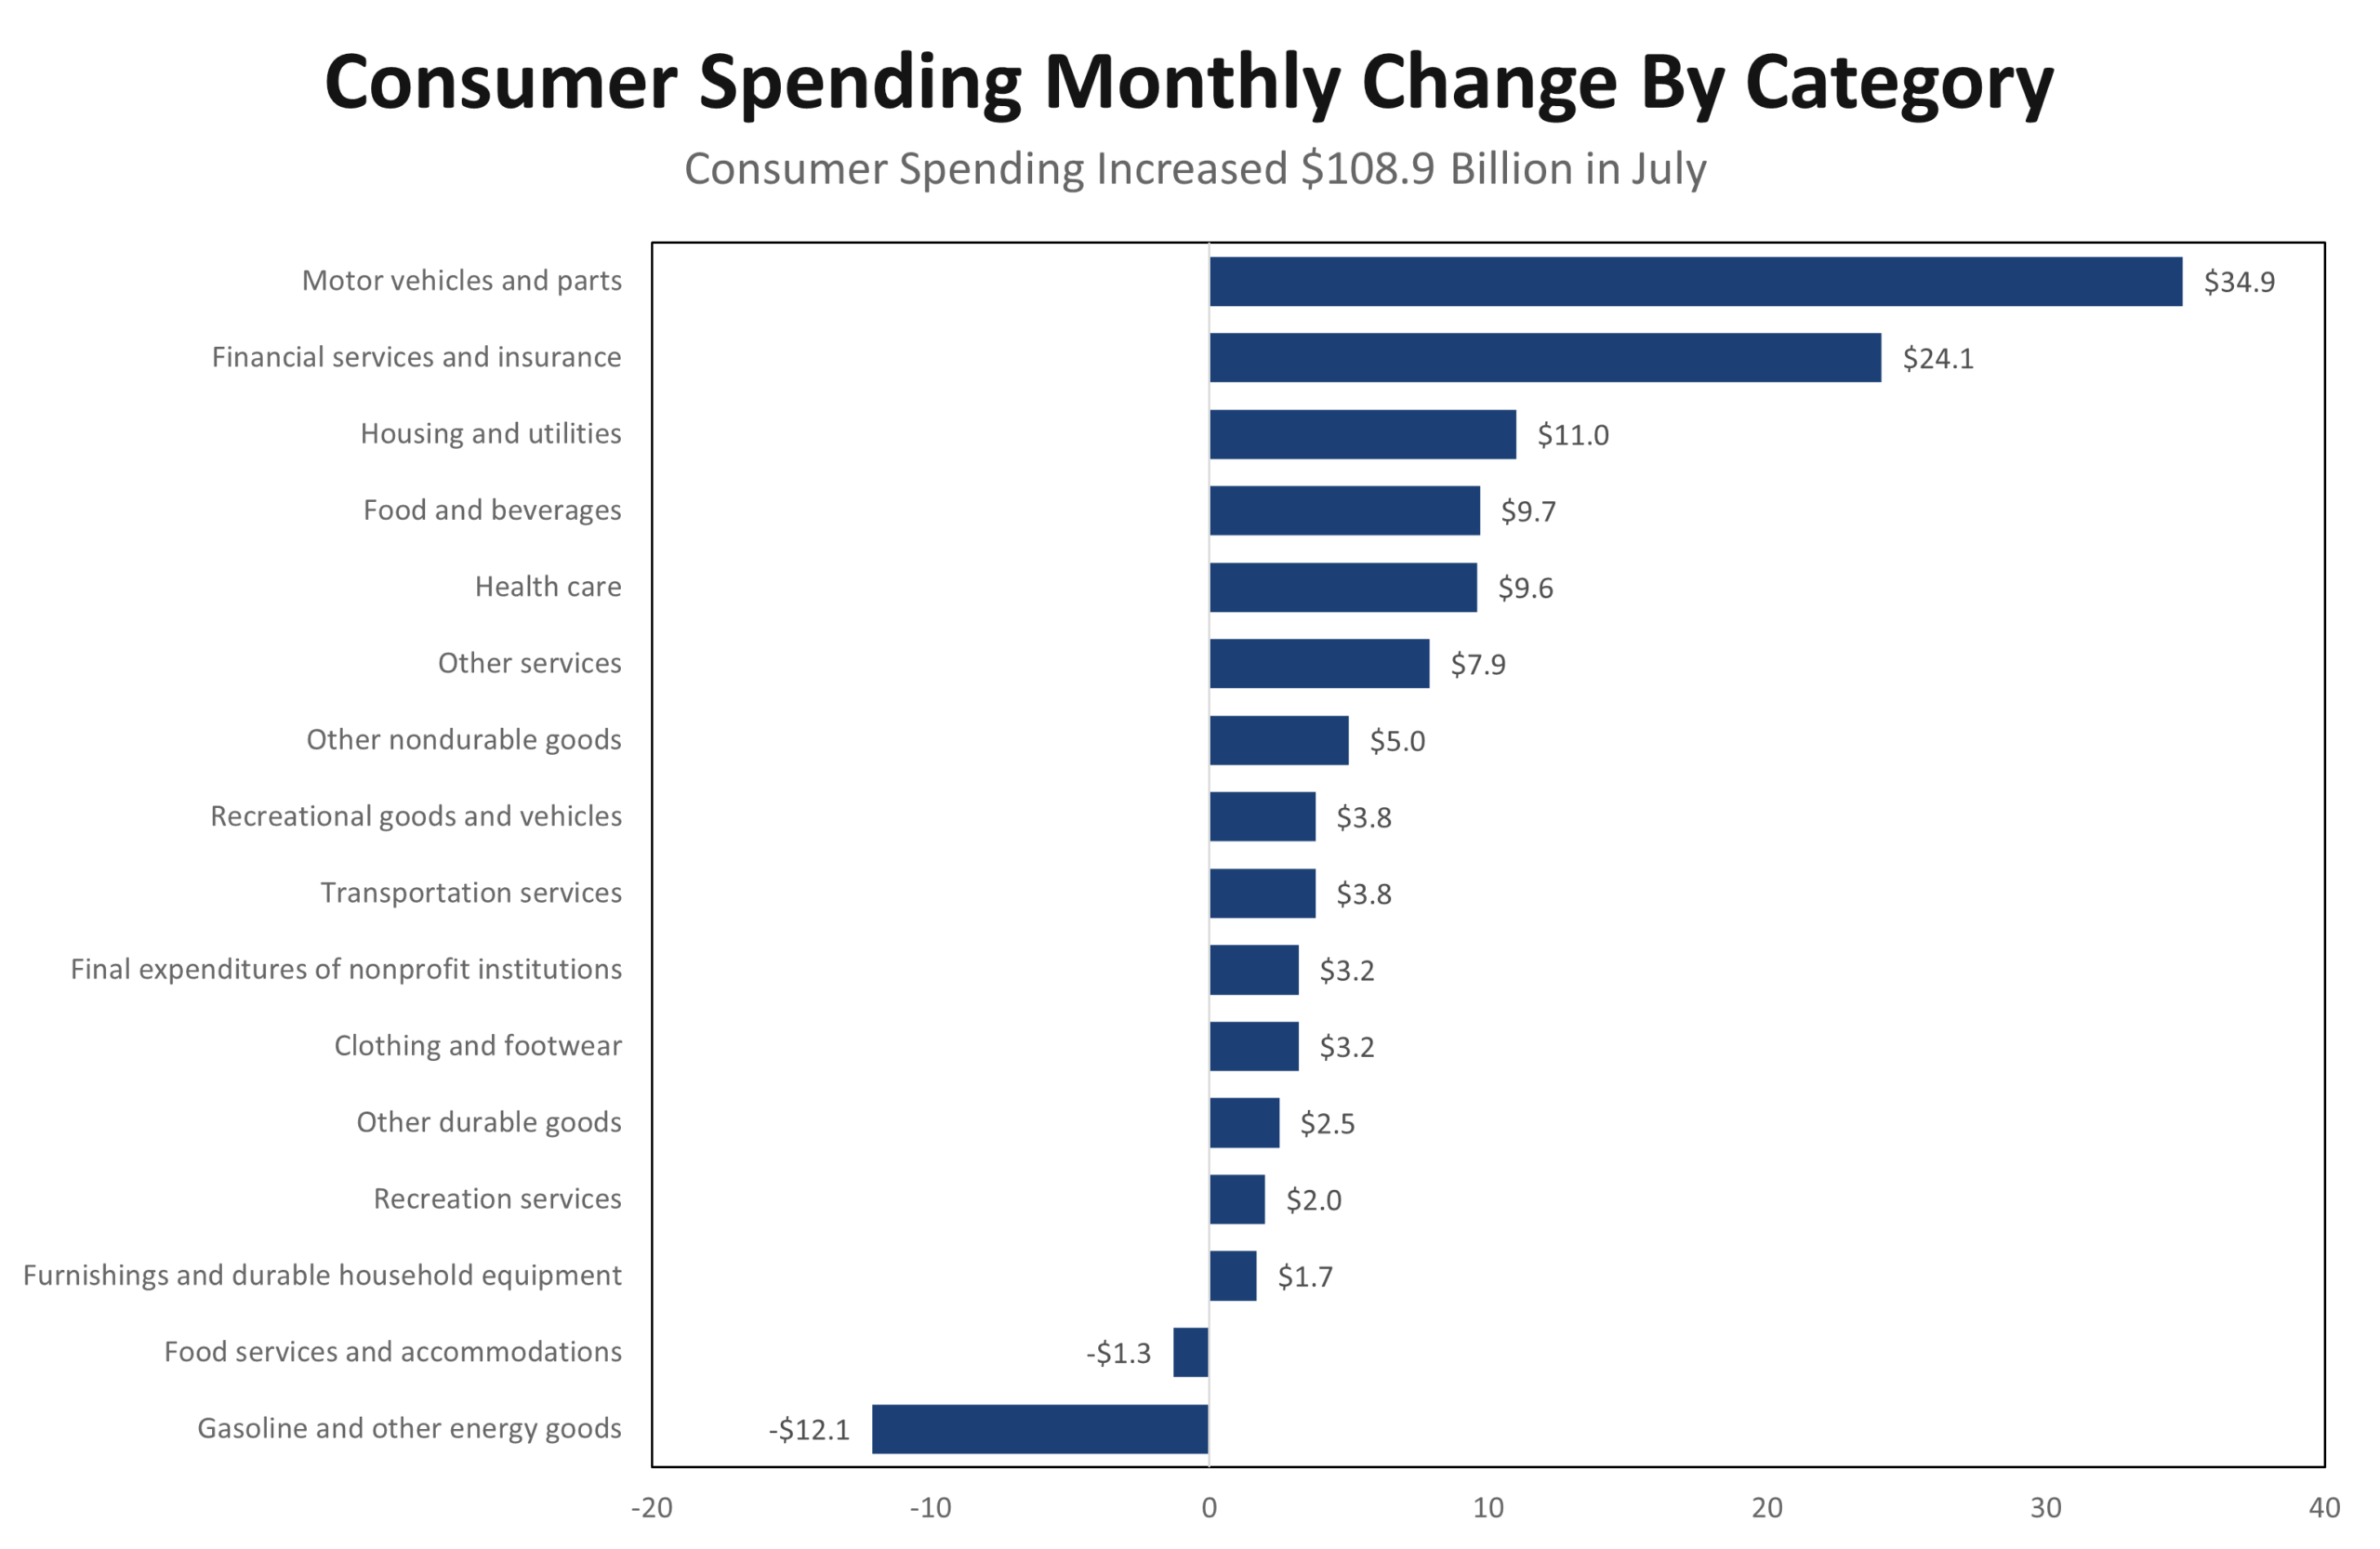
Goods prices were generally flat-to-lower in July, helped by a sharp drop in energy. Services rose 0.3%, led by a jump in financial services tied to strong equity market gains. For now, consumers are enjoying an easier rhythm.
Yet tariffs are still widely expected to push the core PCE deflator back above 3% later this year. That looming shift tempers today’s relief and ensures the Fed will tread cautiously.
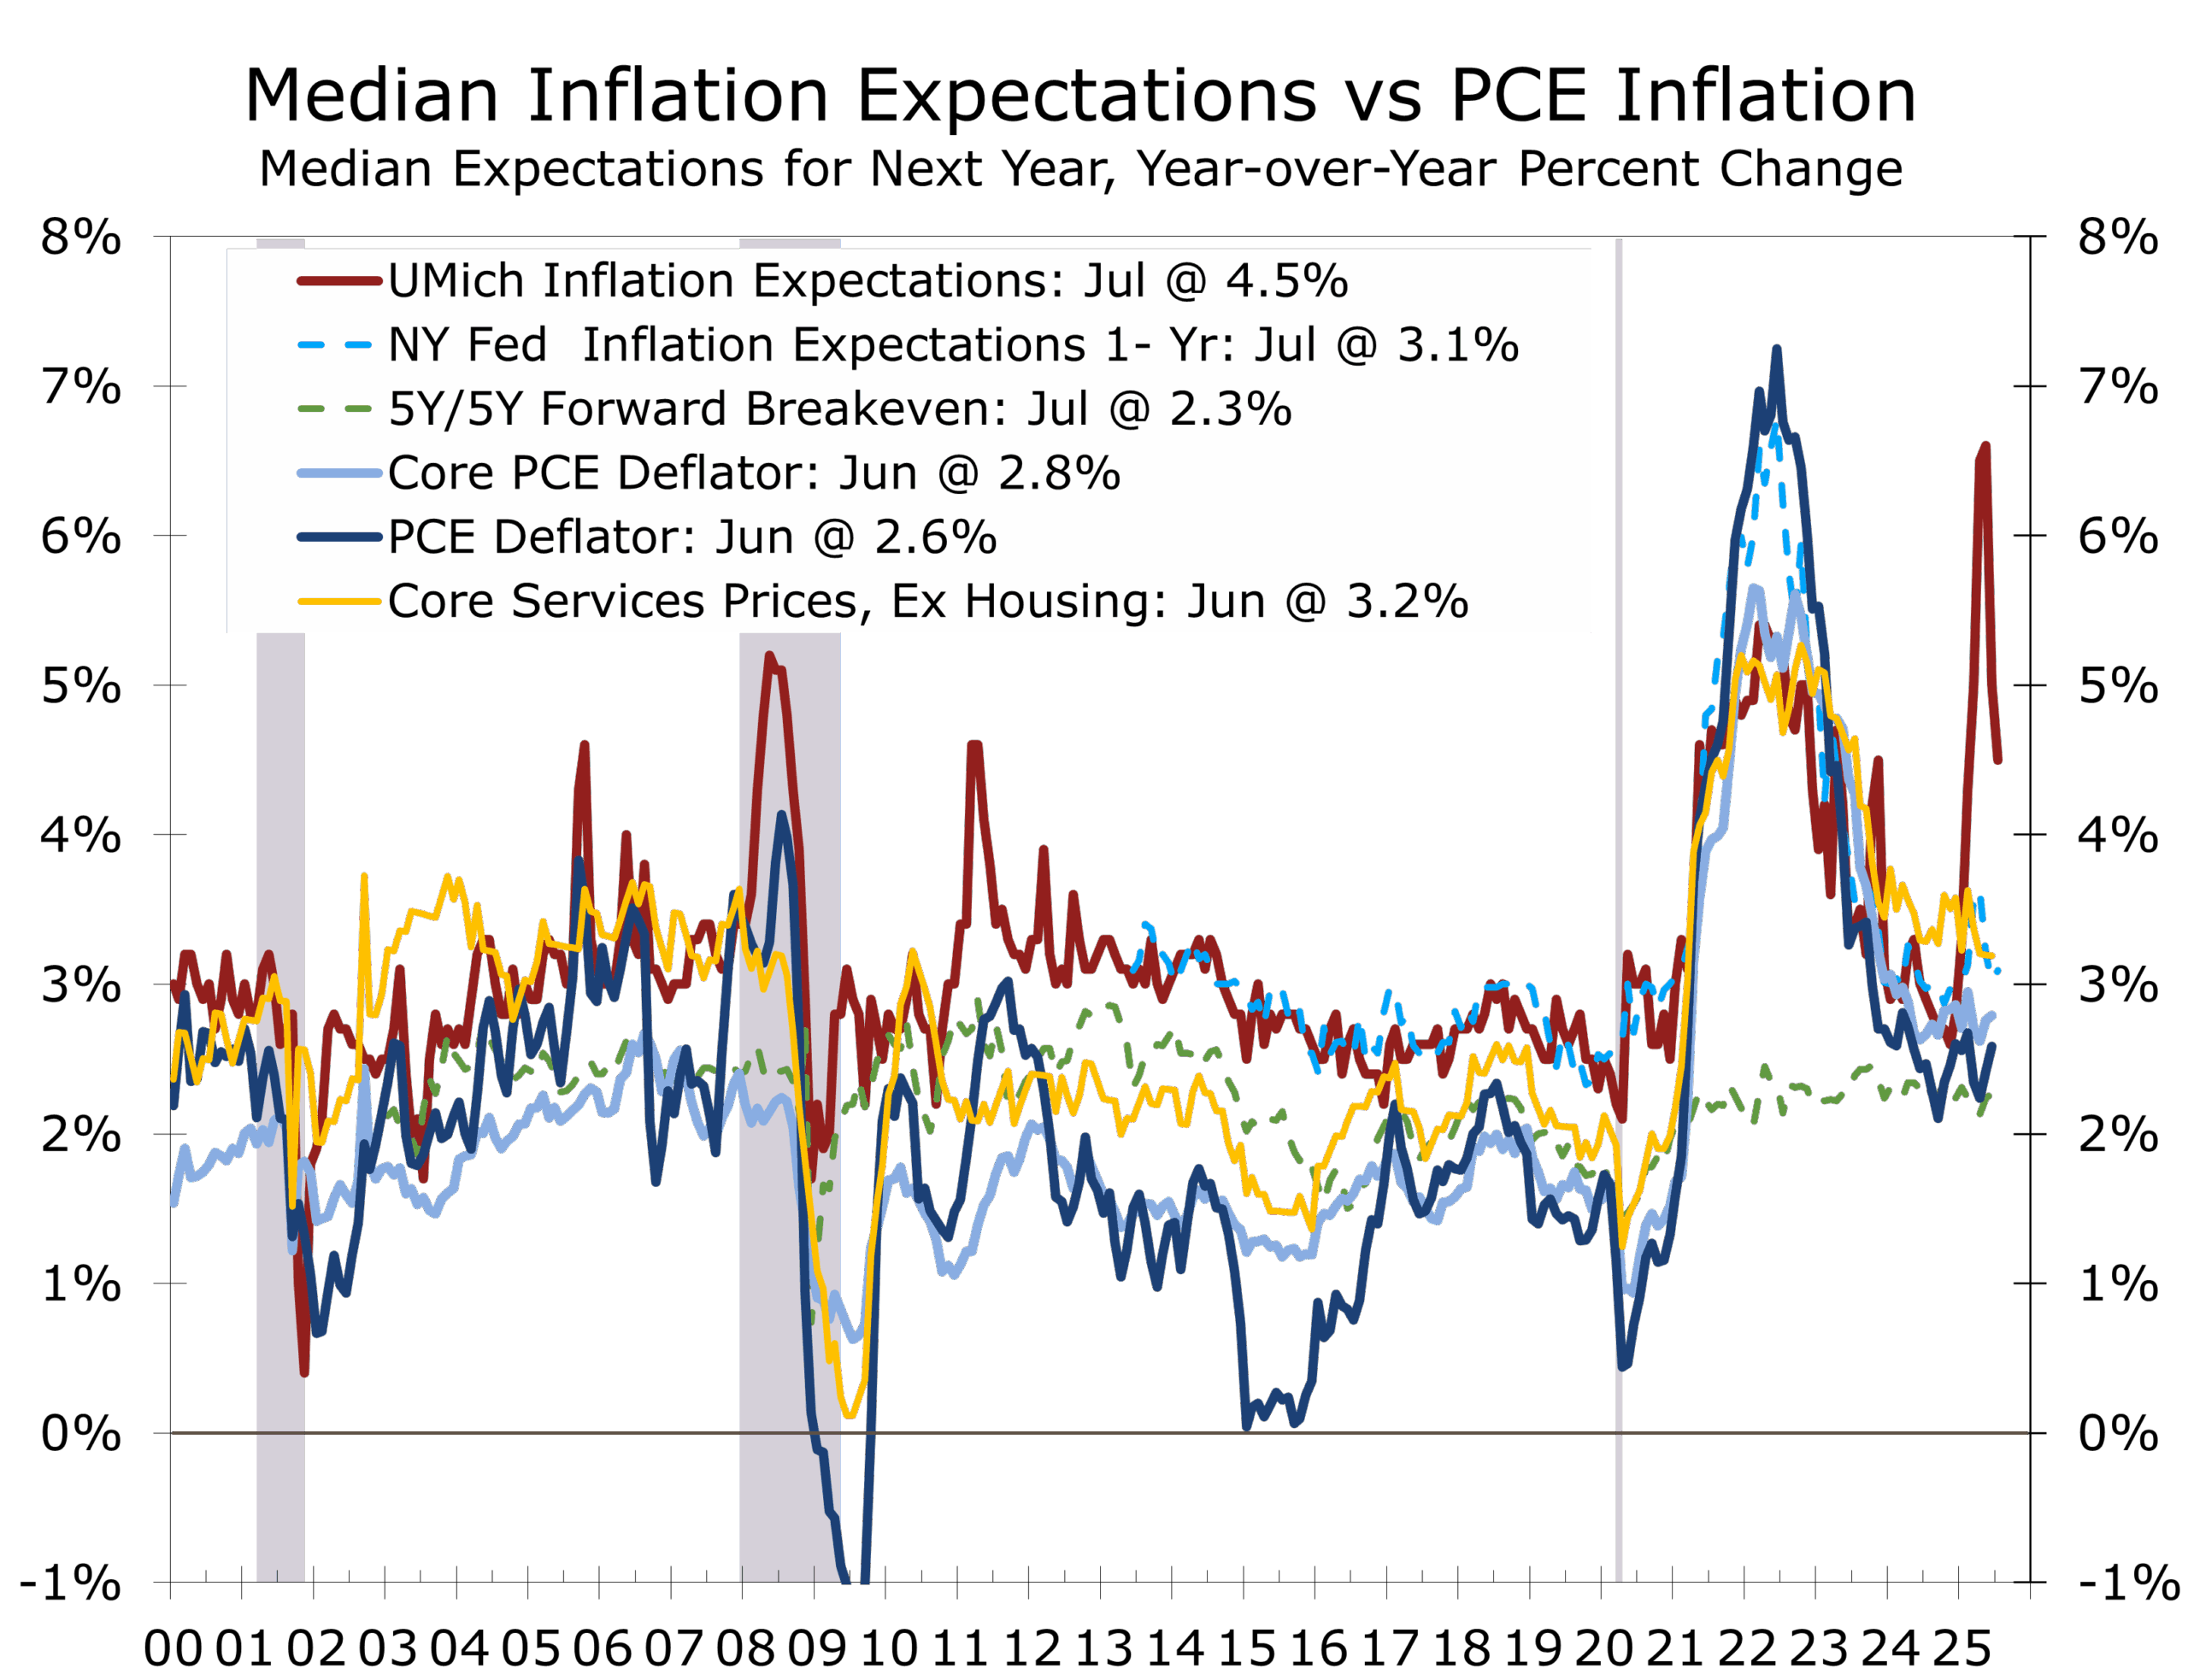
Consumers’ fears of inflation are much worse than actual inflation or the market expectations.
Consumers’ view: sentiment lags the data
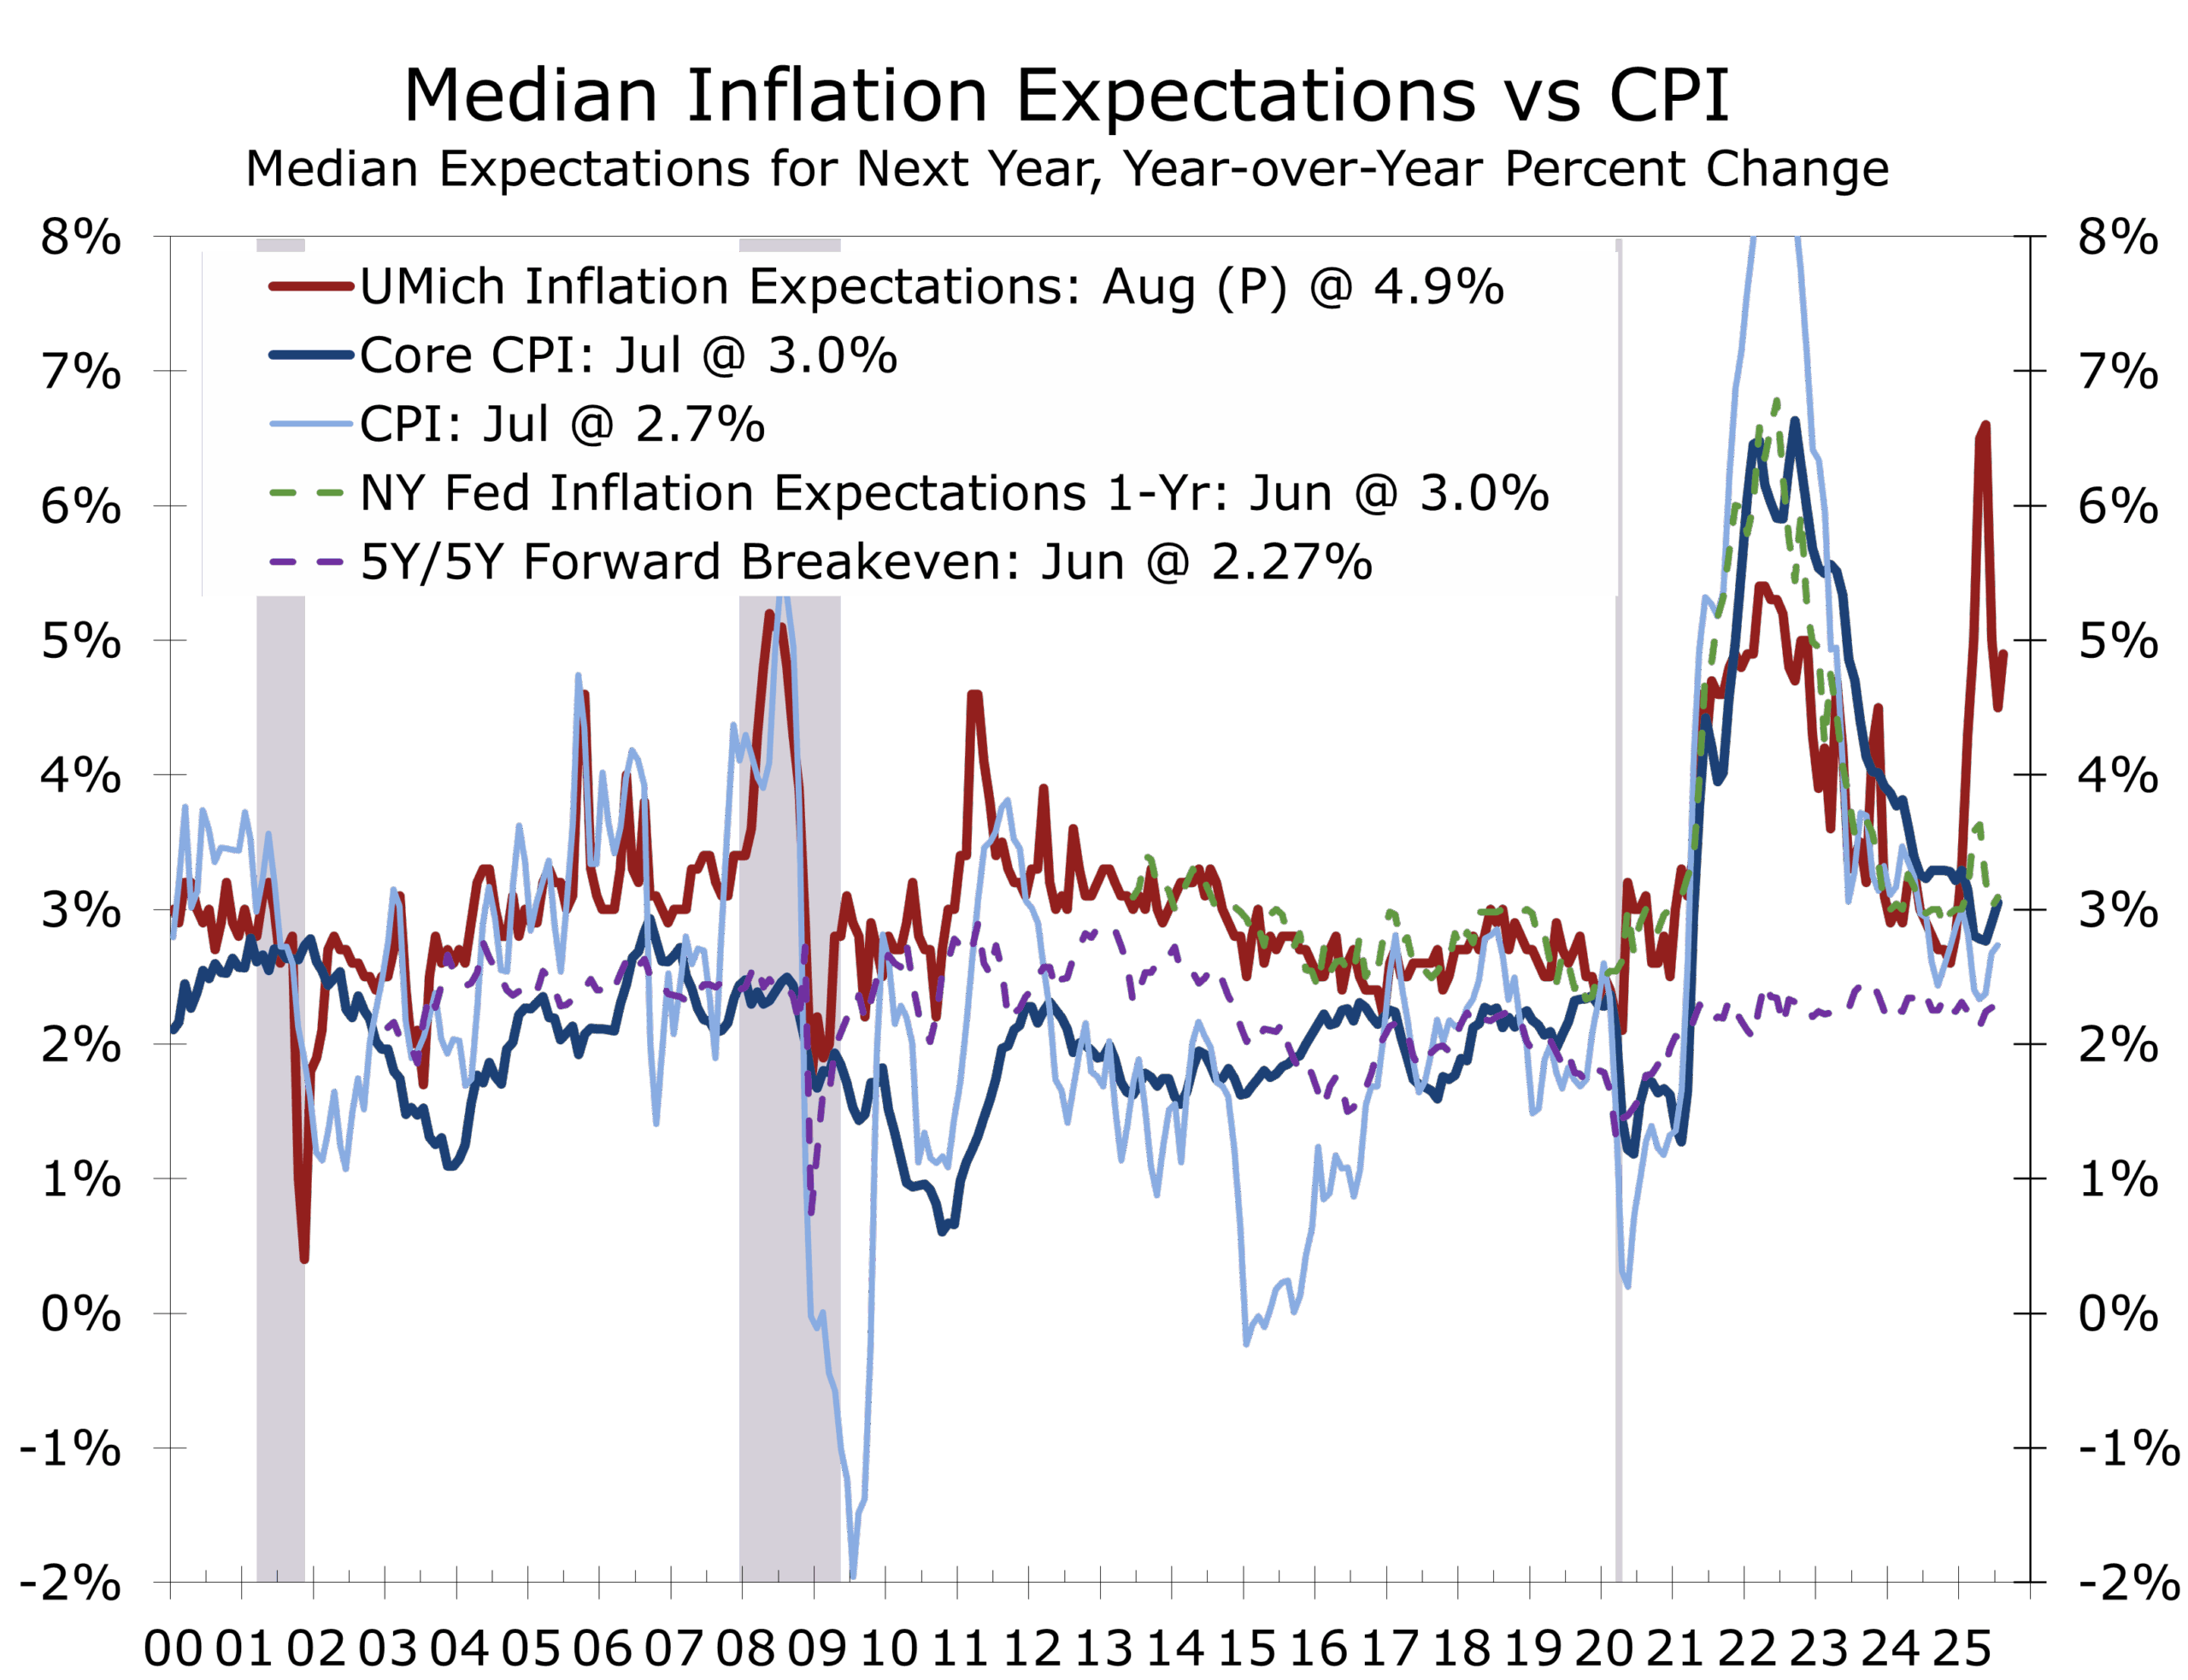
Even with firmer income growth and softer inflation readings, the public mood remains dour. The latest University of Michigan survey shows consumer sentiment slipping, with inflation expectations ticking higher. Consumers’ fears of inflation are much worse than actual inflation or the market’s expectations.
Consumers are likely taking note of their reduced purchasing power from earlier price hikes. Higher prices for necessities — housing, groceries, new and used cars, and the ongoing increases in operating expenses like maintenance, repairs, and insurance — has left households with less discretionary income. While forecasters see resilience, households feel squeezed, which explains why recession fears remain elevated even as the data point to stability.

Fed outlook and the yield curve
Annual revisions, due September 26, will carry unusual weight. If wages and salaries are truly growing as solidly as July’s report suggests, the Fed has justification to take more time before cutting rates. A September cut is still expected, but after that officials may skip meetings or signal fewer cuts than markets currently anticipate.
One way to bring the long end of the yield curve down more sustainably might be to deliver fewer cuts in the near term. This approach could ease financial conditions in housing and other rate-sensitive sectors without stoking renewed inflation pressure.
Bottom line
Compared with the heightened fears of 2022–2023, today’s landscape looks sturdier. Consumers are spending steadily, wages are supporting growth, inflation is easing more than expected, and the saving rate is healthier. Recession worries remain high among households, but forecasters see an economy that is a little further from the edge — and a Fed that can adjust the tempo of easing with less urgency.
Consumers remain on the dance floor, and while the music may have slowed, the steps are steadier and more sustainable.
Disclaimer: This publication has been prepared for informational purposes only and is not intended as a recommendation offer or solicitation with respect to the purchase or sale of any security or other financial product nor does it constitute investment advice.
August 29, 2025
Mark Vitner, Chief Economist
(704) 458-4000
Housing Starts Rise to Five-Month High in July
A Summertime Surge in Apartment Starts?
-
- Housing starts rose 5.2% in July to a 1.428 million SAAR, the strongest pace since February, and up 12.9% from a year earlier, with upward revisions to prior months adding further support.
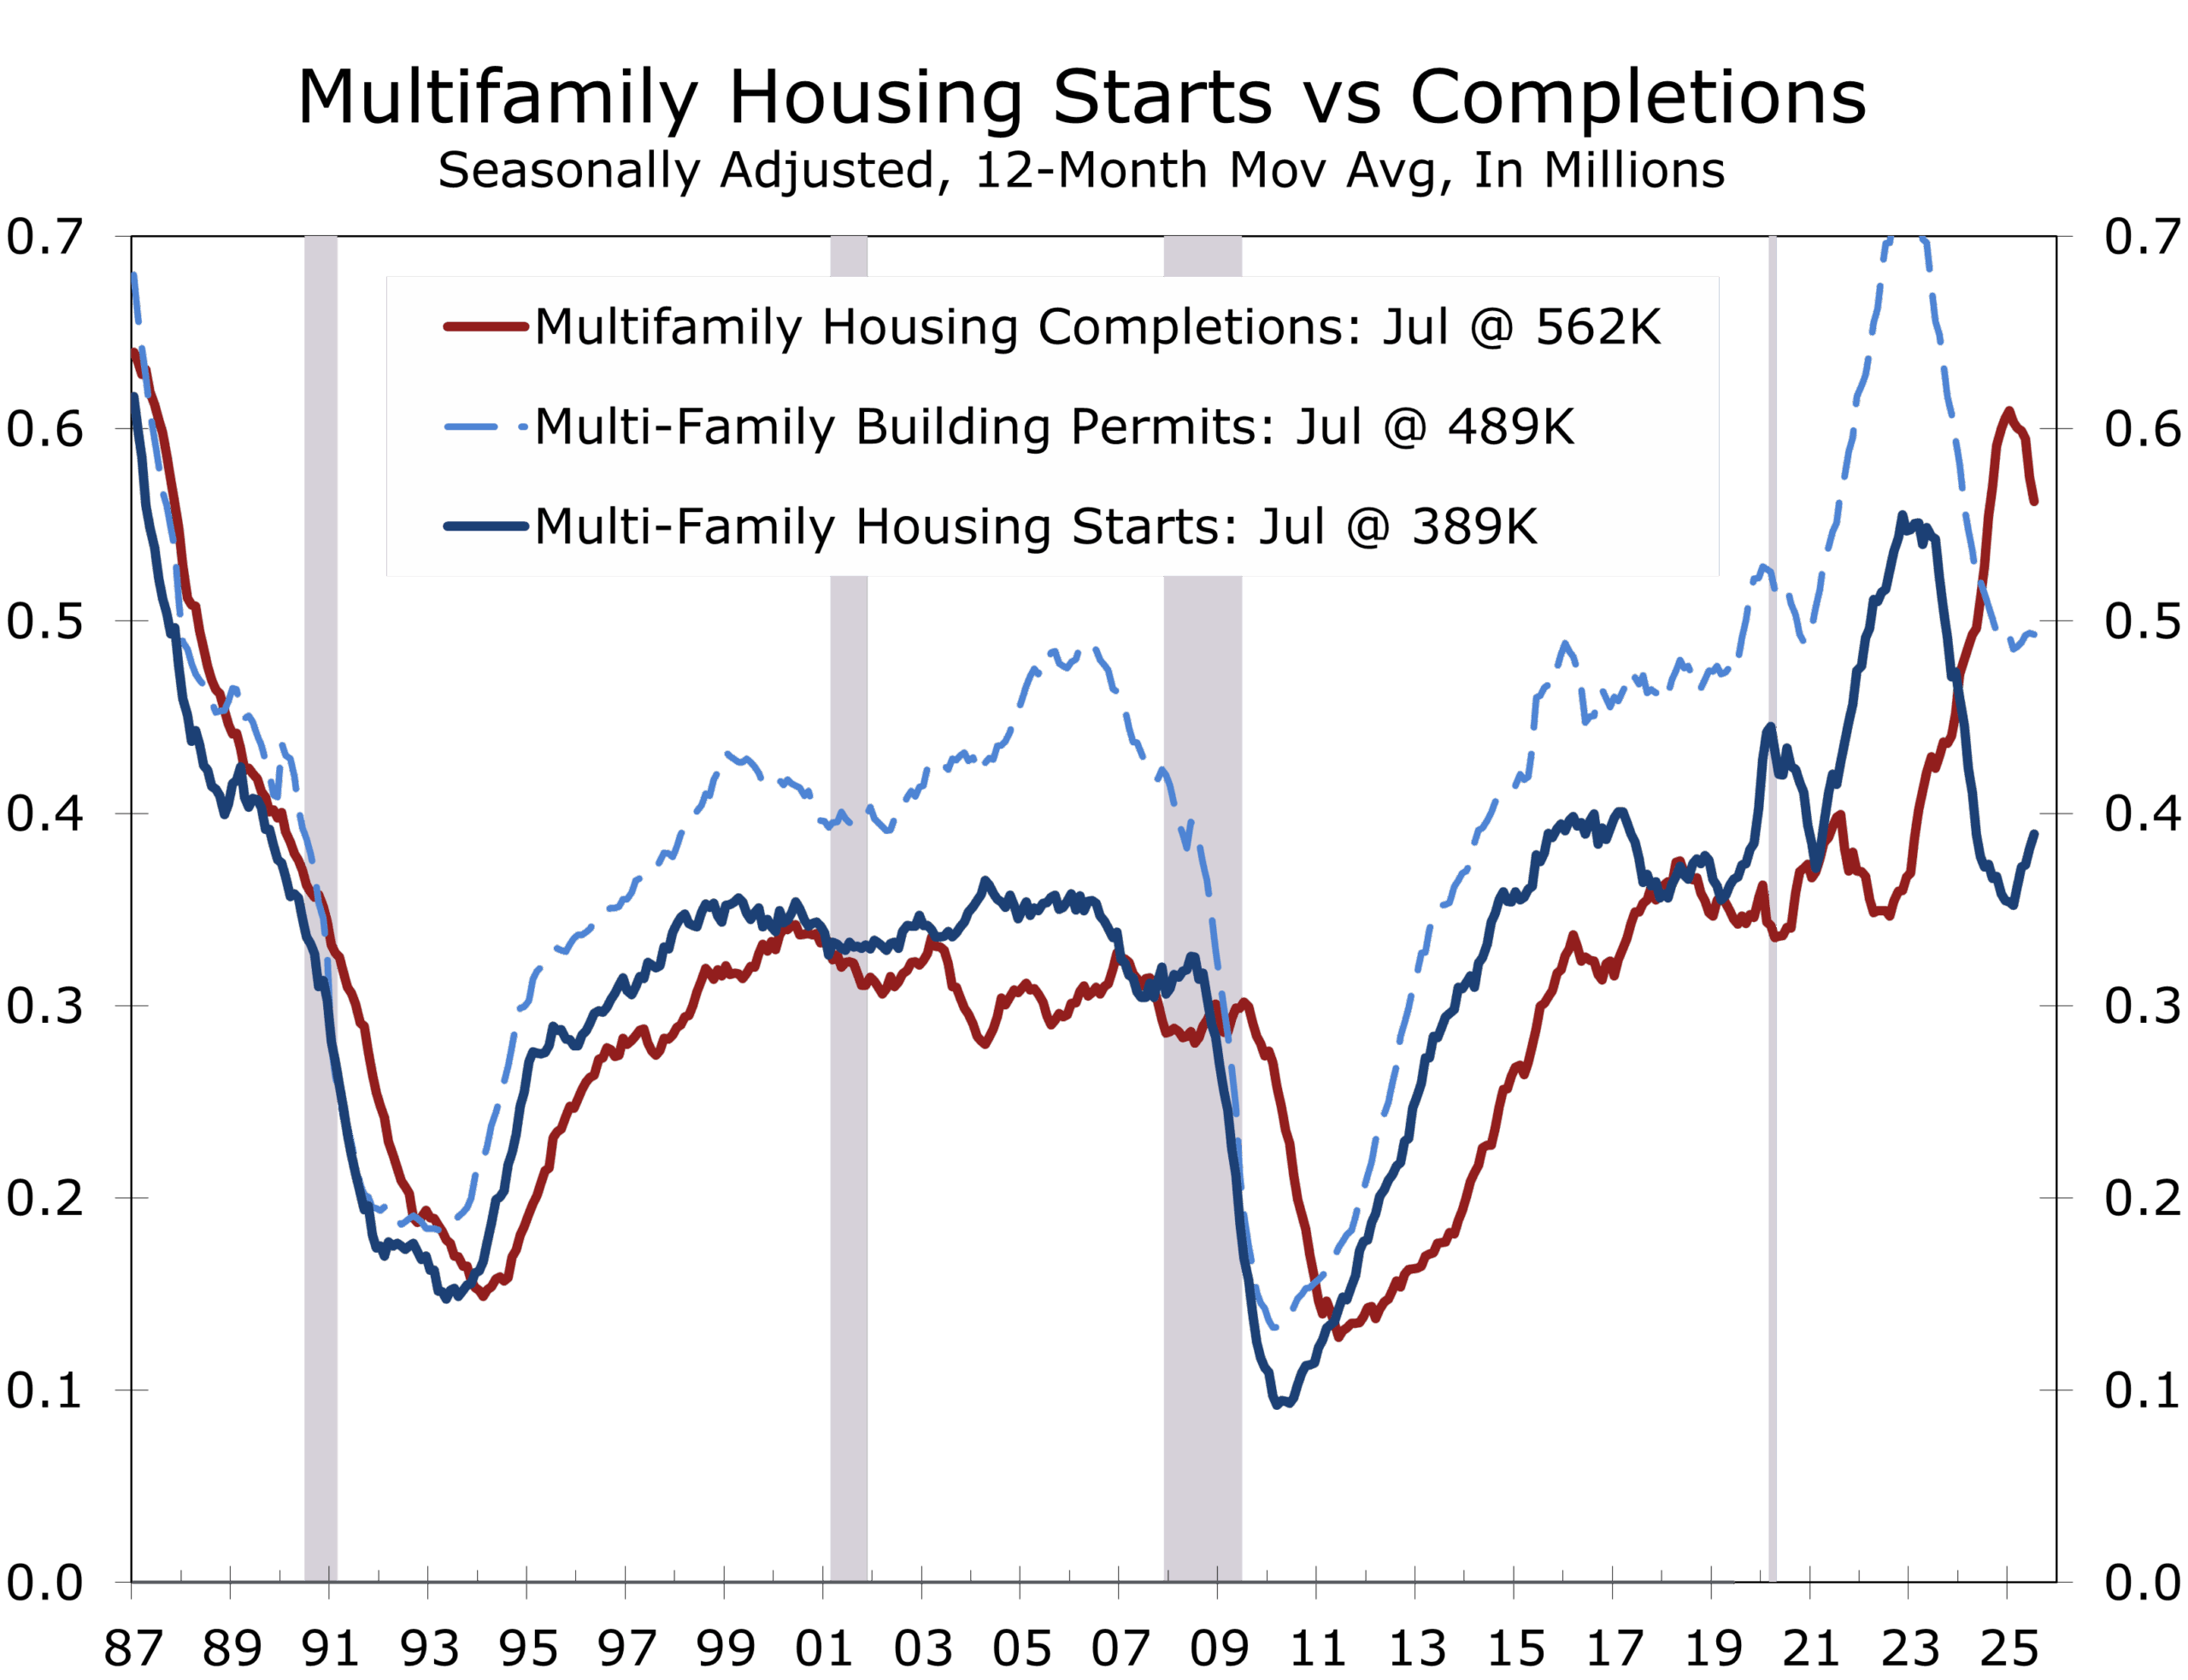
- Single-family starts edged up 2.8% to 939,000, while multifamily starts jumped 9.9% to 489,000, the highest since May 2023.
- Building permits fell 2.8% to 1.354 million, a five-year low, with single-family up modestly (+0.5%) but multifamily off sharply (-8.2%).
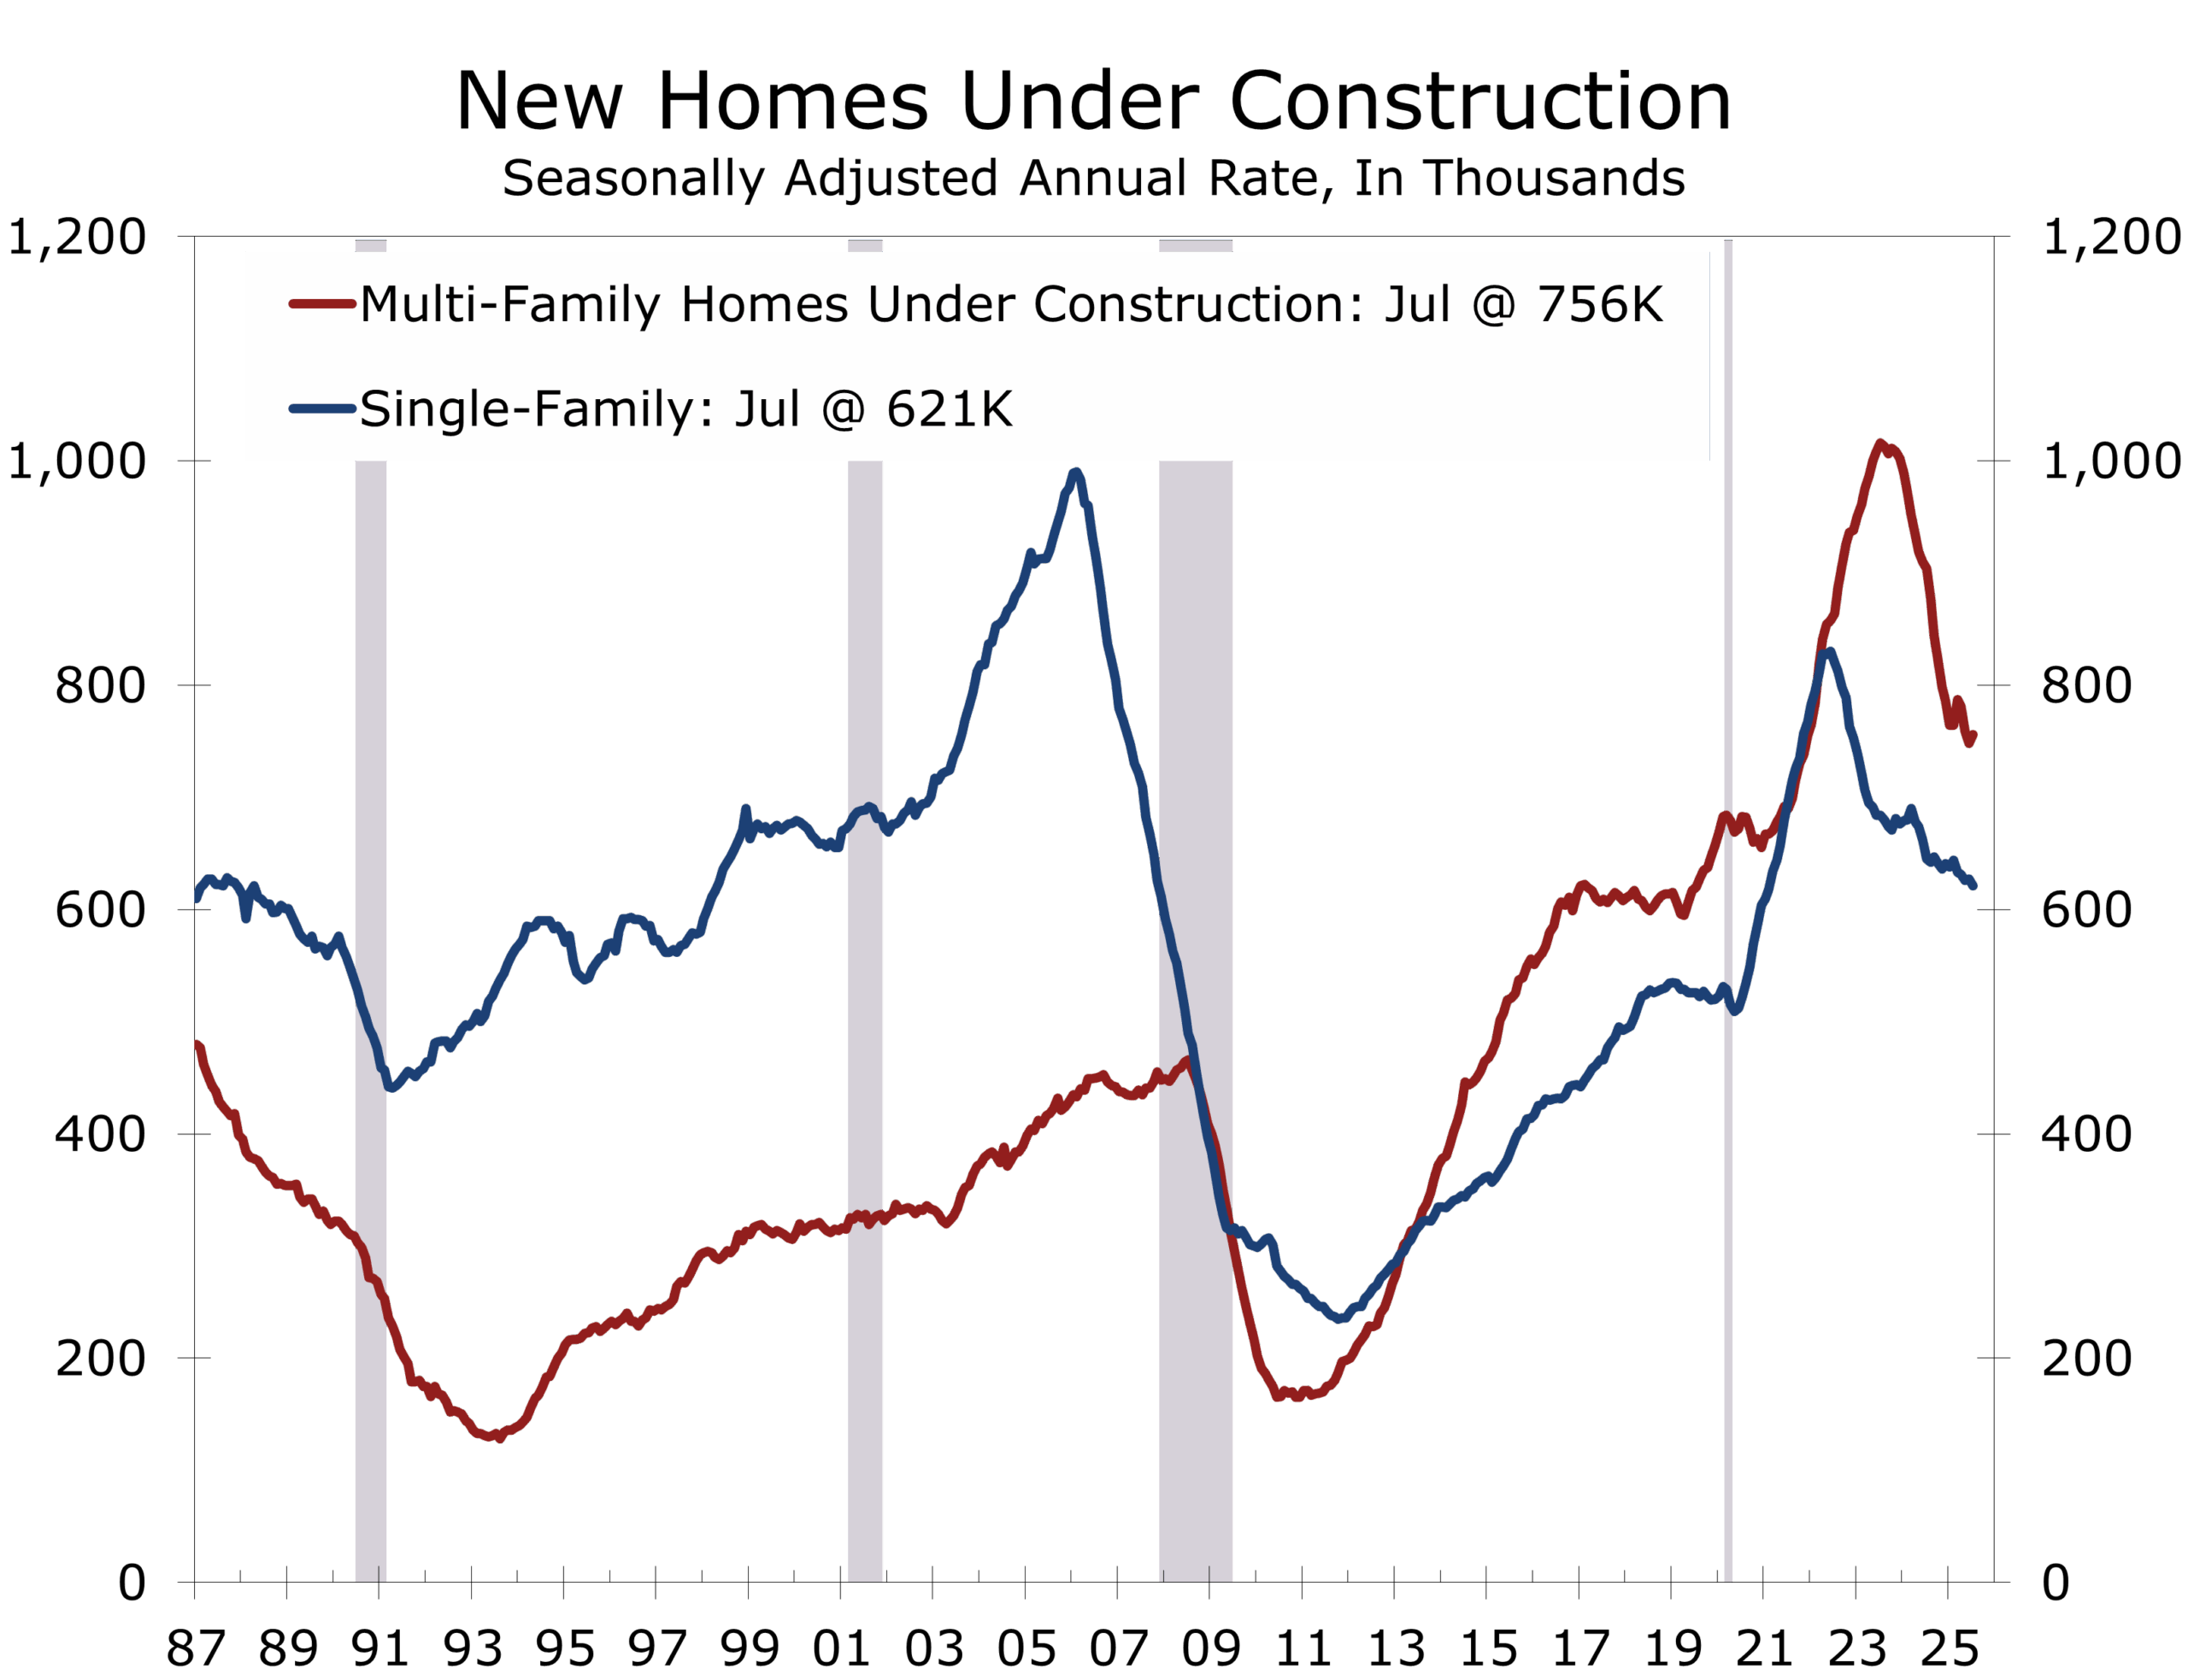
- Housing completions climbed 6.0% to 1.415 million, with single-family completions up 11.6% and multifamily up 2.9%, though units under construction remain elevated at 1.357 million, signaling ongoing supply pressures.
- Housing completions fell 4.0%, with single-family completions rising 7.1% and multifamily completions falling 20.8%.
- Builder sentiment dropped to 32 in August, the weakest since late 2022, as high mortgage rates and affordability constraints weighed on demand, with 37% of builders cutting prices and 66% offering incentives.
- Mortgage rates have eased to 6.6%, their lowest since October 2024, but affordability challenges and excess inventory are keeping buyers on the sidelines.
Apartment Building Drives Summertime Housing Starts Higher
Homebuilding reportedly firmed in July, with housing starts climbing to a seasonally adjusted annual rate of 1.428 million units. The 5.2% monthly gain was driven by a surge in multifamily construction, which offset only modest improvement in single-family building. While the rebound marks the strongest pace in five months, declining permits, which fell 2.8%, suggest that momentum may prove fleeting. Builders are discounting homes to clear inventories, which have risen to their highest levels in more than a decade.
Housing starts hit a five-month high in July, powered by a surge in multifamily construction.
July’s increase in starts was broad but driven largely by multifamily construction. Single-family starts rose 2.8% to 939,000, supported by slightly lower mortgage rates but still limited by affordability pressures. Multifamily starts jumped 9.9% to 489,000, the highest since mid-2023, though the surge may reflect reporting noise. Starts of five units or more climbed 11.6% to 470,000—the strongest July pace since the pandemic and the third highest in four decades. Permits have been running well ahead of starts for some time. Stronger than expected apartment demand this summer likely encouraged some delayed projects to break ground, especially those with permits issued earlier but postponed amid weaker conditions.
Regionally, the gains were concentrated in the South (+19.2%), which accounts for over half of all starts, and the Midwest (+33.3%), offsetting sharp declines in the Northeast (-26.0%) and West (-27.5%). Single-family starts rose only in the South, while multifamily starts tripled in the Midwest and grew strongly in the South but fell steeply elsewhere. Multifamily starts tend to be volatile on a monthly basis.
Single-family permits edged higher in July but are down 4.2% year-to-date and trending lower.
Permits offered a more cautious signal. Total authorizations fell 2.8% to 1.354 million, the lowest in five years. Single-family permits edged up to 870,000 in July. The gap between housing starts and permits quells any excitement about July’s stronger housing report. Permits are far less volatile than starts and are less prone to major revision.
Year-to-date through June, single-family permits declined 4.2% nationally to 577,600, with every region down except the Midwest (+8.2%), where affordability pressures are less severe. Houston and Dallas, the two largest markets, posted YTD declines of 8% and 10%. Starts also fell in Phoenix (-13%) and Atlanta (-14%) but held up better in Charlotte (-5%) and Nashville (-6%), while rising in Orlando (+13%) and Los Angeles (+5%).
Completions rose 6.0% to 1.415 million, with single-family completions up 11.6% to 1.022 million, reflecting builders’ focus on clearing backlogs. Multifamily completions rose modestly to 385,000. Units under construction remain historically high, most of which are apartment projects. The backlog of single-family homes under construction is more in line with historical norms and is steadily declining, hinting that single-family starts are near a bottom.
Builder sentiment continues to deteriorate, with the NAHB/Wells Fargo Housing Market Index falling to 32 in August, its lowest since December 2022. More than a third of builders report cutting prices, with average reductions of 5%, while two-thirds are offering buyer incentives. These trends reflect weak buyer traffic, affordability pressures, and caution going into the fall.
While mortgage rates have eased 40 basis points since early summer, now averaging 6.6%, high prices, labor shortages, and input cost pressures—exacerbated by tariffs—continue to constrain affordability. The recent improvement in starts provides a welcome boost but is unlikely to mark the beginning of a sustained upturn, with upward revisions to May and June appearing out of step with bloated inventories, weak builder confidence and more cautious lenders.
The outlook for housing remains challenging. With permits sliding to multi-year lows and builder sentiment eroding, construction activity is likely to soften in coming months. We expect housing starts to average 1.37 million units in the second half of 2025, with the sector continuing to drag modestly on GDP growth before conditions begin to gradually improve in early 2026
Disclaimer: This publication has been prepared for informational purposes only and is not intended as a recommendation offer or solicitation with respect to the purchase or sale of any security or other financial product nor does it constitute investment advice.
August 19, 2025
Mark Vitner, Chief Economist
(704) 458-4000
A View from the Piedmont: Our Weekly Commentary on Money, Credit, Exchange Rates & Geopolitics – Complacency in Precarious Times
Highlights of the Week
- July CPI was relatively benign, raising hopes that tariffs would not bite as hard as feared and spurred talk of a half-point cut in September.
- More recent data told a different story: headline PPI surged 0.9%, core PPI rose 0.4%, and import prices climbed 0.4%, all pointing to stubborn inflation pressures and putting the kibosh on a half-point cut.
- Retail sales strengthened in July, with control group sales up 0.5% and previous data were revised higher, lifting Q3 GDP baseline estimates.
- Consumer sentiment dipped in August, ending a four-month streak of improvement, underscoring fragile household finance.
- Trump’s Aug. 15 Anchorage summit with Putin signaled a precarious shift in U.S. posture toward Ukraine; Zelensky meets Trump August 18, in Washington with many European leaders traveling along for support.
- Equities hit record highs while Treasurys diverged, with a steepening curve on firmer PPI/import price data; markets still price around 80% odds of a September Fed cut.
- Markets remain calm and complacent via the swings in sentiment on growth and inflation ahead of Powell’s Jackson Hole keynote on Aug. 22, but risks are mounting.
Dog Days, Lingering Pressures
The dog days of summer have brought record equity highs and a veneer of calm. July’s CPI—headline inflation steady at 2.7% y/y with shelter easing—further fueling hopes that tariffs would not bite as hard as feared. But those hopes proved short-lived.
The headline PPI surged 0.9% in July, the largest monthly increase since early 2022. Core PPI rose 0.4%, double expectations, signaling stronger pipeline pressures. Import prices also came in firmer, climbing 0.4% versus 0.1% expected, with industrial supplies and consumer goods leading gains. Take together, the data suggest core PCE rose 0.3% in July, or 2.9% year-to-year—less benign than CPI alone implied. Some of July’s spikes likely reflect catchup in purchases of industrial supplies and materials stockpiled ahead of tariffs. The replenishing of those stocks boosted demand and helped pull prices higher.
Tariffs did not deliver an immediate inflation shock but are now seeping into supply chains.
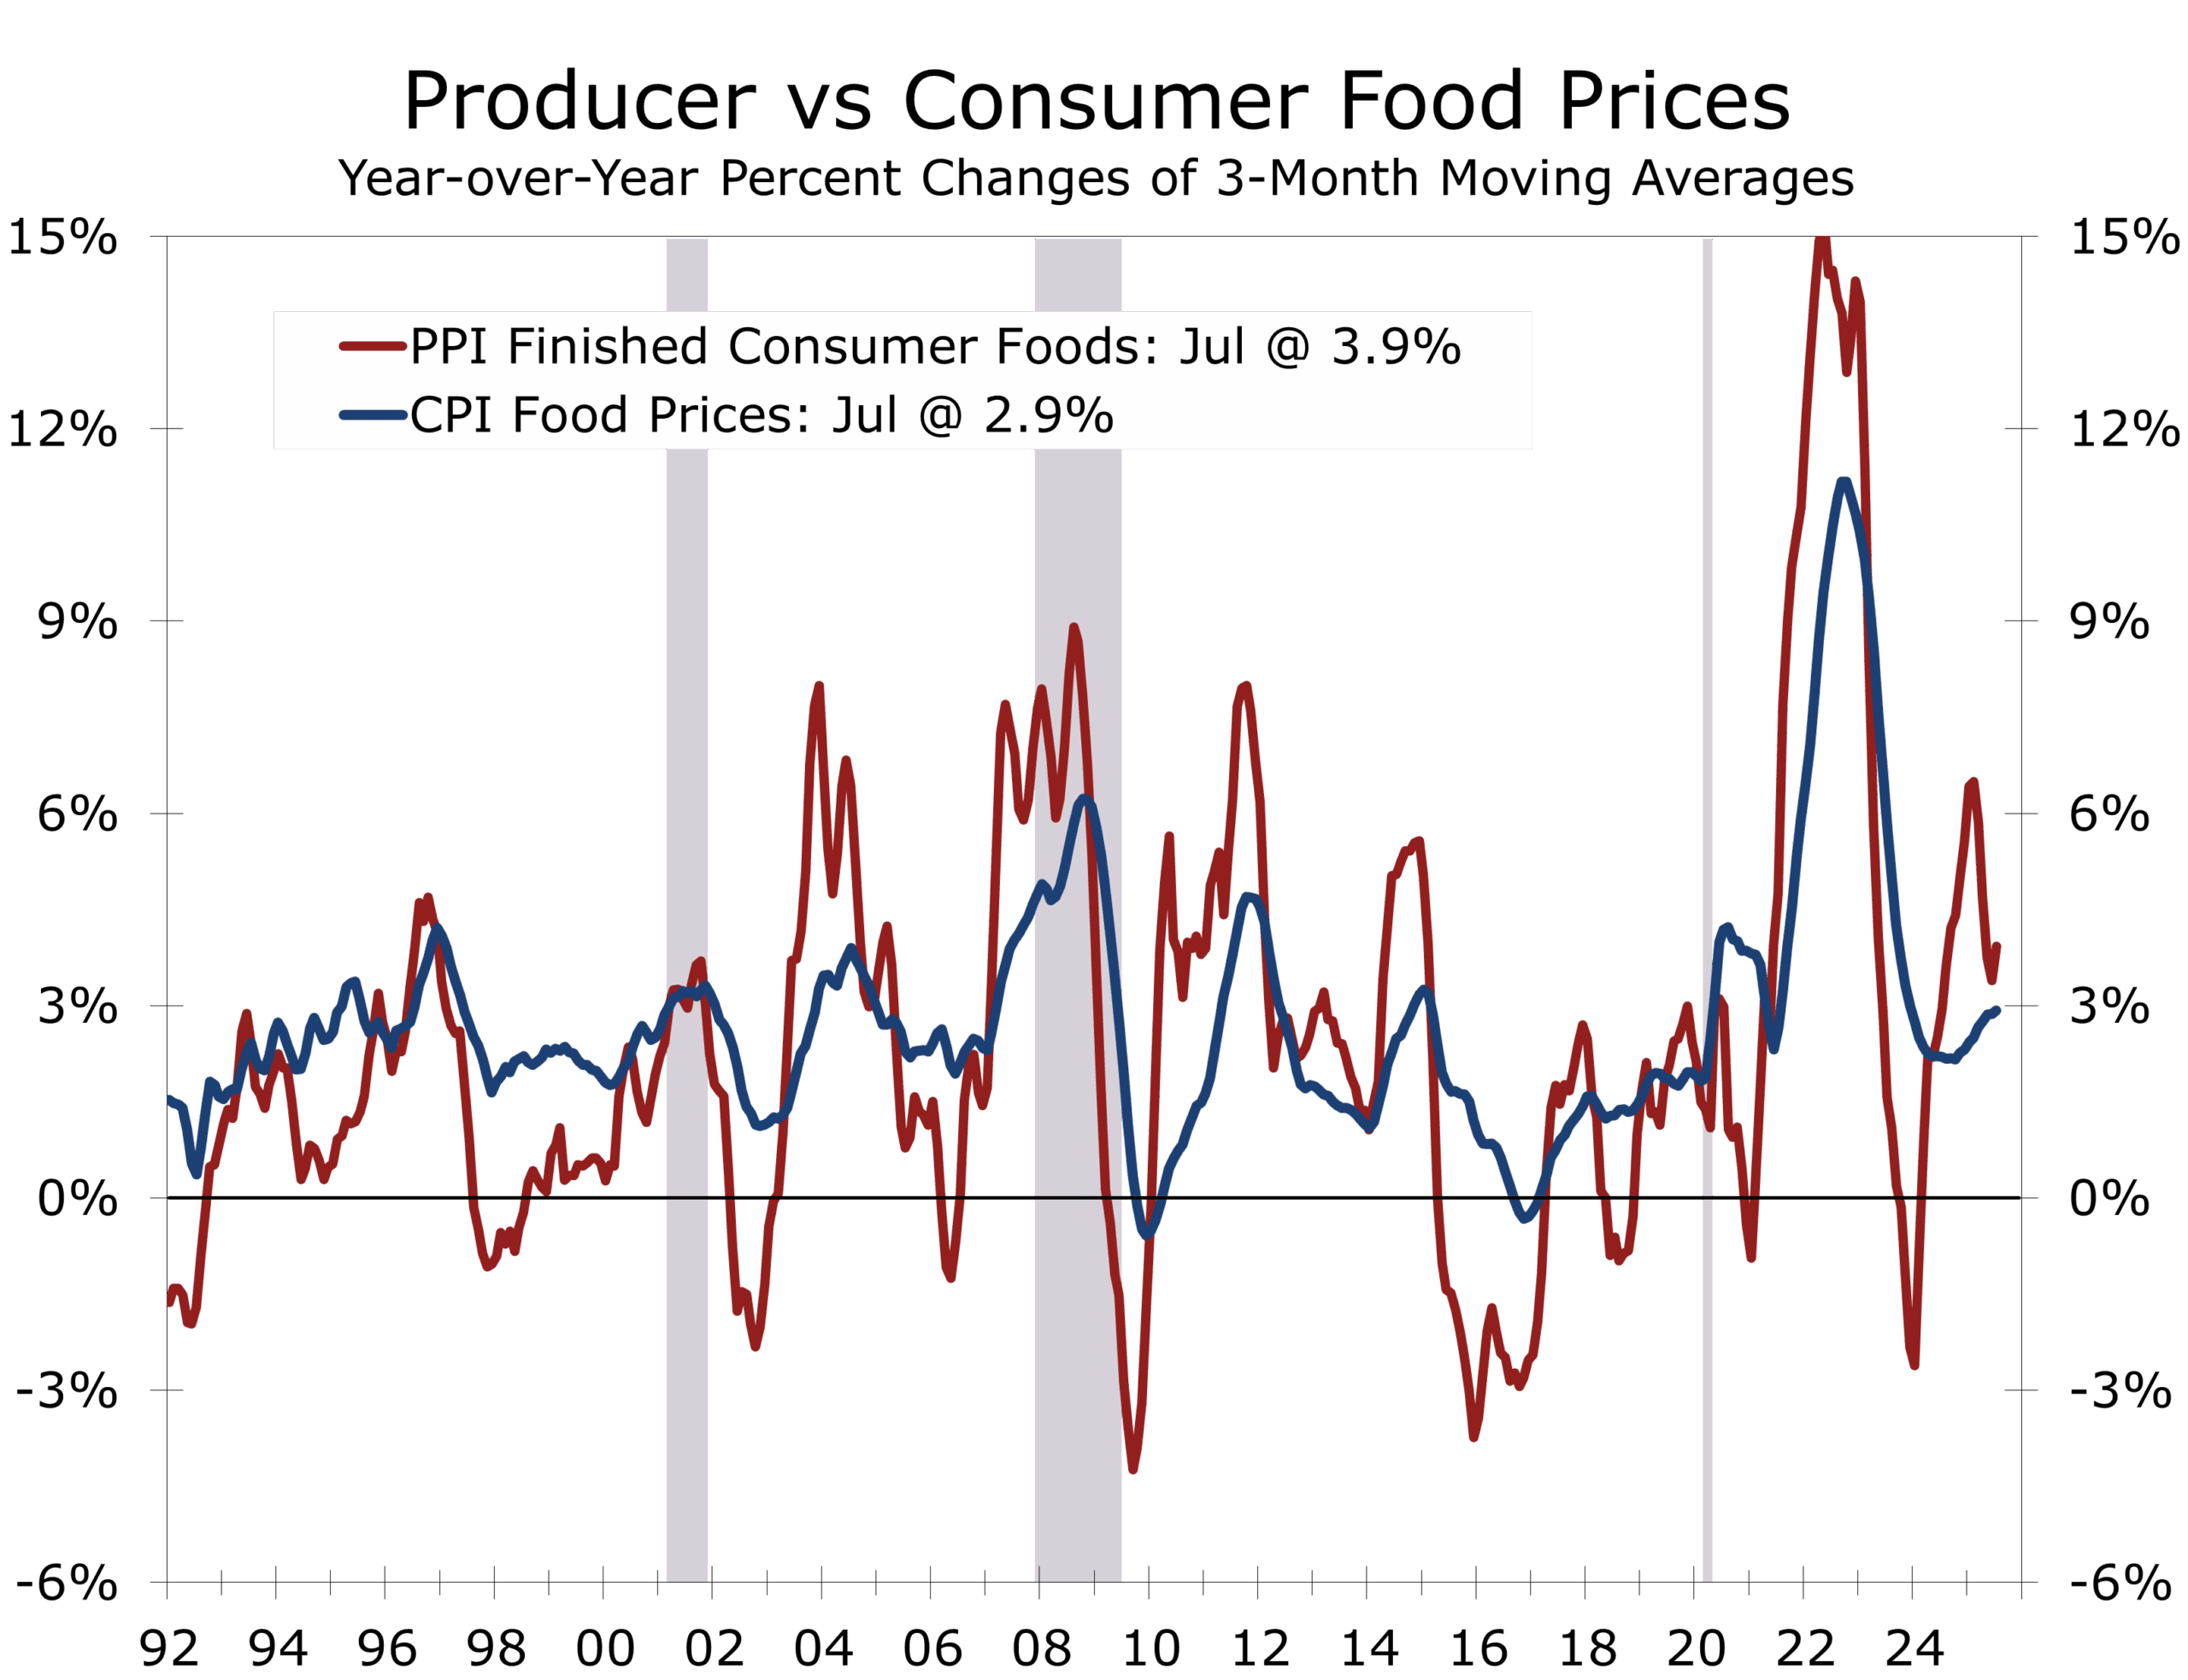
Tariffs did not deliver an immediate inflation shock, but their effects are seeping into supply chains. And with ground beef prices rising ahead of Labor Day, households feel inflation’s persistence more acutely than headline figures suggest. The persistence of inflation, particularly for everyday items, is emerging as the key issue for this year’s off-year elections, which are typically seen as a harbinger for the mid-terms.
Consumers: Still Resilient, But Uneasy
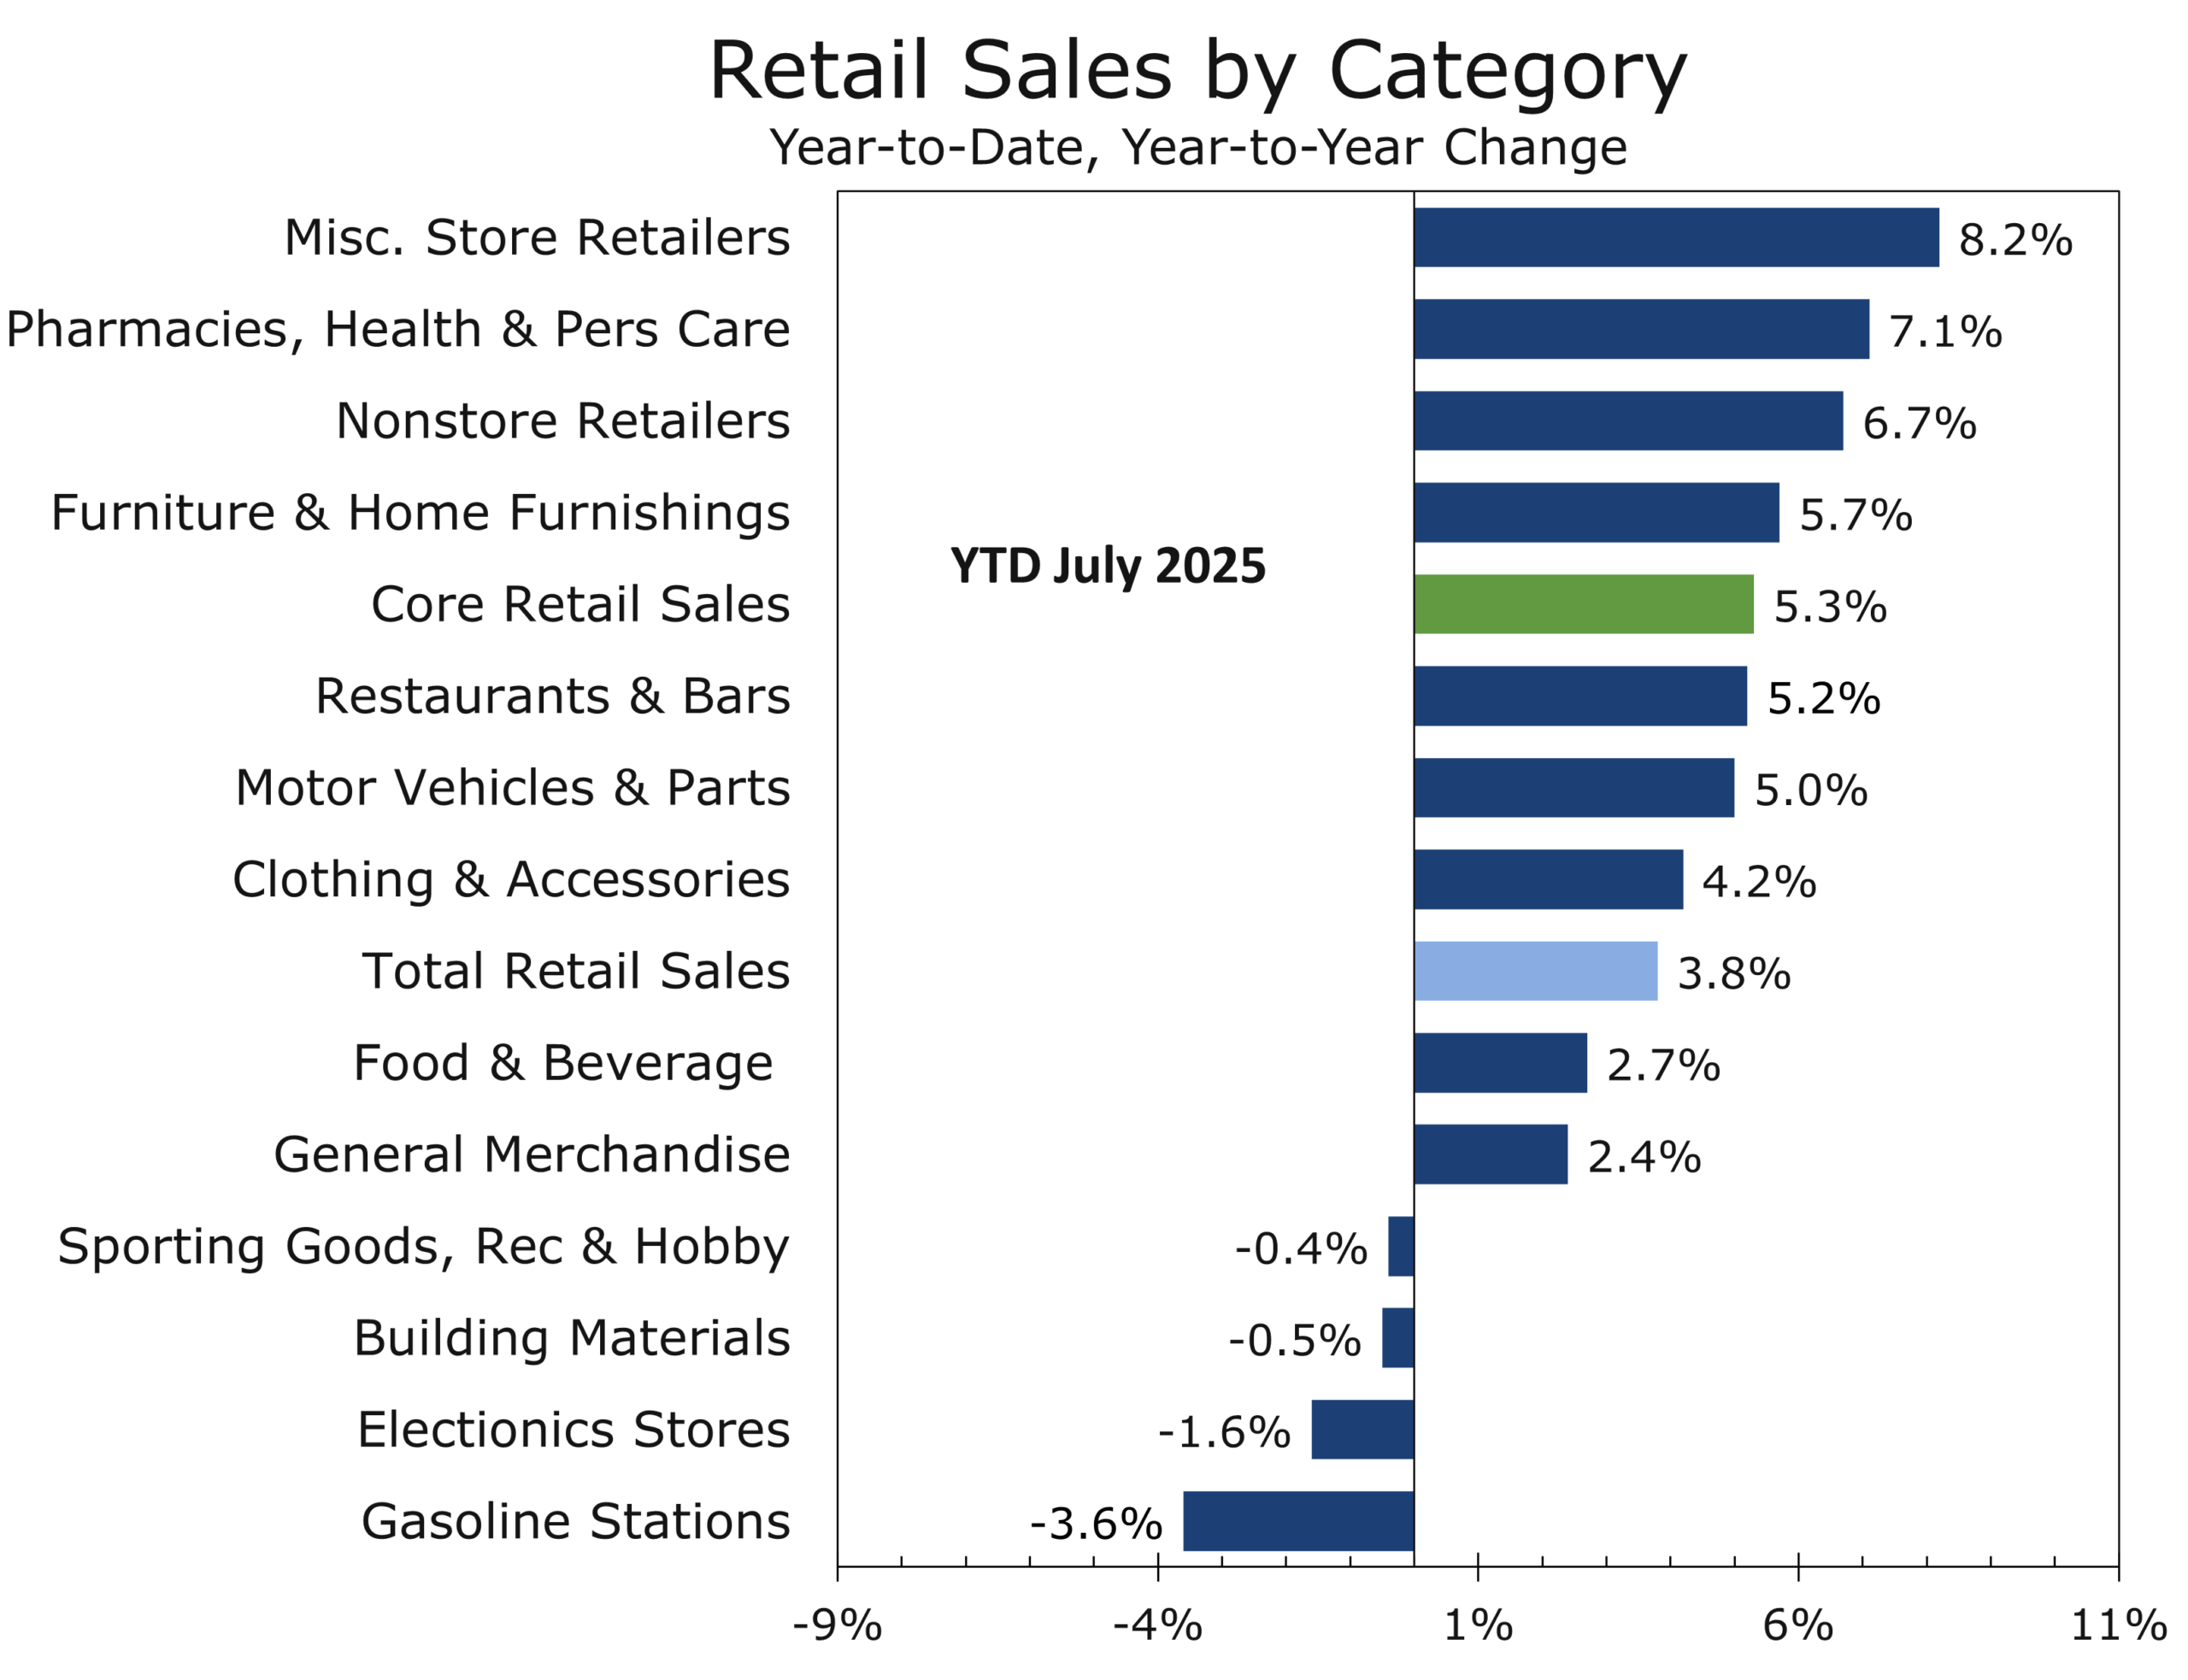
Retail sales rose 0.5% in July, which is a shoulder month for most retailers and makes up a relatively small proportion of their overall sales. Control group sales, or what we often call core retail sales, also rose 0.5%, and prior months’ data were revised higher. Autos (+1.6%) and online retailers (+0.8%) led gains, supported by extended Prime Day promotions and competitive discounts. Furniture, clothing, and sporting goods also posted solid advances, while housing-linked segments most closely tied to housing appreciation, including building materials, hardware, and home improvement centers (-1.0%) and restaurants (-0.4%) lagged. Real core sales point to slightly stronger Q3 personal consumption, once again emphasizing one of our most often refrains about the U.S. economy, which is to never underestimate the capabilities of the U.S. consumer.
Confidence is historically weak, however, and is wavering. The University of Michigan’s preliminary August sentiment index slipped to 58.6 from 61.7, ending a four-month streak of improvement. One-year inflation expectations rose to 4.9% and long-run expectations to 3.9%, reversing recent progress. While the link between sentiment and spending has weakened since the pandemic, the deterioration reflects growing household unease over inflation, tariffs, and labor market conditions. The contrast between solid spending and softening sentiment underscores the precarious balance sustaining growth.

Crosscurrents Beneath the Surface
Industrial production slipped 0.1% in July, its first decline in four months, as weakness in utilities (-0.2%) and mining (-0.4%) offset resilience elsewhere. Manufacturing output was flat overall, though auto production fell 0.4%, reflecting tariff-related pressures and affordability headwinds.
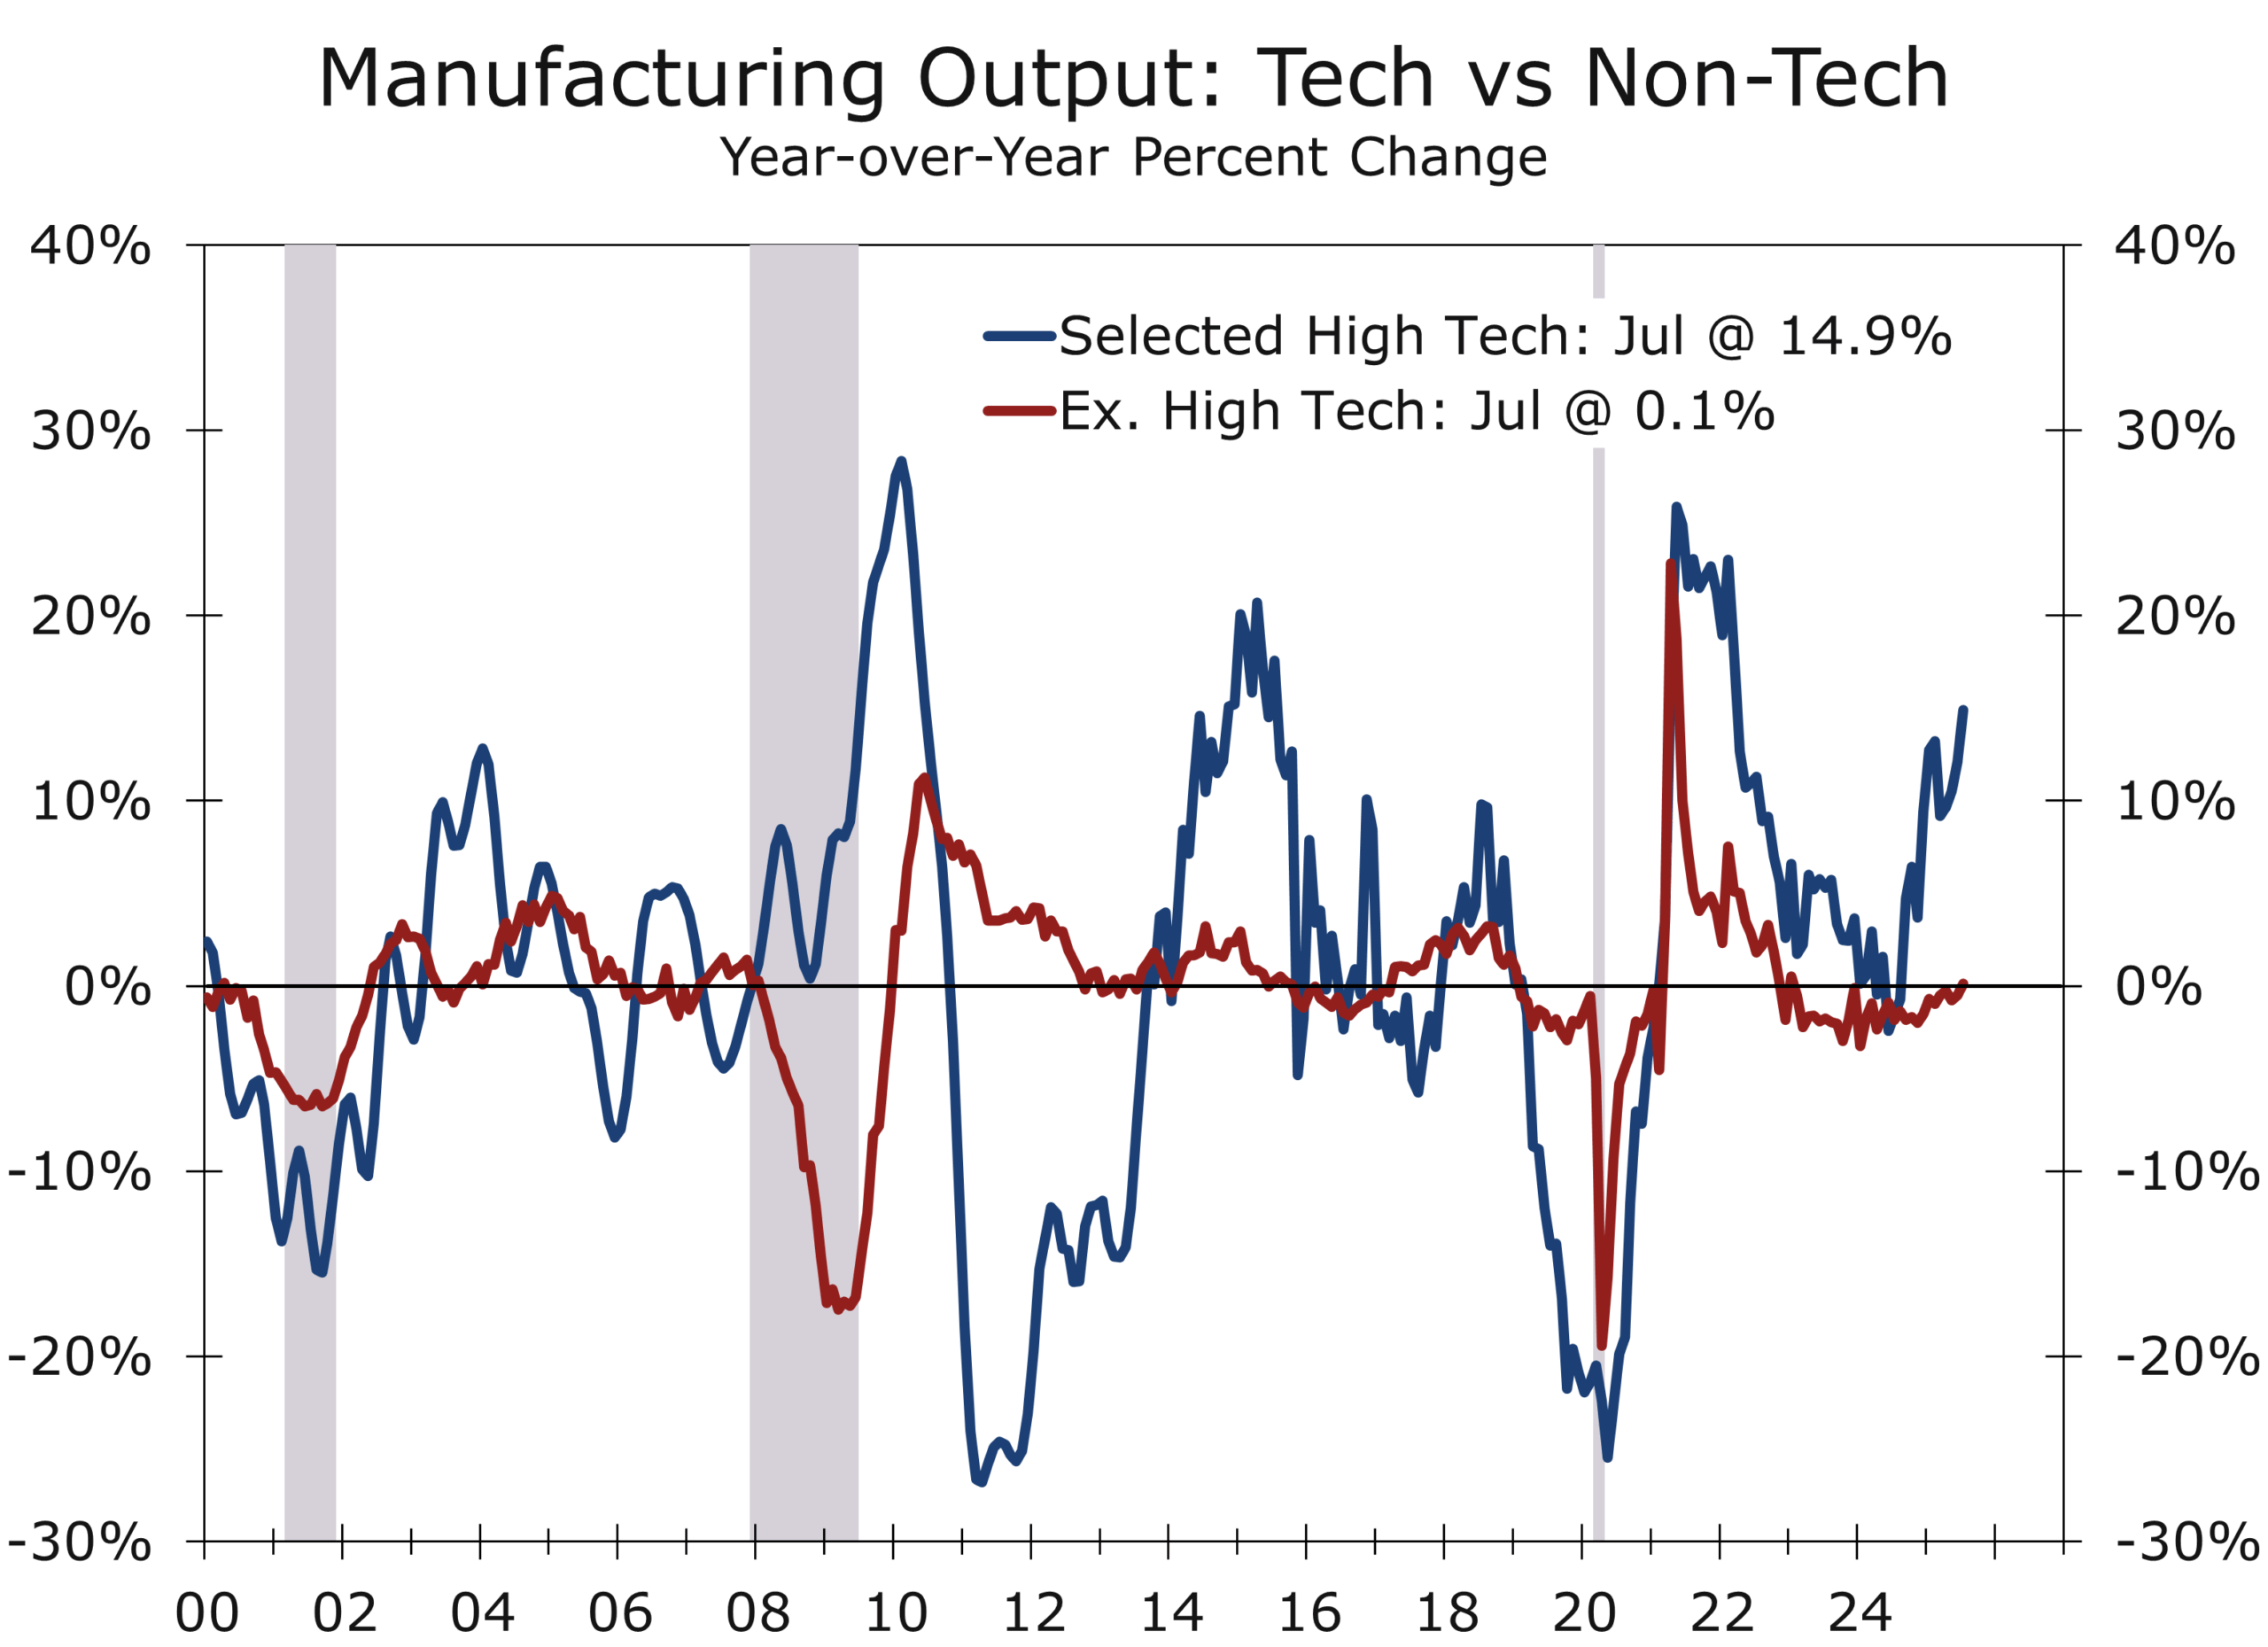
Production of high-tech equipment is up 14% y/y; aerospace is surging as Boeing ramps up.
Not all the details were negative. High-tech equipment output rose 1.4% in July and is up 14% year-over-year, fueled by AI and semiconductor investment as new plants ramp production. Overall business equipment saw output rise 0.5% in July and production has grown at an 11% annualized pace over the past six months. Aerospace also stands out: Boeing is boosting 737 Max output and raising 787 assemblies, steadily working to keep pace with its historic backlog.
Elsewhere, output of consumer goods edged higher (+0.1%), with gains in tariff-sensitive categories such as furniture and wood products, which are benefiting from some reshoring of upholstered furniture. These improvements may prove fleeting, however, given sluggish new and existing home sales and weakening homebuilding. Steel and aluminum production held steady, supported by industrial demand, though higher input costs remain a constraint.
Markets: Calm at the Highs
Despite firmer inflation, equities pushed higher this past week, with the Dow at record highs and the S&P 500 close behind. Treasurys told a different story: the yield curve steepened as the long-end backed up on the hotter PPI and import price data. The front end held relatively steady, with traders still assigning around an 80% probability to a September cut. Talk of a half point cut has vanished.
Financial market valuations reflect precarious complacency heading into fall.
This disconnect—stocks at record highs, real yields rising, inflation proving stubborn—captures the precarious complacency of late summer. Investors have shed some of their long-held skepticism about tariffs and appear to view labor risks as temporary. It is still early innings on both fronts, however, and upcoming releases on employment and inflation will carry a great deal of weight this fall.
Geopolitics: Anchorage and Beyond
On August 15, Trump met Putin in Anchorage. The summit ended without a deal but marked a clear shift in U.S. posture toward Ukraine. Trump dropped his demand for an immediate cease-fire, opening the door to a broader settlement more favorable to Moscow—recognition of Crimea, neutrality, and frozen front lines in Donbas and the south. Stalled on the battlefield, Putin is seeking to secure diplomatically what he could not by force. Anchorage was not Reykjavik; it looked far more like Munich 1938.
Now the spotlight shifts to Washington, where Zelensky met with Trump on August 18, joined by leaders from the U.K., France, Germany, Italy, Finland, and the EU, along with NATO Secretary-General Mark Rutte. Their task: preserve Western unity, keep Trump focused on Putin as the aggressor, and prevent a rift that could fracture Ukraine’s support. Early reports showed Trump and European leaders were closely aligned.
The divide is stark. Security guarantees—once a flashpoint between Trump and Zelensky—are now under discussion, potentially modeled on NATO’s Article 5 but issued bilaterally by the U.S. and European states. Yet the territorial issue remains a chasm. Putin’s terms for Ukraine to cede Donetsk in exchange for a frozen conflict elsewhere are a constitutional nonstarter for Kyiv and overwhelmingly opposed by the Ukrainian public. Analysts warn that conceding hardened defenses would most certainly invite future Russian offensives.
The Stakes in Anchorage Echo Munich, Not Reykjavik. Let’s Hope the Outcome is Different.
At a minimum, Trump would do well to demand the withdrawal of Russian forces from Transnistria in Moldova as part of any settlement, removing a threat to Ukraine’s southwestern flank. Otherwise, the outcome risks echoing the 1938 Munich Agreement, when Hitler was granted the German-speaking Sudetenland of Czechoslovakia under the promise of peace. Within months, he struck a separate deal with Slovakia, encircled what remained of Czechoslovakia, and effortlessly swallowed the rest. Conceding Donetsk without removing Russia’s forward positions in Moldova could set up a similarly perilous dynamic, inviting Moscow to return later and complete the conquest from a position of even greater advantage.
Trump’s rhetoric has added pressure, suggesting Zelensky “can end the war almost immediately if he wants to.” Meanwhile, Russian drone strikes—including one in Kharkiv this morning that killed four civilians—underscore Moscow’s unwillingness to halt the war. Markets may briefly rally on cease-fire talk, but appeasement would deepen long-term risks, embolden adversaries from Beijing to Tehran, and raise doubts about Western resolve. For Trump, the political stakes are equally high. Biden’s presidency never recovered from Afghanistan; a perceived capitulation in Ukraine could be more damaging still, with potential to reopen the GOP field for 2028, which had recently consolidated around J.D. Vance.
The consequences extend far beyond Europe. If Washington is seen conceding territory under pressure, the message to other adversaries will be unmistakable. Xi Jinping could interpret it as a green light to test U.S. resolve in the South China Sea or accelerate plans for Taiwan. Tehran and Pyongyang would likewise conclude that coercion pays. Trade and tariff deals would also likely prove even harder to reach, particularly with India and China, as Trump would be viewed as a far less strong leader than he has proven so far.
Russia is betting heavily that U.S. security guarantees will prove as hollow as those given to Ukraine in 1994, when Kyiv surrendered its nuclear arsenal. Moscow is also amplifying far-right narratives in the U.S. against “forever wars,” aiming to erode bipartisan consensus on supporting Ukraine. These fringe movements have a small but committed following that are likely unwittingly being supported by Russian intelligence.
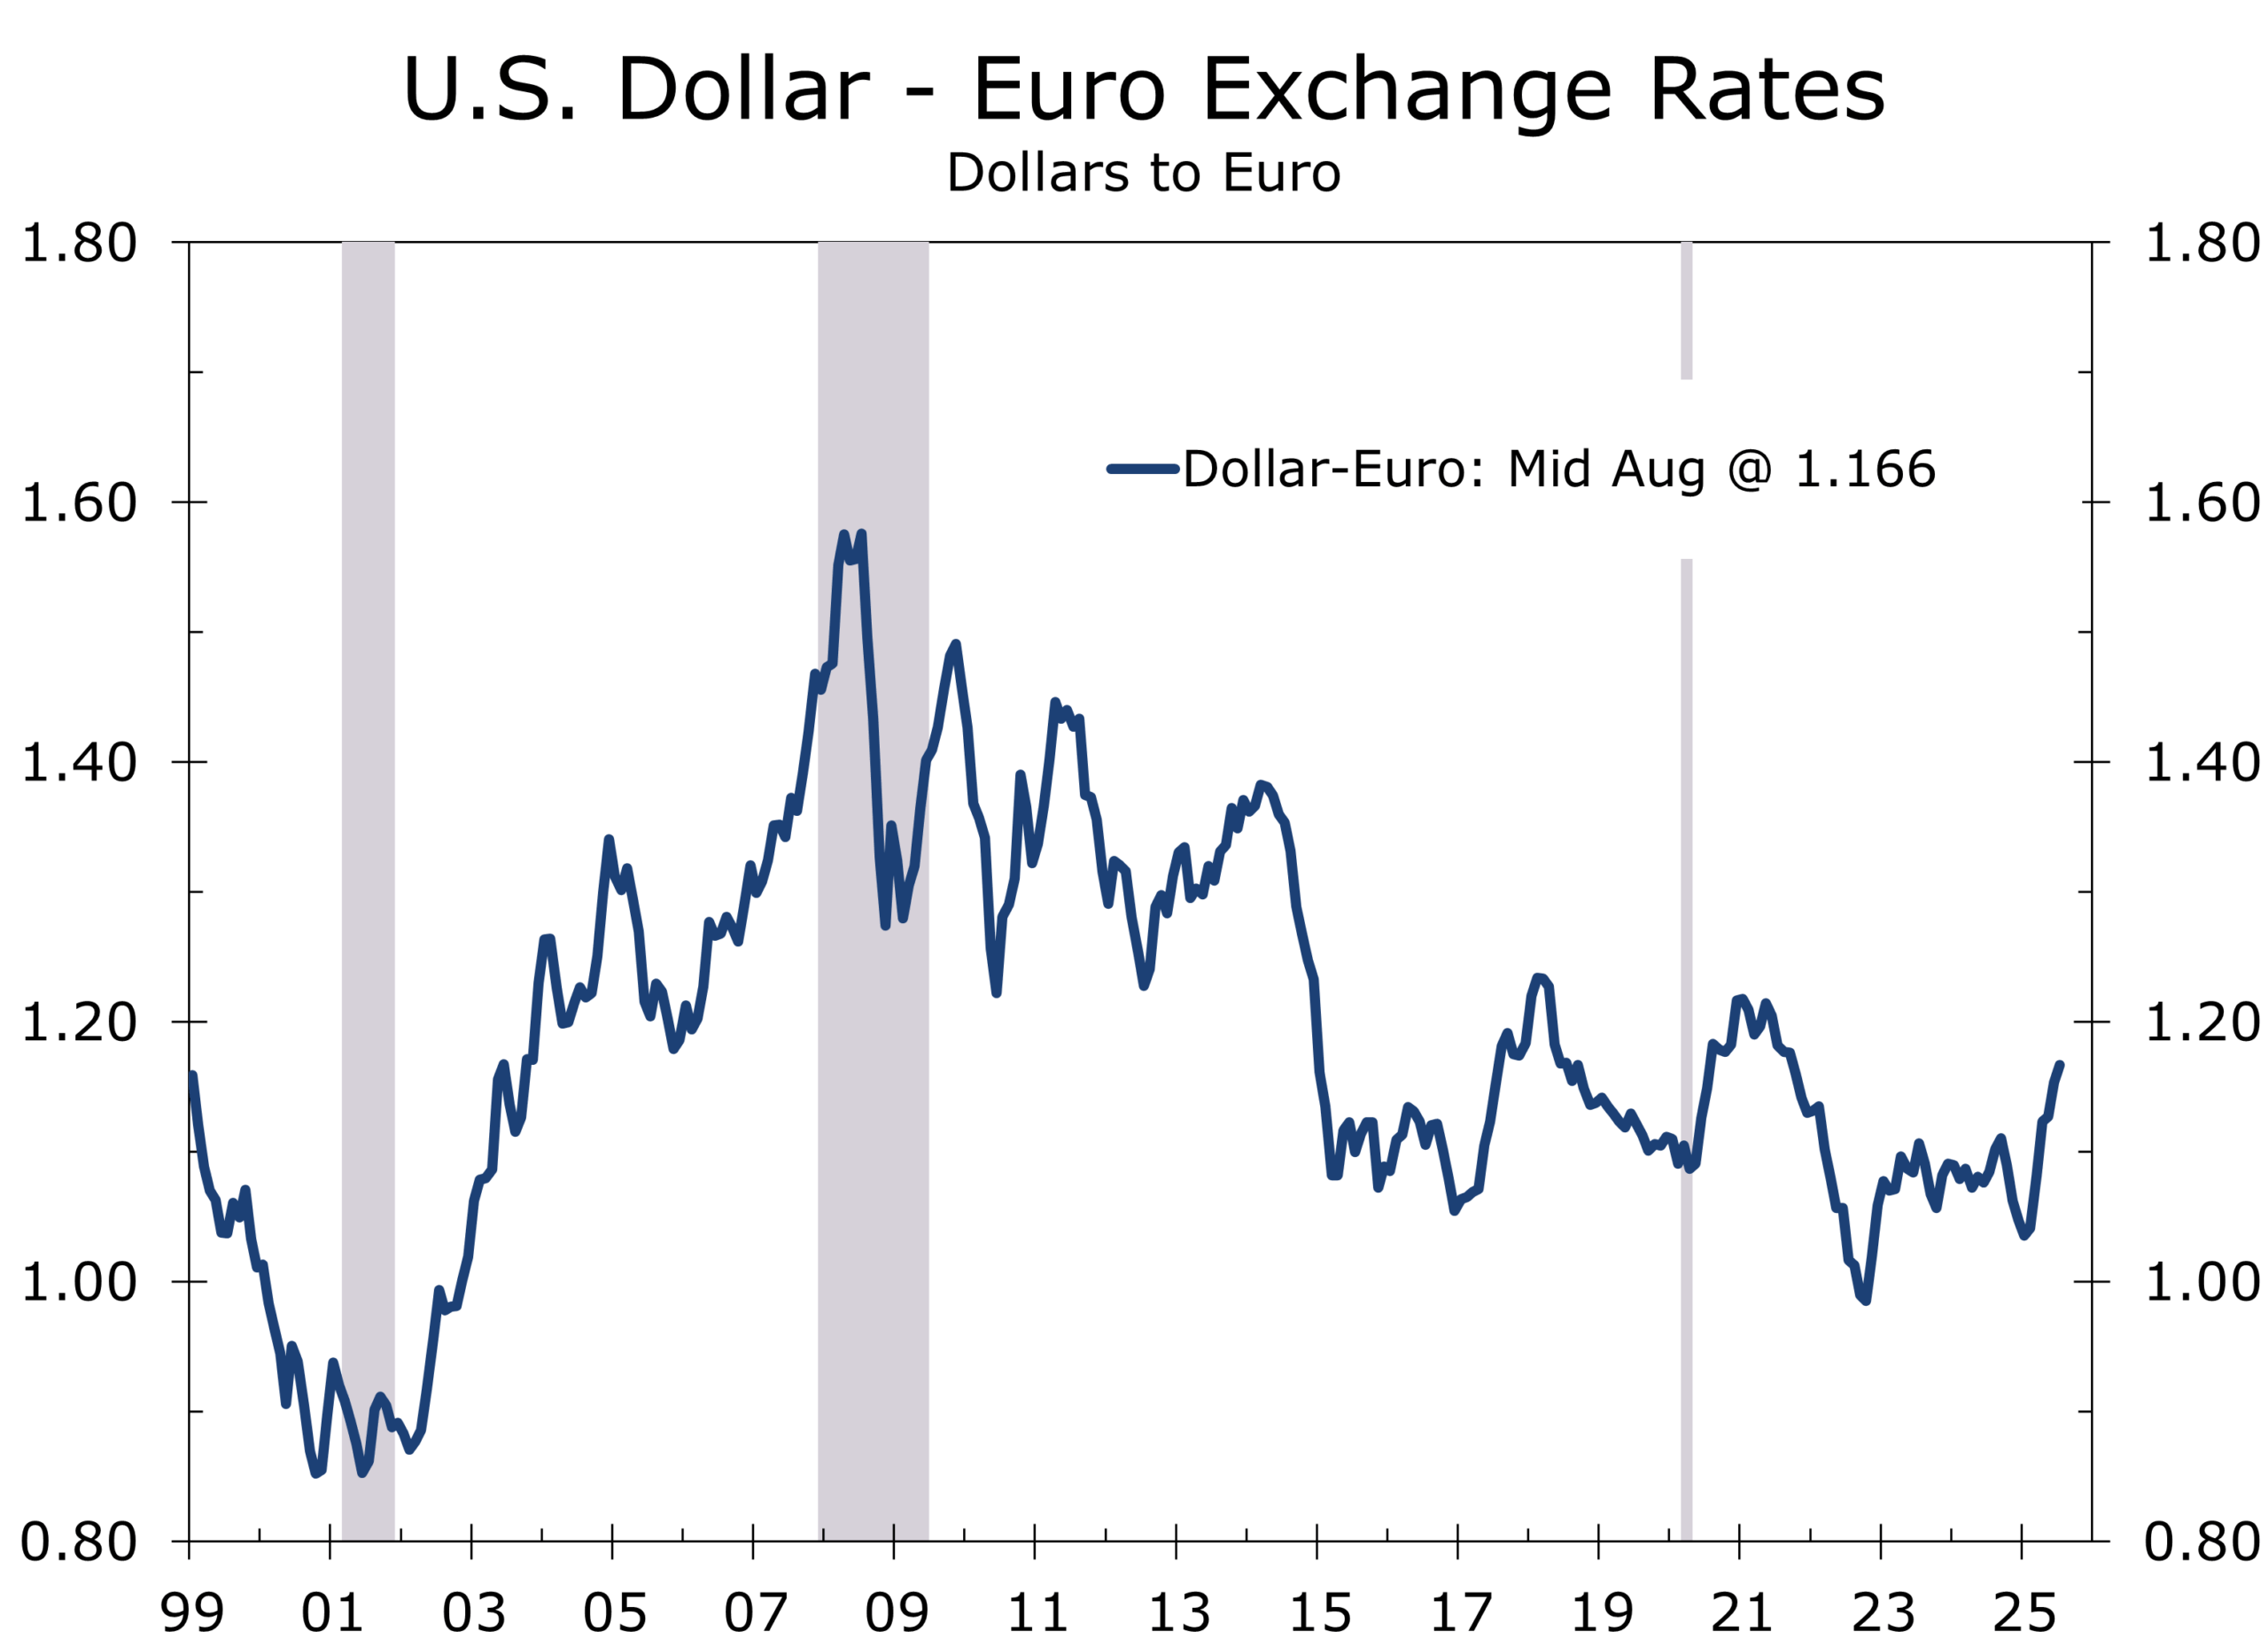
Markets will oscillate between optimism over the possibility of a cease-fire and anxiety that appeasement only defers larger conflicts. Energy prices may ease on signs of progress, while defense stocks could see near-term pressure but retain longer-term support. The euro remains vulnerable if Europe is perceived as conceding leverage to Moscow, while the dollar continues to benefit from safe-haven flows. Treasurys, as ever, will mirror risk appetite—steepening on real progress, flattening if talks collapse.
Bottom line: Putin is using negotiation and flattery to extract what his army could not achieve by force. Financial markets, which are forward-looking, would quickly see through a bad deal—shrugging off near-term relief about the absence of secondary sanctions on India and China and instead pricing in greater instability for the U.S. and Western democracies in the years ahead, amidst what would be a diminished and politically weakened U.S. presidency. We expect Trump to work out a good deal that ends the war and provides durable security guarantees that fall just short of immediate NATO membership for Ukraine.
High-Stakes, High Altitude: Jackson Hole 2025
This week, global policymakers converge at the Jackson Lake Lodge in Wyoming for the Kansas City Fed’s annual Jackson Hole Symposium, August 21–23, under the theme “Labor Markets in Transition.” With only about 120 attendees, the event is one of the most exclusive global economic forums. For Chair Powell—likely his last appearance before his term ends next May—the stakes are high: the Fed is deeply divided between those urging preemptive cuts and those worried about additional inflationary pressures from tariffs. Easing when inflation is rising requires a great deal of clarity in the Fed’s messaging.
Markets enter the week focused squarely on Powell’s Friday remarks. Futures currently price around an 80% probability of a quarter-point September cut, but weak July payrolls and large downward revisions to the two prior months’ data have sharpened attention on the Fed’s employment mandate. Based on our analysis of the Quarterly Census of Employment and Wages series, the state employment data and data from private sources, we estimate nonfarm payroll growth is currently running at just 60,000–80,000 jobs per month. That may be enough to hold the unemployment rate steady, given reduced immigration flows—or at least limit how much it rises.
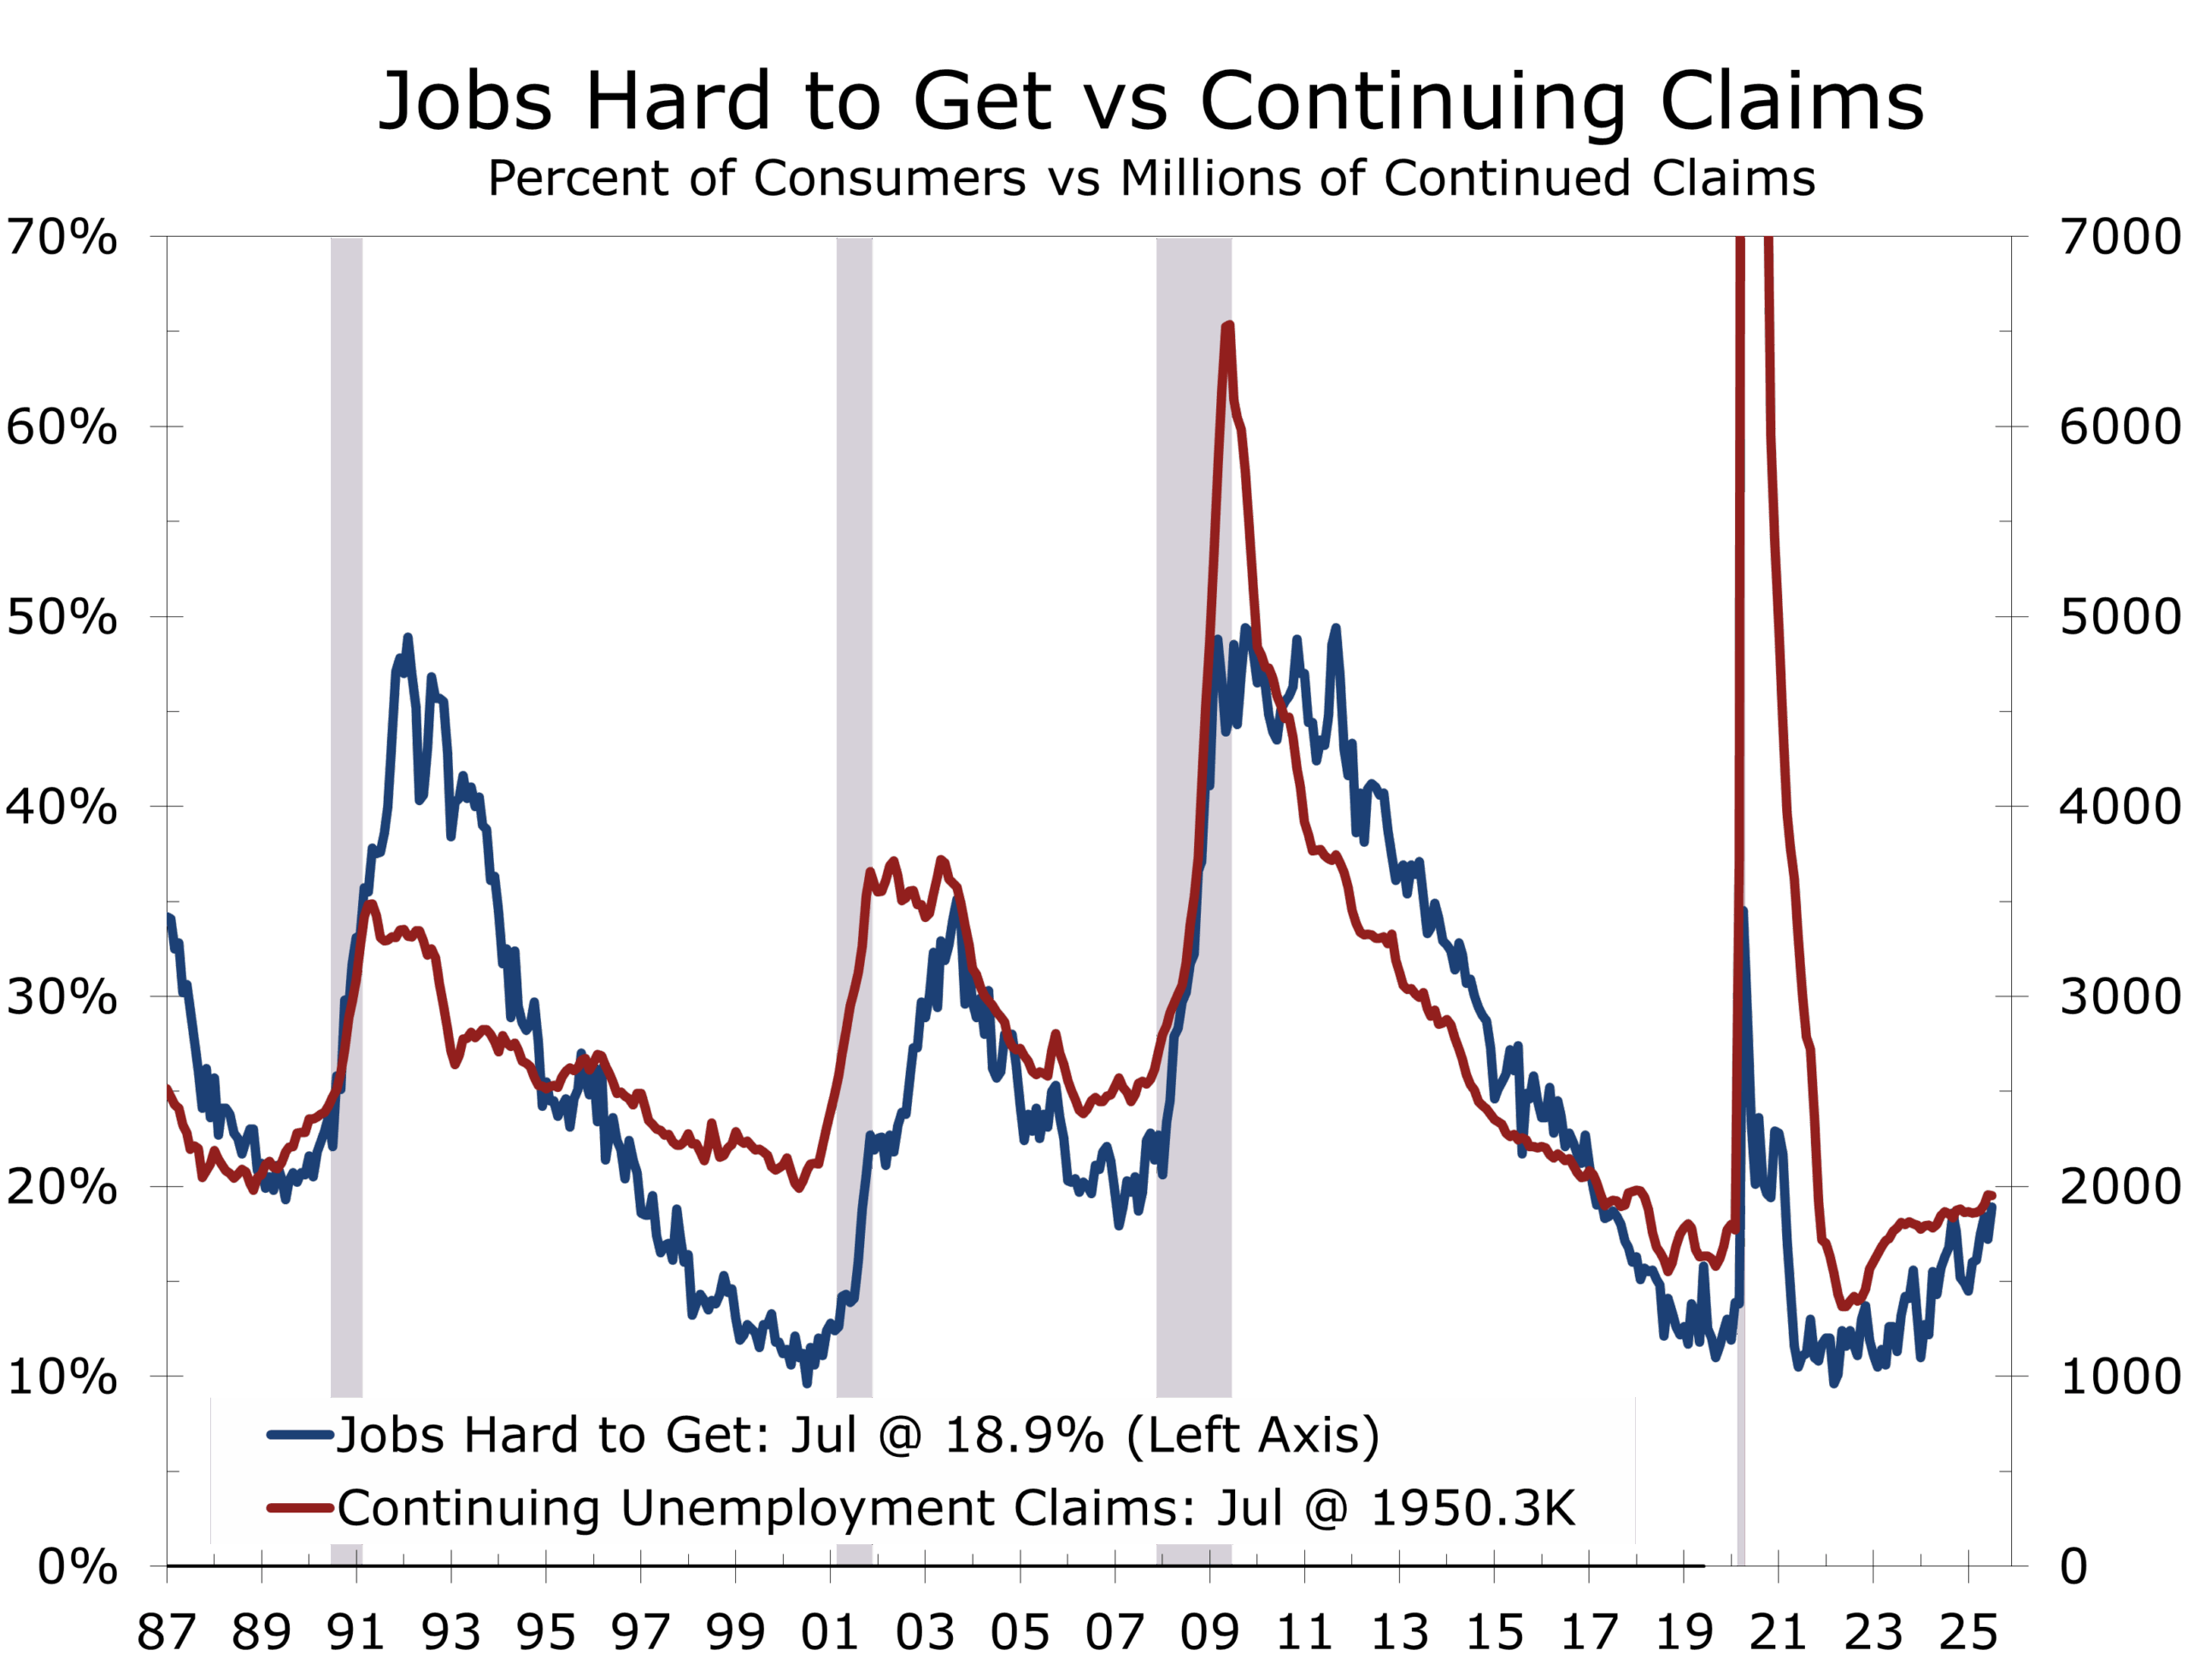
At the same time, a rising number of consumers report that jobs are harder to get, coinciding with broader weakness in sentiment. Consumers are equally worried about higher prices, particularly for necessities such as housing, groceries, and transportation—not only the cost of new and used vehicles, but also higher maintenance and insurance costs.
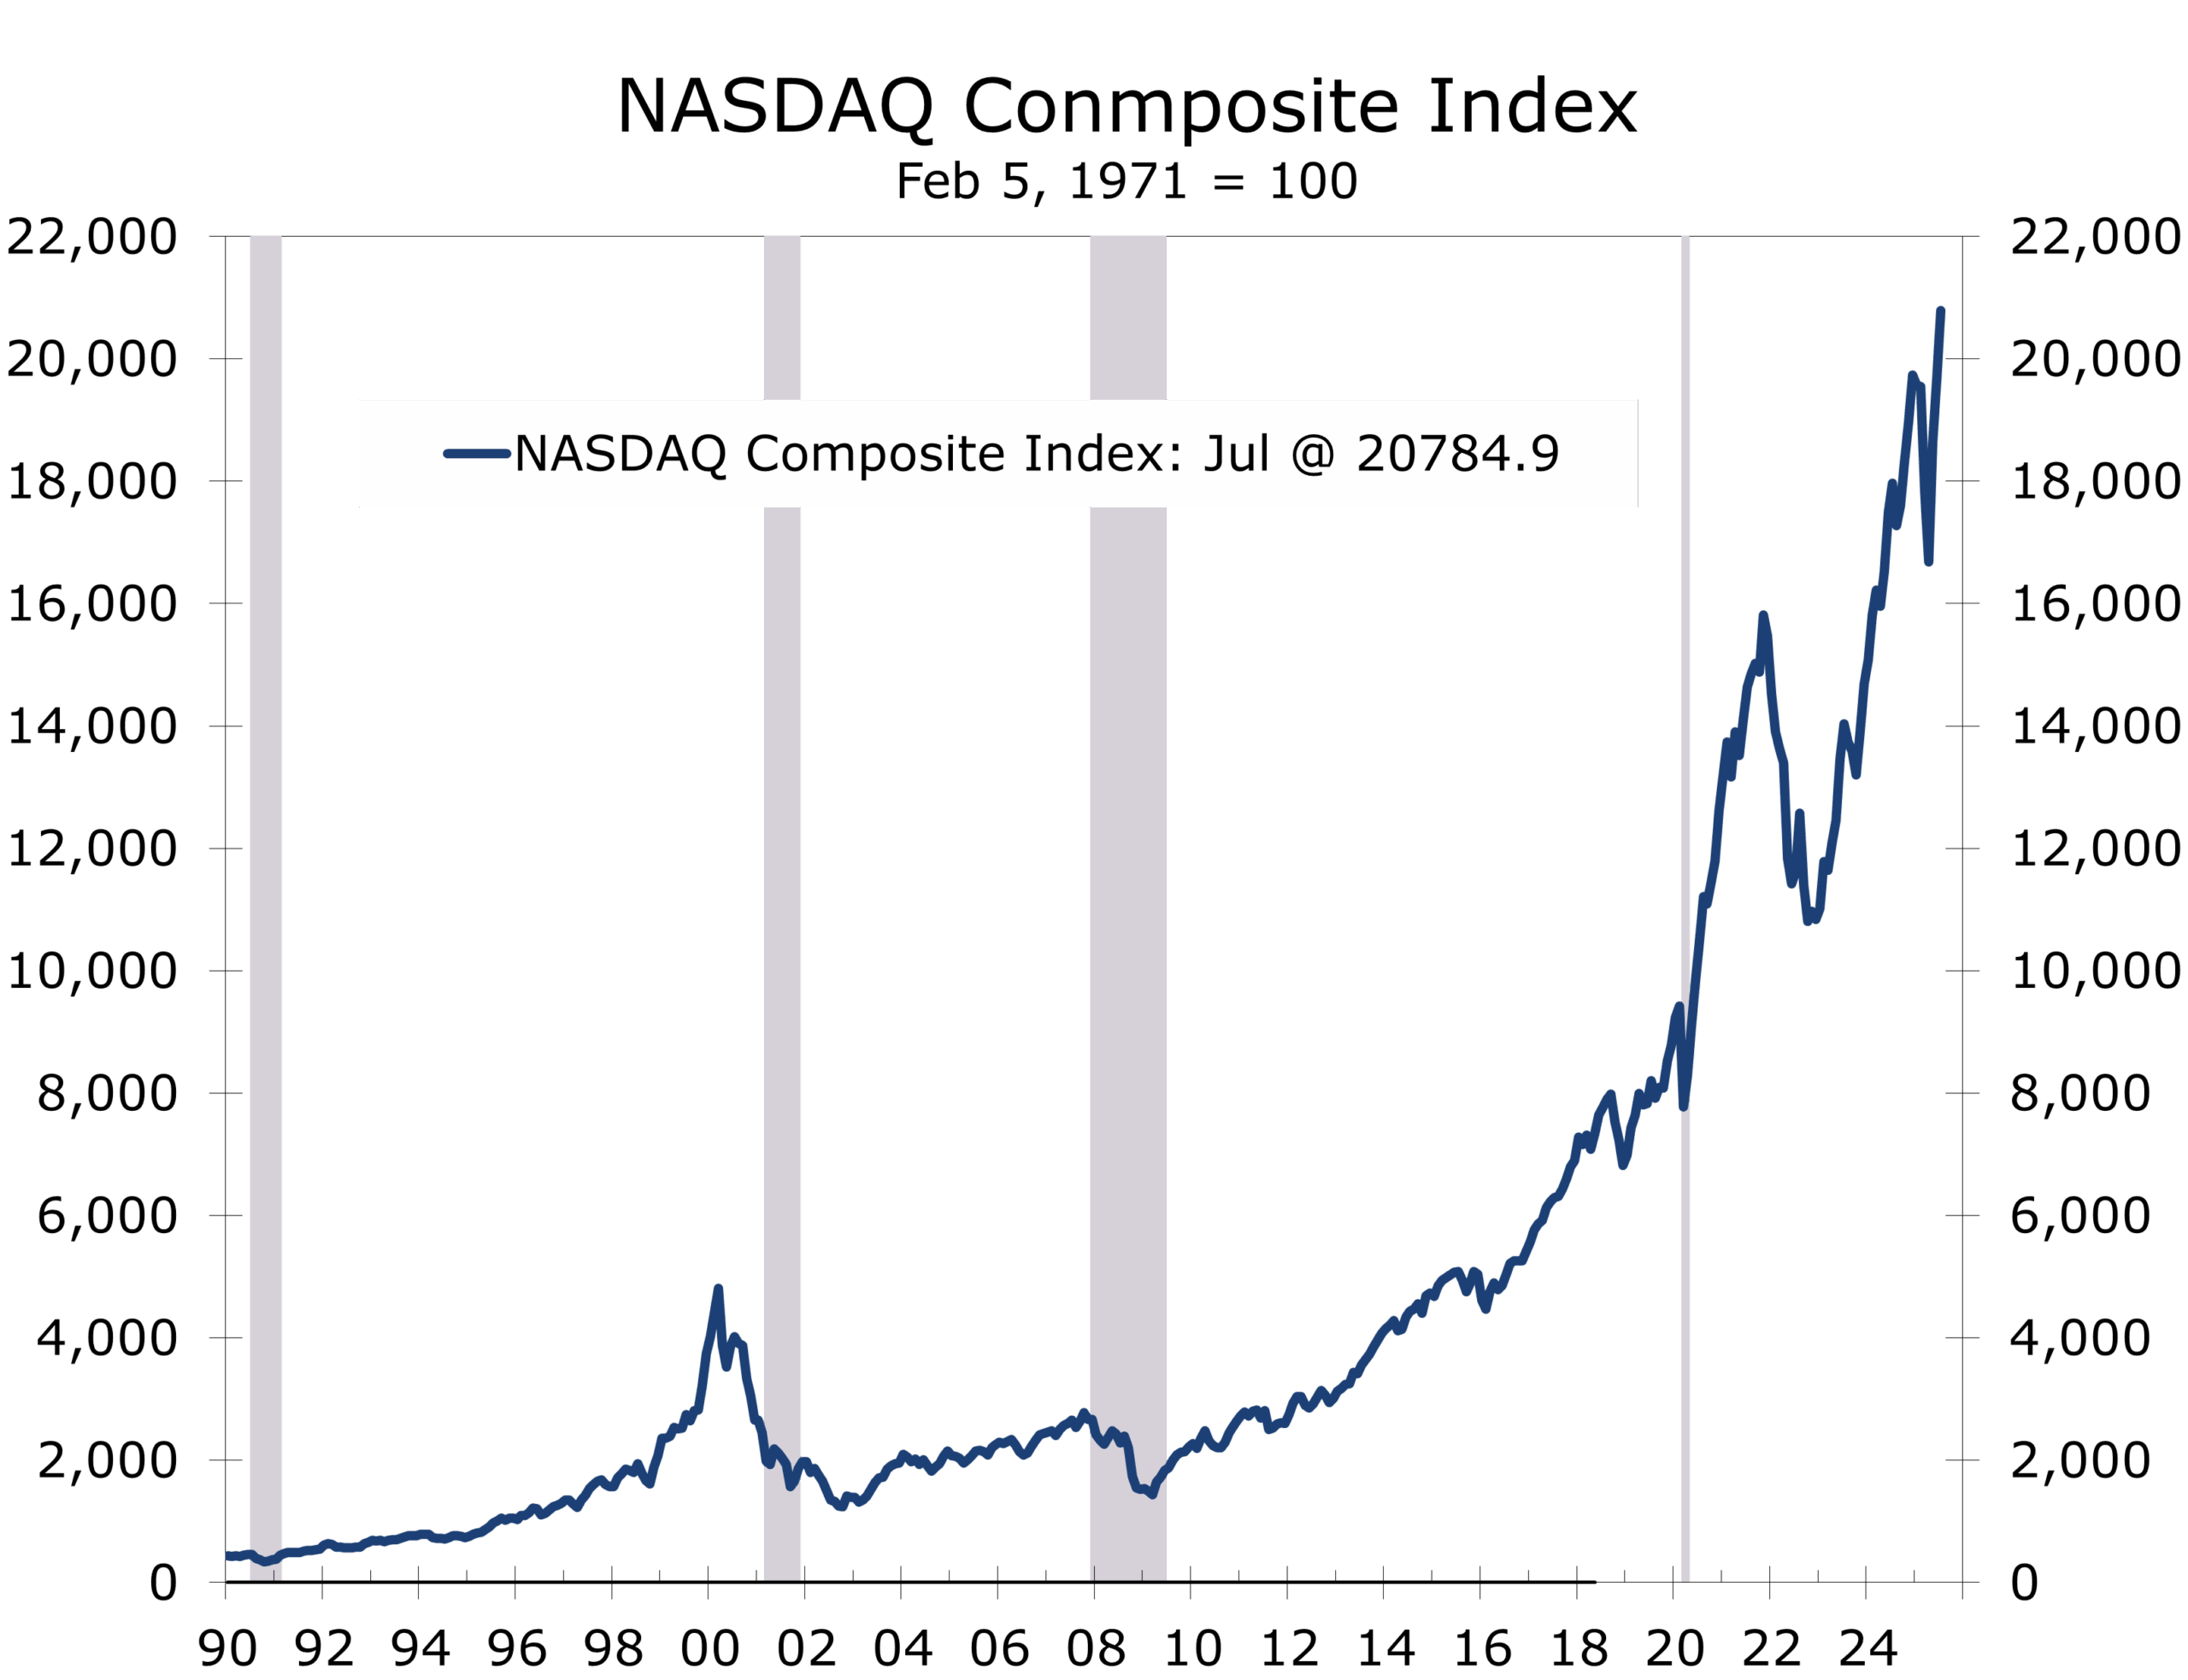
The optics also amplify the risk: Powell’s final Jackson Hole appearance comes as equities trade at stretched valuations near 24x forward earnings. Markets have climbed the wall of worry largely on expectations of Fed easing and resilient corporate earnings. That leaves them highly sensitive to Powell’s message. A hawkish guardrail could unsettle risk assets, while dovish reassurance may extend the rally in equities, Treasuries, and a weakening dollar. Either way, Powell’s tone will set the trajectory heading into this fall.
Looking Ahead: Light on Data, Heavy on Stakes
It is a relatively light week for economic reports, but a heavy one for monetary policy and geopolitics:
Tuesday, August 19 – Housing Starts & Permits Expected to slip below 1.3M. New home inventories remain elevated (511,000 in June, +8.5% y/y), with completed homes up 21%. Rising supply is weighing on builder sentiment and slowing new construction.
Wednesday, August 20 — FOMC Minutes
Will offer details on the July debate, though they predate the unexpectedly weak jobs report and firmer July inflation data.
Leading Economic Index (July)
The consensus is looking for a 0.1 point drop.
Thursday-Saturday August 21-23 — Jackson Hole Symposium – Powell’s keynote (Aug 22) is the highlight. Markets expect a dovish tilt, but stubborn inflation may force a more cautious tone.
Friday, August 22 — Existing Home Sales
Forecast to rise slightly to 3.95M. Affordability remains tight. The rising supply of homes for sale is providing some support for sales, particularly at the upper end. With sales skewed toward higher priced homes, the median sales price has risen to all-time highs.
Final Thoughts: Calm with Fault Lines
This week may feel light on data, but it is heavy with risk. Powell’s Jackson Hole remarks and Zelensky’s White House visit are set to define the narrative far more than the economic data. Beneath the calm of record equity highs lie clear warning signs: producer prices are accelerating, consumer sentiment is slipping, the LEI is flashing red, and geopolitics and public policy remain on edge.
The dog days may feel slow and tranquil, but as Powell speaks at Jackson Hole and Zelensky negotiates in Washington, complacency could quickly give way to volatility this fall.
Disclaimer: This publication has been prepared for informational purposes only and is not intended as a recommendation offer or solicitation with respect to the purchase or sale of any security or other financial product nor does it constitute investment advice.
August 18, 2025
Mark Vitner, Chief Economist
mark.vitner@piedmontcrescentcapital.com
(704) 458-4000
July Retail Sales: Solid Headline, Better Core
Prices Are Likely Bolstering Core Retail Sales
-
- Headline retail & food services sales rose 0.5% m/m in July and 3.9% y/y; June was revised up to +0.9% m/m.
- Control group (ex‑autos, gas, building materials, and food services) rose 0.5%; June’s was revised up about 0.4 ppts, implying the consumer spending has stronger underlying momentum.
- Gains were driven by stronger auto sales and solid gains in clothing, sporting goods, and general merchandise stores. Spending was down at home improvement stores and restaurants, however, reflecting continuing weakness in housing and a further pullback in spending for discretionary services.
- Prime Day–style promotions and extended online sales boosted nonstore activity, potentially beyond seasonal adjustments.
- University of Michigan sentiment fell to 58.6, with 1-year inflation expectations up to 4.9% and long-run to 3.9%.
- Inflation fears continue to outpace the data. July’s hotter than expected PPI report and today’s slightly faster rise in import prices likely reflect some catch-up with tariffs.
July Retail Sales—What Stood Out
U.S. consumer prices increased moderately in July. The July retail sales report shows more resiliency. Headline sales rose 0.5% m/m and are up 3.9% y/y, and the prior month’s gain was revised higher to a 0.9% gain. Those revisions nudge the level of activity up heading into the third quarter and should cause forecasters to slightly increase their estimate for Q3 growth.
Under the hood, vehicles sales rebounded 1.6% m/m and nonstore (e‑commerce) climbed 0.8%, consistent with extended summer discount events. Part of the strength in vehicle sales is likely higher prices, with prices of maintenance and repairs climbing rapidly the past few months. Sales also rose solidly at furniture (+1.4%), clothing (+0.7), sporting goods (0/8%), and department stores (0.9%). Nonstore retailers, which includes online retailers, rose 0.8%.
Housing Weakness, Higher Prices Squeeze Services
Sales at home improvement and hardware stores fell 1.0%—reflecting the recent swing of weak home sales, as well as some softening in home prices. Restaurant sales dipped 0.4%, which is consistent with our thesis that with consumers spending more for higher priced imported goods, they will have less to spend on discretionary services, including dining out. The weaker numbers are consistent with recent earnings reports from restaurant chains.

From a GDP-relevant perspective, control group sales rose an estimated 0.5% in July, and June’s level was revised up by 0.4 ppts. The stronger data indicate consumer spending had more momentum heading into Q3, making it easier for consumption to contribute meaningfully to real GDP growth. We have been looking for real consumption to rise at a 2.4% pace in Q3 and the upward revisions will help reach that mark. Higher prices, however, are padding core retail sales.
Consumer sentiment slipped in August as inflation and job worries grew.
Sentiment Apparently Softens on Inflation Fears
The preliminary University of Michigan Consumer Sentiment Index slipped to 58.6 in August from 61.7, ending a string of four consecutive modest improvements. Consumers appear to be increasingly concerned about inflation and a softening labor market. One-year inflation expectations rose to 4.9% and long-run expectations to 3.9%, reversing recent improvements. Both measures are well above market-implied levels and the inflation expectations reported in the Federal Reserve Bank of New York’s survey.
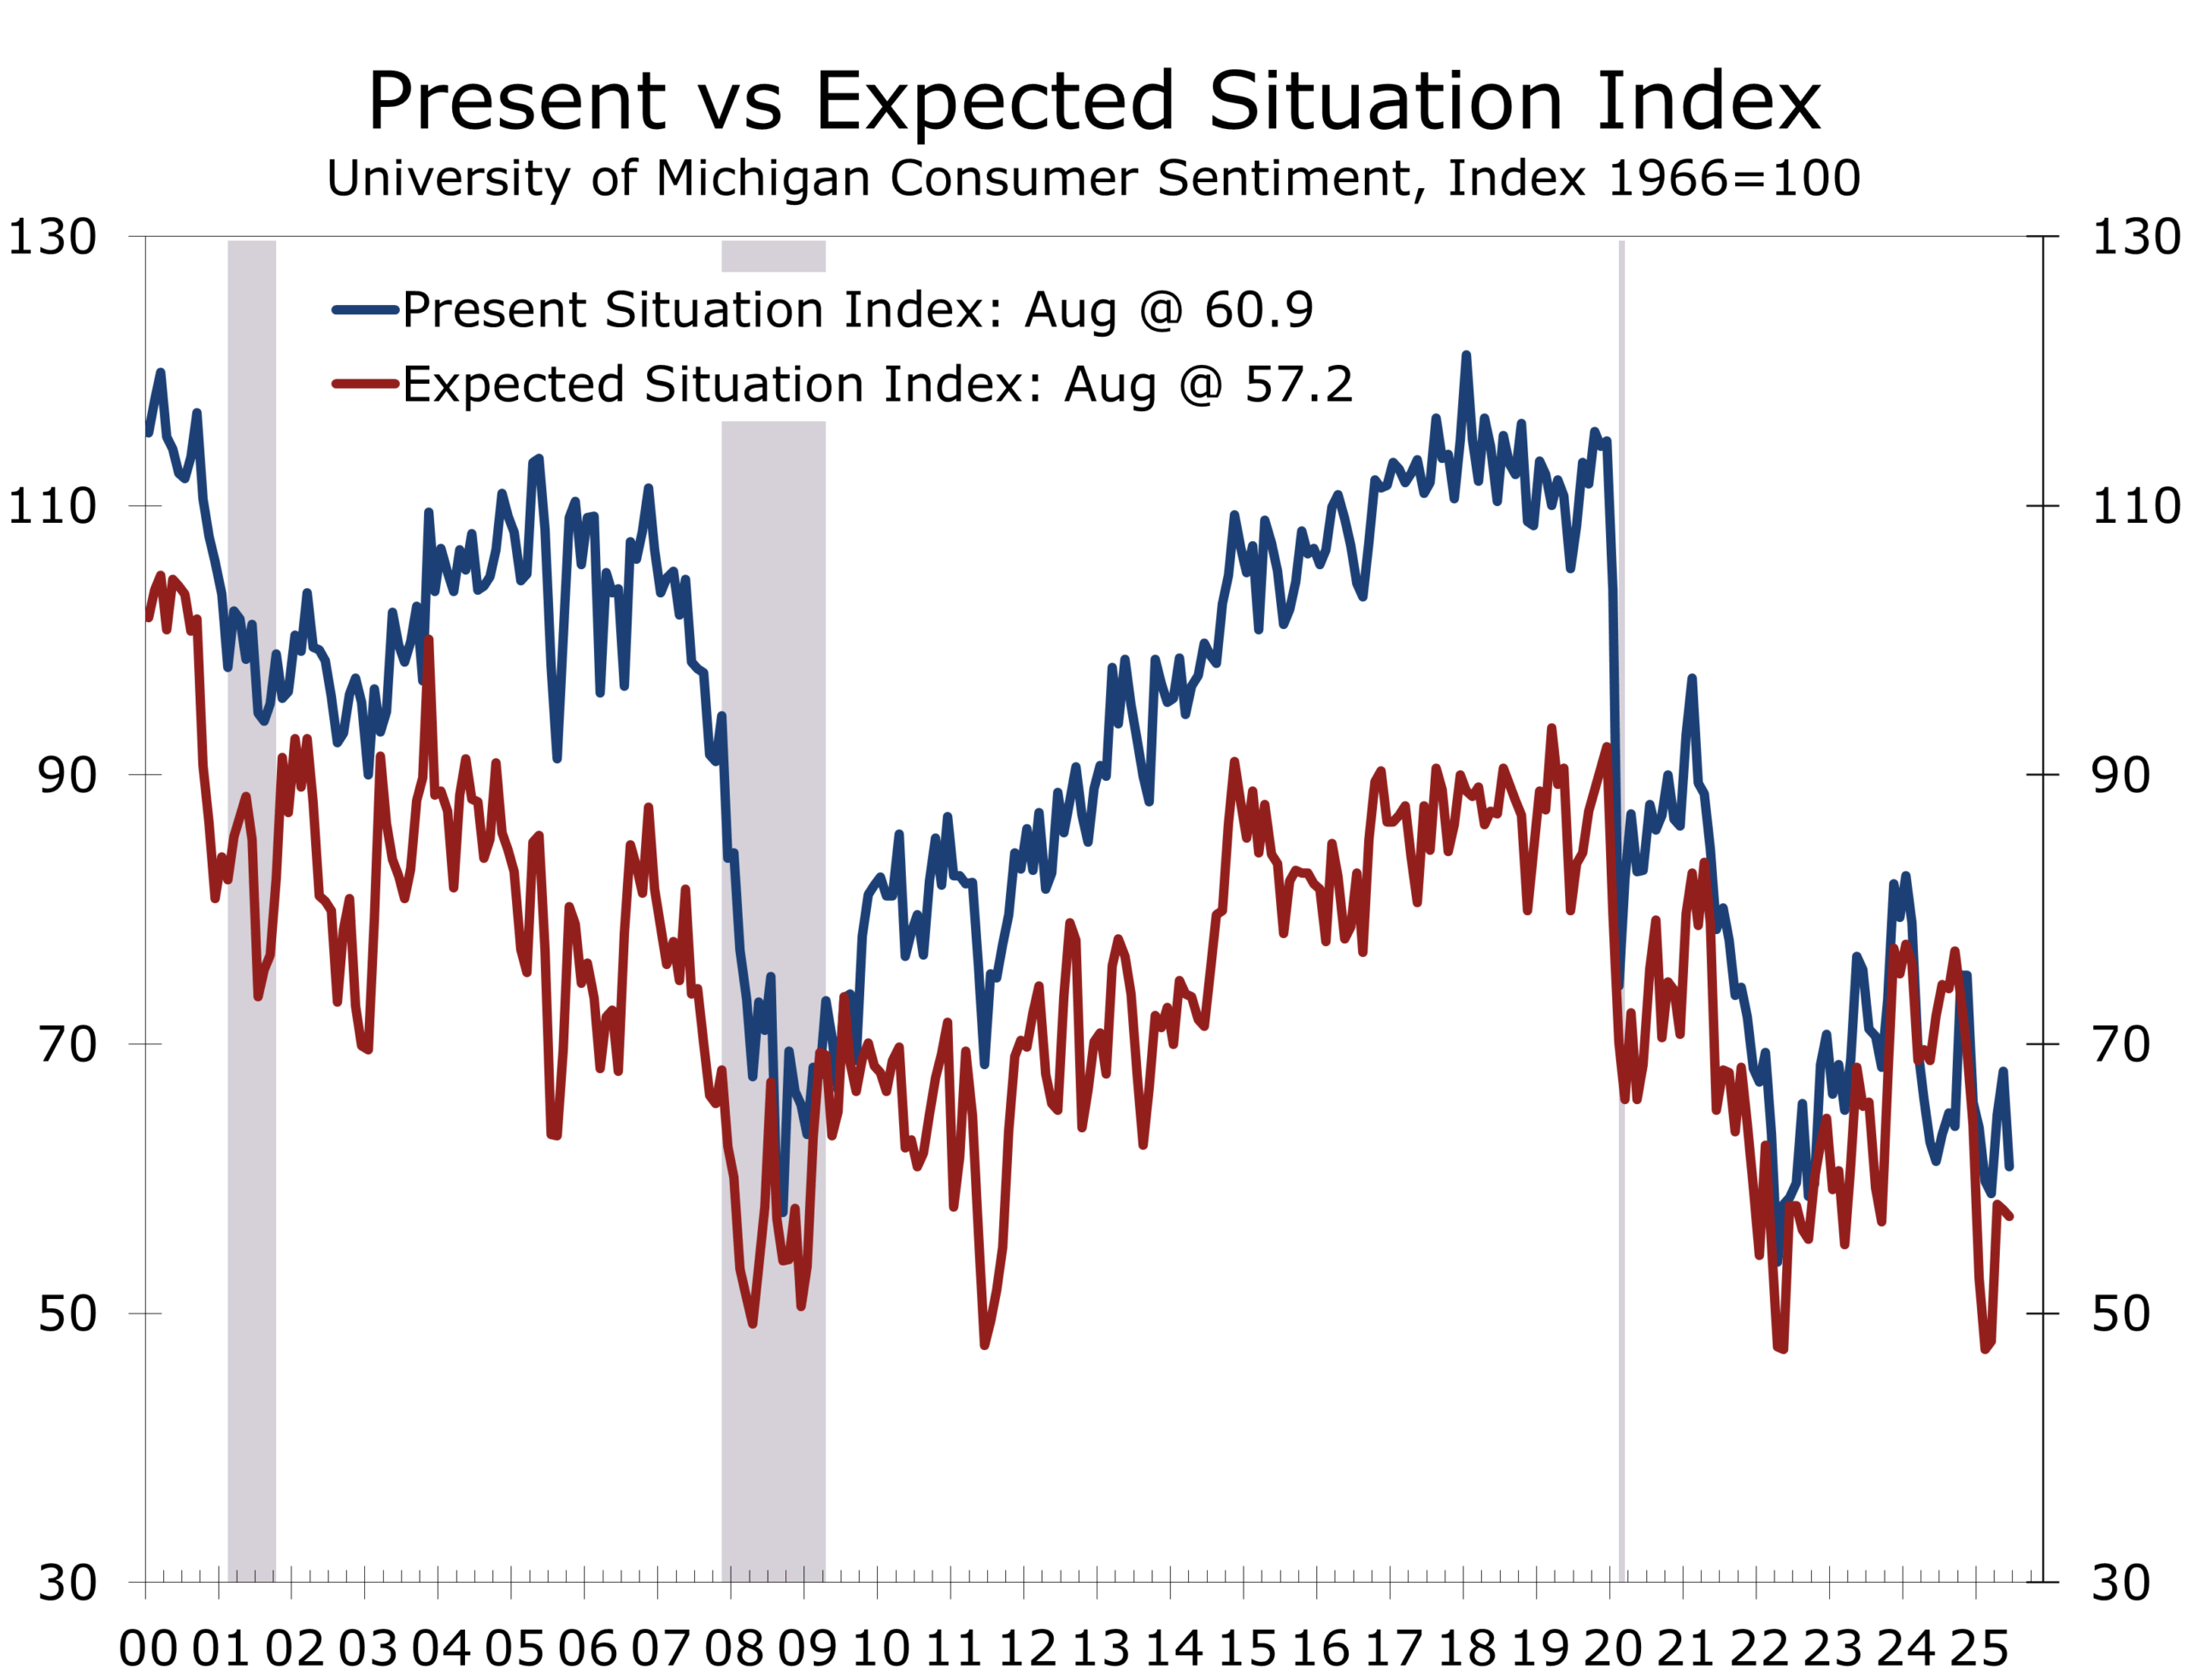
While the link between sentiment and spending has weakened since the pandemic, elevated inflation expectations and growing anxiety about the labor market can weigh on big-ticket purchases and are likely to constrain consumer spending in the coming months. The latest drop was largely concentrated in consumers’ assessment of the present situation,which fell 7.9 points to 60.9. The expectations series, which is much more closely correlated with spending, fell just 0.5 points to a still low 57.2.
We continue to expect below-trend but positive real consumption growth in Q3, supported by autos and value-oriented online promotions, with housing-related categories lagging. Spending on discretionary goods and services will likely slow or even decline modestly, which should help contain overall inflation, as services account for the bulk of consumer expenditures and the CPI and PCE price measures.
Policy & Market Implications
The retail data do not materially change the growth narrative: consumption is slowing but showing more resilience. The softer sentiment and higher inflation expectations argue for caution, but with labor data softening and core PCE still drifting lower on trend, the bar for a near‑term policy pivot remains a function of employment prints, which are weakening, as much as inflation. We see risk management dominating the Fed’s tone over the next few weeks as officials weigh still‑moderate demand against sticky goods prices and expectations.
Disclaimer: This publication has been prepared for informational purposes only and is not intended as a recommendation offer or solicitation with respect to the purchase or sale of any security or other financial product nor does it constitute investment advice.
August 15, 2025
Mark Vitner, Chief Economist
(704) 458-4000
Easing Pressures Clear the Runway for Growth
More of a Touch and Go Rather Than a Typical Soft Landing
- After a volatile first half marked by rapid tariff escalation and market swings, the reciprocal tariff regime is now largely in place. Early progress in trade negotiations with key allies suggests uncertainty could ease later this year and into 2026, reducing market risk premiums and supporting a more stable investment environment.
- Strong productivity gains, driven in part by AI adoption, and tighter immigration enforcement are reshaping labor supply and demand. This is producing a bifurcated labor market—tight for blue-collar and service roles, yet increasingly slack in many white-collar professions—creating complex challenges for wage growth and policy decisions.
- Consumer spending is slowing as softer job and income growth collide with higher prices for imported goods. Tariff pass-through is expected to increase in the second half, shifting spending toward essentials and putting added pressure on lower-income households, while higher-income consumers remain relatively resilient.
- Capital spending, previously delayed by policy uncertainty, is showing signs of acceleration. Clearer trade rules are unlocking postponed projects, with reshoring, supply chain diversification, and strategic infrastructure—including data centers and energy investments—set to drive business investment into 2026.
- While higher interest rates and tariff uncertainty have temporarily slowed momentum, the economy is positioned to regain altitude, supported by a backlog of capital projects, easing financial conditions, and a likely September Fed rate cut. However, the total number of cuts may be fewer than markets anticipate.
- Geopolitical developments—including the Alaska summit on Ukraine, the escalation in Gaza, and the expiration of the U.S.–China tariff truce—are key variables for markets. Alliance cohesion and trade negotiation outcomes will shape risk sentiment and global trade flows in the coming months.
- Outlook: We expect U.S. GDP growth to moderate to 1.3% in 2025 before reaccelerating to 2.3% in 2026 and 2.6% in 2027 (Q4/Q4). Growth will increasingly be driven by business investment, with housing and trade gradually improving as interest rates and policy clarity provide lift.
Macro Outlook – Something Beyond a Typical Soft Landing
The U.S. economy enters the second half of 2025 with momentum slowing but not stalling. After turbulence in April and May—marked by volatile markets, trade policy uncertainty, and softer consumer spending—conditions have steadied. Recession risk has eased, replaced by a more nuanced outlook: a brief deceleration followed by a cautious reacceleration as clarity improves on multiple fronts.
Rather than a smooth soft landing, the path ahead resembles a “touch and go.” In aviation, this maneuver involves landing and immediately taking off without coming to a full stop—a staple of naval carrier practice and an occasional necessity for commercial pilots when margins narrow. For the economy, the analogy fits: a short slowdown under the weight of higher interest rates and policy uncertainty, followed by renewed lift from capital investment, clearer trade rules, and a long-anticipated easing in monetary policy.
One of the largest sources of uncertainty earlier this year—the rapid escalation and down-to-the-wire negotiations over tariffs—has shifted into a more stable phase. After sending the economy on a wild ride in the first half, the reciprocal tariff regime is now largely in effect. We expect agreements with China and other key nations to emerge later this year or in early 2026. The initial adjustment period produced sharp swings in trade flows—import frontloading in Q1 subtracted about five percentage points from GDP growth, only to reverse in Q2 and add a comparable boost as imports normalized. Beneath this volatility, core domestic demand expanded just 1.2% in Q2, its slowest pace since late 2022.
While the U.S. effective tariff rate has climbed above 15%, the latest measures spared China from new penalties, limiting the risk of major supply disruptions. Financial markets have taken the changes in stride, and some uncertainty has given way to greater policy clarity. Early progress in trade talks suggests the policy backdrop could become less volatile later this year and into 2026. Markets now appear to have a better read on the administration’s trade strategy and are pricing in a potential deal with China and other major partners within the next year.
High tariffs will continue to act as a “tax-like” constraint on consumers and certain industries, but the near-term bite has been milder than feared. Much of the initial impact on prices was muted as businesses stockpiled goods ahead of implementation, absorbed costs through lower margins, and cut expenses. Those buffers are now largely exhausted, and more tariff impact is likely to pass through to prices in the second half, potentially pushing inflation back toward—or slightly above—3%.
Economic growth is expected to run below potential in the second half—around 1.3% annualized—as weaker real income growth, persistent housing market softness, and lingering policy uncertainty offset tailwinds from inventory restocking and a narrowing trade gap. Still, with the tariff regime more predictable, financial conditions easing, and the prospect of Fed rate cuts ahead, the runway for a late-2025 or early-2026 pickup in growth is beginning to clear. Lower interest rates should help ensure a safe climb-out.

Productivity Gains and Tighter Immigration Enforcement Reshape the Labor Market
The July employment report confirmed that the labor market is slowing more decisively. Nonfarm payrolls rose just 73,000, and downward revisions erased a combined 258,000 jobs from May and June. Over the past three months, job growth has averaged only 35,000—a pace well below replacement levels. The unemployment rate ticked up to 4.2% (4.24% unrounded), but this masks underlying weakness: labor force participation fell to 62.2%, the lowest since the economy’s initial ascent from the pandemic, and the employment-population ratio slipped to 59.6%. Long-term unemployment rose by 179,000 to 1.8 million, now nearly one-quarter of total unemployed.
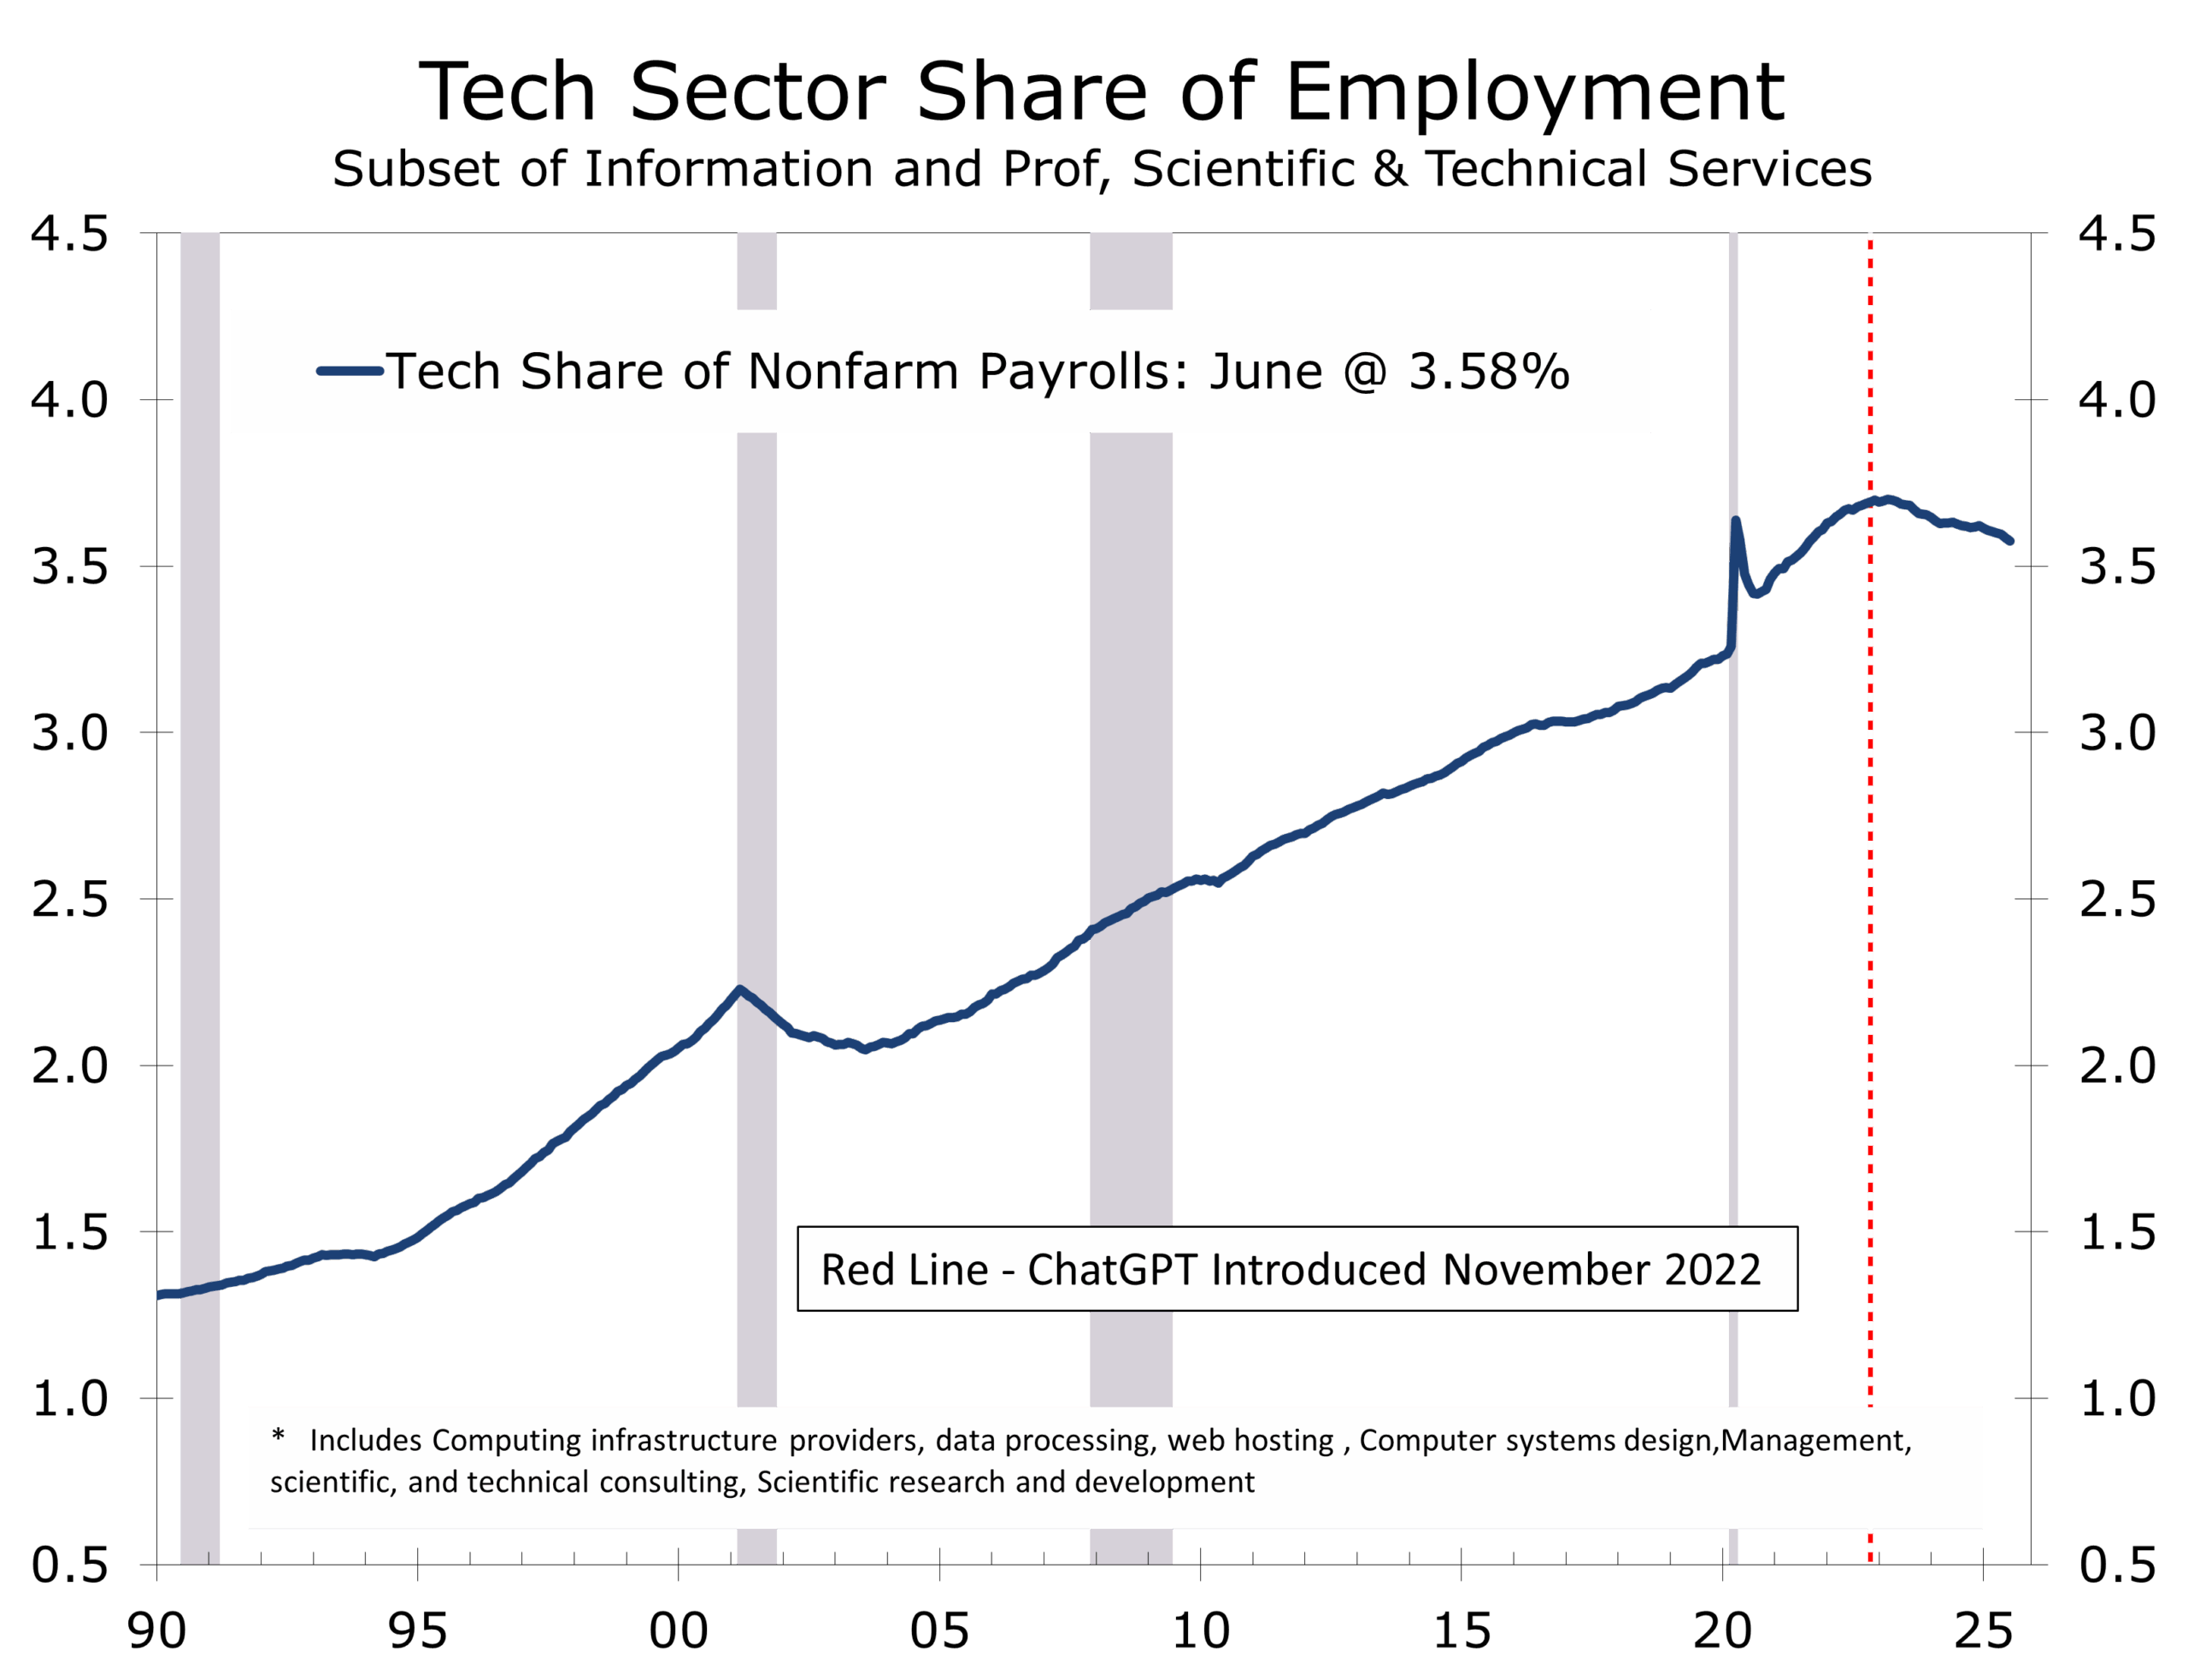
Layoffs are edging higher but remain historically low. Instead, the market is characterized by unusually low turnover—fewer firings but also fewer hirings. Productivity gains, partly driven by increased AI use, are contributing to this dynamic. Nonfarm productivity grew at a 2.4% annualized pace in Q2. Employment in a narrow set of information technology industries has fallen sharply, losing 12,300 jobs in June and seeing its share of nonfarm employment decline steadily since ChatGPT debuted in November 2022.
Hiring in sectors such as tech, finance, and business services is flat or contracting, leaving many new graduates facing an unexpectedly tough job market. By contrast, blue-collar and service roles remain tight, particularly in construction, manufacturing, logistics, and healthcare. Stricter immigration enforcement and accelerating retirements are constraining labor supply in these sectors, keeping wage pressures elevated despite slower overall hiring.
Wages remain firm, rising 0.3% in July and 3.9% year-over-year, with stronger gains in lower-paying, labor-intensive industries. This divergence—slack in white-collar work alongside persistent shortages in blue-collar roles—marks a reversal from prior labor cycles. We expect businesses to accelerate investment in automation and training programs to offset constrained labor supply in trade and service occupations, reshaping the job market in the second half of the decade.
The unevenly cooling labor market also creates a dilemma for policymakers. Easing wage pressures in white-collar sectors provide some room to cut interest rates, but sustained inflation risk from persistent blue-collar shortages limits how aggressive the Fed can be. The challenges to living standards also raise important questions for elected officials and are helping drive populist sentiment across the political spectrum.
Consumer Spending – Losing Altitude Amid Higher Prices and Softer Incomes
Consumer spending is losing momentum as softer job and income growth collide with persistently high prices for imported goods. Employment concerns are building as hiring plans slow across a wide range of industries, leaving middle- and lower-income households squeezed by tighter budgets, reduced discretionary outlays, and a growing reliance on savings or consumer credit to maintain basic consumption. Rising credit utilization in these groups signals that the cushion from pandemic-era savings has largely been depleted.
The strain is uneven across the income distribution. High-income households—buoyed by strong equity market gains, rising home values, and relatively secure employment—still account for more than half of total consumer spending. Lower-income families face greater exposure to tariff-driven price increases on necessities, thinner savings buffers, and reduced government support, such as cuts to nutrition assistance programs. The result is a bifurcated spending environment: affluent households continue to drive demand in premium goods, travel, and high-end services, while lower-income households cut back in discretionary retail, dining, and entertainment.
Tariffs are amplifying the pressure. Early mitigation—via import frontloading, margin compression, and cost cuts—has largely run its course, raising the likelihood of more direct pass-through to consumer prices in the second half. With goods inflation poised to edge back toward or slightly above 3%, households are shifting spending toward staples and away from non-essentials. Recent retail and services data confirm the pivot, with grocery and household goods outperforming, while apparel, electronics, and other discretionary categories lag.
Tighter credit conditions are compounding the slowdown. While an expected Fed rate cut later this year should lower borrowing costs, banks are raising lending standards, especially for households with weaker credit profiles. Credit card delinquency rates are climbing, led by younger borrowers and lower-income households. Mortgage refinancing could provide some relief, but the benefits are concentrated among middle- and upper-income households with strong equity positions—leaving the most financially vulnerable with limited options.
Taken together, the consumer sector is transitioning from broad-based strength to a more fragile and uneven footing. Continued resilience among high-income households should prevent a sharp collapse in aggregate spending, but persistent drag from middle- and lower-income groups will weigh on consumption growth through year-end. For policymakers, the challenge will be ensuring that rate cuts, while supportive, do not disproportionately benefit those least constrained, leaving the regressive impact of tariffs and inflation largely intact for the households that feel it most.
Capital Spending – From Standby to Full Throttle
After a year of hesitation, capital spending appears set to regain altitude as clarity on trade policy begins to filter through the corporate sector. The reciprocal tariff regime, now largely in place, has reduced the day-to-day policy uncertainty that kept many projects on hold through the first half of 2025. With the rules of engagement more clearly defined—and early signs of progress in negotiations with key allies—firms are dusting off deferred investment plans, particularly in sectors where long lead times make planning stability essential.
Manufacturers are at the forefront. Reshoring and supply chain diversification efforts, accelerated by recent geopolitical tensions, have sparked renewed investment in domestic production capacity. Industrial construction pipelines are filling, driven primarily by the need to build massive data centers to support the accelerating rollout of AI and by restructuring projects tied to defense and national security. Energy projects are also moving forward, with natural gas viewed as the fastest option to ramp up output. Small modular nuclear reactors are generating significant interest and investment, but working models remain years away. Wind and solar projects are progressing more cautiously and must stand on their own to a greater degree than in the past.
The thaw is not limited to heavy industry. Technology, logistics, and advanced manufacturing firms are expanding capacity to capture market share in growth segments—semiconductors, AI-driven data infrastructure, and electric vehicle supply chains. Commercial equipment orders, which flattened earlier this year, are expected to rebound in the second half as companies position for strengthening demand in 2026 and beyond. Clearer trade rules have improved supply chain predictability, reducing risk premiums in project budgets and freeing capital for deployment.
While elevated interest rates and a strong dollar had been drags on investment, both headwinds are easing. Treasury yields have drifted lower in anticipation of a September Fed rate cut, and corporate bond spreads remain tight, offering favorable financing conditions for well-rated issuers. For small and mid-sized firms, credit remains tighter, but even here the prospect of lower rates and clearer trade policy is helping restore confidence.
Taken together, these shifts suggest the capital spending cycle is moving from standby into taxiing for takeoff—a stage where project pipelines are being reactivated, contracts are being signed, and financing is being secured, but full-scale execution is still a few months ahead. The combination of a backlog of deferred projects, targeted reshoring initiatives, and improving financing conditions should carry this momentum into a more robust expansion phase beginning in late 2025 and into 2026. With corporate balance sheets generally healthy and supply chain bottlenecks easing, the next leg of the expansion will be driven less by the consumer and more by strategic capital deployment across key sectors—echoing the tech boom of the late 1990s.
Monetary Policy – Cleared for Landing, but a Short Runway Ahead
The Fed appears increasingly likely to begin its descent from restrictive policy at the September FOMC meeting. Softer labor market readings and a loss of altitude in consumer spending have brought rate cuts onto the active flight plan. Market pricing now implies near-certainty of a quarter-point move, with many forecasters expecting five or six cuts over the next year. We see a shorter flight path—three or four cuts at most—as inflation remains above target, tariff-related price pressures are still ahead, and the economy, while slowing, is not yet in a hard-landing trajectory.
Recent inflation readings underscore the Fed’s balancing act. Core PCE rose to 2.8% year-over-year in June, up from its spring lows, and is likely to edge above 3% before leveling off. This uptick should be temporary, but it comes at a politically sensitive moment—much like hitting turbulence on approach—complicating the optics of easing. Goods prices in tariff-exposed categories such as electronics, autos, and apparel are climbing, while consumers have responded by pulling back on discretionary services, helping to cool inflation there. Wage growth, though down from its peak, remains firm at 3.9%, adding lift to inflation pressures. Productivity gains, now picking up, may give the Fed a little more room to maneuver.
From the Fed’s perspective, the runway is visible but with uncertain crosswinds. Financial conditions have already eased on expectations of a September cut, with Treasury yields drifting lower and equity markets climbing. Housing could be an early beneficiary: with the share of mortgages above 6% roughly doubling since 2021, even a modest rate drop could spur refinancing and sales. Credit-sensitive sectors such as autos and consumer durables could also see a tailwind, though tighter lending standards will keep some households grounded.
The Fed’s challenge will be to manage descent speed. Move too quickly and it risks reigniting inflation expectations; too slowly, and growth could stall before the aircraft is aligned with the runway. Unless incoming data show a sharper slowdown in jobs or inflation, the Fed is likely to keep subsequent cuts data-dependent rather than pre-set.
In short, September looks like the “cleared for landing” moment for rate cuts, but we expect the touchdown to be brief—three or four cuts at most—before the economy gains altitude again in 2026, propelled by capital spending, reshoring of critical industries, and a modest rebound in housing.
Geopolitics – Summits, Sieges, and Shifting Leverage
The mid-August Alaska summit is shaping up as a critical waypoint in the Ukraine war. Moscow’s floated ceasefire would freeze the front lines and cement Russian territorial gains, but Ukraine and its European allies countered on August 9 with a proposal that any talks begin only after a ceasefire or reduction in hostilities—starting from current front lines—and include robust security guarantees. The U.S. has signaled openness to a trilateral meeting including Zelensky, though Putin has resisted direct talks. The Kremlin’s strategy appears aimed at dividing Washington from Europe, portraying Ukraine and the EU as obstacles to peace while refusing to compromise on core war aims.
In the Middle East, Israel’s cabinet approval of a Gaza City seizure marks an aggressive escalation in the Gaza campaign. Prime Minister Netanyahu frames the move as decisive in defeating Hamas, but European and UN leaders have condemned it as worsening a humanitarian crisis. Germany has suspended certain arms exports, and a bloc of European UNSC members has reiterated calls for a halt to hostilities. The U.S. remains firmly in Israel’s corner—reinforcing perceptions that Washington will fly solo when strategic imperatives outweigh multilateral alignment.
These parallel conflicts intersect with U.S.–China trade negotiations. The 90-day tariff truce expires August 12, just days before the Alaska summit. Beijing is watching closely to see if the U.S. maintains coordinated allied altitude or drifts toward transactional, bilateral deals. A U.S.–Russia arrangement that sidelines Europe, or growing isolation over Gaza, could embolden China to demand more favorable terms, delay market access, or resist export controls. Conversely, disciplined allied formation on Ukraine would strengthen Washington’s negotiating position.
Policy Watch – Industrial Policy for a China 2.0 World
Nvidia and AMD will remit 15% of China-related AI-chip revenue to the U.S. in exchange for export licenses—an unprecedented blend of export control and fiscal capture. The move could trim gross margins and pressure both stocks, while aligning with the administration’s broader shift toward state capitalism with American characteristics.
The U.S. response to China’s rise is moving beyond traditional free-market playbooks toward a more direct state role in steering capital, shaping industries, and linking economic policy to geopolitical goals. Unlike the Cold War, this is not a binary contest between capitalism and communism. China is the world’s second-largest economy, firmly in the communist camp politically, but using capitalist tools to generate growth.
The U.S., by contrast, remains a capitalist system increasingly willing to use the state as a strategic instrument. Tariffs, investment controls, sovereign wealth funding, and corporate leverage are now policy tools aimed at securing strategic advantage. This shift will likely endure and may define how market economies contend with China’s command-and-control model.
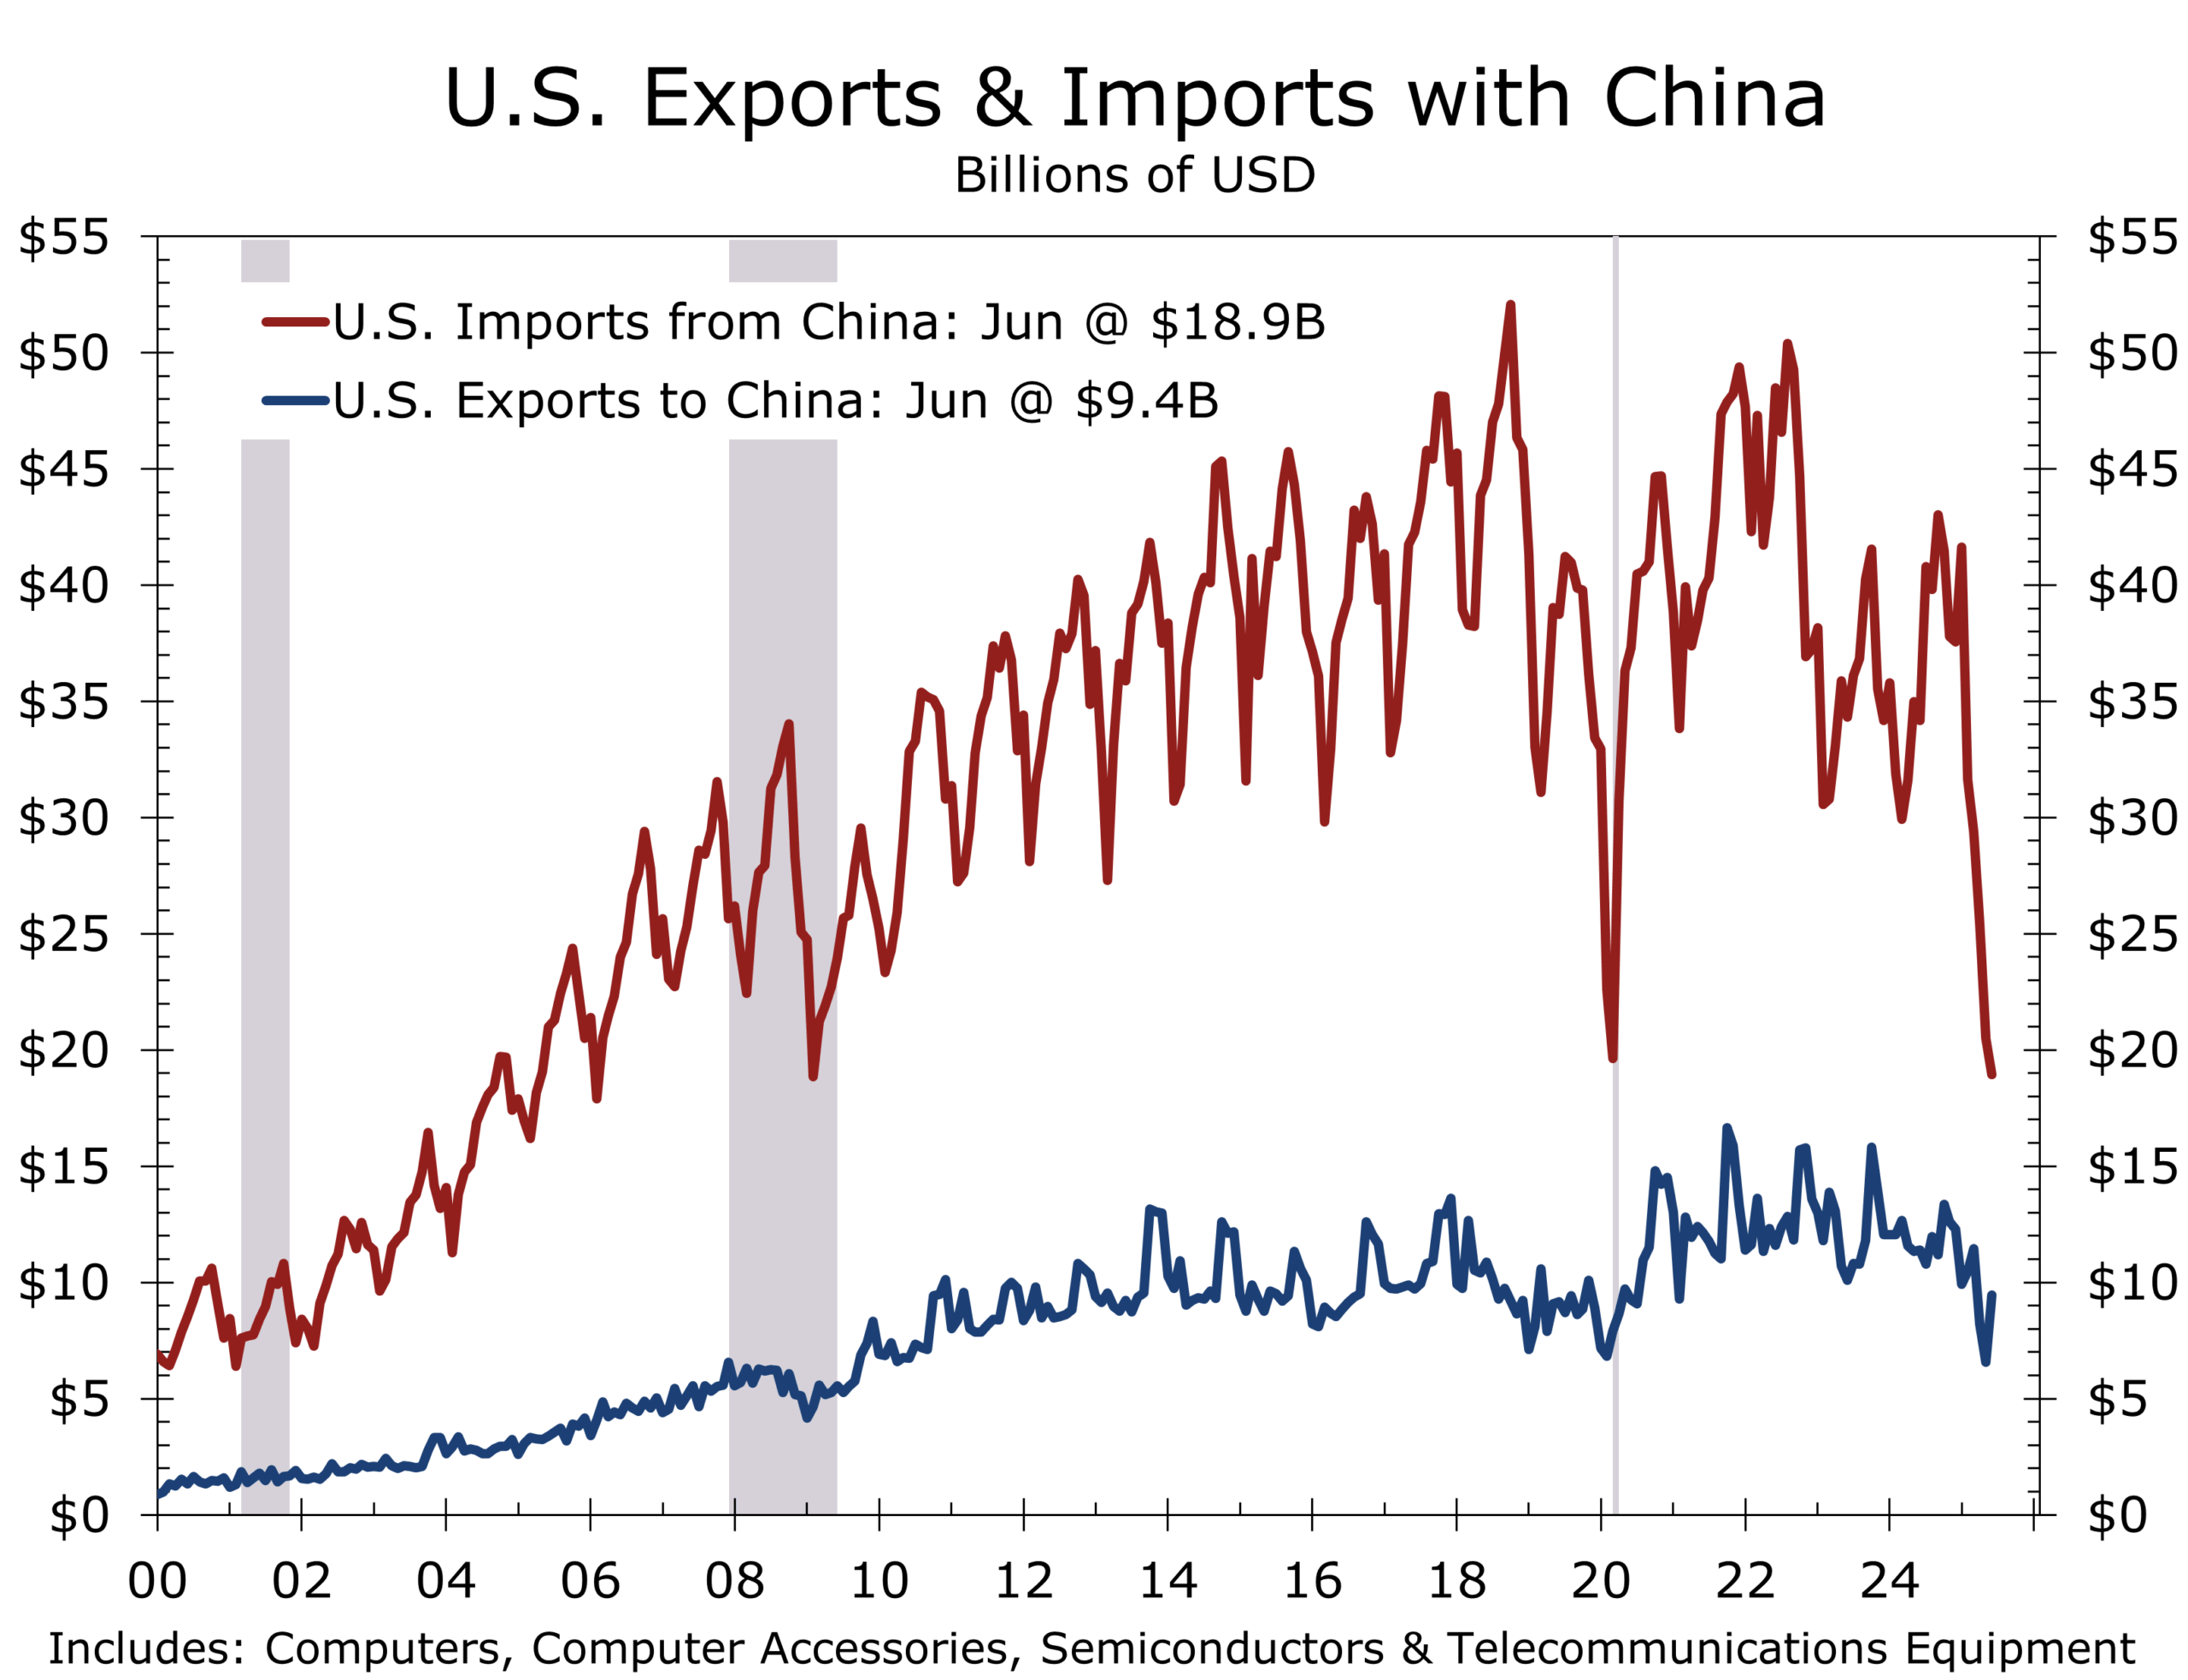
Economic Outlook – Touch and Go Landings Require a Skilled Pilot
With tariffs now largely finalized with many trade partners, we expect a base tariff of between 10% and 15%, with higher rates on China and on goods transshipped through third countries by China. An updated USMCA is likely next year, strengthening the North American trade alliance. The effective U.S. tariff rate should settle between 15% and 20%, with China’s near 35%.
Comparisons to the 1930s Smoot-Hawley tariffs are overstated. Goods account for only about one-third of consumption today versus 75% then, reducing the economy-wide impact. Still, greater tariff pass-through in the second half will push headline inflation higher, complicating the Fed’s balancing act. We expect quarter-point cuts at the September, October, and December FOMC meetings, with a possible January cut if growth disappoints.
By spring, stronger economic growth should emerge, increasingly driven by business fixed investment. Home sales and construction should see a modest rebound once mortgage rates fall near 6%. We project real GDP growth of 1.3% in 2025, 2.3% in 2026, and 2.6% in 2027, measured from Q4 to Q4.
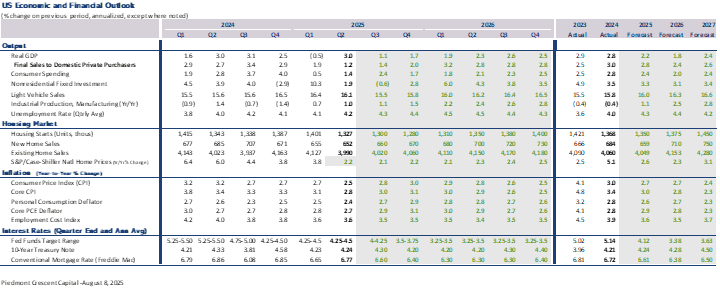
Disclaimer: This publication has been prepared for informational purposes only and is not intended as a recommendation offer or solicitation with respect to the purchase or sale of any security or other financial product nor does it constitute investment advice.
August 12, 2025
Mark Vitner, Chief Economist
704-458-4000
Core Inflation Firms, but Fed Still Has Room to Cut
Shelter Slows, Energy Drops, Tariffs Lift Core to Six-Month High
- Headline CPI rose 0.2% in July, down from 0.3% in June, and matching consensus expectations.
- Year-over-year headline inflation held at 2.7%; core CPI climbed to 3.1% from 2.9%, the largest monthly gain since January.
- Tariff-related price pressures emerged in select goods categories, offsetting declines in energy and lifting the core.
- Shelter moderated to a 0.2% monthly gain, while energy fell 1.1% as gasoline prices dropped 2.2%.
- Food prices were flat: grocery prices fell 0.1%, while dining out costs rose 0.3%.
- Strongest gains came in medical care (+0.7%) and airline fares (+4.0%), while lodging away from home fell 1.0%.
- Market expectations for a September Fed rate cut remain intact following weak July jobs data and steep downward payroll revisions.
- Data quality concerns are growing after budget cuts and partial suspensions in CPI data collection at the Bureau of Labor Statistics (BLS ).
Inflation Moderates Overall, but Core Ticks Higher
U.S. consumer prices increased moderately in July, with headline CPI rising 0.2%—slowing from June’s 0.3% gain—and holding steady at 2.7% year-over-year. The increase was in line with expectations, but the 0.3% rise in core CPI marked its strongest monthly advance since January, lifting the annual rate to 3.1% from 2.9%.
The uptick in core reflected firmer pricing for tariff-affected goods, even as broad inflation pressures remained contained. The three-month annualized pace for core CPI is running near 2.4%, consistent with a gradual convergence toward the Fed’s 2% target.
Tariffs Help Lift Inflation to a Six-Month High as Shelter and Energy Keep Headline CPI Cool.
Energy Drags, Shelter Cools Further
Energy prices fell 1.1% in July, led by a 2.2% decline in gasoline. Natural gas dropped 0.9% and electricity edged down 0.1%. On a year-over-year basis, the energy index is down 1.6%, with gasoline nearly 10% lower and fuel oil off 2.9%.
Shelter costs—which account for roughly 35% of the CPI and about 44% of the core—rose just 0.2%, the slowest monthly gain since early spring. Owners’ equivalent rent and primary rent each rose 0.3%, but lodging away from home fell 1.0%. With market-based rent measures still soft, further deceleration in shelter inflation is likely.
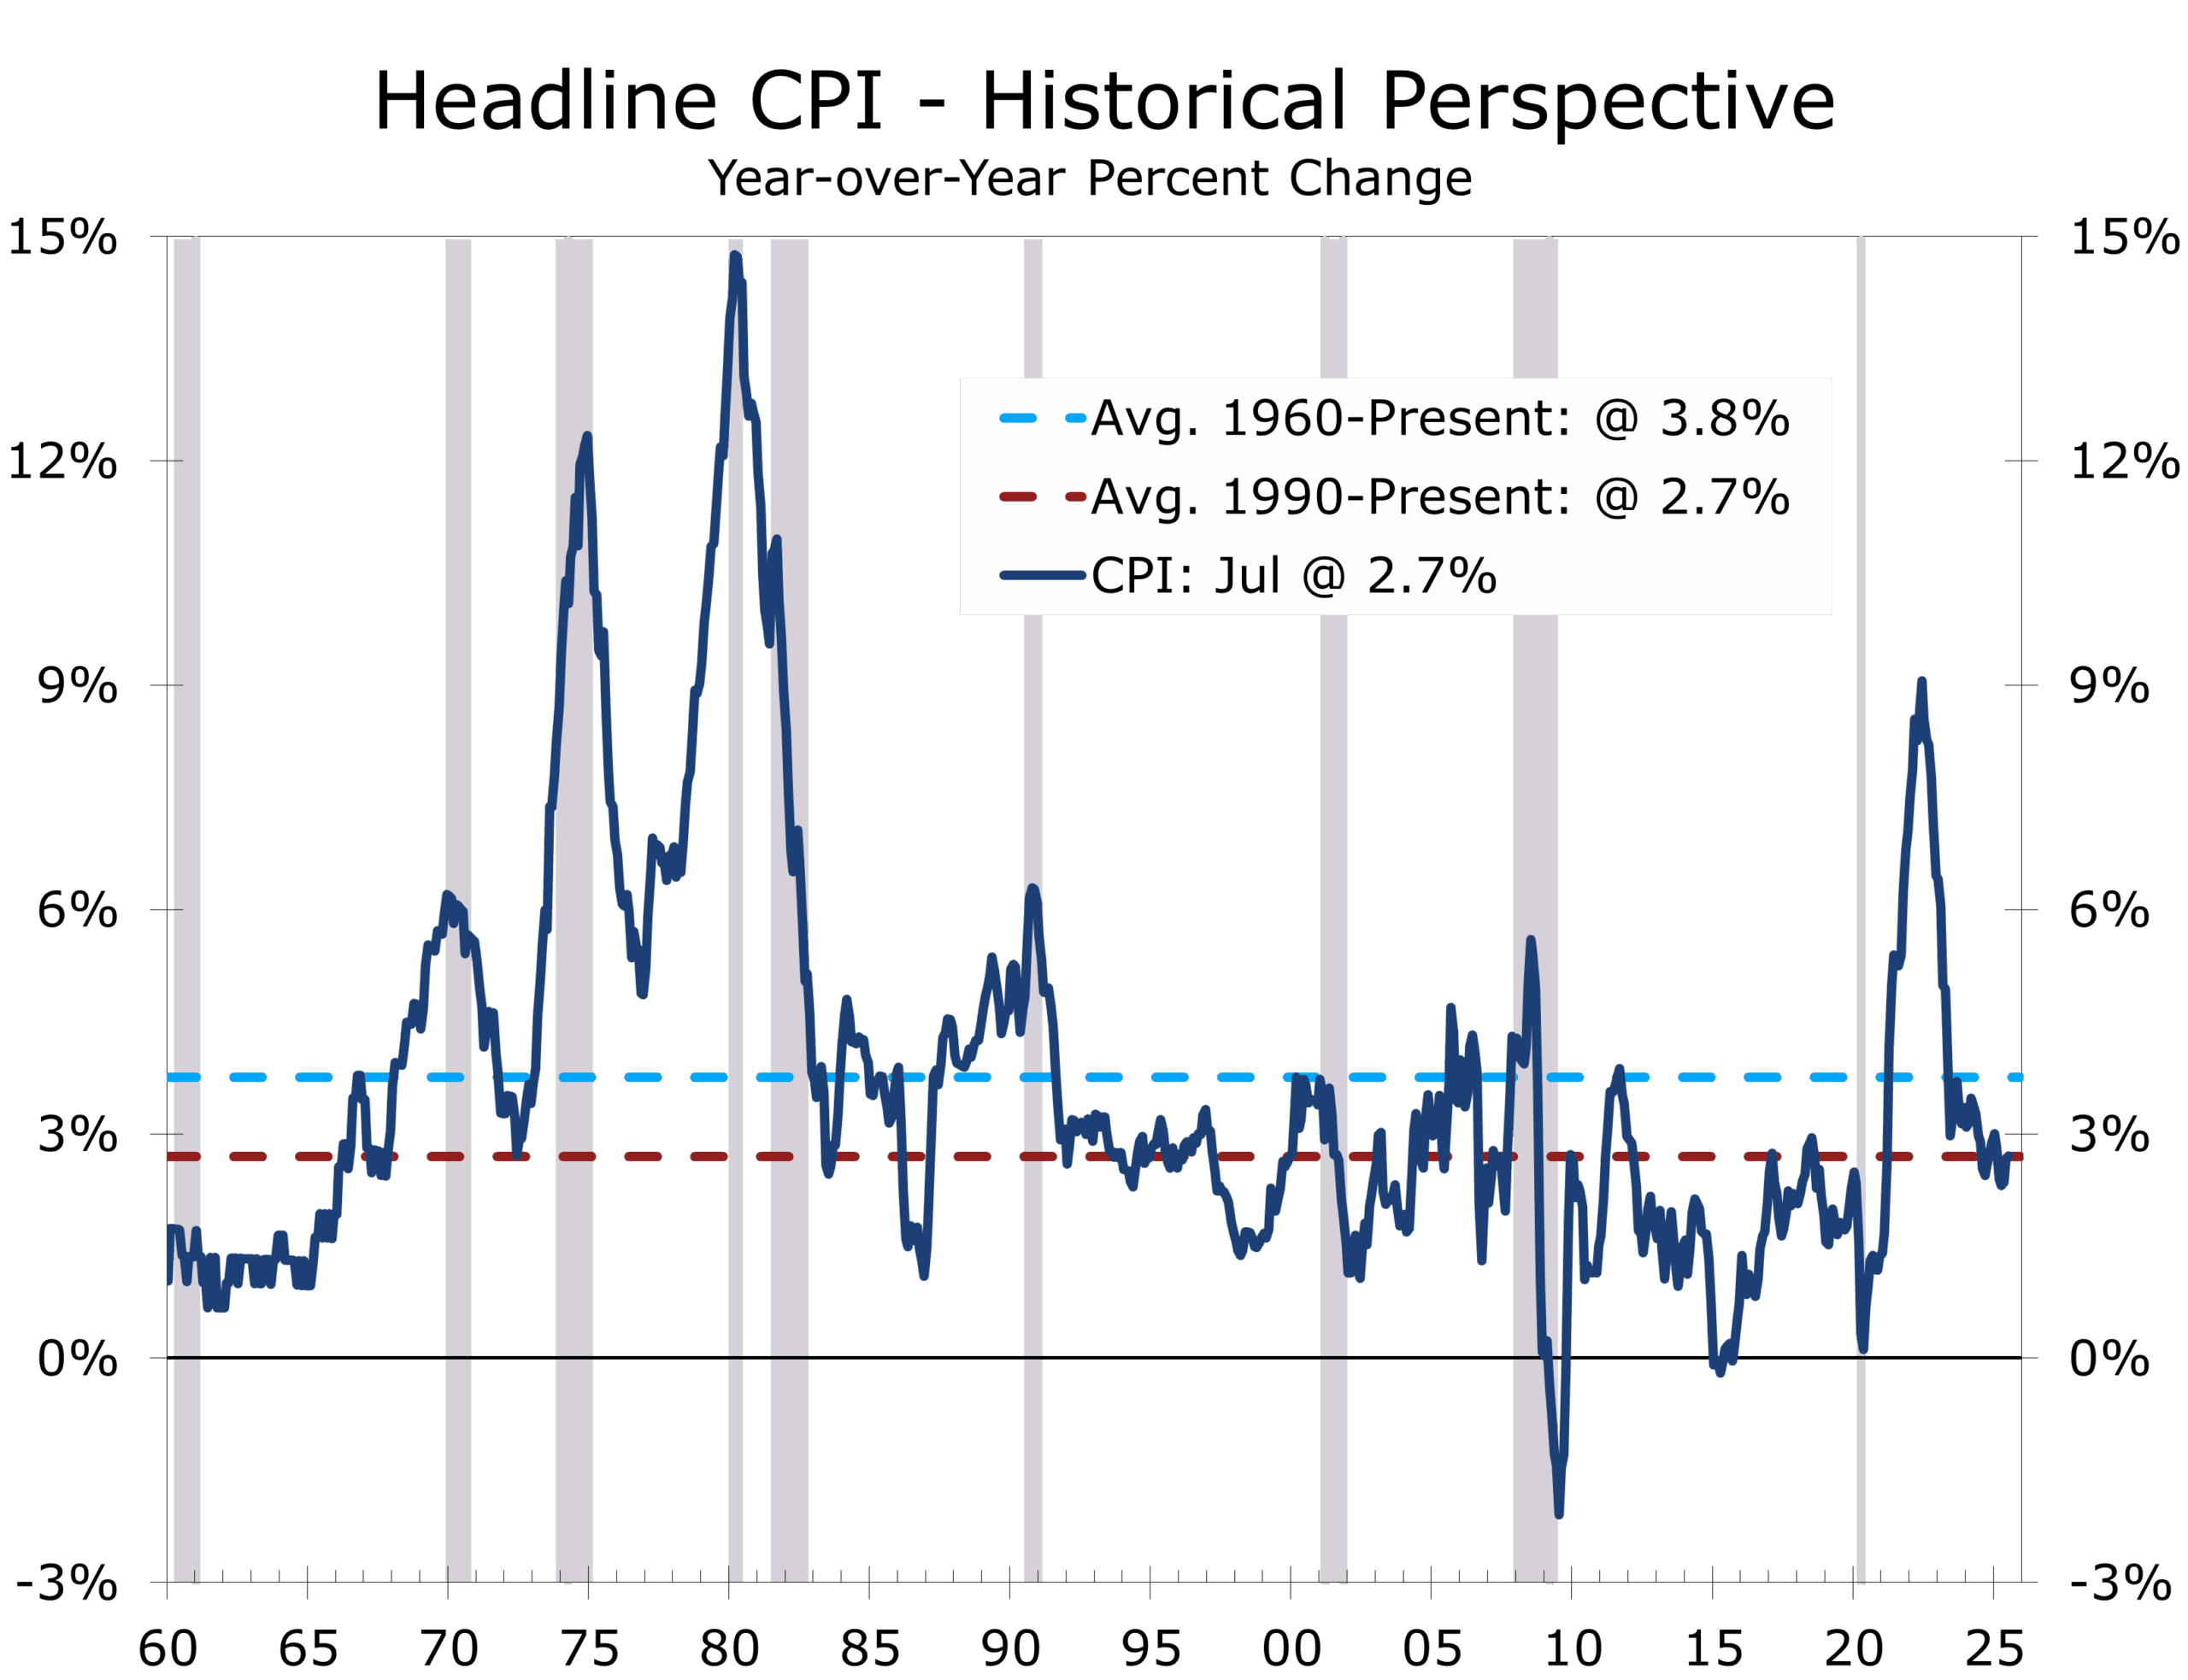
Food Prices Hold Steady
The food index was unchanged in July, ending a two-month streak of 0.3% gains. Grocery prices fell 0.1%, driven by declines in “other food at home” (-0.5%), nonalcoholic beverages (-0.5%), and cereals/bakery (-0.2%). Dairy rose 0.7%, and meats, poultry, fish, and eggs gained 0.2%, though egg prices fell sharply (-3.9%).
Food away from home rose 0.3%, with full-service meals up 0.5% and limited-service meals up just 0.1%. Over the past year, grocery prices are up 2.2% versus a 3.9% gain for restaurant prices. Many chains report tighter margins, as beef and labor costs remain elevated. Price increases are harder to pass through to middle- and lower-income households, as reflected in smaller gains at limited-service restaurants, including fast-food and quick-service outlets.
Flat food prices and limited tariff effects are slightly easing pressure on household budgets.
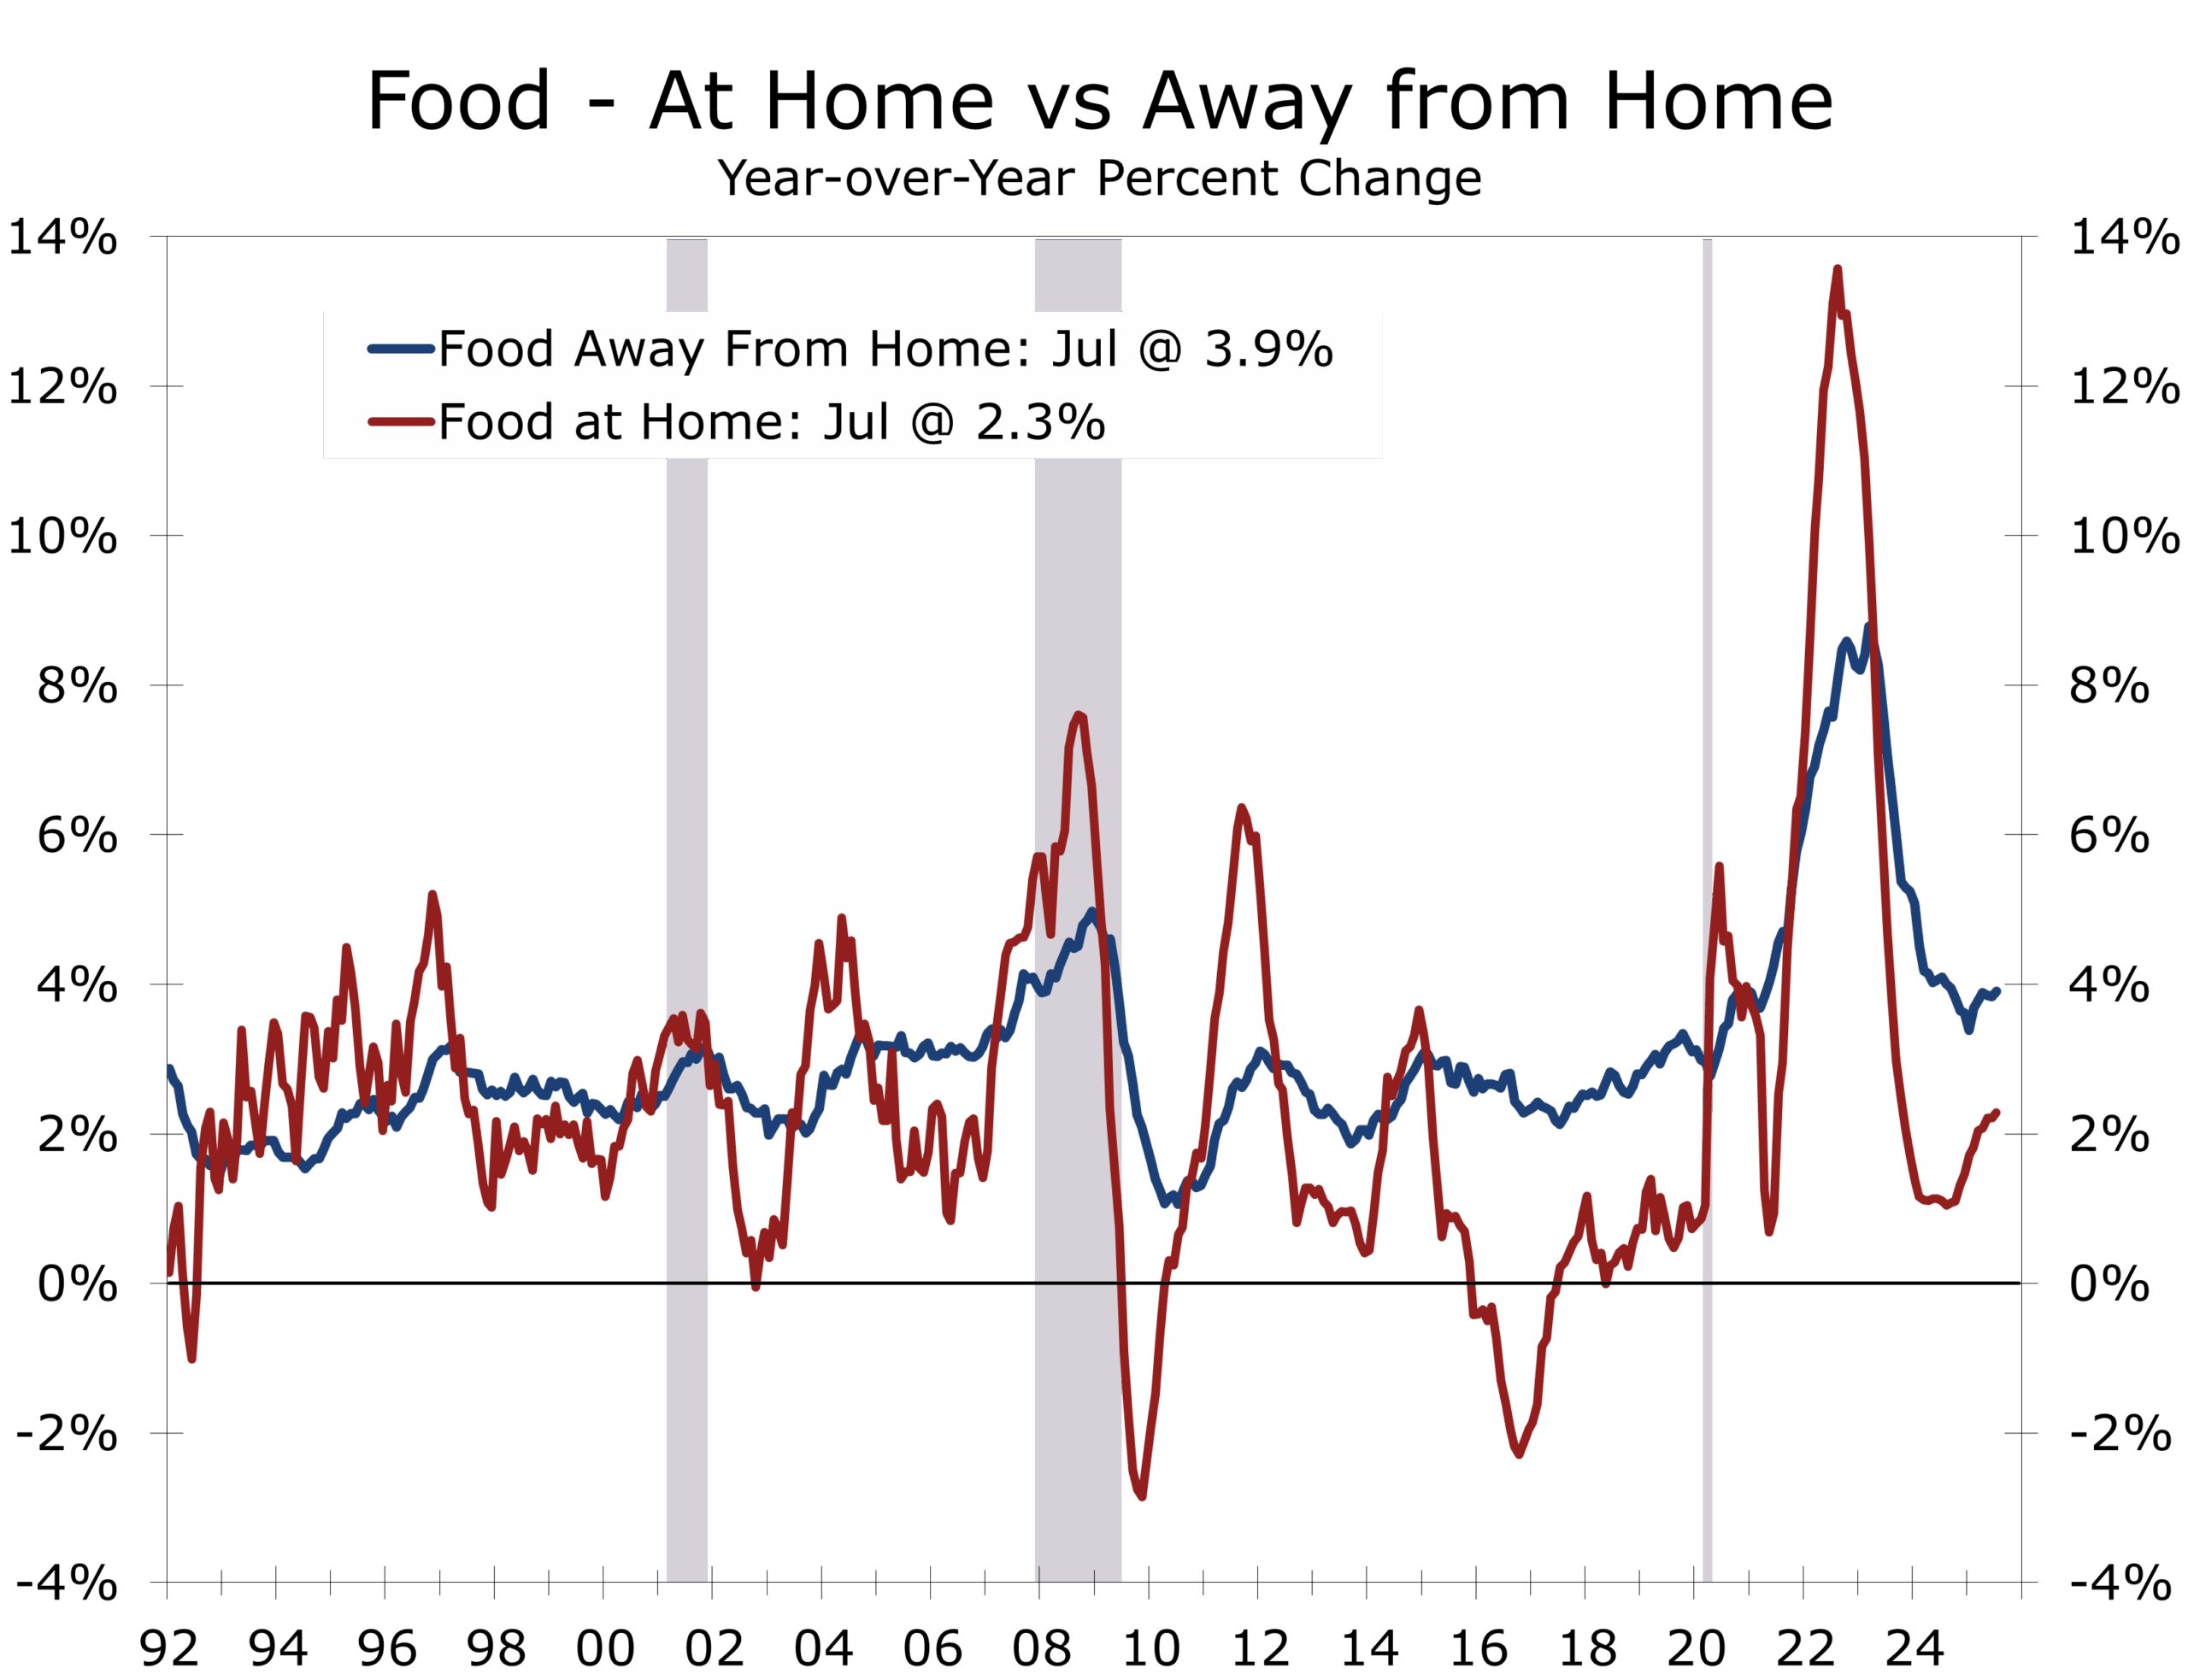
Tariff Effects: Targeted, Not Broad-Based
Tariff pass-through remains concentrated in a handful of import-heavy sectors, including furniture, linens and curtains, washing machines, and audio equipment. Broad-based effects remain absent. Apparel prices rose just 0.1% in July and have fallen 0.2% over the past year. Men’s apparel is down 0.3% year-over-year, while women’s and girls’ apparel are down 0.8%.
Footwear prices are firming—up 1.4% in July after a 0.7% gain in June—though still just 0.9% higher over the past year. Other core goods were mixed: used cars rose 0.5%, while new vehicles were flat, reflecting affordability concerns.
Core services showed more consistent strength: medical care rose 0.7%, including a 2.6% jump in dental services, and airline fares surged 4.0% after dipping in June. Recreation and household furnishings (including linens and curtains) each rose 0.4%, while communication prices fell 0.3%.
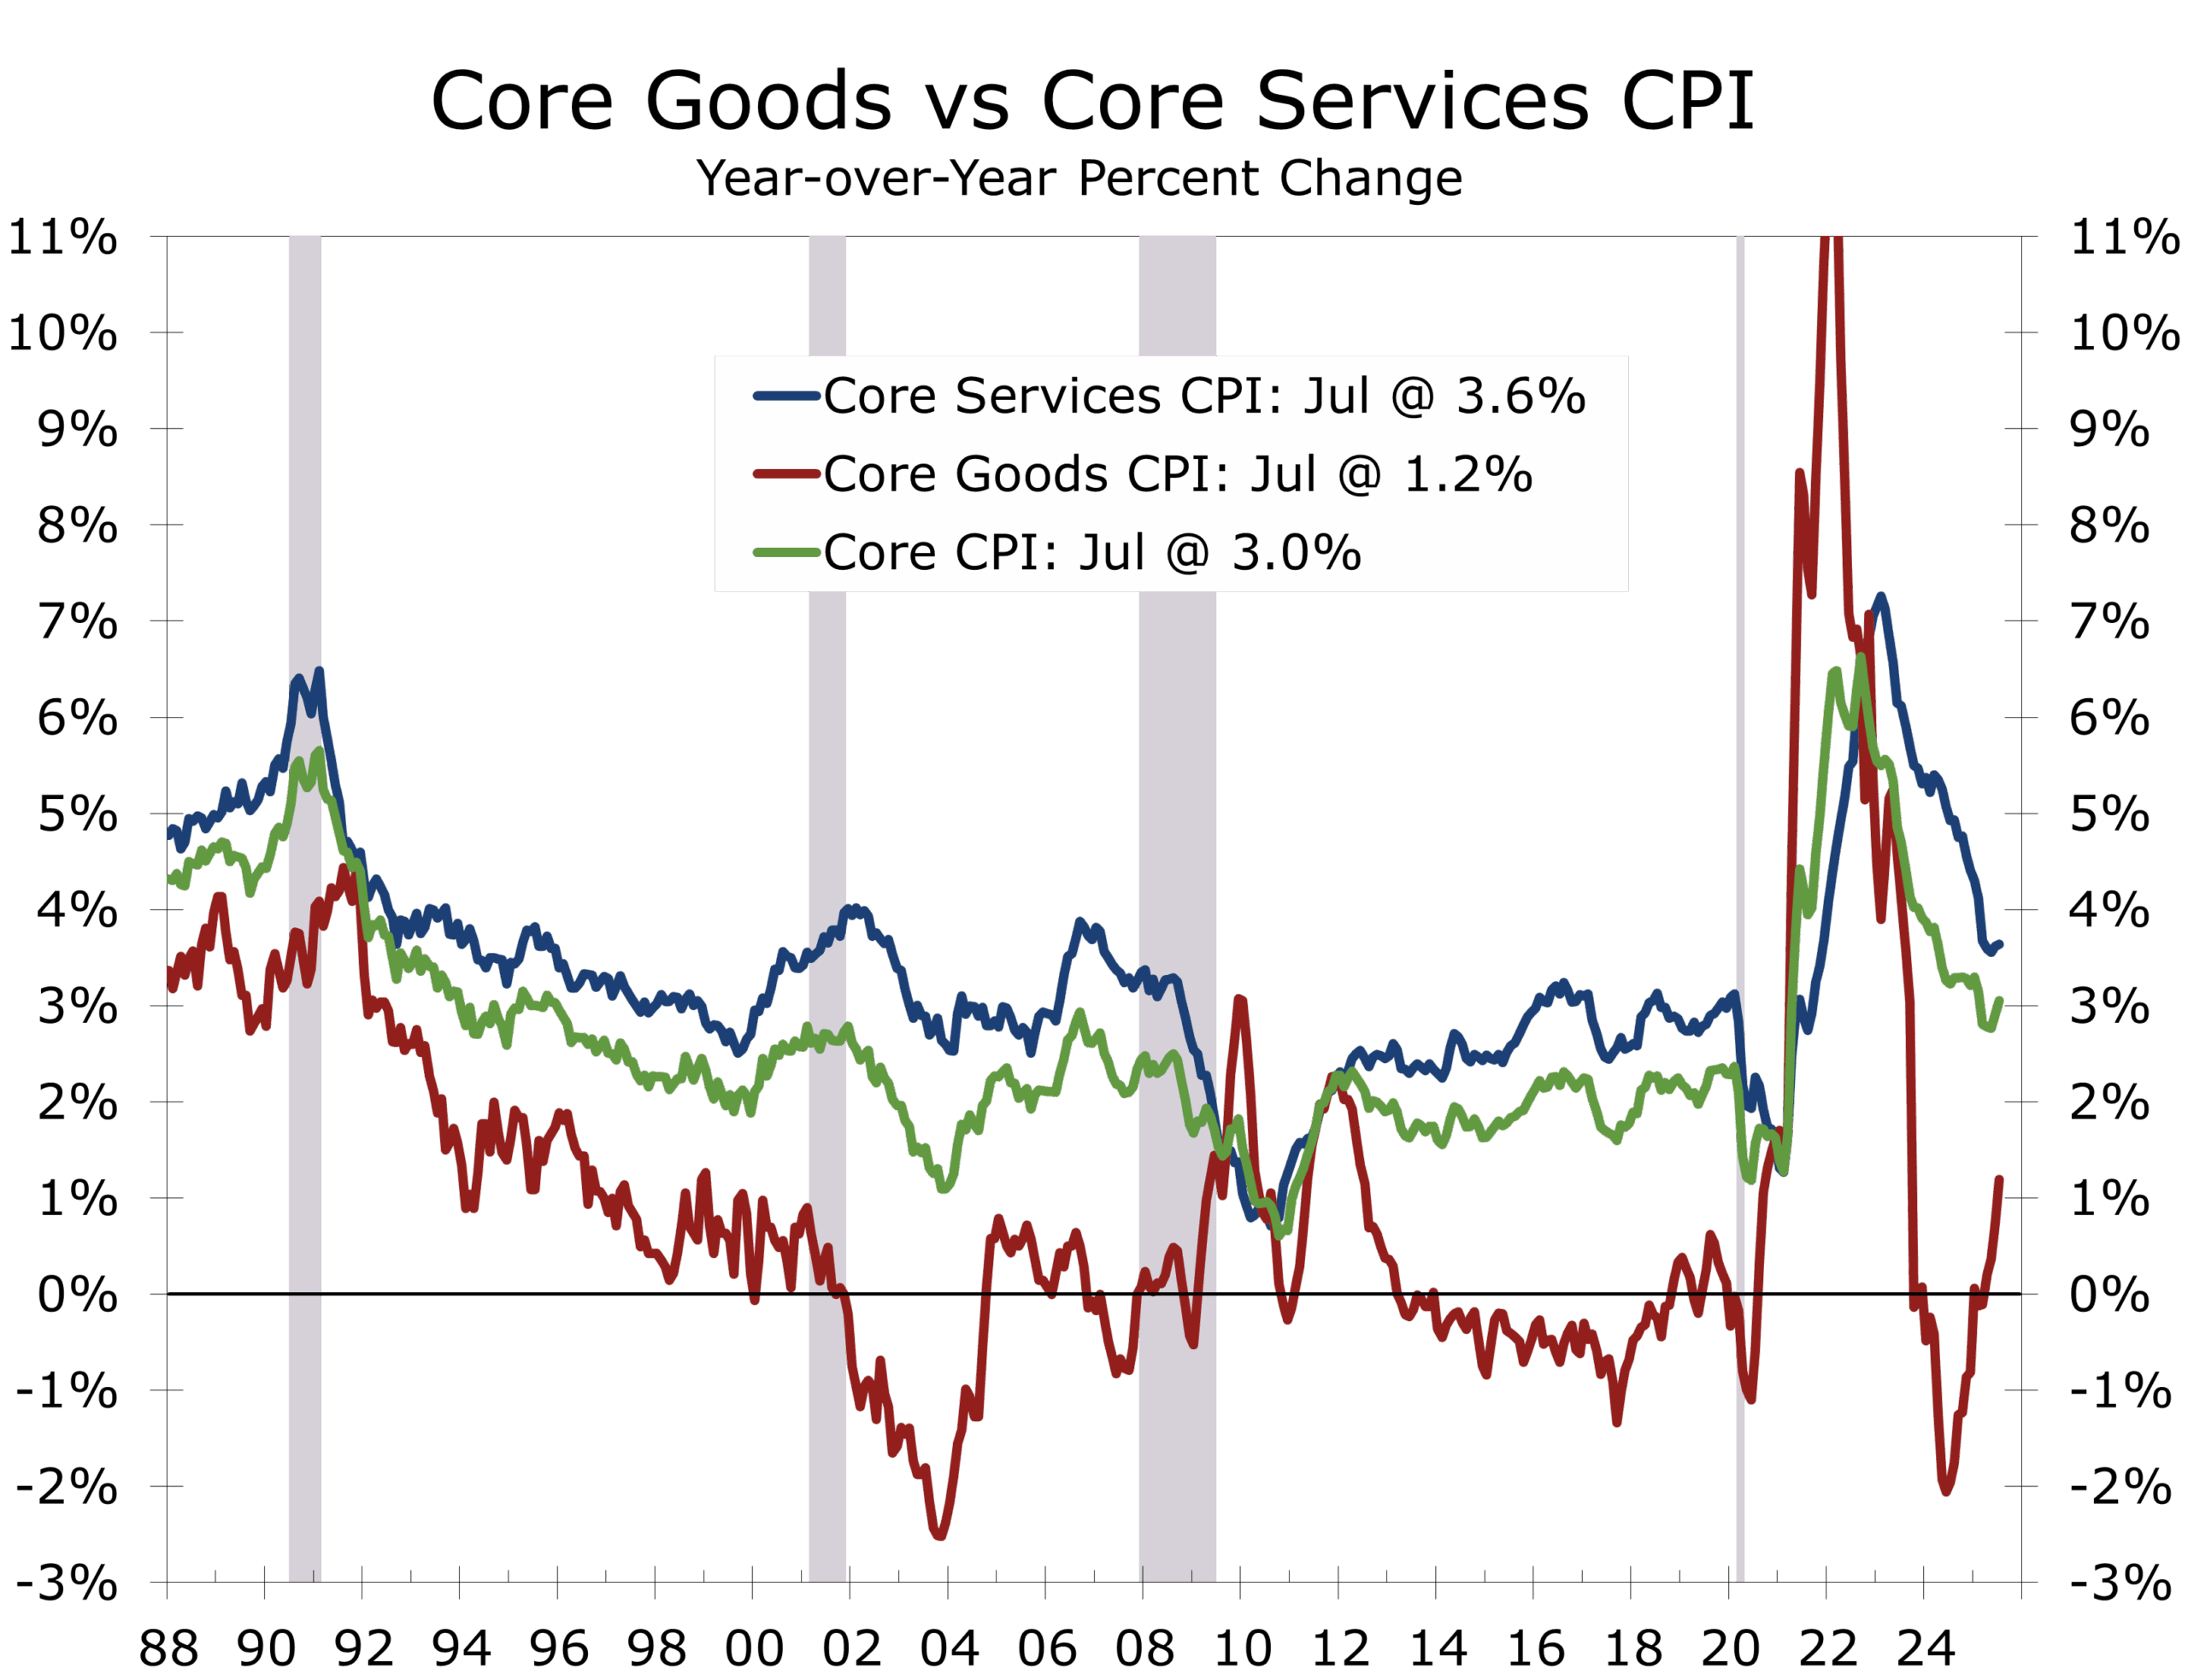
Real Earnings
Real average hourly earnings for all employees rose 0.1% in July, reflecting a 0.3% nominal wage increase offset by the 0.2% rise in the CPI-U. Combined with a 0.3% increase in the average workweek, real average weekly earnings rose 0.4% for the month.
From July 2024 to July 2025, real average hourly earnings increased 1.2%, while real average weekly earnings rose 1.4%. Gains were similar for production and nonsupervisory workers, whose real hourly earnings rose 0.1% in July and 1.3% year-over-year.
July’s improvement marks a small but notable rebound from June’s flat real wage performance, suggesting moderating inflation is allowing nominal pay gains to translate into improved household purchasing power—at least in the near term. This is a modest positive for retailers, many of which have seen sales stagnate over the past year.
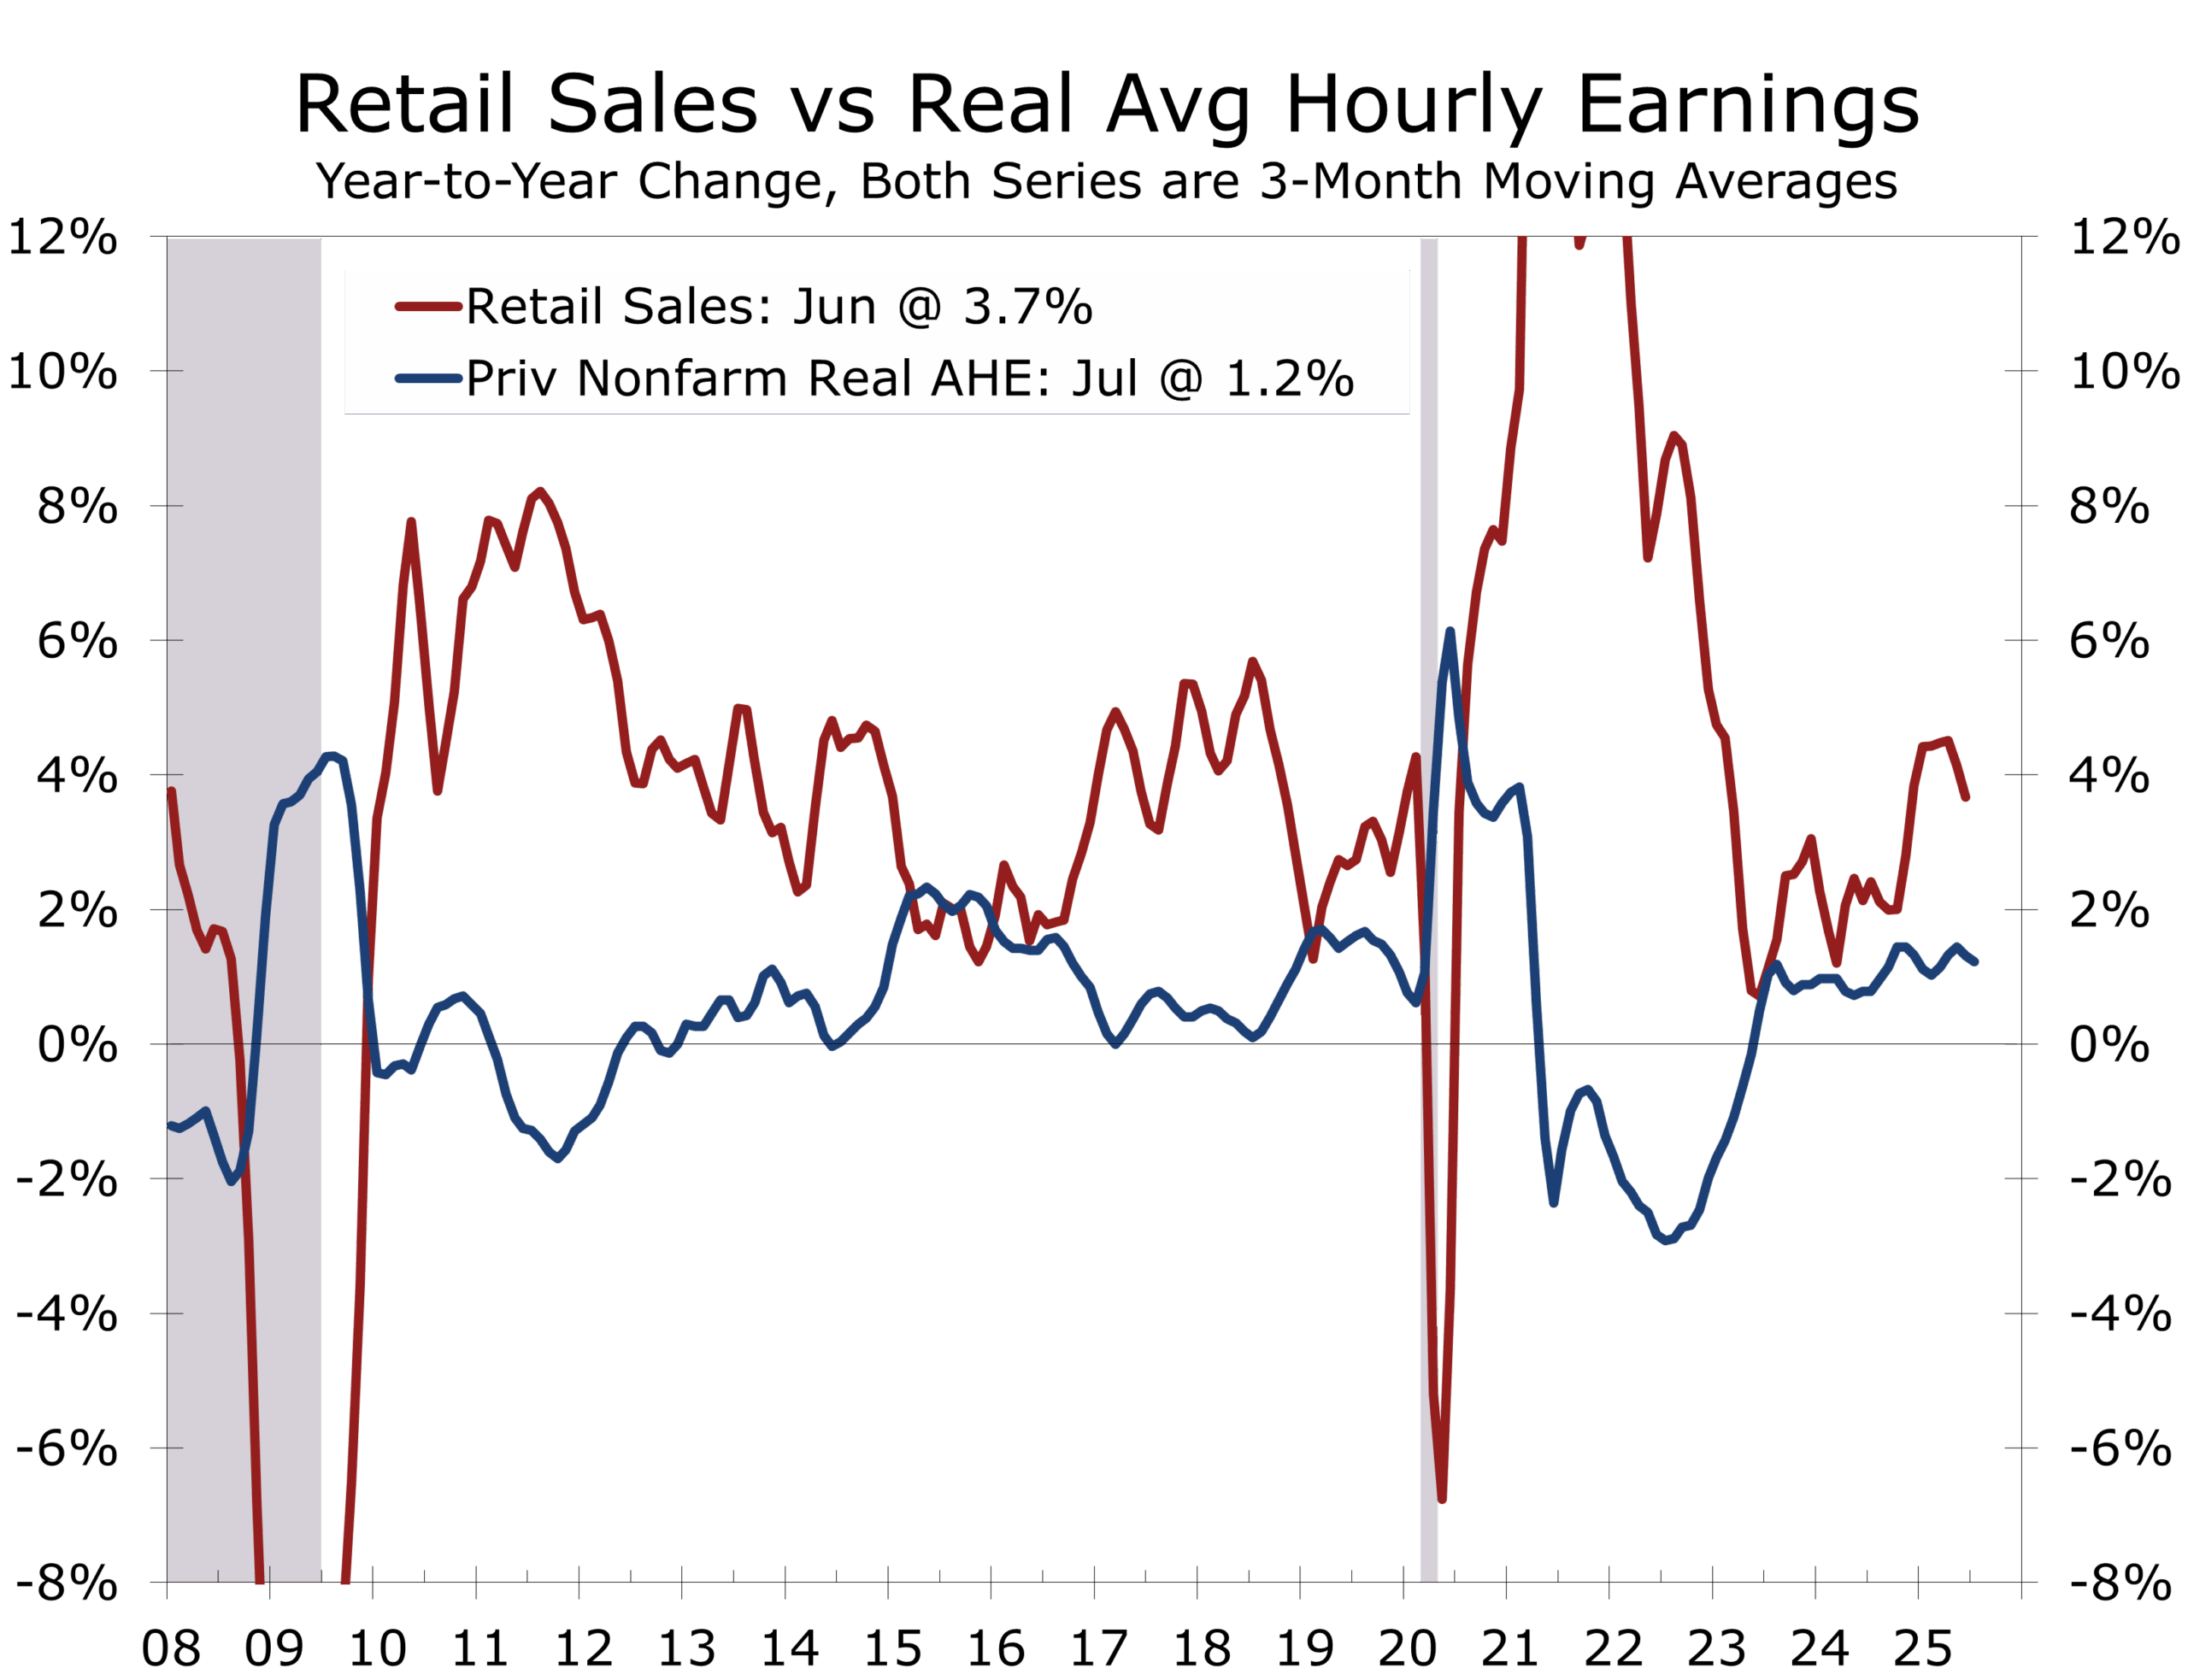
Policy Outlook: September Cut Still in Play
The July CPI report supports market expectations for a September Fed rate cut, particularly after July’s weak employment report and steep downward payroll revisions. The Fed has held its policy rate at 4.25%–4.50% since December, balancing slowing inflation with a softening labor market.
While headline inflation remains above target, cooling shelter inflation and the absence of broad-based price acceleration give the Fed room to ease without reigniting price pressures. A faster tariff pass-through remains the main upside risk and could slow the pace of easing.

Data Quality Concerns Cloud the Picture
July’s CPI release comes amid mounting concerns over statistical reliability following budget cuts and staffing reductions at the BLS. Earlier this month, President Donald Trump dismissed BLS Commissioner Erika McEntarfer after July’s weak job growth and unusually large downward payroll revisions. Accuracy issues in monthly employment data date back to the pandemic and involve larger-than-usual revisions and wide discrepancies with the more reliable QCEW series.
The BLS has suspended CPI data collection entirely in one city each in Nebraska, Utah, and New York, and reduced collection by roughly 15% in other areas. This affects both goods and housing surveys, forcing greater reliance on imputations to fill gaps. The share of “different cell” imputations—borrowing prices from broader geographic areas—jumped to 35% in June from 8% a year earlier. Economists do not believe these methods systematically bias CPI, but the potential for higher volatility warrants caution in interpreting month-to-month changes.
Disclaimer: This publication has been prepared for informational purposes only and is not intended as a recommendation offer or solicitation with respect to the purchase or sale of any security or other financial product nor does it constitute investment advice.
August 12, 2025
Mark Vitner, Chief Economist
(704) 458-4000
A View from the Piedmont: Our Weekly Commentary on Money, Credit, Exchange Rates & Geopolitics – Labor Softens, Tariffs Bite, and Policy Risks Grow
Highlights of the Week
- July’s employment report confirmed a sharp deceleration—payrolls rose 73,000, and data for May and June were revised down by a combined 258,000 jobs.
- Private sector hiring has flatlined; healthcare and social services, finance and retail trade account for all net job growth.
- Unemployment edged up to 4.2% (4.248% unrounded), while labor force participation slipped to 61.7%.
- President Trump’s reciprocal tariff regime took effect August 1, pushing effective U.S. tariff rates above 15%.
- Microsoft and Meta delivered strong earnings, reinforcing optimism around AI-driven investment and productivity.
- Treasury yields fell and the dollar softened as markets priced in a September rate cut; equities posted their worst week since Liberation Day in early April.
- Russia launched its most intense weekly barrage in Ukraine since May, while famine in Gaza prompted diplomatic fractures among Western allies. In a notable shift, the Arab League officially condemned the October 7 attack on Israel and declared that Hamas should surrender and play no role in governing Gaza or any future Palestinian state.
- Markets now expect a September rate cut; this week’s data—services ISM, unit labor costs, inflation sentiment, and various Fed speakers—will be closely watched for clues into the underlying pace of growth and change in sentiment.
The Recovery Slows Beneath the Surface
The July employment report confirmed the labor market is softening. Nonfarm payrolls rose by just 73,000, well below consensus. Moreover, May and June data were revised lower by a combined 258,000. Over the past three months, the economy has added an average of just 35,000 jobs per month.
The private sector has held up slightly better, adding an average of 52,000 jobs a month for the past three months. Private-sector hiring is being carried by healthcare and social services. Manufacturing employment fell for the third straight month, while construction and professional services were flat. A subset of tech jobs we track within professional and technical services lost 12,300 jobs and has shed 33,200 jobs over the past three months.
Much of the downward revisions to May and June data was to state and local government. The timing of the end of the school year often leads to wide swings in the seasonally adjusted data this time of year. Still, downward revisions of this magnitude are rare. Federal government payrolls have declined for six consecutive months, reflecting DOGE cuts and retirements.
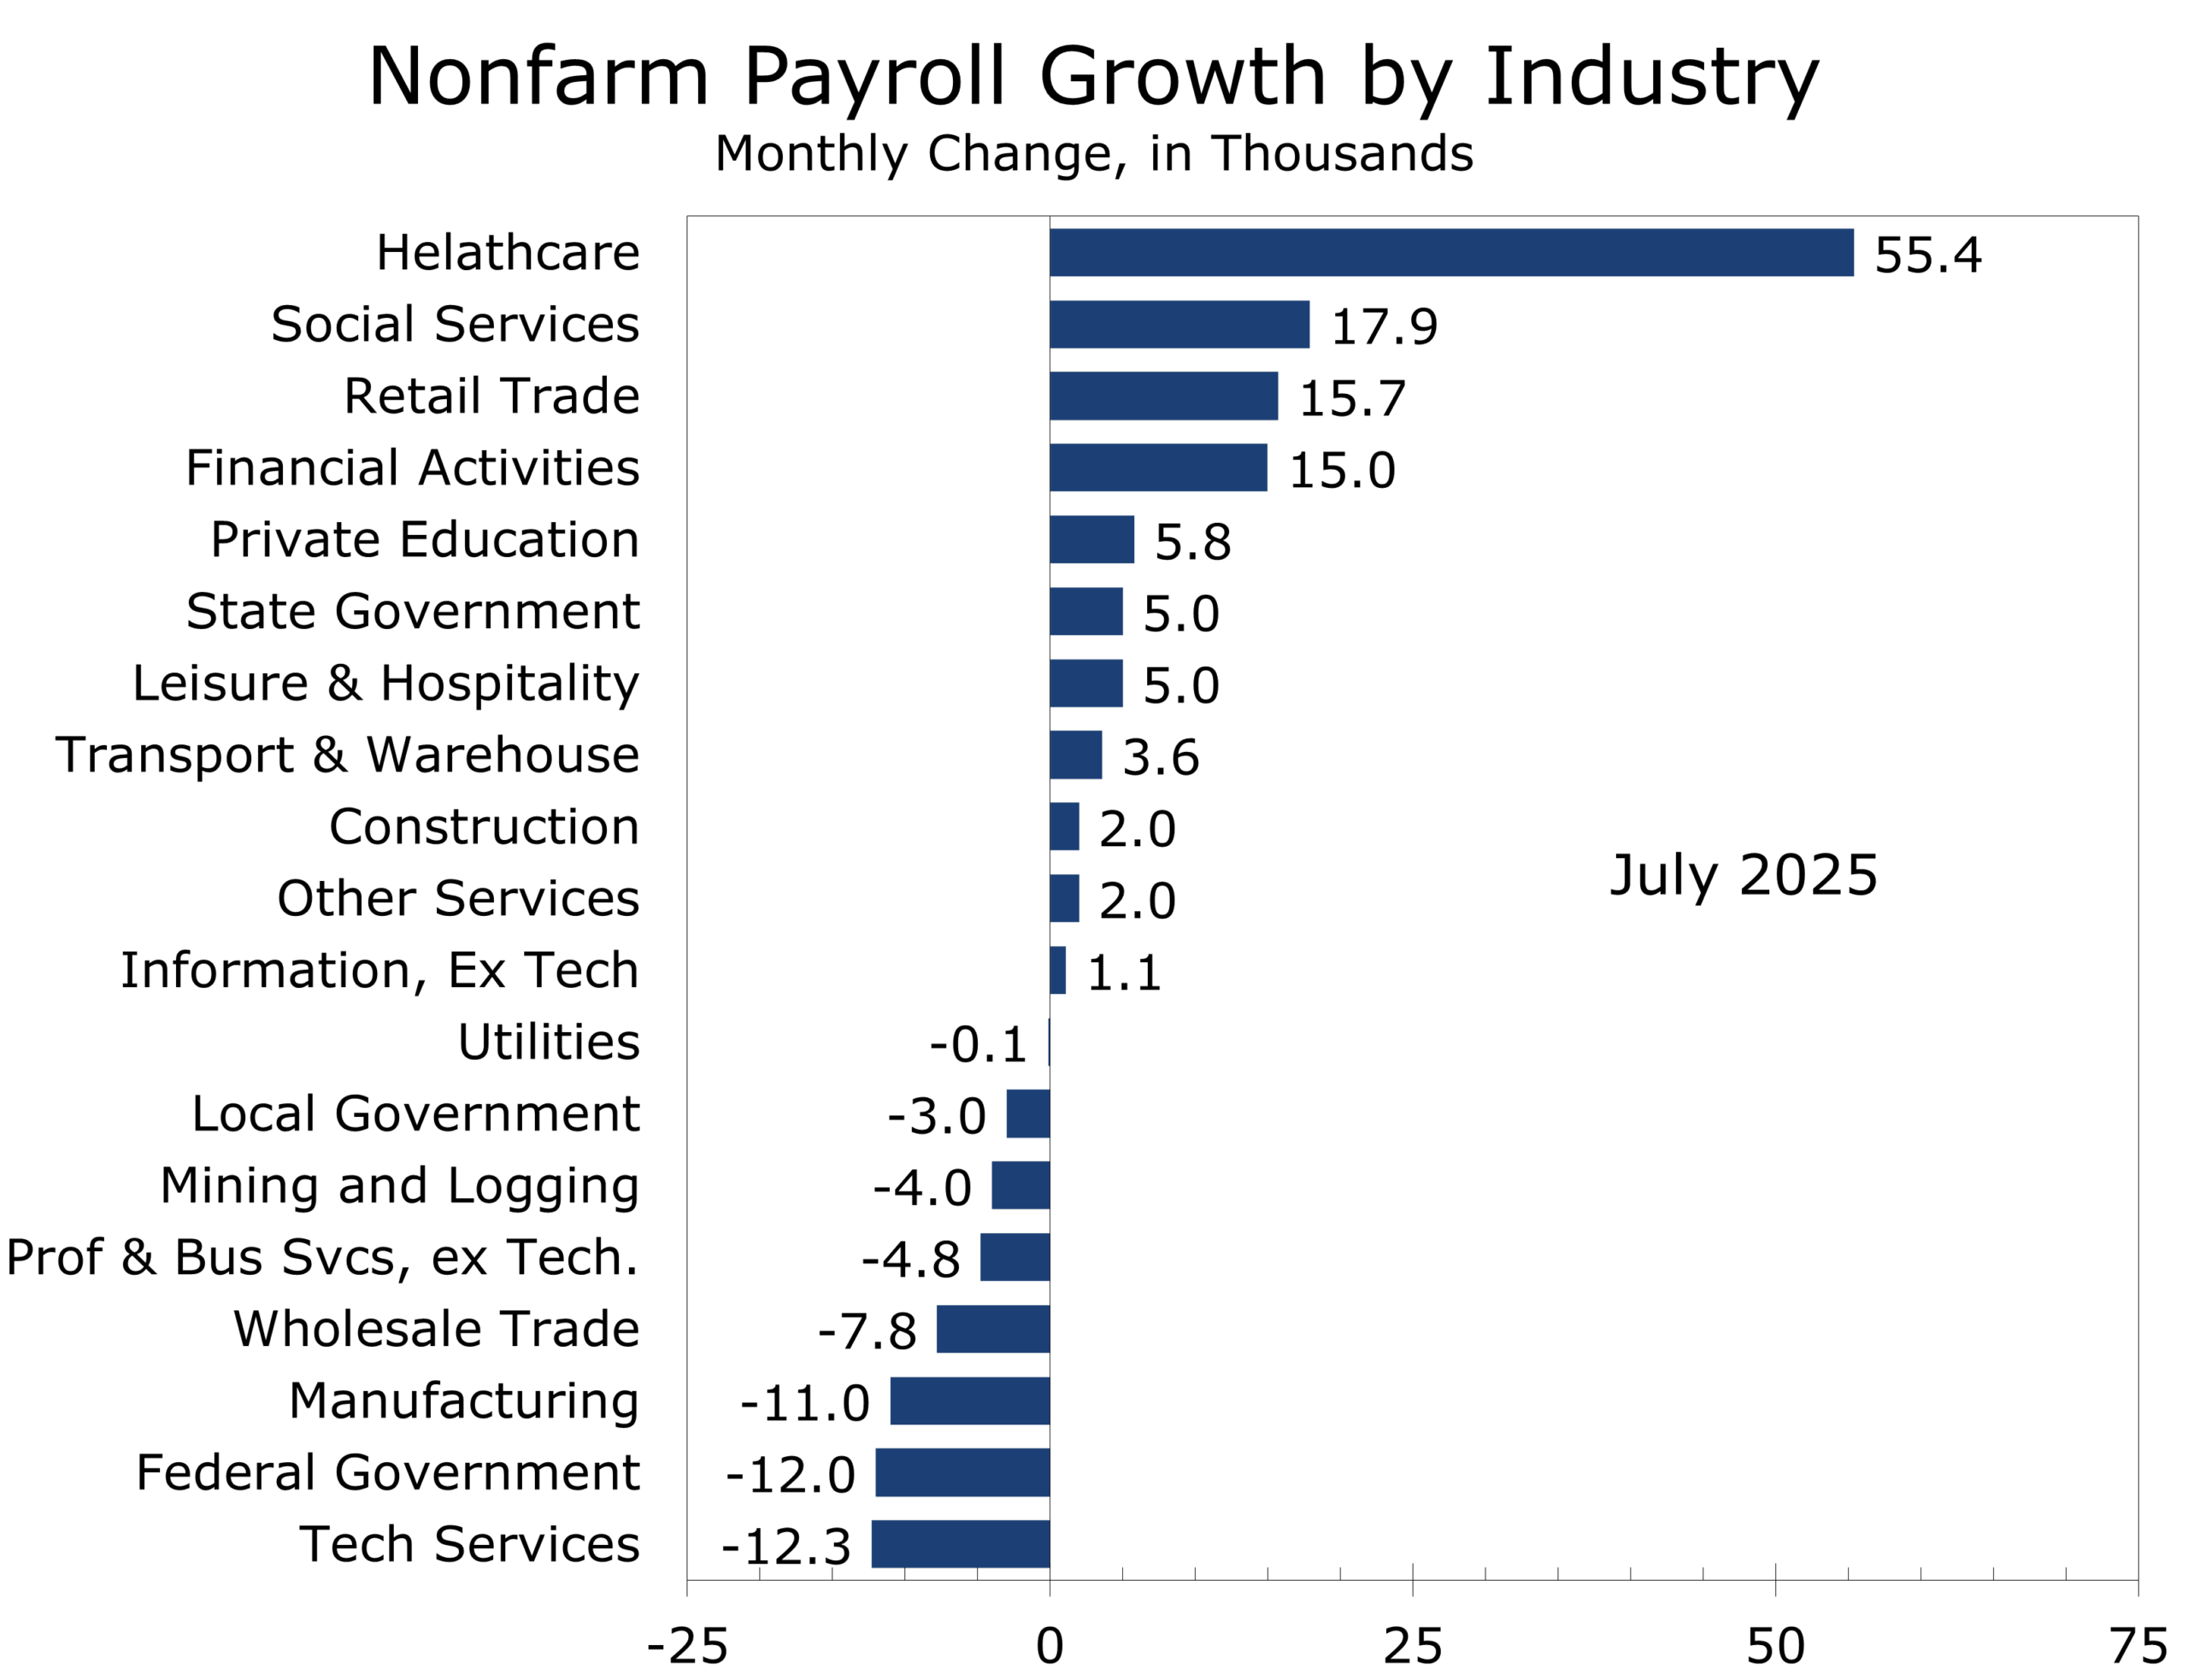
The unemployment rate rose to 4.2%, but the unrounded figure was 4.248%—the highest since November 2022. Labor force participation edged down to 61.7%, and the employment-to-population ratio slipped to 60.1%. Long-term unemployment rose to 1.8 million. The participation rate has fallen 0.5 percentage points over the past year, while the employment-population ratio has fallen 0.4 percentage points.
Structural shifts are becoming more apparent. A slowdown in immigration and an aging population have lowered the breakeven rate of job growth, making headline unemployment appear healthier than underlying conditions suggest. Broader measures of labor market health continue to deteriorate. Without the drop in labor force participation, much of which is tied to tighter immigration enforcement, the unemployment rate would easily top 4.5%
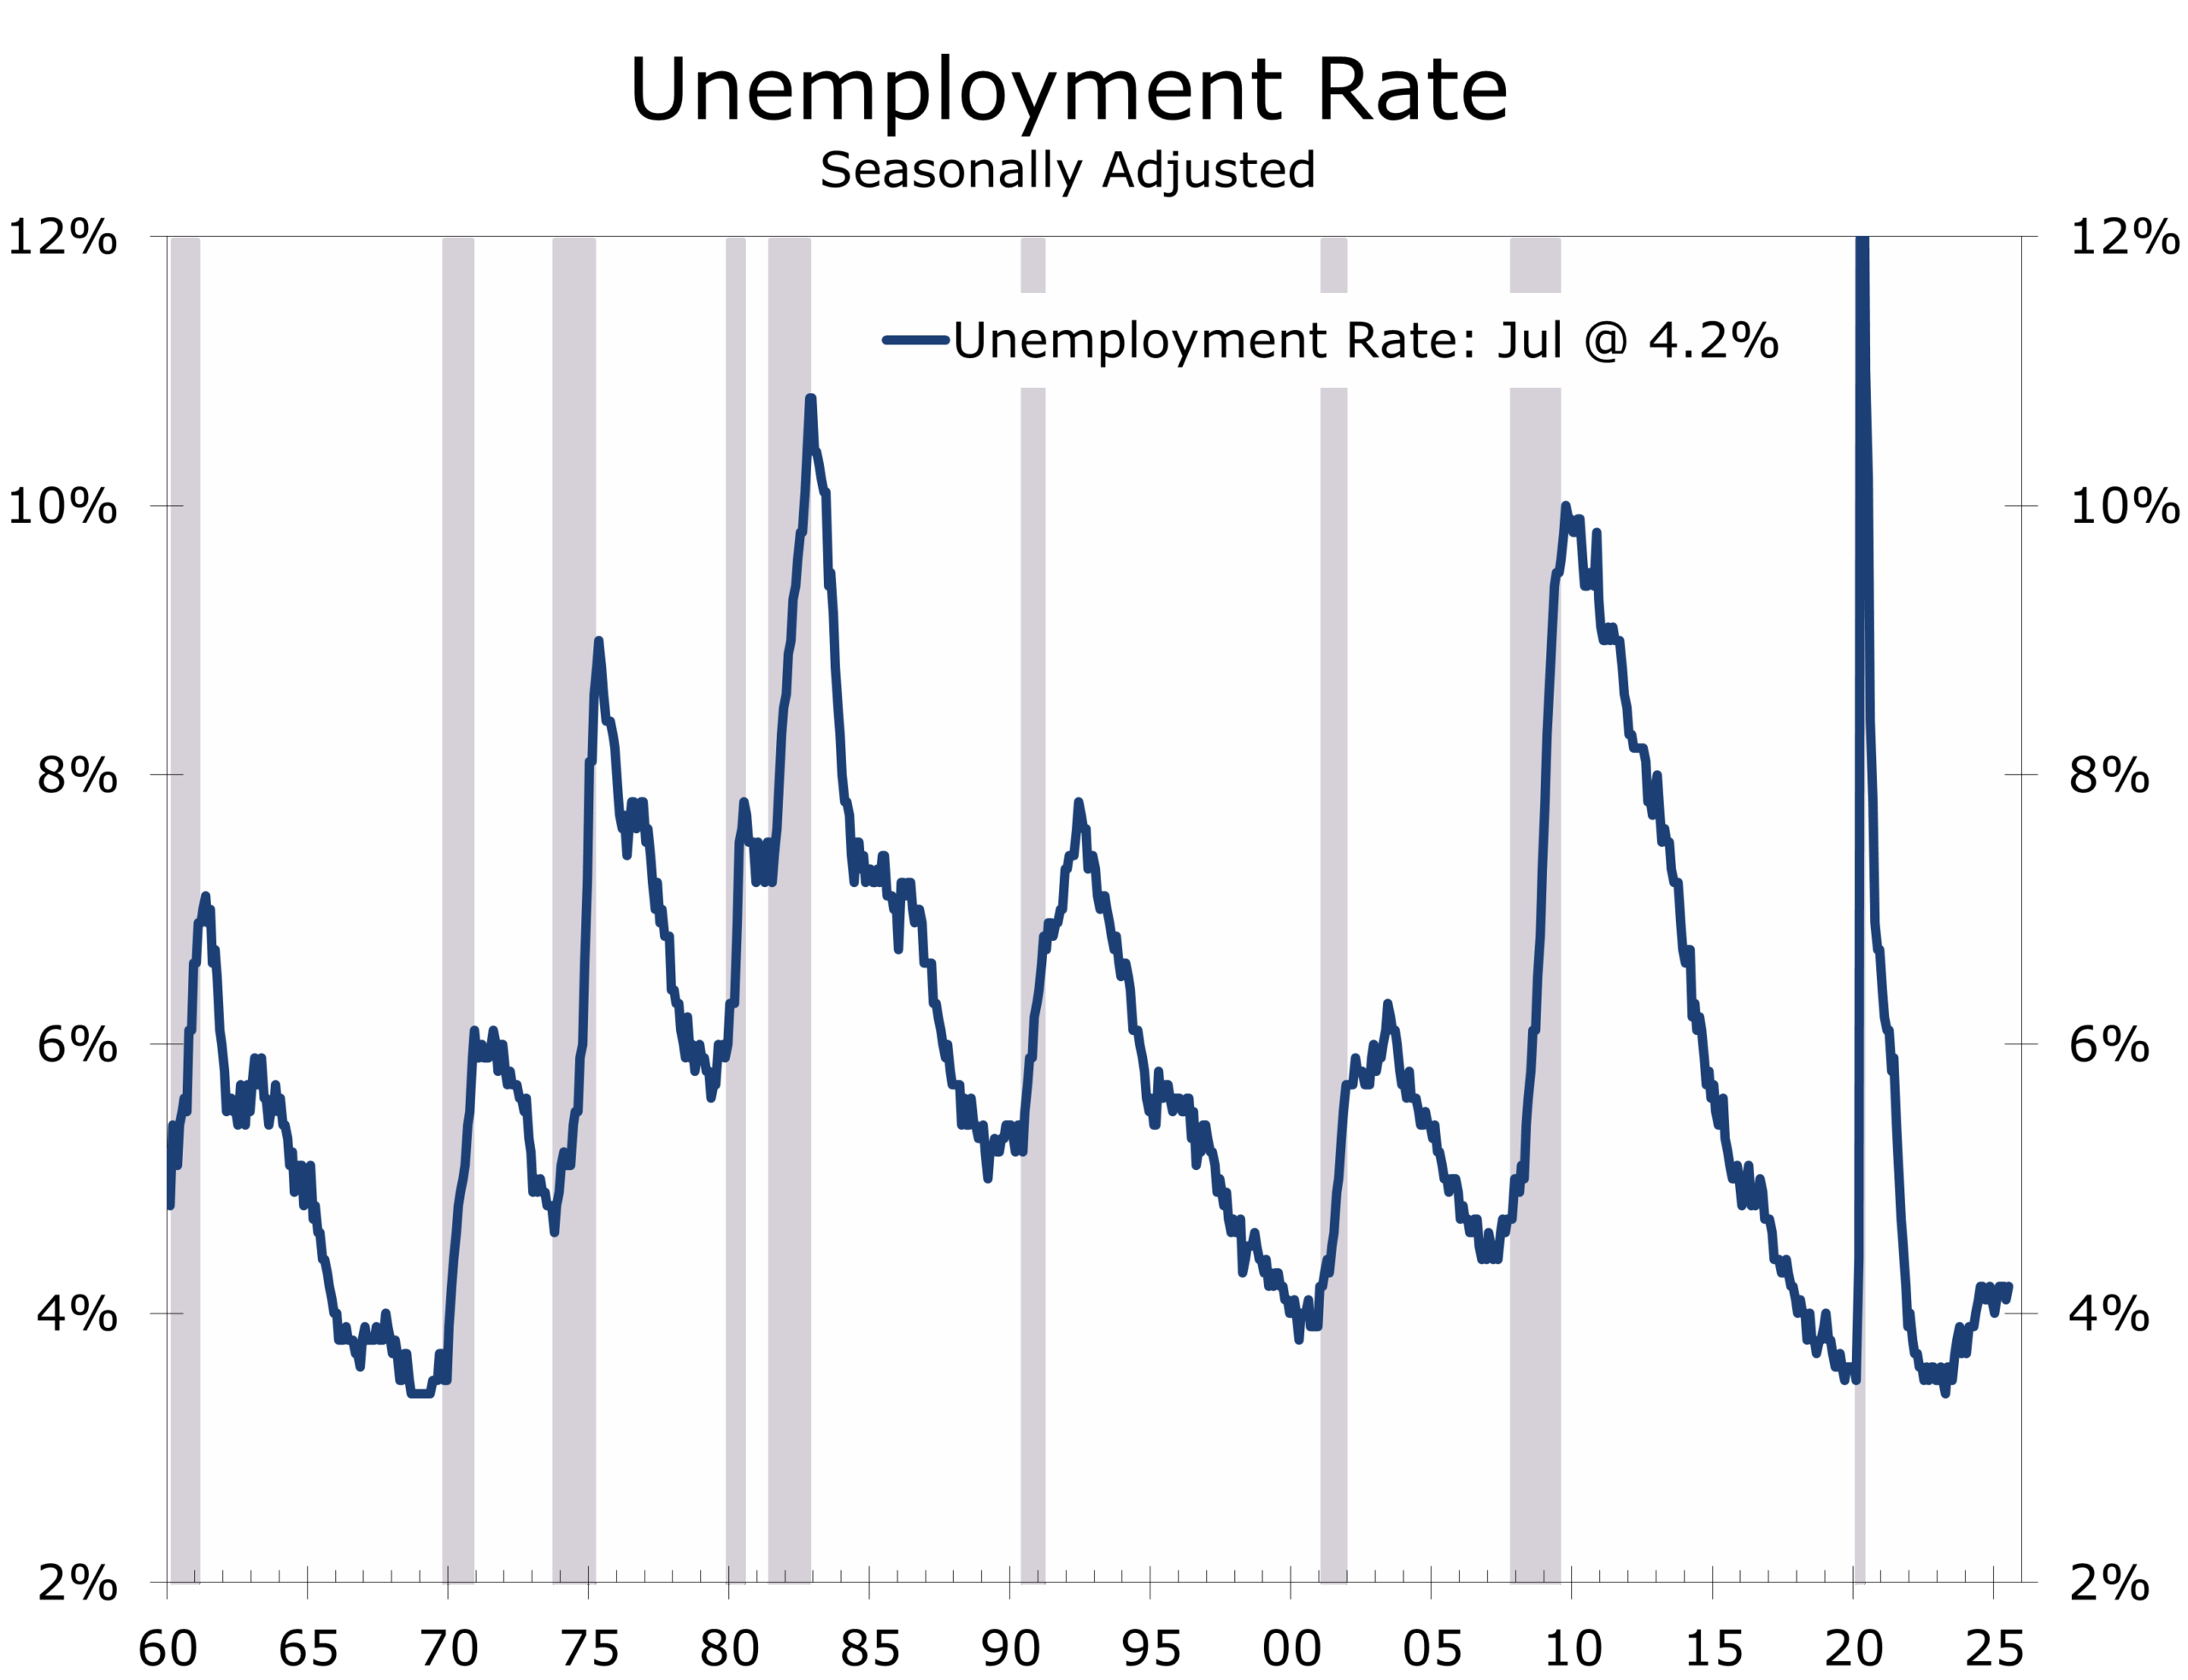
Tariffs in Effect: The Next Phase of Strategic Trade
President Trump’s reciprocal tariff order took effect on August 1, raising rates to 15% or more on imports from countries without new trade agreements. Some targeted nations—including Canada, Switzerland, Brazil, and Taiwan—face effective rates as high as 50% on select goods. Secondary sanctions on Russia could boost effective tariff rates even further, with India and China two of the most impacted nations
The move is part of a broader strategy to align trade with national security and industrial policy. Tariffs are now being paired with investment pledges in energy, logistics, and semiconductor supply chains. The average effective tariff rate has now likely risen above 15%, by far the highest in the modern era.
The inflation impact has so far been modest, with most firms absorbing costs through margin compression. But policy uncertainty is weighing on investment: core capital goods orders have now declined for three consecutive months, and ISM Manufacturing remains below 50. Retailers and manufacturers are adjusting inventories in anticipation of further disruption, and many firms have been waiting for tariffs to be finalized before deciding how much to pass on to consumers.
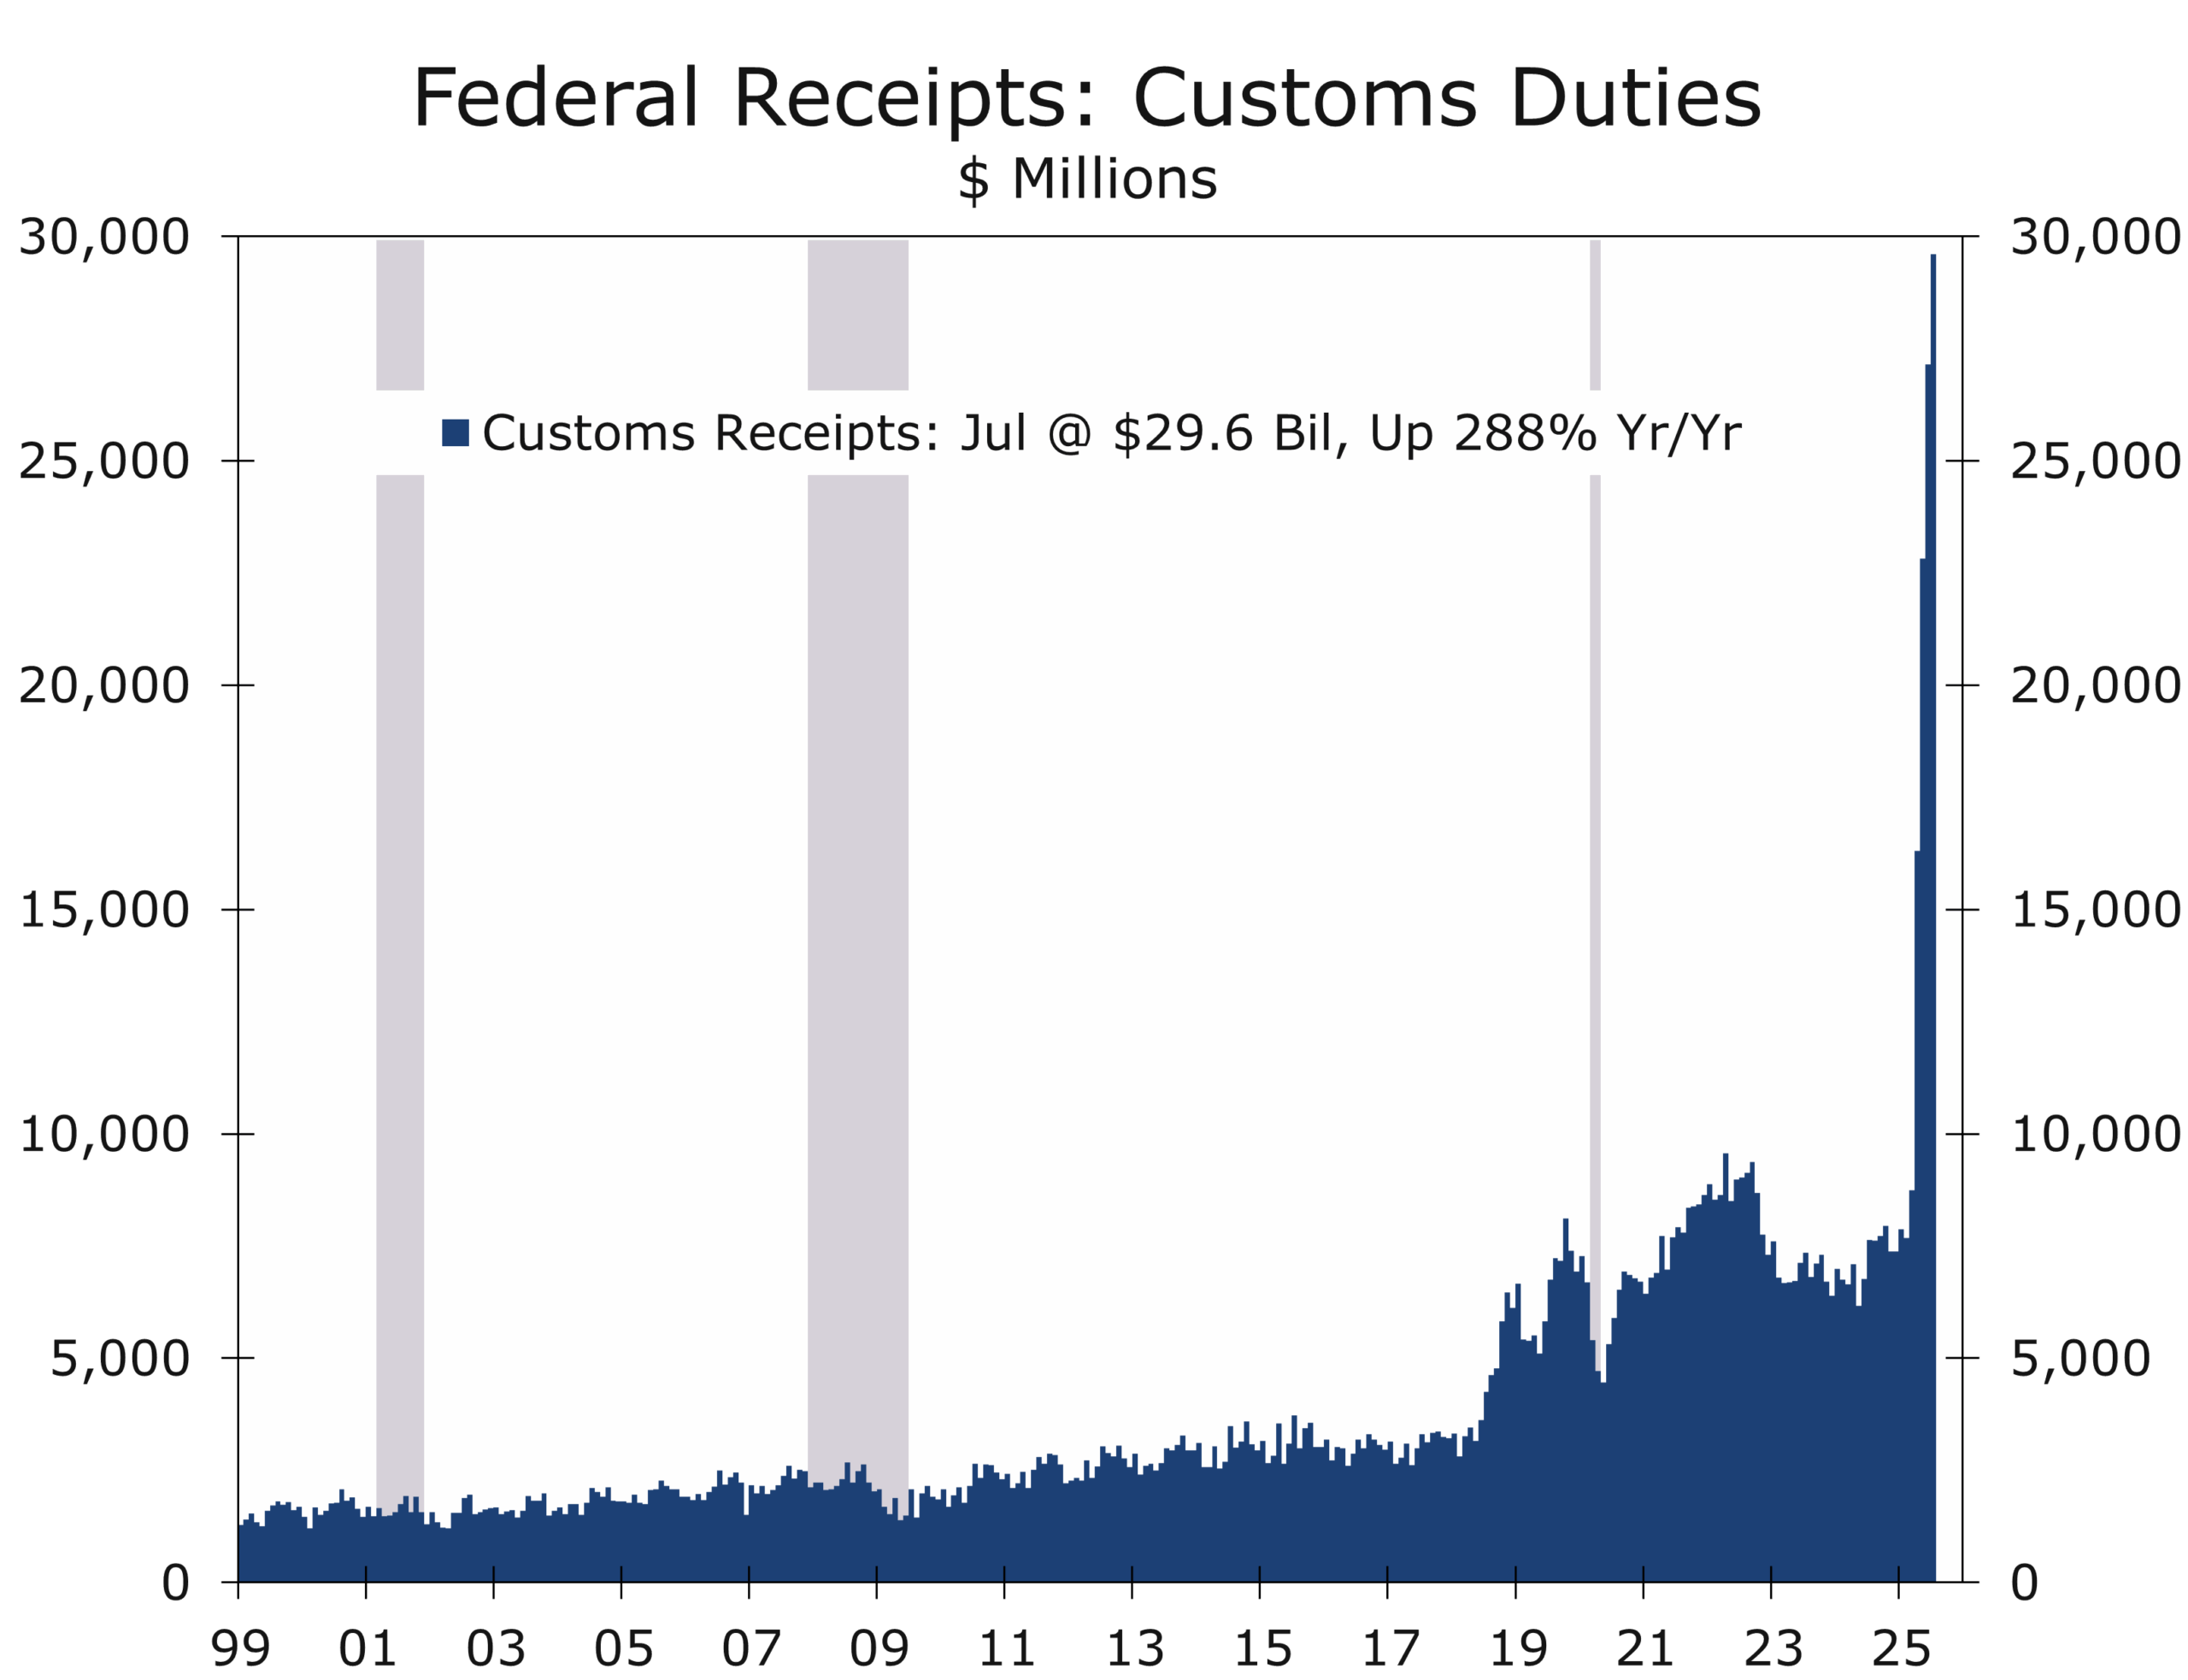
Geopolitics: Flashpoints and Fallout
Russia intensified its military operations in Ukraine last week, launching more than 300 drone and missile strikes—the most in a single week since May. Ukrainian infrastructure in Odesa and Kharkiv was heavily targeted, and Chasiv Yar, a key defensive position in Donetsk, appears to have fallen. Peace negotiations remain stalled. President Trump has moved up the deadline for Russia to respond to U.S.-led peace initiatives, warning that secondary sanctions will soon be imposed on nations that continue to trade with Russia, particularly in energy and dual-use technologies.
The move prompted a fierce response from Moscow. Russian Security Council Deputy Chair Dmitry Medvedev threatened that any escalation of Western involvement would trigger a reactivation of Russia’s “Dead Hand” nuclear response system—an automated retaliation protocol developed during the Cold War. Medvedev also warned that Moscow considers any economic siege an act of war, and state-controlled media began running simulations of nuclear attacks on European capitals. These provocations signal that the Kremlin is escalating not only militarily but also in the information and psychological warfare domains.
These threats suggest the Kremlin views the prospect of secondary sanctions as a serious escalation and threat—one that could strain Russia’s economic lifelines and test the cohesion of its leadership. Medvedev’s outburst may reflect growing internal anxiety over the potential for isolation from China, India and other critical trading partners. President Trump would like Indian refiners to stop purchasing Russian oil and commit to purchase more U.S. crude as part of a broader trade deal.
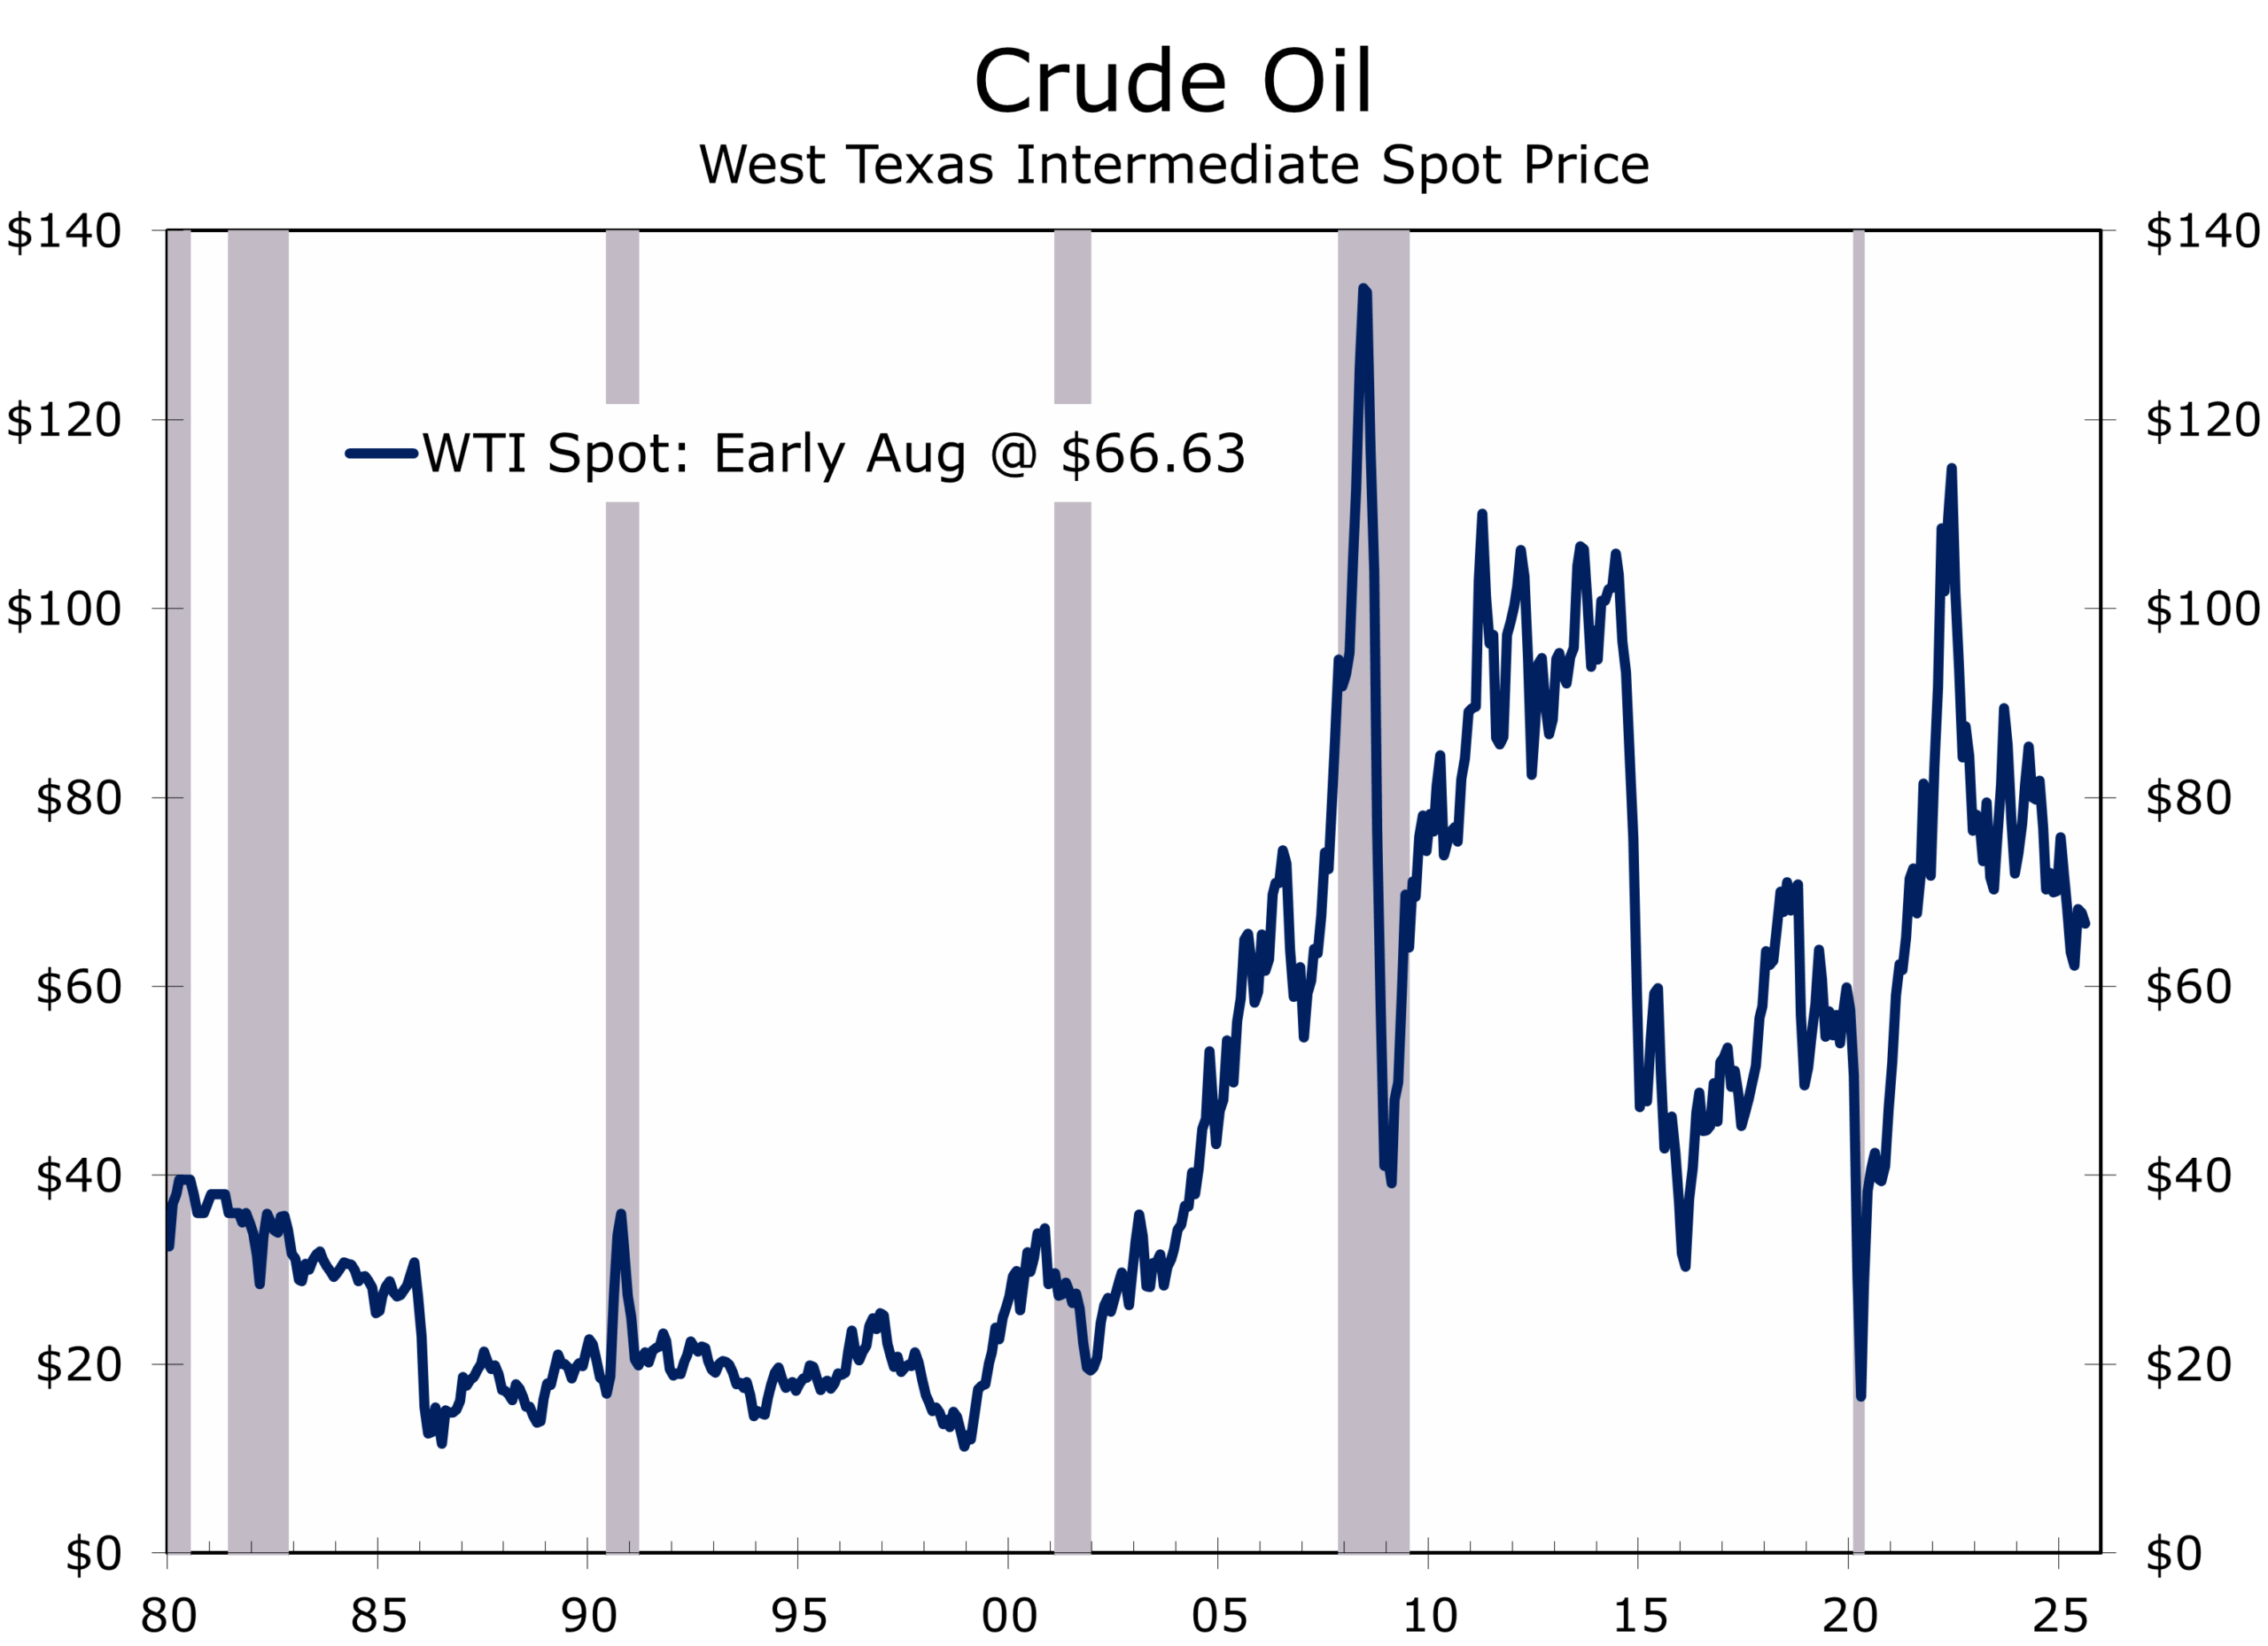
In the Middle East, Gaza’s deepening humanitarian crisis prompted Canada, the U.K., and France to announce plans to recognize Palestinian statehood at the upcoming U.N. General Assembly. The Trump administration responded swiftly, imposing new sanctions on Palestinian Authority officials and warning that such moves could jeopardize future trade cooperation, including under the USMCA framework. Secretary of State Marco Rubio criticized the recognitions as premature and even counterproductive, arguing they may embolden Hamas and undermine prospects for a lasting ceasefire.
The divergence between the U.S. and its allies reflects broader tensions over diplomatic strategy as well as greater tolerances for appeasement in Canada and western Europe. Critics of unilateral recognition argue that it offers symbolism without substance—particularly in the absence of a defined leadership structure or clear territorial boundaries. The Trump Administration continues to emphasize the potential of expanding the Abraham Accords framework as a more durable pathway toward Palestinian statehood and a broader, more equitable and enduring peace.
Markets and the Fed: September in Play
Markets are now pricing in a high probability of a 25bp rate cut at the September FOMC meeting, and potentially a half-point cut if labor market conditions deteriorate further. Two Fed governors dissented in favor of immediate easing at the July meeting—the most open policy division at the Board level in over three decades. Bond yields fell across the curve, and the dollar reversed its recent rally and edged lower. Equities sold off sharply on Friday, capping the worst week for stocks since the Liberation Day tariff announcement in early April.
The economy appears to be on the precipice of recession. Consumer spending has shown no net growth this year, after adjusting for inflation. Housing is in full retreat, with sales stumbling and new construction ramping down. Home prices are also weakening, which will undermine home improvement spending. Businesses are also holding off on capital spending, outside of AI and related power initiatives
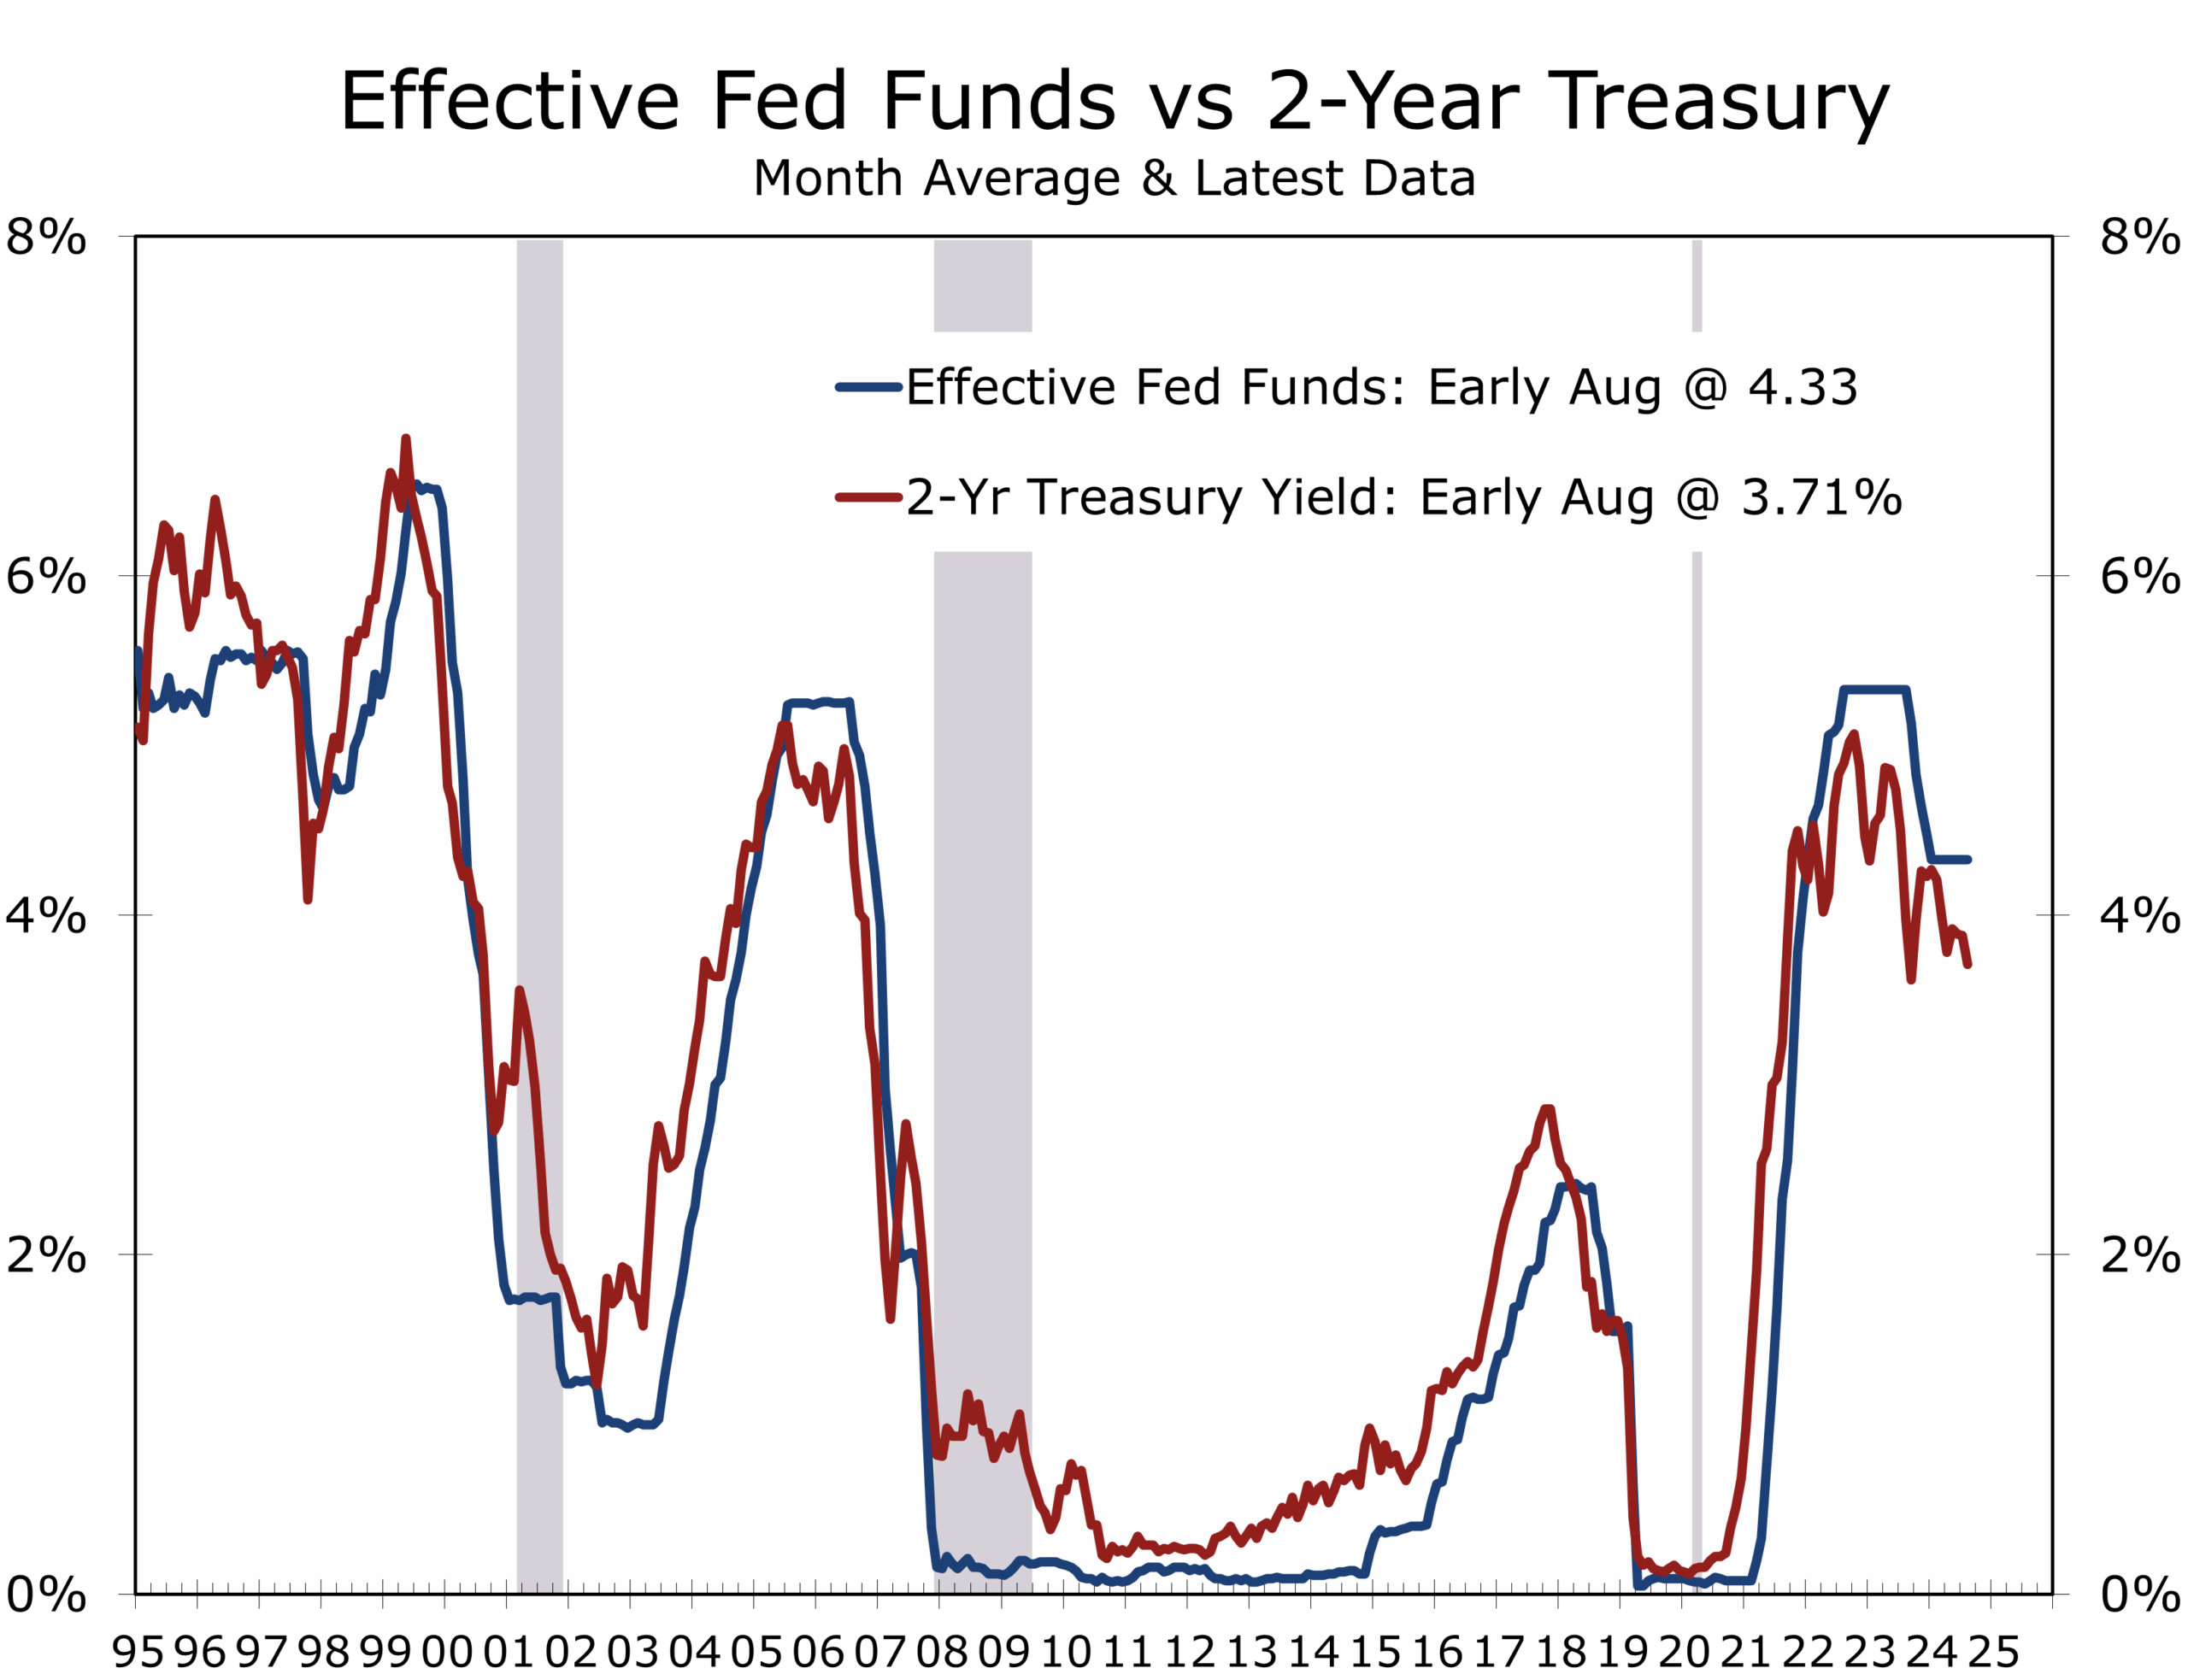
Earnings: AI Delivers a Tailwind
Amid macro uncertainty, Q2 earnings from Microsoft and Meta offered a rare bright spot. Microsoft’s revenue rose 18% to $76.4 billion, driven by continued strength in cloud and AI services. Meta’s revenue jumped 22% to $47.5 billion, fueled by strong demand for AI-powered advertising tools.
Both companies raised capital spending guidance and emphasized productivity gains. Meta now reports that over 2 million advertisers are using its AI-generated ad content platform. These results reinforce the view that the AI investment cycle is maturing—providing near-term earnings support and long-term productivity gains.
The performance of these mega-cap firms has helped buoy equity sentiment even as broader growth softens. Investor appetite for firms with pricing power, capex discipline, and exposure to AI remains strong. There is a downside, however, as AI is increasingly displacing workers, both through layoffs and reduced hiring.
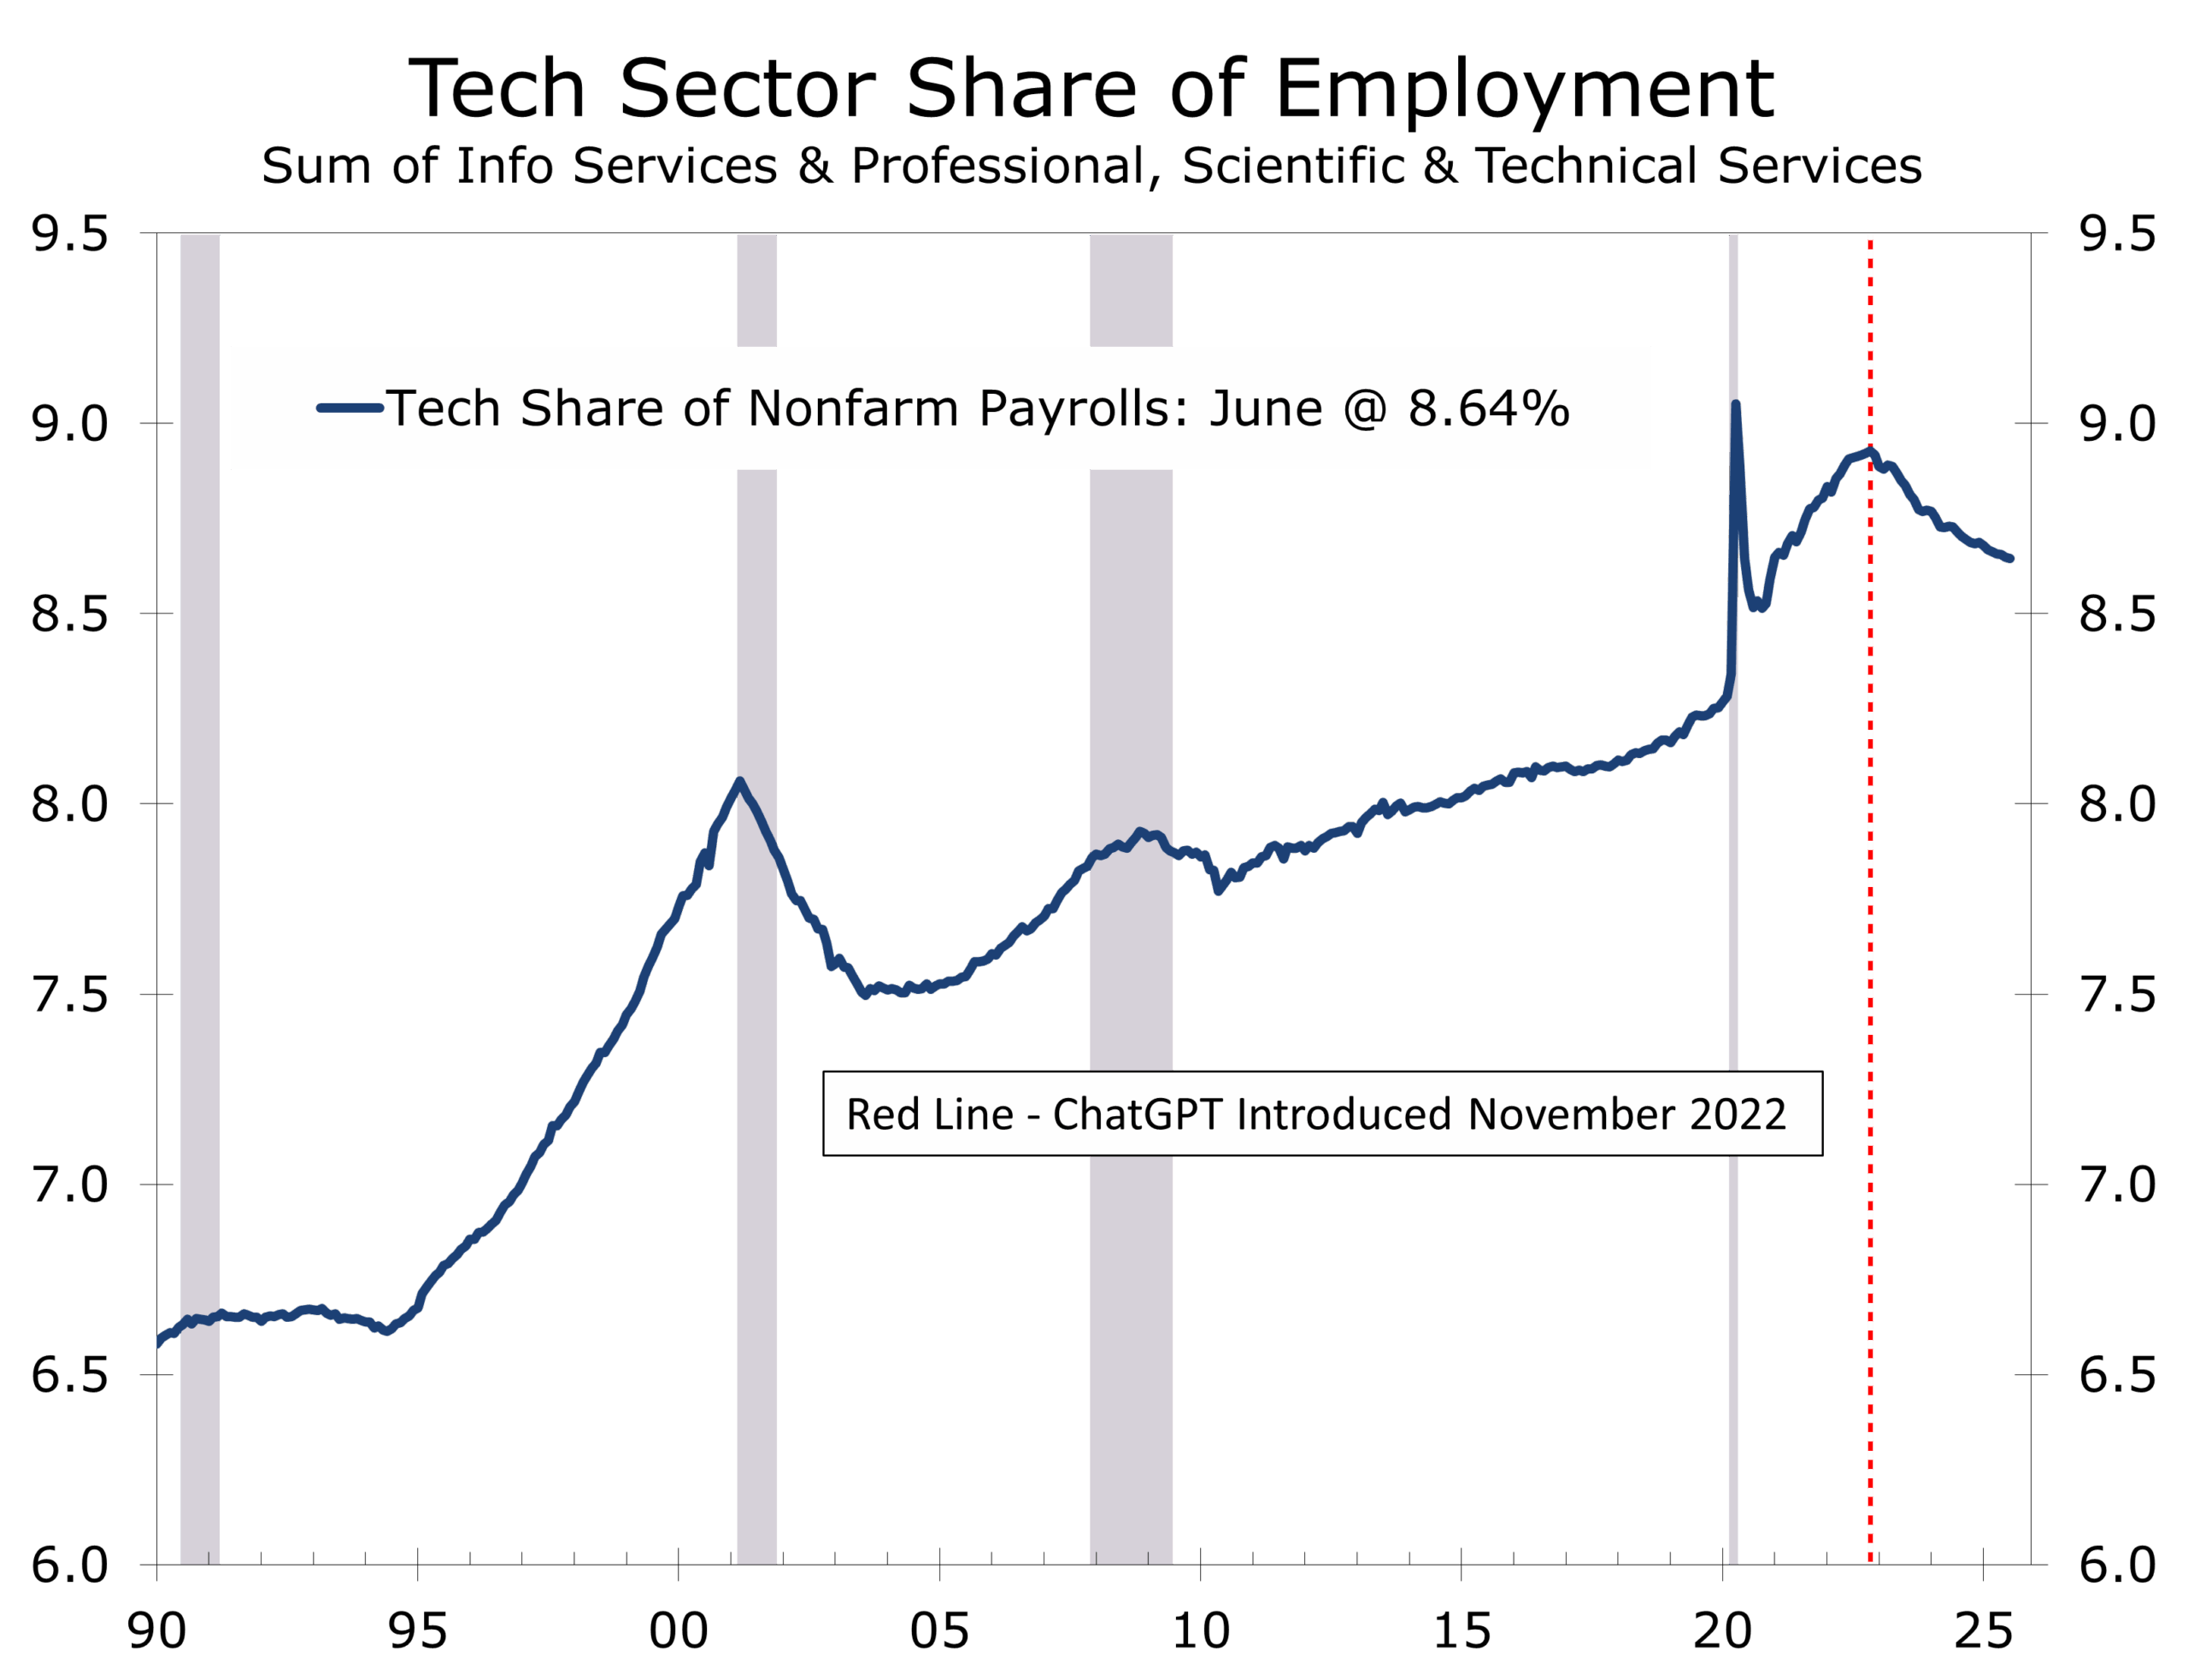
Looking Ahead: August Signals, September Setup
The back nine is proving to be as difficult as we feared. Labor market momentum has faded, real consumption is stalled, and tariff-related uncertainty continues to cloud the outlook. While the Fed retains room to ease, inflation data are likely to remain mixed. This week’s calendar is relatively light but still should provide a few key signals. The ISM Services Index will shed light on underlying demand and pricing power, both of which appear to be softening. Productivity and unit labor cost data may prove the most consequential—any improvement there would strengthen the case for near-term policy easing. Inflation expectations from the New York Fed and the preliminary University of Michigan sentiment survey also warrant close attention.
This Week’s Key Reports
Monday, August 4
• Factory Orders (June) – Expected to be soft due to volatility in commercial aircraft orders, which surged in May. Broader business investment remains cautious amid tariff uncertainty and unclear rate trajectory.
Tuesday, August 5
• ISM Services Index (July) – Forecast to rebound to 51.7. Watch for signals on service-sector demand and pricing pressure.
Wednesday, August 6
• Fed Speakers – Governor Lisa Cook and Boston Fed President Susan Collins will participate in a livestreamed panel discussion at 2:00 p.m. titled “A Central Bank Perspective on the Evolving Global Landscape.”
Thursday, August 7
• Q2 Productivity & Unit Labor Costs – A key read on whether the economy can sustain growth amid structural labor constraints driven by tighter immigration enforcement and accelerating AI adoption.
• Initial Jobless Claims – Seasonal adjustments may inflate the headline figure; continuing claims are expected to continue their gradual upward trend.
• New York Fed Consumer Expectations Survey – Closely watched for near-term inflation expectations, which several Fed officials have highlighted recently.
• Fed Speaker – Atlanta Fed President Raphael Bostic to deliver remarks.
• Consumer Credit (June) – Credit growth may slow as consumers grow more cautious about employment stability and future income.
Friday, August 8
• University of Michigan Sentiment (Prelim August) – Inflation expectations remain the key metric, particularly after their early-year spike and subsequent decline.
Final Points
The U.S. economy is not in crisis, but it is clearly losing altitude. Slower hiring, stagnant consumption, a weakening housing market, and rising trade friction are straining the expansion’s resilience. If policymakers misjudge the risks—or wait too long to cut rates—the glide path could steepen quickly. A September rate cut now appears likely, but the timing and tone of the Fed’s messaging will shape whether markets interpret it as a much-needed precautionary adjustment, a political capitulation, or a belated rescue move.
A precautionary adjustment is the outcome policymakers are aiming for. If executed successfully, it could bring down long-term interest rates and mortgage costs—relieving pressure in the housing market and reducing refinancing risk across the broader economy.
A Gun and a Grievance
On July 28, 2025, a mass shooting at 345 Park Avenue in Midtown Manhattan claimed four lives—including an off-duty NYPD officer and a Blackstone executive—and left another victim critically injured. The gunman, 32-year-old Shane Devon Tamura, a former Las Vegas casino worker, opened fire inside the building—home to the NFL’s headquarters—before taking his own life.
Tamura left behind a note blaming the NFL for his alleged chronic traumatic encephalopathy (CTE), a degenerative brain disease he attributed to playing high school football. Fueled by resentment and unmet medical needs, he drove cross-country to confront league officials. After mistakenly arriving on the wrong floor, he opened fire indiscriminately—turning a personal grievance into public tragedy.
The attack echoed the December 2024 assassination of UnitedHealthcare CEO Brian Thompson, who was gunned down on a Midtown sidewalk by Luigi Mangione—a man with no personal connection to Thompson or the company, but who viewed the insurance industry as emblematic of a system that had failed him. Both incidents reflect a disturbing trend: individuals channeling institutional resentment into targeted violence.
Though their motivations differed, both attackers believed the system had wronged them—and that violent retribution was justified. That segments of social media applauded their actions—celebrating Mangione’s murder and framing Tamura’s attack as a social protest—raises troubling questions about the normalization of vigilante justice.
These events carry serious economic consequences. After Thompson’s assassination, major insurers removed executive profiles from their websites and quietly upgraded security protocols. Following Tamura’s attack, the NFL and other tenants at 345 Park Avenue tightened access restrictions, while corporate security firms reported a surge in demand. Investor confidence, executive mobility, and board-level recruitment may all suffer if cities like New York are perceived as unsafe for business leadership.
At the foundation of functional capitalism lies the rule of law. Executives must be able to lead without fear of arbitrary violence. Markets thrive when disputes are resolved through legal channels—not through bloodshed or intimidation. When violence becomes an accepted or romanticized outlet for grievance, the cost of doing business rises and capital flows elsewhere.
The path forward requires a coordinated response: expanded mental health care, greater institutional accountability, enhanced urban security, and a firm recommitment to zero tolerance for violence—including on social media, university campuses, and within political discourse. However legitimate a grievance may be, redress must remain within the bounds of law.
The Midtown shooting is a grim reminder that public safety is not merely a civic issue—it is a moral and economic imperative. The protection of human life must remain the first responsibility of a functioning society, and the preservation of safe, open, and orderly environments is essential for commerce to thrive. In cities like New York, where trillions in capital flow each year and millions live, work, and lead, law and order is not a luxury—it is the foundation upon which both lives and livelihoods depend.
Disclaimer: This publication has been prepared for informational purposes only and is not intended as a recommendation offer or solicitation with respect to the purchase or sale of any security or other financial product nor does it constitute investment advice.
August 4, 2025
Mark Vitner, Chief Economist
mark.vitner@piedmontcrescentcapital.com
(704) 458-4000