
The Piedmont Perspective – Echoes of Jimmy Carter: Credit Controls Revisited
Disclaimer: This publication has been prepared for informational purposes only and is not intended as a recommendation offer or solicitation with respect to the purchase or sale of any security or other financial product nor does it constitute investment advice.
January 20, 2026
Mark Vitner, Chief Economist
Piedmont Crescent Capital

December 2025 Consumer Price Index: Shelter Reaccelerates Modestly, Food Pressures Resurface, Core Inflation Holds Near Target
Inflation Continues to Ease Back to Historic Norms
-
- Headline CPI rose 0.3% in December, while year-over-year inflation held steady at 2.7%, reinforcing evidence that inflation has likely peaked for this cycle.
- Core CPI increased 0.2%, leaving core inflation unchanged at 2.6% y/y, slightly softer than expected once shutdown-related distortions are accounted for.
- Shelter prices rose 0.4%, the largest contributor to the monthly increase, though part of the recent volatility reflects data distortions tied to the federal shutdown rather than a change in trend.
- Food prices surprised to the upside, rising 0.7% on the month, with both grocery and restaurant prices contributing.
- Energy prices increased modestly, driven by natural gas, as unseasonably cold weather offset falling gasoline prices.
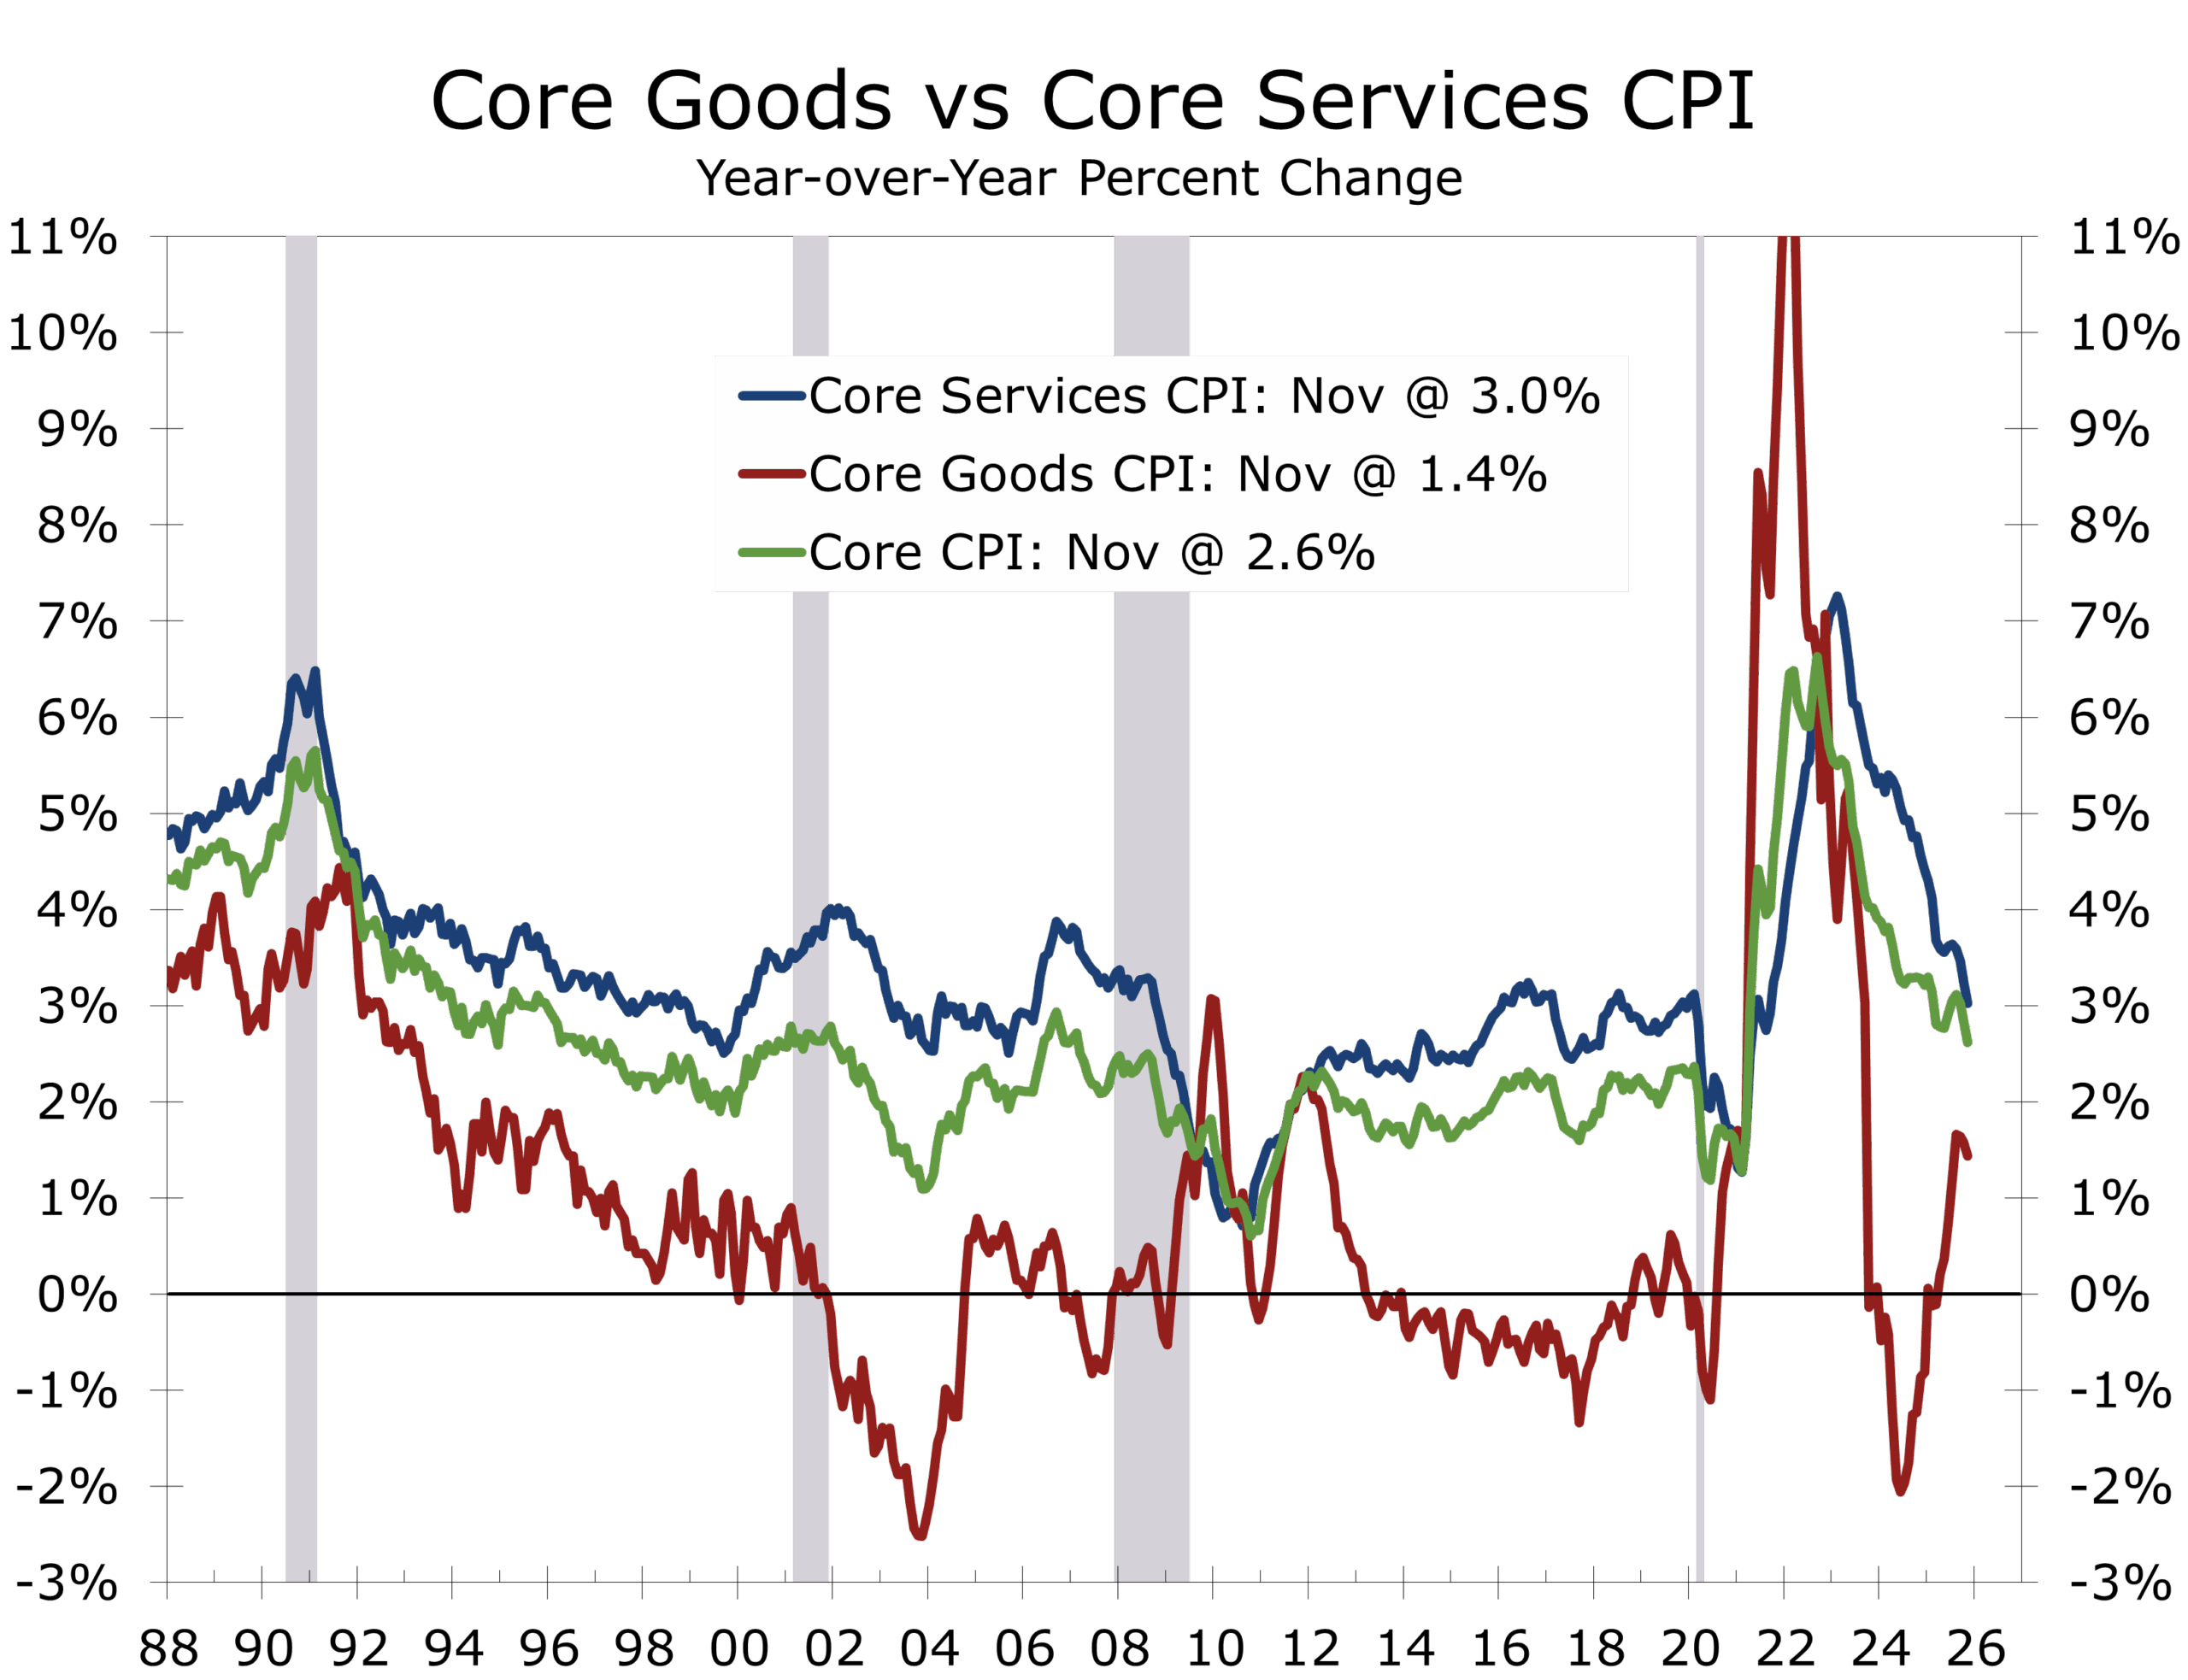
- Core goods inflation appears to have peaked, while services inflation outside of shelter continues to trend lower, supported by improving productivity and easing unit labor costs.
Headline Inflation: A Firm Finish to the Year
Consumer prices rose 0.3% in December, a step up from November, driven primarily by shelter and food. On a year-over-year basis, headline inflation held at 2.7%, confirming that inflation has stabilized at a lower level even as month-to-month readings remain uneven.
December’s report was noisier than usual due to the federal shutdown, which compressed data collection and distorted comparisons with prior months. November prices were collected only for late in the month, exaggerating some December increases, particularly in seasonal and holiday-sensitive categories. Even so, stepping back from the volatility, the broader signal suggests inflation continues to decelerate, and the bulk of the impact from tariffs is now behind us.
Inflation continues to decelerate and is now roughly even with its long-run trend.
Energy prices added modestly to the headline, while food prices delivered an outsized monthly gain. The combination pushed the CPI headline higher even as underlying inflation trends remained broadly consistent with the Fed’s target range.

Core Inflation: Stable, but Not Yet Settled
Core CPI rose 0.2% in December, matching recent monthly averages and keeping core inflation at 2.6% year over year. The rise in the core CPI was slightly softer than expected once shutdown distortions are considered, reinforcing the view that underlying inflation pressures are easing.
Tariffs are most evident in core goods inflation, which now appears to have peaked.
Core goods prices declined again, led by sharp drops in used cars and trucks (-1.1%), communications (-1.9%), and household furnishings (-0.5%). Broader core goods inflation now appears to have peaked, reflecting slower tariff pass-through, easing supply-chain pressures, and growing efforts by the Administration to reduce the sting of tariffs.
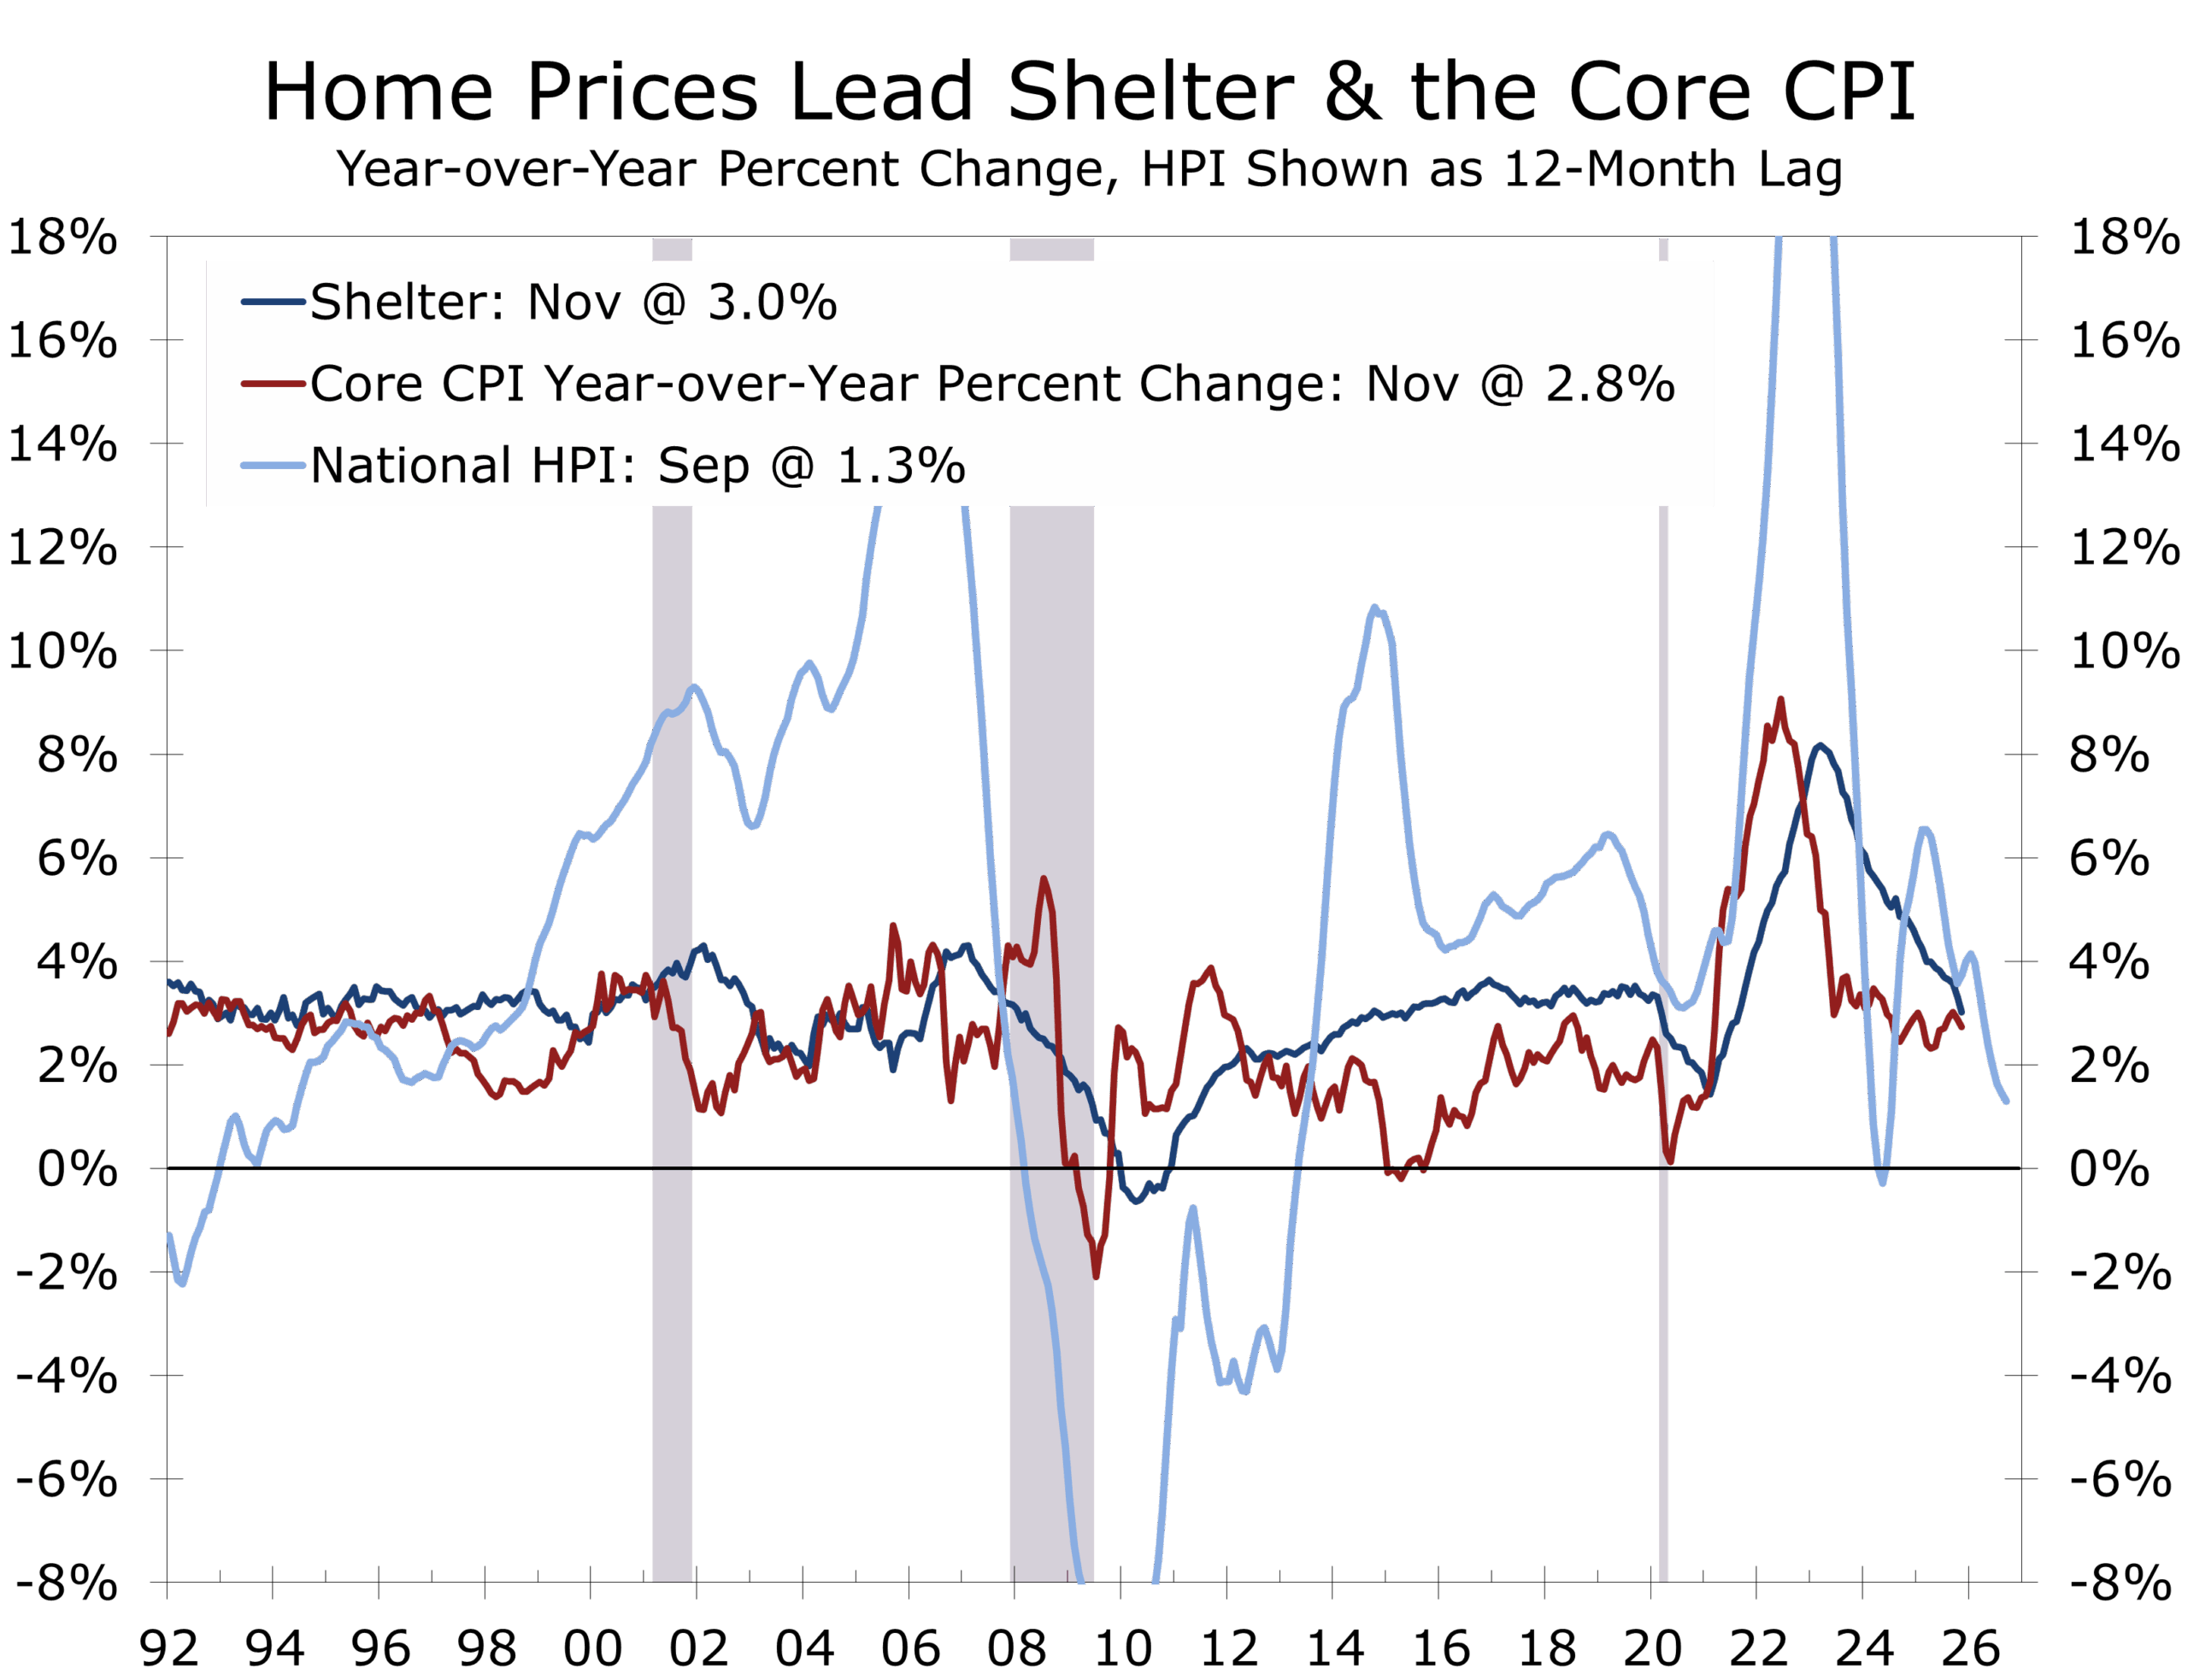
Shelter prices rose 0.4% in December, firmer than in recent months, with both rent and owners’ equivalent rent up 0.3%. The headline was rose more than its two largest components because hotel and other lodging costs surged 3.5%. The spike likely reflects the later survey period, which picked up more holiday season demand. Year-over-year shelter inflation now stands at 3.2%, well below cycle highs but still elevated relative to pre-pandemic norms.
Market-based rent indicators continue to point toward further moderation in 2026 as elevated multifamily supply works through the system. Moreover, home prices, which have reliably provided a leading signal for shelter costs 12 to 18 months ahead, continue to ease.
Shelter costs continue to follow home prices lower and will likely bring the core CPI back to the Fed’s target by year-end.
The message is clear; core inflation is headed lower this year and will likely finish 2026 close to the Fed’s 2% target.

Food prices rose 0.7% in December, marking one of the strongest monthly gains of the year. Grocery prices increased broadly, while restaurant prices continued to reflect elevated labor and operating costs.
Food away from home inflation remains particularly sticky at 4.1% y/y, reinforcing why many consumers remain skeptical of improving inflation data despite easing headline measures. The jump in food and energy prices are the least encouraging elements of the report. We suspect that the later than usual timing of the survey meant that the survey picked up much more of holiday season price hikes. We are looking from more modest gains in grocery prices in 2026.
Higher restaurant prices are likely to weigh on office workers as the return-to-office trend solidifies, with higher beef prices remaining a key upside risk. Restaurants have little room to cut prices, as labor costs are rising along with the minimum wage.

Energy: Volatile but Contained
Energy prices rose 0.3% in December, driven by a sharp increase in natural gas prices amid colder weather, while gasoline prices declined. Over the past year, gasoline prices are down 3.4%.
While falling global oil prices are easing gasoline costs, rising electricity demand, including from data centers, is limiting the pace of disinflation in utilities. Even so, energy continues to behave as a swing factor rather than a structural inflation driver.
We are looking for energy costs to moderate this year, as natural gas prices fall back and restrain electricity prices. The Trump Administration is also likely to lean on utilities this year to avoid passing on the costs of ramping up capacity to serve data center. Finally, the move against Venezuela’s ghost fleet of supertankers will keep oil prices lower.
Services inflation firmed in December, with notable increases in recreation (+1.2%), airline fares (+5.2%), and lodging away from home (+2.9%). These categories remain closely tied to upper-income demand and labor intensity. This past month’s hikes, however, were largely overstated, as the survey took place later than usual and was impacted by holiday season travel.
Goods prices, by contrast, continue to ease, reversing last year’s tariff-driven run-up. Improving productivity growth is helping to slow unit labor costs, which should support further moderation in services inflation outside of shelter in 2026.
Inflation pressure is becoming more concentrated, not widespread.
December’s CPI reinforces a clear shift in the Fed’s reaction function. Both the headline and core CPI have returned to their long-run average of 2.7% and 2.6%, respectively, easing the central bank’s policy dilemma. Inflation is no longer the dominant risk, though residual seasonality and shutdown distortions will complicate interpretation in coming months.
The federal funds rate remains modestly restrictive, and rate cuts are best viewed as insurance rather than stimulus. With inflation fears fading, the Fed has greater flexibility to respond to downside risks in the labor market should conditions weaken.
The inflation data argues for patience rather than urgency. President Trump has gotten the affordability memo and is also likely to use his bully pulpit to pressure firms to restrain price increases, an approach that should prove marginally effective at the margin. With price pressures already easing, we expect both headline and core inflation measures to be near the Federal Reserve’s target by year-end.
December closes the year with inflation lower than a year ago, but still uneven across categories. Shelter is cooling gradually, goods prices are deflating, and services inflation remains the final hurdle. Strip away shutdown distortions, and the evidence increasingly suggests inflation has peaked and is on a slow glide path lower into 2026. Disinflation is intact, but the last mile will remain uneven and politically sensitive as the new year begins.
Disclaimer: This publication has been prepared for informational purposes only and is not intended as a recommendation offer or solicitation with respect to the purchase or sale of any security or other financial product nor does it constitute investment advice.
January 13, 2026
Mark Vitner, Chief Economist
(704) 458-4000
The Piedmont Perspective – Institutional Home Buying: Populism Meets the Balance Sheet
Housing politics in a supply-constrained economy
Executive takeaway
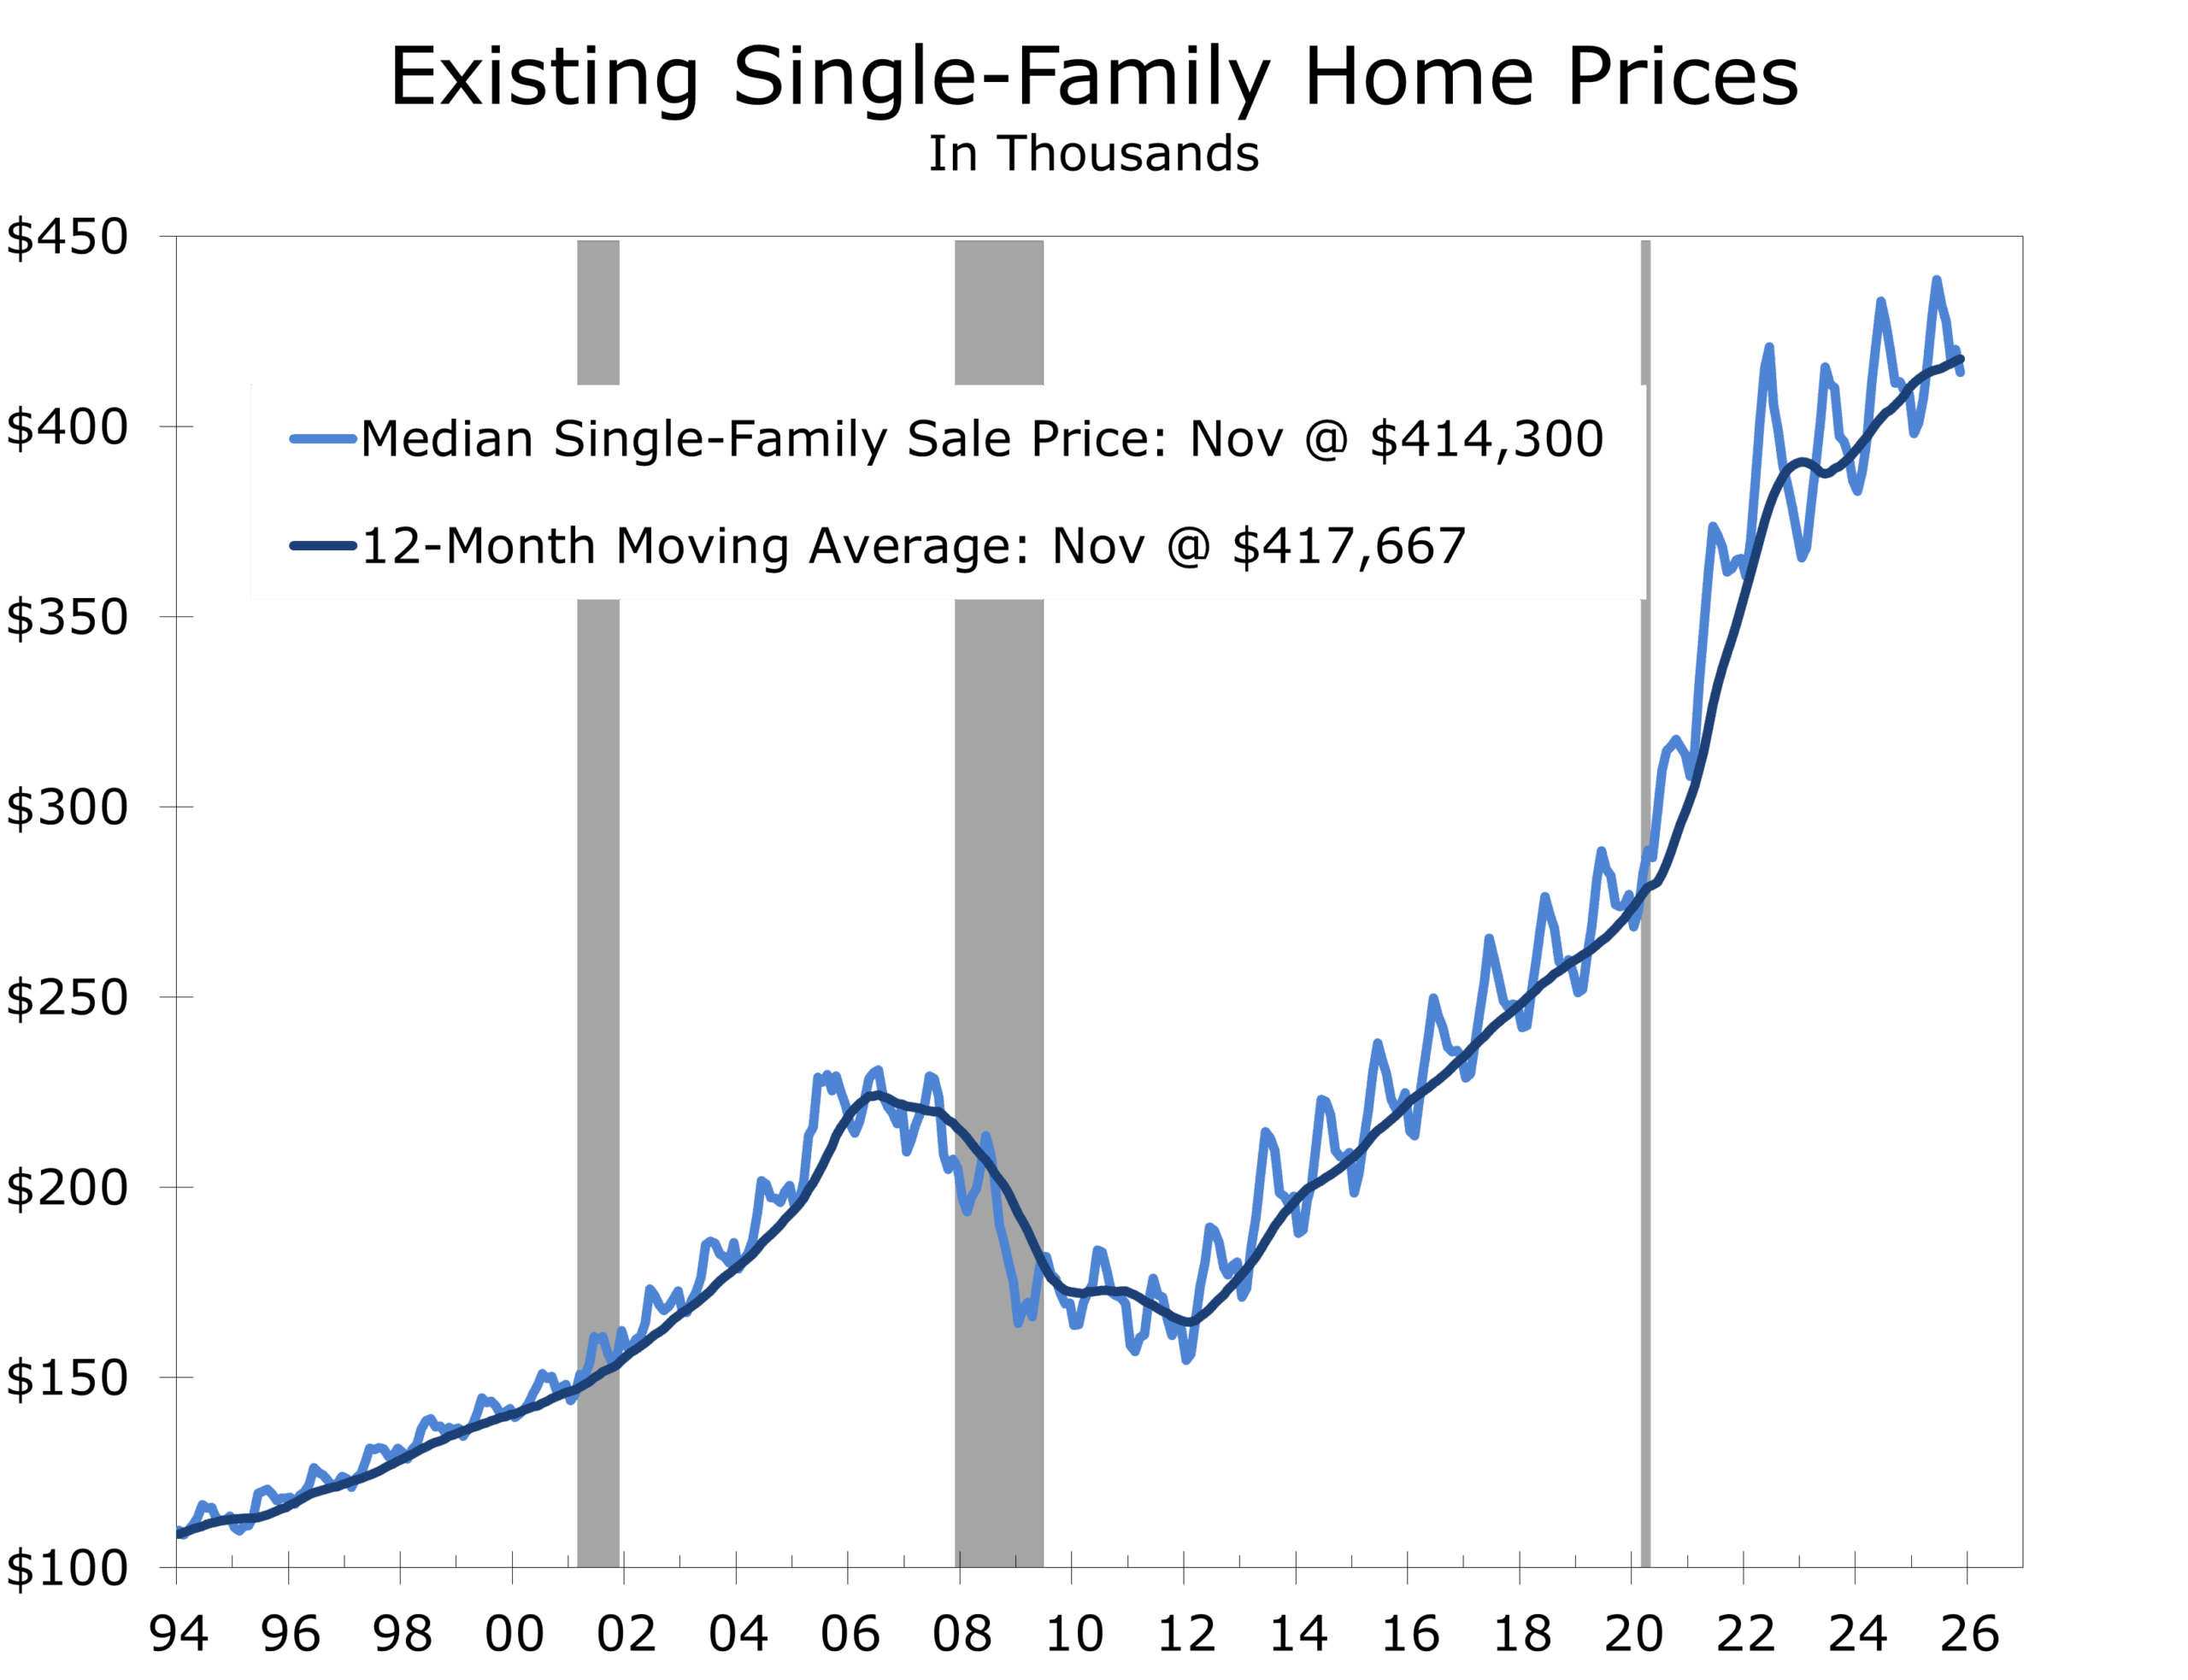
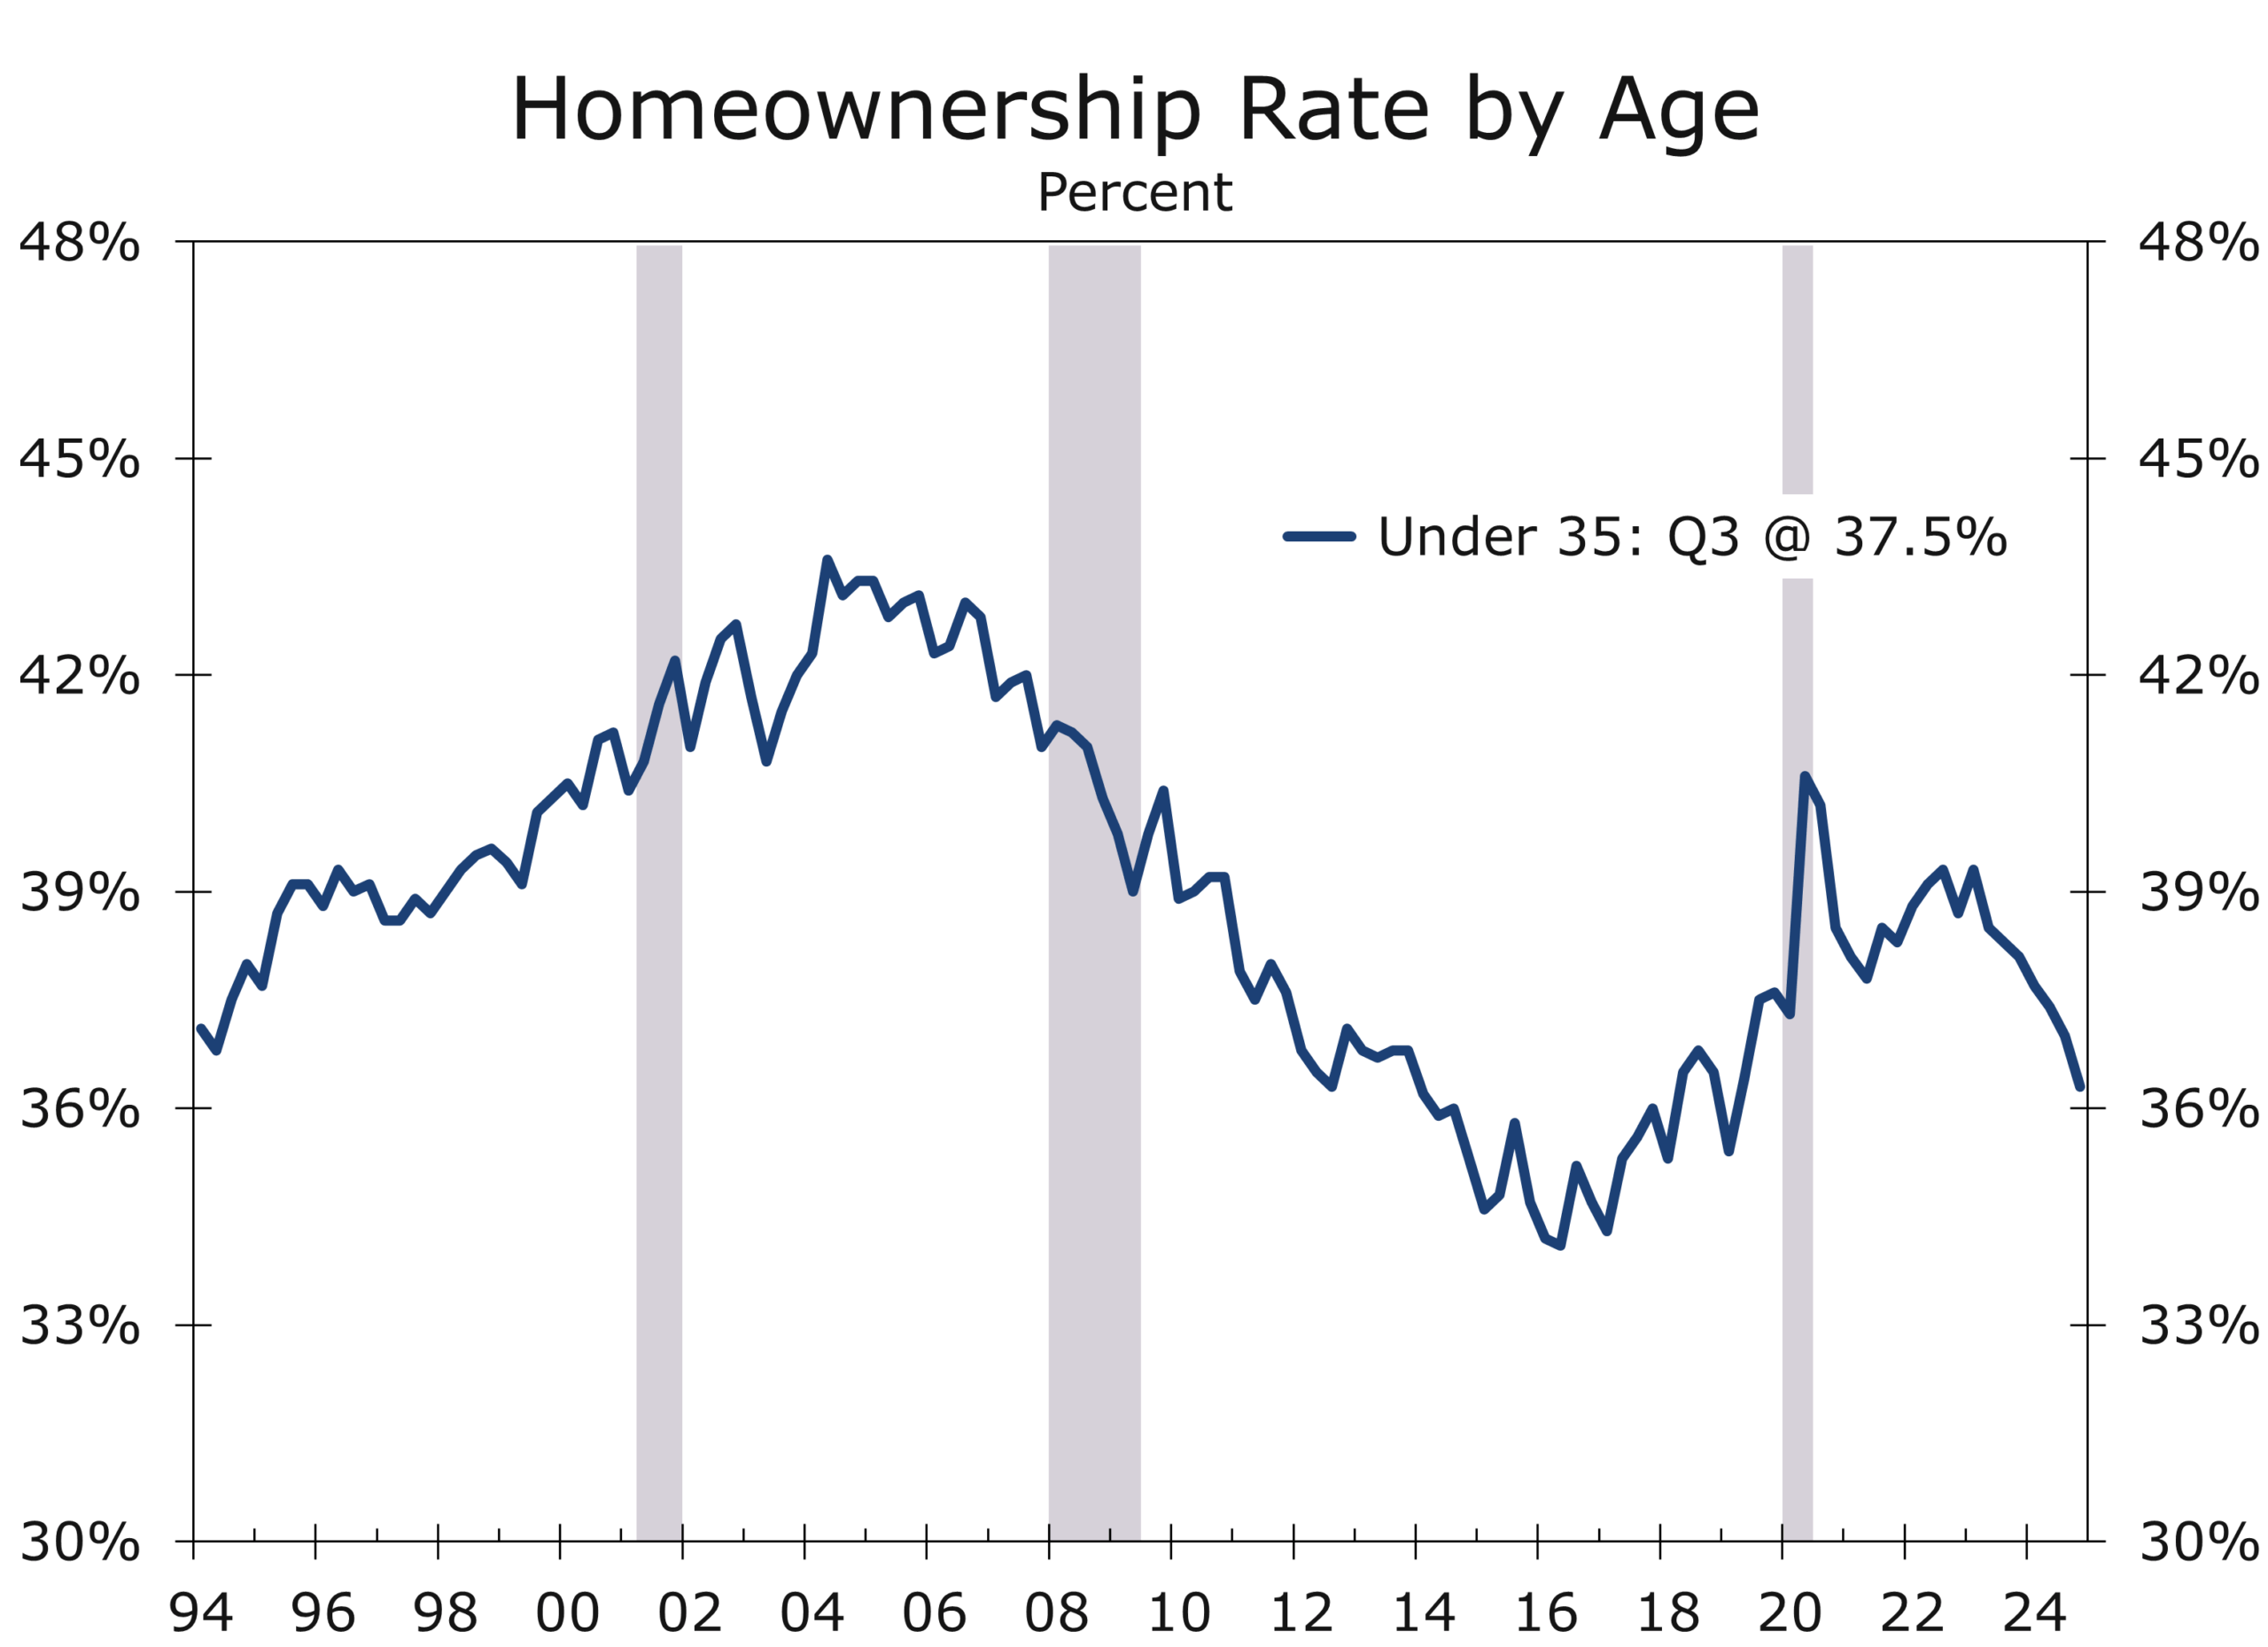
Proposals to limit institutional purchases of single-family homes reflect real frustration over housing affordability, but they misdiagnose the problem. Large institutions own only a small share of the U.S. housing stock and cannot explain the national rise in home prices; where they matter is at the margin, in supply-constrained metros where purchase flows can amplify price pressures and reduce entry points for first-time buyers. Even there, institutional activity is a second-order effect layered on top of a much deeper structural shortage driven by years of underbuilding, restrictive zoning, rising construction costs, and strong in-migration. Recent data show institutions already slowing acquisitions and shifting toward build-to-rent, helping expand rental supply rather than crowd it out. Framing affordability as a battle between households and institutions may be politically appealing, but durable relief will come from expanding housing capacity—faster permitting, zoning reform, and infrastructure investment—not from constraining capital in an already undersupplied market.
Disclaimer: This publication has been prepared for informational purposes only and is not intended as a recommendation offer or solicitation with respect to the purchase or sale of any security or other financial product nor does it constitute investment advice.
January 12, 2026
Mark Vitner, Chief Economist
Piedmont Crescent Capital

A View from the Piedmont: Our Weekly Commentary on Money, Credit, Exchange Rates & Geopolitics – An Economy on Parallel Rails
Highlights of the Week
- Growth signals remain bifurcated. Manufacturing continues to contract, services have re-accelerated, and GDP tracking models still point to a very strong fourth quarter. The economy is advancing on parallel rails, not in a straight line.
- The labor market is cooling without cracking. Hiring has slowed materially, wage growth is easing, and productivity is doing more of the work. This is a low-hire, low-fire environment, not a recessionary one.
- Financial conditions remain supportive. Credit markets reopened forcefully, issuance surged, and risk assets are behaving as though policy is restrictive only at the margin.
- Policy risk has shifted from inflation to institutions. Political pressure on the Federal Reserve introduces a new variable that could extend policy restraint even if inflation continues to improve.
- Geopolitics has moved from background noise to event risk, but markets are still treating it as a premium rather than a macro shock.
U.S. macro: mixed signals, durable momentum
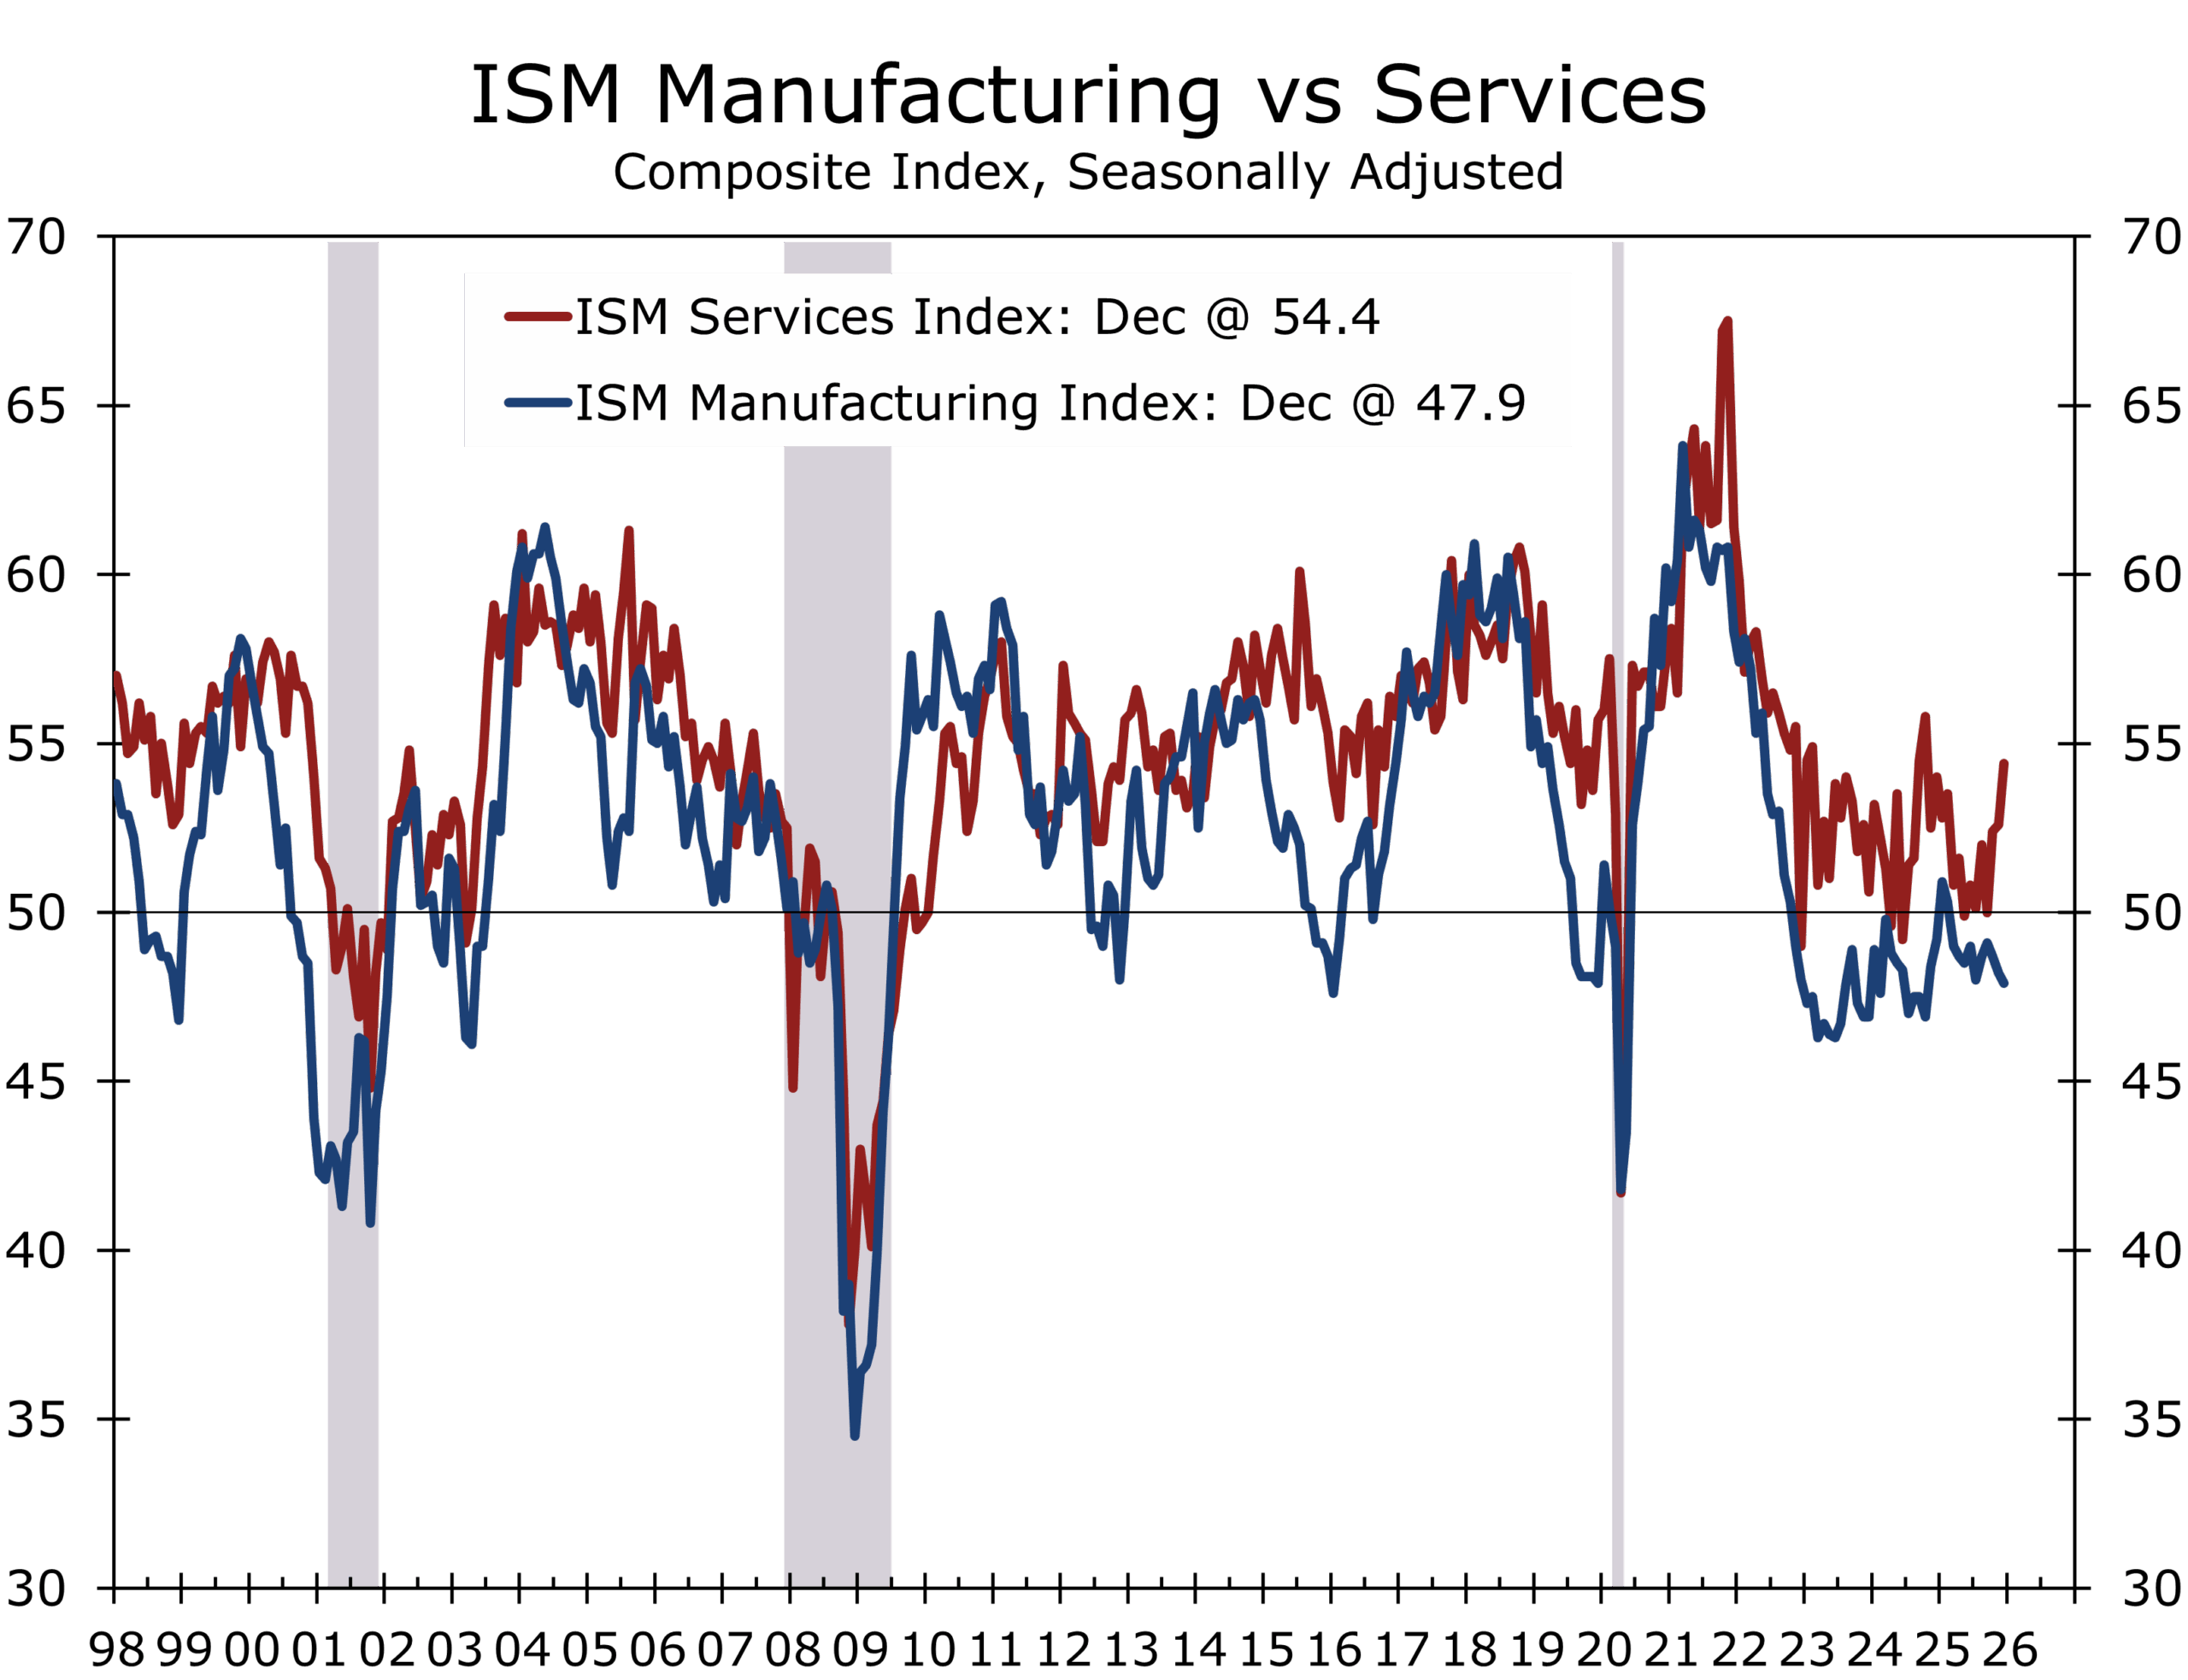
Manufacturing ended 2025 on a softer note. ISM Manufacturing fell to 47.9 in December, pushing further into contraction and underscoring how sensitive the sector remains to policy uncertainty and uneven global demand. But the weakness is not uniform. Manufacturing is increasingly bifurcated.
Output of consumer goods rose just 1.4% year over year, while output of business equipment surged 12.5%. That strength is narrowly concentrated in capital-intensive segments—aerospace and miscellaneous transportation equipment, including shipbuilding, where output jumped 25.2%, and semiconductors and related components, up 16.5%. Even within nondurables, pharmaceutical and medicine production stands out, rising roughly 6–7% over the past year.
The signal from industrial production is clear: this is not a consumer-led manufacturing cycle. It is a capital-, defense-, technology-, and innovation-driven expansion operating alongside a still-soft factory backdrop. Reshoring will become more evident during 2026, with pharmaceuticals and steel likely to be two of the earliest beneficiaries.
Manufacturing is contracting overall but expanding in capital-intensive segments.
Services, meanwhile, continue to do the heavy lifting. The Institute for Supply Management Services index climbed to 54.4 in December, signaling sustained momentum in business activity, new orders, and hiring. This is now the economy’s center of gravity. Large, scalable service platforms benefit from recurring demand, pricing power, and operating leverage. Unlike goods production, services are less constrained by inventories and more adaptable to shifts in labor and capital mix.
GDPNow, trade, and the arithmetic of growth
Atlanta Fed GDPNow remains eye-catching. As of January 9, the model was tracking Q4 real GDP growth above 5%, even after a modest pullback. The strength is not coming from housing or consumer excess. It is coming from trade arithmetic and capital spending.
October trade data showed a sharp narrowing of the trade deficit, driven largely by tariff-related timing effects. Pharmaceutical imports reversed abruptly after September front-loading, while capital goods imports surged, reflecting sustained spending on AI infrastructure, data centers, and high-tech equipment. Exports were also boosted by an unusual spike in gold shipments, which flatters the headline trade balance but contributes little to real GDP.
GDPNow captures the arithmetic of the moment; forecasting requires judgment about what lasts.
We adjusted our Q4 real GDP forecast modestly higher following the trade release, but not nearly to the levels implied by GDPNow. The model is deliberately mechanical. When net exports swing sharply and equipment spending remains firm, it upgrades growth aggressively, even if some of that strength is likely to reverse as gold flows normalize and import-timing effects fade. Our 2026 growth forecast remains above consensus, with risks currently skewed to the upside.

Labor market: slow lane, not pile-up
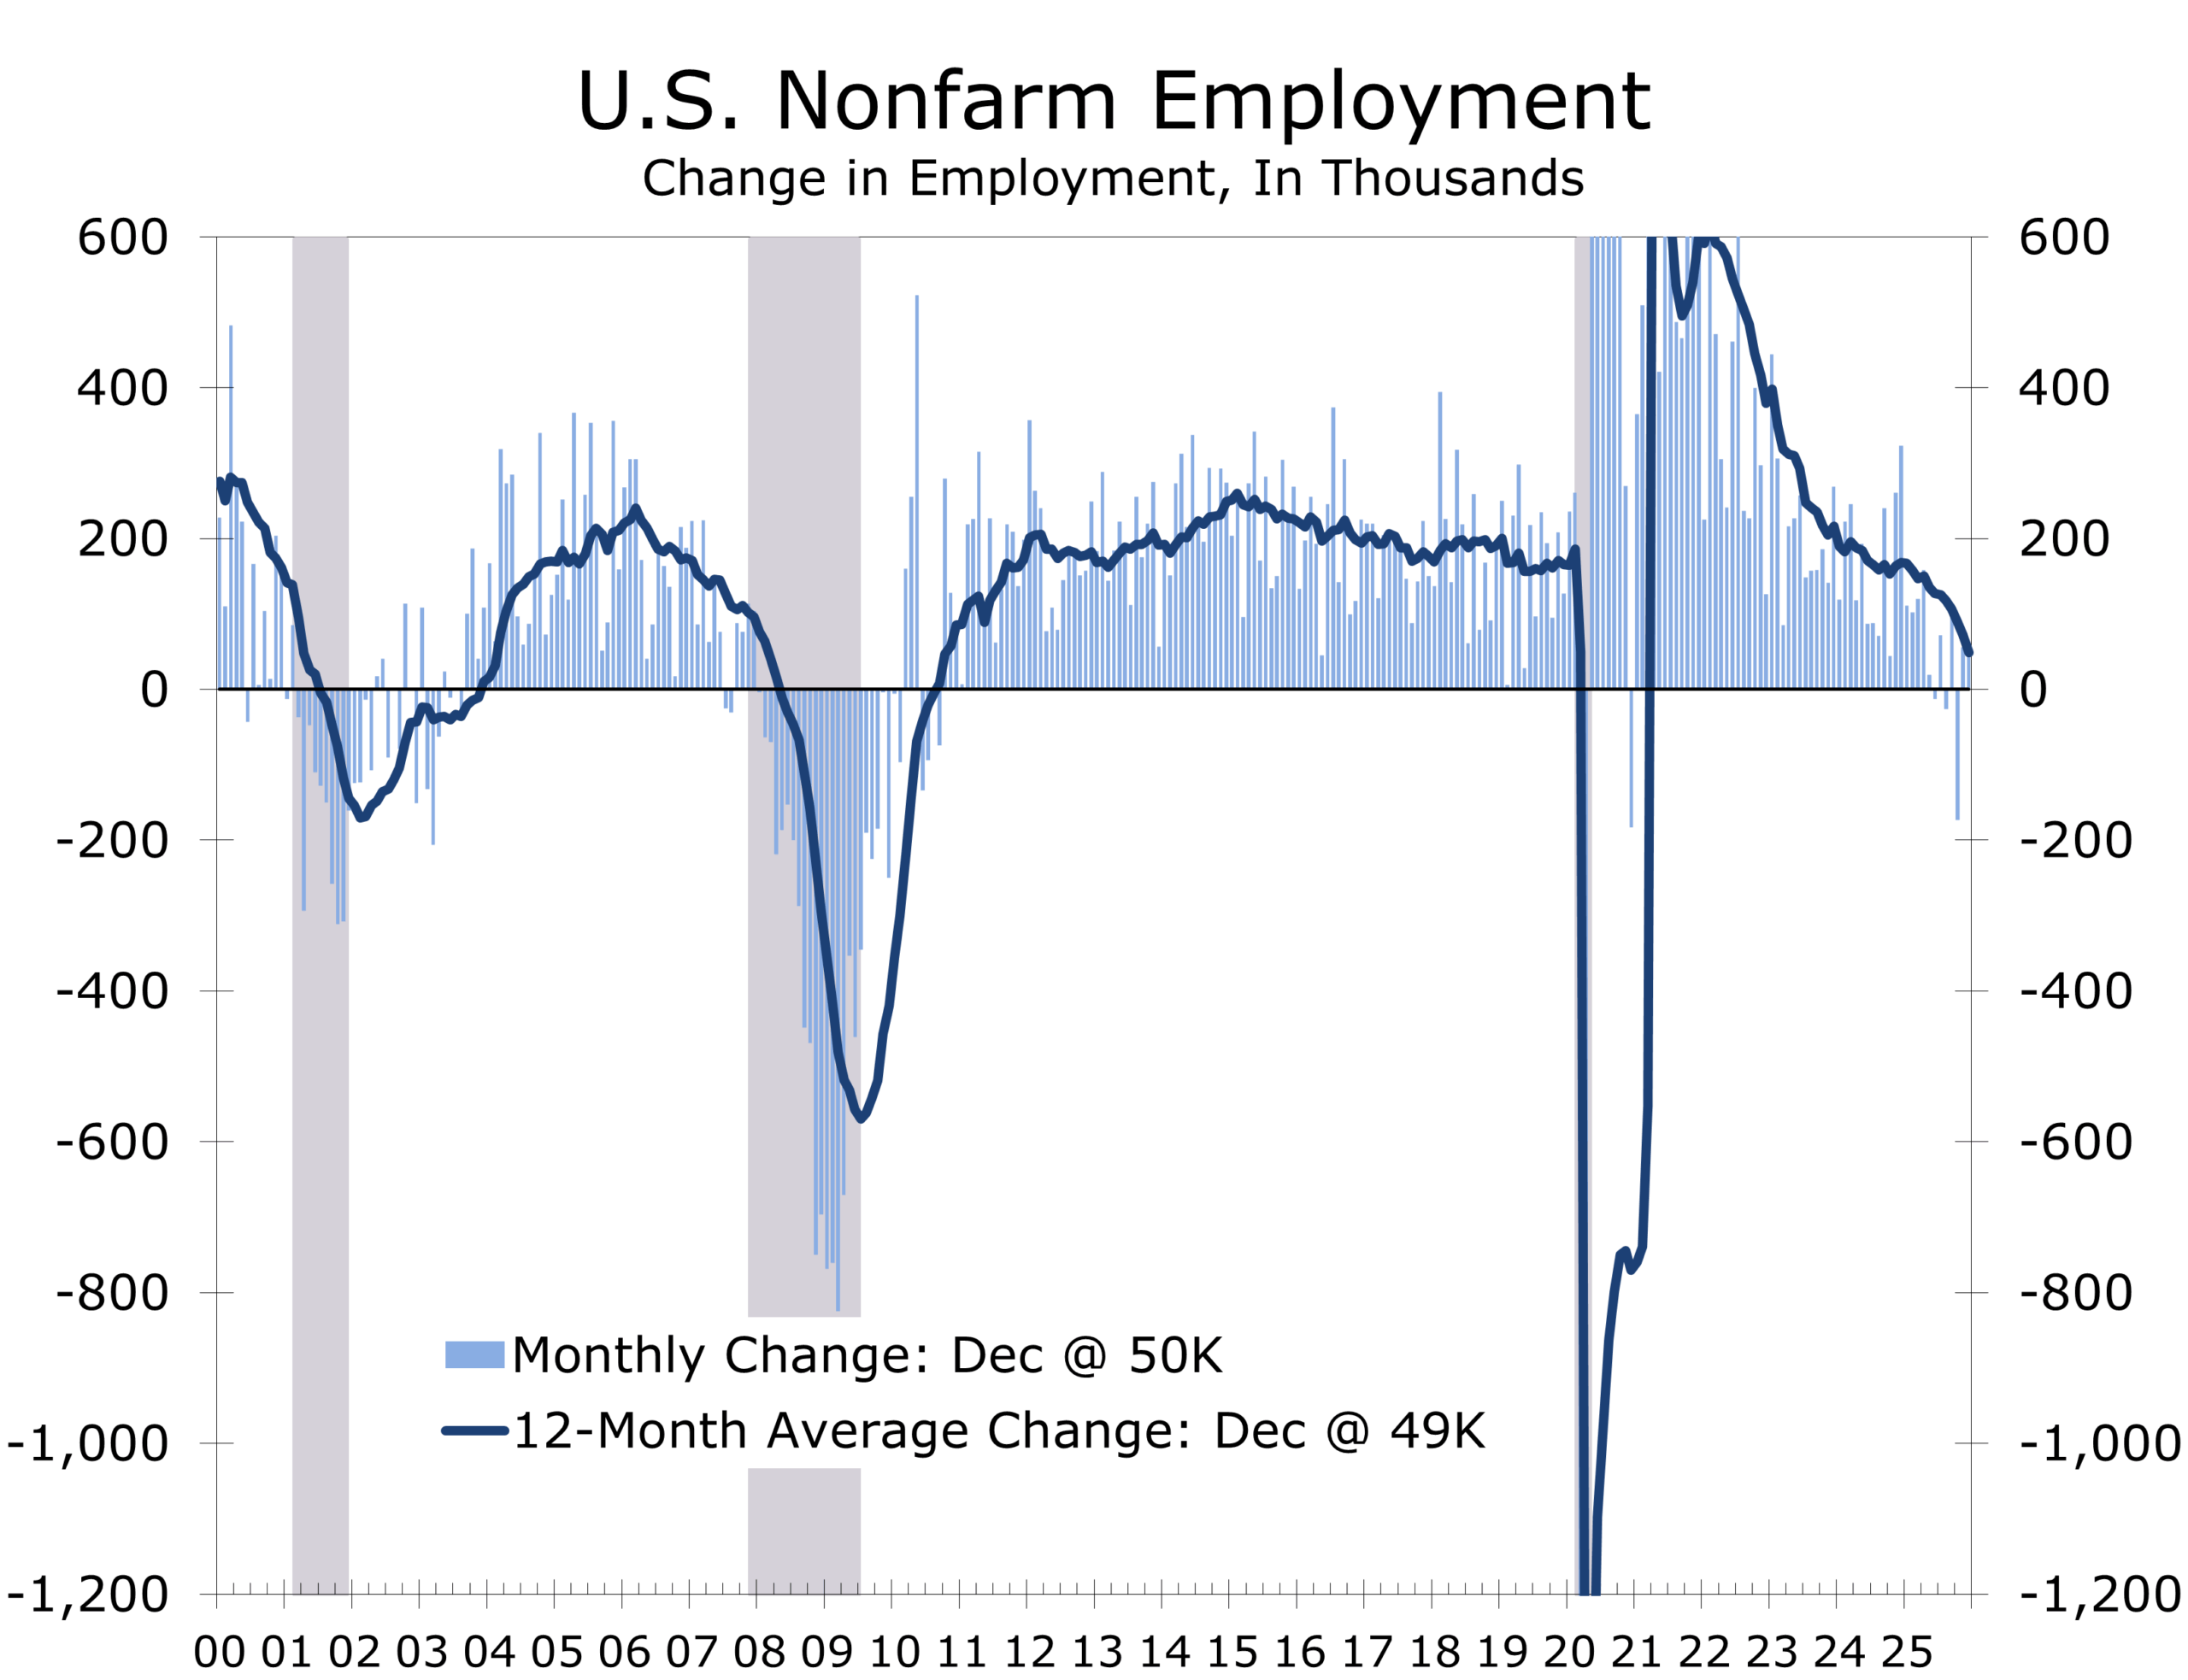
The December Employment Situation capped a notably slower hiring year. Payroll gains averaged roughly 49,000 per month in 2025, a sharp deceleration from prior years, with the unemployment rate ending the year at 4.4%. Wage growth cooled but did not collapse, with average hourly earnings running in the high-3% year-over-year range—firm enough to support consumer spending while remaining consistent with a disinflationary labor backdrop.
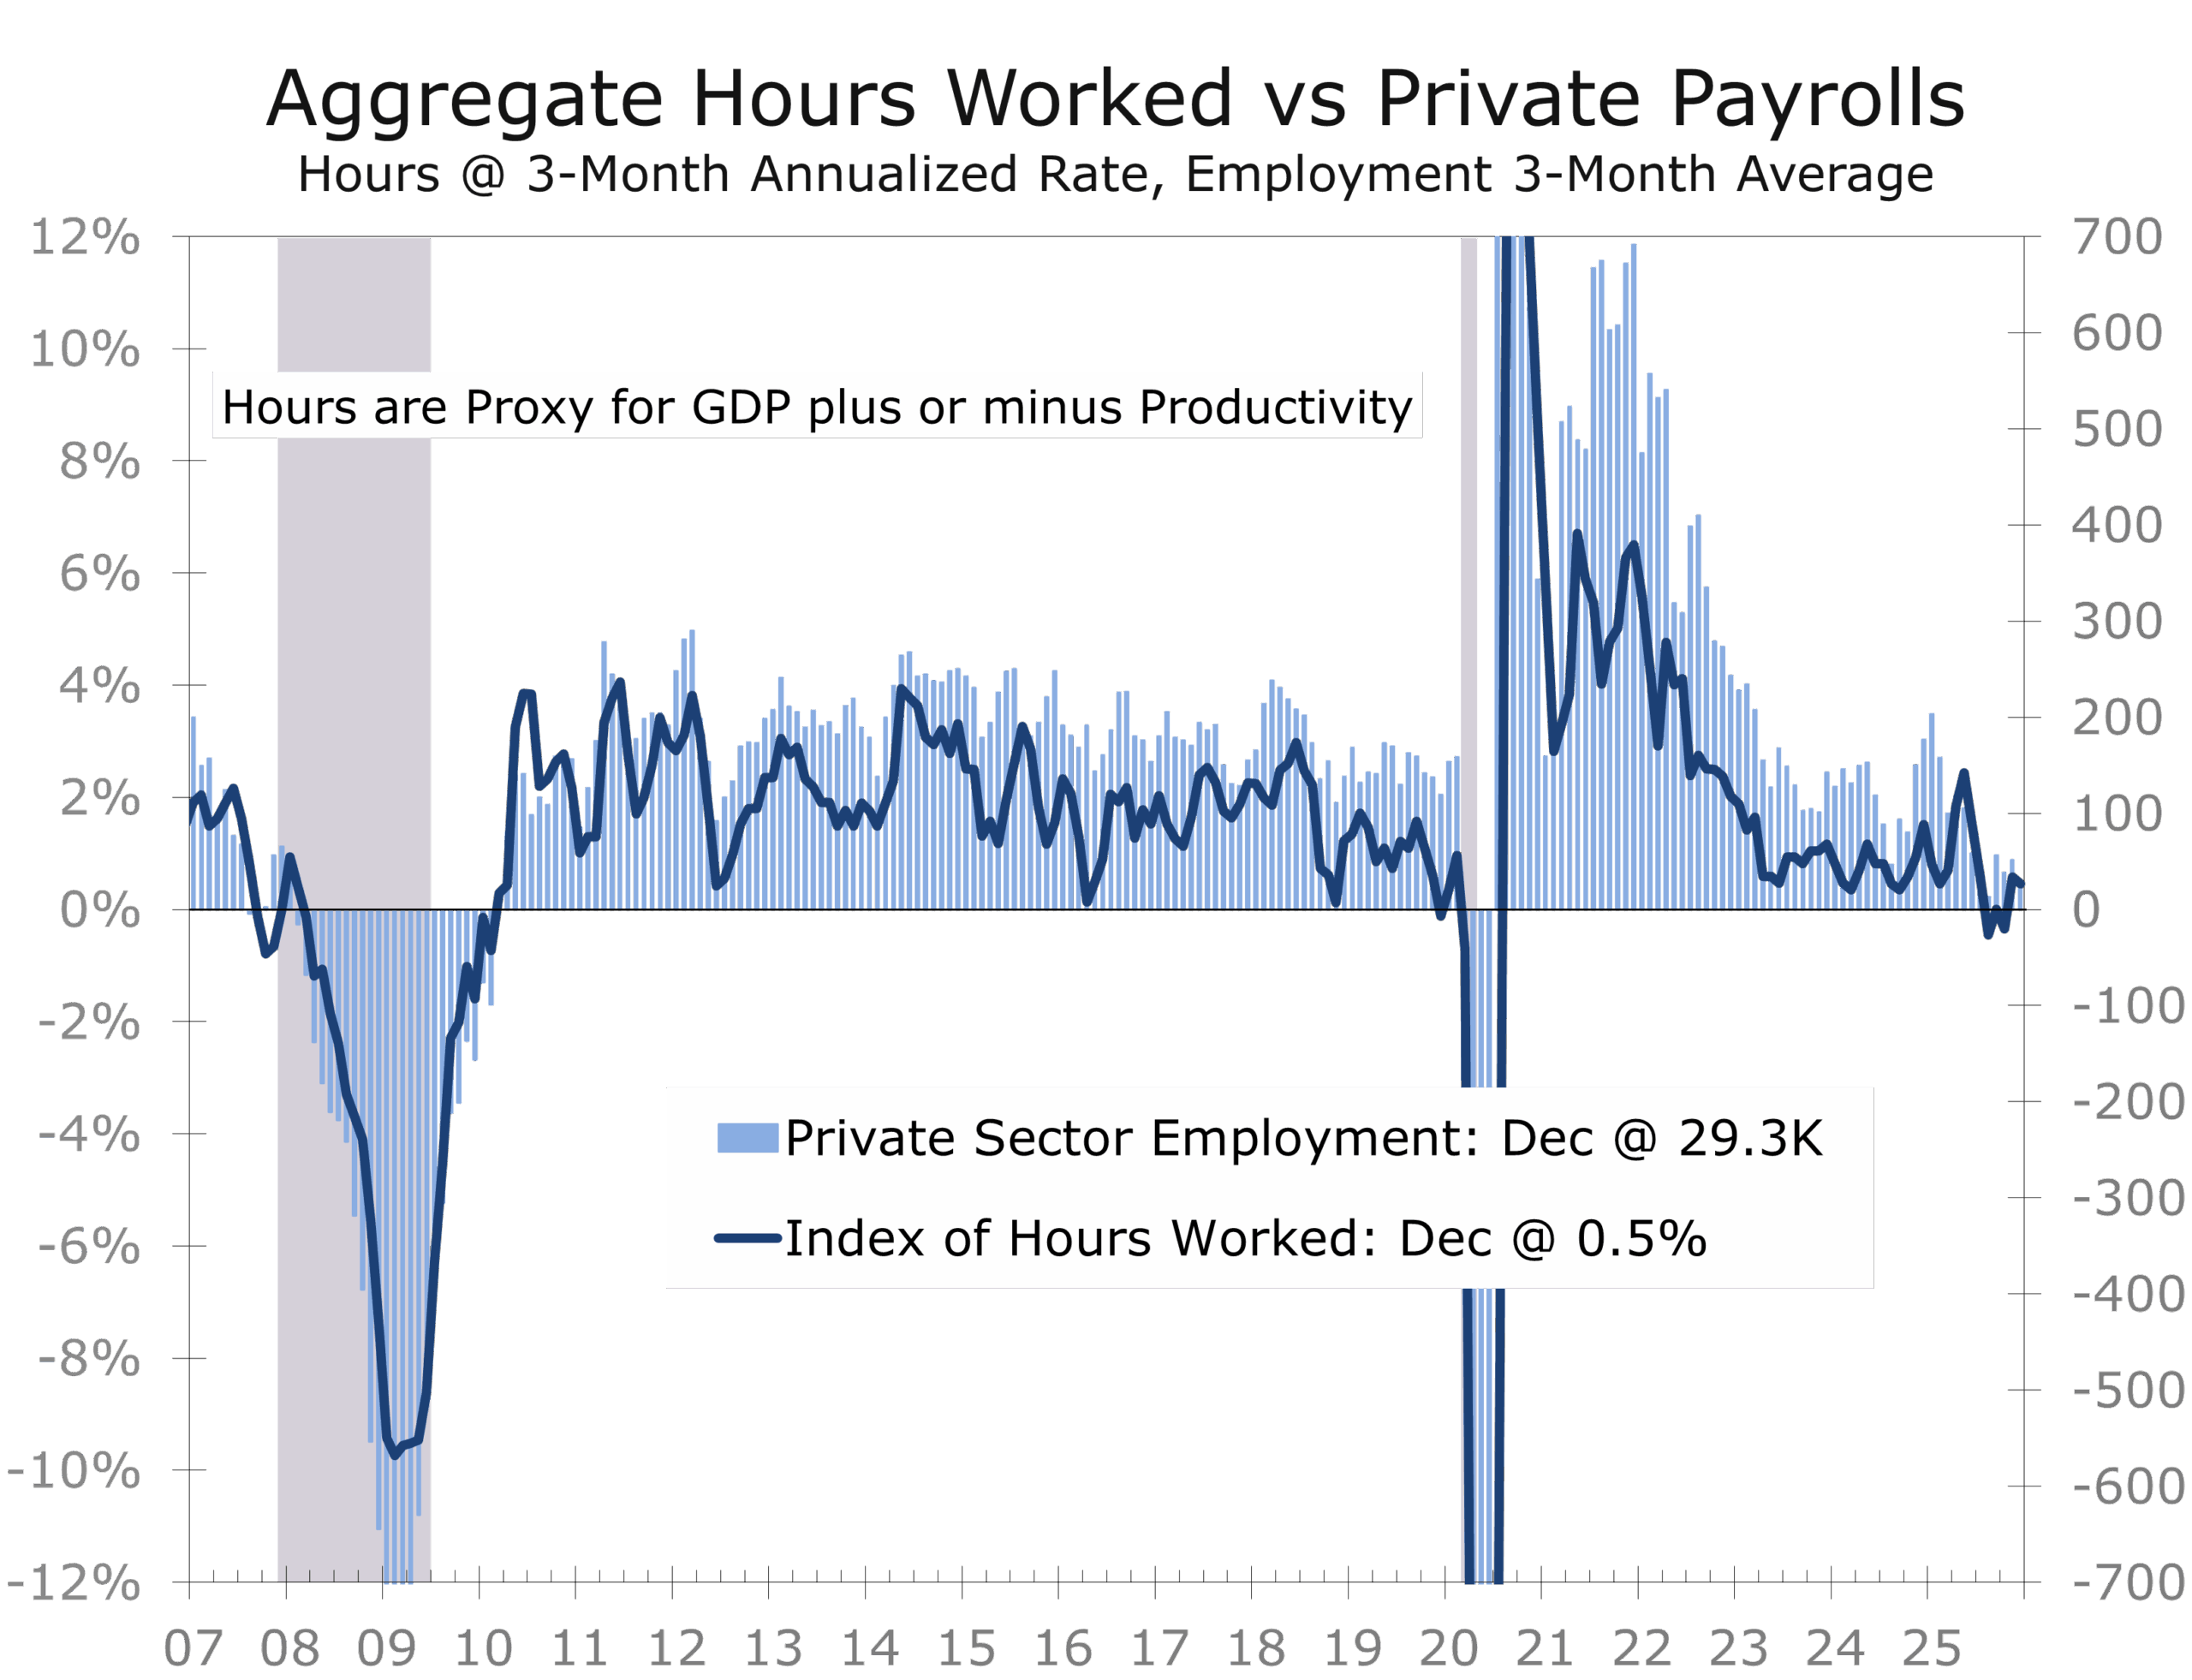
Hiring remains narrowly concentrated, with many cyclically sensitive industries showing little net change. Layoffs remain historically low, however, reinforcing the view that firms are reluctant to shed labor. Adjustment continues to occur primarily through hours rather than headcount, with aggregate hours worked declining modestly and underemployment edging higher at the margin. Productivity is doing more of the work. After a strong third quarter, nonfarm productivity remains up roughly 2% year over year, underscoring a meaningful improvement in output per worker even as hiring slows.
Slower hiring reflects higher productivity and tighter labor supply, not labor-market stress.
Quarterly productivity readings are inherently noisy. The more reliable signal comes from year-over-year trends and multi-year averages, which point to underlying productivity growth closer to 2%, with scope to rise toward 2½%–3% as capital deepening, AI adoption, and the buildout of digital infrastructure shift a larger share of growth toward capital rather than labor. At the same time, businesses are pruning lower-return activities, retaining higher-quality workers, and becoming more selective in hiring; reinforcing the productivity rebound.
This increasingly resembles a low-hire, low-fire equilibrium. Employers are cautious about adding workers but reluctant to cut existing staff. The implication is straightforward: labor costs are becoming more predictable, not more volatile, reducing downside risk to margins even as top-line growth moderates.
Rates, financial conditions, and policy risk
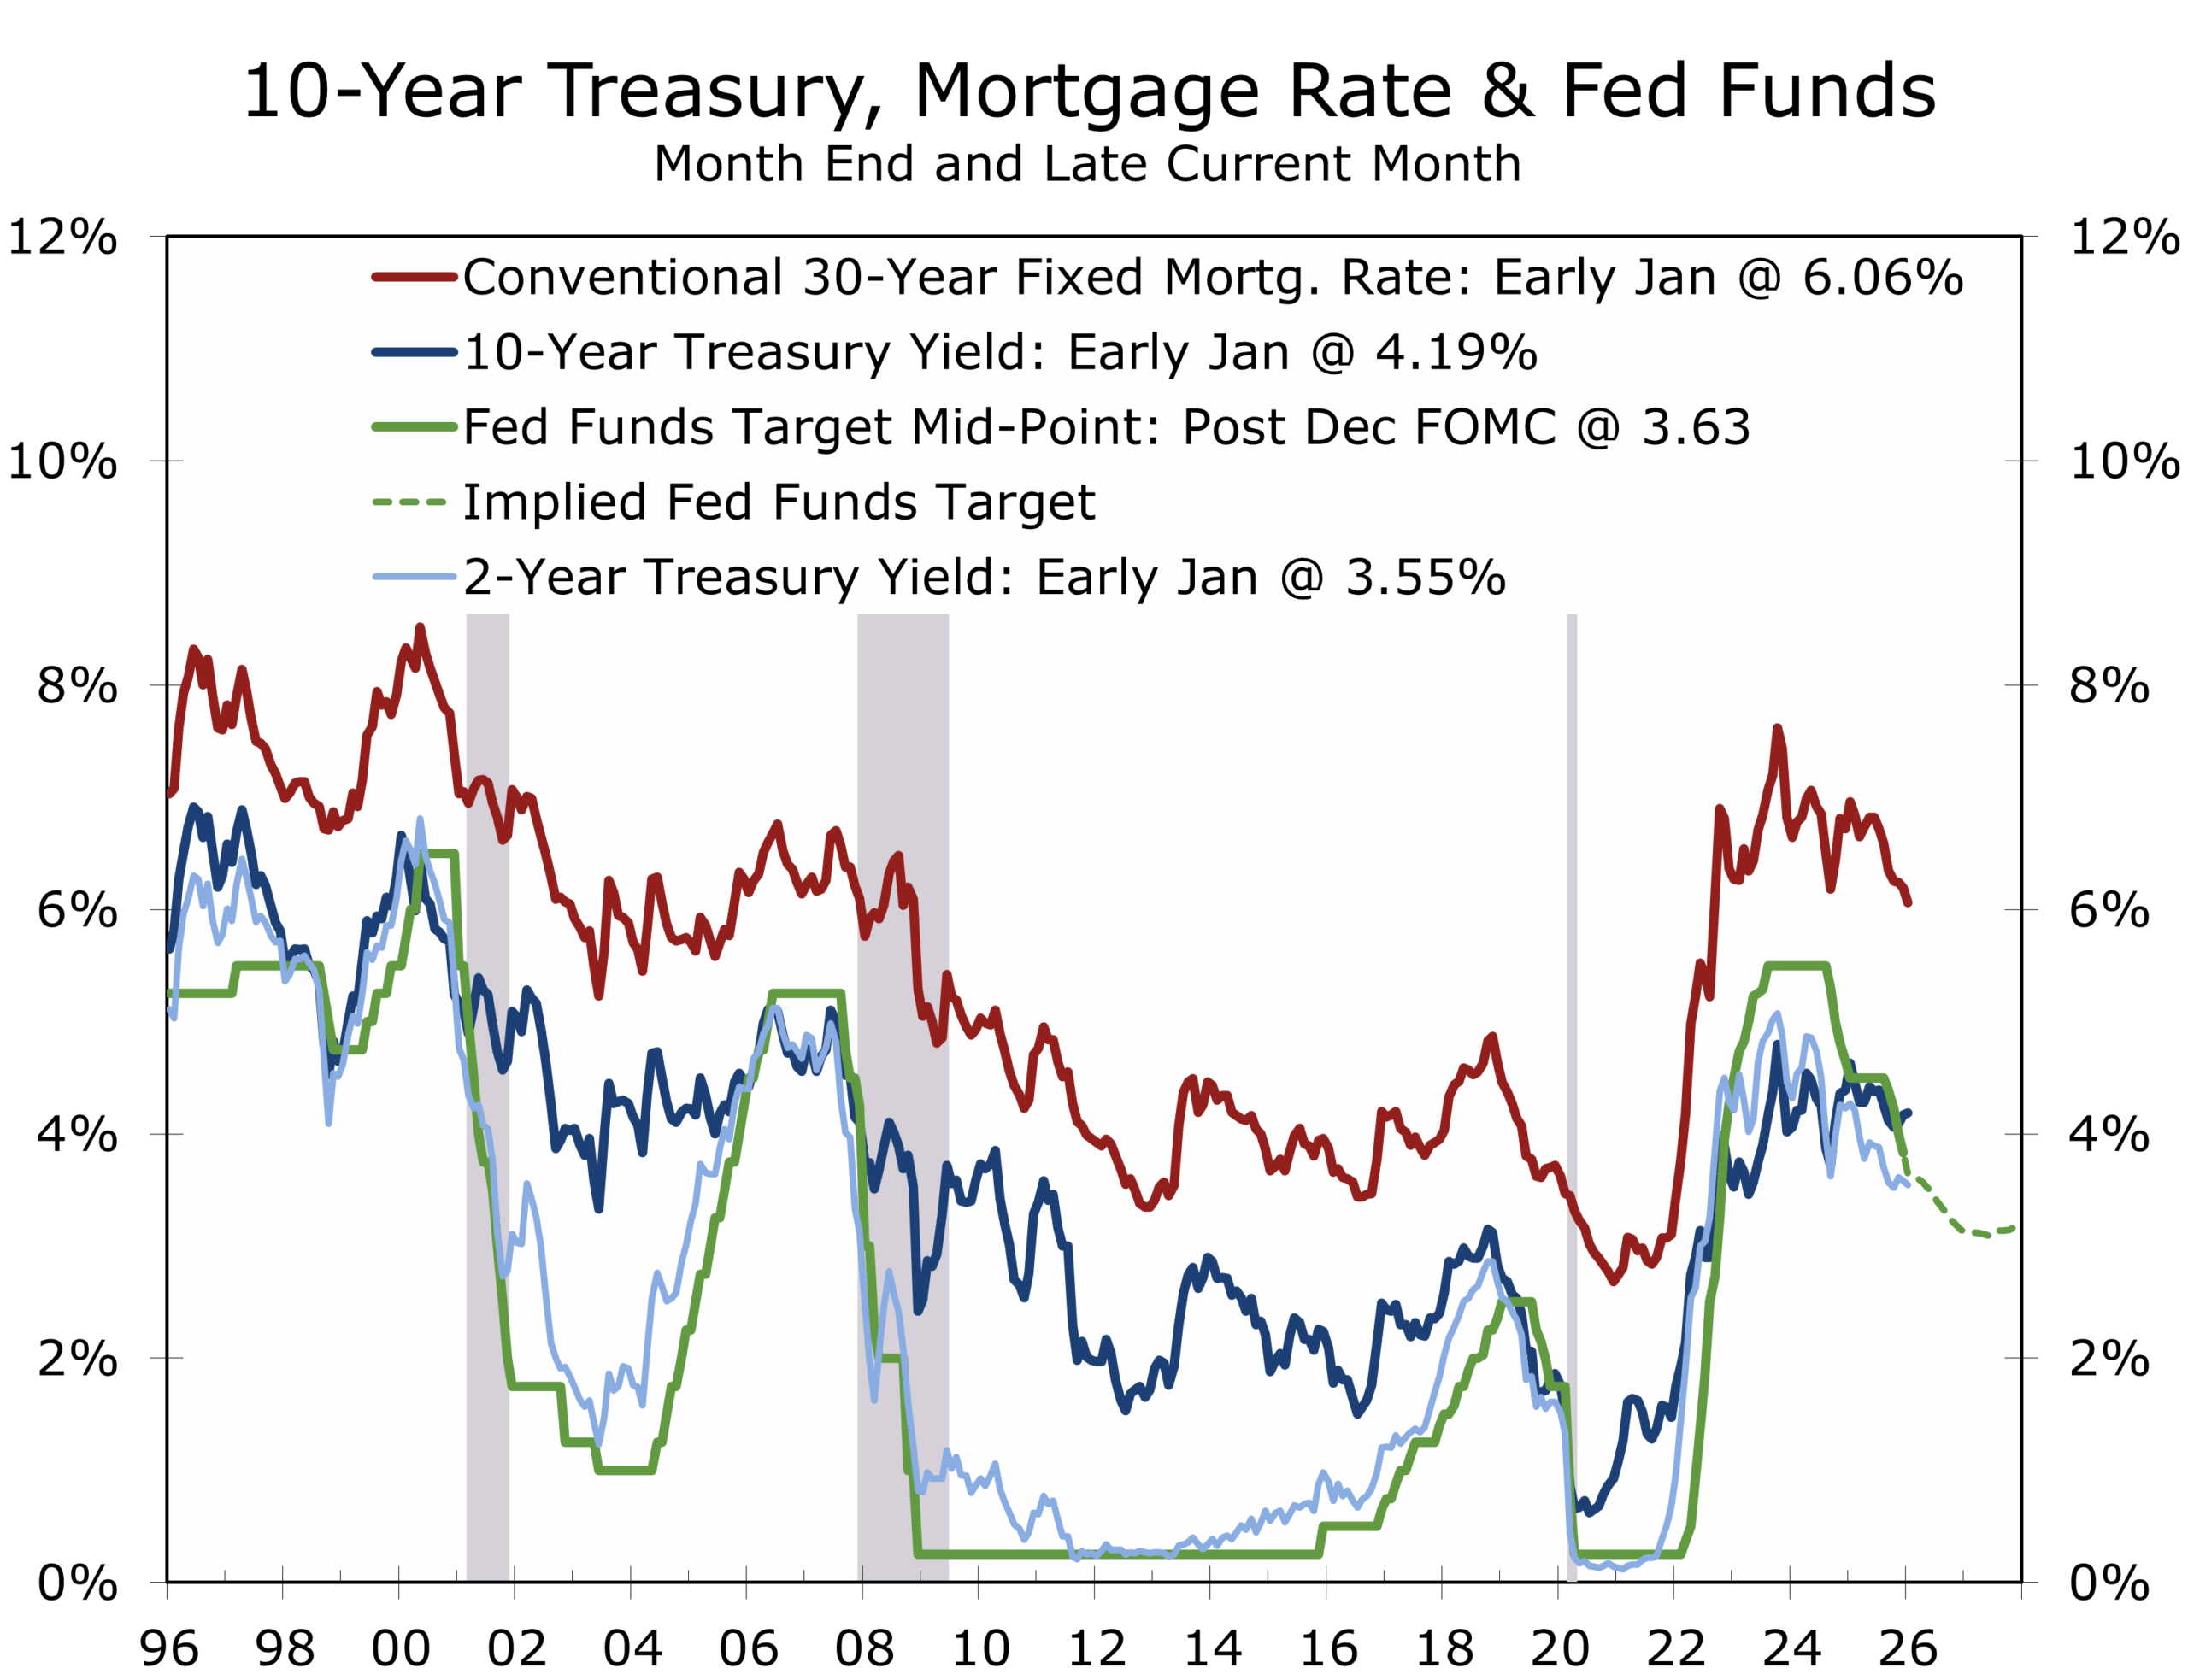
Markets have shifted toward a patient Fed narrative. Rate cuts remain priced for later in 2026 if inflation cooperates, but near-term urgency has faded. Financial conditions reinforce that view. Credit spreads remain contained, issuance has surged, and risk assets are not behaving as though policy is overly restrictive.
A new variable entered the equation this week: direct political pressure on Federal Reserve leadership. The Administration publicly accused Chair Powell of misconduct tied to his prior regulatory decisions and indicated support for potential legal action, an extraordinary step that reframes the policy outlook—not through inflation or employment, but through institutional credibility.
Central Bank independence is a policy tool. Undermining it raises the cost of easing.
Markets have largely discounted immediate consequences, assuming the Fed’s reaction function remains intact. That assumption appears reasonable. Inflation expectations remain well anchored, rate pricing has barely moved, and financial conditions show no signs of credibility shock. Policy is still being set inside the FOMC, not outside it.
History, however, offers an important guide. Episodes of political pressure on central banks rarely result in faster accommodation. More often, they produce the opposite outcome. When independence is questioned, policymakers tend to lean more heavily on process, caution, and institutional legitimacy. Powell’s response fits that pattern. His remarks were institutional, procedural, and deliberately defiant. He made clear that the Federal Reserve’s mandate, framework, and decision-making process remain unchanged. That message was not accidental. It was designed to reinforce credibility at a moment when it was being tested.
Threats to Fed independence rarely hasten easing. They usually reinforce caution.
The irony is that the macro backdrop would otherwise support patience. Growth remains solid, labor markets are cooling without distress, and funding conditions are accommodative. Political pressure risks turning what could have been a benign pause into a longer one, even if inflation continues to drift lower.
This episode is best viewed as a test of norms rather than a transfer of authority. The Federal Reserve’s independence ultimately rests not on rhetoric or statute alone, but on credibility and the willingness of its leadership to hold the line. On that front, Powell has been clear.
Equity and credit: funding windows reopened
Investment-grade credit markets opened the year with force. Roughly $95 billion in U.S. corporate bond issuance marked the busiest first full week since early 2020. This is classic January front-loading, amplified by strong demand and a desire to lock in funding early.
That behavior is inconsistent with a narrative of tightening liquidity. It suggests that access to capital remains available, terms are competitive, and balance-sheet strategies are being executed from a position of relative strength.
Equities have reflected a similar message: growth intact, wage pressure easing, and margins supported by productivity rather than labor expansion.
Geopolitics: risk premium, not shock yet
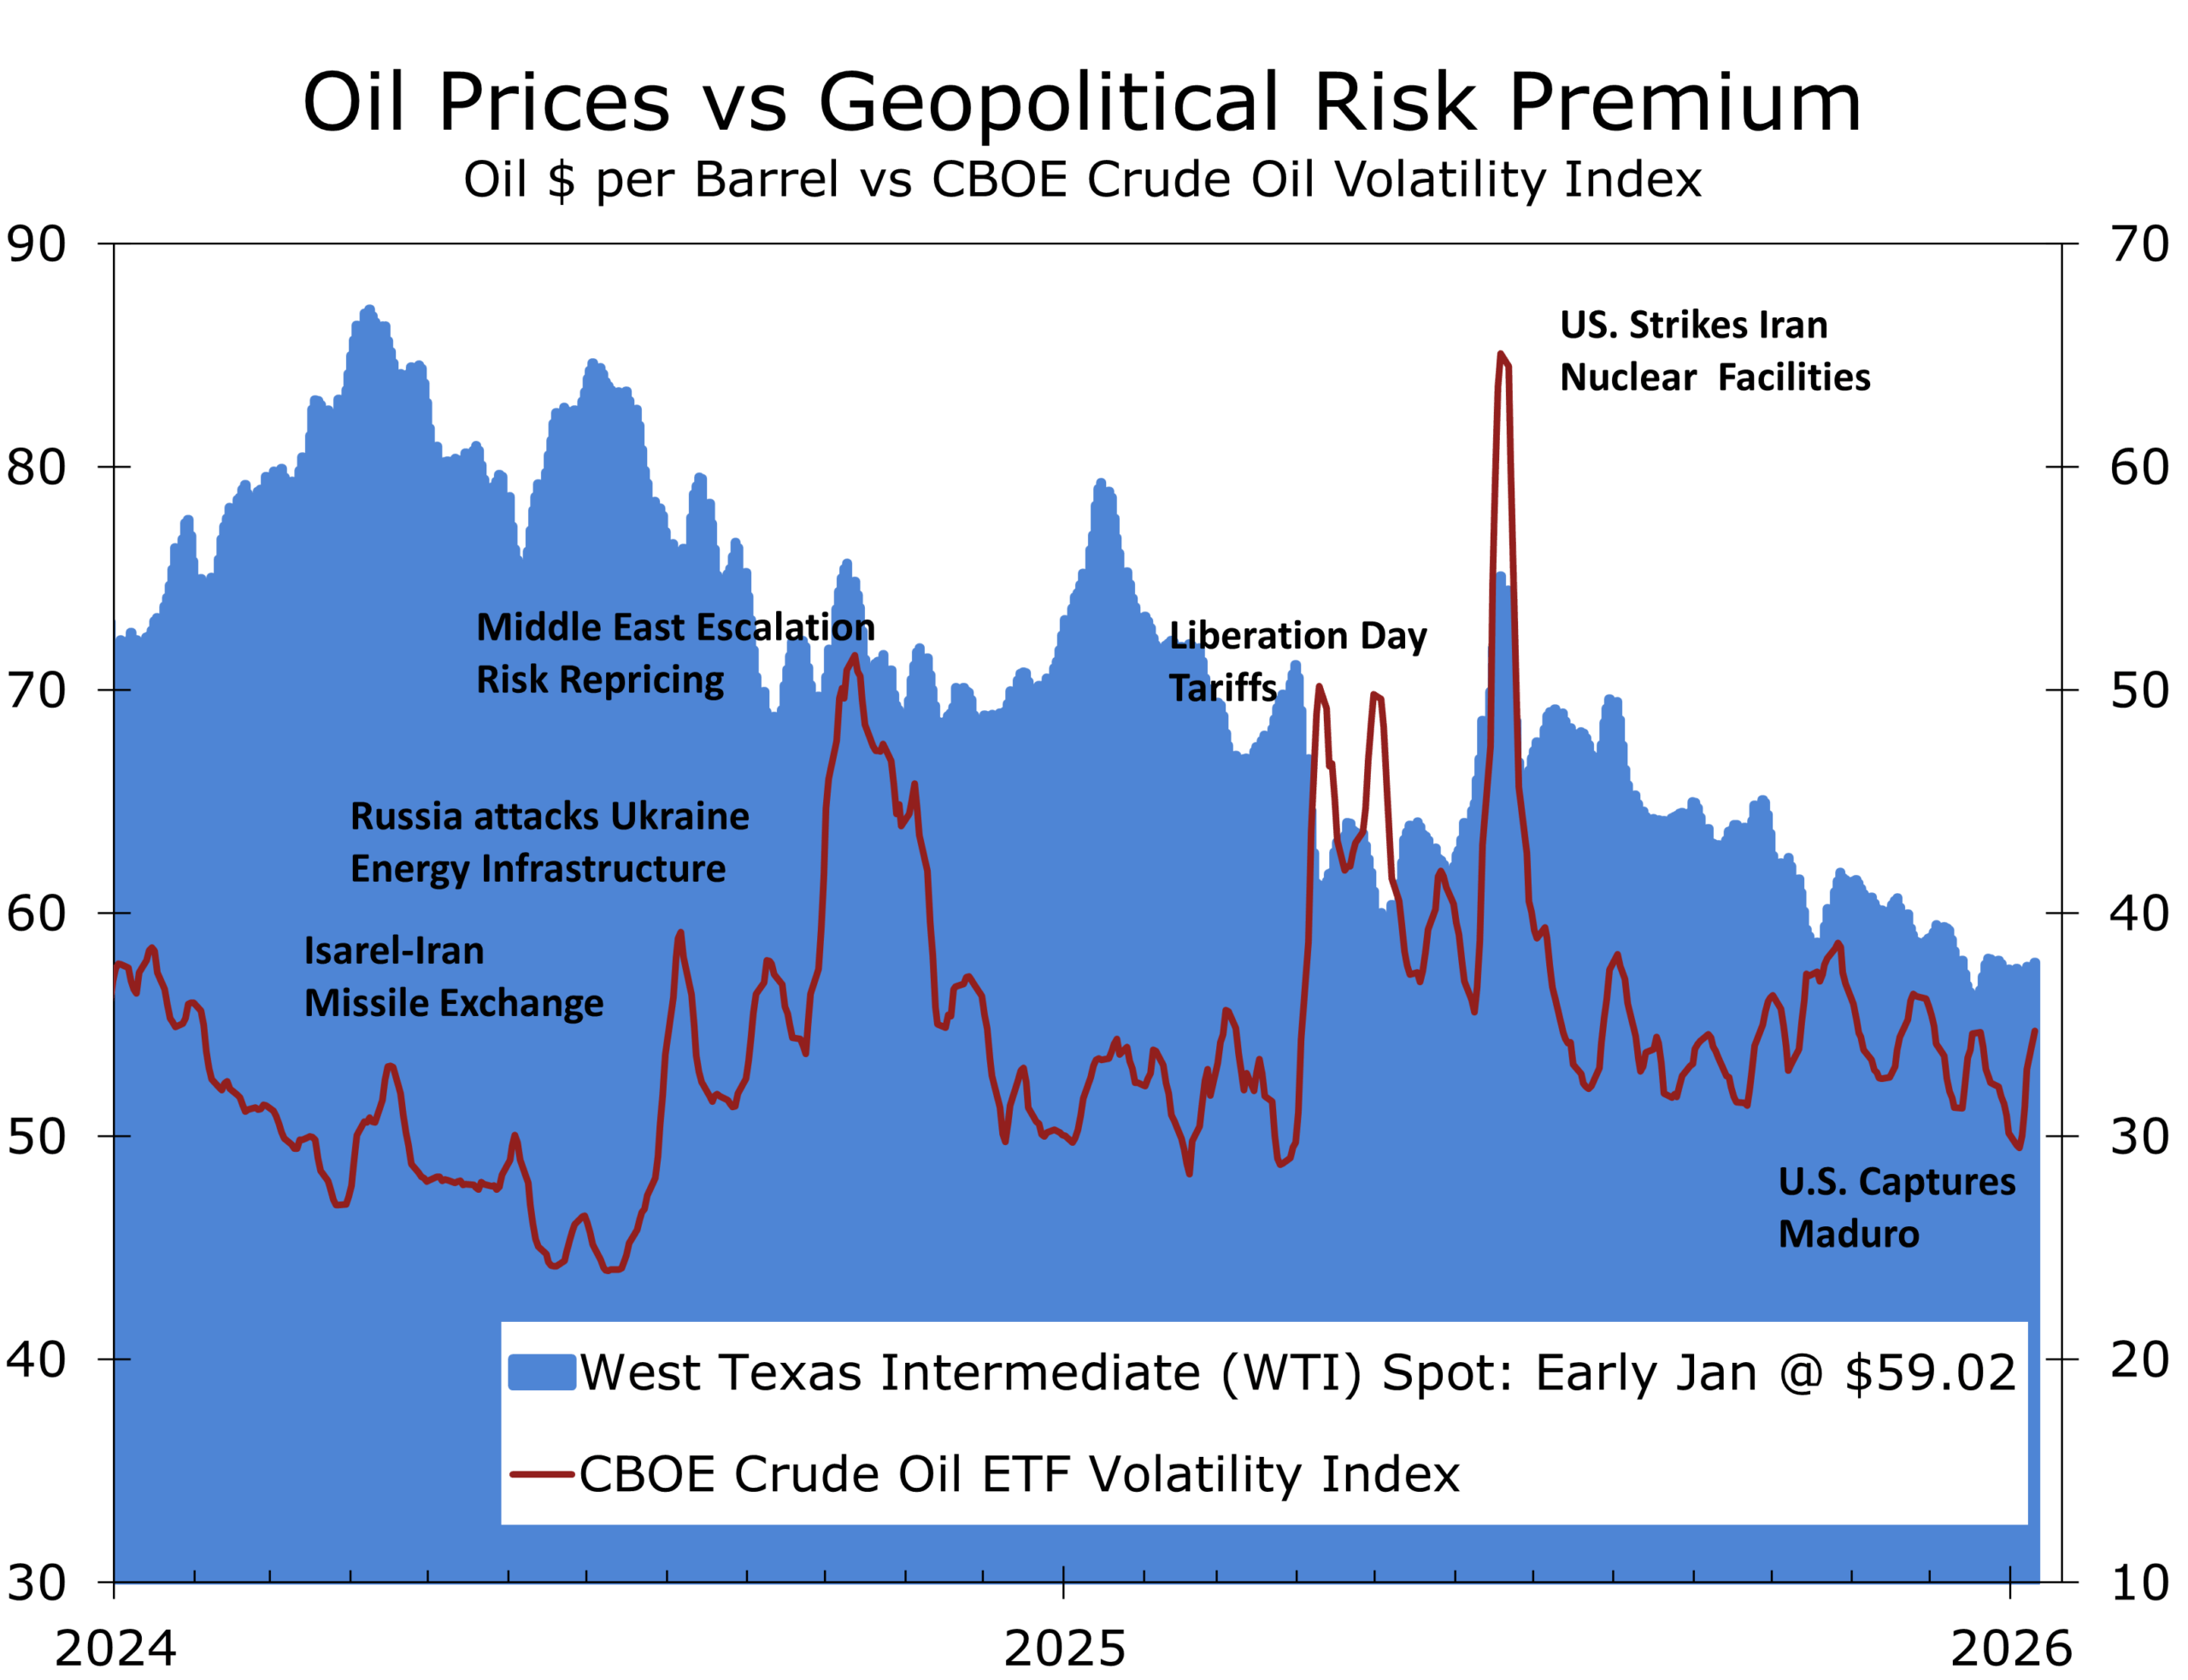
Venezuela was the headline shock. The U.S.-led capture of Nicolás Maduro sent a clear signal about hemispheric control, inviting comparisons to the 1989 intervention in Panama. Markets have so far treated the episode as a geopolitical risk premium rather than a systemic macro event, with oil prices and broader risk assets largely contained.
Russia intensified strikes on Ukrainian infrastructure during extreme cold, raising humanitarian and energy-system risks. Iran escalated rhetoric toward Israel and the United States, keeping the Middle East risk envelope wide, while renewed movement around Aleppo underscored Syria’s continued volatility. These developments reinforce a backdrop of persistent geopolitical tension without triggering outright disruption.
Geopolitical risk is being priced through volatility and term premia.
The timing matters. Geopolitical assertiveness abroad is coinciding with institutional tension at home, a combination markets typically price with a lag. After a strong start to the year, this raises the likelihood of intermittent volatility, making early-year issuance and proactive funding decisions look increasingly well timed.
Theme: geopolitics, pricing power, and term premia
The common thread across these developments is not immediate disruption but option value. Supply chains remain intact, yet redundancy, inventory buffers, and routing insurance continue to carry a cost. That dynamic keeps a floor under goods inflation even as headline pressures ease. In fixed income, the transmission runs less through near-term rate expectations and more through term premia, as investors demand compensation for geopolitical uncertainty, policy risk, and elevated fiscal supply. The result is a curve that resists flattening and volatility that reappears episodically rather than persistently.
The week ahead: data that can move the narrative
This week’s calendar is dense enough to stress-test the emerging patient-Fed consensus.
Tuesday: December CPI and the NFIB Small Business Optimism Survey. Inflation remains the gatekeeper, particularly core services and shelter. We expect a better-than-feared print, helped by softer grocery prices and easing rent pressure. NFIB sentiment will be closely watched for signs of stabilization.
Wednesday: Retail sales and existing home sales. Control-group sales will shape Q4 GDP tracking and early-year consumer momentum.
Thursday: The Empire State and Philadelphia Fed manufacturing surveys will provide early insight into how manufacturing entered 2026. The data have been volatile, but orders, shipments, and pricing matter more than the headlines.
Friday: Industrial production, capacity utilization, and the NAHB Housing Market Index will round out the week.
The Beige Book will be quietly influential throughout. Confirmation of a low-hire, low-fire labor market would reinforce patience into the spring. With Chair Powell under scrutiny, Fed communication will be parsed less for timing and more for institutional resolve.
Piedmont Perspective
Institutional Home Buying: Populism Meets the Balance Sheet
President Trump’s proposal to limit institutional purchases of single-family homes is best understood as a political signal rather than an economic lever. It speaks to real affordability frustration among younger households, but its economic impact is limited.
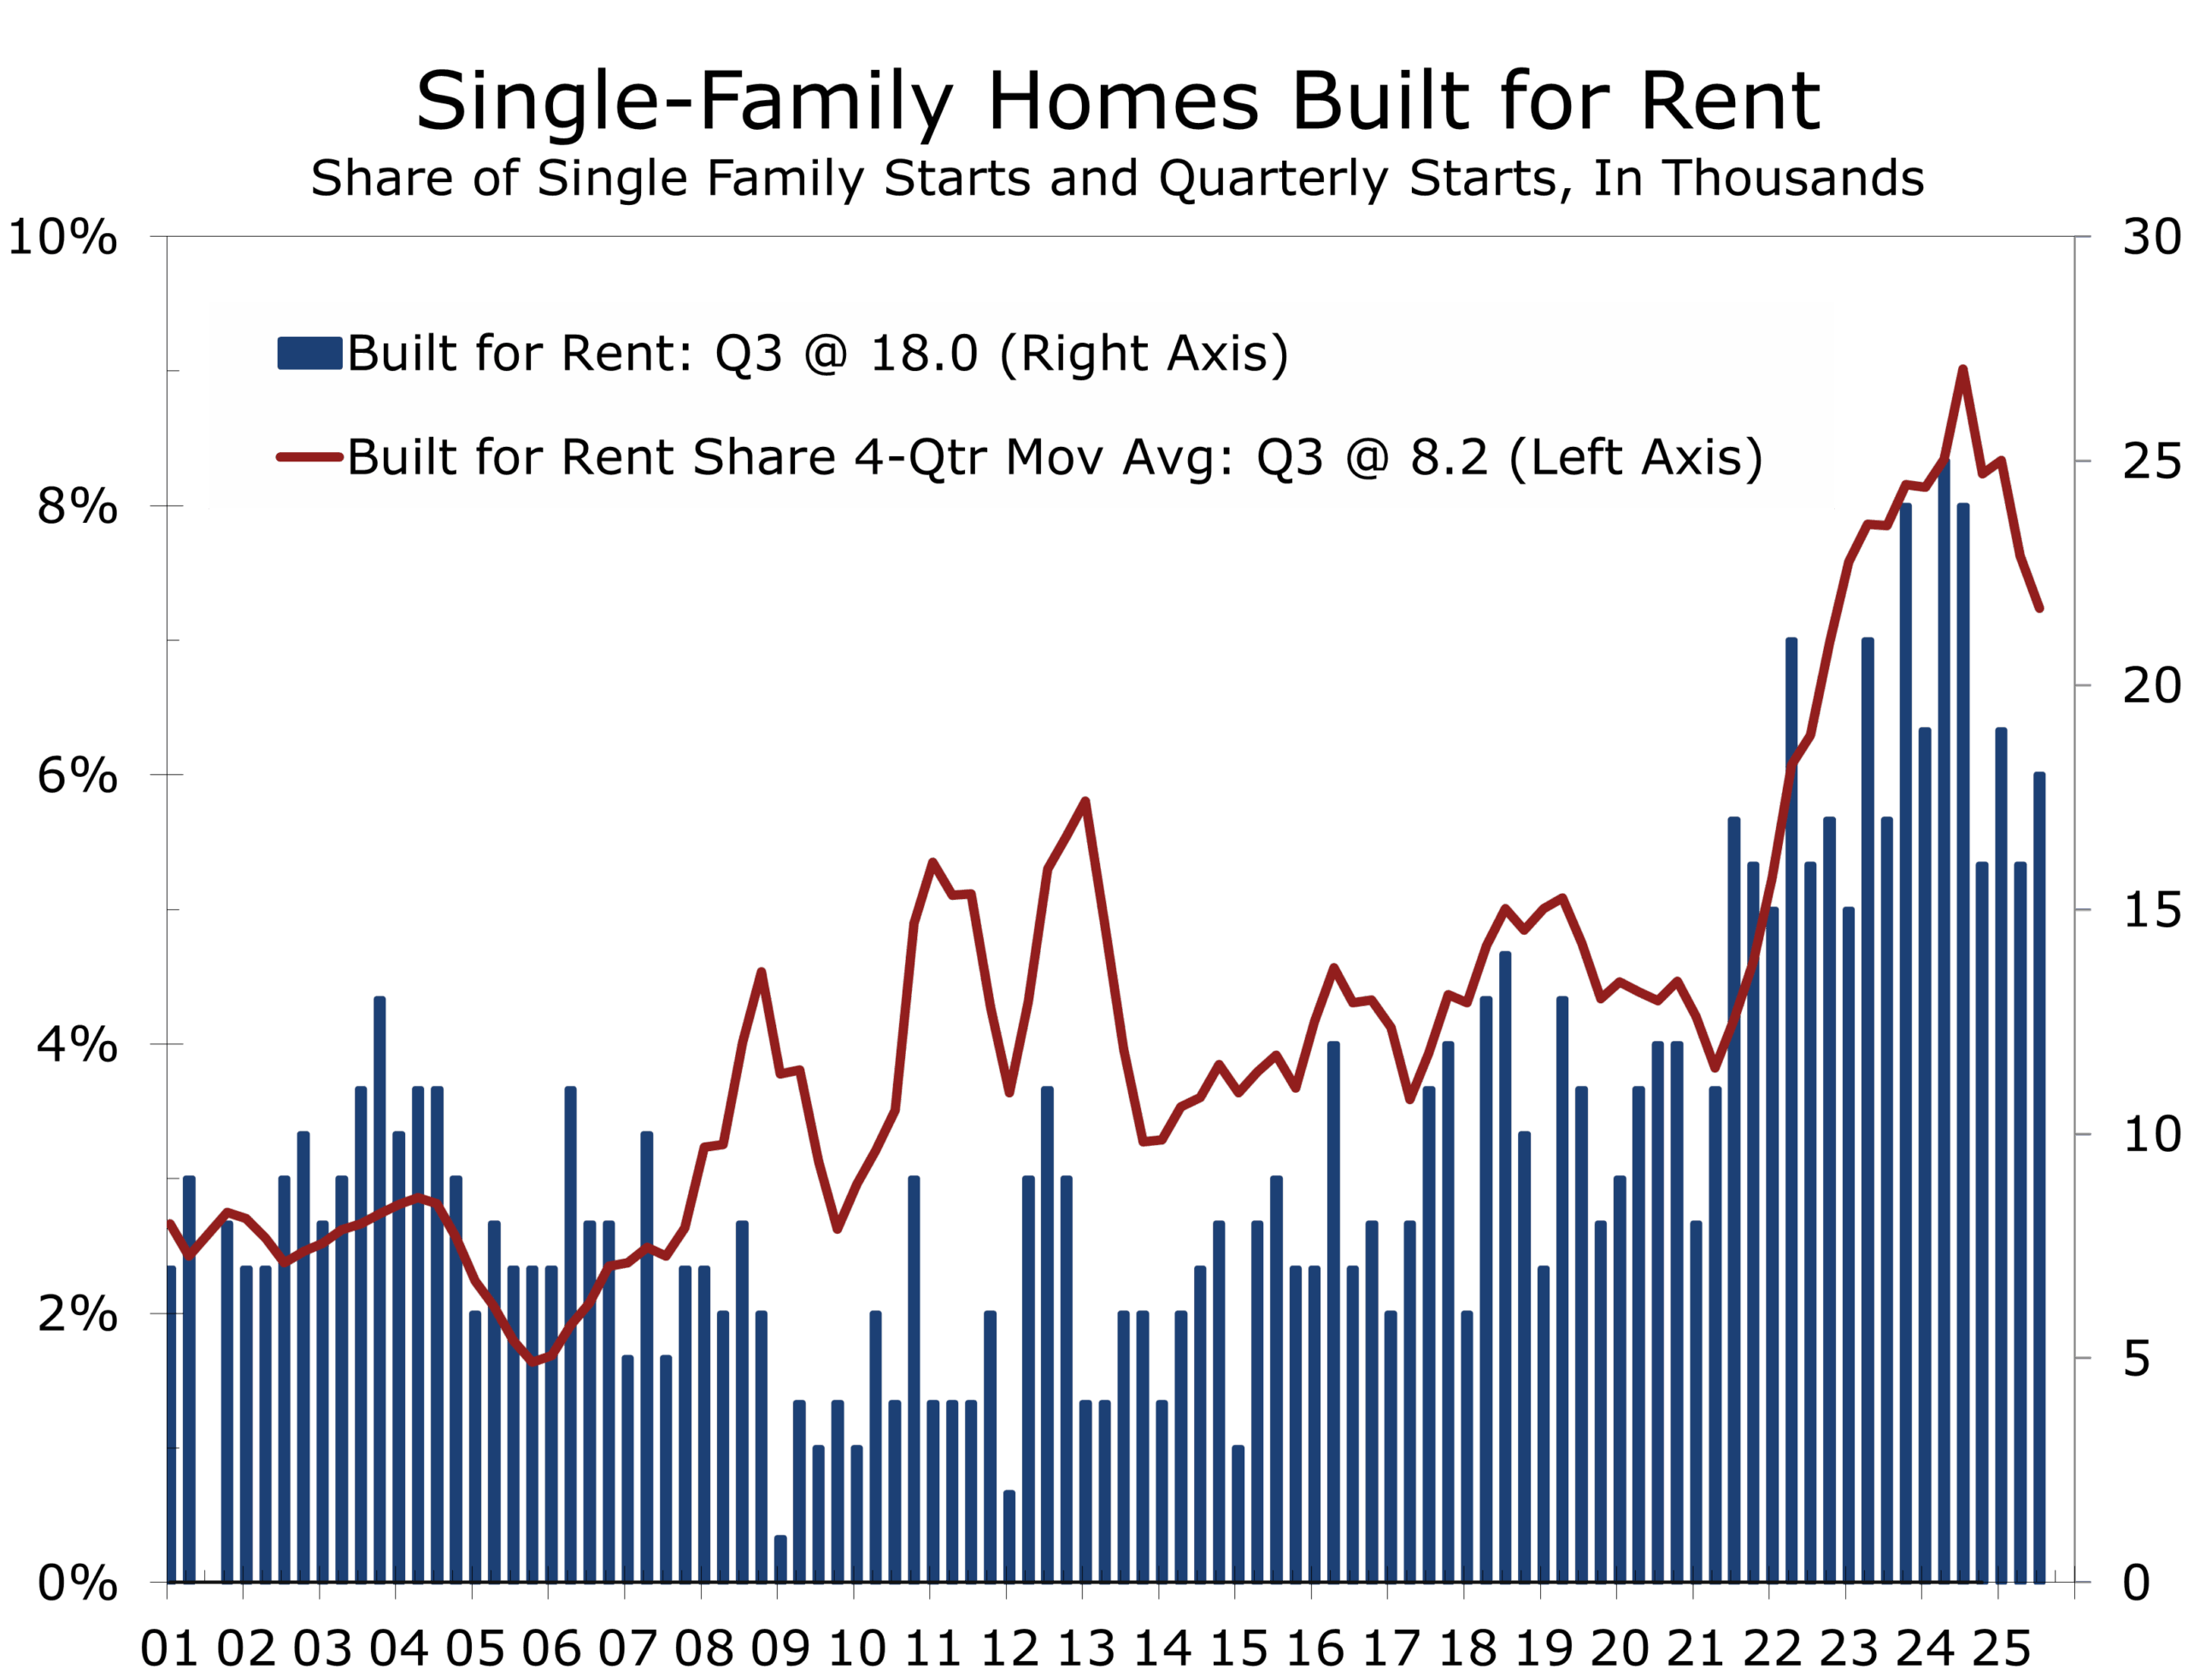
Institutional investors hold only 1–3% of single-family homes nationally and under 5% of single-family rentals. Where they matter is at the margin. Purchase flows can amplify price pressure in fast-growing metros during low-inventory periods, particularly in parts of the Sun Belt and Midwest.
Even there, institutions are not the root cause. The binding constraints are underbuilding, zoning restrictions, infrastructure costs, and in-migration. Since 2022, large institutional buyers have slowed acquisitions, shifted toward build-to-rent, and in some cases become net sellers. Restricting their participation risks slowing one of the few scalable sources of new housing supply without materially improving affordability.
Housing responds to capacity. Policies that expand it tend to work. Policies that constrain it tend to reshuffle ownership while leaving prices largely unchanged.
Disclaimer: This publication has been prepared for informational purposes only and is not intended as a recommendation offer or solicitation with respect to the purchase or sale of any security or other financial product nor does it constitute investment advice.
January 12, 2026
Mark Vitner, Chief Economist
mark.vitner@piedmontcrescentcapital.com
(704) 458-4000
December Employment Report - December Jobs Data Reinforce a Mid-Cycle Rebalance
Cooling Without Cracking
-
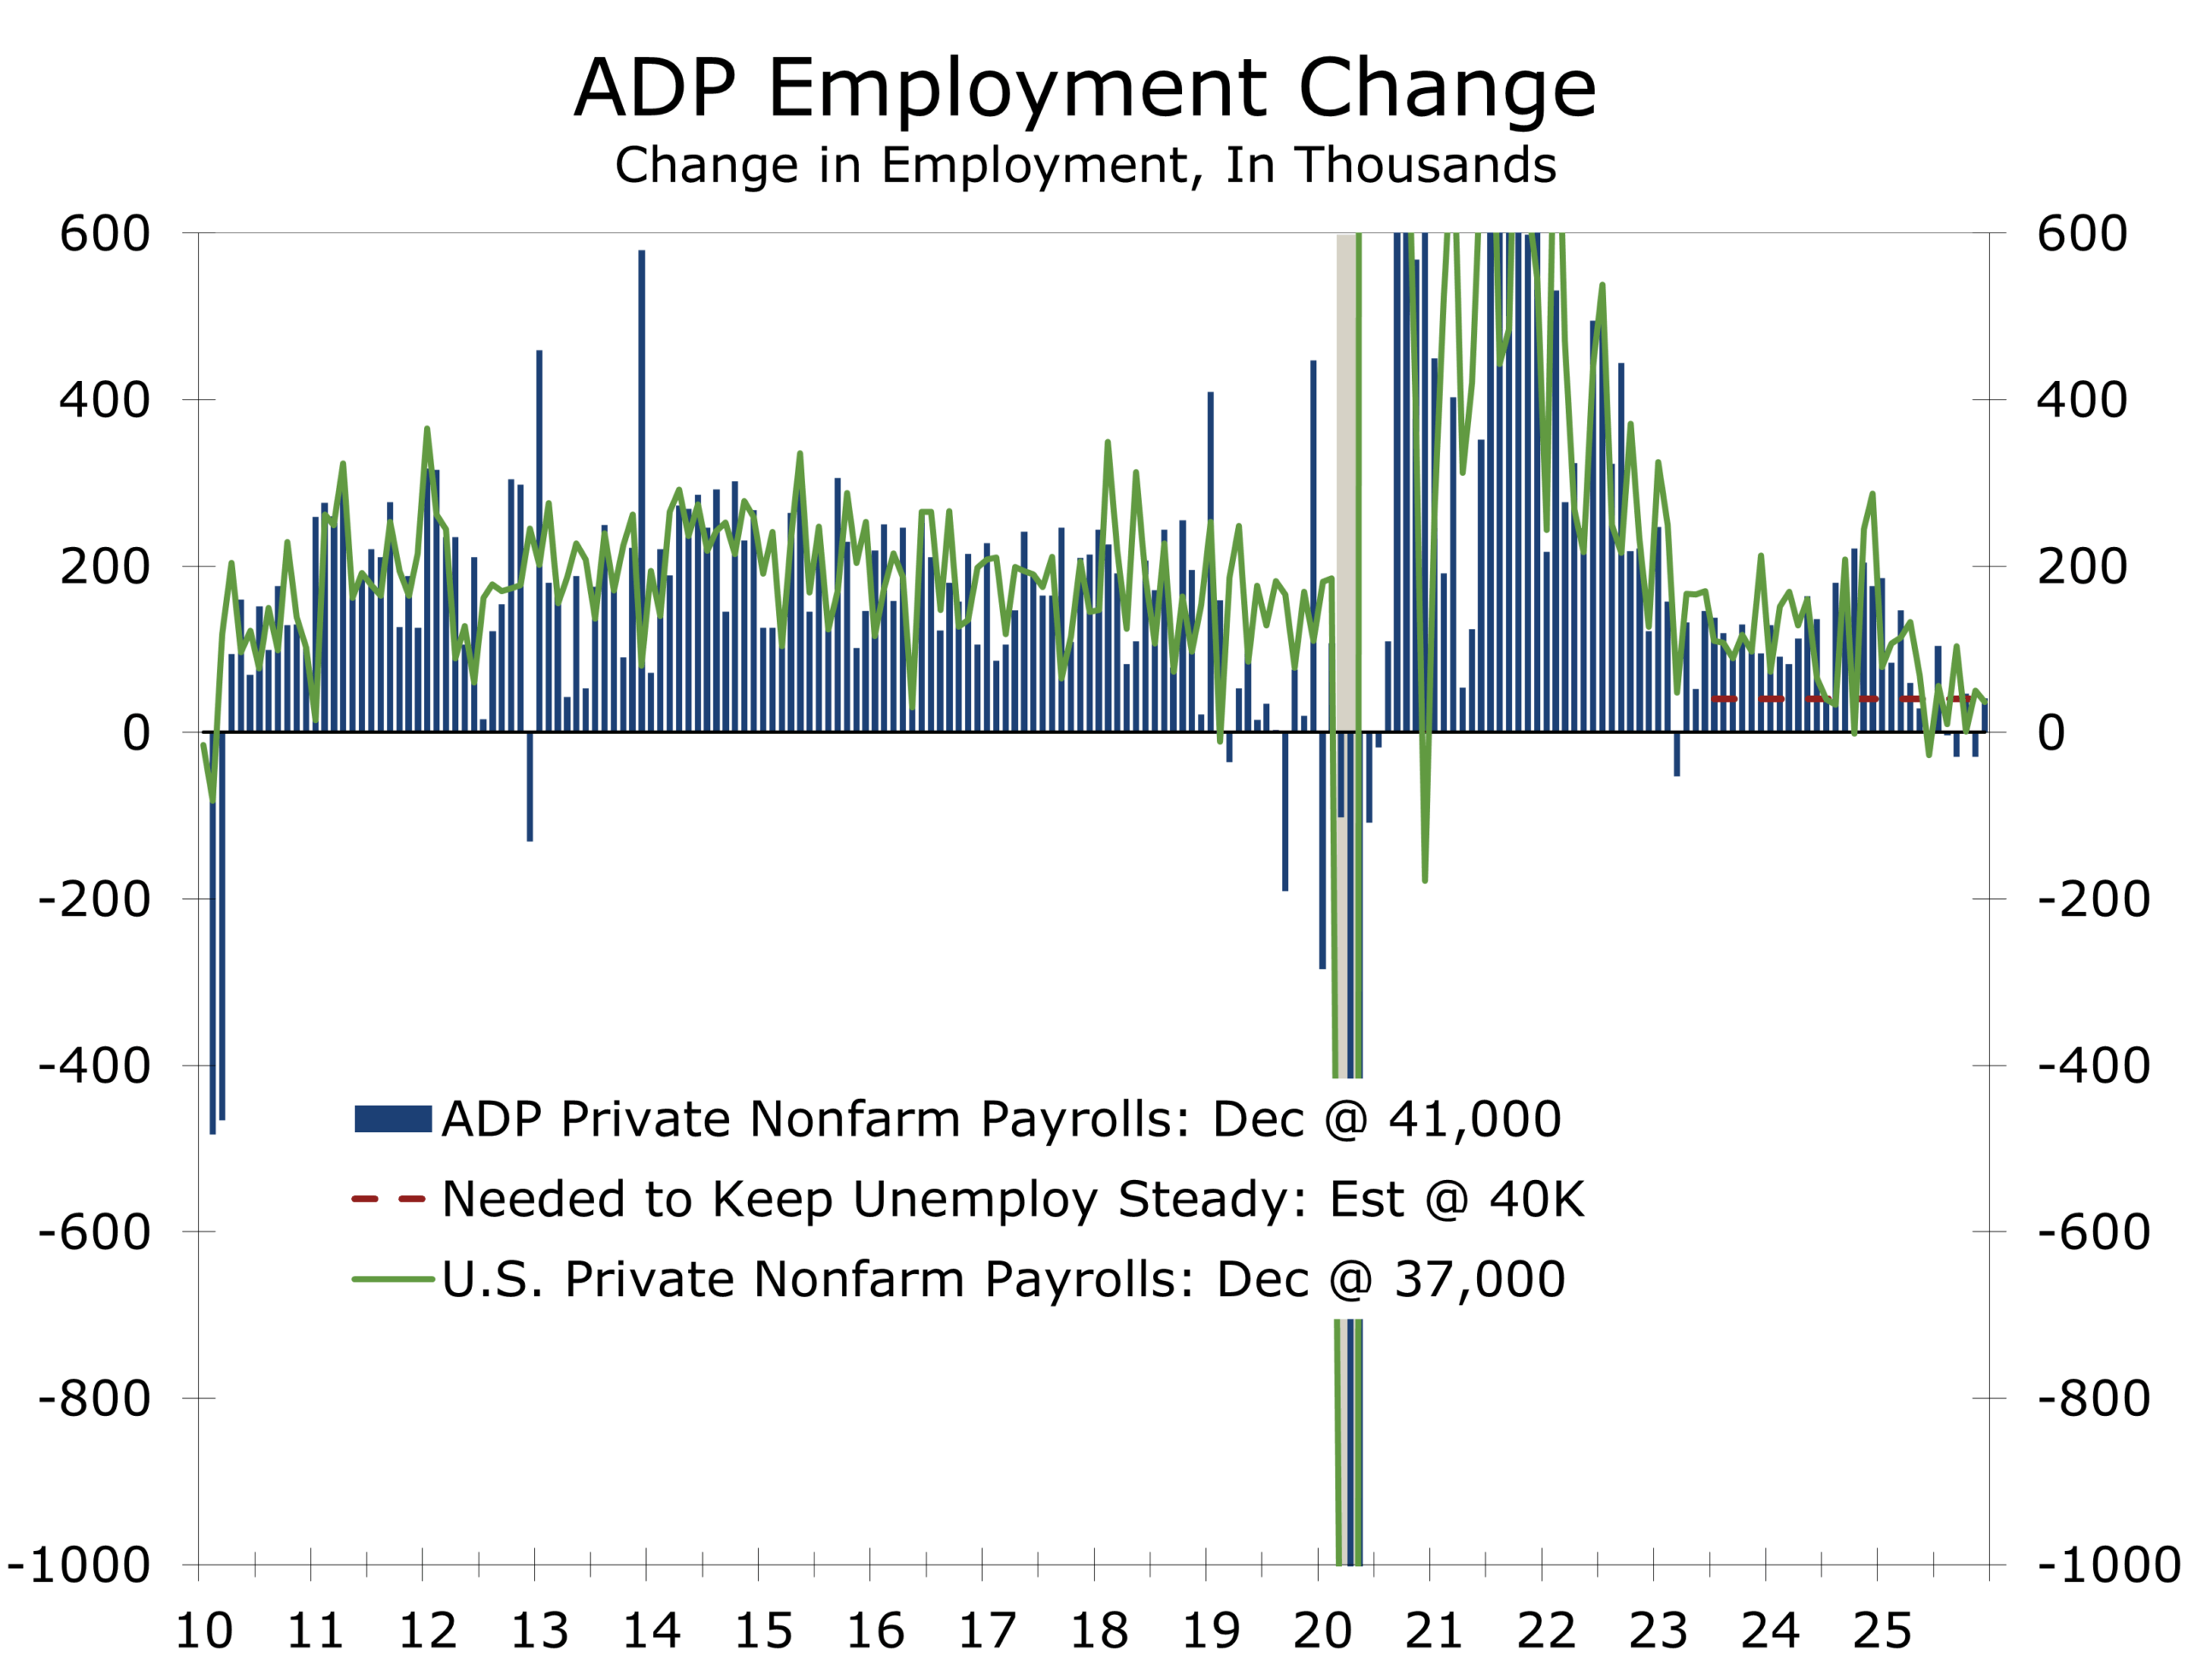
- Payroll growth remains subdued. Nonfarm payrolls rose 50,000 in December, extending the stall-speed pace of job growth that has prevailed through much of the second half of 2025.
- Job gains remain narrowly concentrated in health care, social assistance, and food services. Most other major sectors showed little or no change.
- The unemployment rate held at 4.4%, unchanged on the month, but measures of labor underutilization continue to creep higher.
- Wage growth continues to cool. Average hourly earnings rose 0.3% in December and are up 3.8% year over year, consistent with a disinflationary labor market.
- Unemployment is drifting higher—but unevenly. The jobless rate rose to 4.6%, the highest since October 2021, driven largely by labor-force reentrants and concentrated among younger workers.
- Hours worked declined again. Firms continue to manage labor input through hours rather than headcount, a classic late-cycle adjustment.
- The December jobs report supports a policy pause: Federal job cuts and reduced hours mask private-sector resilience, while cooling wages and solid productivity argue for the Fed to hold rates steady in January rather than respond to labor-market stress.
Momentum Fades as Slack Continunes to Gradually Build
December’s employment report confirms that the U.S. labor market is no longer tightening and is instead operating in a lower-growth, mid-cycle equilibrium. Payroll gains of 50,000 were modest, and downward revisions to October and November subtracted a combined 76,000 jobs, reinforcing the view that underlying momentum has been softer than initially reported.
Employers added just 584,000 net new jobs in 2025, a sharp deceleration from the 2.0 million job gain in 2024. Hiring is no longer keeping pace with prior expansionary norms, but neither is it collapsing. This is an economy cooling without breaking.
Job growth has slowed to a pace that barely offsets labor-force growth.
Job Growth Barely Offsets Labor Force Expansion
The unemployment rate remained at 4.4%, with 7.5 million unemployed, little changed on the month. The labor force participation (62.4%) and the employment-population rate (59.7%) were also stable, suggesting that headline labor market conditions remain resilient amidst a lingering hiring slowdown.
Beneath the surface, however, slack continues to accumulate. Long-term unemployment rose to 1.9 million, accounting for 26% of all unemployed, and is up nearly 400,000 over the year. This reflects a labor market where re-employment is becoming more difficult at the margin.
At the same time, part-time employment for economic reasons climbed to 5.3 million, nearly 1 million higher than a year ago, indicating that firms are increasingly trimming hours rather than payrolls.
Underemployment is rising even as the headline unemployment rate remains stable.
Hiring Remains Narrow and Service-Sector Heavy
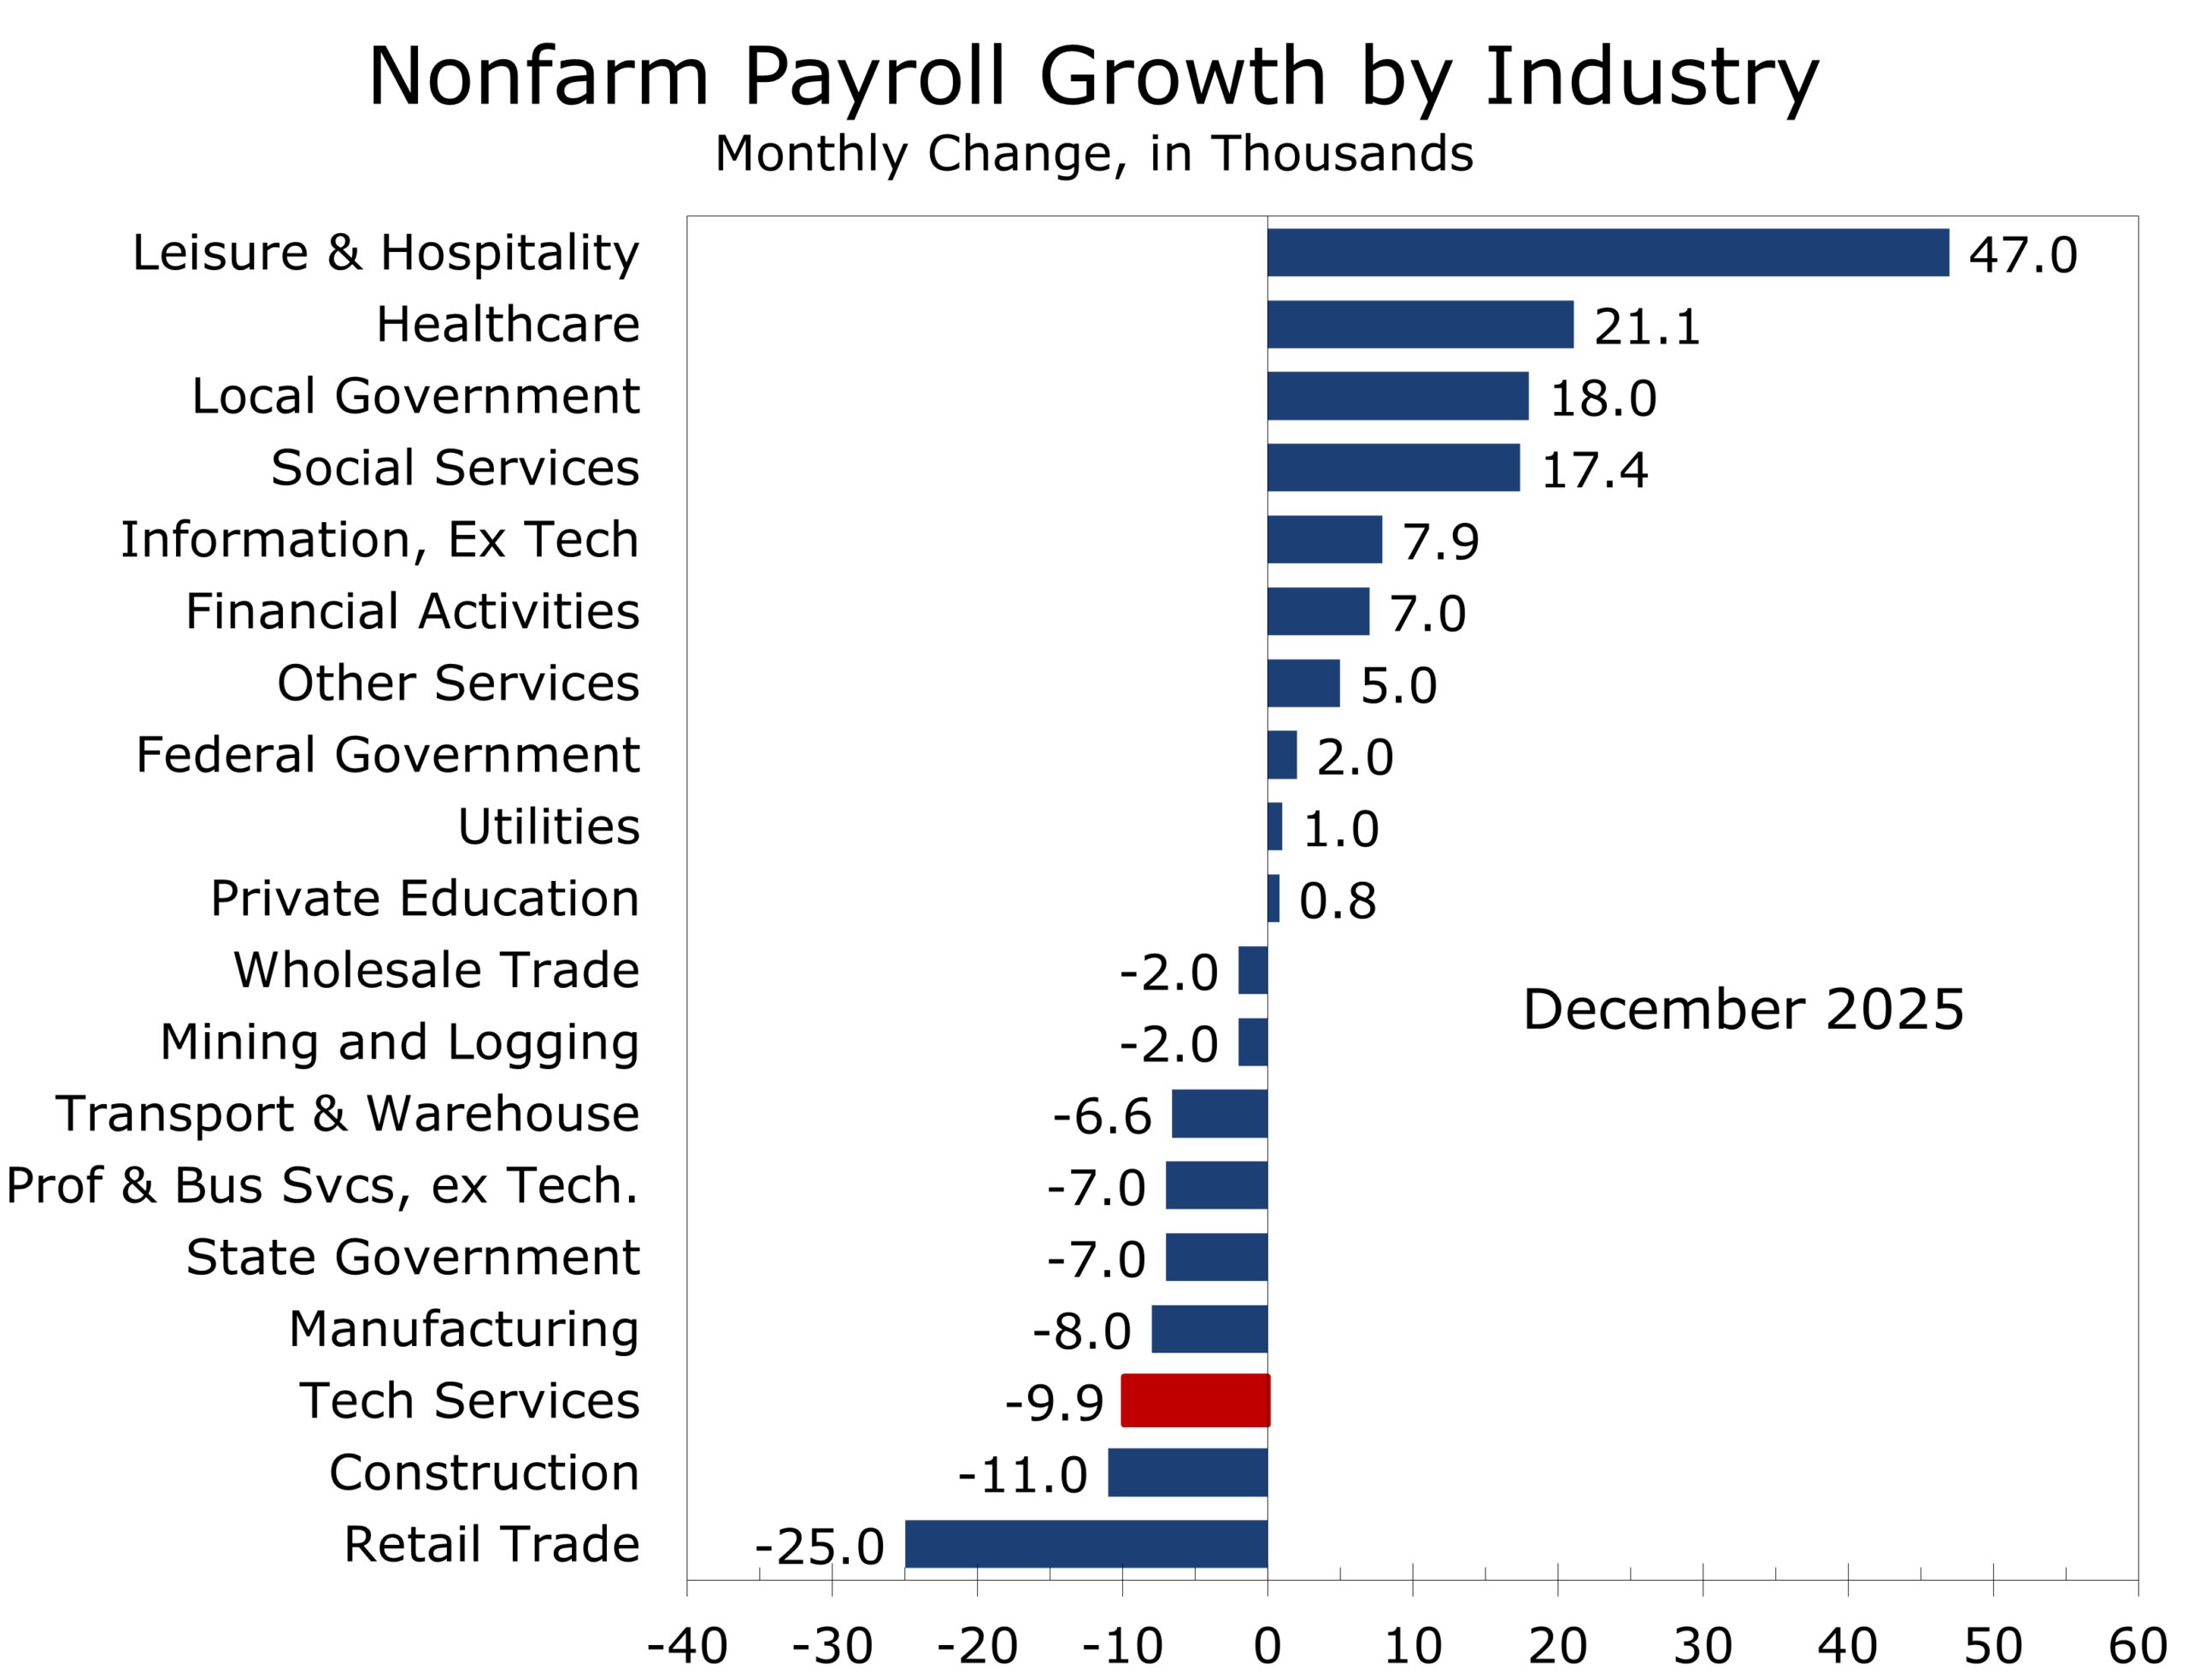
Sectoral detail underscores the late-cycle character of the labor market. Food services and drinking places added 27,000 jobs. Health care employment rose by 21,000, led by hospitals. Social assistance increased by 17,000, primarily in individual and family services. These categories account for virtually all net job creation in December.
Elsewhere, hiring stalled. Manufacturing, construction, professional and business services, financial activities, information, wholesale trade, and transportation and warehousing all showed little or no change. Hiring within the tech sector is a notable soft spot, with tech employers cutting 9,900 jobs in December and 61,000 jobs over the past 12 months.
Retail trade lost 25,000 jobs, concentrated in general merchandise and grocery stores. This appears structural rather than cyclical, reflecting productivity gains, automation, and ongoing shifts in retail formats rather than a sudden pullback in consumer demand. The drop was also exaggerated by seasonal factors.
Federal government employment was little changed in December but remains a significant drag. Since peaking in January, federal payrolls are down 277,000 jobs, or 9.2%, reflecting post-pandemic normalization and DOGE-related retirements. These cuts continue to distort headline payroll growth and mask modest private-sector resilience.
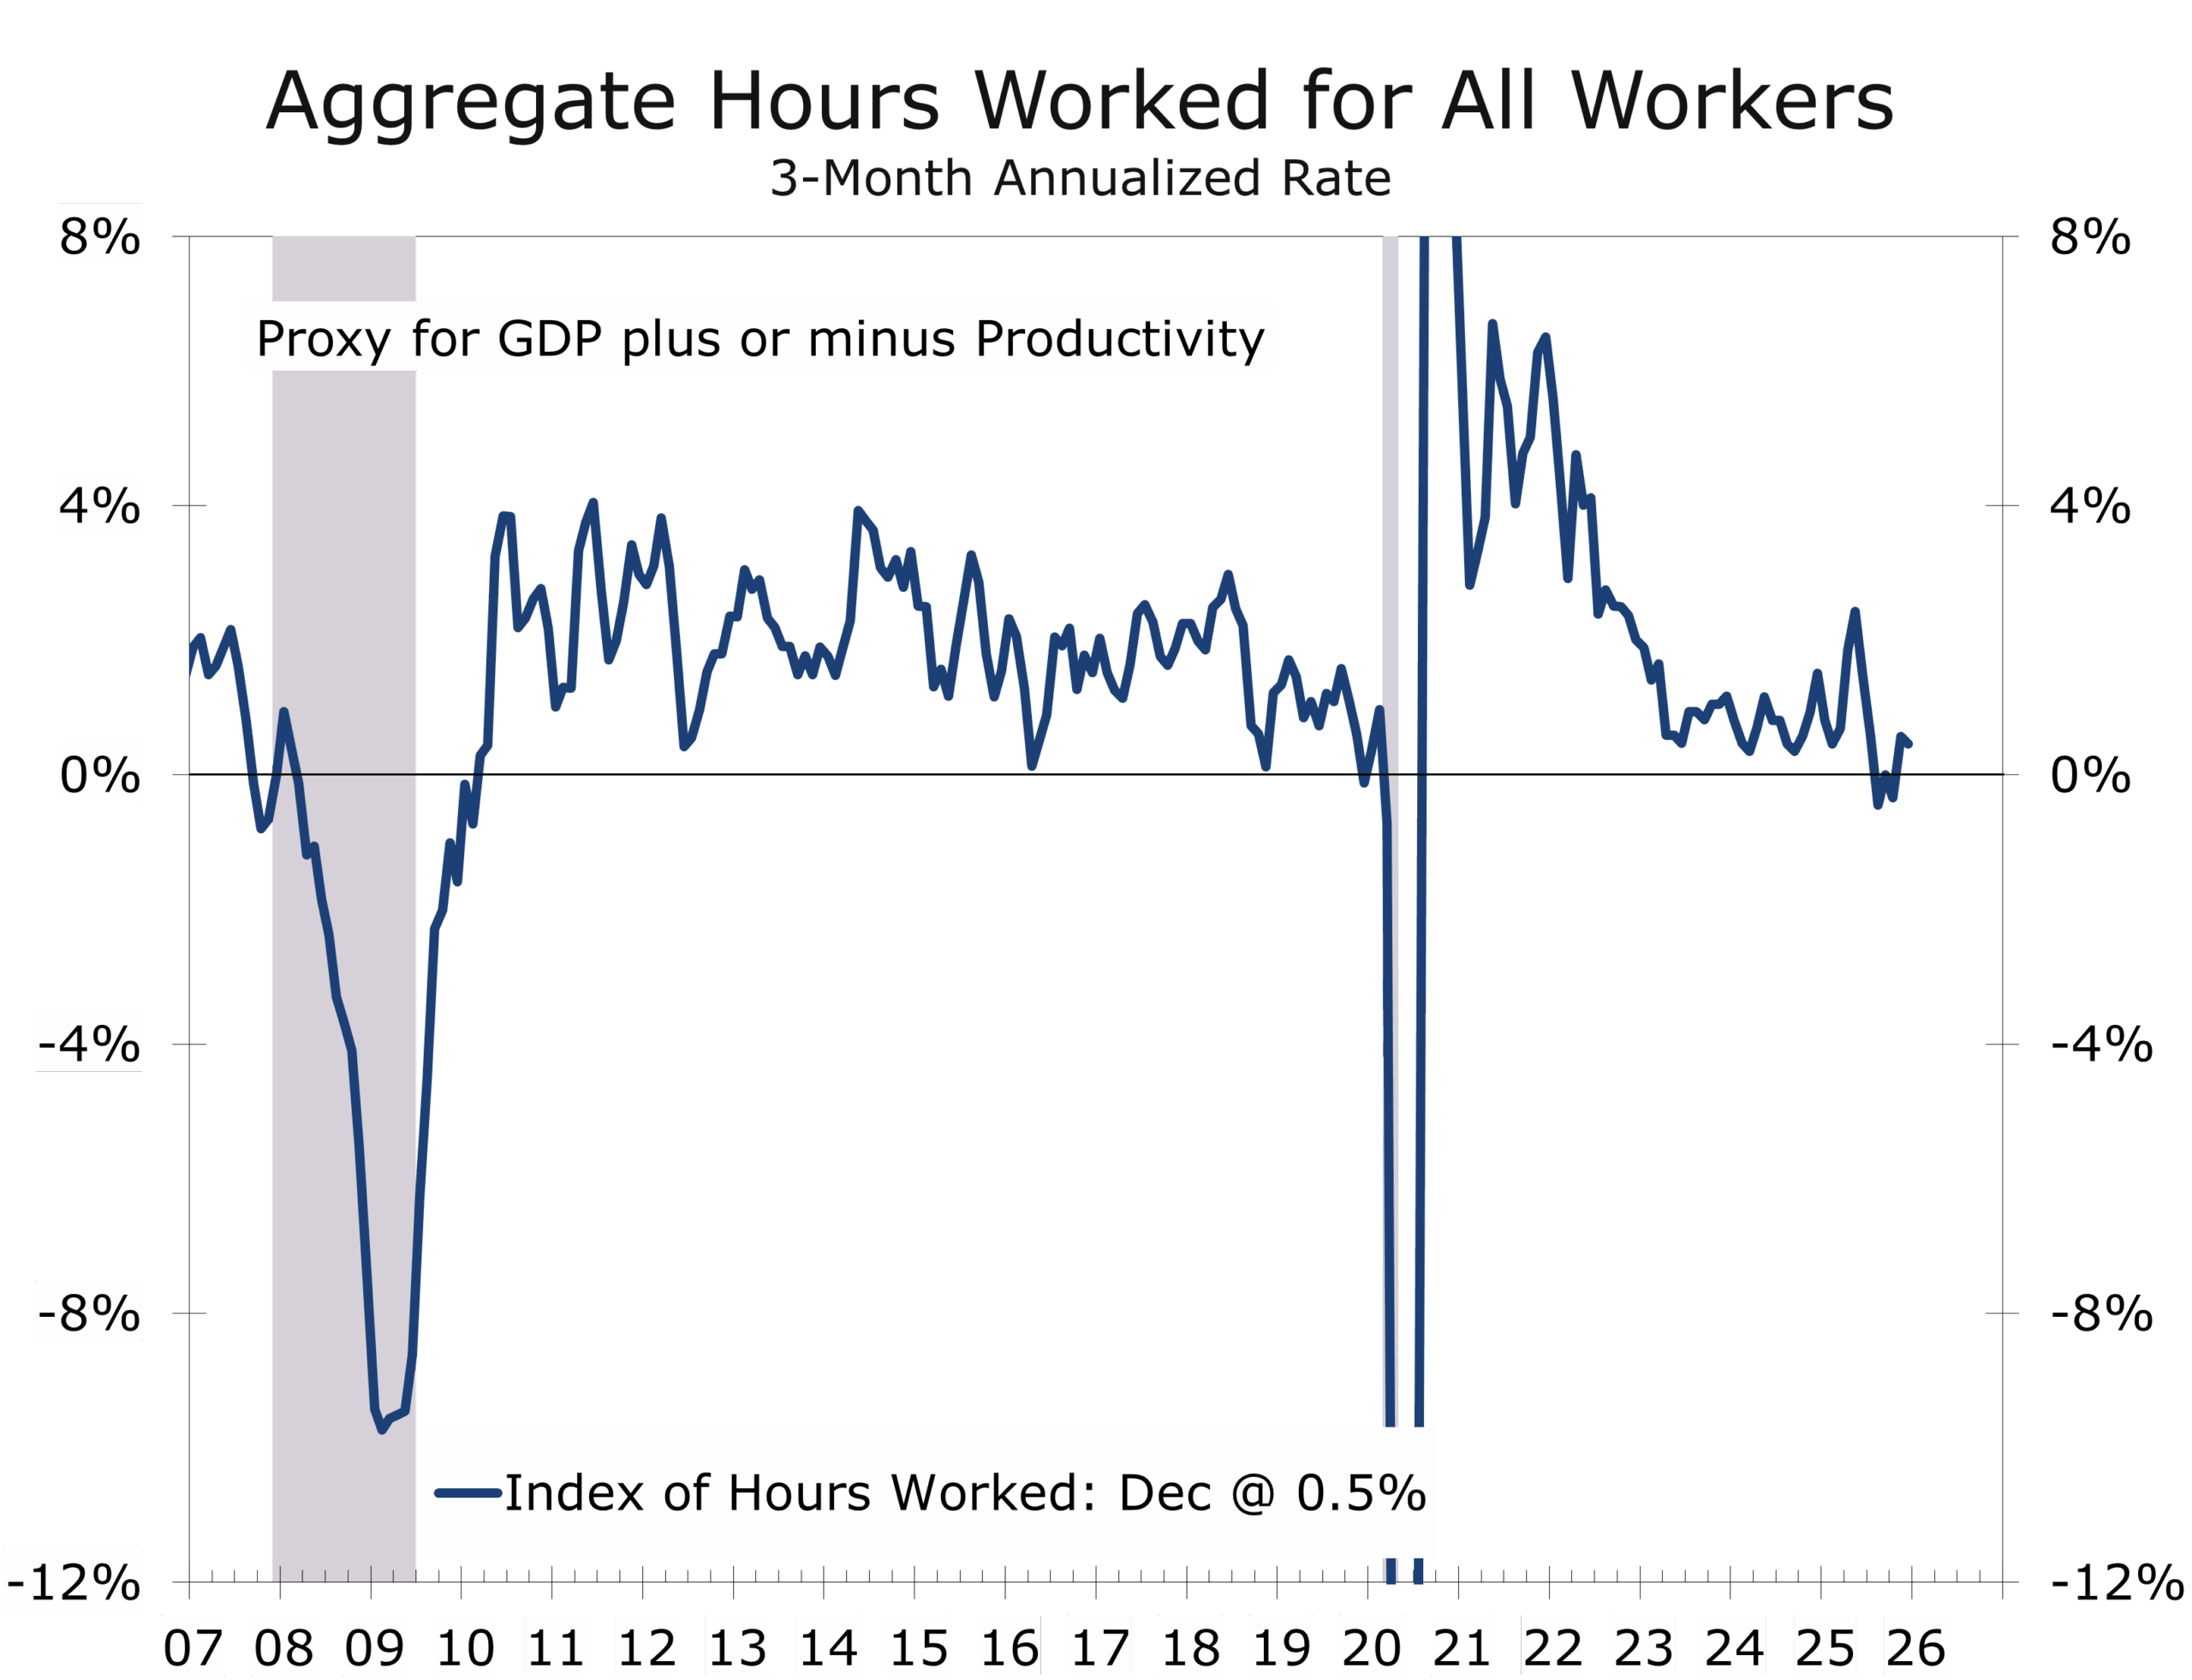
Average hourly earnings rose 0.3% in December and are up 3.8% year over year, a pace consistent with the Federal Reserve’s inflation objective when paired with productivity growth. The average workweek edged down to 34.2 hours, while the manufacturing workweek slipped to 39.9 hours. Overtime hours were unchanged, and aggregate hours worked fell 0.3% in December and rose at just a 0.5% annualized pace in the fourth quarter.
The adjustment continues to occur through hours rather than headcount, signaling caution without distress. Productivity remains sufficient to support real GDP growth near 2.5% in the fourth quarter.
This is not a collapsing labor market. It is a rebalancing one. Hiring has slowed materially, wage growth is cooling, and underutilization is rising at the margins. Yet layoffs remain contained, participation is stable, and service-sector demand continues to absorb labor.
Disclaimer: This publication has been prepared for informational purposes only and is not intended as a recommendation offer or solicitation with respect to the purchase or sale of any security or other financial product nor does it constitute investment advice.
January 9, 2026
Mark Vitner, Chief Economist
(704) 458-4000
A Capital-Led Expansion, a Tech-Driven Cycle, and Why Charlotte Stands Out in 2026
Capital Carries the Cycle
- The U.S. economy is slowing, not sliding into recession. Growth is decelerating as hiring cools and consumers become more selective, but underlying demand remains intact.
- The expansion is being carried by capital, not consumption. Private fixed investment in AI infrastructure, power, advanced manufacturing, aerospace and defense, and life sciences remains the primary growth engine.
- Productivity is rising as payroll growth fades. Firms are producing more with fewer workers, signaling a job-light, capital-intensive phase rather than cyclical retrenchment.
- Policy uncertainty is raising the bar, not stopping investment. Capital is still being deployed, but with greater emphasis on scale, execution, and long-term returns.
- Charlotte is positioned to outperform. Its financial services depth, energy and infrastructure advantages, logistics connectivity, and expanding technology ecosystem align well with a capital-heavy, productivity-driven cycle.
A Productivity-Led Expansion
As the U.S. economy enters 2026, growth is cooling but not cracking. The December CAVU Compass captures this phase well: an economy pulling in different directions, with consumer spending becoming more selective, hiring slowing sharply, and policy uncertainty remaining elevated. Beneath those surface frictions, capital spending continues to anchor the expansion. For technology companies, that distinction matters. This is not a demand-driven slowdown. It is a transition toward a more capital-intensive, productivity-led cycle.
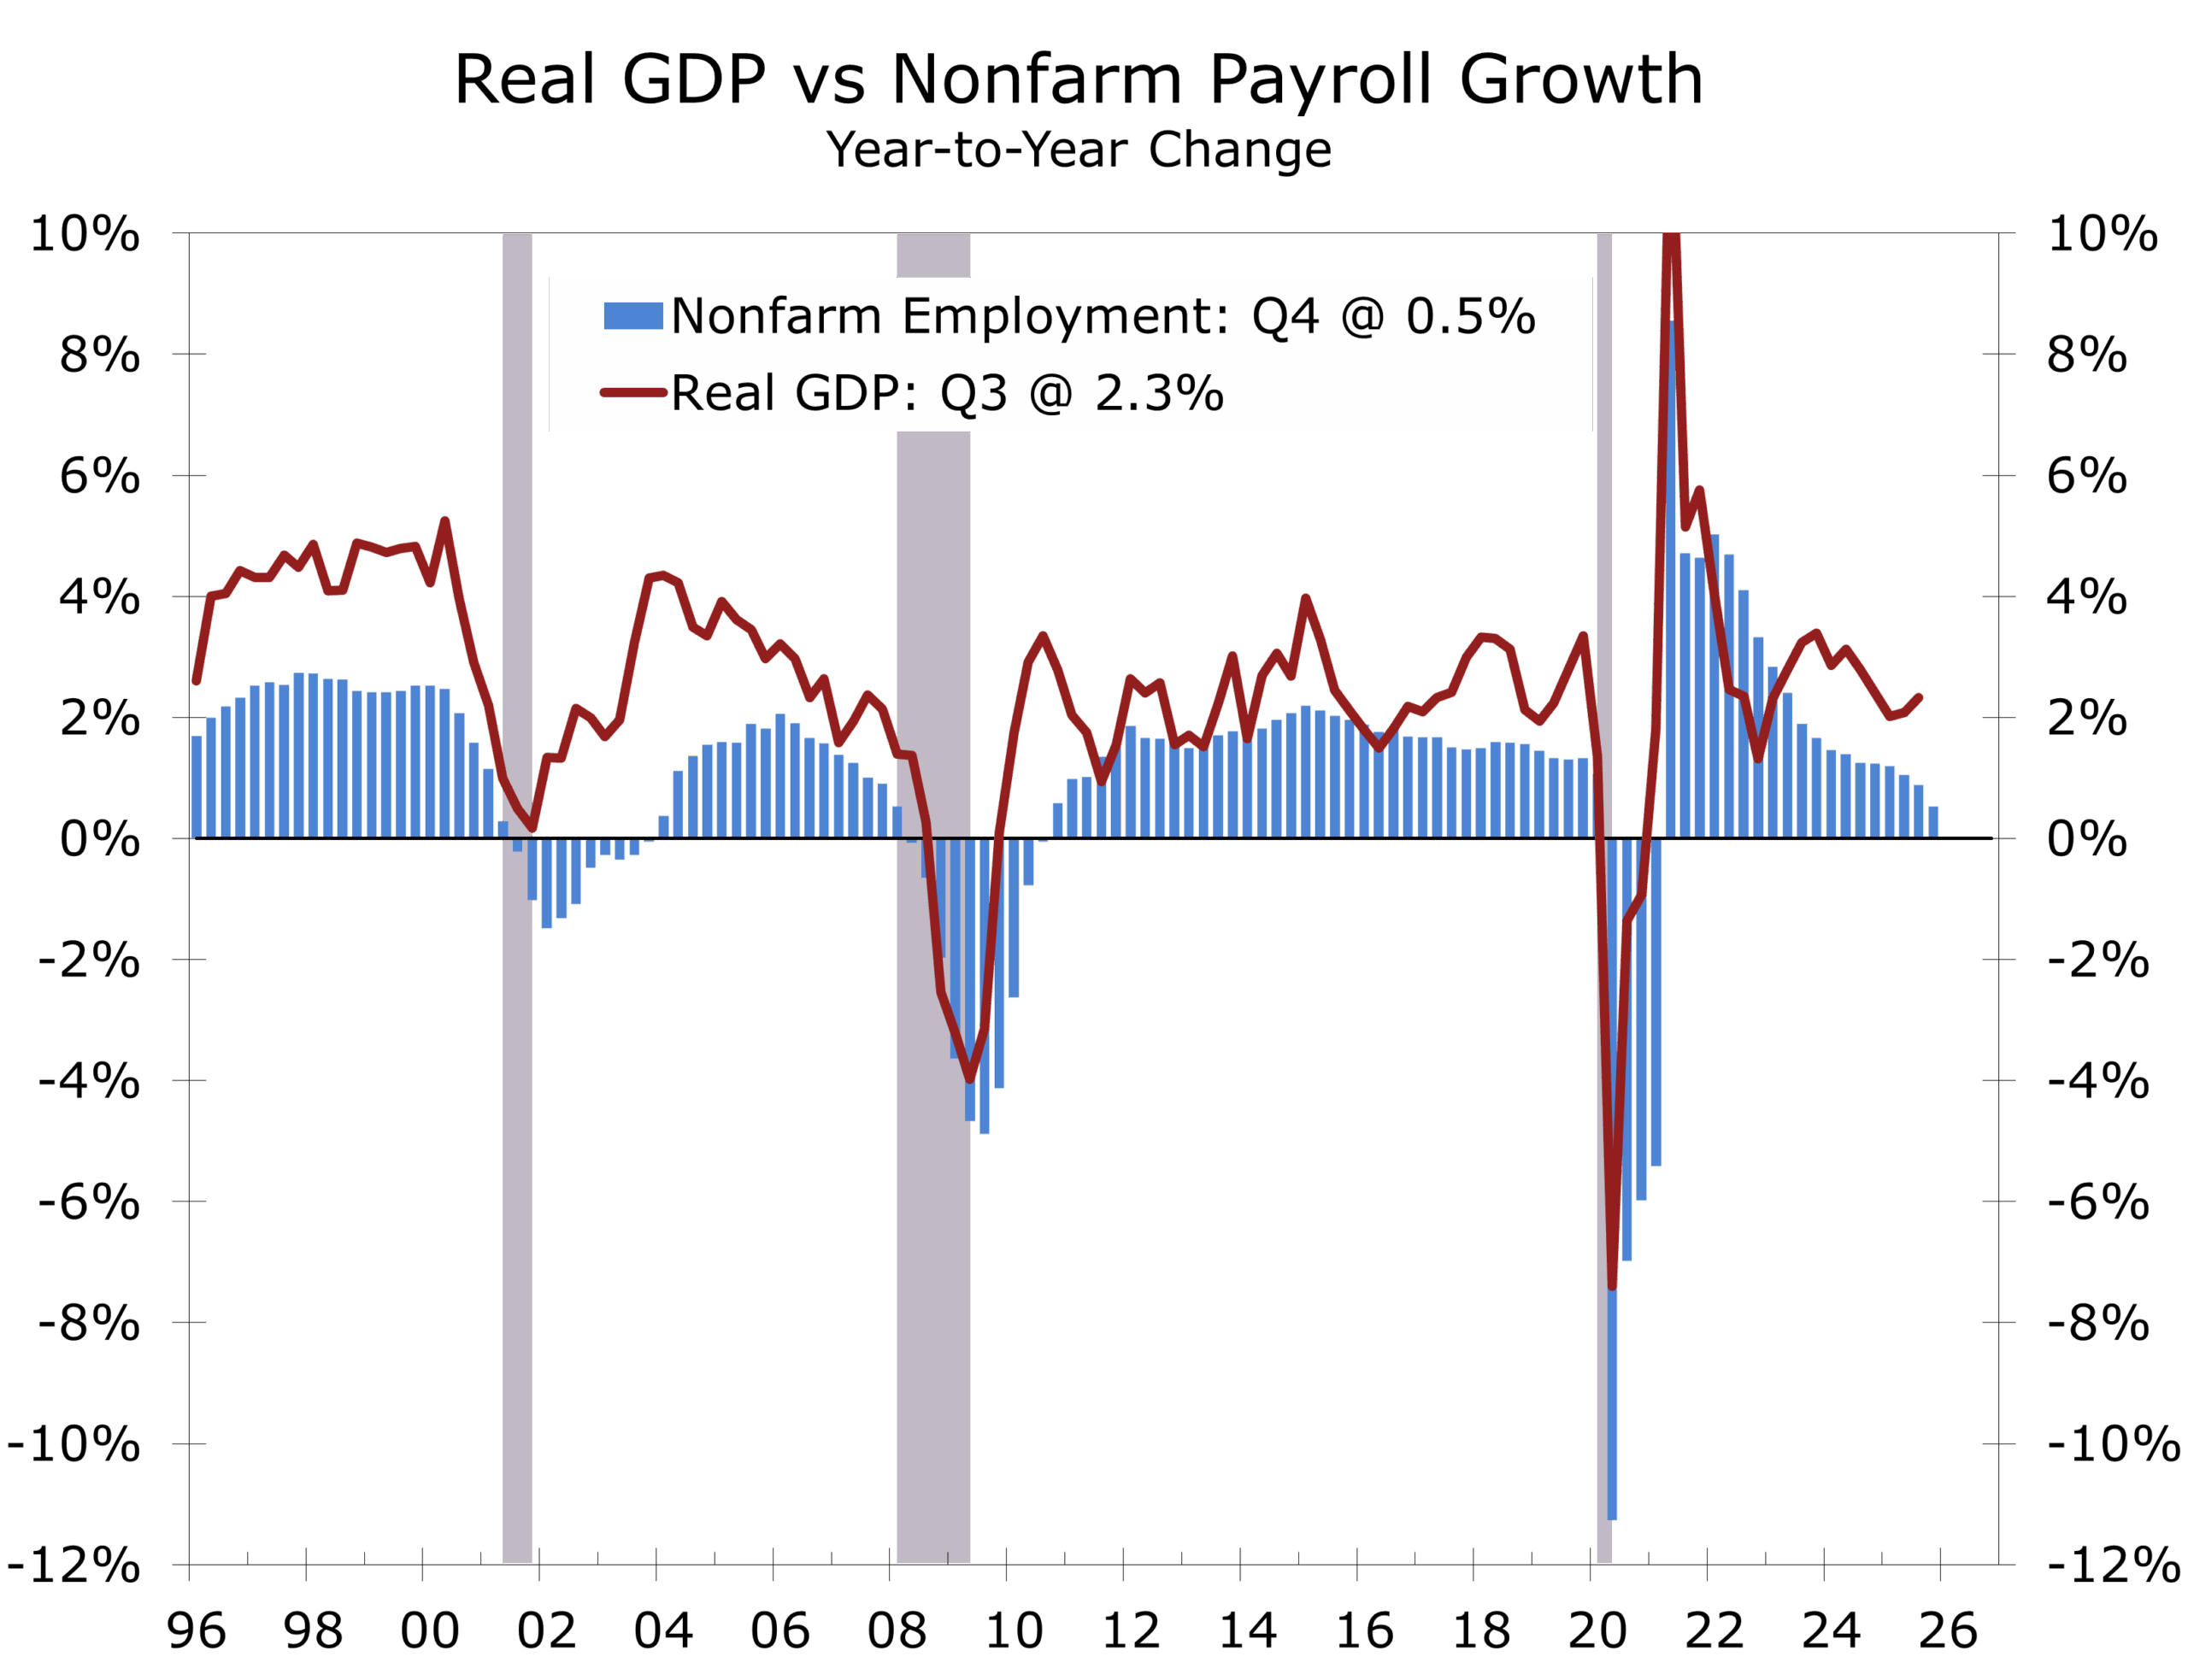
This is not a demand problem; it is a productivity shift. The economy is producing more with fewer new workers.
The backbone of the cycle remains private fixed investment. AI infrastructure, power and energy systems, aerospace and defense, biopharma, and advanced manufacturing continue to attract capital at scale. These are not short-cycle bets tied to consumer sentiment; they are long-duration investments driven by returns, resilience, and geopolitical recalibration. Arguments that growth would falter “without AI” miss the point. Capital would still flow to its highest risk-adjusted return. AI is simply where capital is flowing today, as expected risk-adjusted returns remain unusually attractive and AI use shifts from experimental to everyday applications.
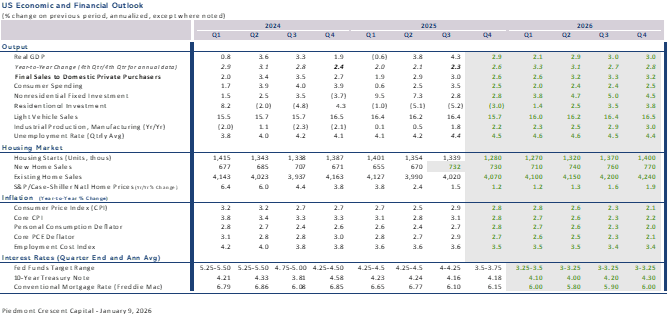
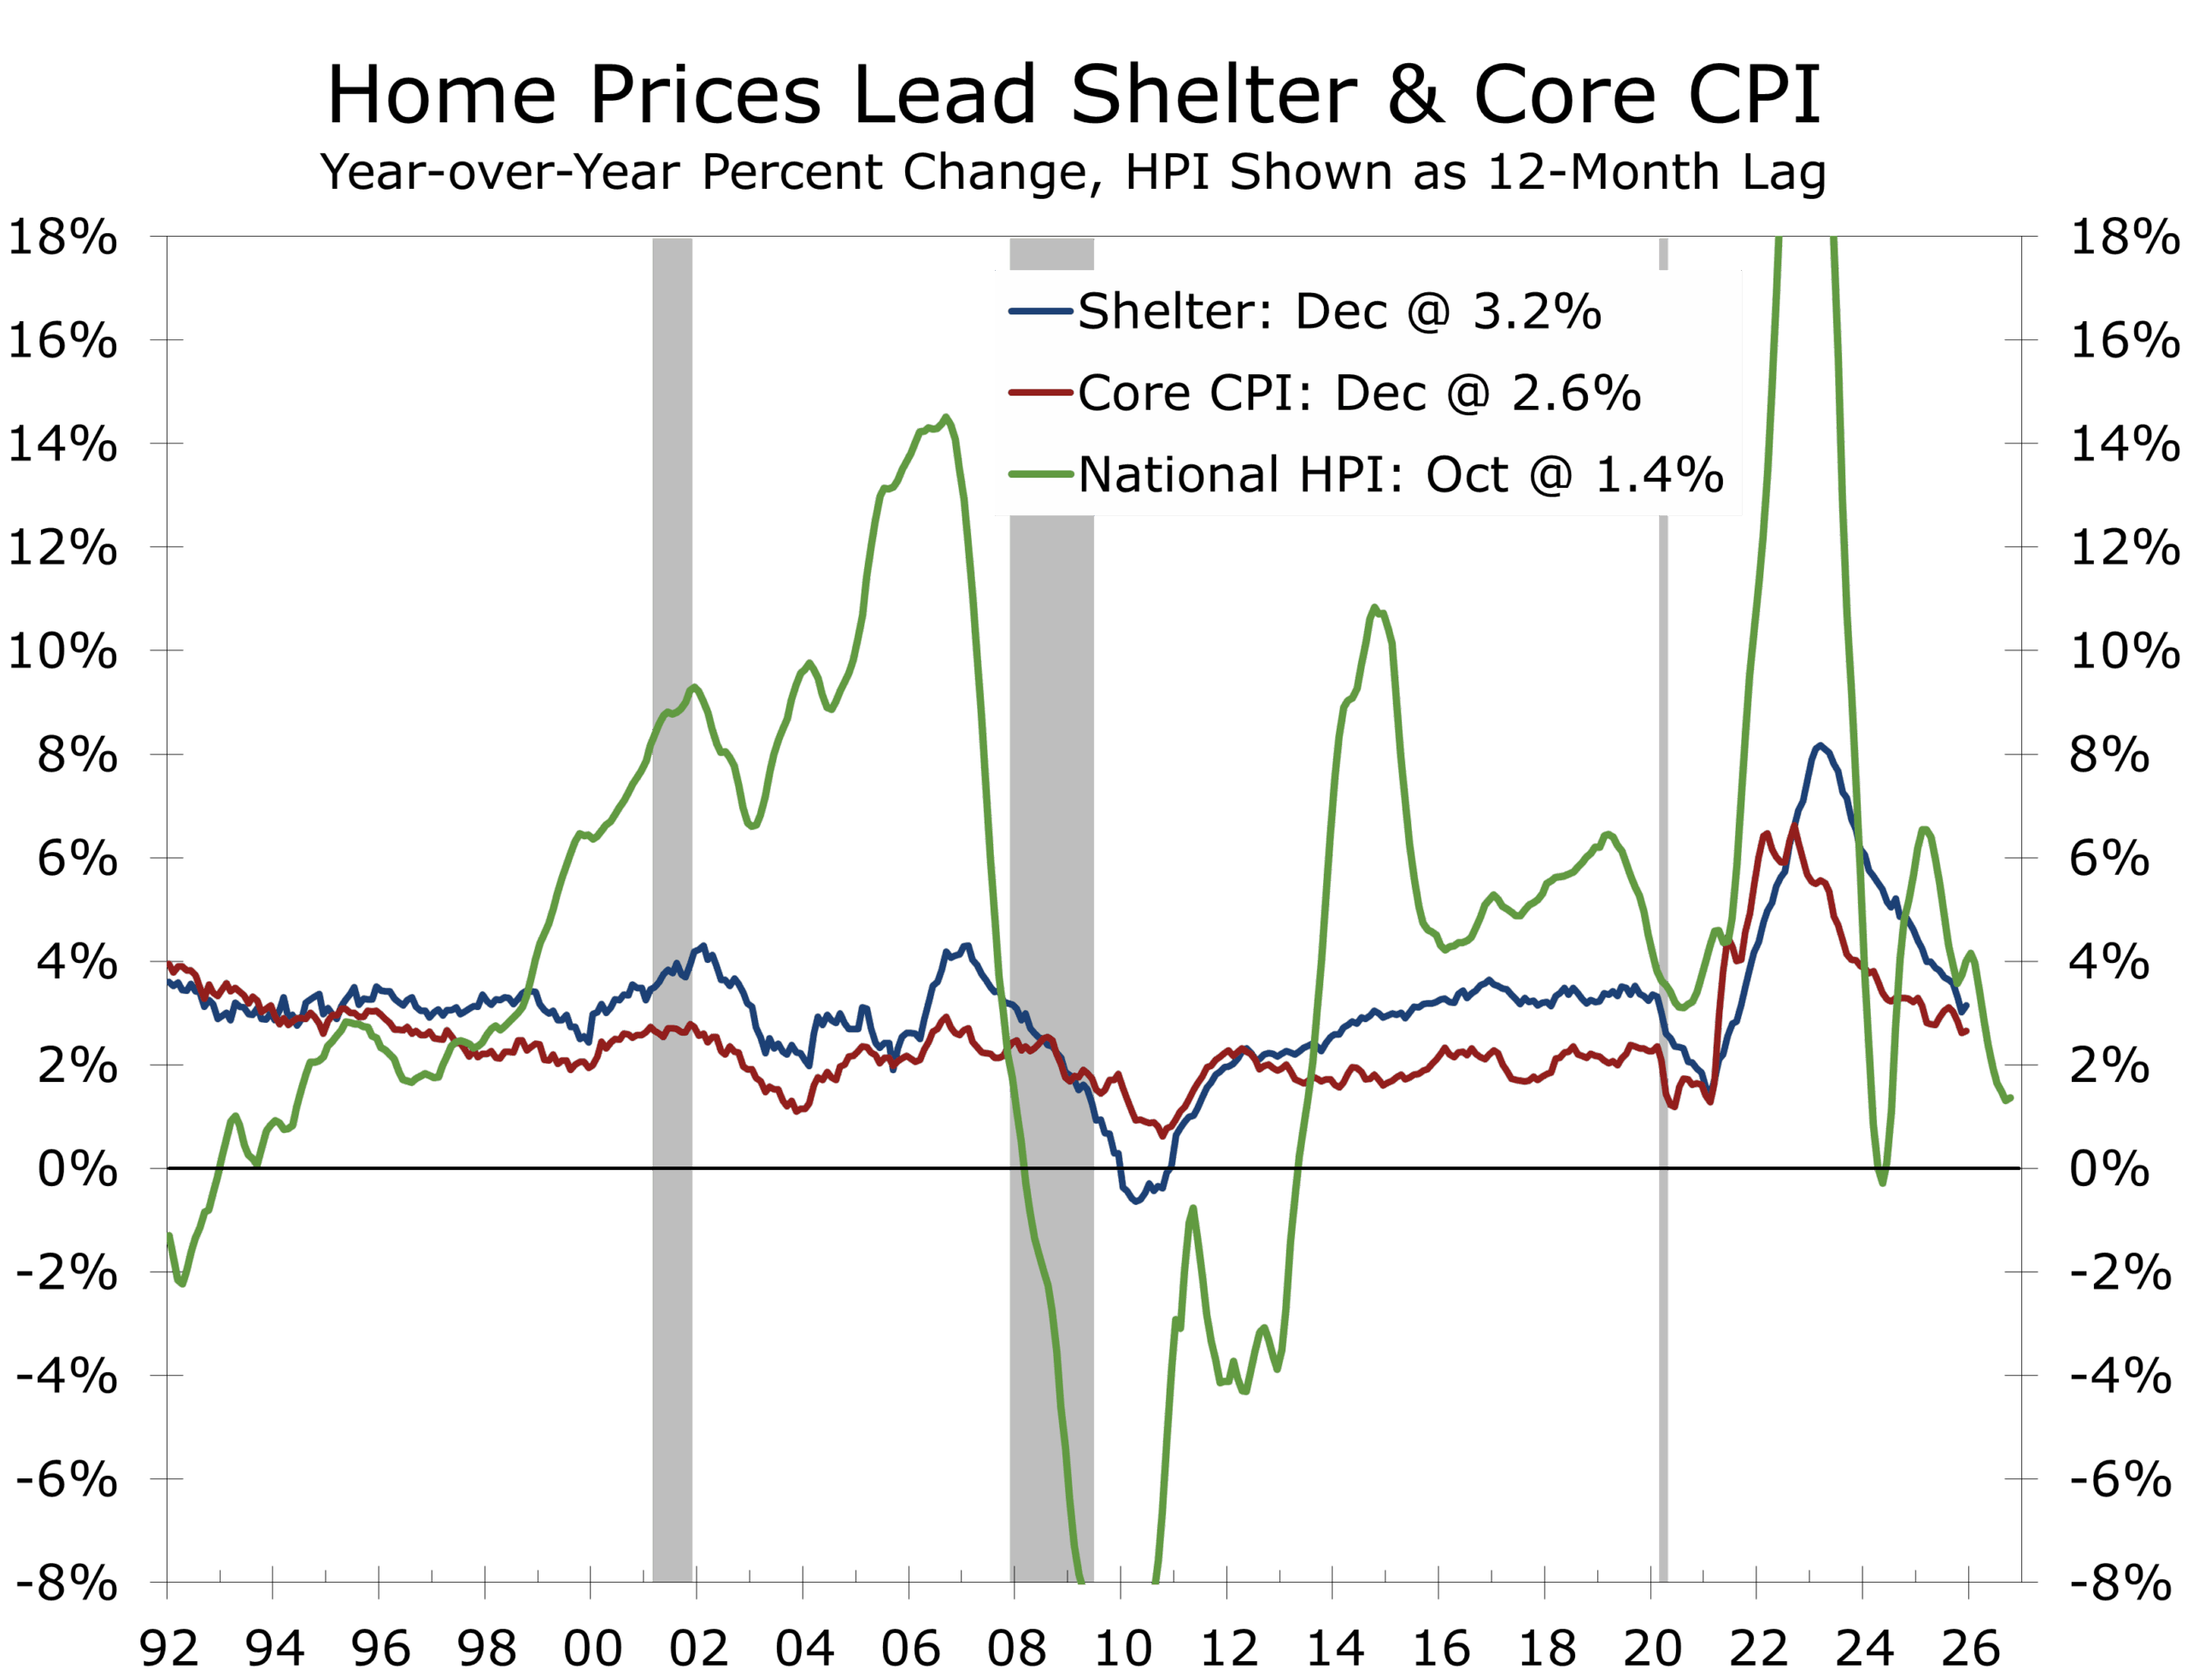
Inflation dynamics reinforce this constructive backdrop. Tariffs briefly interrupted the disinflation trend in 2025, but their inflationary impulse has largely passed. More importantly, shelter inflation—which accounts for roughly 44% of core CPI—is now decelerating as home prices flatten and rental supply rises. Our 2026 forecast calls for shelter CPI inflation to slow to 3% or less, pulling core inflation back under 2.5% by year-end. For technology firms, this matters less for headline inflation and more for margin stability and planning certainty.
Labor-market dynamics further underscore the shift underway. Early 2026 is shaping up as a near-jobless expansion, with payroll growth hovering near zero before improving later in the year. Demographics, tighter immigration enforcement, and slower labor-force growth are restraining hiring even as output holds up. Employers are not aggressively cutting staff, but they are increasingly reluctant to add headcount. This divergence is not a warning sign; it is a signal. Demand for automation, AI orchestration, workflow optimization, and data-driven productivity tools tends to rise precisely in this environment.
Businesses are increasingly worried about being left behind as competitors implement AI more effectively.
Regional divergence is widening as these forces play out, and this is where Charlotte clearly separates from many of its peers. While job growth has slowed in metros such as Raleigh, Nashville, Tampa, and Austin, hiring accelerated in Charlotte over the past year. Nonfarm employment in the Charlotte metro area increased 2.7% over the past 12 months, as employers added nearly 37,800 net new jobs. That performance places Charlotte among the fastest-growing large MSAs in the country, even as national hiring momentum cools. Net job creation also surpassed that of larger peer metros such as Atlanta, Dallas-Ft Worth, and Miami–Fort Lauderdale–West Palm Beach.
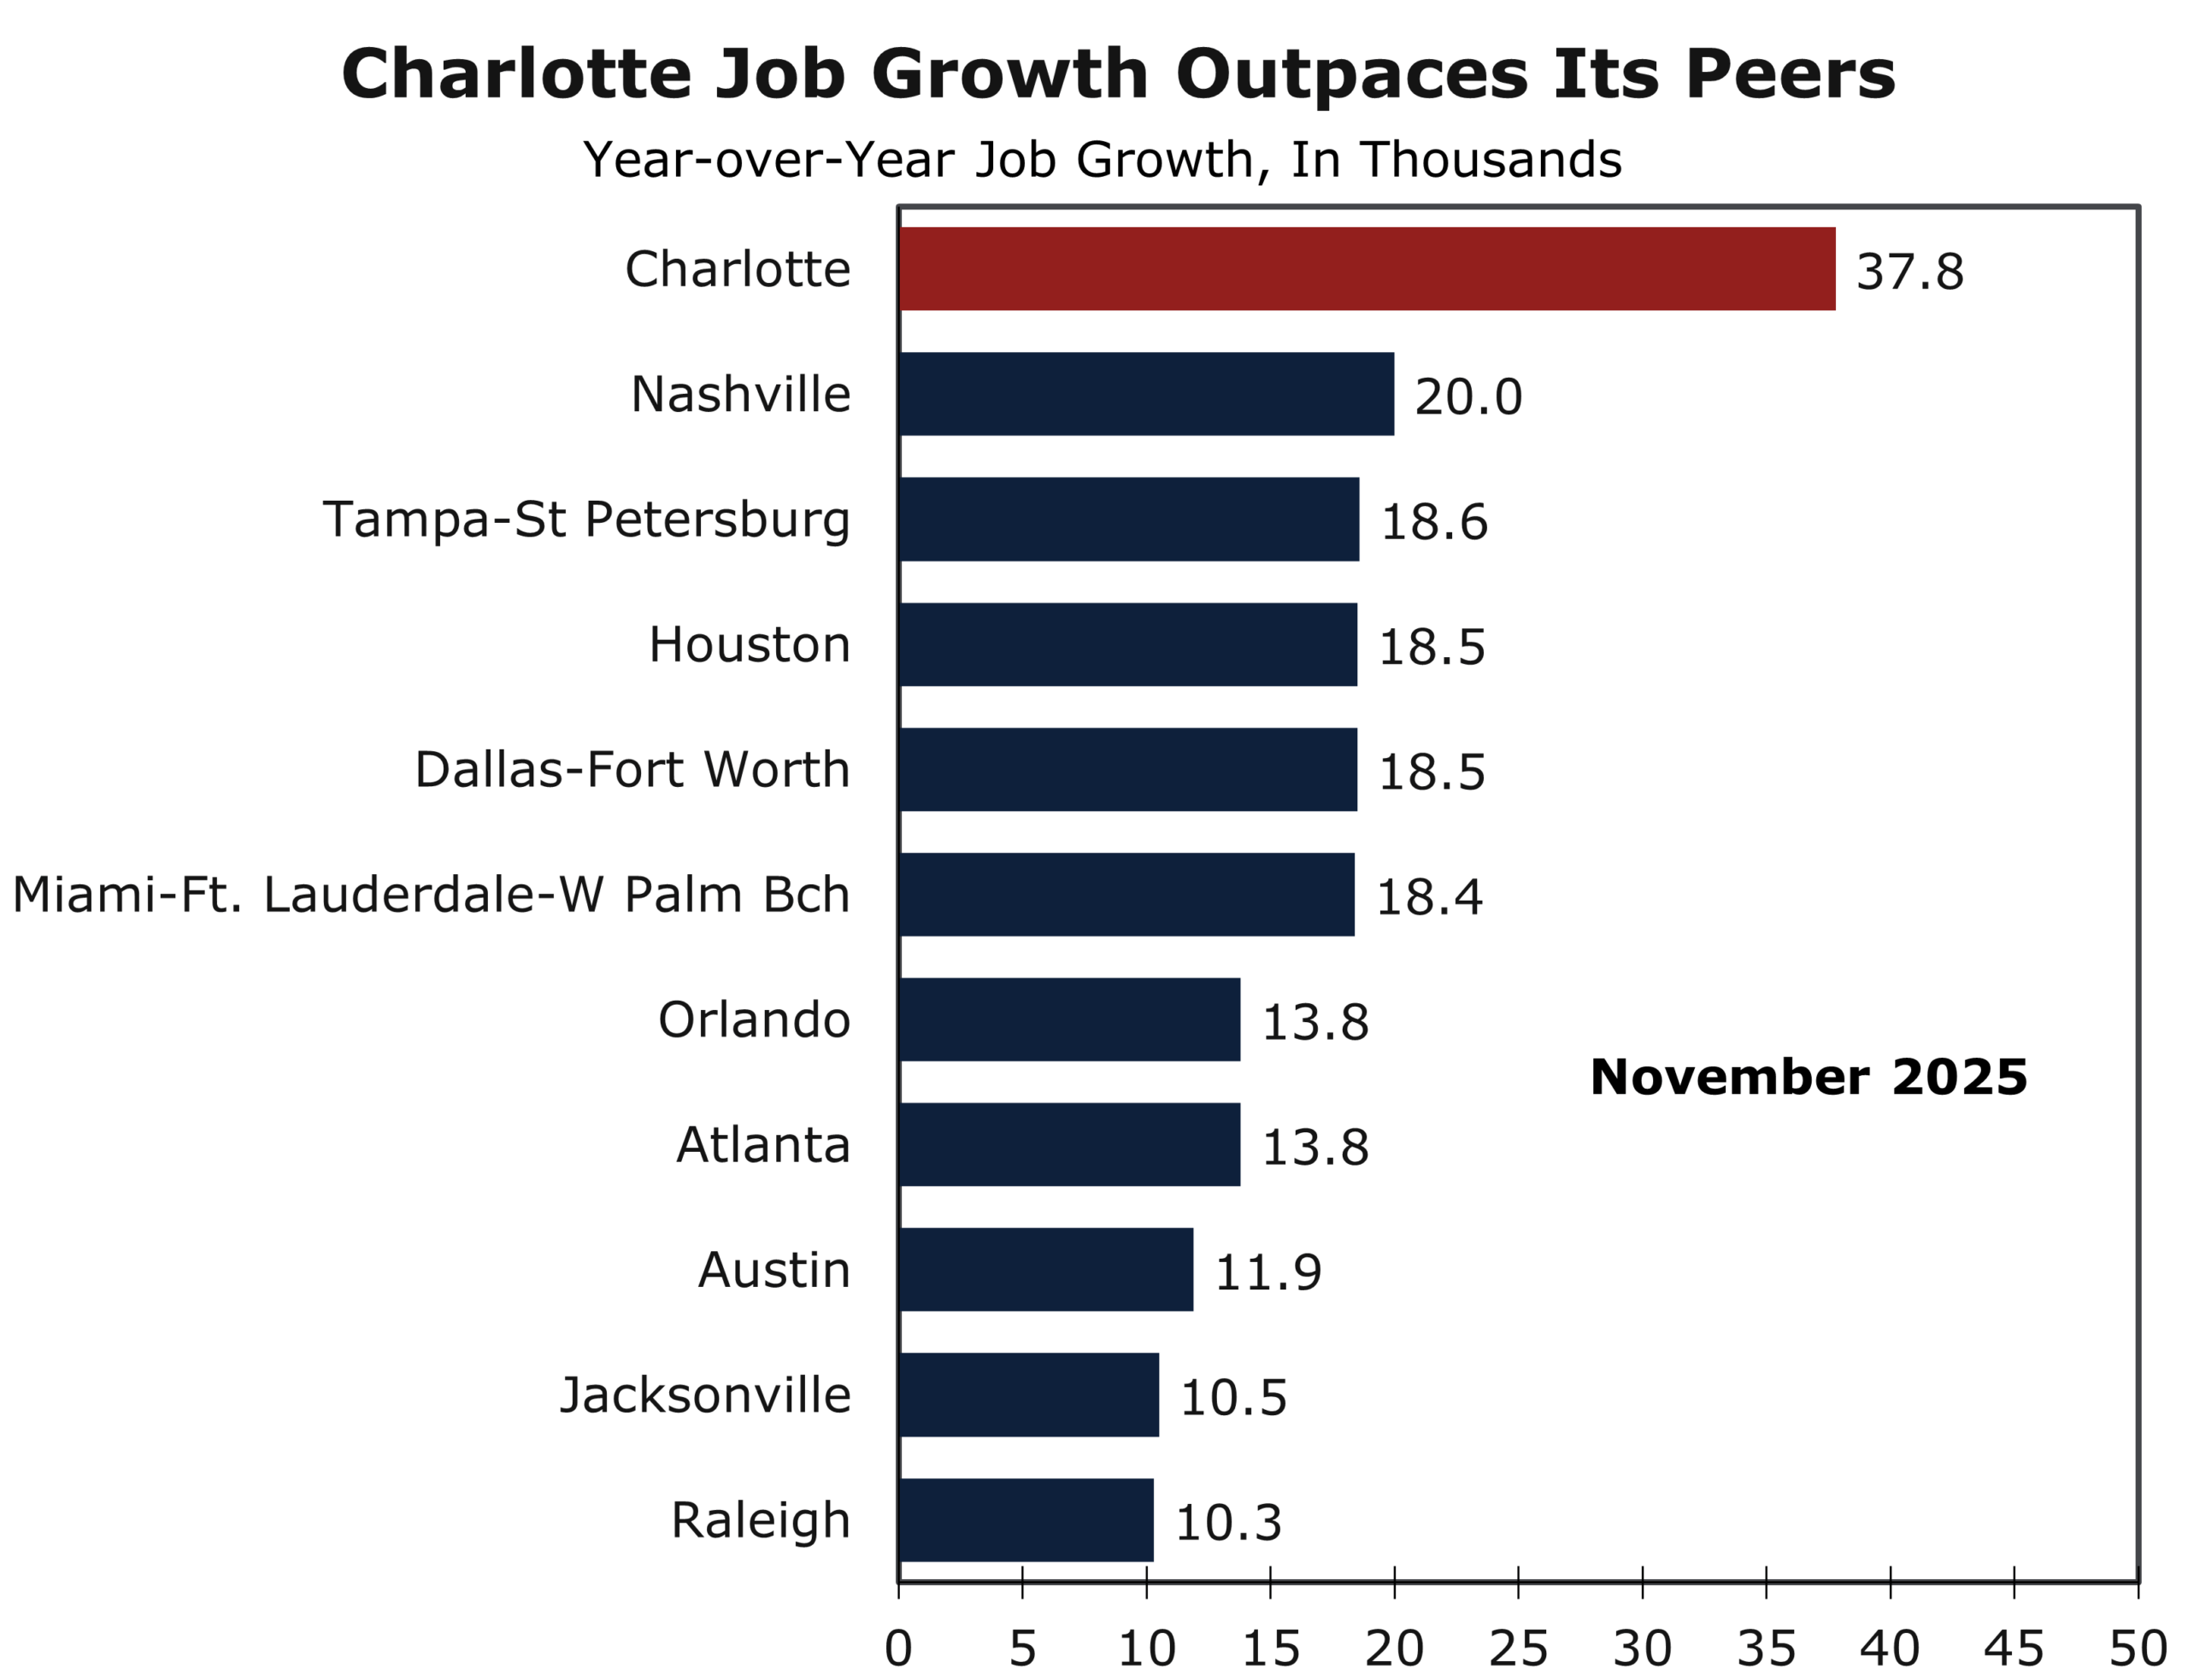
Charlotte’s strength reflects more than favorable timing. The region sits at the intersection of financial services, technology, healthcare, and logistics, supported by sustained population growth and rising capital inflows. Tech and healthcare hiring remain notable bright spots, while investments such as the Wake Forest School of Medicine; and more broadly, The Pearl innovation district, promise to further diversify the region’s economic base. Charlotte also continues to attract corporate and regional headquarters and scored a notable win by landing the new headquarters for Scout Motors. Unlike markets now confronting affordability ceilings and slowing migration, Charlotte continues to benefit from attainable housing, execution speed, and a growing talent pool.
Charlotte is accelerating while many peer tech metros are decelerating. Capital, people, and jobs continue to gravitate toward Charlotte.
While this report draws from discussions with leaders from Charlotte-area technology firms, its conclusions extend well beyond the tech sector. This is not a cycle defined by rapid hiring or outsized top-line growth; it is a capability cycle. Advantages will accrue to organizations that align with capital spending, invest in productivity-enhancing technologies, and operate in regions with durable execution capacity, such as Charlotte. If 2025 was the year the economy cooled without breaking, 2026 is shaping up to deliver growth with fewer workers, more capital, and increasingly calibrated policy. In that environment, discipline, scale, and execution will matter more than speed.
For Charlotte’s tech sector, 2026 is shaping up as a year of opportunity. Firms are accelerating the adoption of AI and automation to boost efficiency, while the sector continues to broaden beyond its historic dependence on the region’s large financial base. Healthcare, life sciences, and MedTech are emerging as particularly strong growth areas. Logistics, long weighed down by a protracted freight recession, is also positioned for a rebound, while financial services and FinTech stand to benefit from lower interest rates and an improving environment for lending and deal flow.
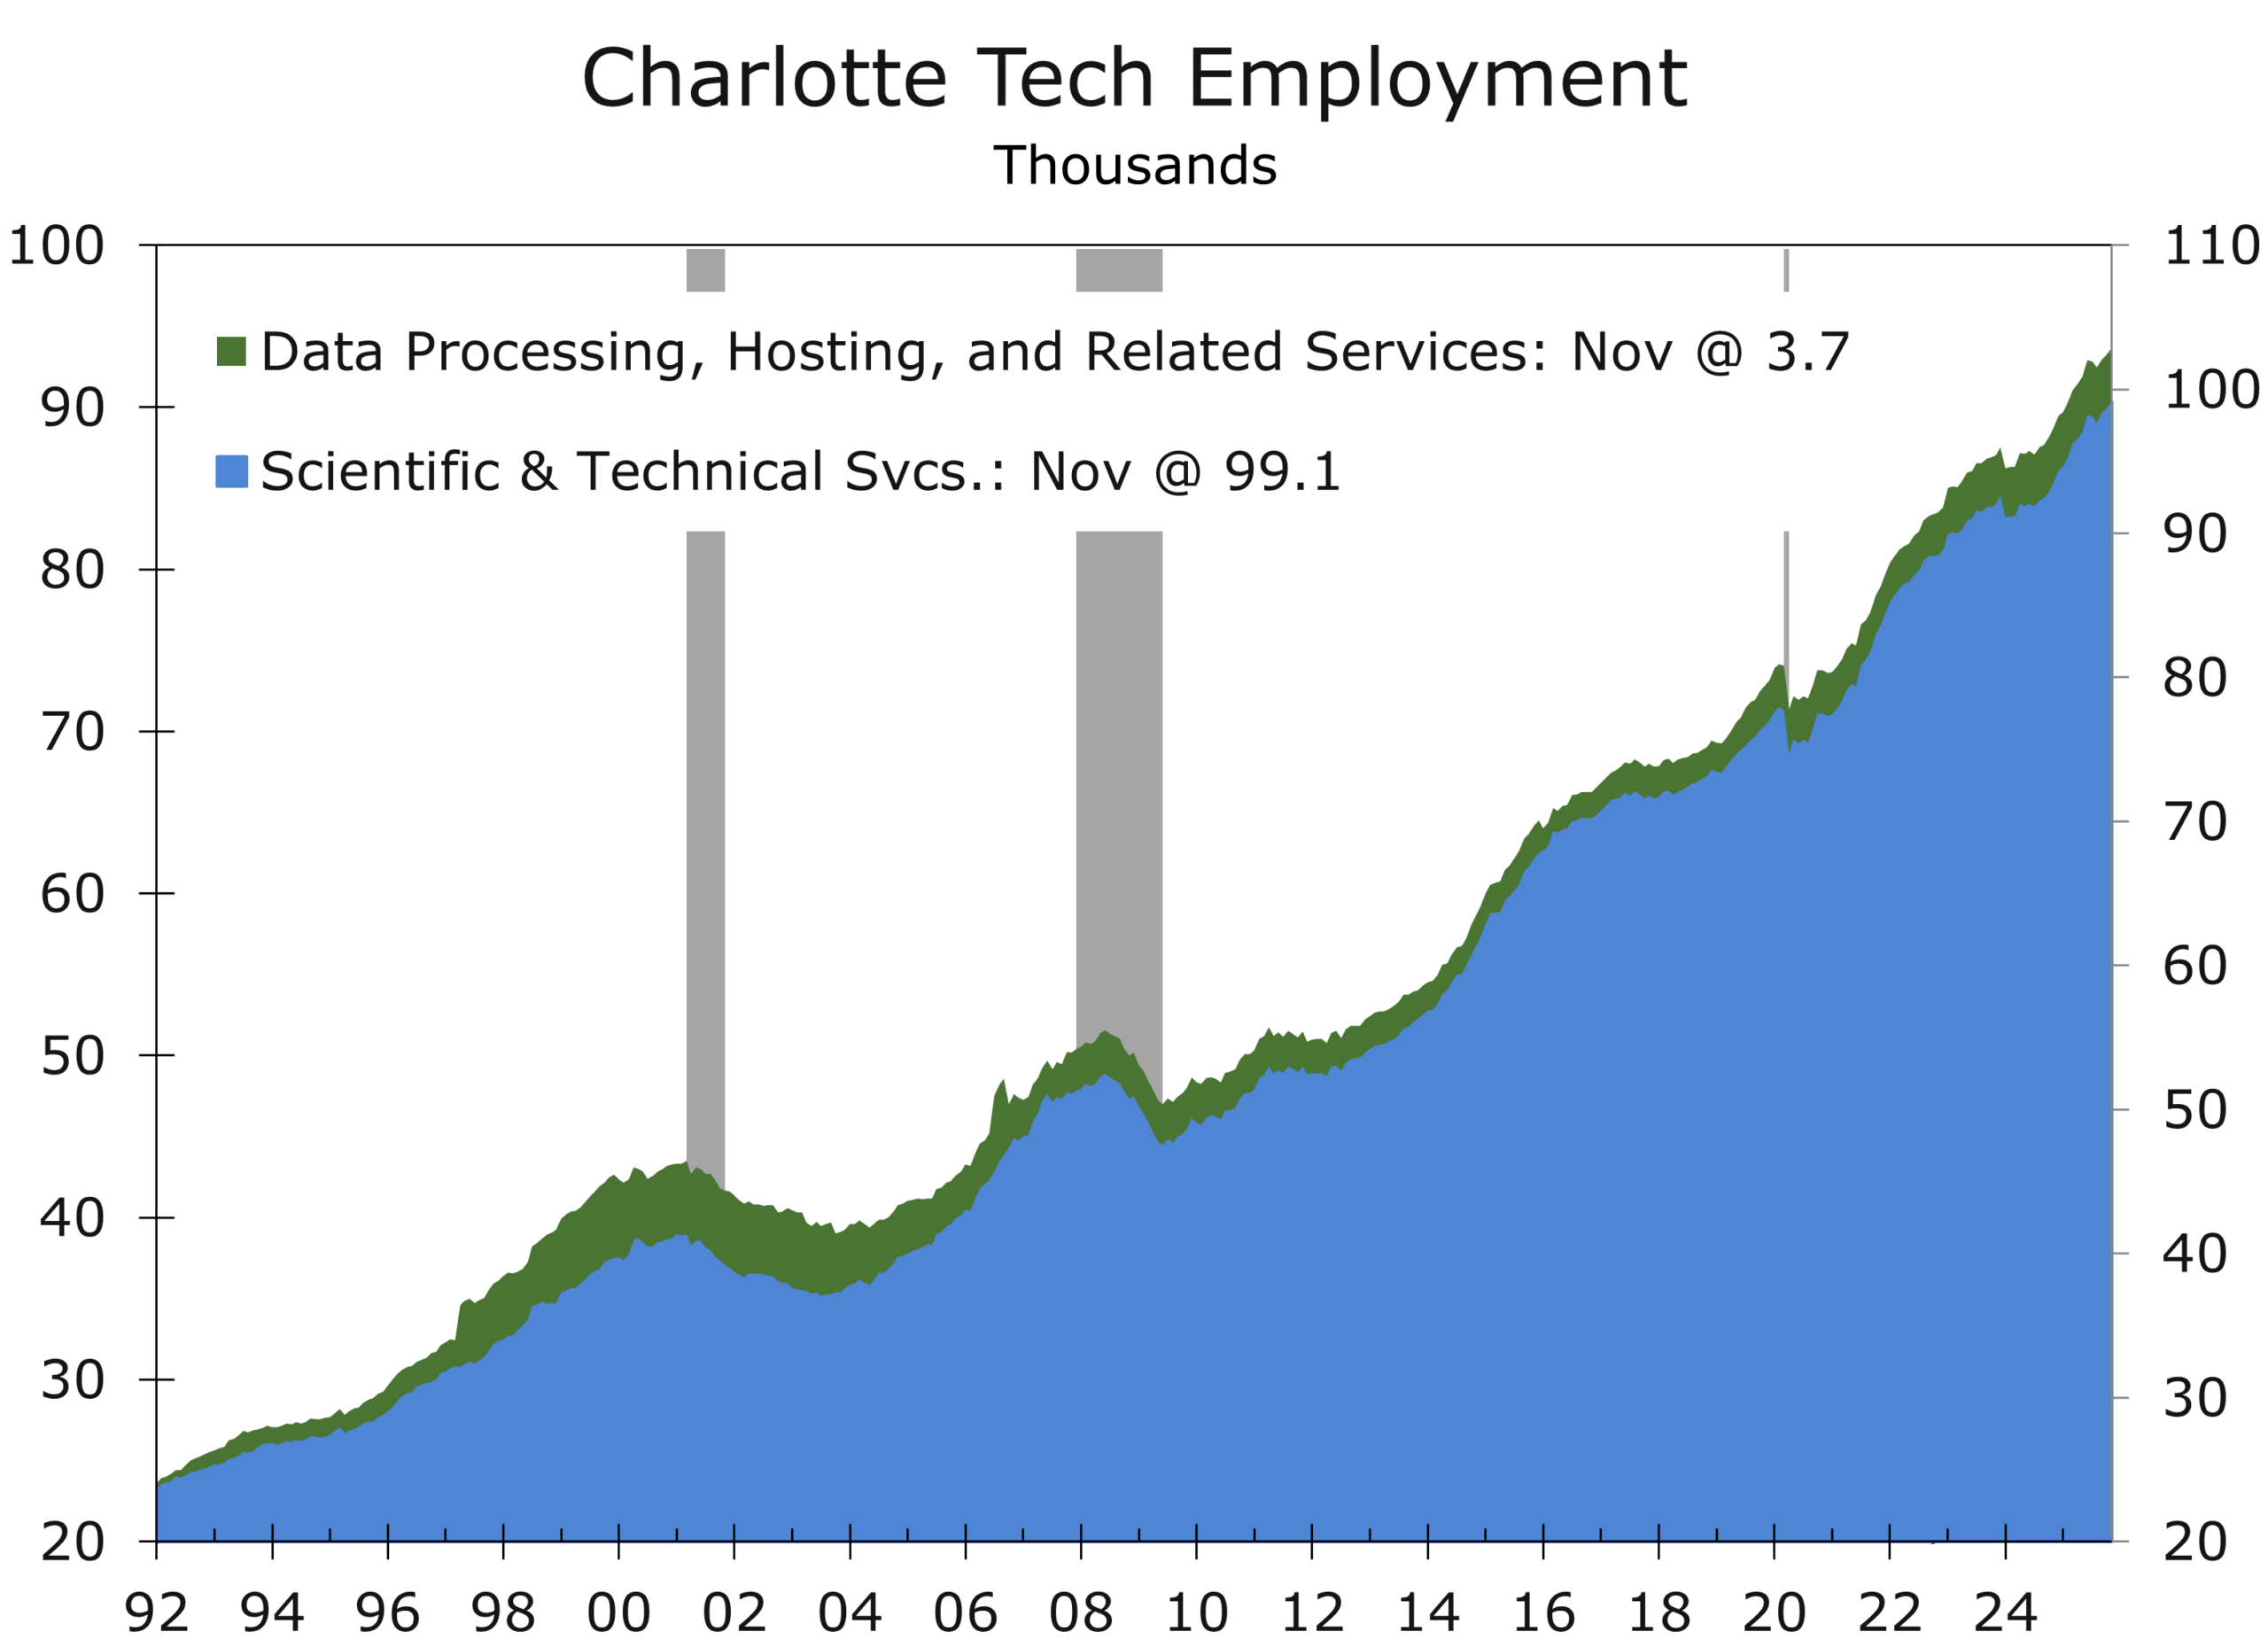
The broader economic outlook remains constructive. While job growth is likely to cool from the pace implied by preliminary data, the Charlotte region is still positioned to outperform the nation and most peer metros. The city’s core advantages remain firmly in place: a diversified economy, a high quality of life, and a well-located major airport hub that consistently ranks as one of the busiest in the world. Population growth continues to be fueled by domestic migration, led by inflows from the Northeast and Midwest, with rising contributions from other Southeast states—particularly Florida—as well as the West Coast. Charlotte also continues to rank among the top U.S. metros for attracting corporate and regional headquarters, reinforcing its long-term growth trajectory.
One of the questions we often get when speaking about the region’s economic performance is: Can this momentum continue, and what could trip Charlotte up? The answer to both is housing affordability. While home prices have risen in Charlotte, the region remains relatively affordable compared to its peers. As long as that remains true, the region’s competitive edge remains intact.
Charlotte is blessed with significant geographical advantages, including abundant land and water resources (including three lakes along the Catawba River). Most metro areas grow predominantly in one direction, typically to the north. In Charlotte, however, growth is roughly evenly split between the north and the south. Furthermore, the east (Cabarrus, Union, and Stanly counties) and west (Gaston and Lincoln) are currently the fastest-growing parts of the metro, benefiting from their own relative affordability.
A key reason these outlying areas remained accessible and affordable for so long is that Charlotte was one of the last major U.S. cities to complete a beltline expressway. The final leg of I-485 did not open until 2015, effectively “unlocking” vast tracts of land for development just as the national migration toward the Sun Belt accelerated. This delayed infrastructure has provided a critical safety valve for housing supply that many of Charlotte’s peers lack.
Disclaimer: This publication has been prepared for informational purposes only and is not intended as a recommendation offer or solicitation with respect to the purchase or sale of any security or other financial product nor does it constitute investment advice.
January 9, 2026
Mark Vitner, Chief Economist
(704) 458-4000
A View from the Piedmont: Our Weekly Commentary on Money, Credit, Exchange Rates & Geopolitics – Cooling the Cycle, Clarifying the Signal
Highlights of the Week
- Venezuela stirred headlines and sentiment, but ample oil inventories and firm oil fundamentals kept energy prices contained, reinforcing confidence rather than caution.
- Oil and defense stocks rallied, reflecting the prospect of incremental gains to U.S. and Western oil firms, which alone have the expertise needed to boost Venezuelan production.
- Manufacturing is treading water. Production is edging forward modestly, while firms continue to trim labor and run unusually lean inventories as they wait for greater policy clarity.
- The quiet delay of furniture tariffs underscores a broader shift from tariff absolutism to tariff optionality. The switch is important for inflation dynamics, corporate margins, and Federal Reserve timing.
- Policymakers are threading a narrow path as growth stabilizes, inflation cools at the margin, and geopolitical risk rises without yet spilling meaningfully into the macro data.
- The week ahead is unlikely to alter the economy’s direction of travel, but it should clarify the story. Growth is decelerating toward trend, not stalling or rolling over.
Calibrated Power, Calibrated Policy
The first full trading week of 2026 offered a familiar lesson dressed in new clothes. Geopolitics can move markets, but fundamentals still write the longer chapters. The arrest of Venezuela’s Nicolás Maduro delivered an early risk-on jolt, pushing equities to record highs and briefly reviving talk of a supply-side oil shock. Yet crude prices barely flinched. Brent and WTI drifted lower, a reminder that global inventories, spare capacity, and demand elasticity still matter more than regime headlines. History rhymes here. Iraq in 2003 changed geopolitics overnight, but oil prices ultimately followed barrels, not banners.
Markets are rediscovering an old truth: geopolitics can move prices in the short run, but fundamentals will anchor them over time.
That same tension between narrative and reality showed up in Monday’s ISM Manufacturing report. The overall PMI fell 0.3 percentage points to 47.9 in December, marking the tenth consecutive month below the expansion threshold and the weakest reading of 2025.
Despite its long run in contraction territory, the weaker ISM index is not a signal of collapse. Instead, it is a picture of a factory sector treading water. Production is eking out modest gains, but manufacturers remain cautious—paring payrolls, preserving liquidity, and holding inventories at unusually lean levels. Capital spending continues, but selectively. Firms are not retreating so much as waiting.
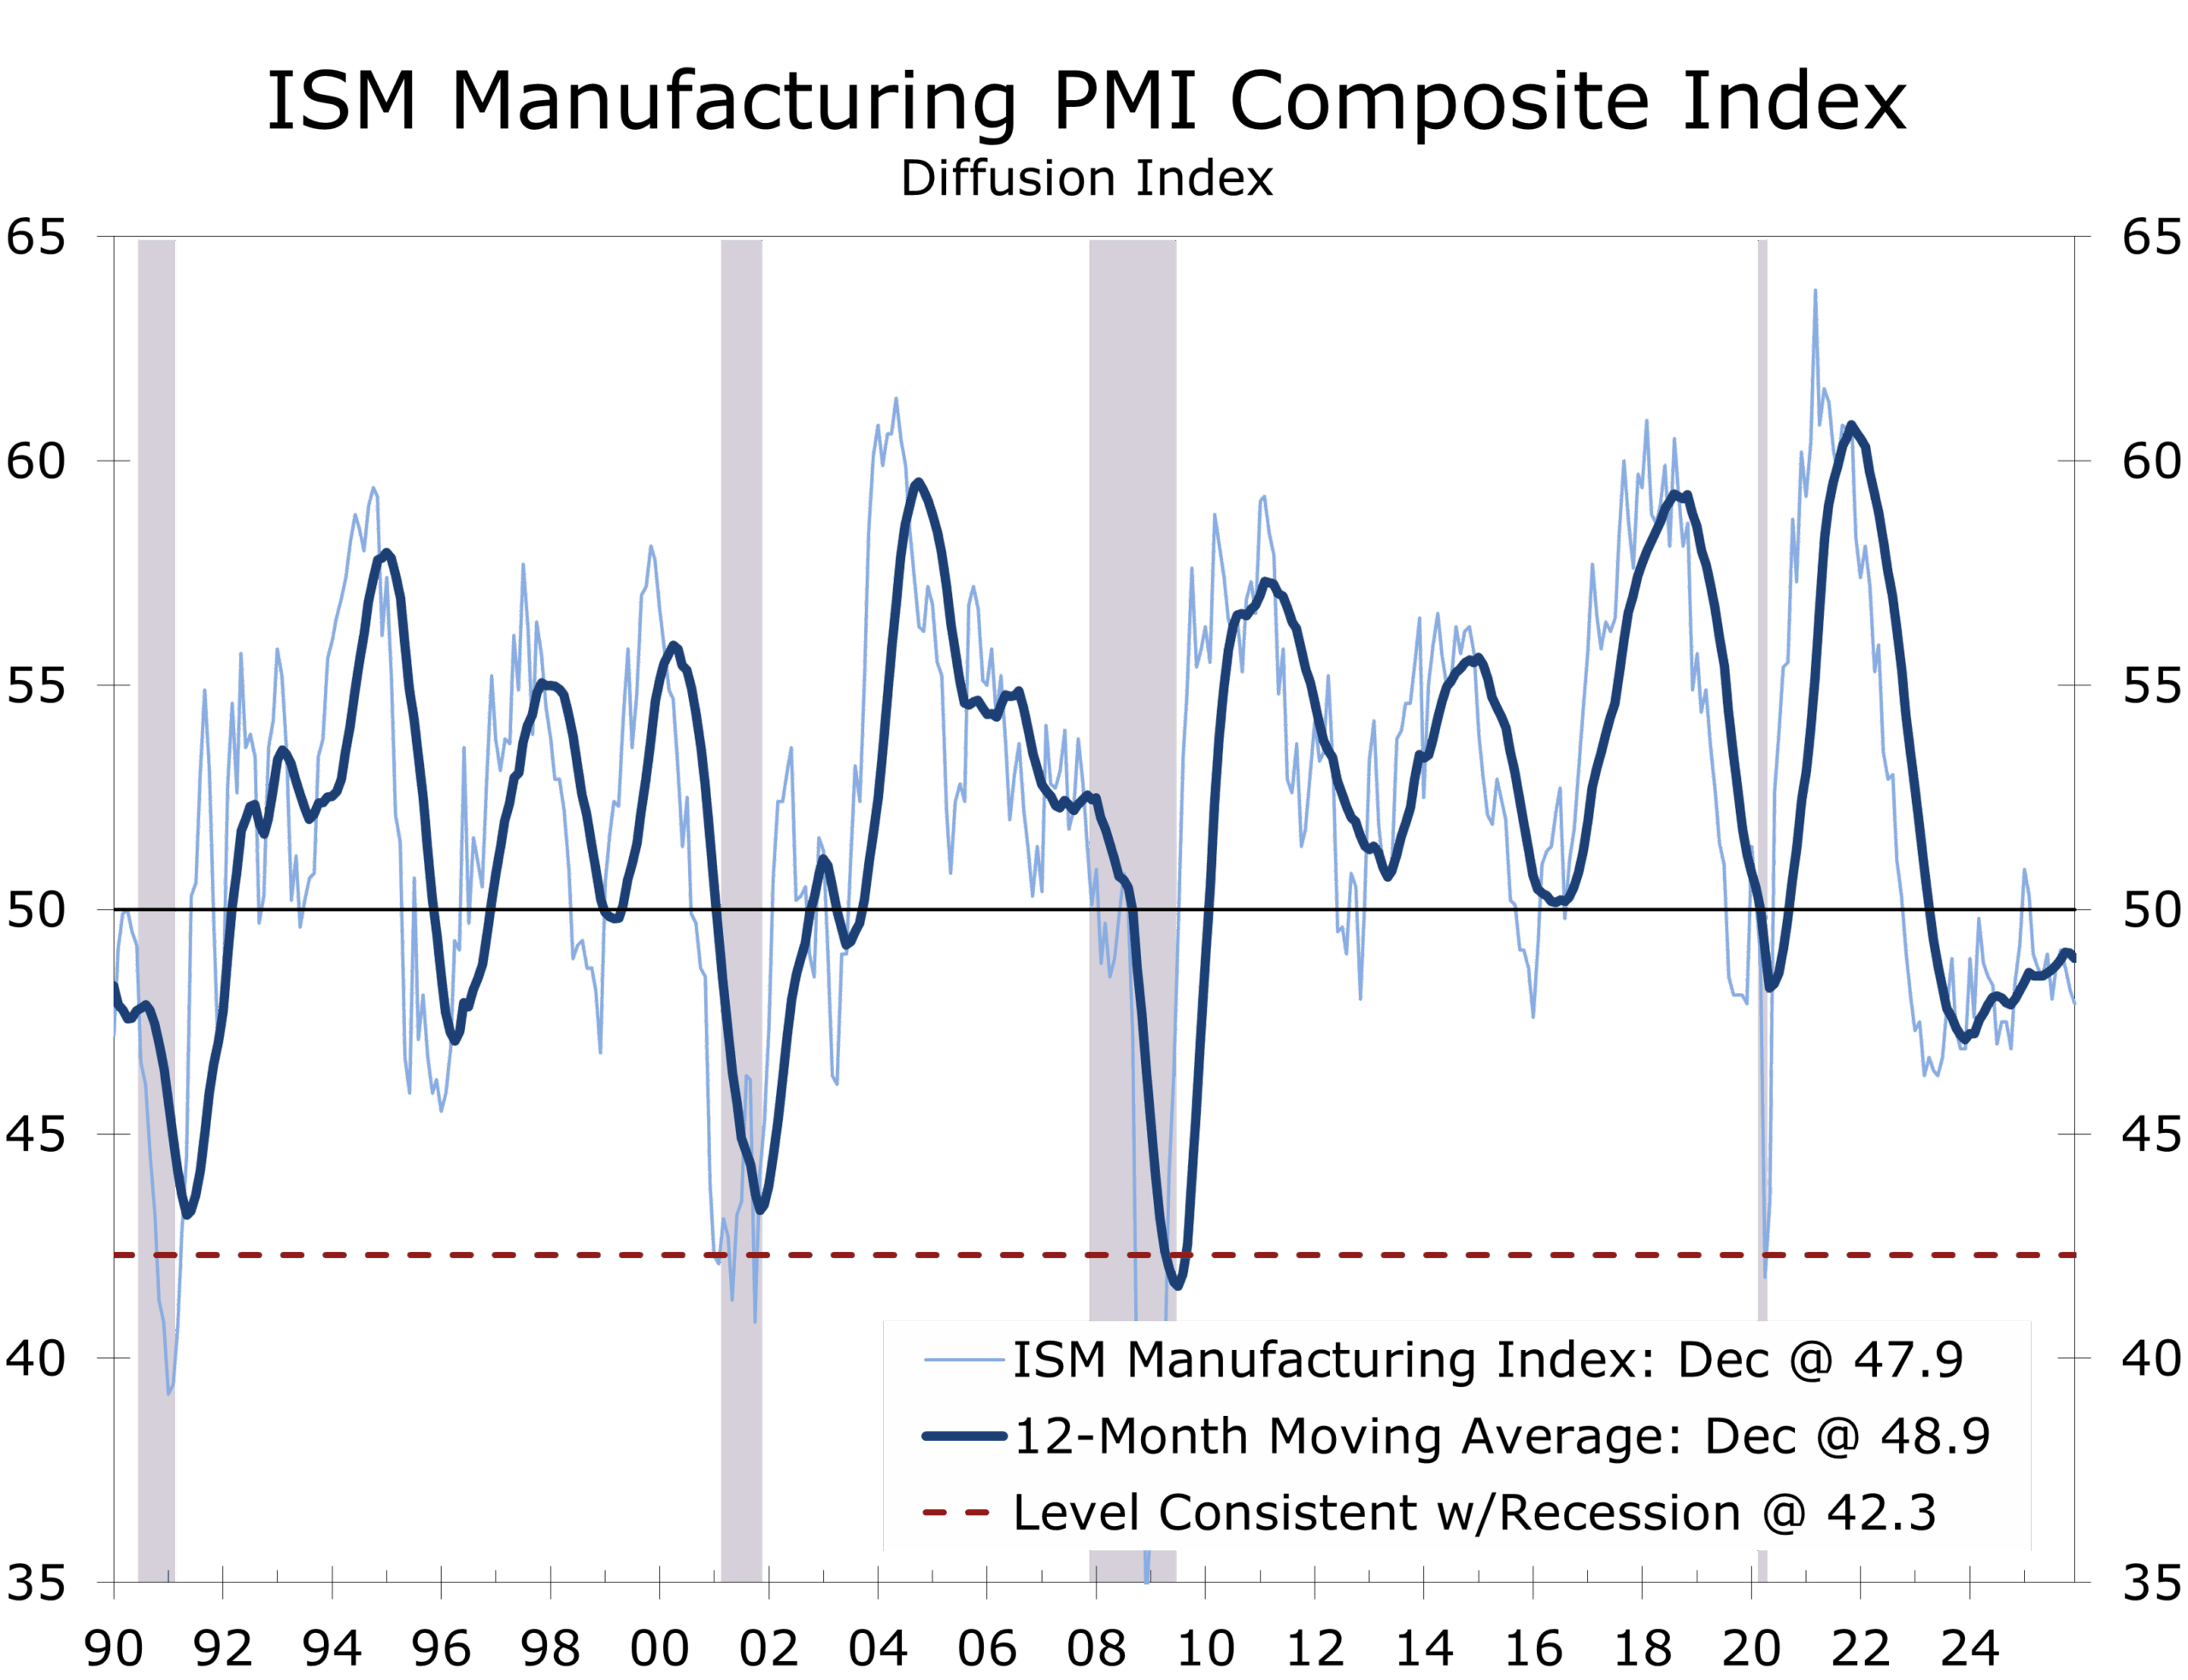
What manufacturers are waiting for is clarity. Trade policy uncertainty and labor availability remain the binding constraints, not demand. On that front, the Trump Administration appears increasingly inclined to oblige. The policy posture emerging early in 2026 is consistent with our central calls for the year: that restoring affordability and momentum ahead of the midterm elections would require easing cost pressures rather than amplifying them. A lighter touch on tariffs and a more pragmatic approach to immigration both fit that playbook.
Manufacturing is not weak because demand has vanished, producers are overly cautious because policy clarity has.
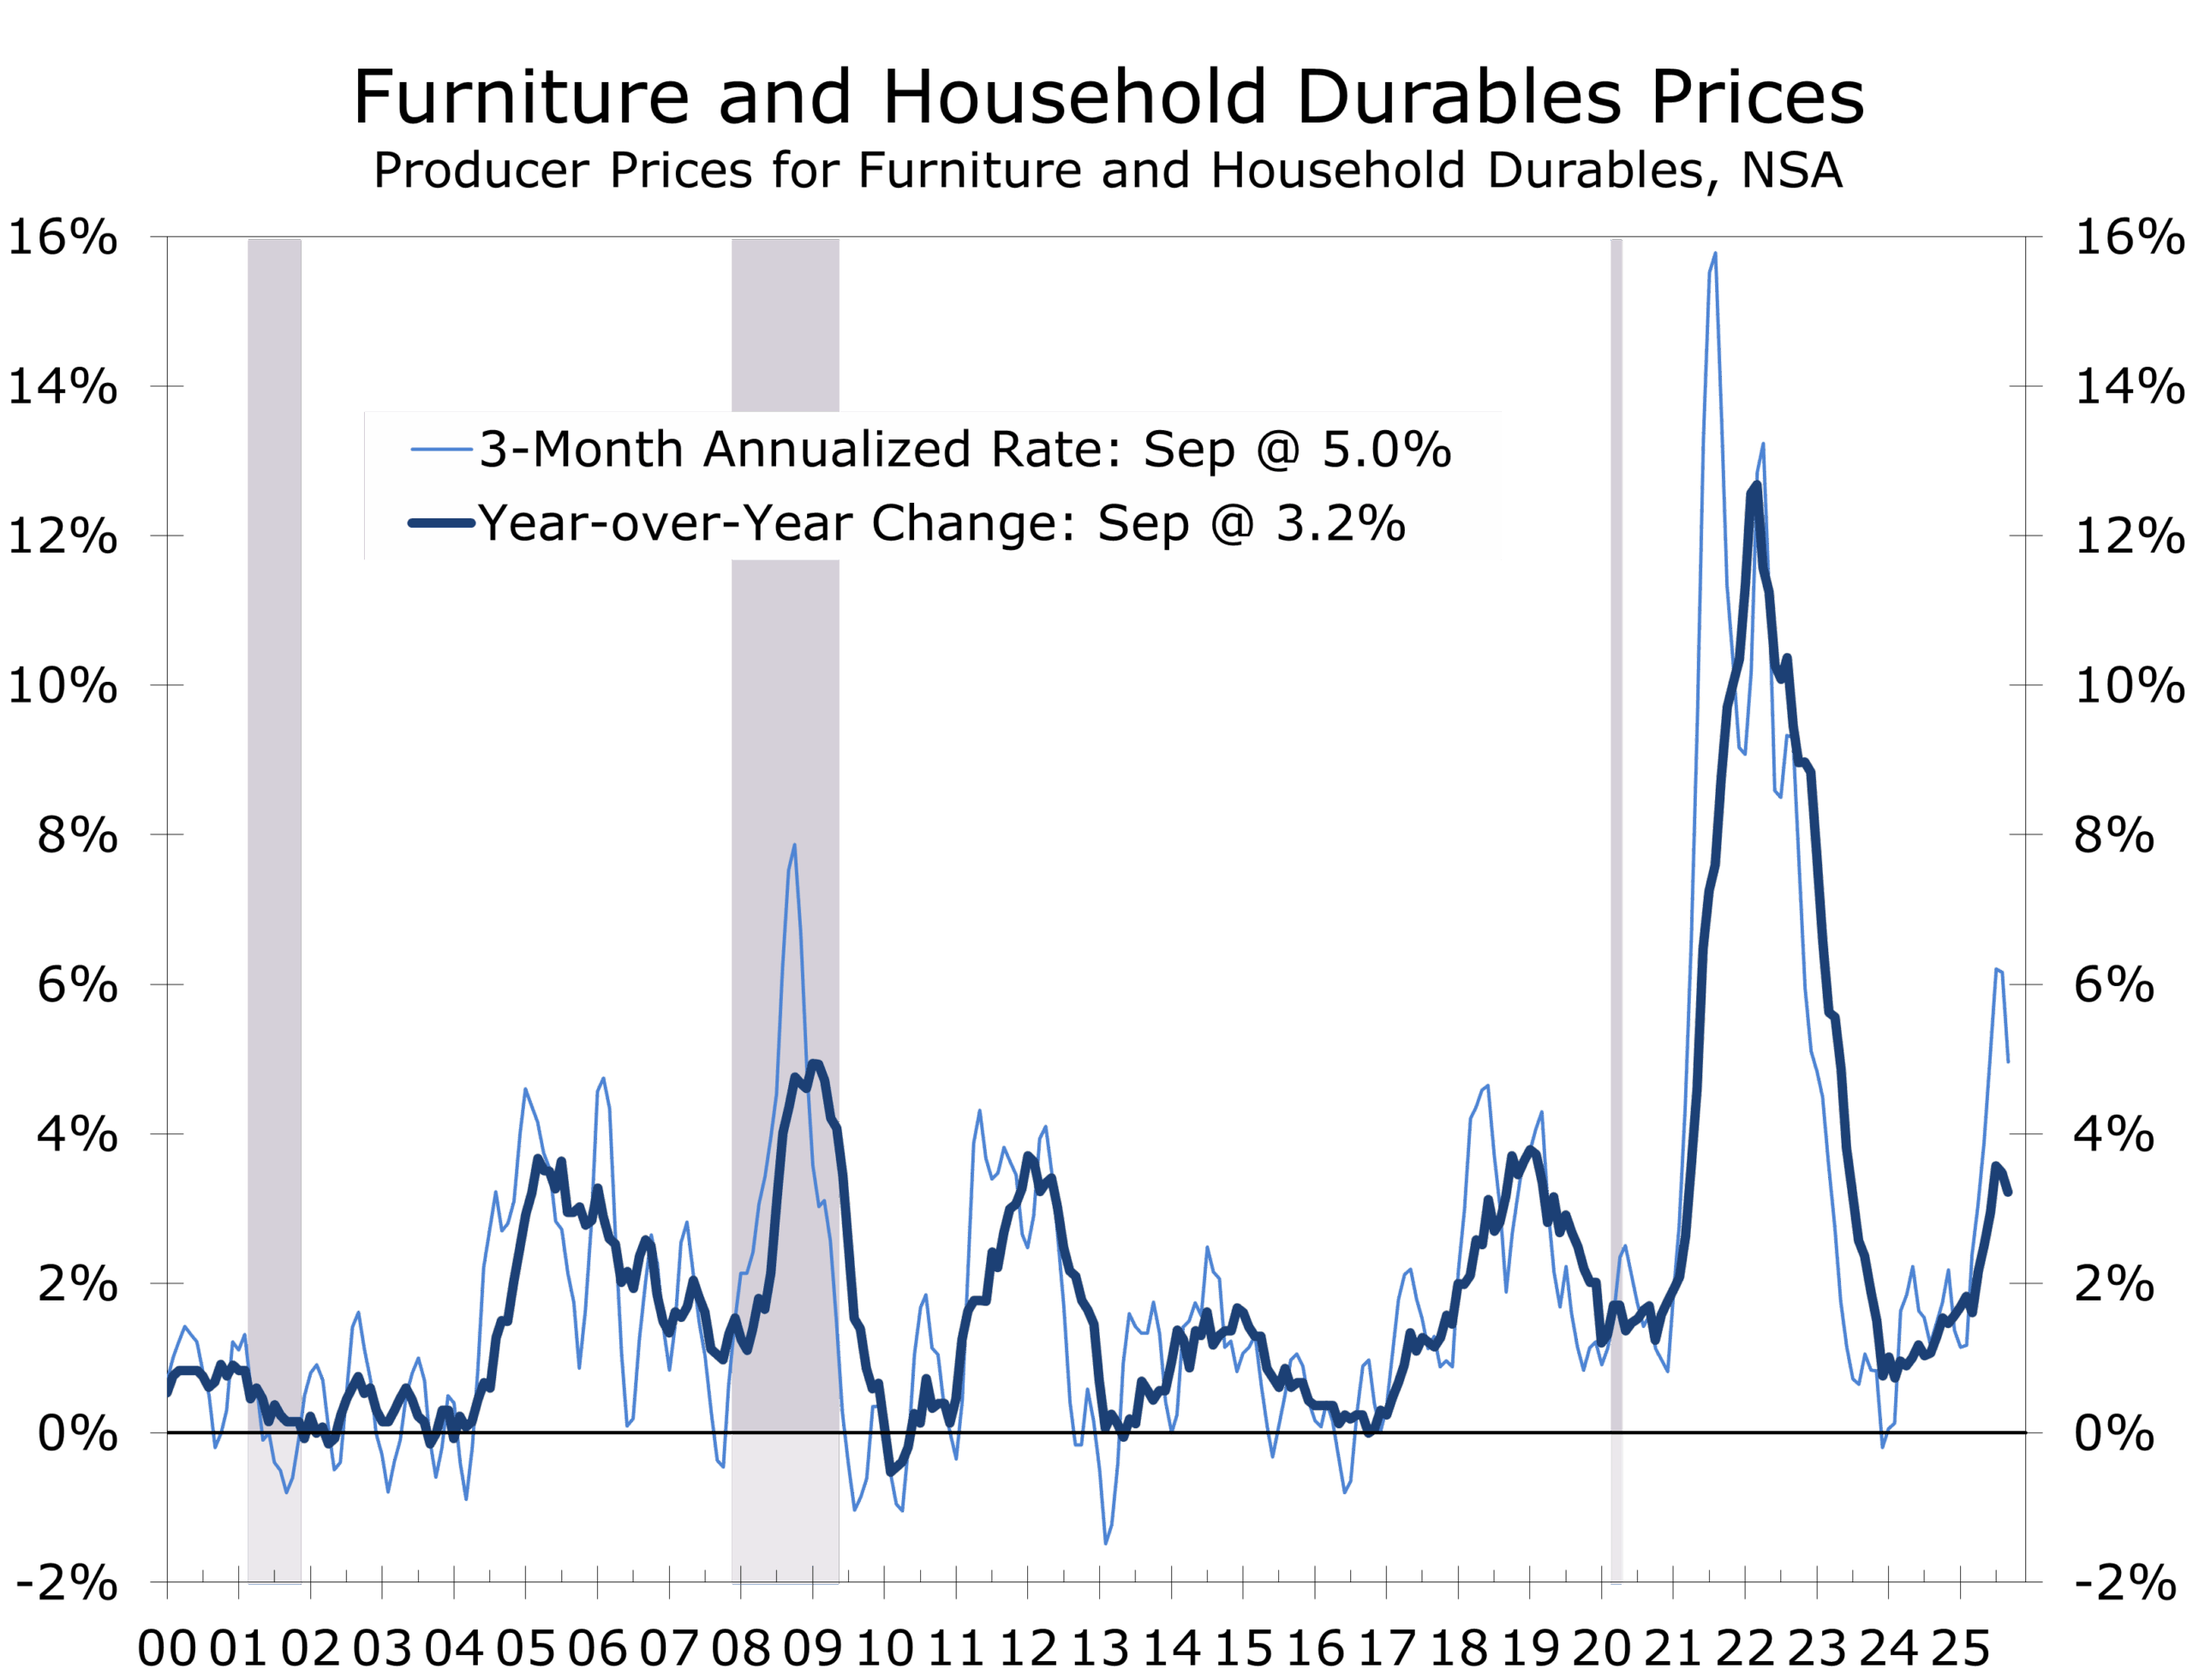
Against that backdrop, trade policy delivered one of the more telling signals of the week. The decision to delay scheduled tariff increases on upholstered furniture, kitchen cabinets, and vanities into 2027 is small in headline terms but meaningful in context. This was not a rollback. Existing tariffs remain in place. But it was a clear acknowledgment of inflation sensitivity and political timing. Furniture is a highly visible, price-elastic category. Allowing tariffs to ratchet higher would have fed directly into consumer prices at a moment when policymakers are trying to declare progress.
Markets understood the message. Home goods and furniture stocks rallied as near-term margin risk eased, and retailers gained a rare commodity in today’s environment: cost visibility. More broadly, the move reinforces a quiet but important evolution in trade strategy. Tariffs are being treated less like permanent fortifications and more like negotiating instruments with built-in off-ramps. That flexibility lowers near-term inflation risk and supports risk assets, even as it raises longer-term planning uncertainty for global supply chains.
Policy restraint is quietly doing some of the Fed’s work for it.
For the Federal Reserve, this matters at the margin. Goods disinflation has been one of the more reliable allies in the fight against inflation. A tariff escalation would have complicated that story just as services inflation shows signs of grinding lower rather than falling cleanly. By delaying the tariff hike, policymakers effectively removed one potential source of renewed price pressure from the 2026 outlook. It does not force the Fed’s hand, but it narrows the set of upside inflation risks the Committee must weigh as it debates the timing and pace of eventual rate cuts.
More broadly, the move reinforces a quiet but important evolution in trade strategy. Tariffs are being treated less like permanent fortifications and more like negotiating instruments with built-in off-ramps. That flexibility lowers near-term inflation risk and supports risk assets, even as it raises longer-term planning uncertainty for global supply chains.
Policy restraint is quietly doing some of the Fed’s work for it, reinforcing the disinflationary trend.
For the Federal Reserve, this matters at the margin. Goods disinflation has been one of the more reliable allies in the fight against inflation. A tariff escalation would have complicated that story just as services inflation shows signs of grinding lower rather than falling cleanly. By delaying the tariff hike, policymakers effectively removed one potential source of renewed price pressure from the 2026 outlook. It does not force the Fed’s hand, but it narrows the set of upside inflation risks the Committee must weigh as it debates the timing and pace of eventual rate cuts.
Geopolitically, the landscape remains unsettled but contained. Venezuela’s future oil contribution is likely measured in quarters, not weeks, and depends on capital, infrastructure, and sanctions mechanics as much as politics. We expect a modest uptick in oil output this year, somewhere around 300,000 additional barrels per day. Gains beyond that will require significant investment and time. What markets seem to be underestimating is U.S. energy know-how, specifically related to Venezuelan crude.
Russia’s war in Ukraine continues to evolve tactically rather than strategically, while China’s tightening grip on dual-use exports to Japan underscores how economic statecraft is becoming more precise, more targeted, and harder to model. None of this has yet bled meaningfully into U.S. macro data, but it continues to shape the risk distribution around the outlook.
The still-growing protests in Iran hold the most promise for the next major geopolitical upheaval. Change may also come sooner than expected in Cuba, but talk about Greenland is most likely a distraction. Unless Greenland becomes a base for Chinese and Russian asymmetric attacks on the U.S., there is no reason for Denmark or other NATO nations to be concerned about an unwanted military takeover by the U.S. Remember that President Trump is always negotiating. The repeated heightened rhetoric on Greenland may be designed to secure a more favorable arrangement with Greenland, such as a lease deal or a mineral rights deal. The U.S. already has the right to operate military bases in Greenland.
Early 2026 is shaping up as a period of calibrated power and calibrated policy. Growth is slower but steadier. Inflation is easing, but has not been vanquished. Manufacturing is waiting, not failing. Tariffs are no longer blunt instruments, and geopolitics is loud without yet being inflationary. The margin for error is thinner than it looks—but the runway remains open, for now.
2026 Top Calls
- Manufacturing treads water, then stabilizes. Production growth remains modest, inventories stay lean, and labor trimming continues into midyear, but conditions improve as policy uncertainty fades.
- Tariffs become more flexible, not more forceful. Expect selective delays, exemptions, and enforcement discretion aimed at containing inflation and protecting politically sensitive consumer categories.
- Immigration pragmatism returns quietly. Incremental easing helps stabilize labor supply, lower service-sector cost pressures, and support affordability without reopening broader political fights.
- The Fed cuts later and by a little less than markets once expected. With goods disinflation intact and services inflation grinding lower, the Fed gains time rather than urgency.
- Geopolitical risk stays elevated but contained. Markets price uncertainty, not disruption, favoring resilience over recession trades.
For a deeper discussion of our macro framework and policy outlook, see the December edition of The CAVU Compass, where these themes were first laid out in detail.
The Piedmont Perspective
The removal of Nicolás Maduro is more than a regime change. It is a stress test of a gray-zone alliance built on opacity, grievance politics, and sanctions arbitrage. For more than a decade, Caracas served as the Western Hemisphere hub of a loose alignment linking Russia, China, Iran, and Cuba. The glue was not ideology but utility: Venezuela offered geography, oil optionality, and permissive terrain for sanctions evasion; its partners provided capital, weapons, intelligence cooperation, and diplomatic cover.
That ecosystem extended beyond states. Venezuela became an enabling environment for Iran-aligned networks tied to Hezbollah and, indirectly, Hamas. Caracas did not direct militant operations, but it lowered coordination costs through diplomatic alignment, financial opacity, and limited physical safe haven. Permissive hubs matter: they reduce friction, extend reach, and complicate enforcement.
That model now looks fragile. Asymmetric coalitions tend to hold only while their hubs remain intact. Russia’s leverage in Venezuela was coercive and military, optimized for access rather than development. China’s engagement was financial and extractive, centered on oil-backed lending that insulated Beijing while hollowing out PDVSA. Iran focused on sanctions workarounds and logistics, using Venezuela as both testbed and rear area. With Caracas destabilized, the connective tissue frays. No partner can easily replicate Venezuela’s mix of proximity to U.S. markets, energy scale, and permissiveness elsewhere in the hemisphere.
Markets initially priced these developments through energy, but expectations should remain disciplined. Venezuela holds roughly 303 billion barrels of proven reserves, yet production remains a fraction of late-1990s peaks above 3 million barrels per day. Recent output has hovered around 650,000–750,000 barrels per day, with exports discounted and routed through opaque channels, largely to China.
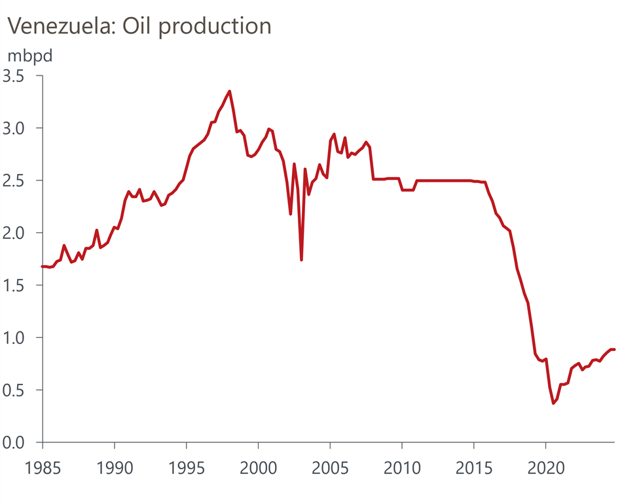
Venezuela is a geological superpower operating like a marginal producer. Years of underinvestment, infrastructure decay, sanctions frictions, and human-capital flight make supply restoration a medium-term project, not a cyclical shock. Even under a credible transition, gains would be incremental and capital-intensive, constrained by financing, diluent availability, and logistics. This is not an oil-shock story; it is an optionality story constrained by capital, infrastructure, and credibility.
The slope matters more than the headline. U.S. technology lowers break-evens before it lifts volumes.
Pundits are underestimating the U.S. technology advantage. Expertise in heavy-crude processing, enhanced recovery, project execution, and cost discipline can materially lower Venezuelan break-evens over time. The most plausible path is a modest rise in output in 2026—on the order of 300,000 barrels per day—followed by more durable gains contingent on political clarity and capital access.
An important regional tail risk has also diminished. The prospect of Venezuelan pressure on oil-rich Guyana has faded as Caracas destabilizes and its external backers turn defensive. That removes a non-trivial risk to one of the world’s fastest-growing new oil provinces and supports the view that recent events reduce upside volatility in energy markets rather than create a supply surge.
The more durable market impact runs through financial plumbing, not crude flows. Venezuela functioned as a settlement node for sanctioned trade, providing parallel payment rails, gold-for-energy exchanges, and opaque mechanisms. Removing that node raises transaction costs, lengthens settlement chains, and increases enforcement risk. It does not reverse reserve diversification, but it slows its velocity at the margin.
At the margin, this is modestly dollar-supportive. Reduced leakage reinforces the dollar’s role as the least-bad settlement option in a fragmented system. The effect is best read as a reduction in downside risk, not a new upside catalyst. By lowering the odds of energy-led inflation surprises and tightening financial plumbing, these shifts reduce the likelihood that the Federal Reserve is forced into a defensive policy response.
Risks remain. Cyber retaliation, proxy agitation, and short-term commodity volatility fit the playbook of a network under pressure. When opaque systems lose a hub, coordination degrades before adaptation sets in. Near term favors noise; medium term favors fragmentation and normalization.
Toppling the Maduro regime is no victory lap. It is a clearing of fog. The Americas regain strategic depth. Energy markets gain marginal optionality rather than abundance. And a coalition built on friction, provocation, and evasion finds itself, at least temporarily, short of all three.
The broader lesson extends beyond the hemisphere. Gray-zone power projection relies on permissive hubs combining geography, resources, and weak governance. When those hubs are disrupted, coordination tightens and strategic optionality narrows. For Beijing, the signal is less about oil than exposure. Sustaining external pressure campaigns, including around Taiwan, requires economic resilience, diplomatic bandwidth, and reliable logistics. Peripheral entanglements dilute focus and raise costs; patience, resilience, and allied cohesion remain the more durable sources of leverage.
Looking Ahead: Cooling, Not Contracting
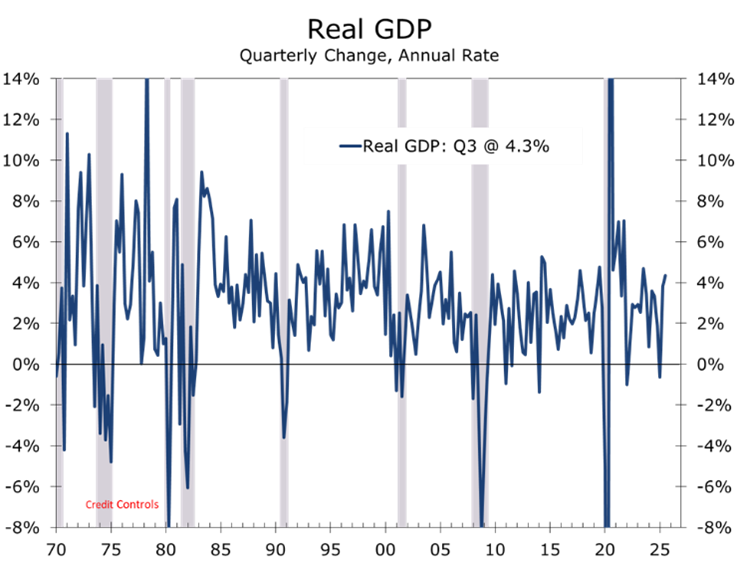
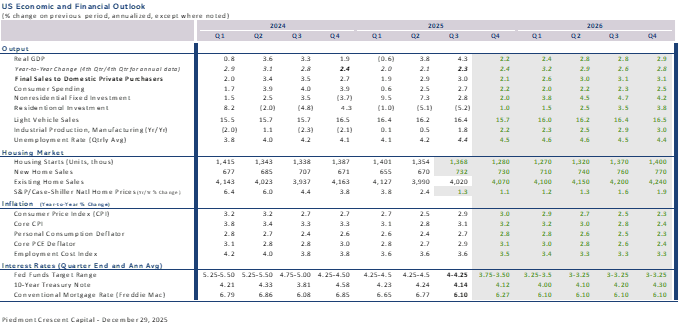
The remainder of the week should reinforce a theme that is becoming clearer as 2026 begins. Manufacturing is treading water, and the broader U.S. economy is cooling following the outsize 4.3% real GDP growth in the third quarter. That deceleration, however, should not be mistaken for deterioration. Growth is likely converging toward its underlying trend, which is best approximated by private domestic final demand and has been growing at a 2.5% pace.
The key question now is not whether the economy is slowing, but what is doing the work underneath the hood. How much of that growth is being driven by capital deepening—investment in equipment, software, AI infrastructure, and productivity-enhancing technologies—and how much is still coming from labor inputs? That distinction will shape both the inflation outlook and the Federal Reserve’s tolerance for patience.
This week’s labor-market data will help clarify that balance. ADP and JOLTS should confirm continued cooling in labor demand rather than outright weakness. Job openings are expected to drift lower, consistent with firms trimming at the margin while remaining reluctant to shed workers aggressively. That pattern aligns with an economy leaning more on productivity than hiring to drive growth.
The ISM Services report later in the week will provide an important cross-check. Services activity remains expansionary, but employment components have been softening. A further easing would reinforce the view that labor is no longer the primary growth engine, even as demand holds up.
Friday’s employment report should anchor the week. Payroll growth is expected to remain positive but modest, with the unemployment rate holding near recent levels (possibly rising 0.1 percentage point at most) and wage growth contained. An outcome along those lines would be consistent with an economy growing near trend rather than above it, as the Q3 data showed. Economic growth is moderating but not slipping to stall speed or less.
From a policy perspective, this composition matters. Growth driven by capital deepening and productivity is inherently less inflationary than growth driven by rapid labor expansion. If the data continues to support that mix, the Federal Reserve gains time. The debate shifts from whether cuts are needed urgently to how confident policymakers can be that disinflation continues without requiring a material rise in unemployment.
The bottom line is the economy is slowing toward trend, not rolling over. Manufacturing is waiting, not faltering. And the durability of growth in 2026 will hinge less on how many jobs are added and more on how efficiently capital is deployed. Our forecast remains unchanged from where it has been since the last GDP release, with a slower pace in the near term and a stronger pace as the year progresses.
Disclaimer: This publication has been prepared for informational purposes only and is not intended as a recommendation offer or solicitation with respect to the purchase or sale of any security or other financial product nor does it constitute investment advice.
January 6, 2026
Mark Vitner, Chief Economist
mark.vitner@piedmontcrescentcapital.com
(704) 458-4000
Manufacturing Slipped Further in December, but Lean Inventories and Easing Tariff Uncertainty Suggest Stabilization Ahead
Key Takeaways from December’s ISM Report
-
- Manufacturing PMI®: 47.9 (–0.3 pts) — lowest reading of 2025; 10th straight month in contraction.
- New Orders: 47.7 (+0.3 pts) — still contracting, but marginally firmer; early stabilization, not a turn.
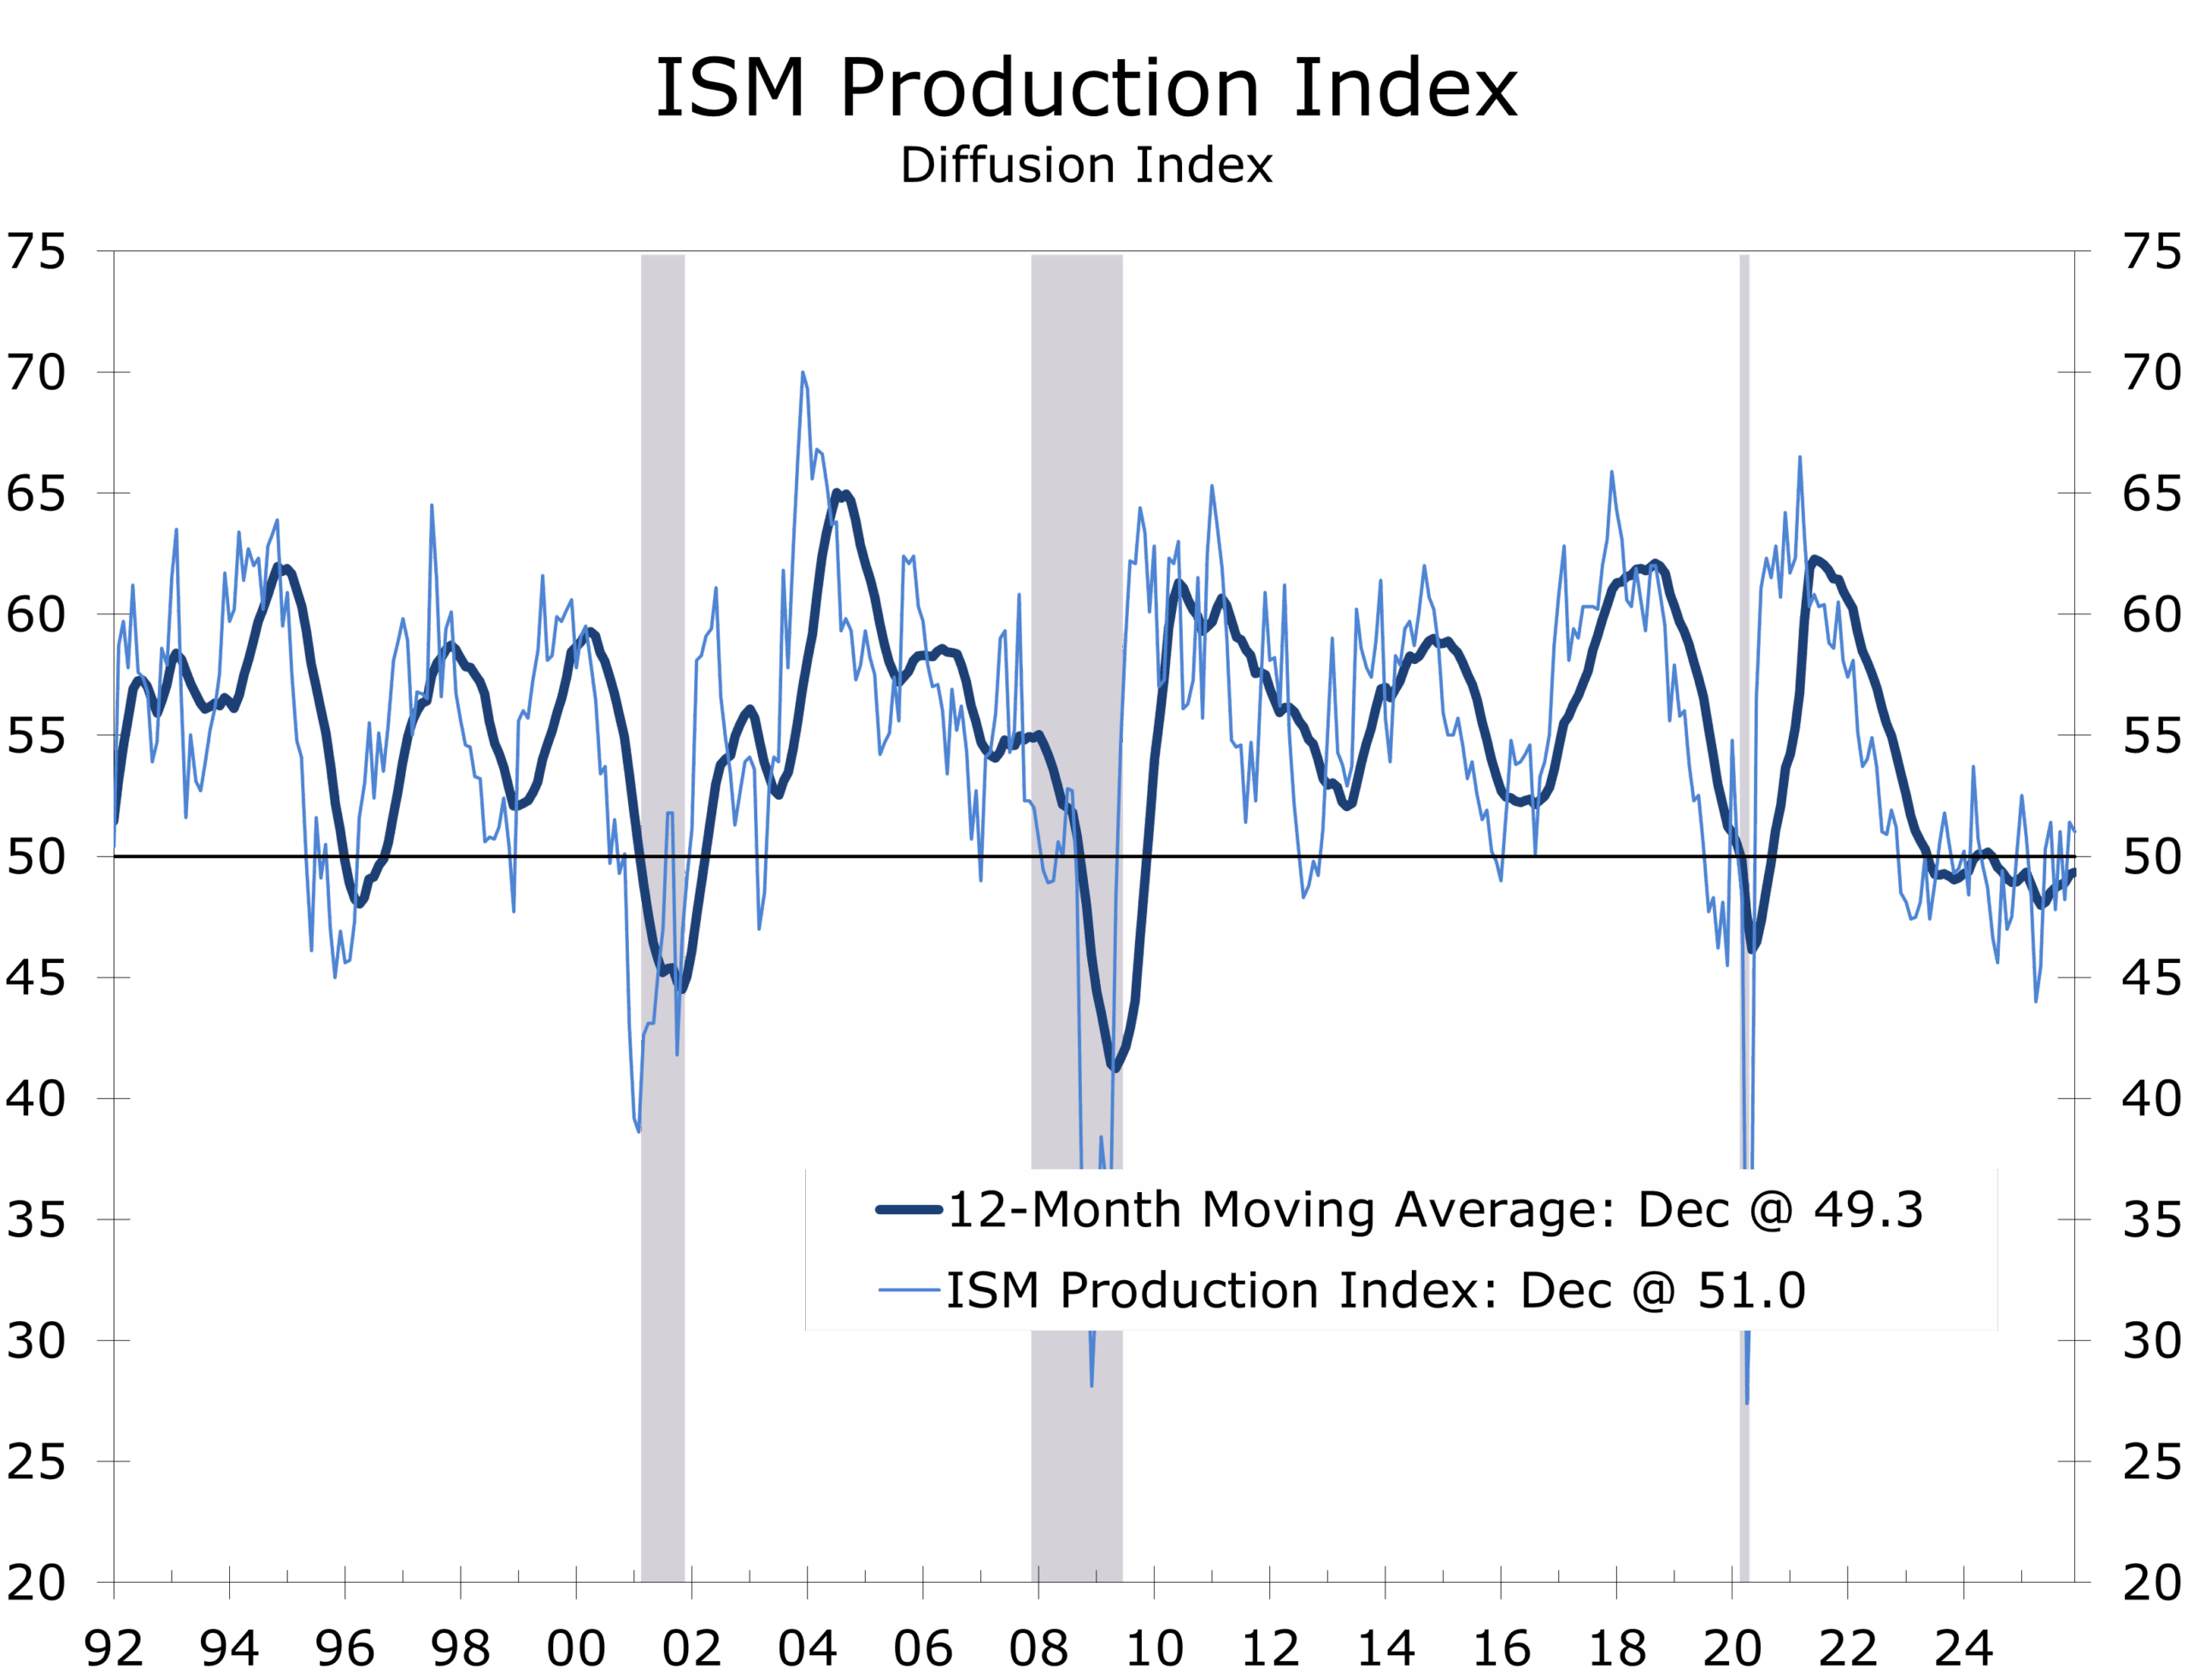
- Production: 51.0 (–0.4 pts) — still expanding, but losing momentum as demand remains soft.
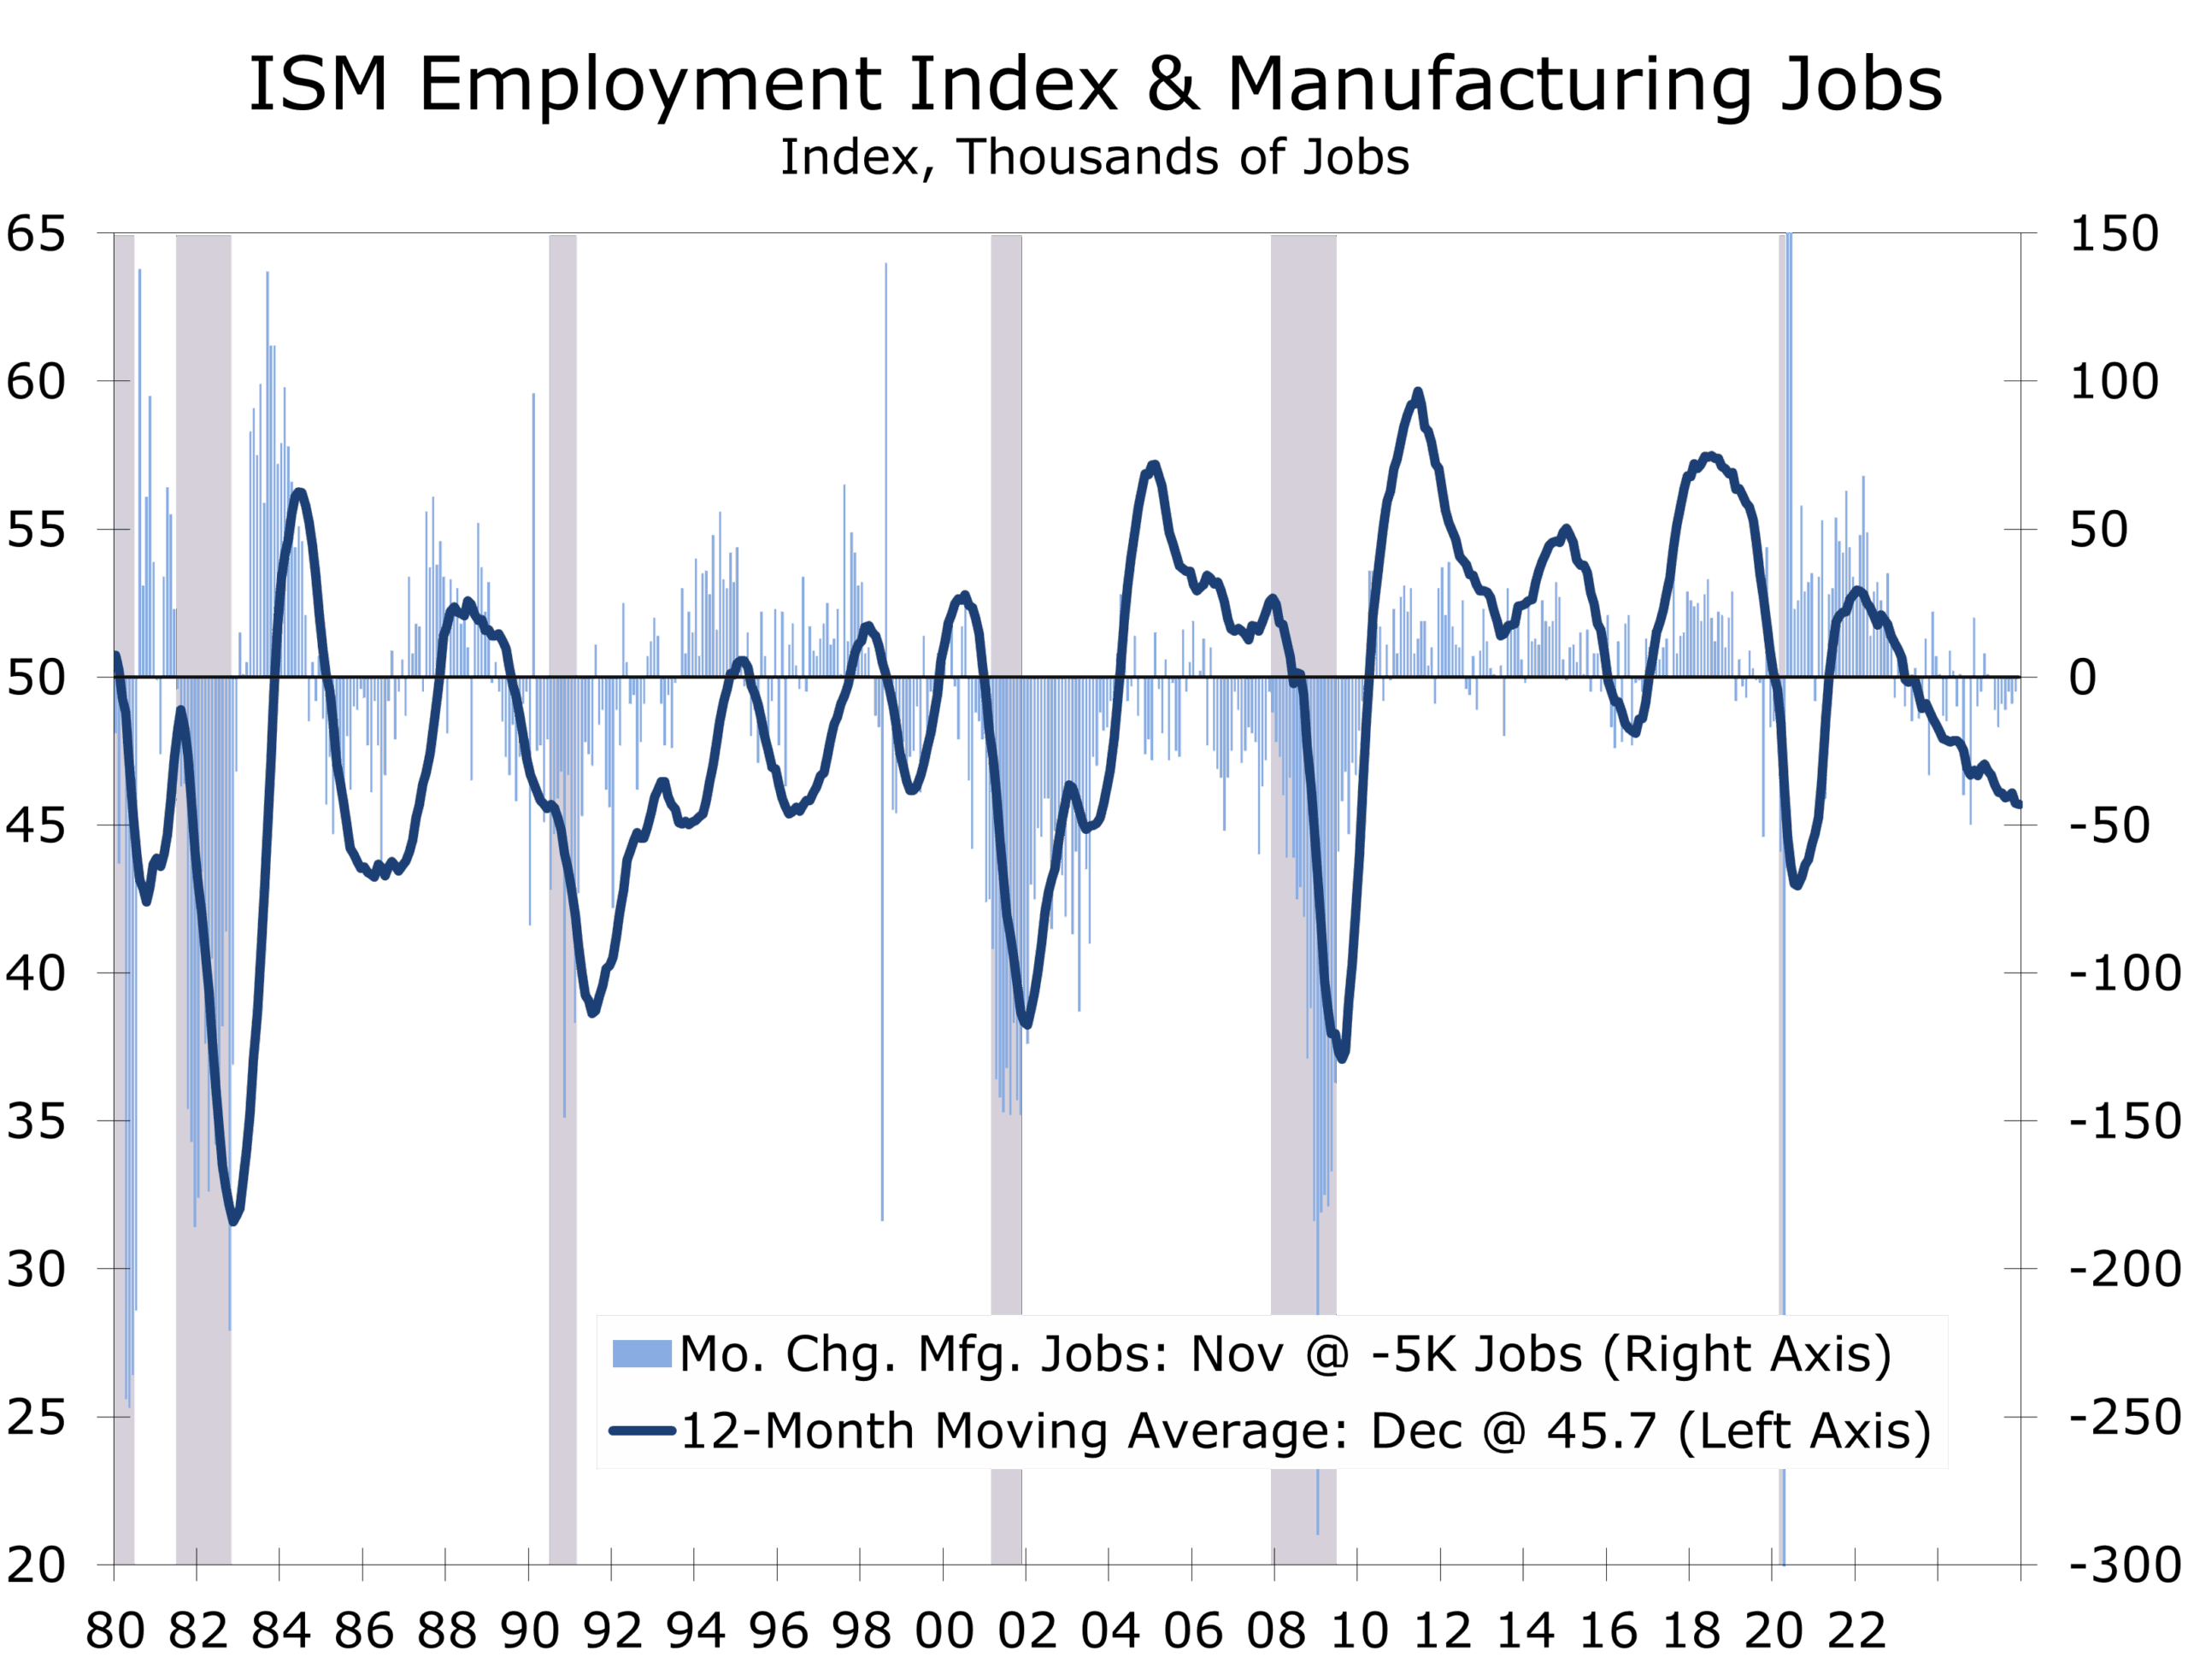
- Employment: 44.9 (+0.9 pts) — contracting at a slower pace; firms still managing headcount.
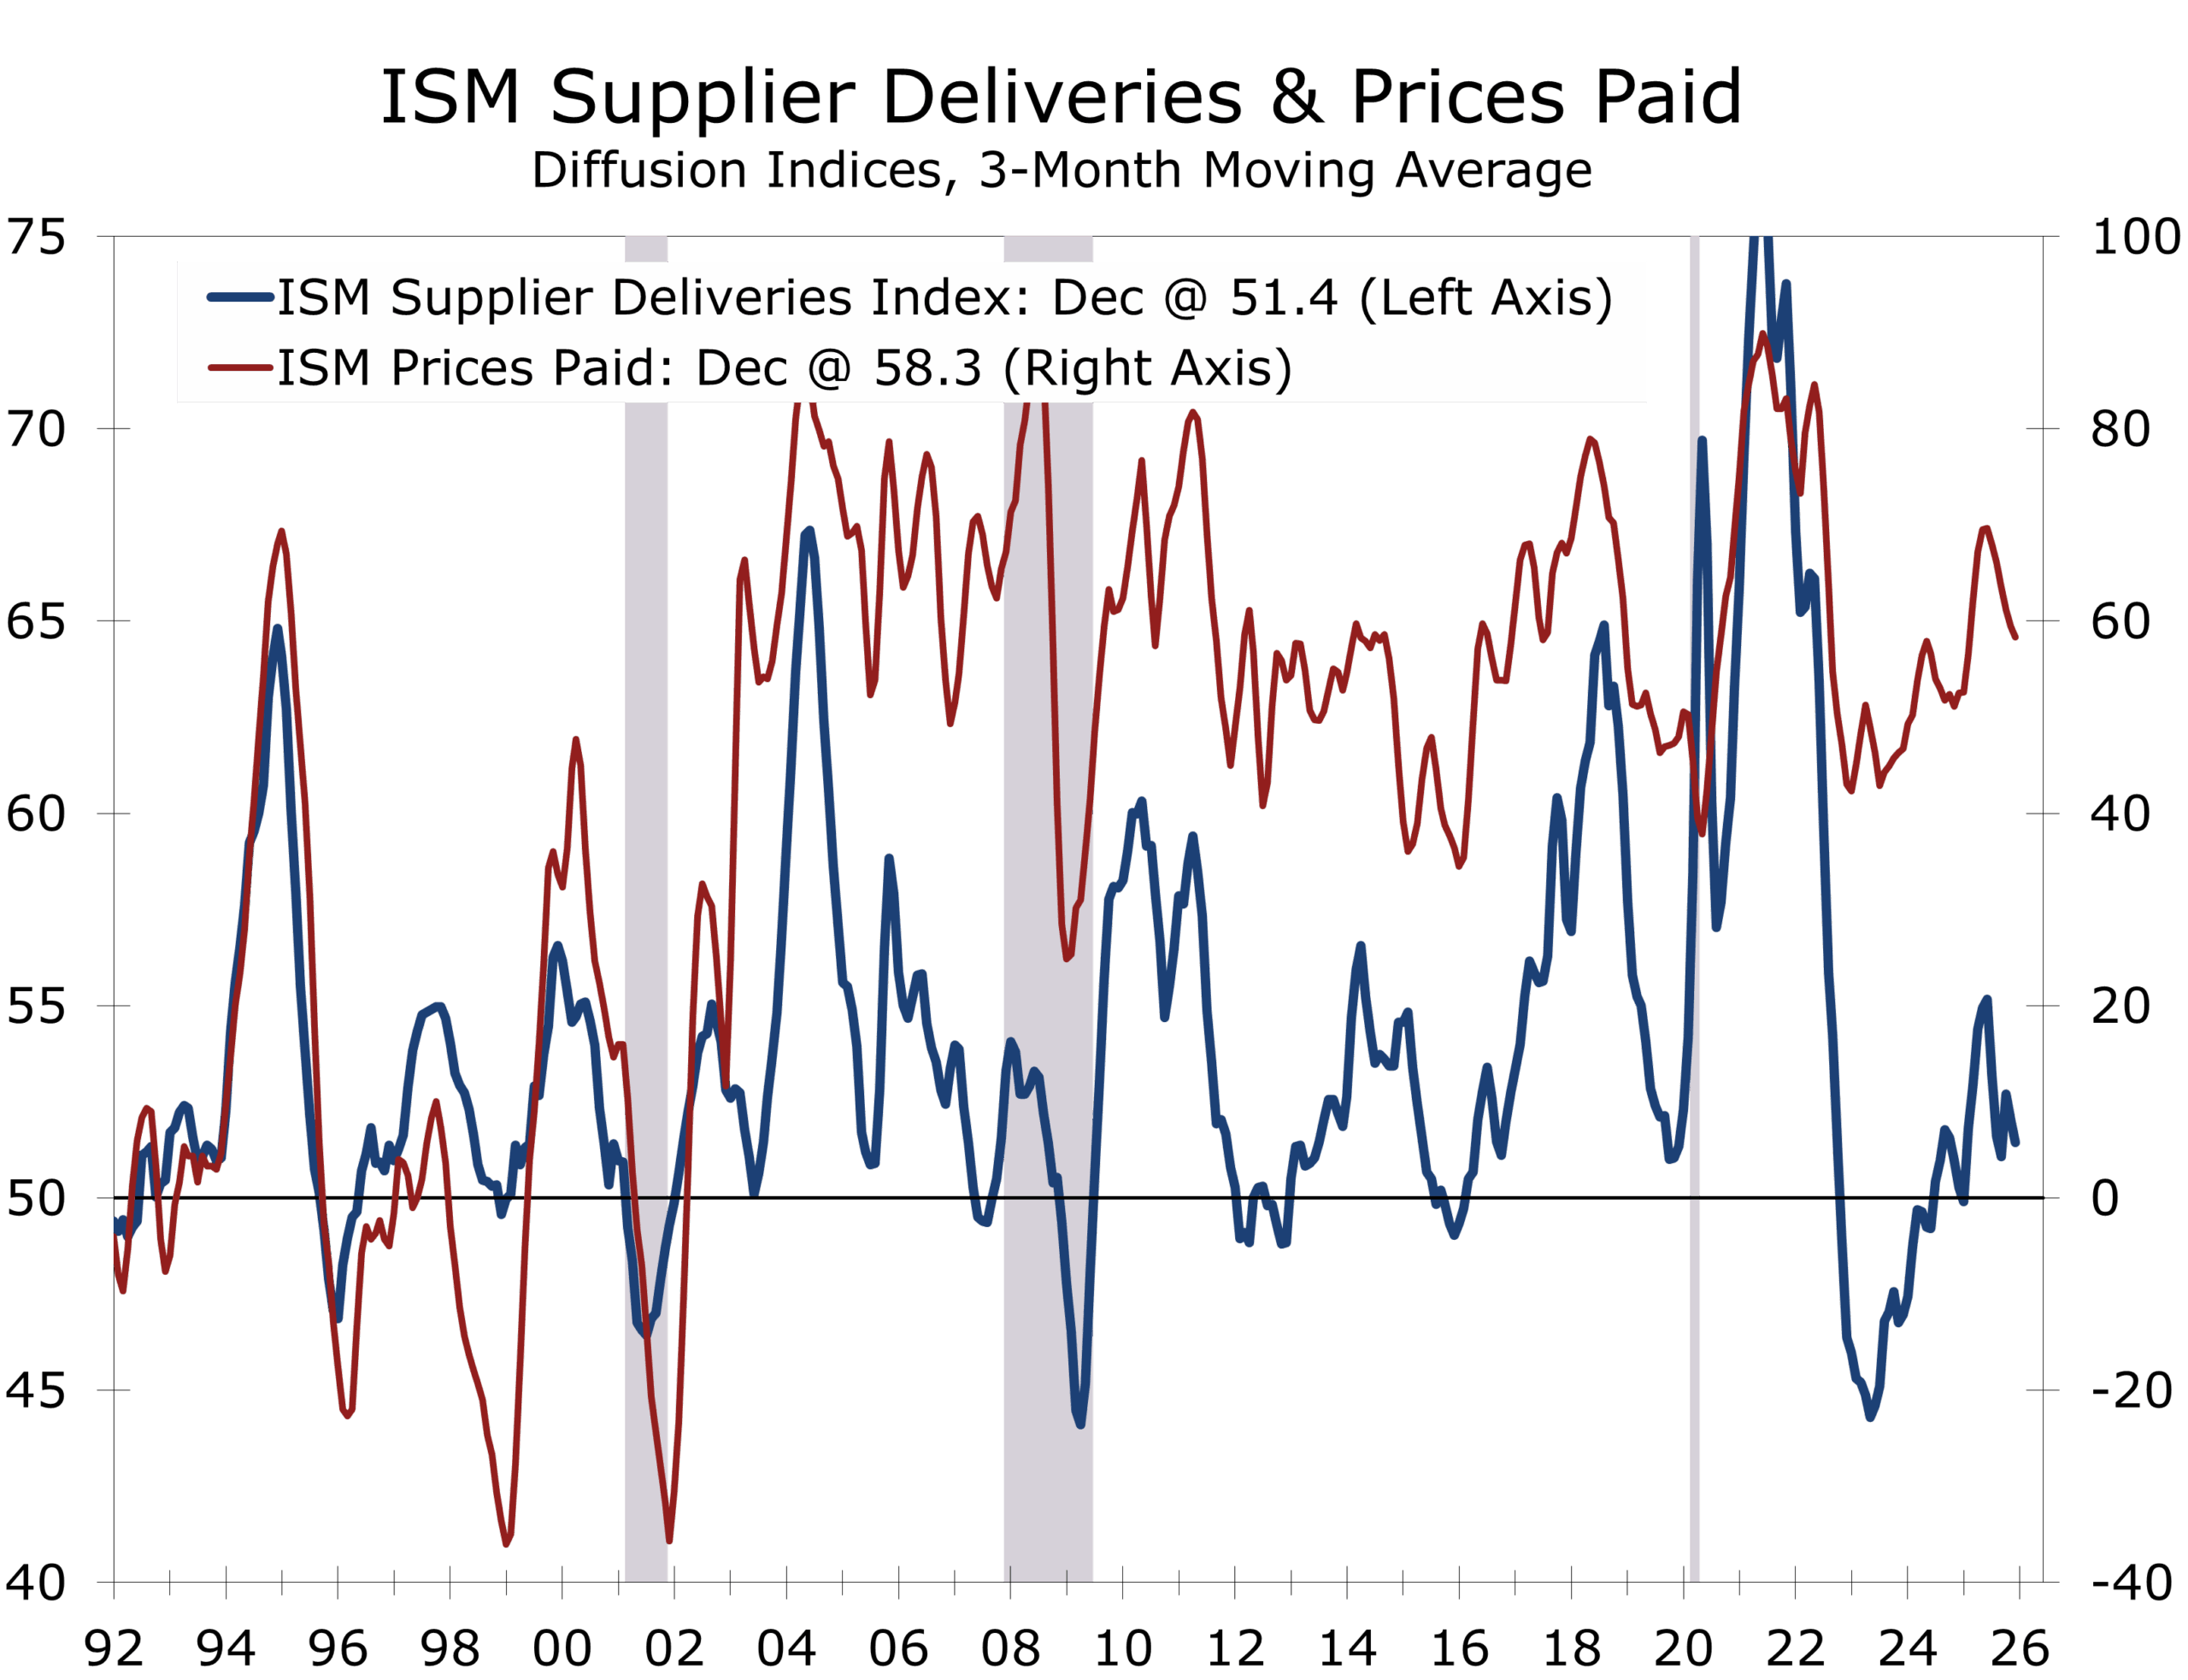
- Supplier Deliveries: 50.8 (+1.5 pts) — back to slower deliveries after one month “faster”; pockets of constraint persist.
- Inventories: 45.2 (–3.7 pts) — sharp drop; restocking is not happening yet.
- Customers’ Inventories: 43.3 (–1.4 pts) — “too low” and more acute; a future tailwind if confidence returns.
- Prices: 58.5 (unch.) — sticky cost pressure, still dominated by metals and tariff-affected inputs.
- Backlog of Orders: 45.8 (+1.8 pts) — improved, but still contracting; pipelines remain thin.
- New Export Orders: 46.8 (+0.6 pts) — slightly less weak; still sub-50.
- Imports: 44.6 (–4.3 pts) — notably weaker; suggests demand restraint and/or tariff-driven sourcing shifts.
- GDP signal: ISM equates 47.9 to roughly +1.6% annualized real GDP, consistent with continued overall expansion. Core GDP is running about a percentage point higher, helped by continued strong capital spending.
Lean Inventories Persist as Confidence Limits Growth
The ISM Manufacturing PMI® slipped to 47.9 in December, the lowest reading of 2025 and the sector’s tenth consecutive month in contraction. As with prior months, the sub-50 reading reflects the breadth of softness, not a collapse in activity. Manufacturing remains a drag on overall growth, but the level of the PMI is still consistent with continued overall economic expansion, reinforcing our view that the U.S. economy is moving through a long adjustment phase, or policy reset, rather than a cyclical downturn.
What stands out in December’s report is not deterioration, but hesitation. Capacity is adequate, supply chains have largely normalized, and production continues to expand modestly. Yet firms remain reluctant to take risk, particularly when it comes to inventories, hiring, and forward purchasing. This posture closely mirrors the themes laid out in our 2026 outlook, where policy uncertainty and cost visibility matter as much as demand itself.
Demand is not collapsing, but it is not strong enough to restore confidence.
Demand indicators remain in contraction, but the pace of decline moderated. New Orders (47.7), Backlog of Orders (45.8), and New Export Orders (46.8) all improved modestly from November, suggesting that demand is stabilizing at low levels rather than continuing to weaken. At the same time, Imports fell sharply to 44.6, signaling a deliberate pullback in purchasing and a continued preference for flexibility over volume. This is consistent with an environment where firms are choosing to wait for clearer signals on trade policy, tariffs, and global growth before fully reorienting supply chains and committing capital.
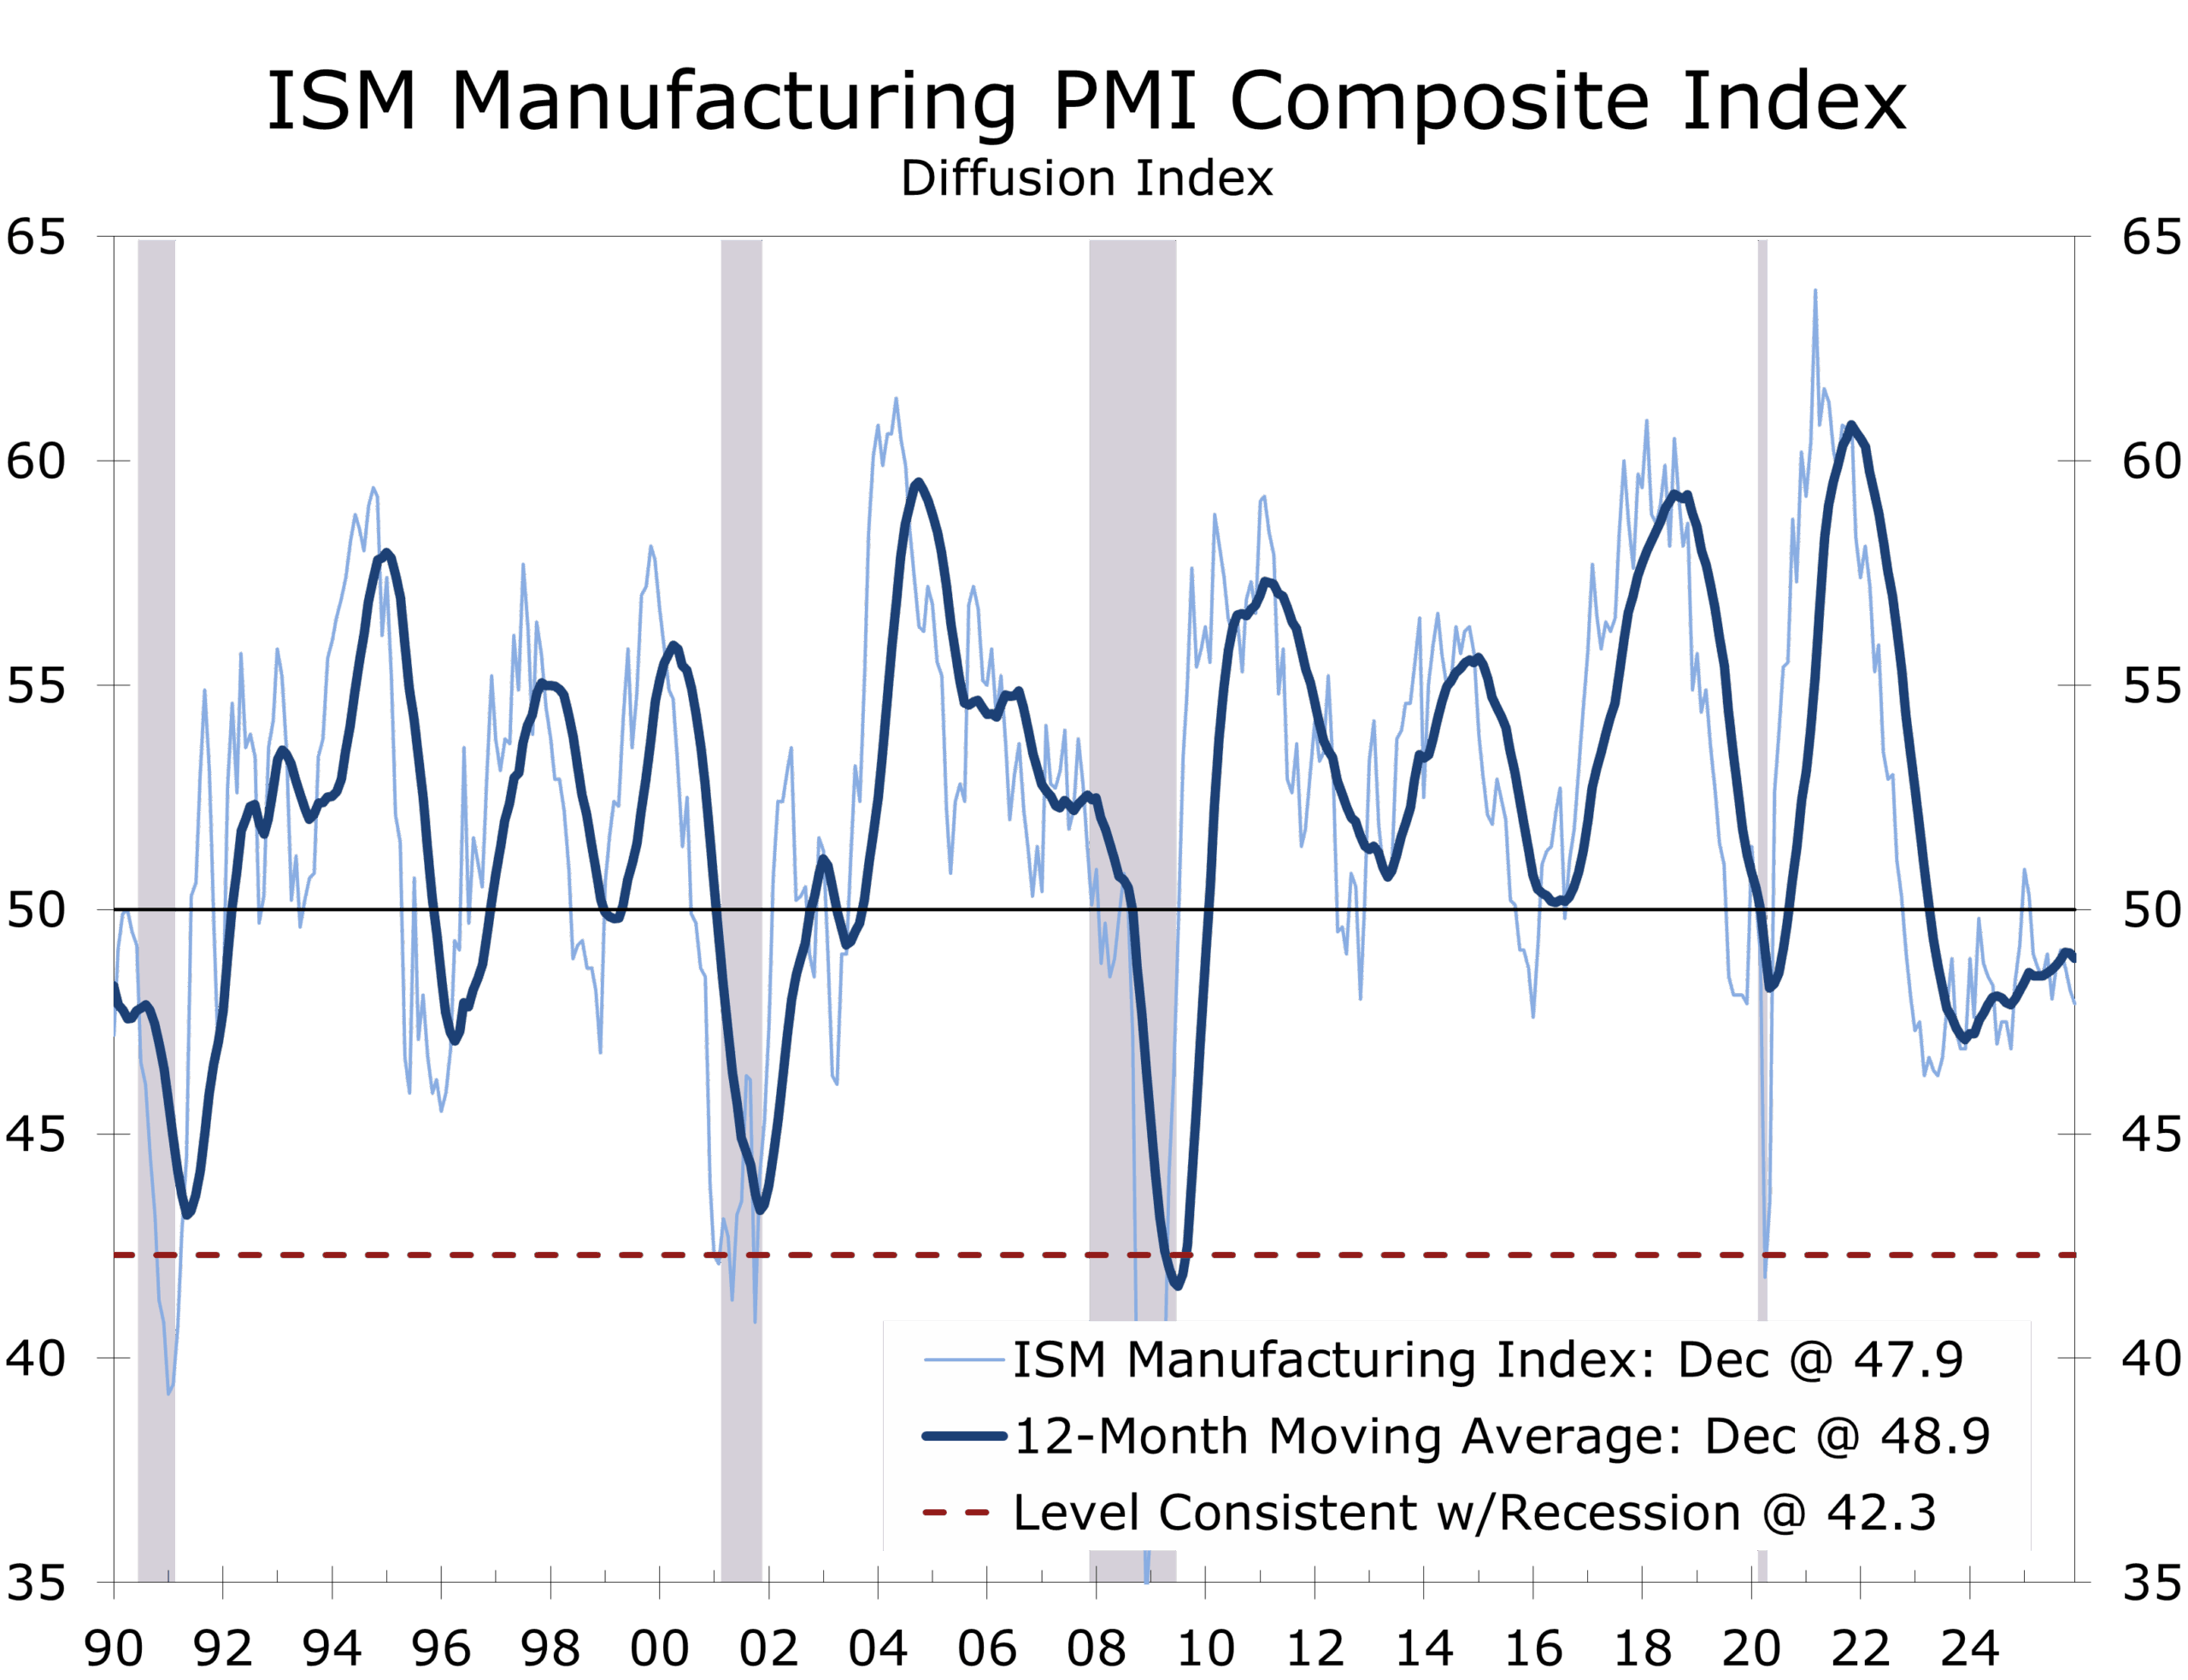
Despite soft orders, Production remained in expansion at 51.0, though momentum eased. Output continues to be supported by execution on existing programs and selective capital spending, particularly in electronics and electrical equipment. This dynamic aligns with our outlook that the current cycle is capital-led rather than demand-led, with growth concentrated in productivity, automation, and targeted investment rather than broad restocking or consumer-driven expansion.
Labor conditions reinforce that interpretation. The Employment Index rose to 44.9, indicating that contraction slowed but hiring did not resume. Firms continue to manage headcounts carefully, relying on attrition and selective reductions rather than expansion. Manufacturing is adjusting gradually to a more capital-intensive model, one that supports output without requiring significant labor growth.
This remains a cycle defined by capital discipline, not labor expansion.
The most important signal in the December report lies in inventories. Manufacturers’ Inventories fell sharply to 45.2, while Customers’ Inventories dropped further into “too low” territory at 43.3. Historically, this combination has been a reliable setup for a restocking cycle. Yet firms are still choosing restraint, running lean inventories and pulling back on imports rather than rebuilding stock.
This divergence confirms a key conclusion of our 2026 outlook: the inventory cycle is deferred, not broken. The ingredients for replenishment are present, but the trigger—greater confidence in policy, pricing, and demand visibility—has yet to emerge. When restocking does arrive, it is likely to be selective, not broad and immediate.
Inventories are lean, but confidence remains the binding constraint.
One major determinant on the timing of an inventory rebuild is costs. Cost pressures continue to shape behavior. The Prices Paid Index held at 58.5, with gains driven primarily by metals and tariff-affected inputs. This remains a cost-push environment rather than a demand-driven inflation story. Persistent input costs, combined with limited pricing power, continue to compress margins and discourage aggressive inventory rebuilding, even as logistics conditions improve.
Sector breadth underscores the narrowness of strength. Only two industries expanded in December, with Computer & Electronic Products again standing out. ISM estimates that 85 percent of manufacturing GDP contracted during the month, up sharply from November. Growth remains concentrated in capital-intensive and policy-supported segments, consistent with our expectation that 2026 expansion will be uneven and selective rather than broad-based. There has been some progress made in reshoring efforts, particularly with new and expanded facilities for steel, tech hardware, household appliances, and pharmaceuticals.
For policymakers, December’s ISM report supports a message of patience. Manufacturing is not generating renewed inflation pressure, nor is it weak enough to force urgent easing. The path likely remains unchanged, although the pace may slow a bit unless the labor market shows more dramatic signs of weakening. The data reinforce a backdrop in which policy clarity, particularly around trade, may matter as much as interest rates in unlocking a manufacturing comeback. The report also fits squarely within our broader 2026 framework: lean inventories, cautious managers, resilient execution, and a restocking cycle waiting on confidence and clarity on tariffs.
Disclaimer: This publication has been prepared for informational purposes only and is not intended as a recommendation offer or solicitation with respect to the purchase or sale of any security or other financial product nor does it constitute investment advice.
January 5, 2026
Mark Vitner, Chief Economist
(704) 458-4000
The Piedmont Perspective – It Is Not About Oil. It Is About China and Russia and How Venezuela's Oil Wealth Relates to Them
The Move on Venezuela is About Much More than Oil
Executive takeaway
Venezuela’s regime change is not an oil supply shock but a network disruption that weakens Russia-China-Iran-Cuba gray zone operations, trims geopolitical and energy tail risks, and slows sanctions arbitrage at the margin. The result is modest support for the dollar, lower inflation volatility, and a slightly wider monetary policy runway without altering the Federal Reserve’s core reaction function.
Disclaimer: This publication has been prepared for informational purposes only and is not intended as a recommendation offer or solicitation with respect to the purchase or sale of any security or other financial product nor does it constitute investment advice.
January 5, 2026
Mark Vitner, Chief Economist
Piedmont Crescent Capital
A View from the Piedmont: Our Weekly Commentary on Money, Credit, Exchange Rates & Geopolitics – Santa Rally, Silver & Gold, and a World That Will Not Sit Still
Highlights of the Week
- Q3 GDP printed a robust 4.3% annualized pace, driven by strong consumer spending and AI-related investment.
- The labor market looks stable on the surface, with initial claims at 214k, but lower turnover and cautious hiring point to a more nuanced backdrop.
- Markets are pricing a gradual Fed easing cycle following the recent 25bp cut to 3.5%–3.75%, with CME data signaling a slow-and-steady approach.
- Silver and gold shone brightly, like a familiar holiday tune, highlighting a shift toward hard asset hedging amid supply concerns and expectations of rate cuts.
- Geopolitical tensions remain front and center, with developments in Ukraine, the Middle East, and Taiwan underscoring a world that is anything but quiet
- 2025 is ending the way many past years have: optimism in the tape, anxiety in the headlines, and history reminding us that “quiet” is usually just a comma, not a period.
Gold, Growth, and a Job-Light Economy
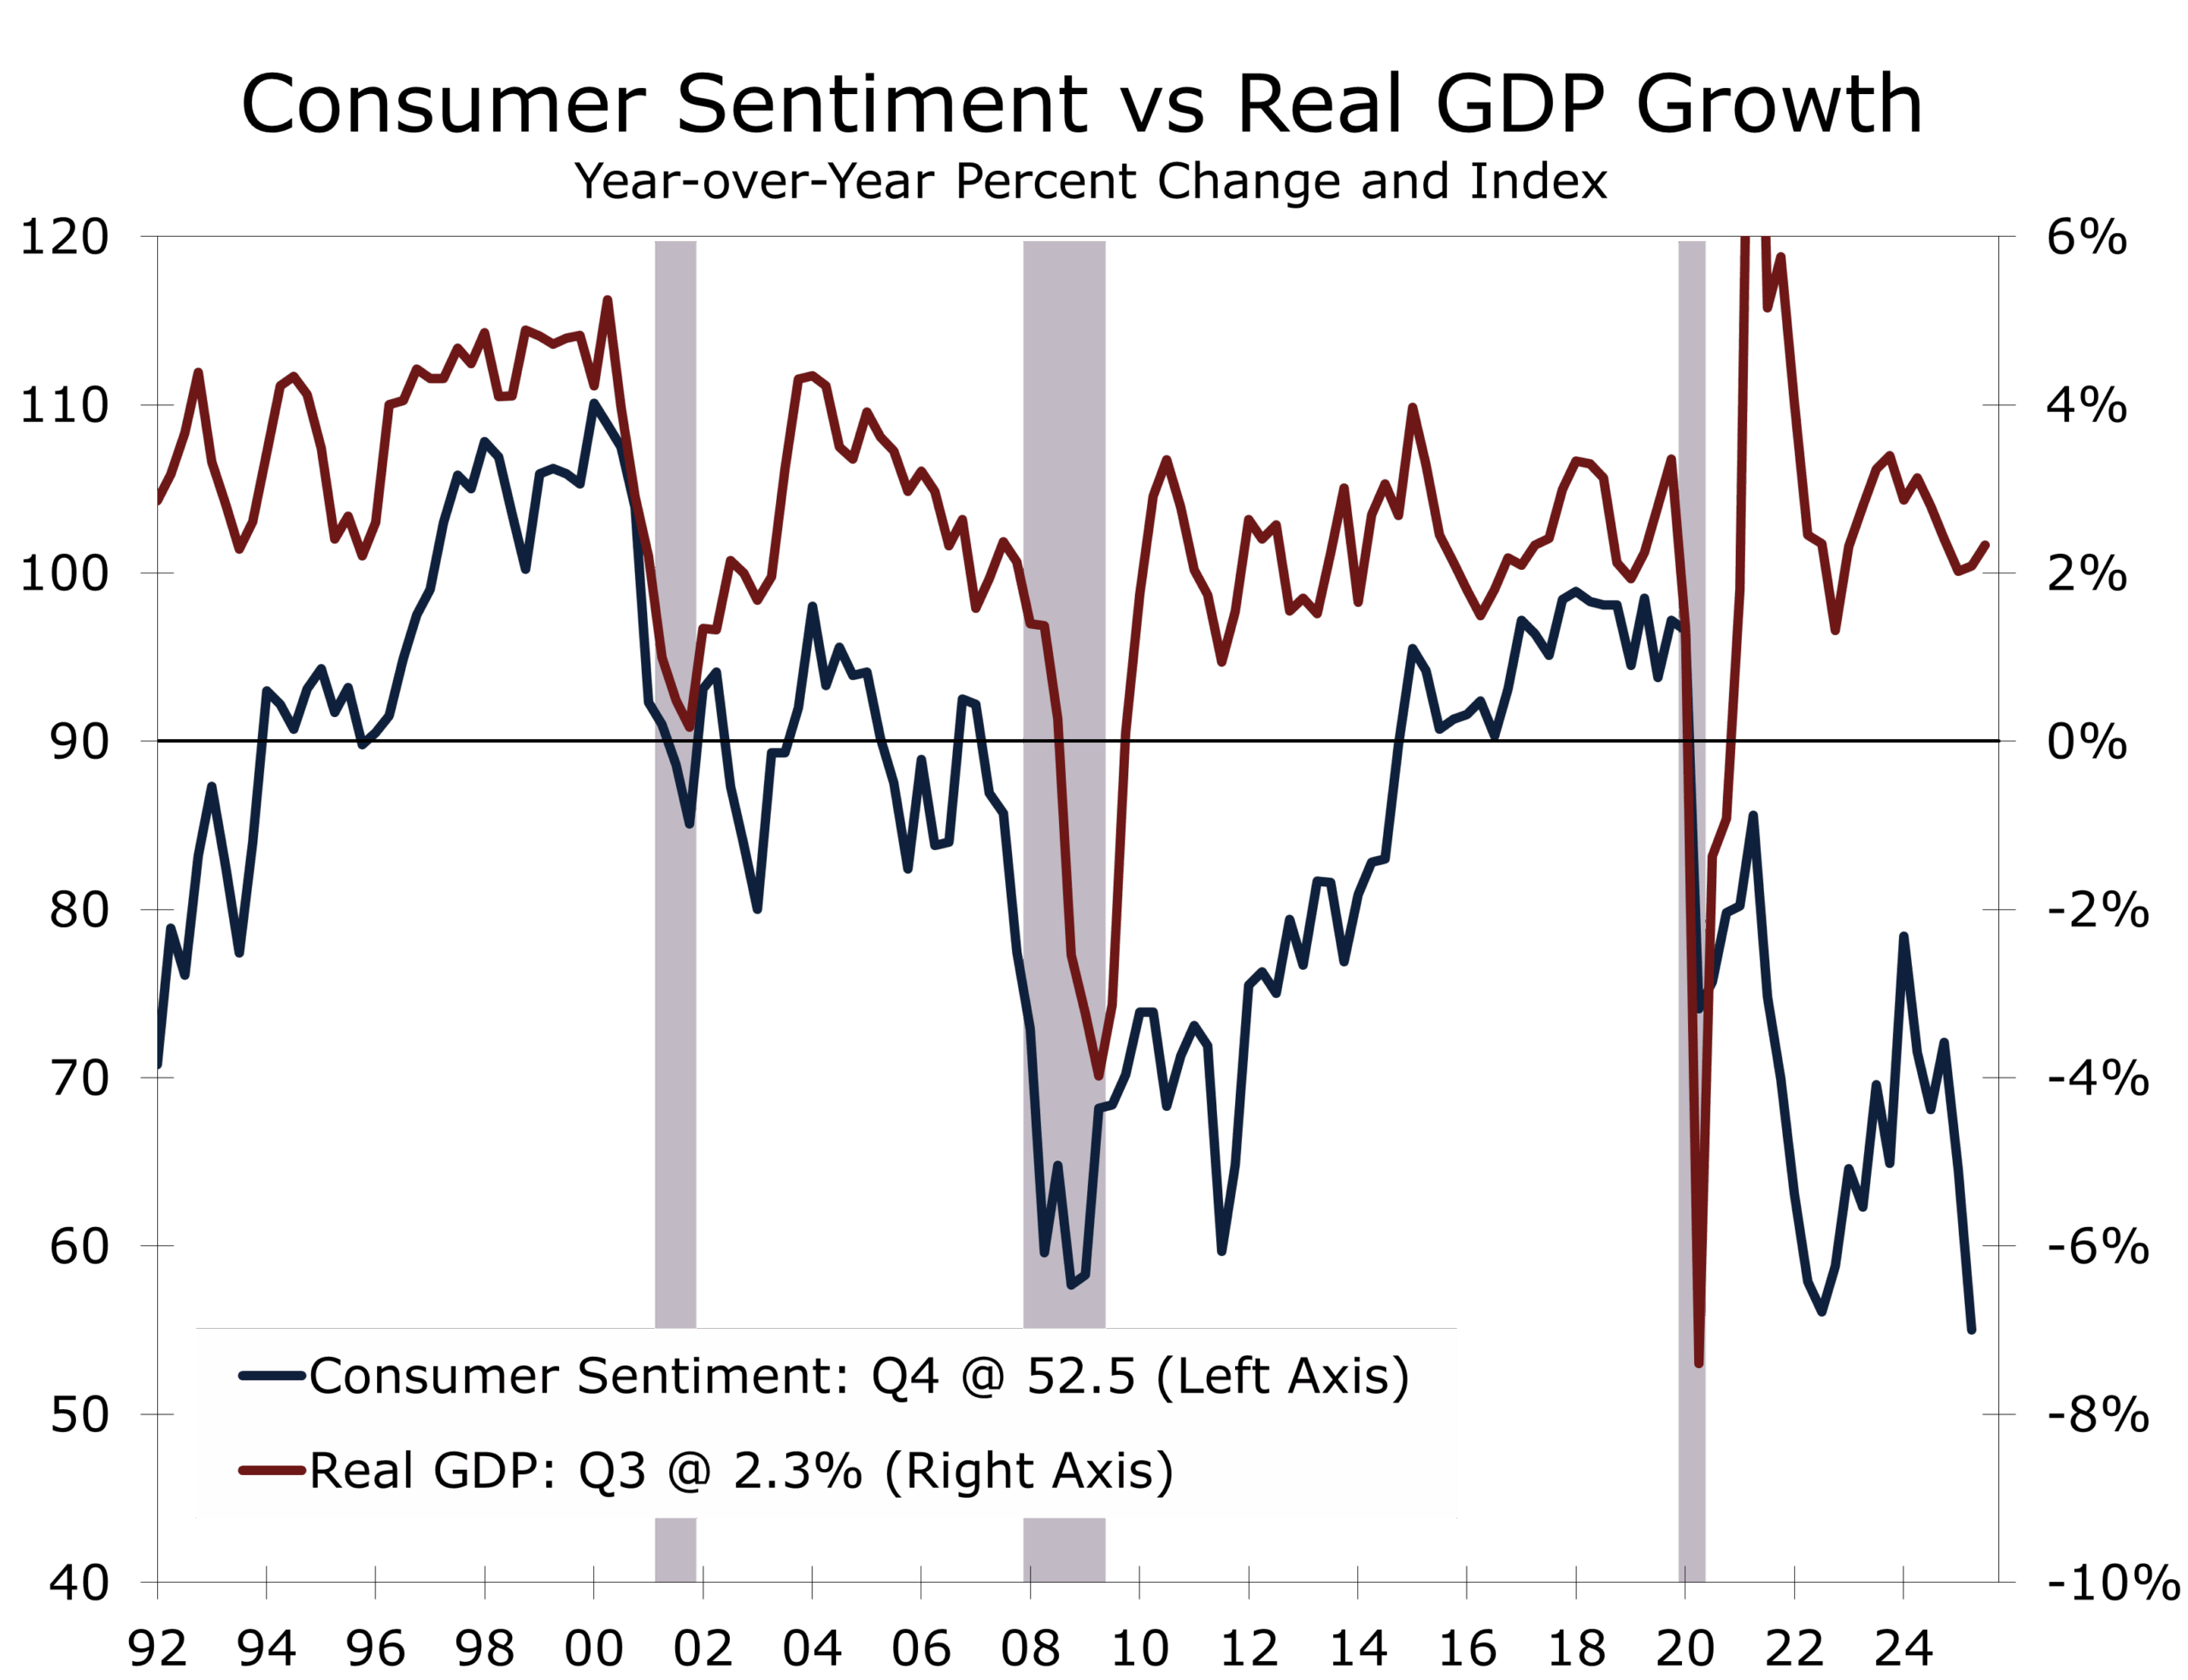
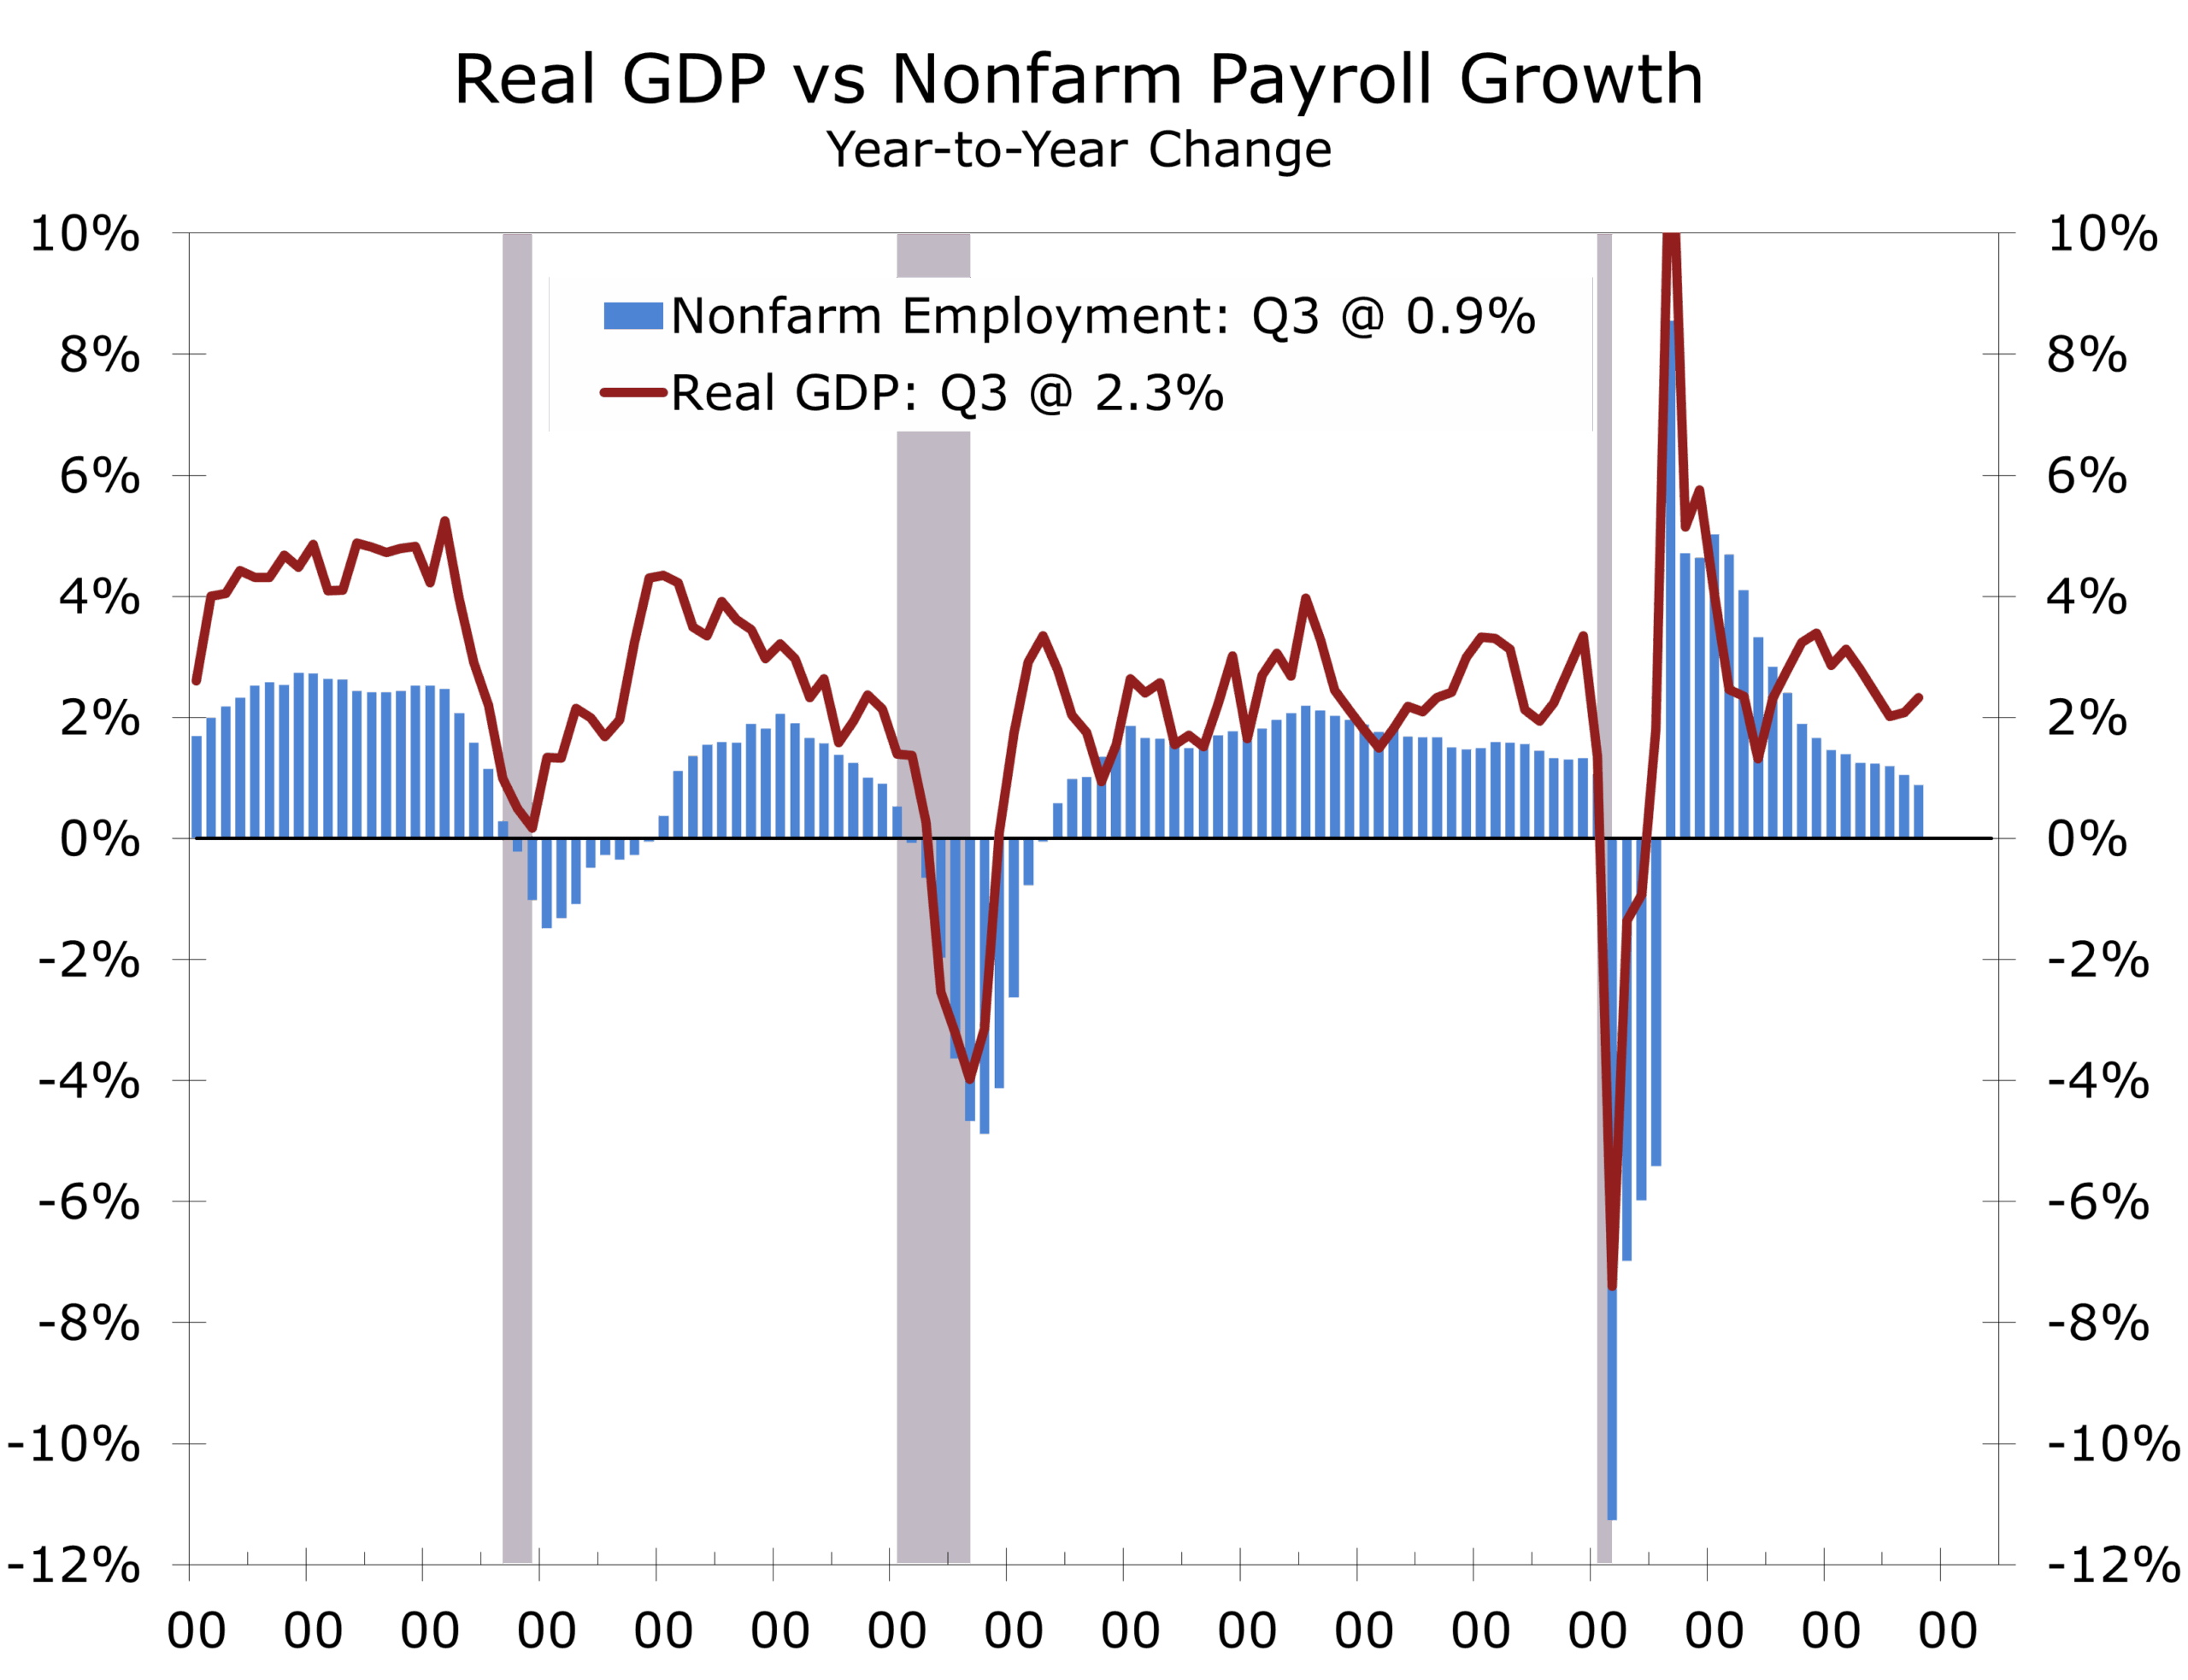
The final full week of 2025 delivered a familiar late-cycle paradox. The macro data still reads like an economy with plenty of altitude, with Q3 real GDP coming in at 4.3% annualized and up 2.3% over the past year, with growth powered by solid consumer spending and an AI-driven investment surge tied to reshoring and technology buildouts. Yet confidence data tells a different story. The economy increasingly feels like one experiencing vertigo.
Things appear to be spinning around the periphery. Consumer confidence fell again in December, with households citing employment and income concerns alongside the usual worries about inflation and politics. The message is not that the expansion is ending. Rather, progress is becoming harder to feel in real time. That disconnect is a defining feature of this job-light, capex-heavy cycle and shows up repeatedly in headlines about how difficult it remains for new entrants and re-entrants to secure employment.
The economy is growing, but the labor market is no longer the messenger.
Under the hood, the labor market is still behaving, at least in the narrow sense that matters for recession risks. Initial jobless claims fell to 214k in the latest week, a historically low level inconsistent with broad-based layoffs. But the labor picture is more nuanced. Turnover remains exceptionally low. With fewer workers voluntarily quitting, firms are hiring less aggressively. Layer in the effects of AI adoption, earlier over-hiring, and lingering reluctance to trim payrolls after the pandemic, and the result is a labor market that looks calm on the surface while quietly adjusting to a more cautious, lower-churn footing.
Labor market uncertainty remains one of the largest open questions for the economy and the 2026 outlook. Revised employment data due early next year are expected to show that job growth slowed sharply in late 2025 and may have briefly turned negative. That would be unusual for an expanding economy. Historically, even modest employment declines have tended to coincide with the onset of recession.
Not every hiring slowdown signals a recession. This job-light expansion appears to be by design.
This cycle may be different, which remains the most dangerous phrase in forecasting. Productivity gains, capital investment, and deliberate talent retention are playing a larger role than broad-based hiring. Rather than an expansion riding a wave of payroll growth, today’s economy is advancing with leaner workforces and stronger productivity, a possible sequel to the “New Economy” dynamics of the late 1990s. Growth is being powered less by headcount and more by automation, efficiency, and strategic staffing, including retaining experienced workers, selectively outsourcing, and relying more heavily on contract and temporary labor.
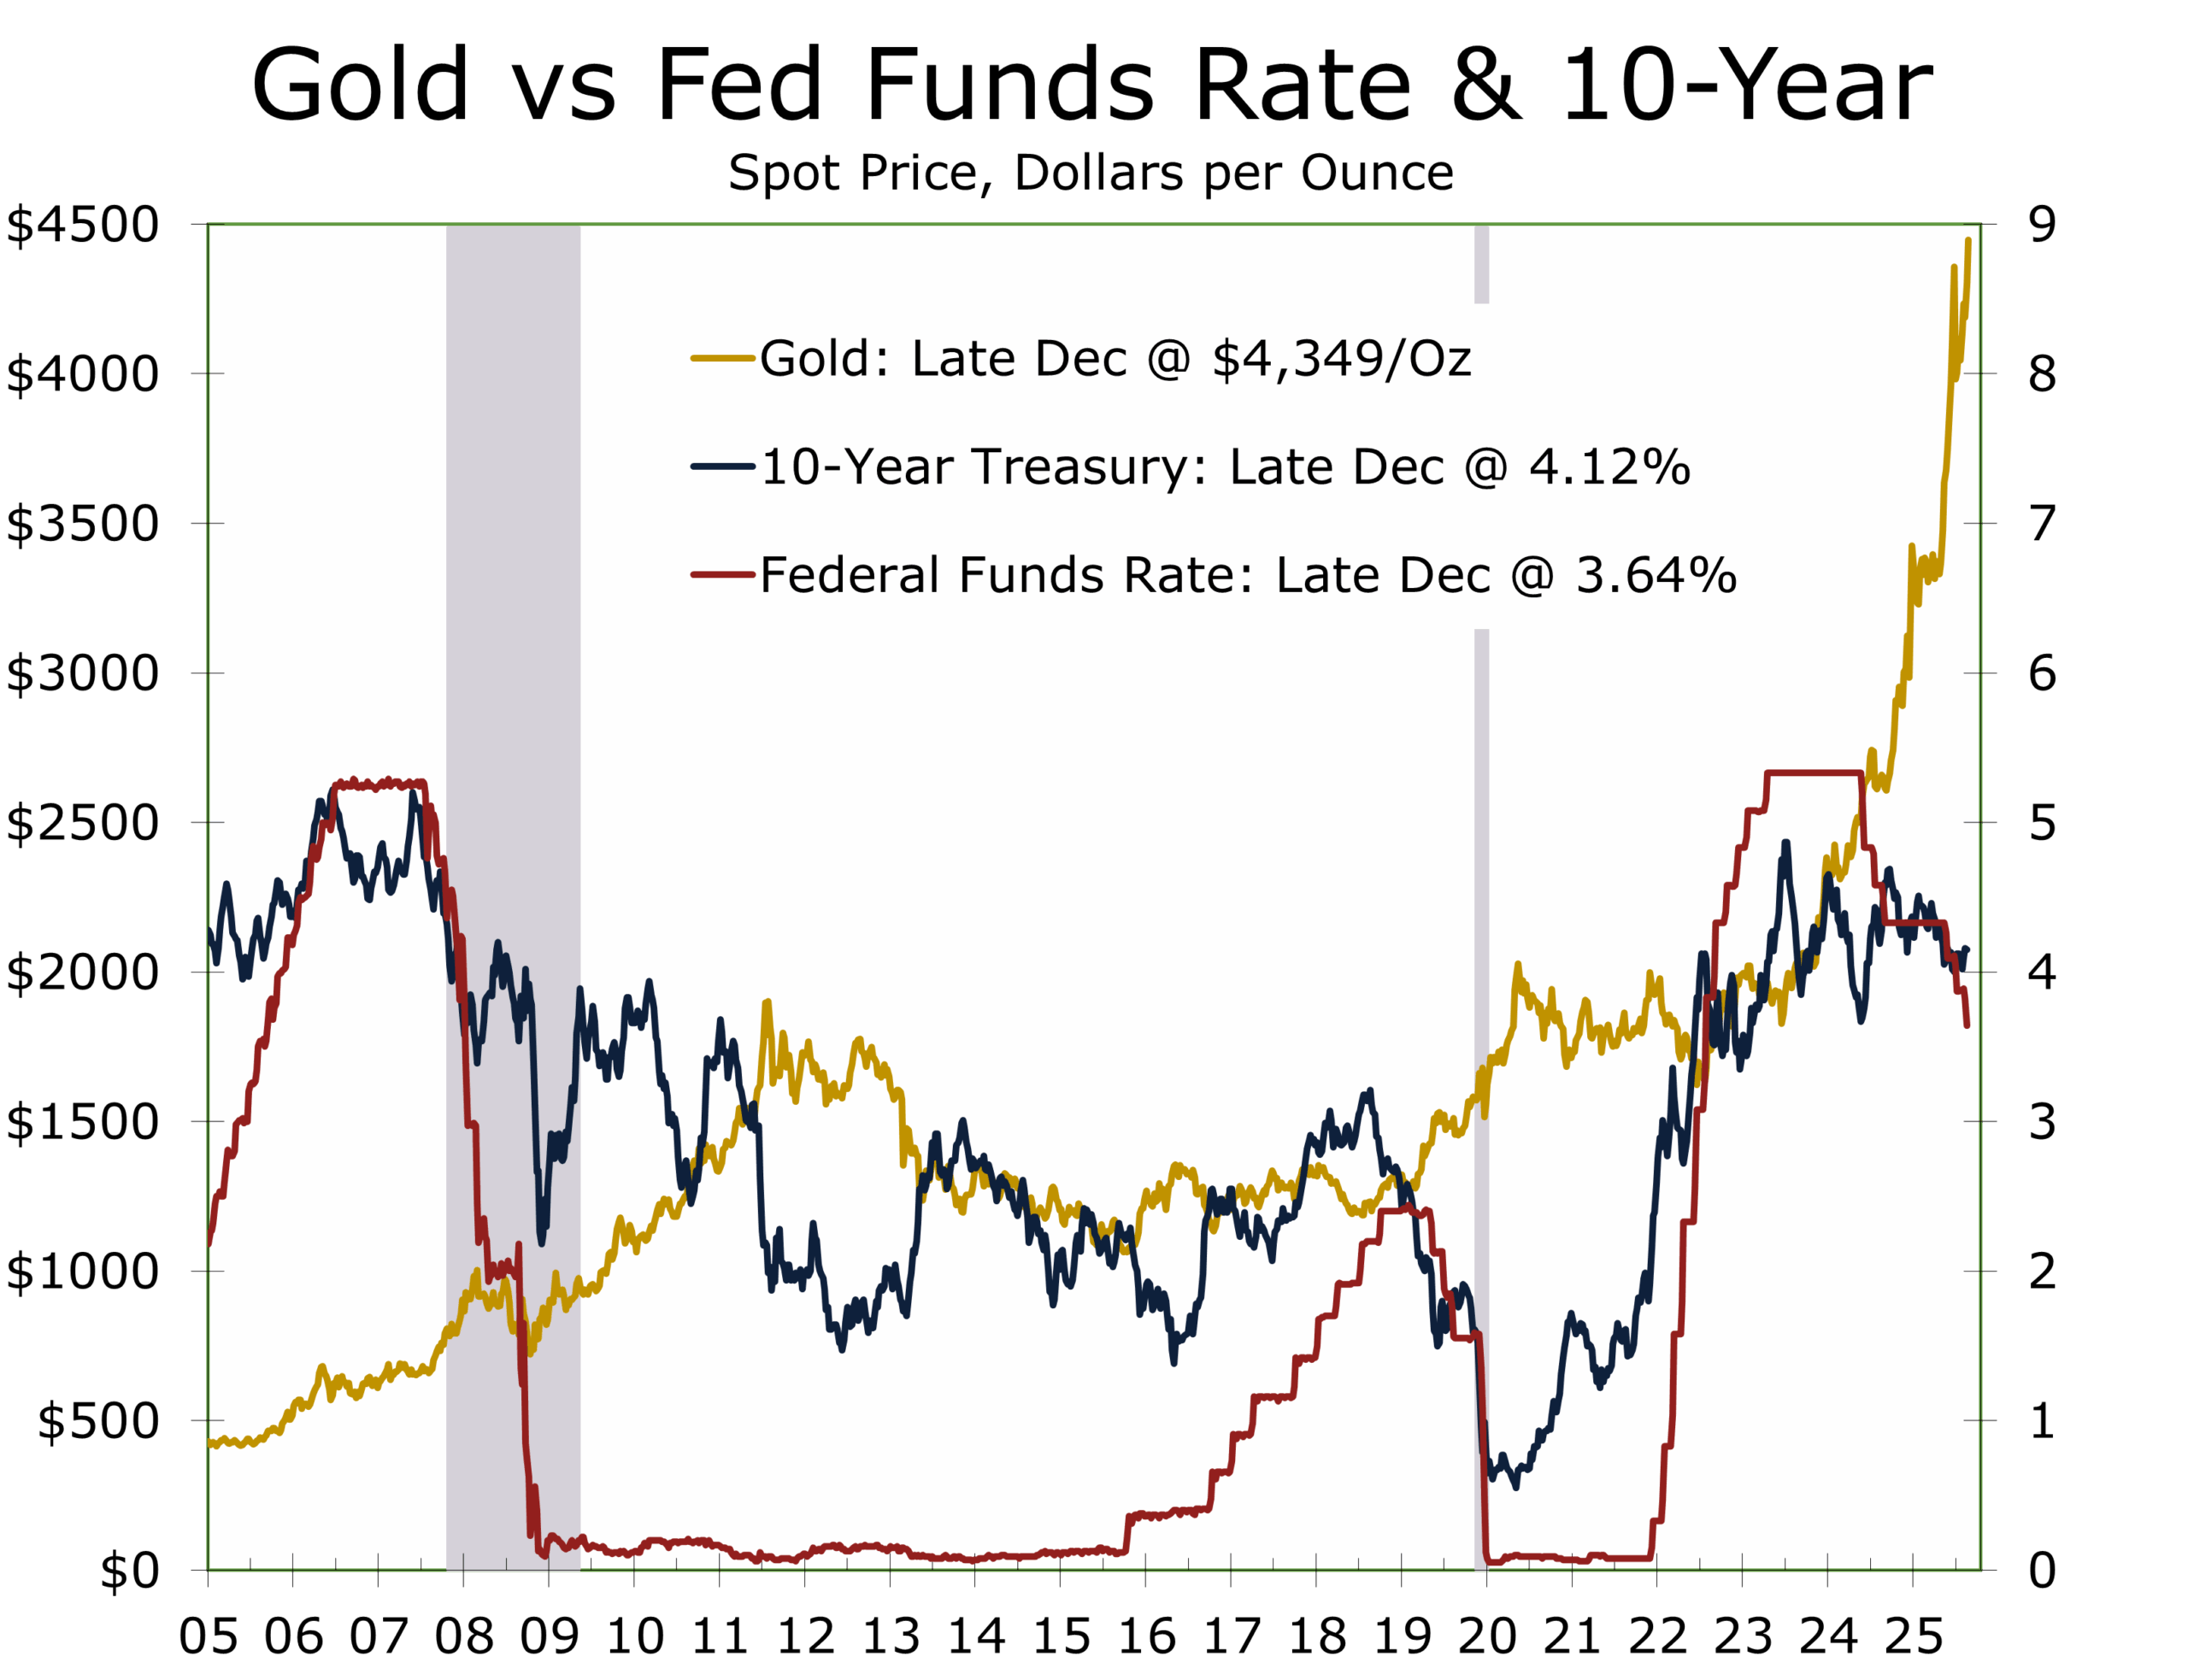
Markets appear to be reading from the same script. Risk assets are closing the year on a firm note, but the more revealing signals came from hedges rather than headlines. A weaker dollar and a renewed bid for precious metals, specifically silver and gold, echo a familiar holiday refrain from Rudolph the Red-Nosed Reindeer that is now hard to get out of my head. These moves suggest investors are positioning for a sequel economy defined less by labor abundance and more by real constraints, including power availability, debt capacity, and the ability to absorb and deploy rapid gains in artificial intelligence.
Markets are hedging constraints, missing data points, and policy uncertainty—not contraction.
Part of the move reflects rate-cut expectations and renewed questions about Federal Reserve independence. It also points to growing recognition that the industrial economy is colliding with bottlenecks in electrification-era inputs. Data center and power projects are crowding out other industrial projects at the margin. The tape is not signaling a crisis. Instead, it is quietly pricing a regime shift toward hard assets, supply security, and resilience premia in an economy running more on efficiency than expansion. One encouraging signal has been the recent strength in transportation stocks, which may be hinting at an end to the long-running freight recession.
Recent Developments: Signals Beneath the Noise
That resilience theme extends beyond economics into geopolitics. Ukraine is moving toward a negotiation framework, with a revised 20-point peace proposal reportedly under discussion with President Trump, even as the hardest questions around territorial concessions and security guarantees remain unresolved. In the Middle East, Trump and Netanyahu are preparing talks on the next phase of a Gaza plan, though the ceasefire architecture remains fragile, particularly following recent comments from Iranian leadership and the apparent launch of three satellites.
In Asia, China’s largest-ever drills around Taiwan served as a reminder that geopolitical tail risks are no longer confined to the margins. They are part of the main distribution. Trump’s more aggressive posture toward Venezuela and recent arms commitments to Taiwan may also be contributing to Beijing’s willingness to apply pressure on the island.
Looking Ahead
As we turn the page to the first week of the new year, attention will shift back to fresh economic data. The ISM manufacturing index, December’s employment report, and updated readings on consumer sentiment will help set the tone for how 2026 begins.
Before that, the coming week features a lighter calendar, offering a brief pause to recharge and, perhaps, watch a bit more football. Key releases include the FOMC minutes from the December 9–10 meeting on Tuesday, weekly jobless claims on Wednesday, and global and U.S. PMI indices from S&P on Friday. As always, we will be watching for evidence that reinforces or challenges the soft-landing narrative and tests whether the Fed’s cautious easing path remains appropriate. Our preference would be for cuts at alternating meetings, extending the easing cycle without materially lowering the terminal rate.
For now, the economy appears to be staying on script, marked by cautious optimism, an affinity for gold, and a world that never quite sits still.
As we close out 2025, we want to thank our readers and clients for the continued engagement and dialogue. We wish you a healthy, prosperous, and thoughtful New Year, and we look forward to navigating 2026 together.
Disclaimer: This publication has been prepared for informational purposes only and is not intended as a recommendation offer or solicitation with respect to the purchase or sale of any security or other financial product nor does it constitute investment advice.
December 29, 2025
Mark Vitner, Chief Economist
mark.vitner@piedmontcrescentcapital.com
(704) 458-4000