
Consumer Prices Rise Close to Expectations
Inflation Continues to Slowly Decelerate
- The Consumer Price Index came in close to expectations, with the headline index rising 0.4% and the core rising 0.5%.
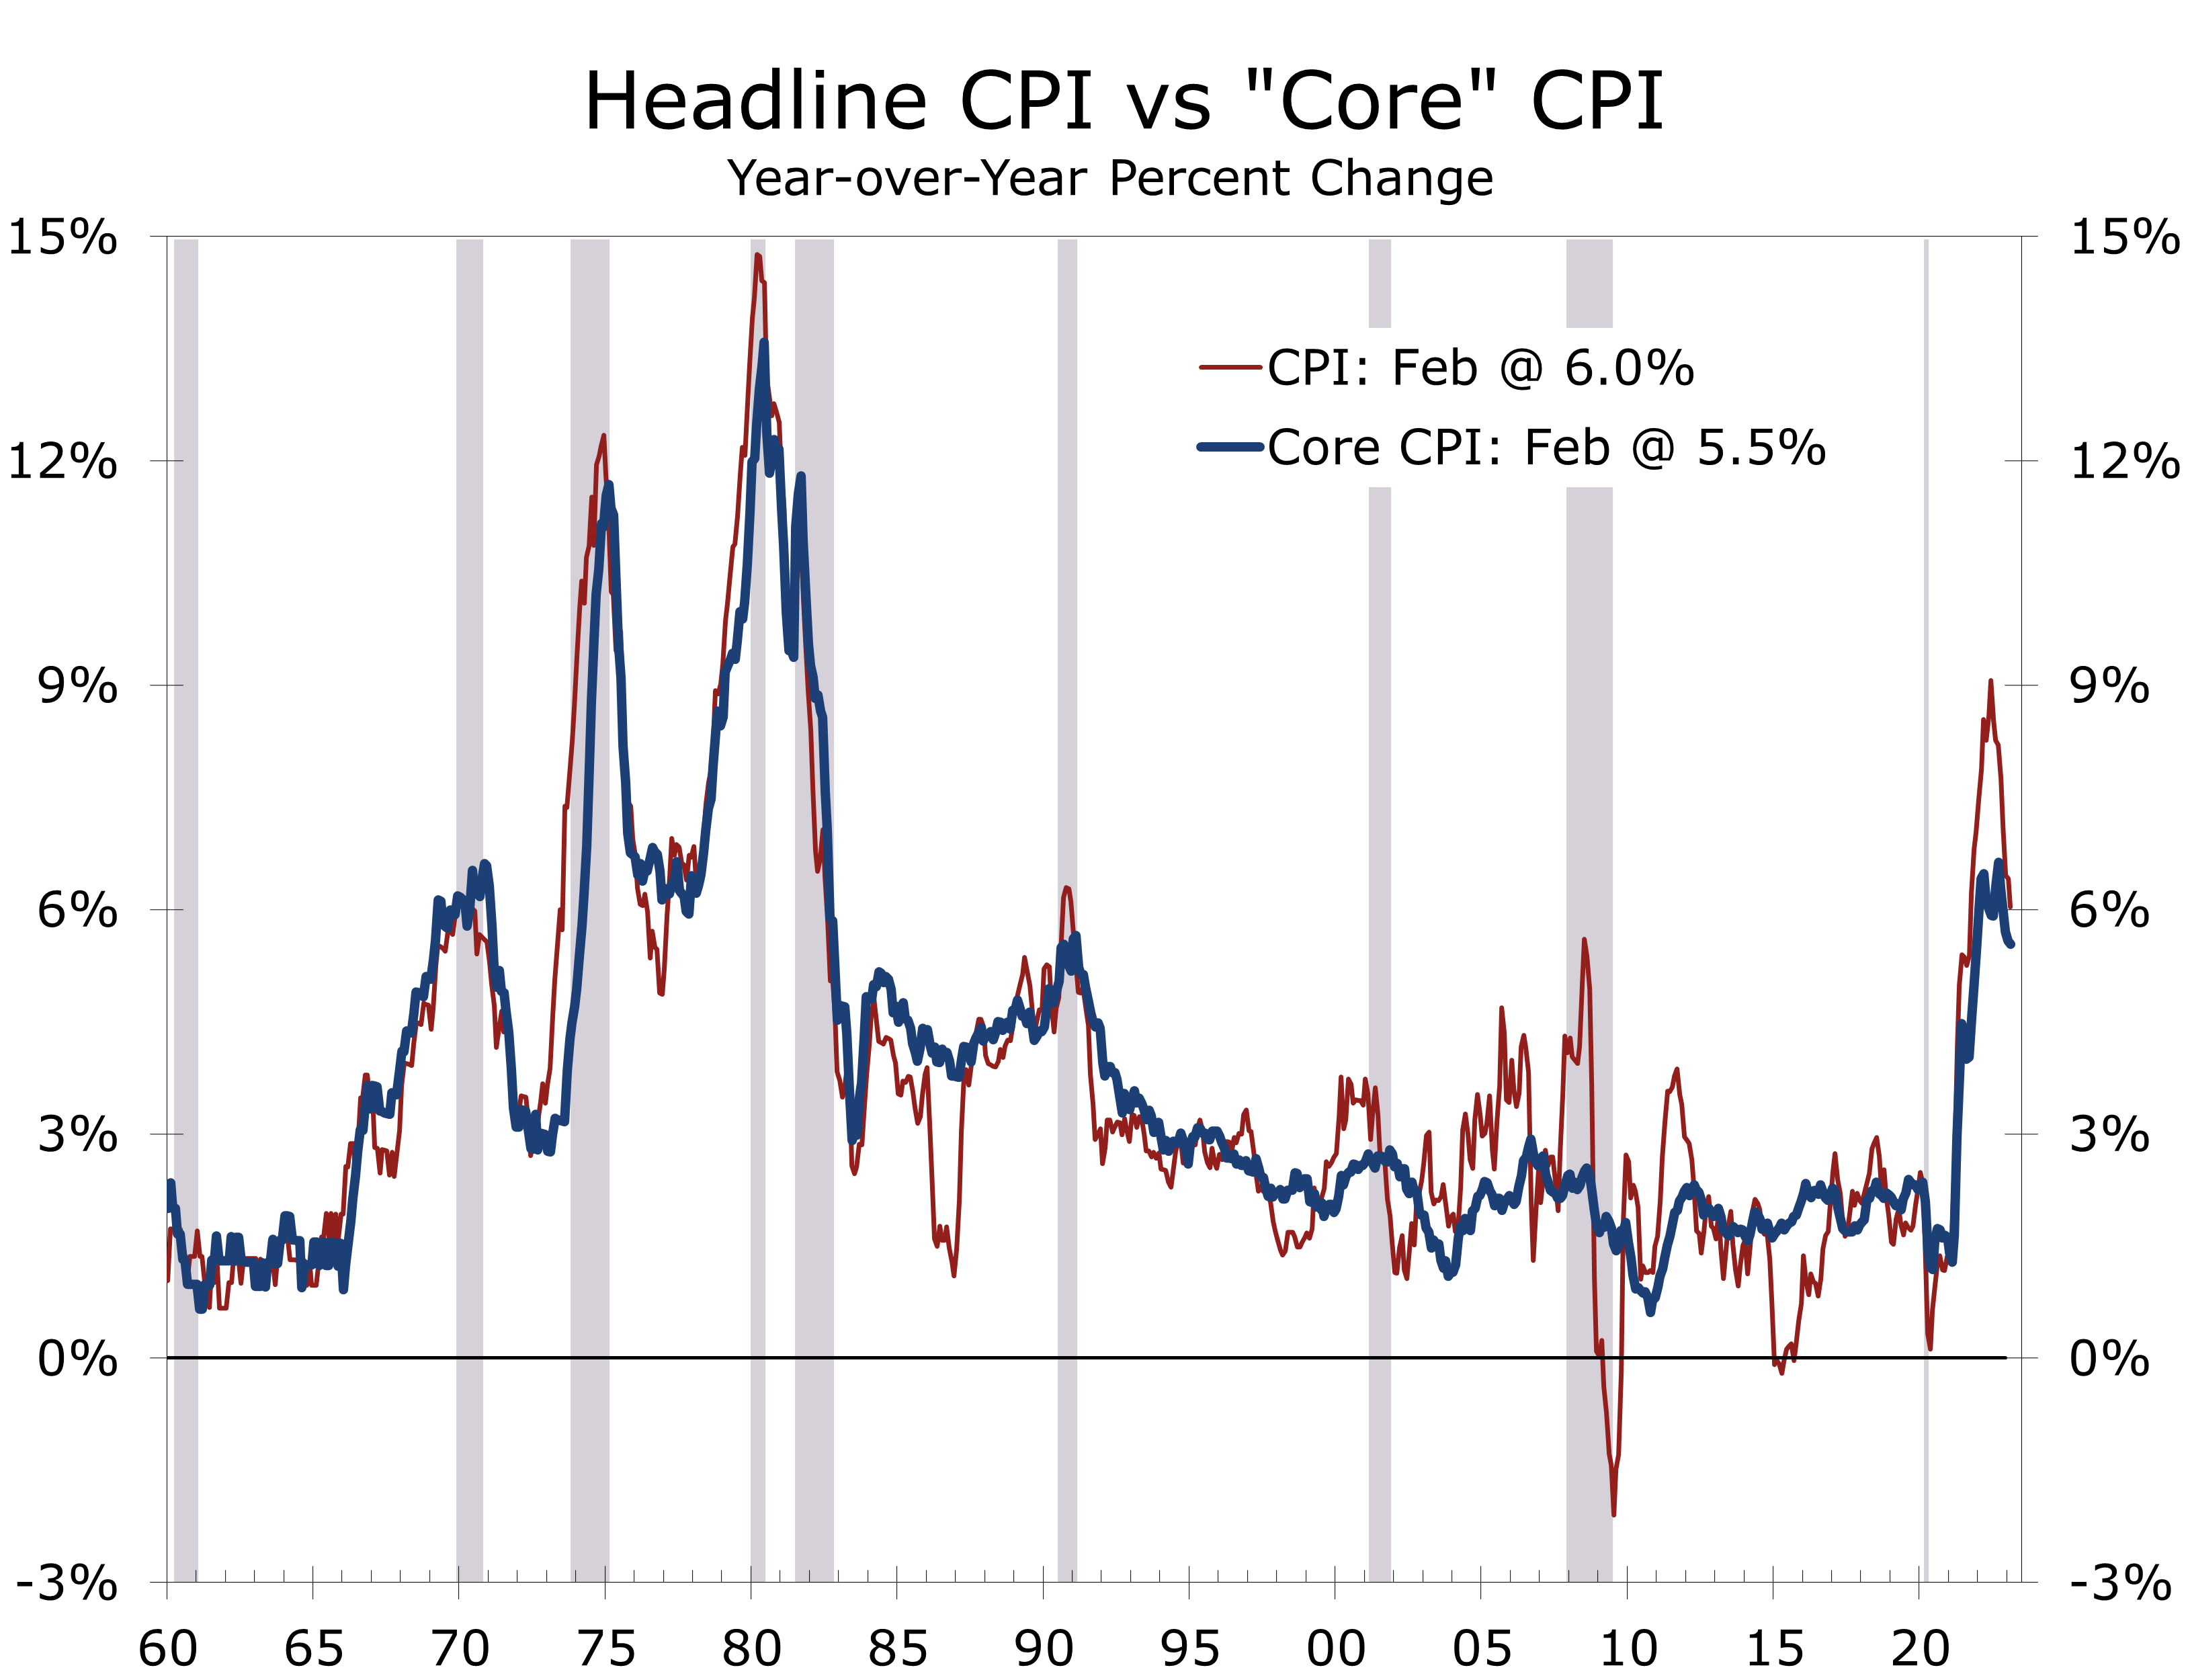
- February’s gains leave the headline index up 6.0% year-to-year, and the core up 5.5%.
- Price increases eased at the grocery store, with food prices rising 0.4% overall and just 0.3% at the grocery store.
- Sharply lower prices for fuel oil and natural gas – both byproducts of milder winter weather – pulled energy prices down 0.6%.
- Used-car prices fell 2.8% but higher prices for airfares and another big rise in shelter cost more than offset that drop, resulting in a slightly larger-than-expected rise in the core CPI.
- Shelter costs were driven higher by an 0.8% increase in residential rents and 0.7% rise in owners’ equivalent rent.
- Medical care costs fell 0.5%, reflecting a 0.5% drop in physician’ services as well as uncharacteristically small increases in hospital services and prescription drugs.
After this past week’s surprise blow up in the banking sector, a ho-hum CPI report was sorely needed. Inflation is now moving in the right direction, although the moderation is still too modest to allow the Fed to end its tightening regimen. We expect another quarter-point hike at next week’s FOMC meeting, provided concerns about the banking system subside.
Inflation is clearly decelerating on a year-to-year basis. The headline CPI peaked at 9.1% last June and has now slowed to just 6.0%. Most of that deceleration has come from a sharp reversal in energy prices due to the draw down of the Strategic Petroleum Reserve and milder than usual winter weather in much of the U.S. and Europe. Falling prices for used cars and light trucks and some moderation in food prices has also helped pull down the headline and core numbers.
Food prices are finally moderating, thanks to lower fuels costs and fewer bottlenecks.
Prices for groceries rose just 0.3% in February, marking their smallest gain since March 2021. The moderation reflects some easing of supply bottlenecks and lower prices for diesel fuel. Prices for meats, poultry, fish and eggs fell 0.1% in February, marking their first monthly drop since December 2021. Egg prices fell 6.7% in February, following huge increases in prior months. Even with the declines in these highly visible areas, grocery store prices remain 10.2% higher than they were a year ago.
Energy prices fell 0.6% in February, following a 2% rise the prior month. The price of natural gas declined 8%, marking the largest 1-month drop since October 2006. The price of fuel oil fell 7.9% in February. Demand for both fell sharply this past month, as much of the country enjoyed unseasonably mild weather. Gasoline prices rose 1% in February, following a 2.4% rise the prior month.
Prices excluding food and energy rose 0.45% in February and remain up 5.5% year to year. Prices for core goods were unchanged in February and are now up just 1% year-to-year. Much of the deceleration in core goods prices is due to falling prices for used cars and trucks, which fell 2.8% in February and are down 13.6% over the prices year.
Shelter costs continue to increase, reflecting past increases in market rents.
Prices for services excluding energy rose 0.6% in February, with high shelter costs accounting for much of the gain. Shelter costs rose 0.8% in February and are up 8.1% year to year. Rent of primary residence and owners’ equivalent rent account for the bulk of shelter costs. Both measures are calculated by the BLS using a complex formula that appropriately captures the costs of housing for renters and homeowners but tends to lag changes in market rents.
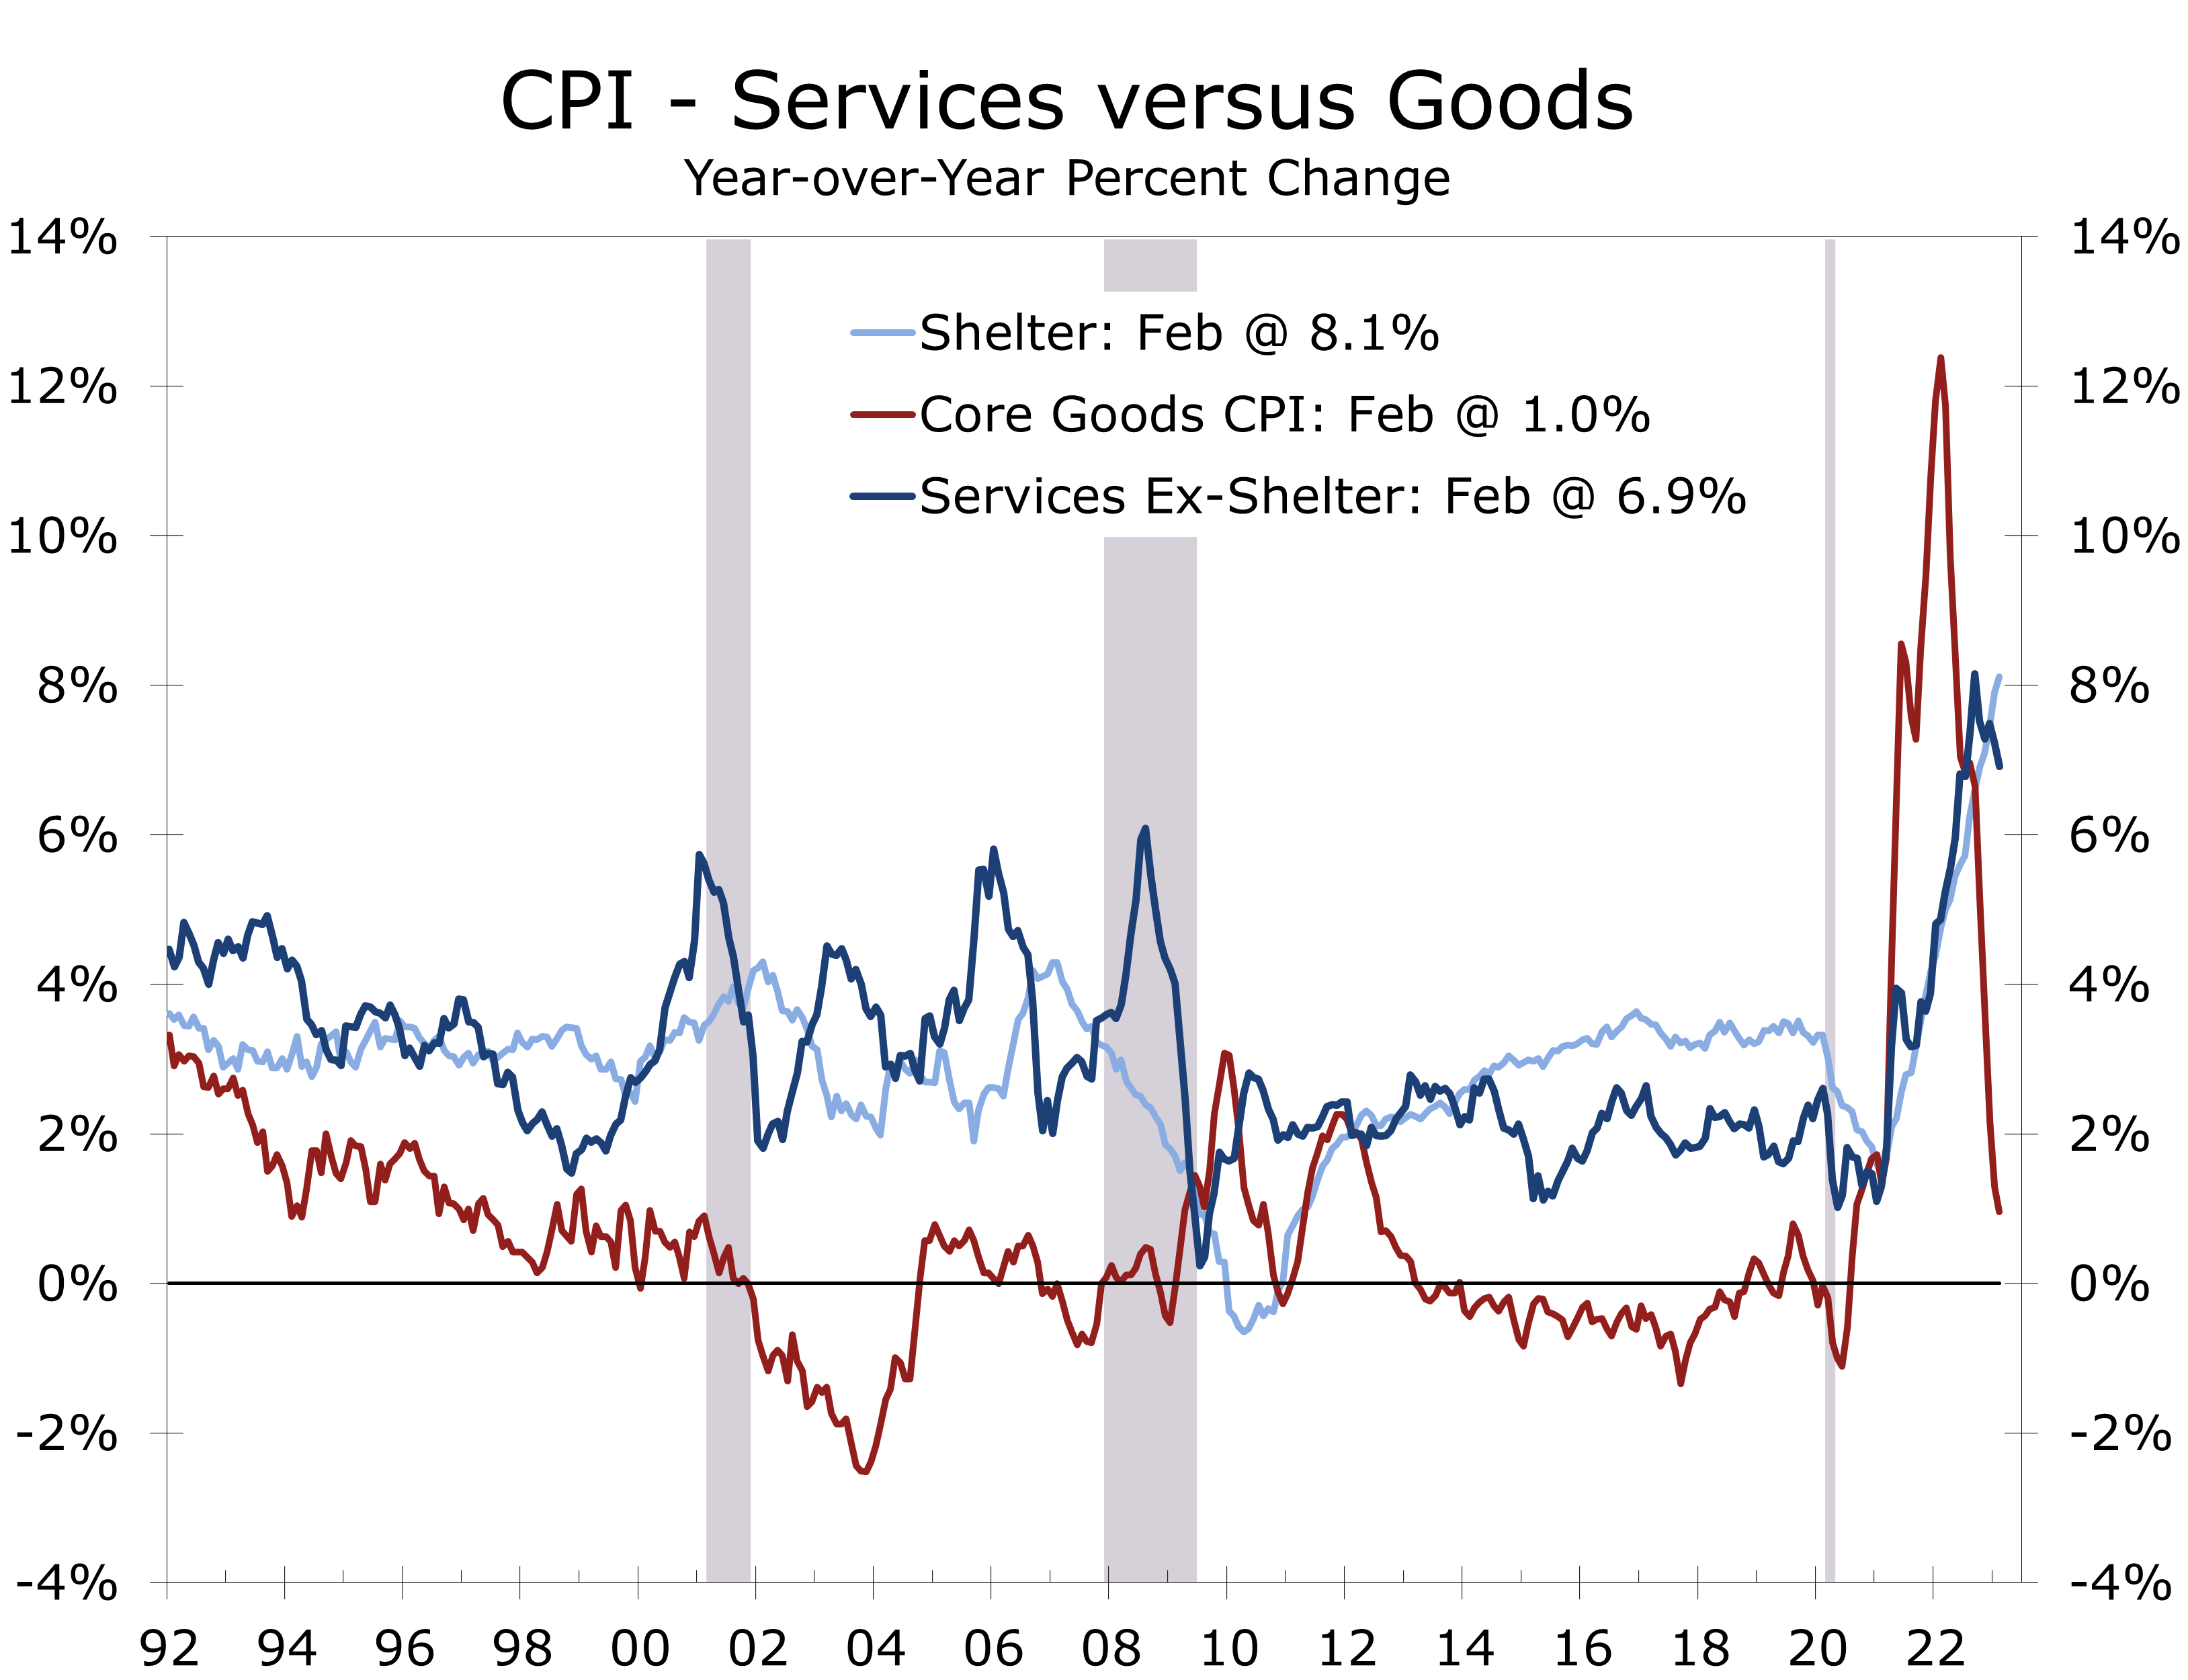
The lags of shelter costs and their outsized weight in the CPI have prompted questions about whether inflation has already decelerated enough for the Fed to stop tightening. We do not believe so. Wages are still rising faster than productivity and price measures where wages are the primary driver of selling prices have been slower to moderate. Prices for services excluding energy and shelter, a category repeatedly mentioned by Fed Chair Jerome Powell, have risen 6.0% over the past year, which is down only modestly from their peak of 6.7% hit last September.
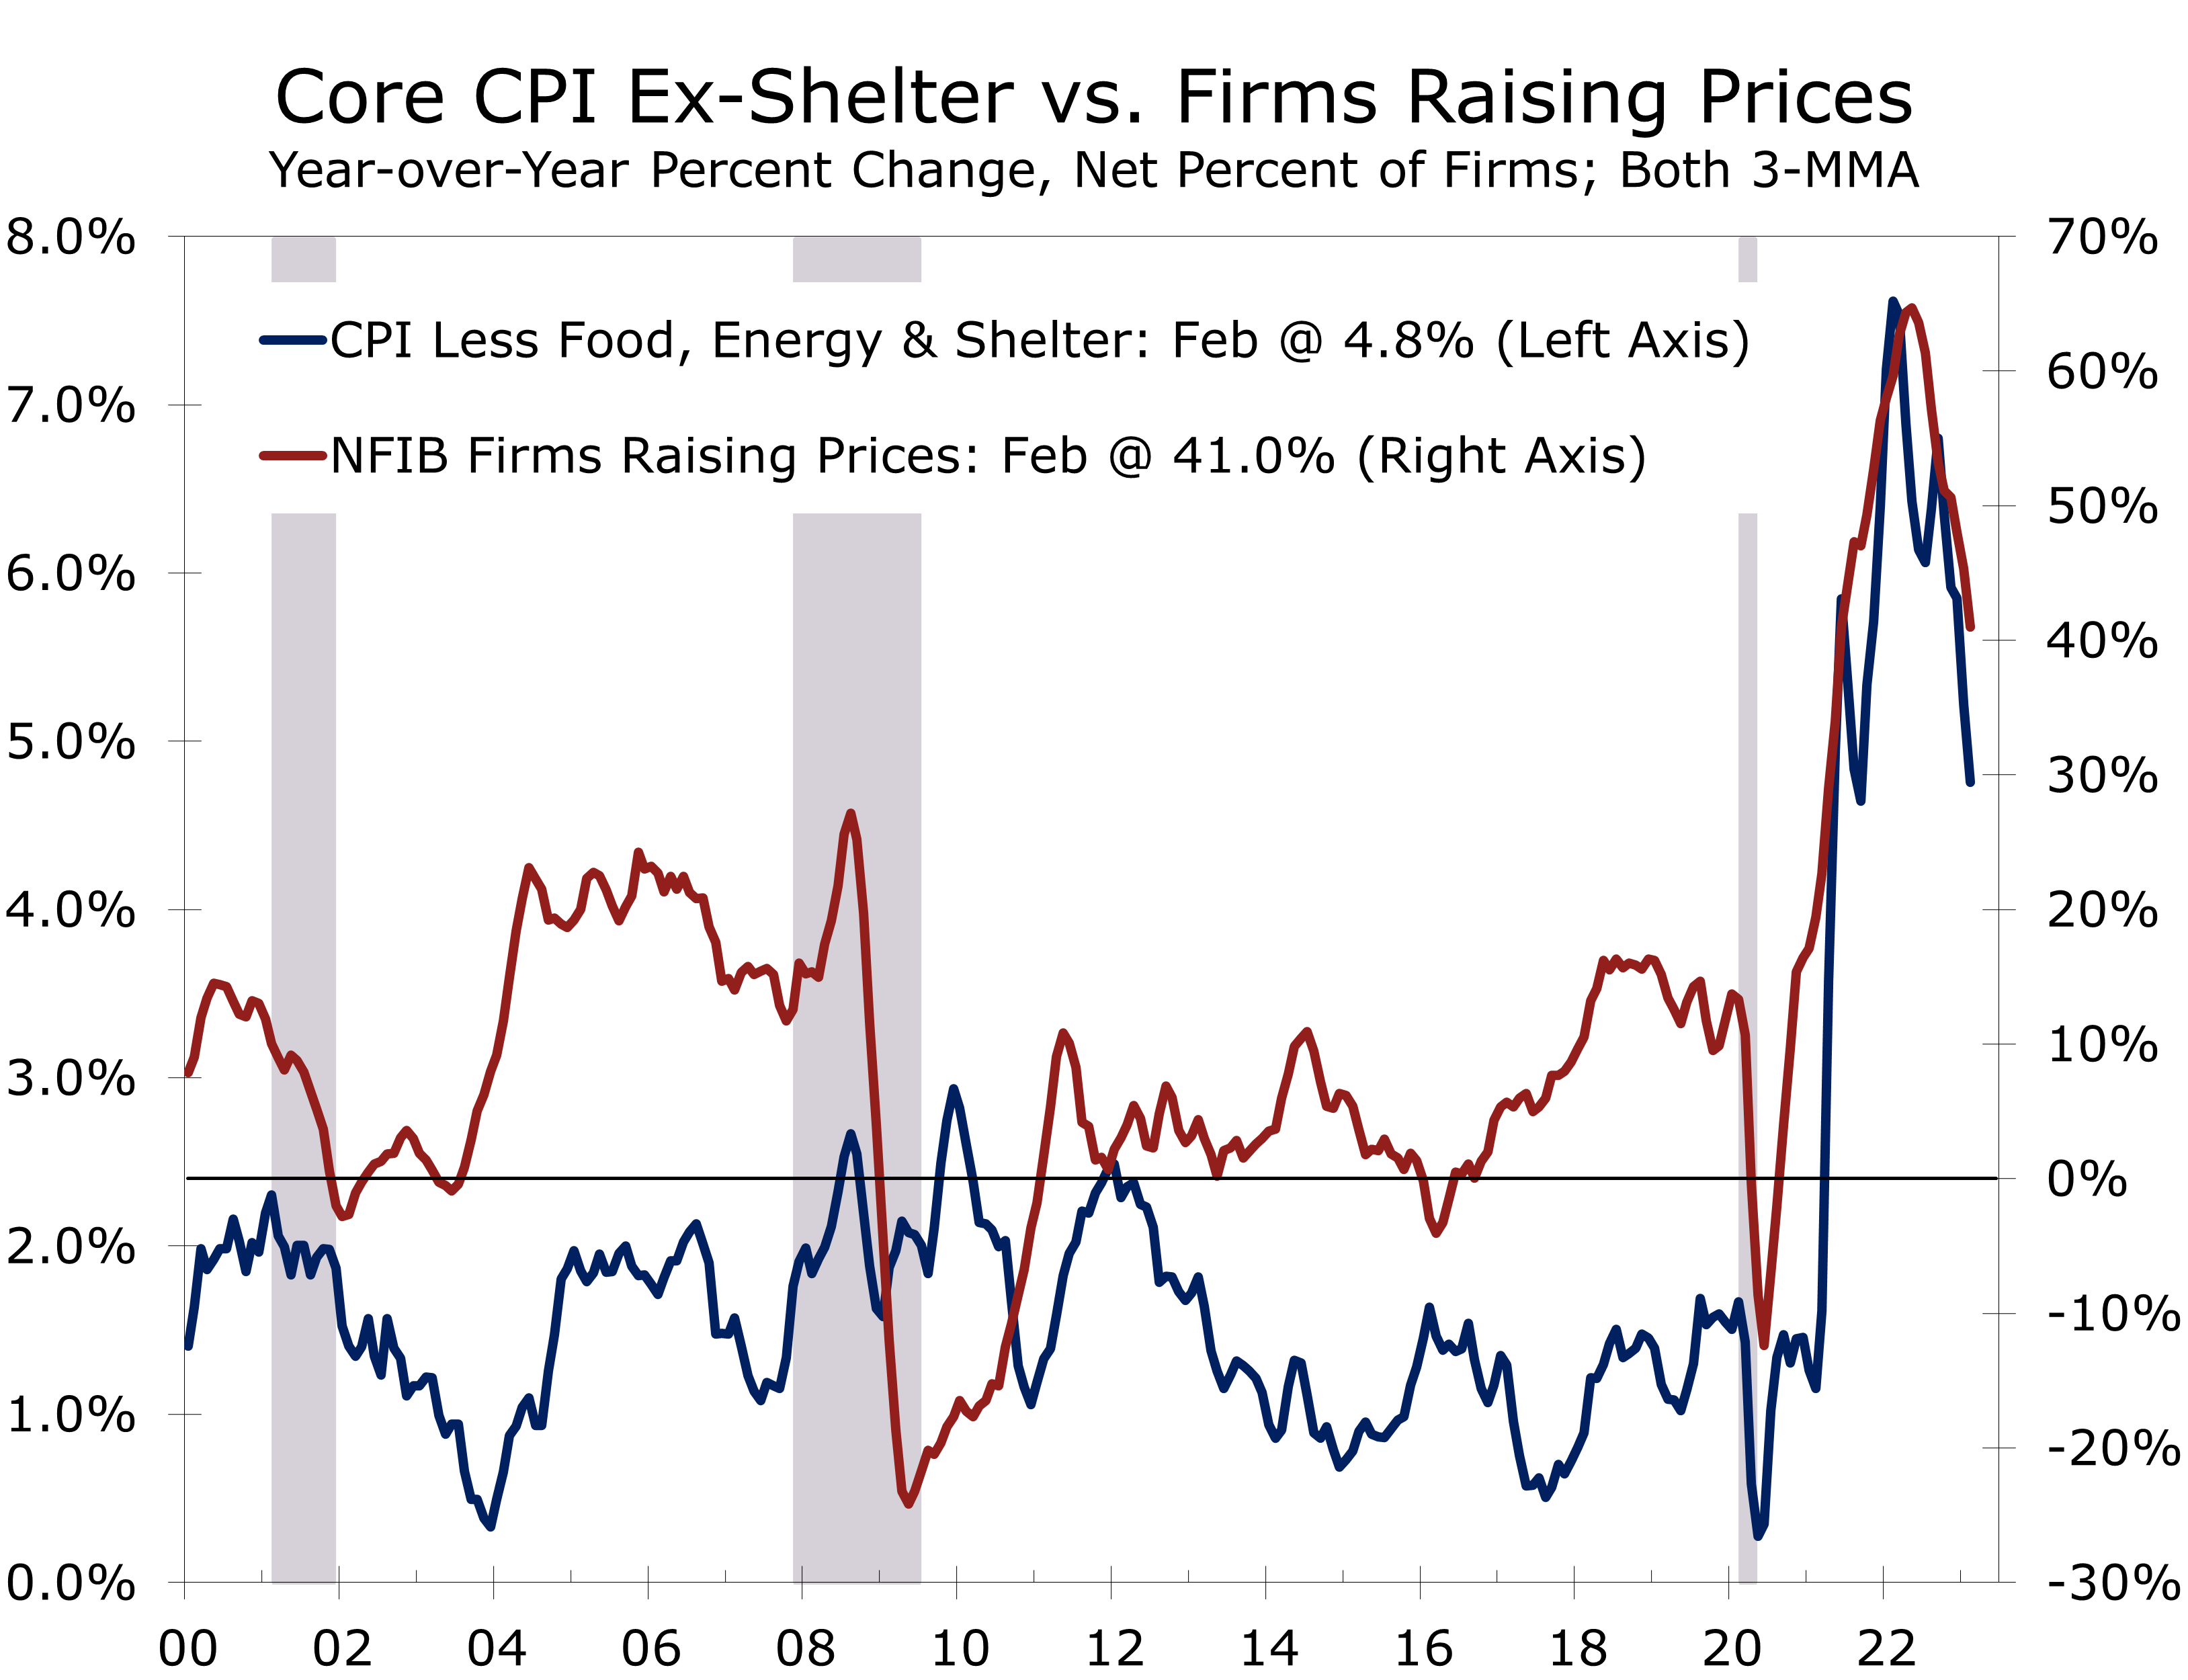
The share of firms raising prices has fallen sharply, hinting inflation will decelerate further.
One of our favorite inflation measures is the share of small businesses raising prices over the past three months. This measure surged to a record high when the economy reopened following the pandemic and is a big reason why we never bought into the “transitory” inflation story. The more recent data is encouraging, with the share raising prices over the past three months falling 4 points in February to 38, which is the lowest level April 2021. A similar measure of firms boosting compensation remains notably higher, however, and has fallen more slowly.
Disclaimer: This publication has been prepared for informational purposes only and is not intended as a recommendation offer or solicitation with respect to the purchase or sale of any security or other financial product nor does it constitute investment advice.

Small Business Optimism Edges Higher in February
Small Businesses Remain Concerned About the Outlook
- The National Federation of Independent Business (NFIB) Small Business Optimism Survey rose 0.6 points to 90.9 in February.
- Business owners remain concerned about the economic outlook and continue to be challenged by higher input cost rising wages.
- The share of business owners expecting the economy to improve over the next six months fell 2 points to -47%.
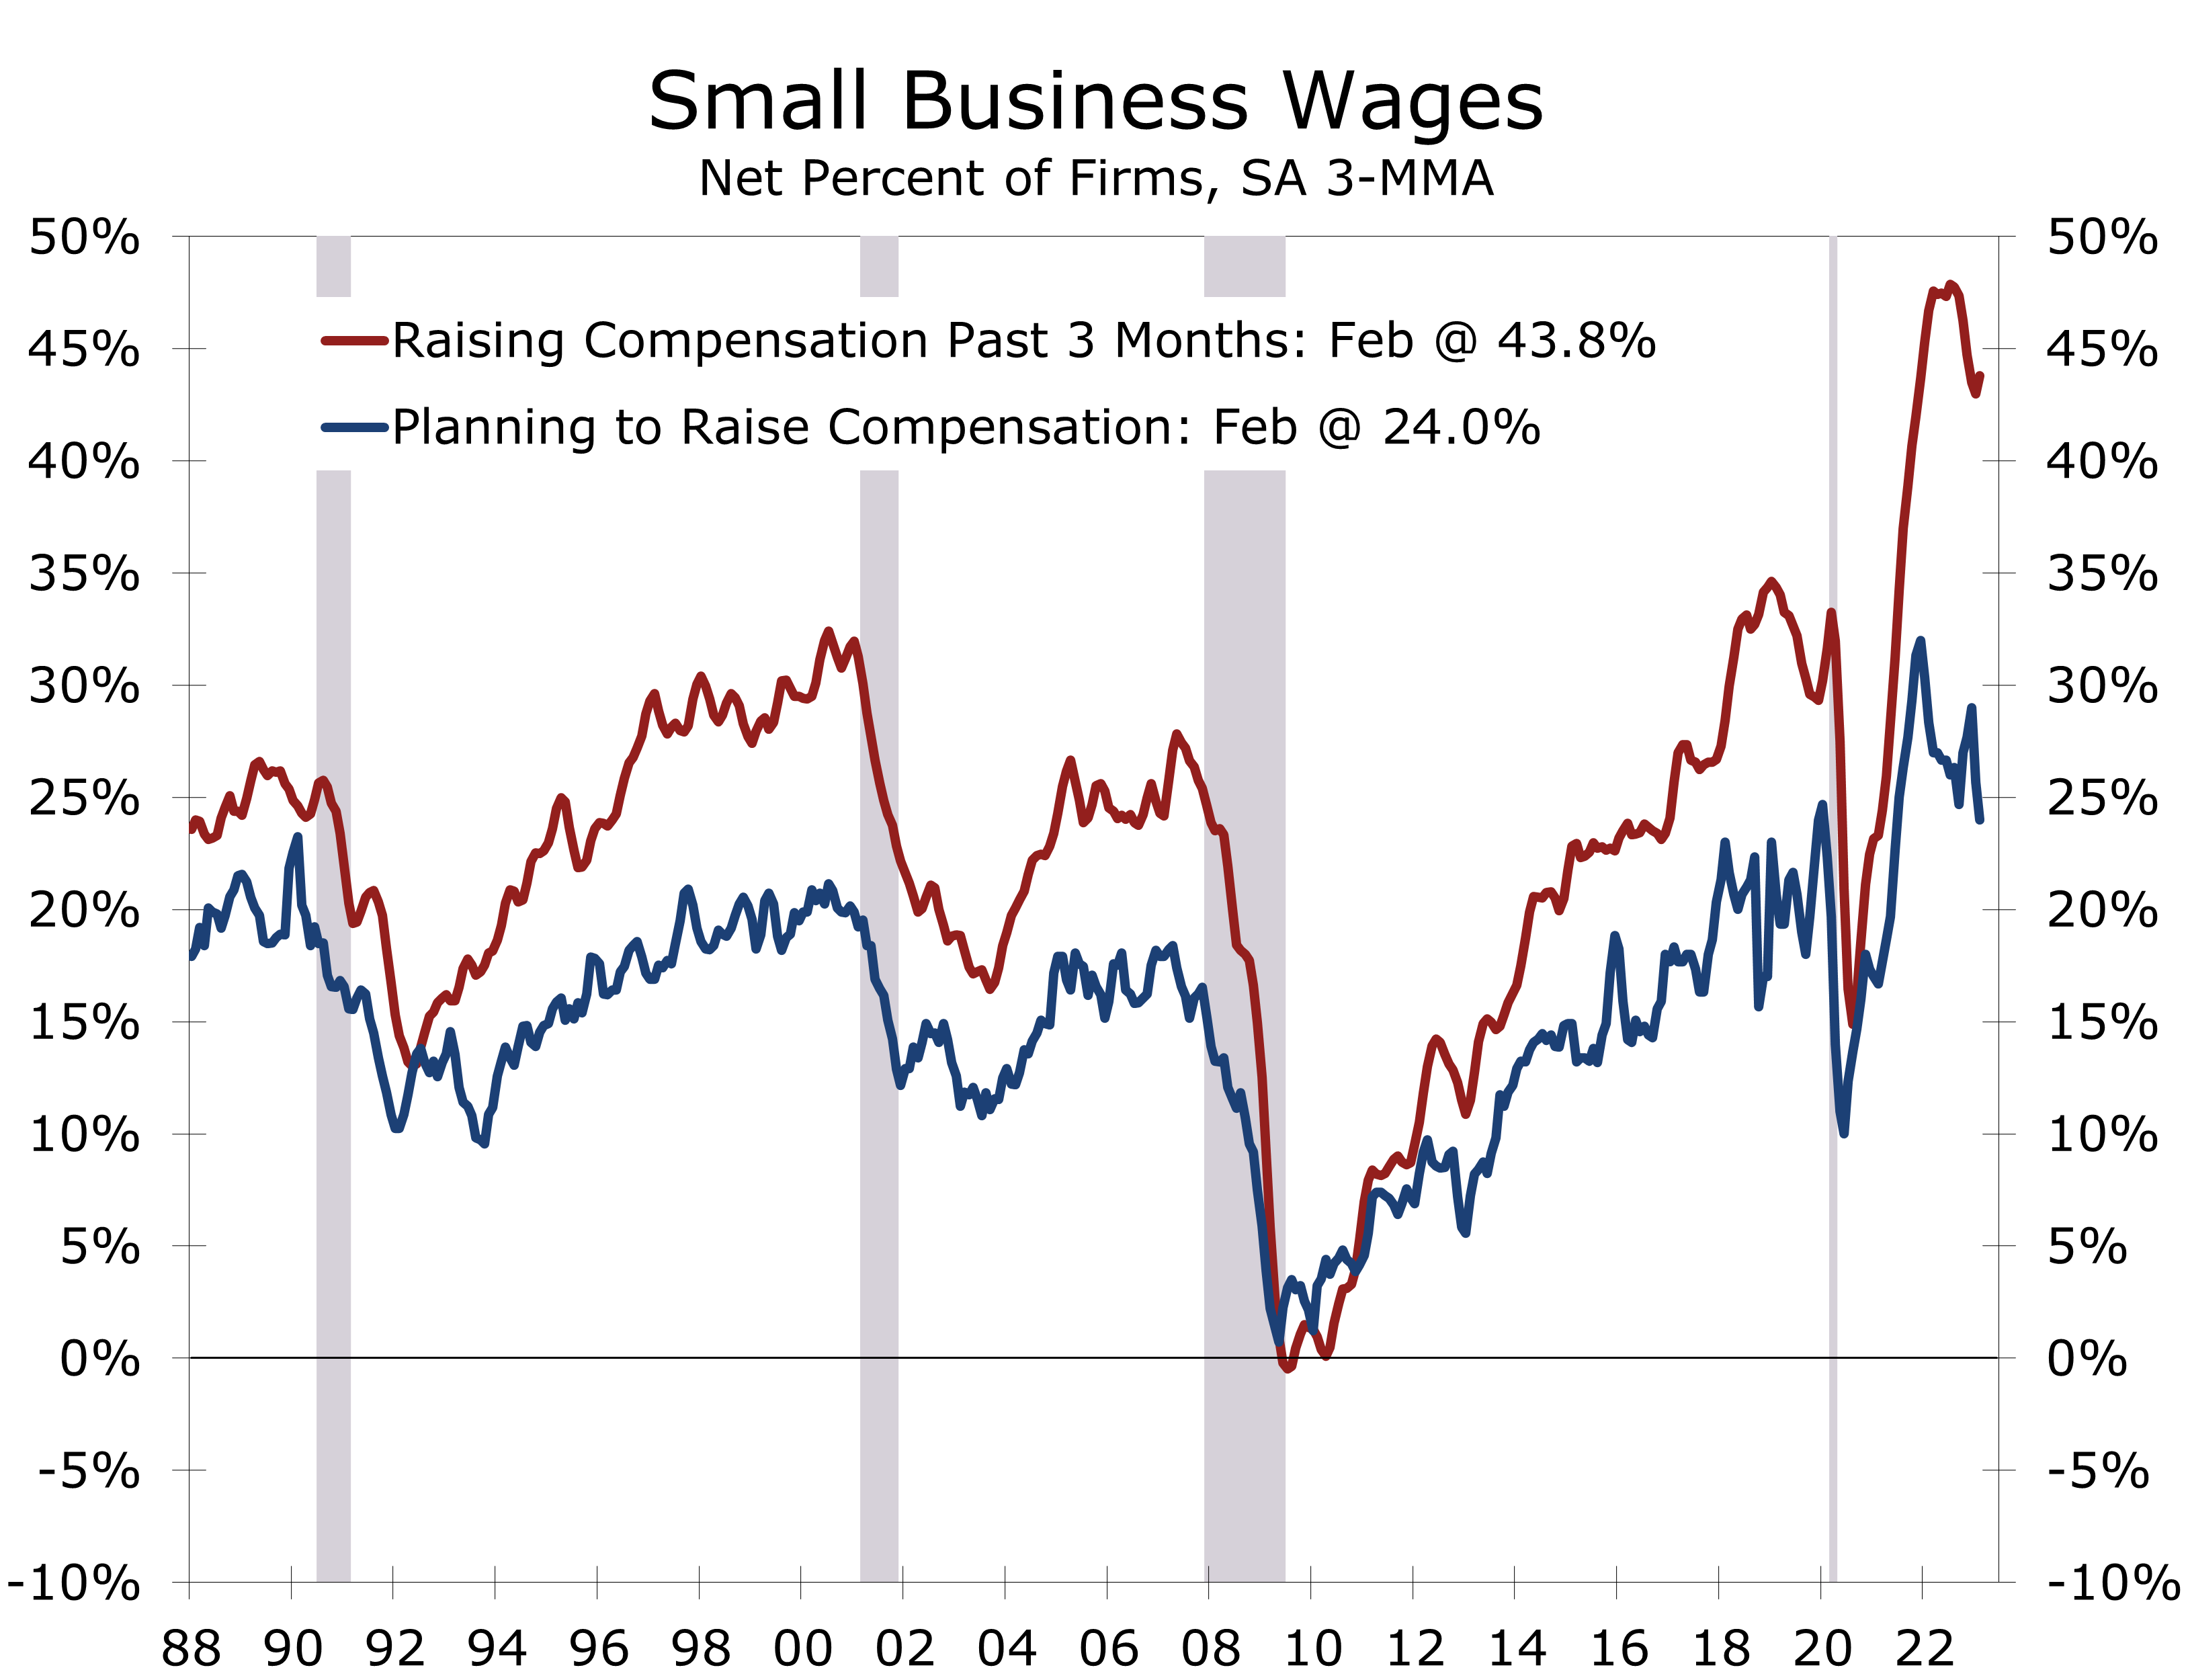
- The spread between the number of firms boosting compensation and those planning to boost compensation remains extremely wide, reflecting efforts to maintain margins.
- The share of firms raising prices fell 4 points to 38 - the lowest share since April 2021.
- Thirty percent of firms report they are borrowing regularly, the highest share since January 2000.
- With profit margins coming under pressure and credit set to tighten, we expect small businesses to curb hiring, reduce inventories and cut capital spending in coming months.
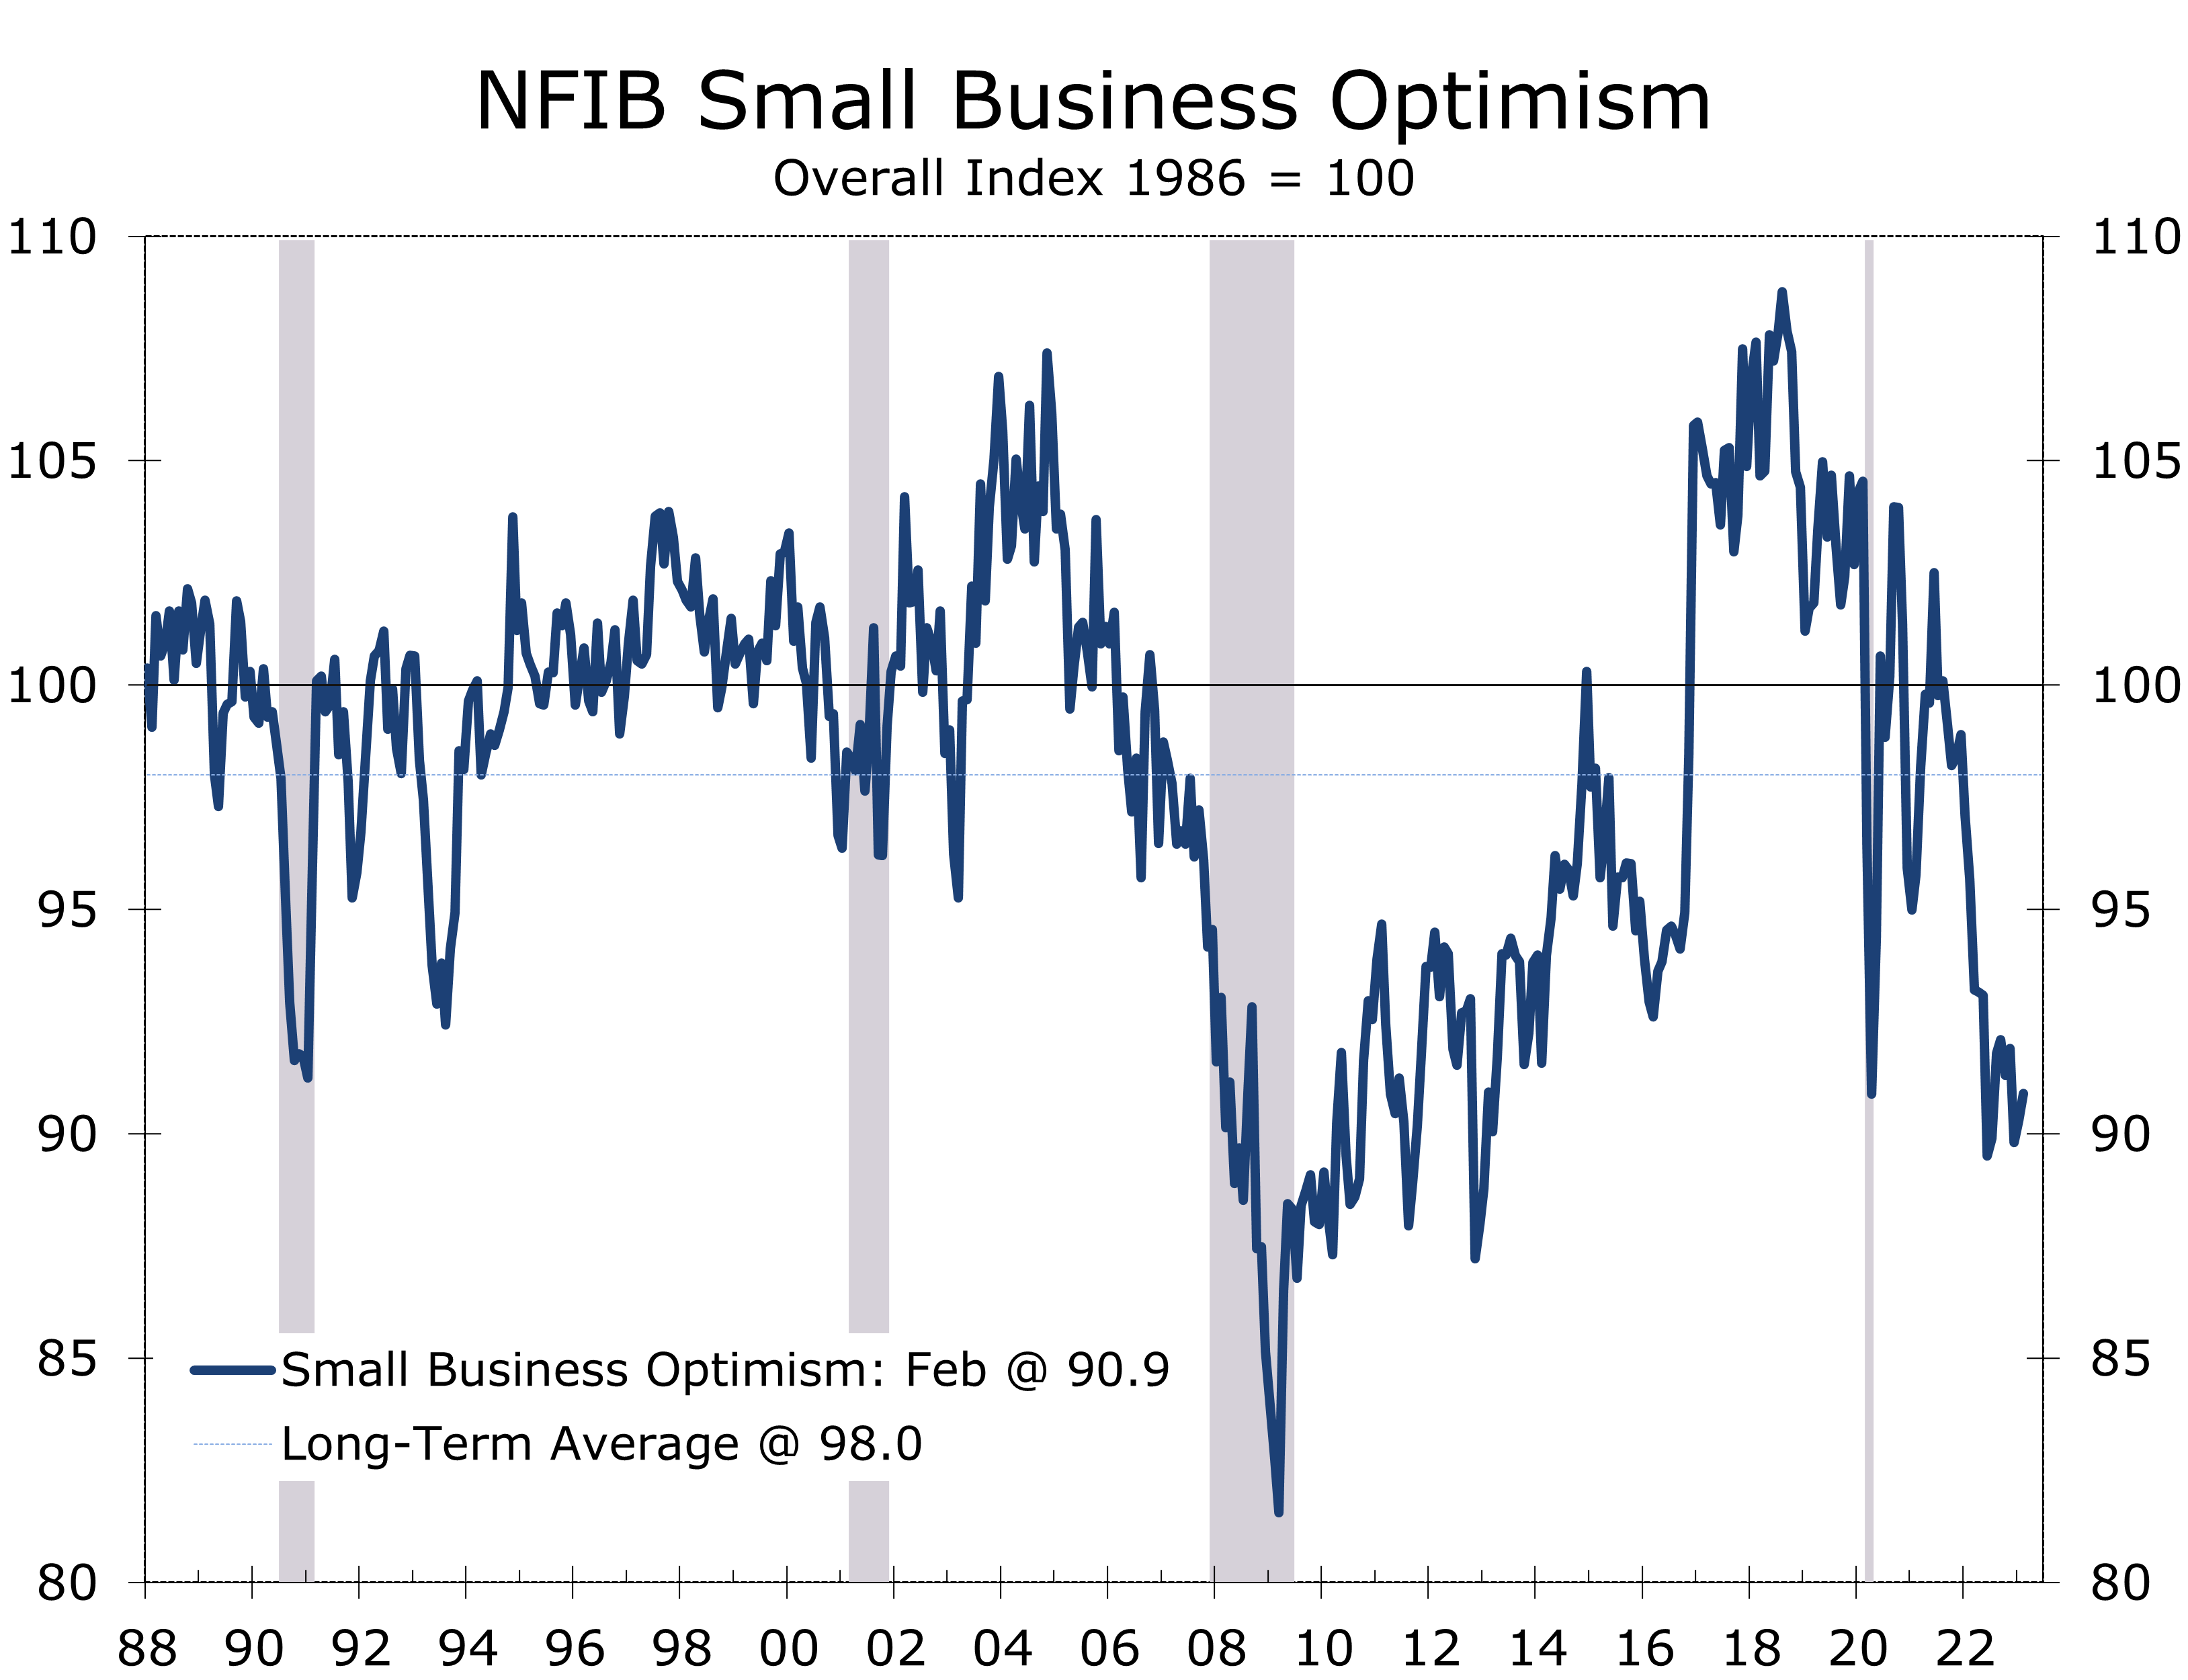
This morning’s update on Small Business Optimism is not likely to steal the headlines from the SVB banking crisis or the latest CPI data. The report shows another modest increase, with the headline index rising 0.6 points to 90.9. Small Business Optimism been below its long-term average for 14 consecutive months and remains at levels typically seen in a recession.
While 5 of the index’s 10 components increased, most rose from severely depressed levels. The share of businesses expecting sales to improve rose 5 points to -9%, indicating more firms still expect sales to fall than expect them to increase. Earnings trends also improved, rising 3 points to -23%, while the net share with job openings and share expecting credit conditions to improve both rose 2 points.
On the plus side, the net share of firms raising prices over the past 3 months fell 4 points to 38%, which is the lowest reading for this closely watched series since April 2021. Moreover, the share of firms planning to raise prices in the next 3 months fell 4 points to 25%.
The NFIB Index has consistently provided one of the earliest warnings of economic distress.
Small Businesses operate on the economy’s front lines and the pressures business owners face often precede those at larger firms. This is one reason why the NFIB index has consistently provided one of the earliest warnings of impending economic distress.
One of the more troubling aspects of the NFIB survey has been the historically large share of business owners expecting general business conditions to worsen. The net share has been in negative territory since December 2020 and steadily weakened as higher inflation drove interest rates higher. The index hit an all-time low of -61% in June 2022 and has averaged -48.7% over the past year.

Heightened concerns about the economy are likely impacting decisions on hiring, inventory levels and capital spending. The net share of small business owners planning to increase staff fell 2 points in February to 17% – the lowest since January 2021.
While hiring plans have fallen, small businesses still have plenty of job openings and a large share report difficultly remaining fully staffed. The share of small businesses with job openings rose 2 points to 47% in February. Of those firms hiring or trying to hire in February, 90% reported few or no qualified applicants for the positions they were trying to fill.
The net share of businesses reporting inventories increased fell 7 points in February to -1%. Moreover, the next share of business owners stating inventories were too low fell 3 points to -4%, meaning more firms feel inventories are too high than feel they are too low. Not surprisingly, a net -7% of business owners plan to increase inventories in coming months.
Businesses have also become more cautious about capital spending. The share of firms planning to increase capital outlays was unchanged at 21% in February. While that is still well into positive territory, it marks the smallest share of small businesses planning to increase capex since March 2021.
One of the key drivers for capital outlays are efforts to boost efficiency. Small businesses are price takers for labor and compensation costs have been sharply outpacing planned increases for quite some time. The gap between the share of firms raising compensation over the past 3 months and those planning to raise compensation has averaged a record 20 percentage points for the past year.
Small businesses are price takers for labor.
The persistent pressure on wages will make it difficult to bring inflation down to the Fed’s 2% target. Wages make up a large share of core services prices, a key metric the Fed has identified in determining how much higher they need to push up short-term interest rates. We still feel the Fed will follow through with a 25 basis point hike at next week’s FOMC meeting, provided fears about the banking system continue to subside.
Disclaimer: This publication has been prepared for informational purposes only and is not intended as a recommendation offer or solicitation with respect to the purchase or sale of any security or other financial product nor does it constitute investment advice.
Employment Rises Solidly in February
Employment Rises Solidly in February
- Job Growth Remained Strong in February
- Employers added 311,000 net new jobs in February, which was above market expectations but in line with the average gain for the past six months.
- Job gains continue to be led by a resurgence in hiring at restaurants, bars, hotels, and entertainment venues – where payrolls still remain 2.4% below pre-pandemic levels.
- Hiring also continues to bounce back in other sectors that have been slow to recover, including health care, childcare, personal services, and local government.
- The most cyclical parts of the economy show a bit more weakness. Manufacturers cut 4,000 jobs, while trucking and warehousing lost 21,500 jobs. Construction payrolls, however, added 24,000 jobs.
- The unemployment rose 0.2 percentage points to 3.6%, while average hourly earnings rose just 0.2%.
February’s larger than expected 311,000-job rise in nonfarm payrolls did not settle the question whether the Fed will raise rates by a quarter or a half of a point at their March 22 FOMC meeting. While the headline came in hot, the gain was below the average for the past 6 months and the underlying details show clear signs of deceleration. Moreover, the unemployment rate rose 0.2 percentage points to 3.6% and average hourly earnings rose a smaller than expected 0.2%.
The employment data were eclipsed by the abrupt collapse of Silicon Valley Bank and worries about the potential fallout. Concern about secondary impacts has triggered a flight-to-quality, which has pulled share prices lower at banks, tech firms and the stock market more broadly. Bond yields have also tumbled, despite ongoing inflation concerns.
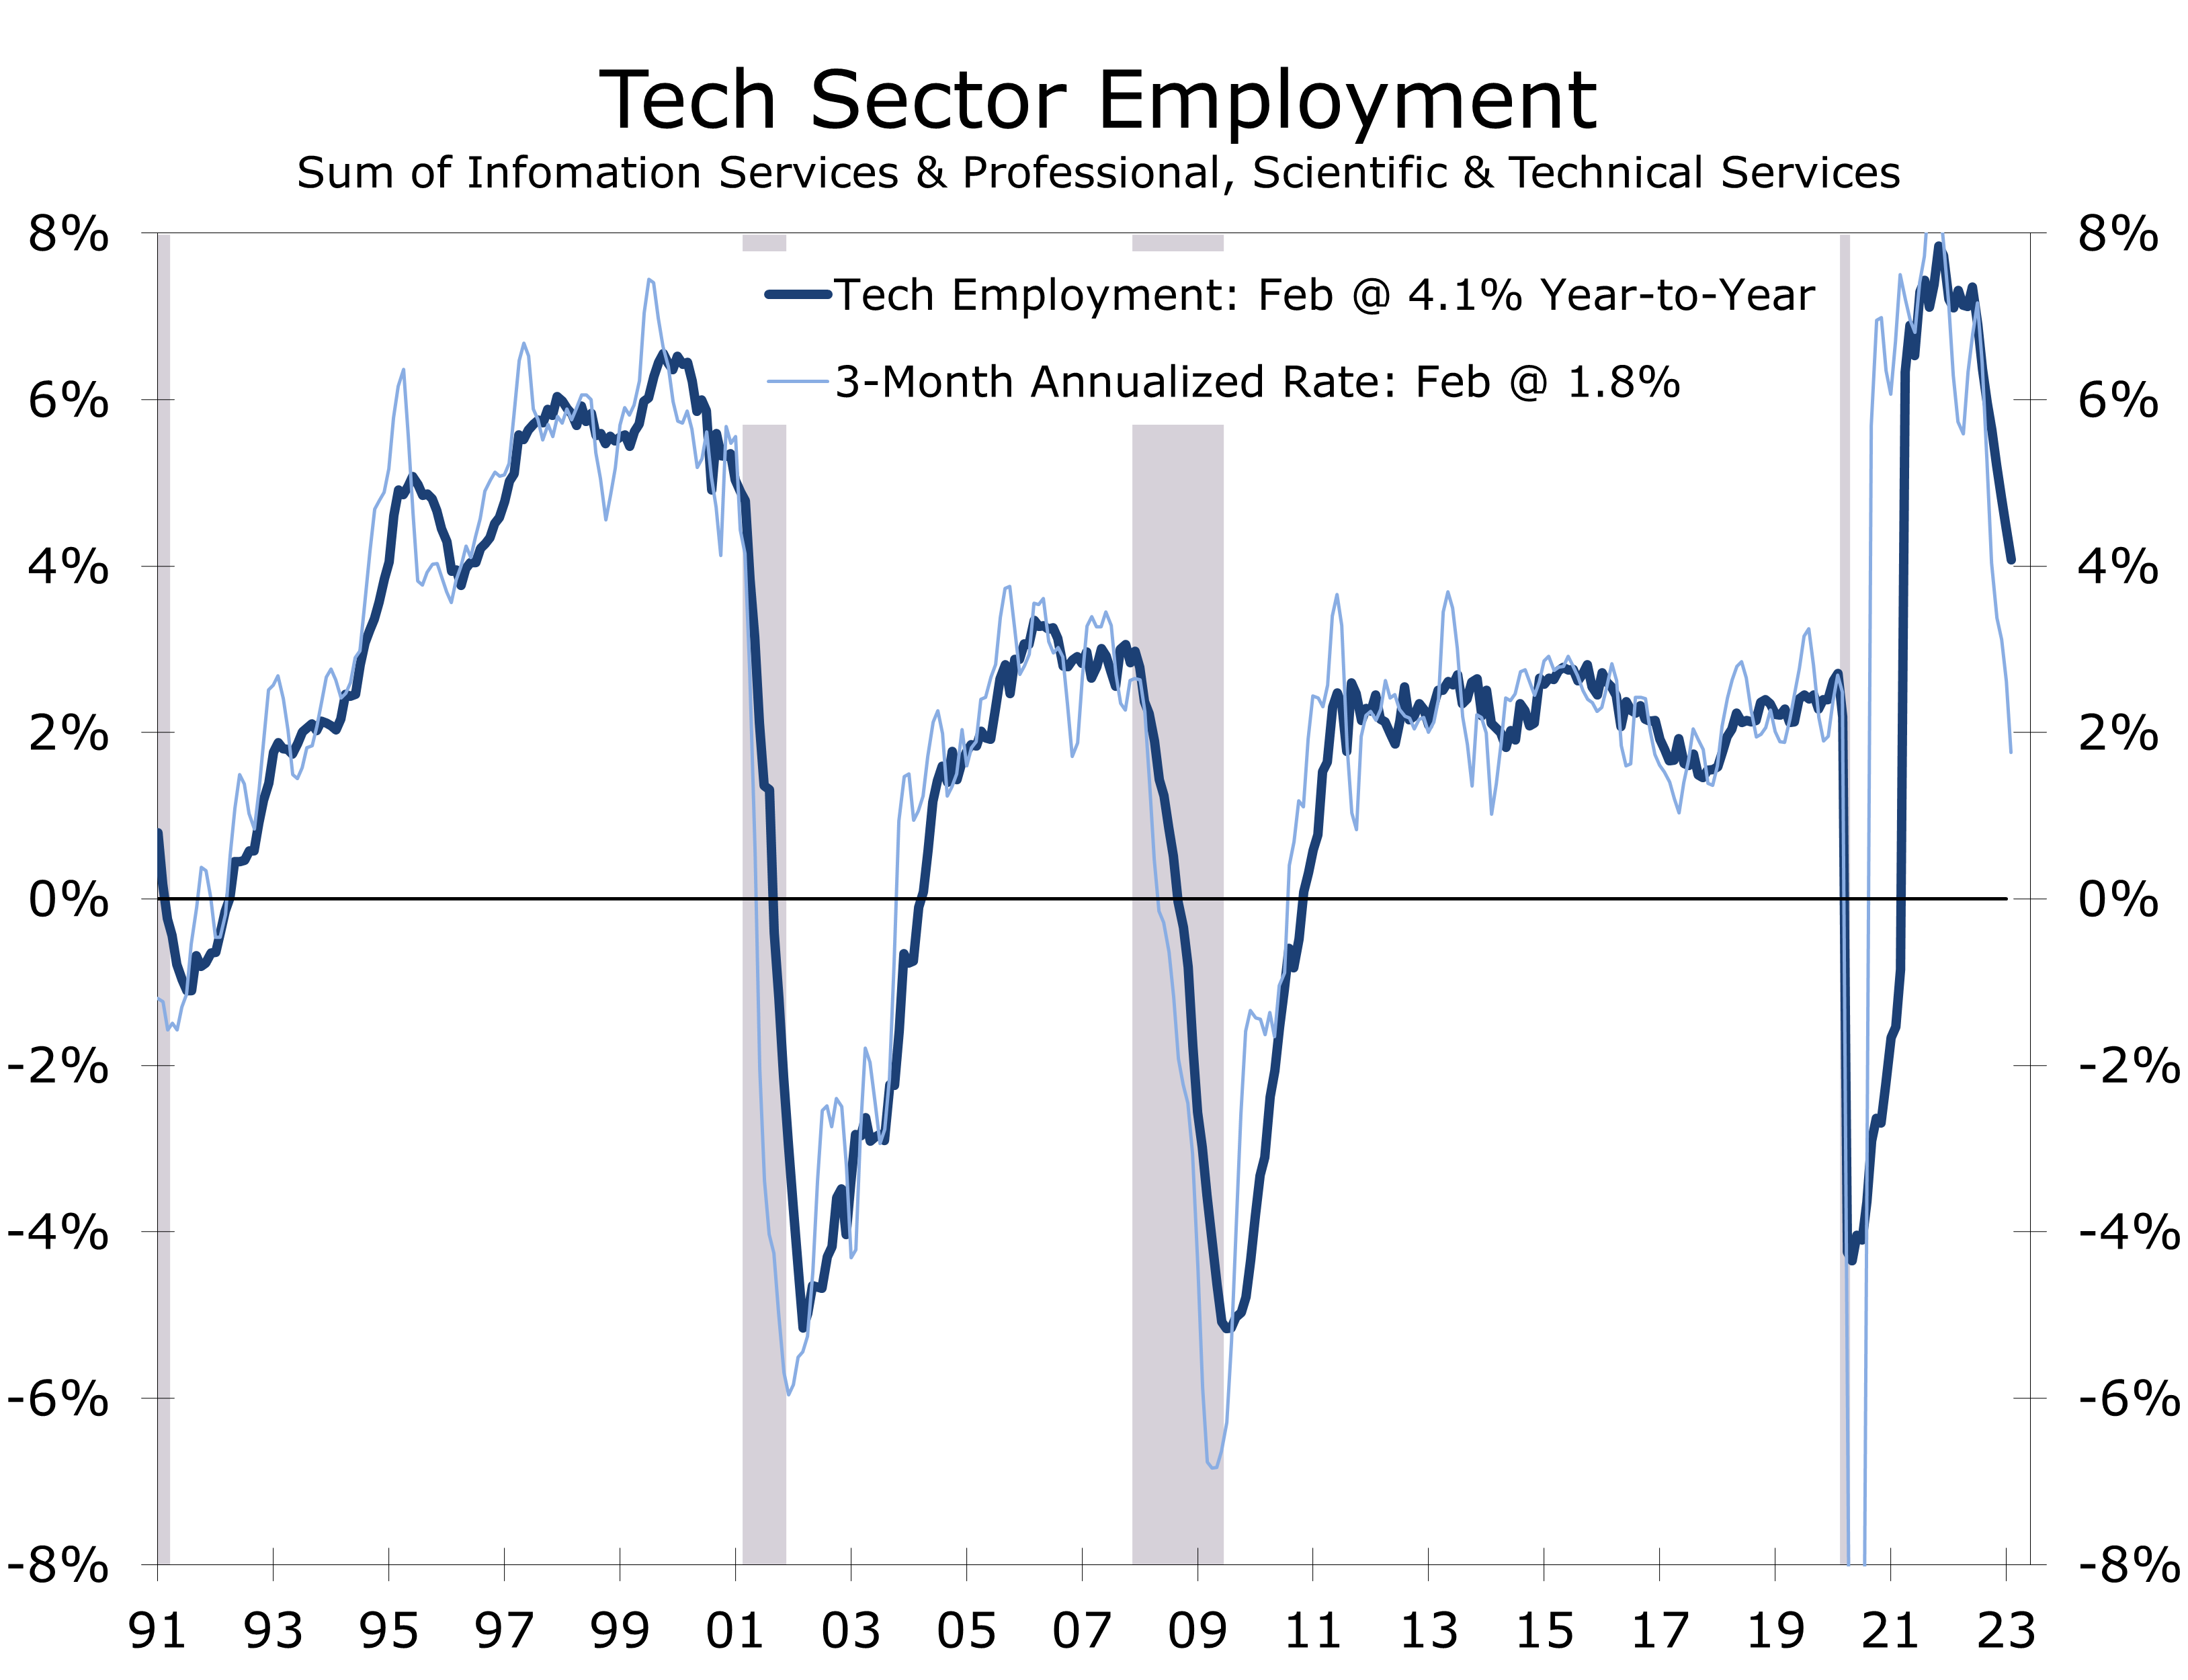
The collapse of Silicon Valley Bank and heightened uncertainty at some West Coast specialty lenders is tied to the ongoing correction in the tech sector. Private equity values have tumbled as exits for startups have become more difficult due to the sell-off in tech shares and heightened scrutiny nearly every merger and acquisition faces today. The only recourse for young firms is to cut costs and those cutbacks are now readily apparent in the jobs data.
Private equity values have tumbled as exits for startups have become more difficult.
The information sector lost 25,000 jobs in February and has cut 54,000 jobs over the past 3 months. Hiring in professional, scientific, and technical services is also decelerating. The most tech-centered subcomponent – computer systems design and technical consulting – lost 2,400 jobs in February. These two sectors provide a timely but imprecise measure of tech payrolls.
Job growth remains exceptionally strong on an overall basis, although a deceleration is also now readily apparent. Employers added 311,000 jobs in February, which was 86,000 more than market consensus. Hiring continues to be driven by the recovery of jobs in the leisure and hospitality sector, which added back 105,000 jobs in February. Health care and social assistance (62,800), retail trade (50,100) and professional and business services (45,000) all posted strong gains during the month. Construction payrolls also rose by 24,000 jobs, hinting that mild weather may have also bolstered the headline increase.
In addition to the earlier noted 25,000-job loss in the information sector, job losses were also reported in trucking and warehousing (-21,500) and manufacturing (-4,000). The weakness in the goods sector likely reflects the pullback in consumer goods purchases. Within manufacturing, plastics and rubber products (-4,700), furniture (-2,800), and textile and apparel (-3,100) all posted notable job losses.
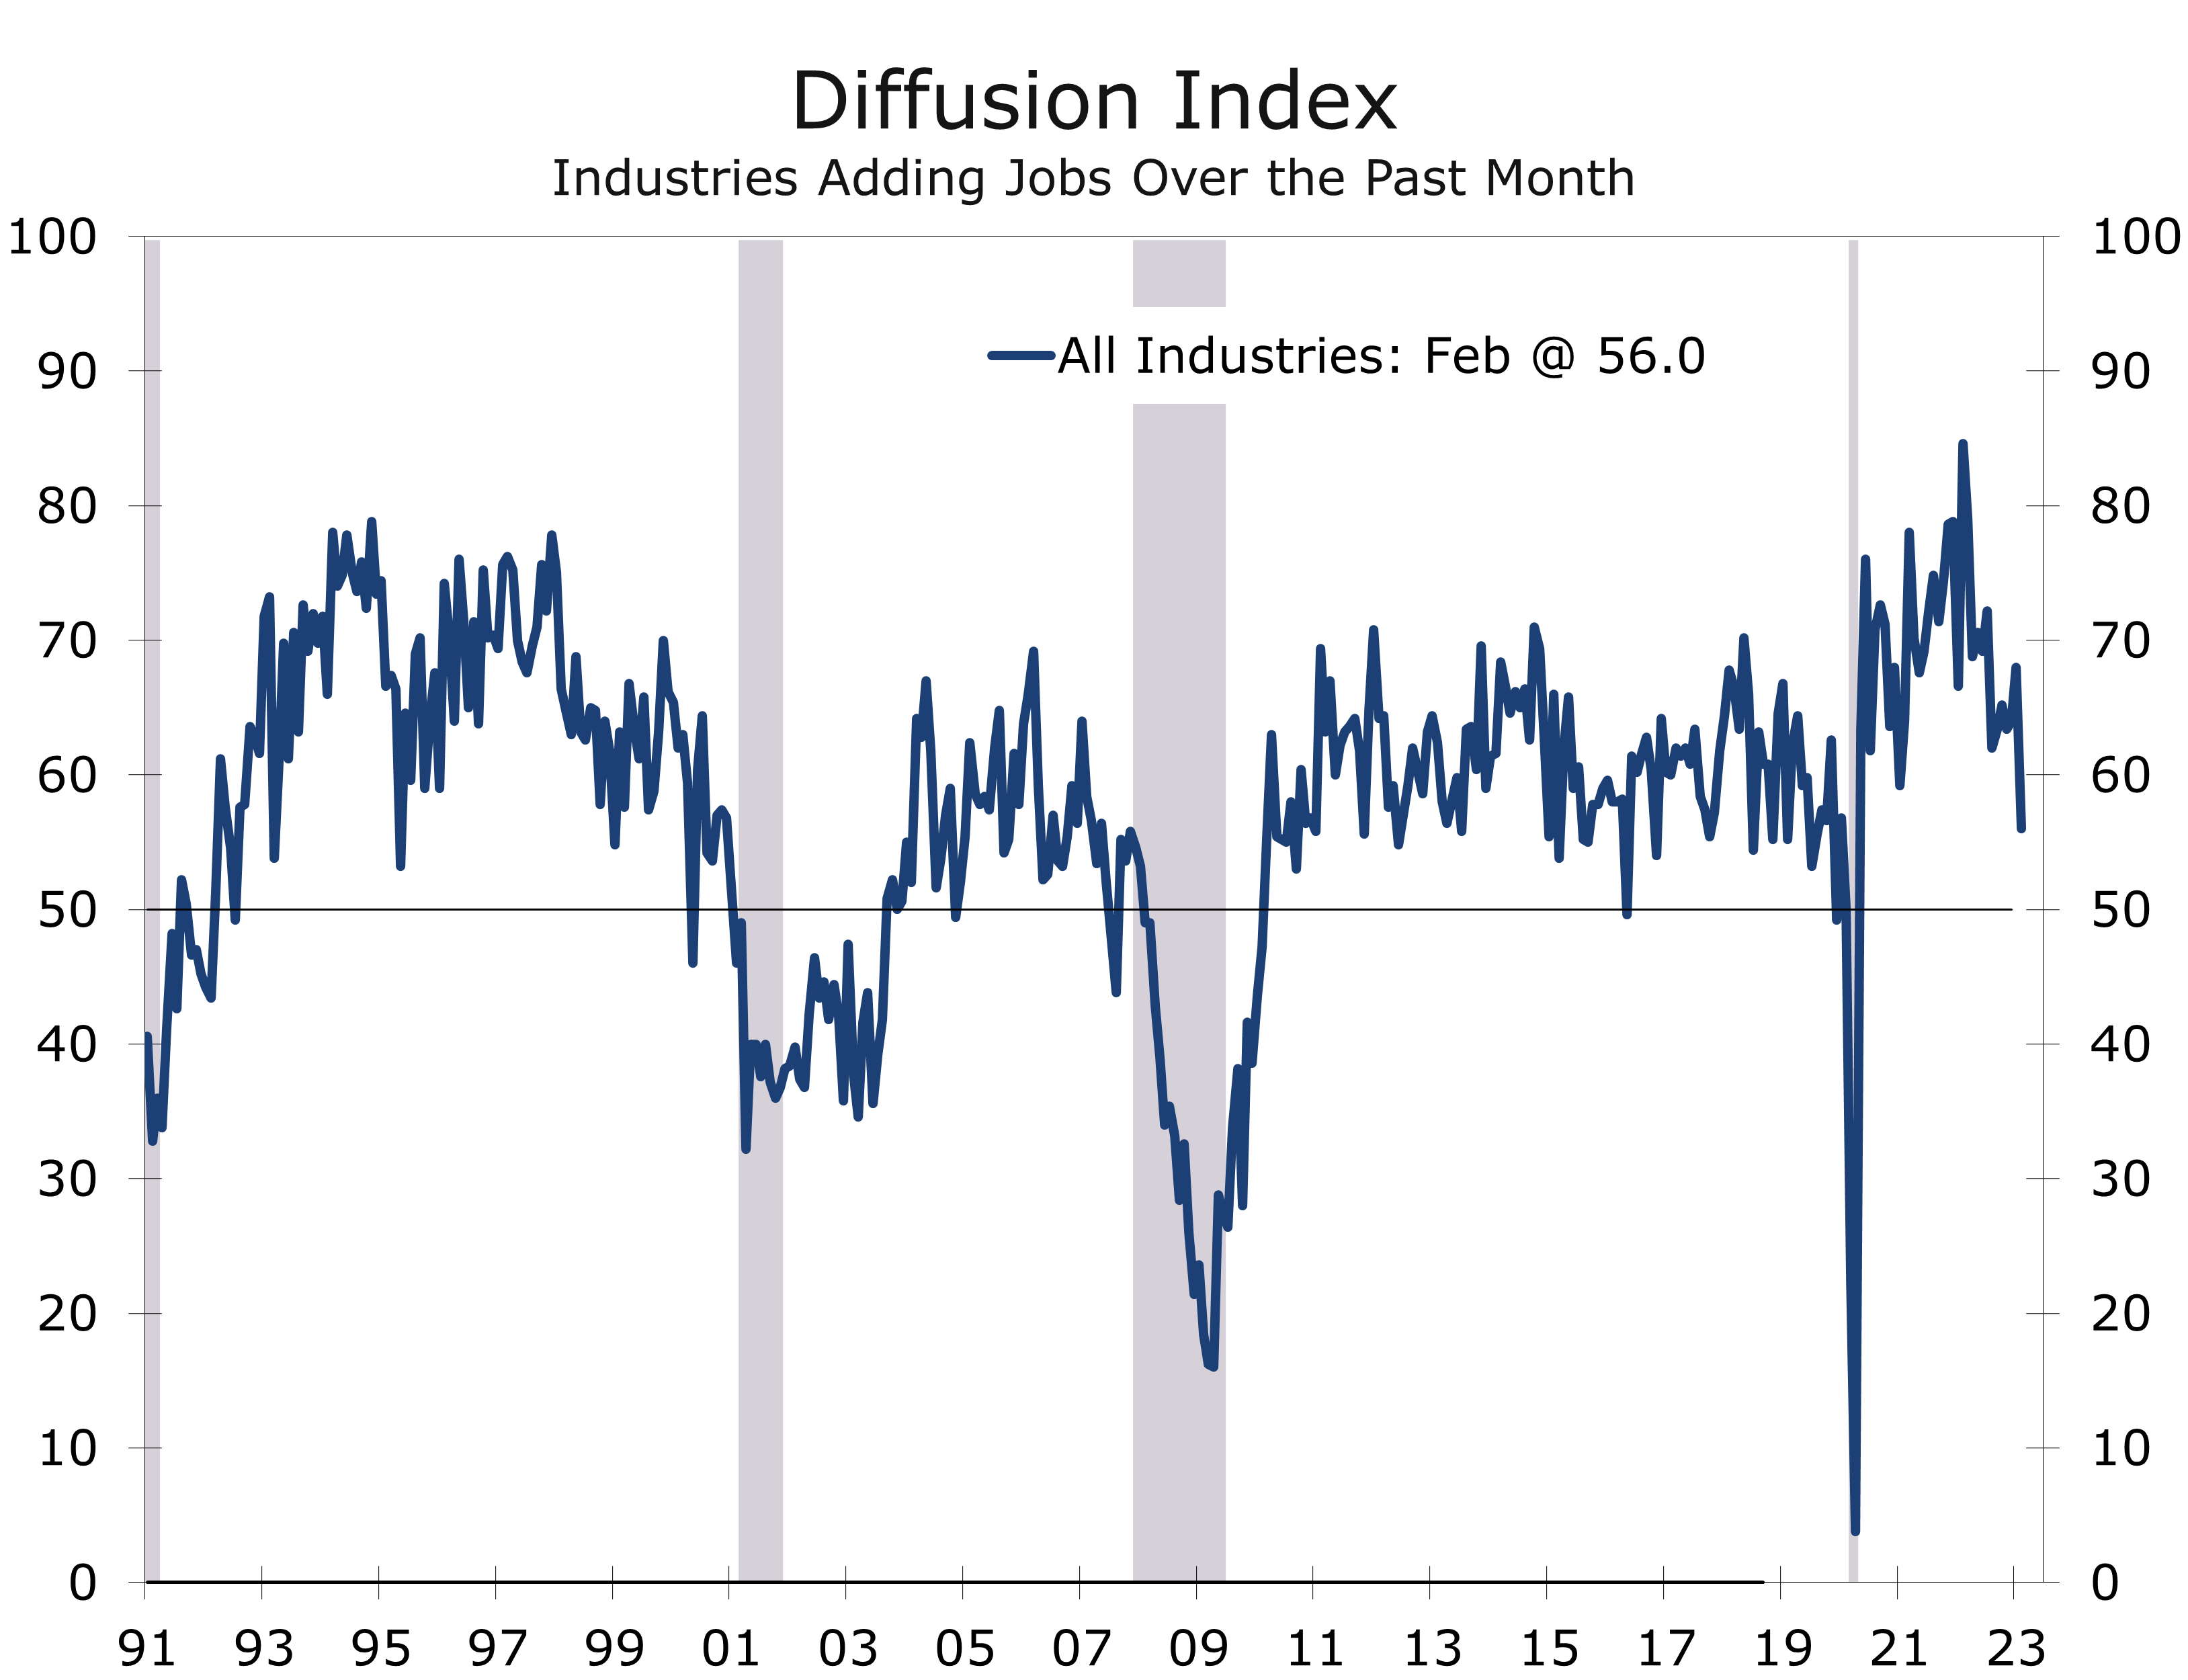
Overall job growth for the prior two months was also revised slightly lower. Payrolls now show a gain of 504,000 jobs in January and 239,000 in December, a combined 34,000 fewer jobs than earlier reported. The breadth of overall job gains was also the weakest since the lockdowns at the start of the pandemic, with the diffusion index falling 12 points in February to 56.
The weakness in the goods sector likely reflects a renewed emphasis by retailers and manufacturers to clear inventories ahead of what is widely expected to be a softer second half of 2023. Trucking and warehousing firms have cut 42,000 jobs since October.
Construction was a notable bright spot in February, with builders adding 24,000 jobs. That gain may have been bolstered by unseasonably mild weather. Nearly half the gain was in residential specialty trade contractors. Home builders are working feverishly to reduce their work-in-process inventory, which remains near a multi-decade high. Heavy and civil engineering construction added 7,700 jobs, benefitting from rising spending for road and bridge projects.
The unemployment rate rose 0.2 percentage points to 3.6% in February, as a 177,000 increase in household employment was more than offset by a 419,000 rise in the civilian labor force. Average hourly earnings came in slightly below expectations, rising just 0.24%, and is now up 4.6% year-to-year. The smaller than expected increase reflects the larger share of job gains occurring in lower paying industries. Average hourly earnings for production and non-supervisory workers rose 0.46% in February and are up a larger 5.3% year-to-year.

Disclaimer: This publication has been prepared for informational purposes only and is not intended as a recommendation offer or solicitation with respect to the purchase or sale of any security or other financial product nor does it constitute investment advice.
Housing Starts Decline Modestly in January
Housing Starts Decline Modestly in January
- Housing starts fell 4.5% to a 1.309-million unit pace. Single-family starts fell 4.5% to an 841,000 unit pace, while multi-family starts fell 4.9% to a 468,000-unit pace.
- The monthly housing starts data are extremely volatile during the winter months, when swings in weather conditions can lead to wide month swings.
- Weather appears to have influenced the data, with starts plunging 42.2% in the Northeast and 25.9% in the Midwest but rising 7.3% in the South and 5.5% out West.
- Permits are less impacted by the weather and were little changed in January.
- Last year’s slide in housing starts may be subsiding. The NAHB Home Builders’ Survey improved for a second month in February, reflecting a rise in present sales.
- Home builders continue to work down their backlog of work in process, with many making a concerted effort to get lean.
January’s 4.5% decline in housing starts broke a nascent string of improving reports for the housing sector. Home builders have reported a rise in buyer traffic in recent months and pending home sales and mortgage demand had shown some promise. Our sense is the pullback in mortgage rates brought some buyers back to the market that had canceled deals or put off home purchases when mortgage rate were closer to 7%. Those buyers came back in when rates fell back closer to 6%. Many builders also offered incentives to buy down mortgage rates.
While we would like to join the rising chorus of analysts expressing optimism about the housing market, we remain more cautious. Affordability remains extremely challenging and we have only seen a modest rebound in buyer traffic. Home builders have a huge backlog of single-family homes under construction and are actively working to reduce their inventory of completed homes and work-in-process.
Starts and permits still appear to be trending lower, as builders work to reduce inventory.
Housing starts are extremely volatile during the winter, particularly single-family starts, which rose 8.9% in December. Most of that rise was in the Northeast, where starts nearly doubled. Starts plummeted back to their prior trend in the Northeast in January but jumped to their highest level since June in the South, where weather was unusually mild. Permits are less influenced by the weather and do not show these wide swings. Starts and permits are both trending lower on a three-month moving average basis.
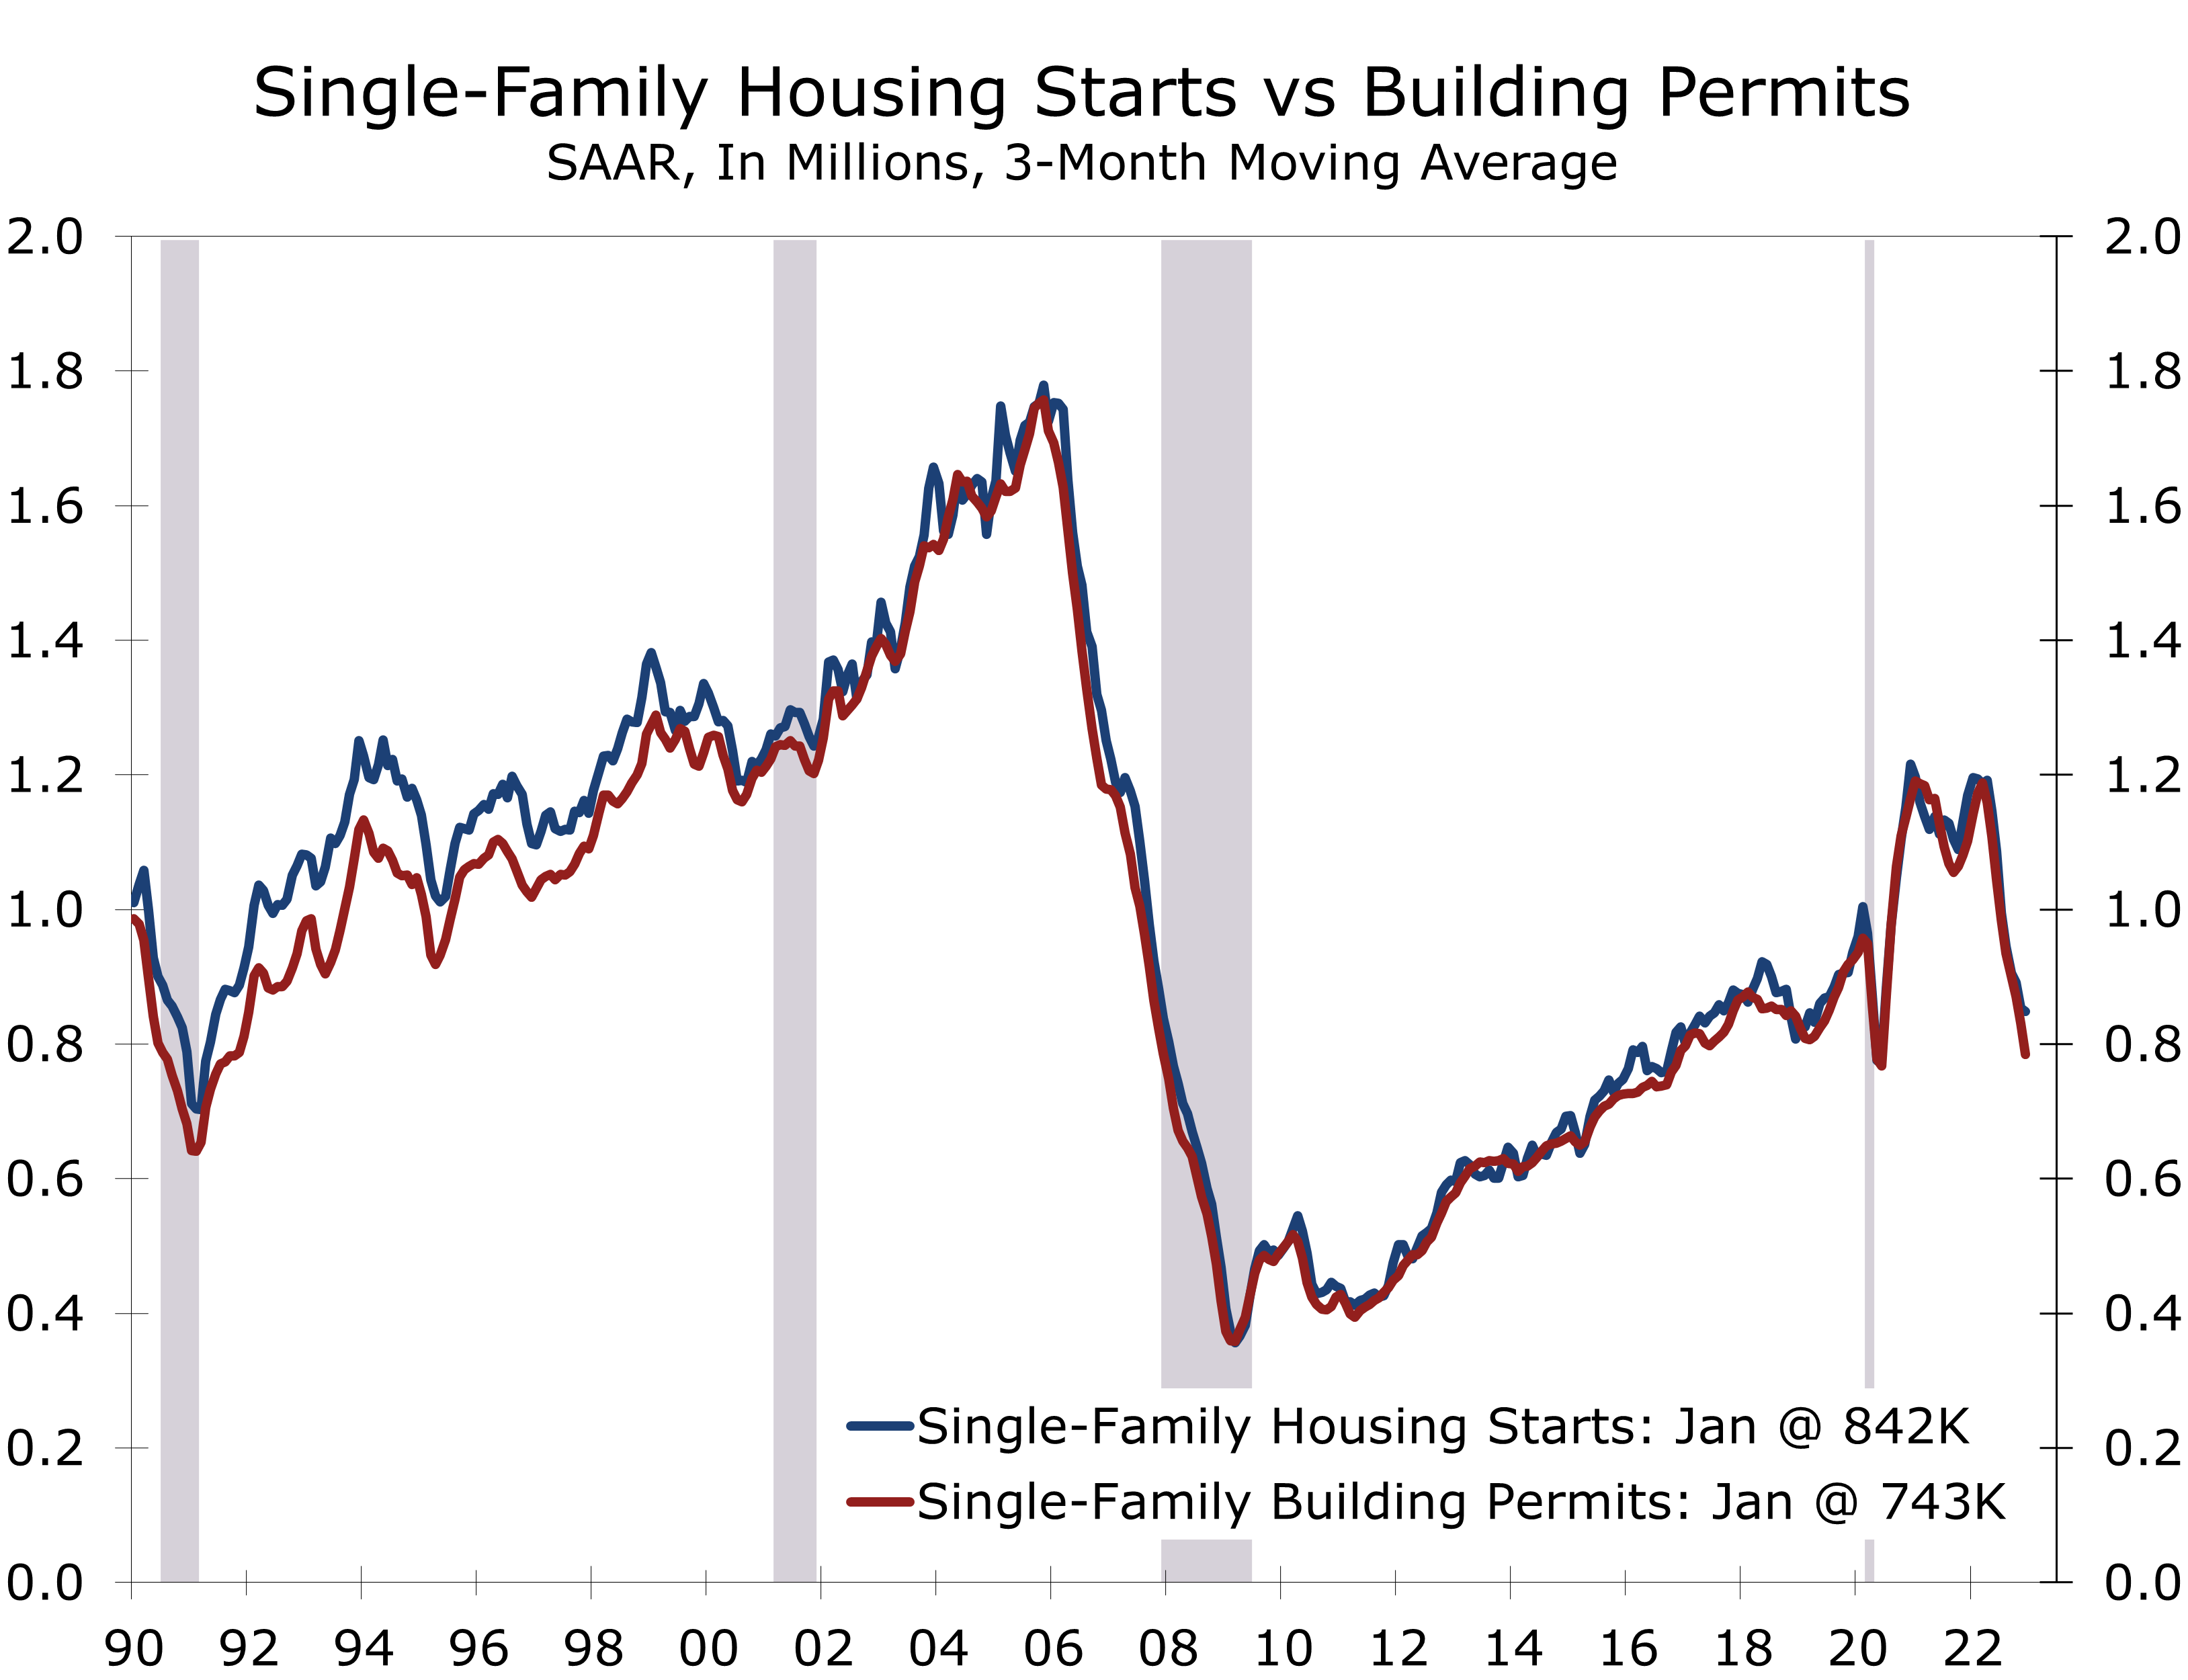
Multi-family starts fell 4.9% in January, while permits rose 2.5%. Both starts and permits are trending lower on a three-month moving average, however, as apartment developers appear to have their hands full with projects currently underway.
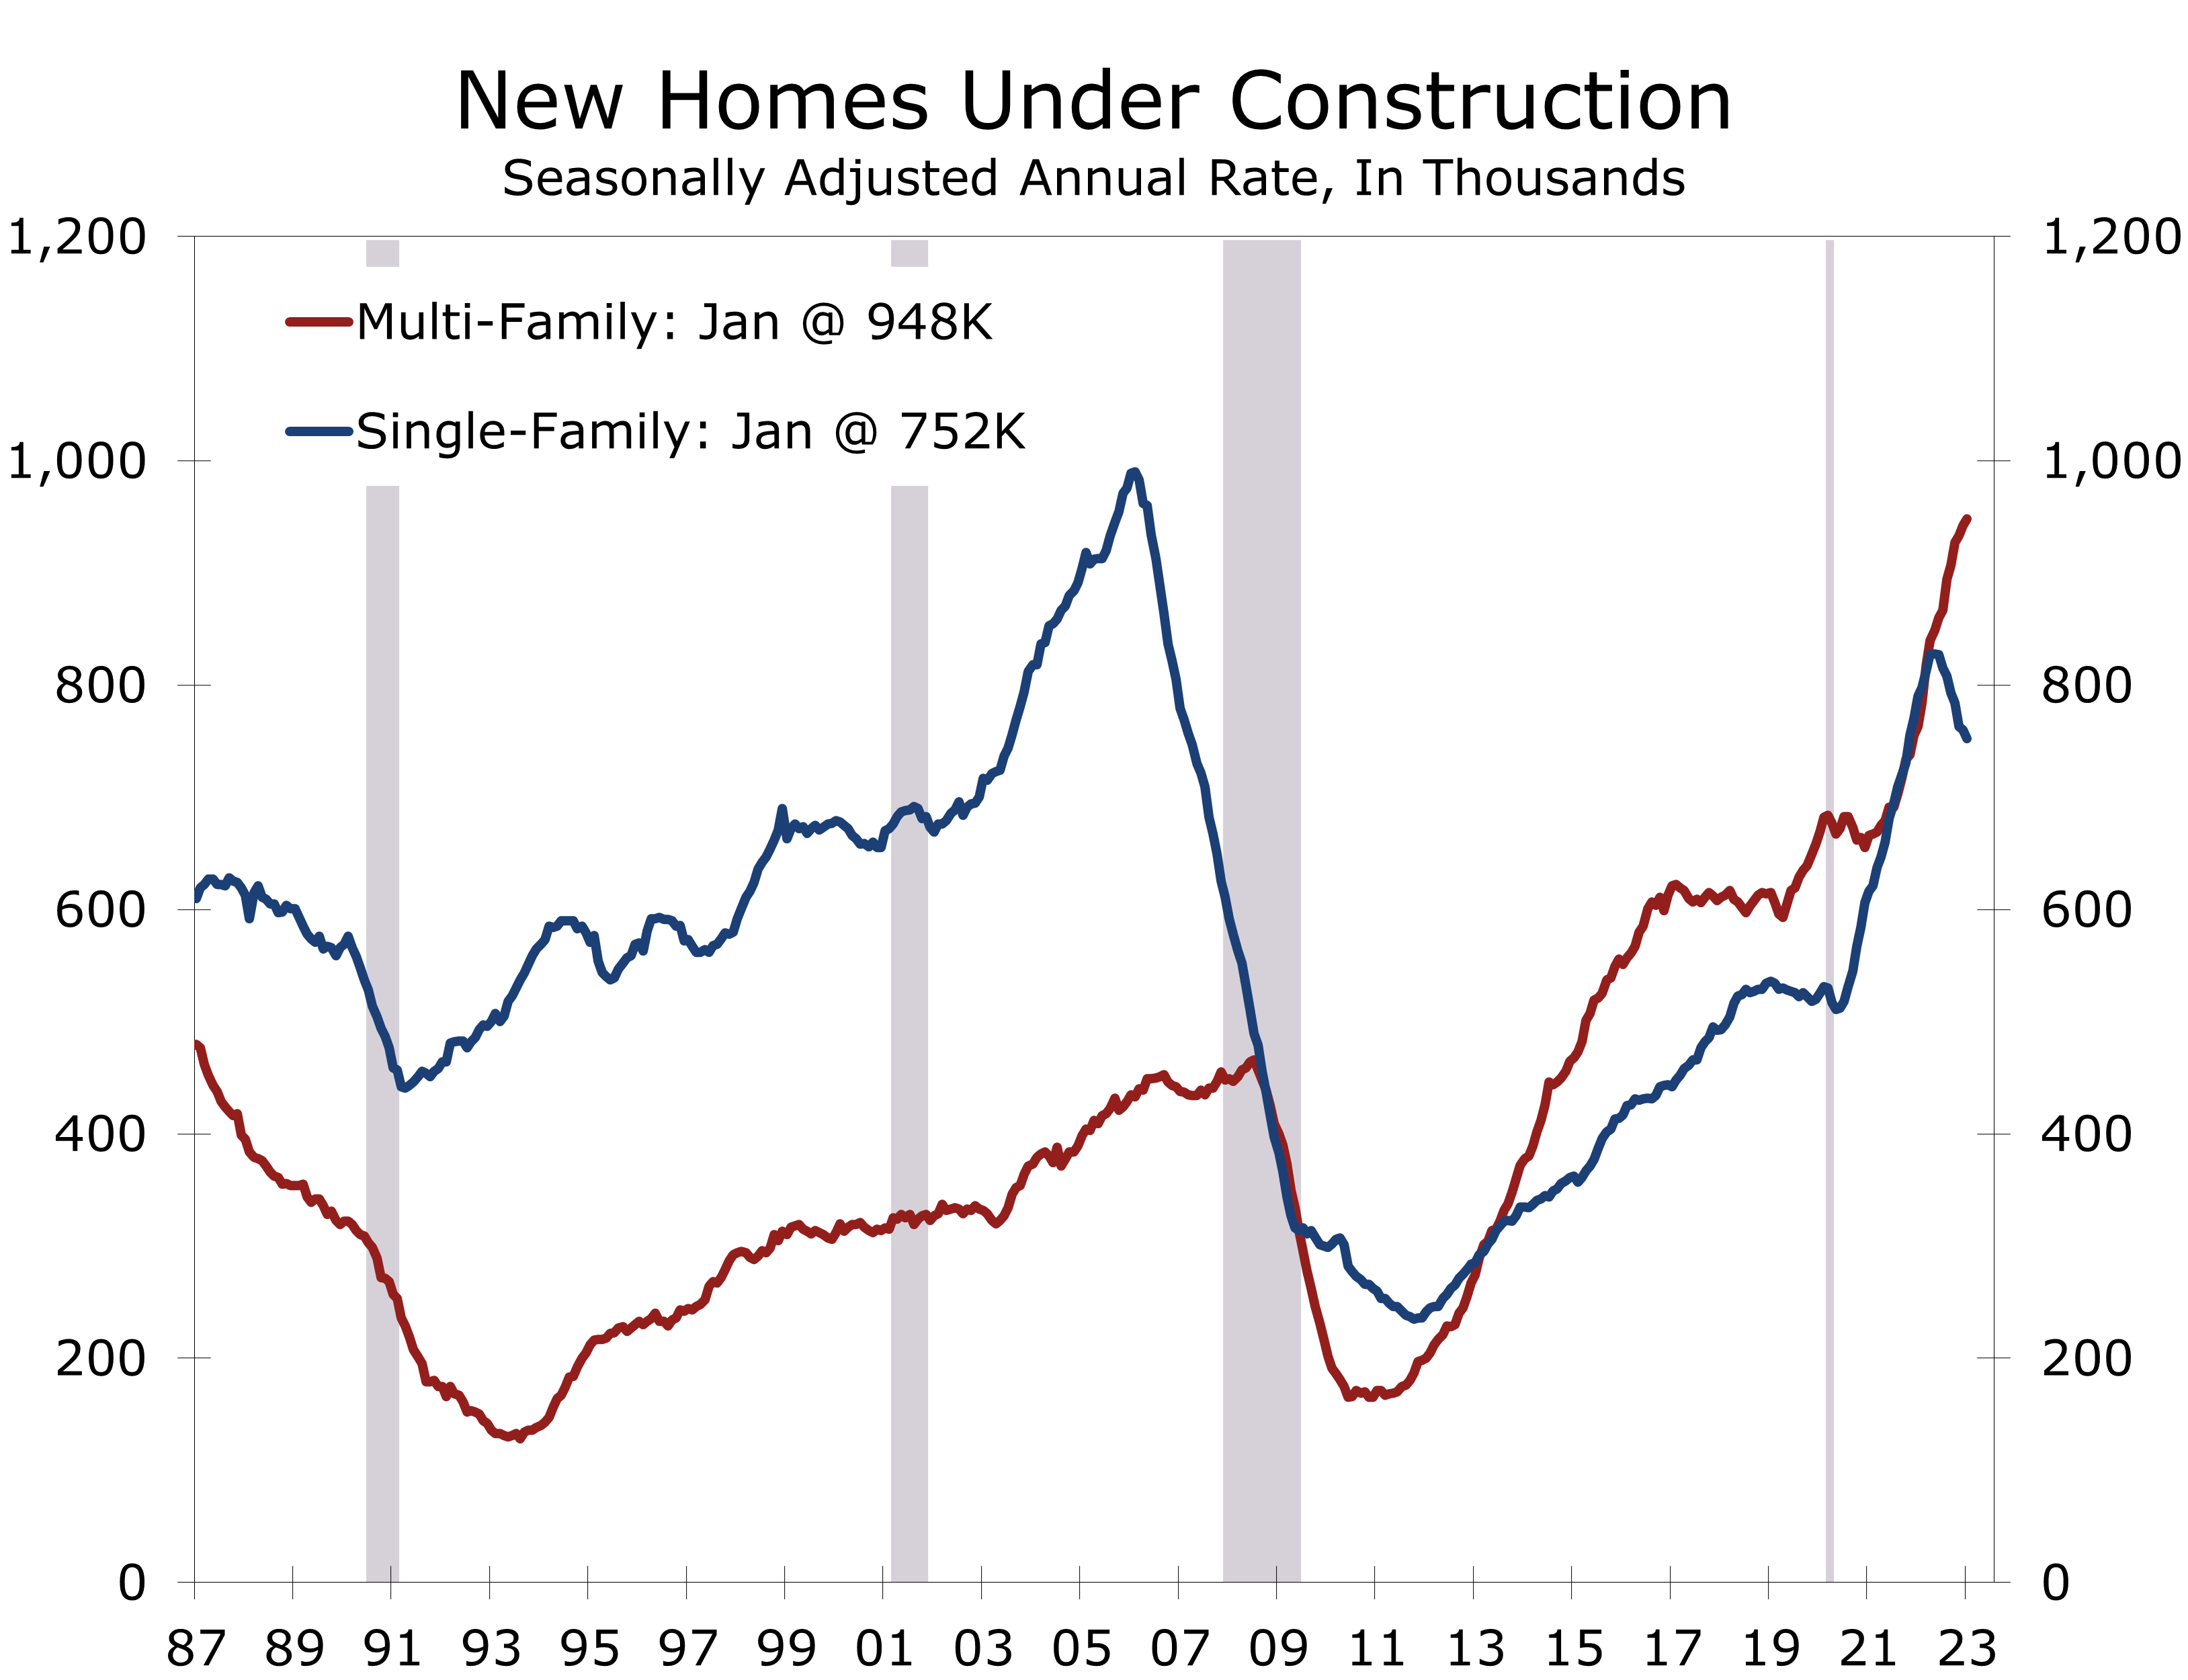
Shortage of materials and workers and the preponderance of mid-rise and high-rise apartment projects has stretched out the timeline for completing apartment developments. The number of multi-family units under construction, the overwhelming majority of which are apartments rose by 6,000 in January to a 948,000-unit pace, which is the highest since 1974. The number of authorized multi-family permits that have not been started also continues to trend higher.
Rents have been falling the past few months and lenders have tightened underwriting.
Demand for apartments has weakened in recent months, largely reflecting affordability issues. Rents have been declining the past few months and lenders have tightened underwriting standards for new developments. All signs point to fewer new multi-family projects entering the pipeline until the backlog of developments begins to clear and participants have a better sense of how demand is holding up. We are looking for around a 15% pullback in multi-family starts this year, and about a 20% drop in permits.
Back-to-back improvements in the NAHB/Wells Fargo Housing Market Index (HMI) boosted optimism ahead of January housing starts. The HMI jumped 7 points in February to 42, after rising 4 points in January. Any reading below 50 means more builders see conditions deteriorating than see them improving.
We suspect new home sales rose in January, confirming the improvement in builder sentiment.
The present sales index rose 6 points to 46, after rising 4 points in January. Expected sales over the next six months rose 9 points to 48, while prospective buyer traffic rose 6 points to 29. We suspect new home sales rose in January, reflecting lower mortgage rates and various incentives by builders to bring buyers back to the table. Builders have mostly been buying down mortgage rates, to reduce the sting from rising rates.
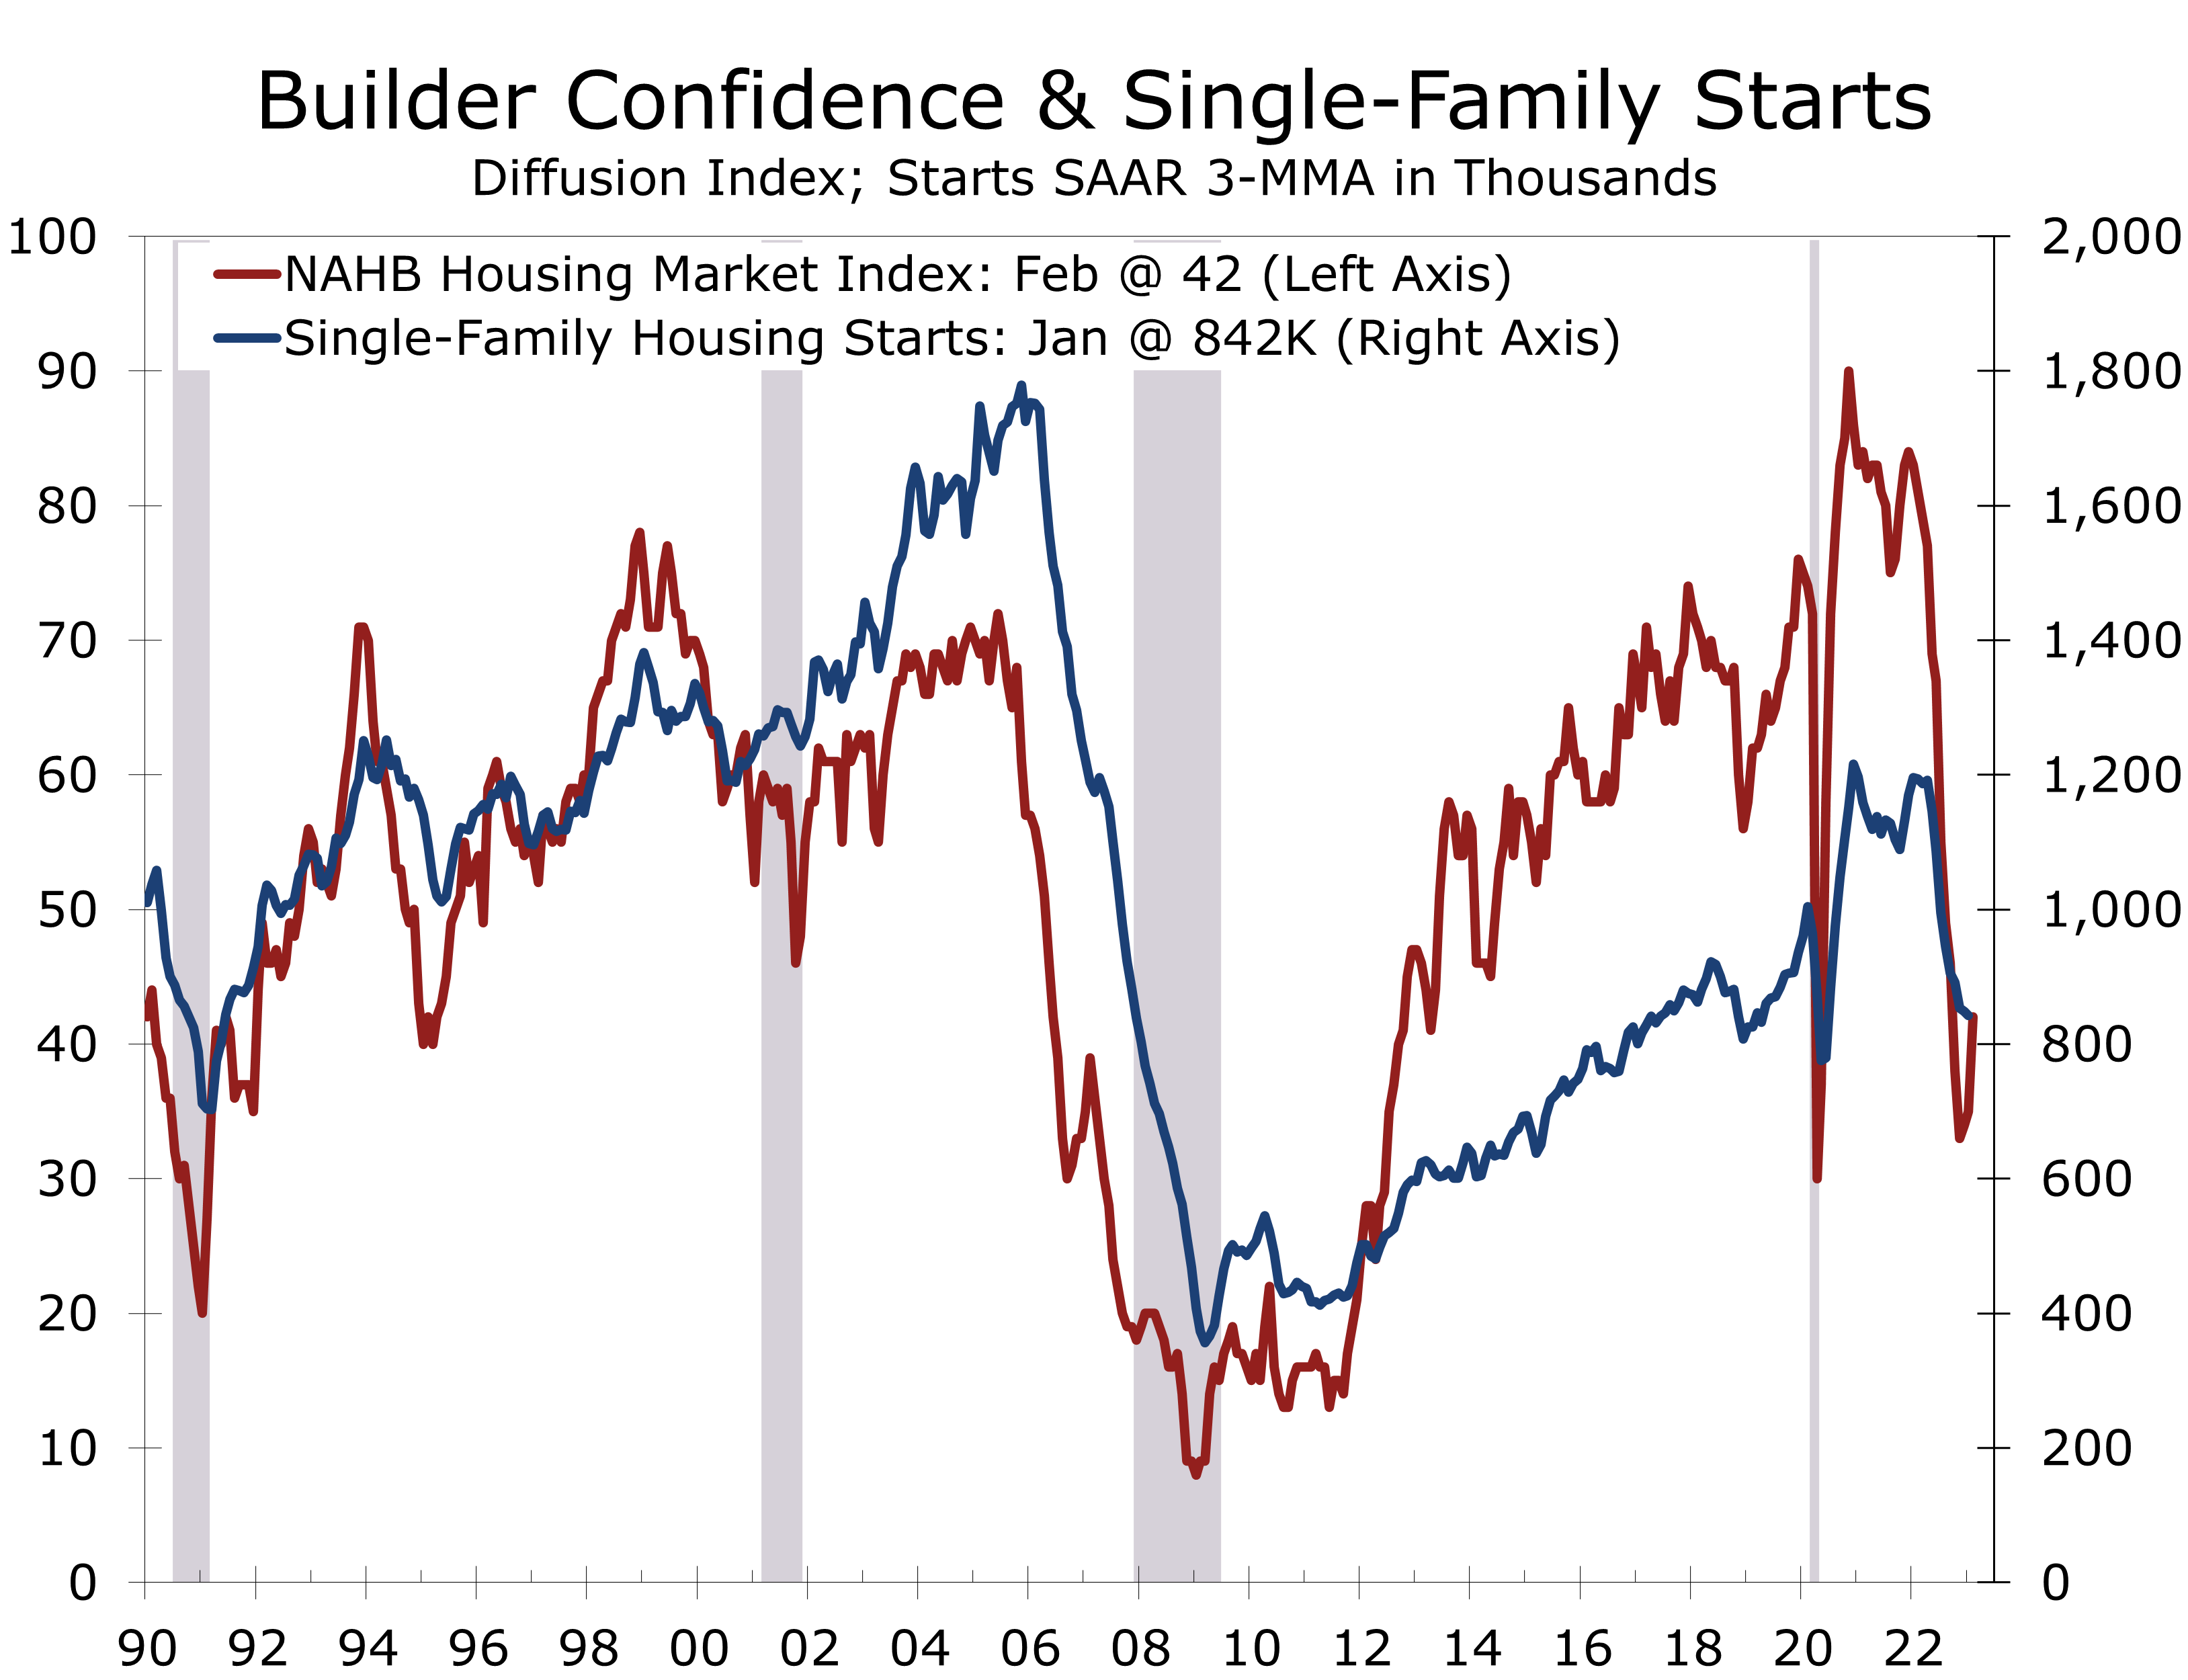
We feel it would be a mistake to interpret the bounce in builder confidence as a sign the housing market is stabilizing. Housing starts are almost certainly headed lower, as interest rates remain higher for longer. Builders will concentrate on clearing their construction backlog and will discount prices to point. Other than lumber, however, raw material prices are still rising.
Disclaimer: This publication has been prepared for informational purposes only and is not intended as a recommendation offer or solicitation with respect to the purchase or sale of any security or other financial product nor does it constitute investment advice.
Inflation Perks Back Up in January
Inflation Perks Back Up in January
- The Consumer Price Index rose largely in line with market expectations. The headline index rose 0.5% and the core rose 0.4%.
- The slide in inflation, so apparent during the second half of last year, is now moderating.
- The BLS updated the weights assigned to various components of the CPI to reflect the most recent survey of consumer spending patterns and updated their seasonal factors.
- Revisions to the seasonal factors slightly reduced inflation in the first half of last year and slightly raised it during the second half.
- Prices for food and energy items picked up in January, with food costs climbing 0.5% and energy prices rising 2%.
- Prices for labor-intensive services rose notably, including hotels (1.5%), nursing homes (1.4%), car repair (1.3%) and food away from home (0.6%).
- The January inflation data is supportive of recent Fed statements that “ongoing increases” in the federal funds rate target would be appropriate.
The monthly Consumer Price Index report continues to rival the employment report as the key piece of information released each month. The latest report came in close to expectations, which had been prepared for firmer price hikes by last week’s release of revised seasonal factors and component weights for the index. Those revisions had taken the shine off the lighter inflation numbers initially reported late last year. Most notably, December’s previously reported 0.1% drop in the headline CPI is now a 0.1% increase.
The adjustments to the seasonal factors and component weights will make the inflation data more relevant with current economic behavior. The shelter categories have been slightly increased, while weights for used cars and some other core goods – which saw prices fall last year – have been slightly reduced.
Shelter costs, which account for 43% of the core CPI, remain problematic. Rent and owners’ equivalent rent each rose 0.7% in January, even though market measures of asking rent for new tenants have eased considerably. The CPI measure of rents includes rents for new tenants and renewals of existing residents, the bulk of which are seeing significant increases due to earlier spikes in asking or market rents. Prices for hotel and motel rooms rose 1.5% in January, following a 1.2% rise the prior month and is up 8.5% year-to-year.
Residential rent and owners’ equivalent rent each rose 0.7% in January.
The bulk of the deceleration in inflation last year came from falling energy prices and lower prices for used cars. Further progress on each will be difficult this year.
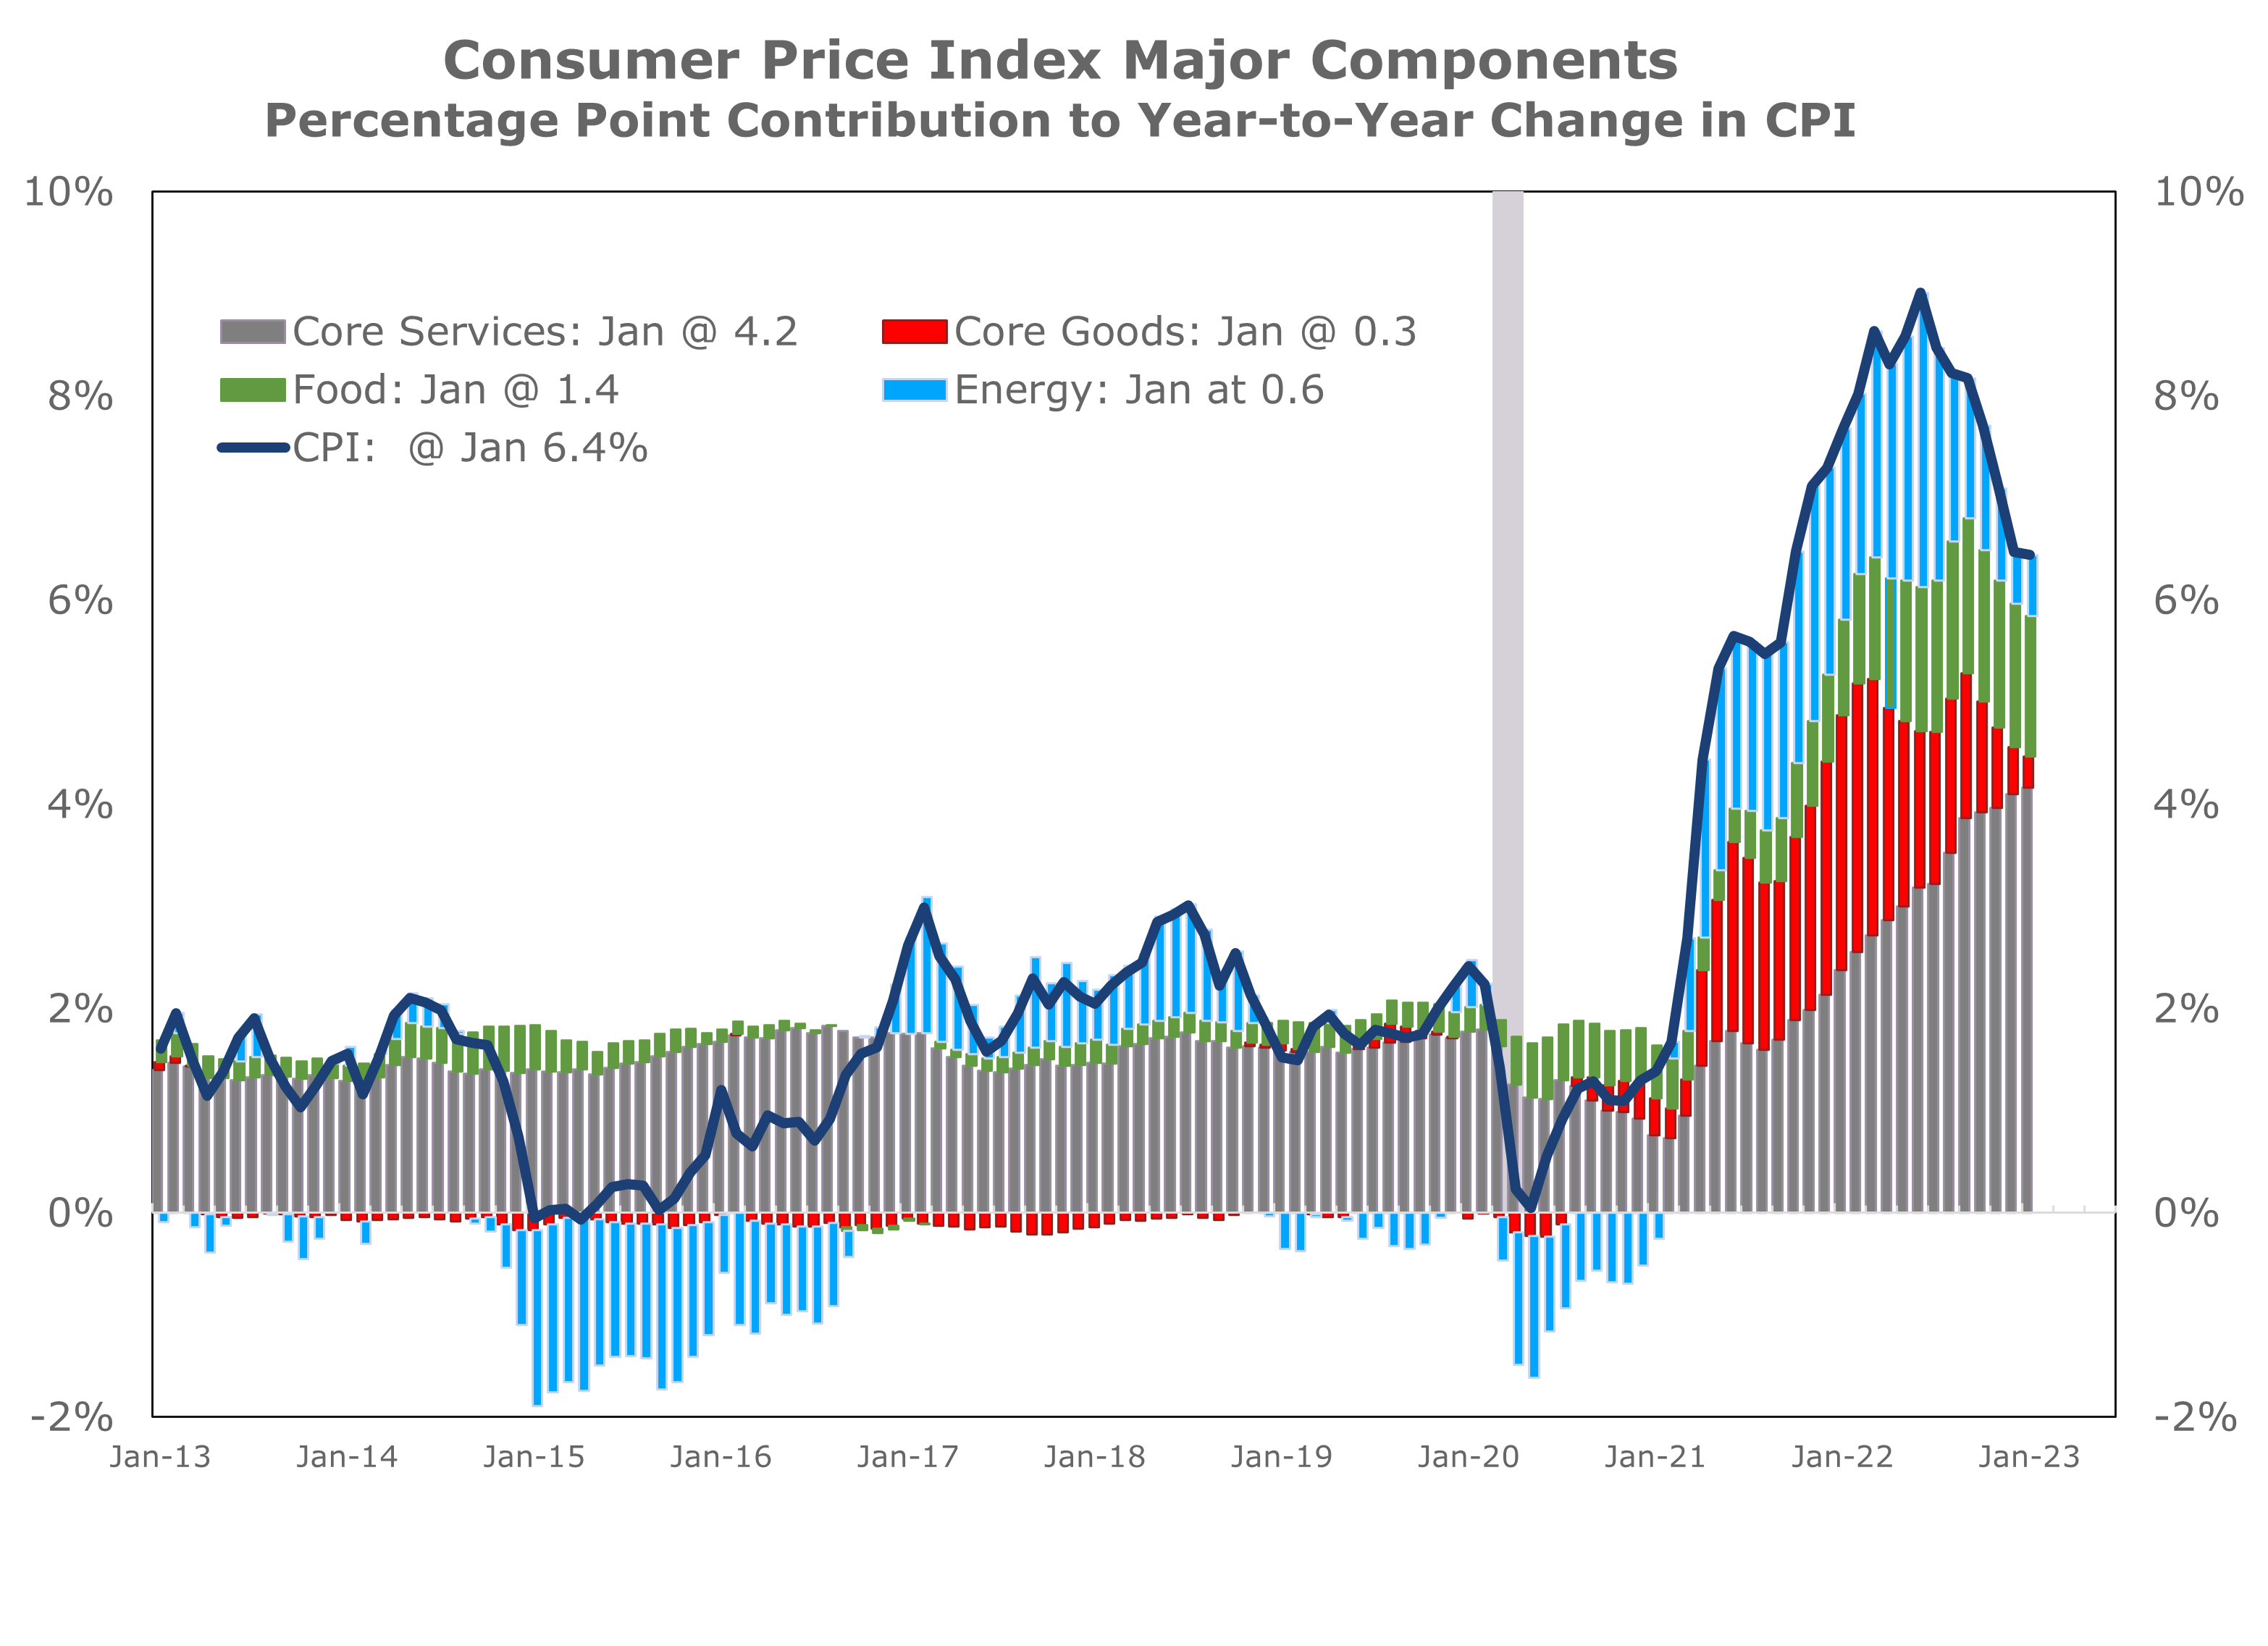
Energy prices fell sharply during the second half of 2022, benefitting from the record drawdown of reserves from the Strategic Petroleum Reserve and warmer than usual winter weather in Europe and the Northeast U.S. With heightened geopolitical pressures around the world, the now severely depleted Strategic Petroleum Reserve will need to be refilled, which will effectively put a floor under oil prices.
Used car prices will also provide less help in containing inflation. While used car prices fell 1.9% January, the Manheim used car price index edged higher, signally the bulk of price declines are behind us. Moreover, new car inventories remain exceptionally low, which should continue to divert demand to used cars. Higher vehicle prices are also fueling steep price gains for auto insurance, with the cost of vehicle insurance rising 1.4% in January and climbing 14.7% over the past year.
Higher vehicle prices are fueling steep price increases for auto insurance.
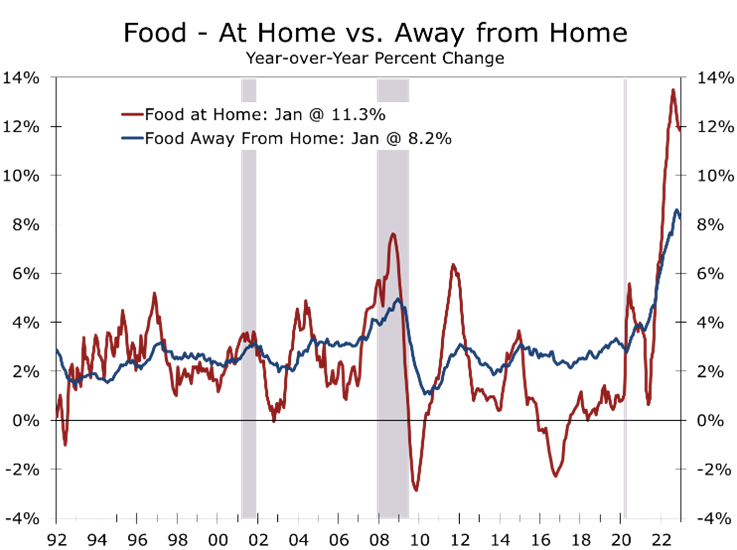
Food prices most likely head the list of consumers’ frustration today. Prices for food at home, which is mostly groceries, have spiked 11.3% over the past year. Eggs are the greatest source of pain, with prices surging 8.5% in January and 70.1% over the past year. Prices for many other food items, including meats (0.0%), pork (0.0%), poultry (-0.1%) and fish (-0.1%) all moderated in January, continuing recent trends.
The most problematic area for inflation remains core services, which include shelter as well as several labor-intensive categories. There has been considerable blowback at the BLS for how shelter costs are measured, with the BLS measuring rents paid for rental housing and the implied rent paid by homeowners. We feel the BLS’s measure is correct, with the 34% weight in the CPI closely corresponding with the share of income households devote to rent or its equivalent.
While the CPI rent measure lags several market measures, it does a good job of capturing actual changes in housing costs. Renters are facing steep increases as leases renew. Moreover, with more than a third of expenses tied to rent, higher residential rents feed back into wage demands.
With more than a third of expenses tied to rent, higher rents feed back into wage demands.
January’s CPI data, combined with the earlier reported stronger jobs data, have cleared the way for the Fed to move forward with hiking interest rates. Market expectations for the federal funds rate are now in line with the Fed’s, calling for at least two more quarter-point rate hikes this year and anticipating no cuts in interest rates until 2024 or later.

Disclaimer: This publication has been prepared for informational purposes only and is not intended as a recommendation offer or solicitation with respect to the purchase or sale of any security or other financial product nor does it constitute investment advice.
Small Business Optimism Rises Modestly in January
Small Businesses See Modest Improvement
- Small Business Confidence began the year on a slightly more optimistic note.
- The National Federation of Independent Business (NFIB) Small Business Optimism Survey rose 0.5 points to 90.3 in January.
- January’s rise primarily reflects a decline in pessimism rather than any sudden recognition of more positive trends.
- The share of business owners expecting the economy to improve rose 6 points to -45%.
- Many of the largest gains were tied to hiring and compensation, both of which remain strong and reflect the exceptionally tight labor market.
- The share of firms raising prices fell 1 point to 42% in January.
- The share of firms making capital expenditures over the past 6 months rose 4 points to 59%. Business owners, however, remain cautious about capital spending and inventories in the coming year.
January’s 0.5 percentage point rise in the NFIB Small Business Optimism Index primarily reflects a slight drop in pessimism among small business owners rather than rising optimism. The proportion of firms expecting the economy to improve in coming months rose 6 points but remains exceptionally low at -45%. Most of the other components posting large gains were tied to hiring and compensation, which is clearly a double-edged sword right now. Hiring plans rose 2 points to 19% but a whopping 45% of firms had job openings they have not been able to fill.
Less pessimism is still better than the alternative and there were some notable positives within the report. The share of firms reporting they made capital outlays during the past 6 months rose 4 points to 59%. Earnings trends also improved, rising 4 points to a less negative 26%. The net share of firms raising prices also fell 1 point to 42%.
The net share of firms raising prices over the past three months fell 1 point to 42%.
Price hikes were most prevalent in construction, retailing, wholesale trade and transportation. The share of firms hiking prices remains well above levels historically consistent with the Fed’s 2% inflation goal. Plans to raise prices rose 5 points in January to 29%.

Labor market conditions remain much closer to the peak levels than where they would be if the economy was truly on the precipice of recession. The NFIB noted that 57% of small business owners reported they were hiring or trying to hire in January, which was up 2 points from December. Of those businesses hiring or trying to hire, 97% reported they had few or no qualified applicants for their open positions.
Fifty-seven percent of small business owners were hiring or trying to hire in January.
After showing some incipient signs of loosening, the labor market tightened further in January, a month that saw the unemployment rate fall to 3.4%. The NFIB noted that 45% of small business owners reported they had job openings they could not fill in January, which is up 4 points from December and just 6 points below its all-time peak of 51% hit in May 2022. The long-run average for job openings, dating back 49 years, is 23%, a level last seen in early 2014.
While lower unemployment rates are often celebrated as a sign of economic success, there appear to be structural impediments in the labor market today that make it tougher for businesses to hire even when the economy is growing only modestly. Ongoing shortages of workers are forcing business owners to boost compensation, hire less qualified workers, reduce operating hours, or offer fewer products and services.
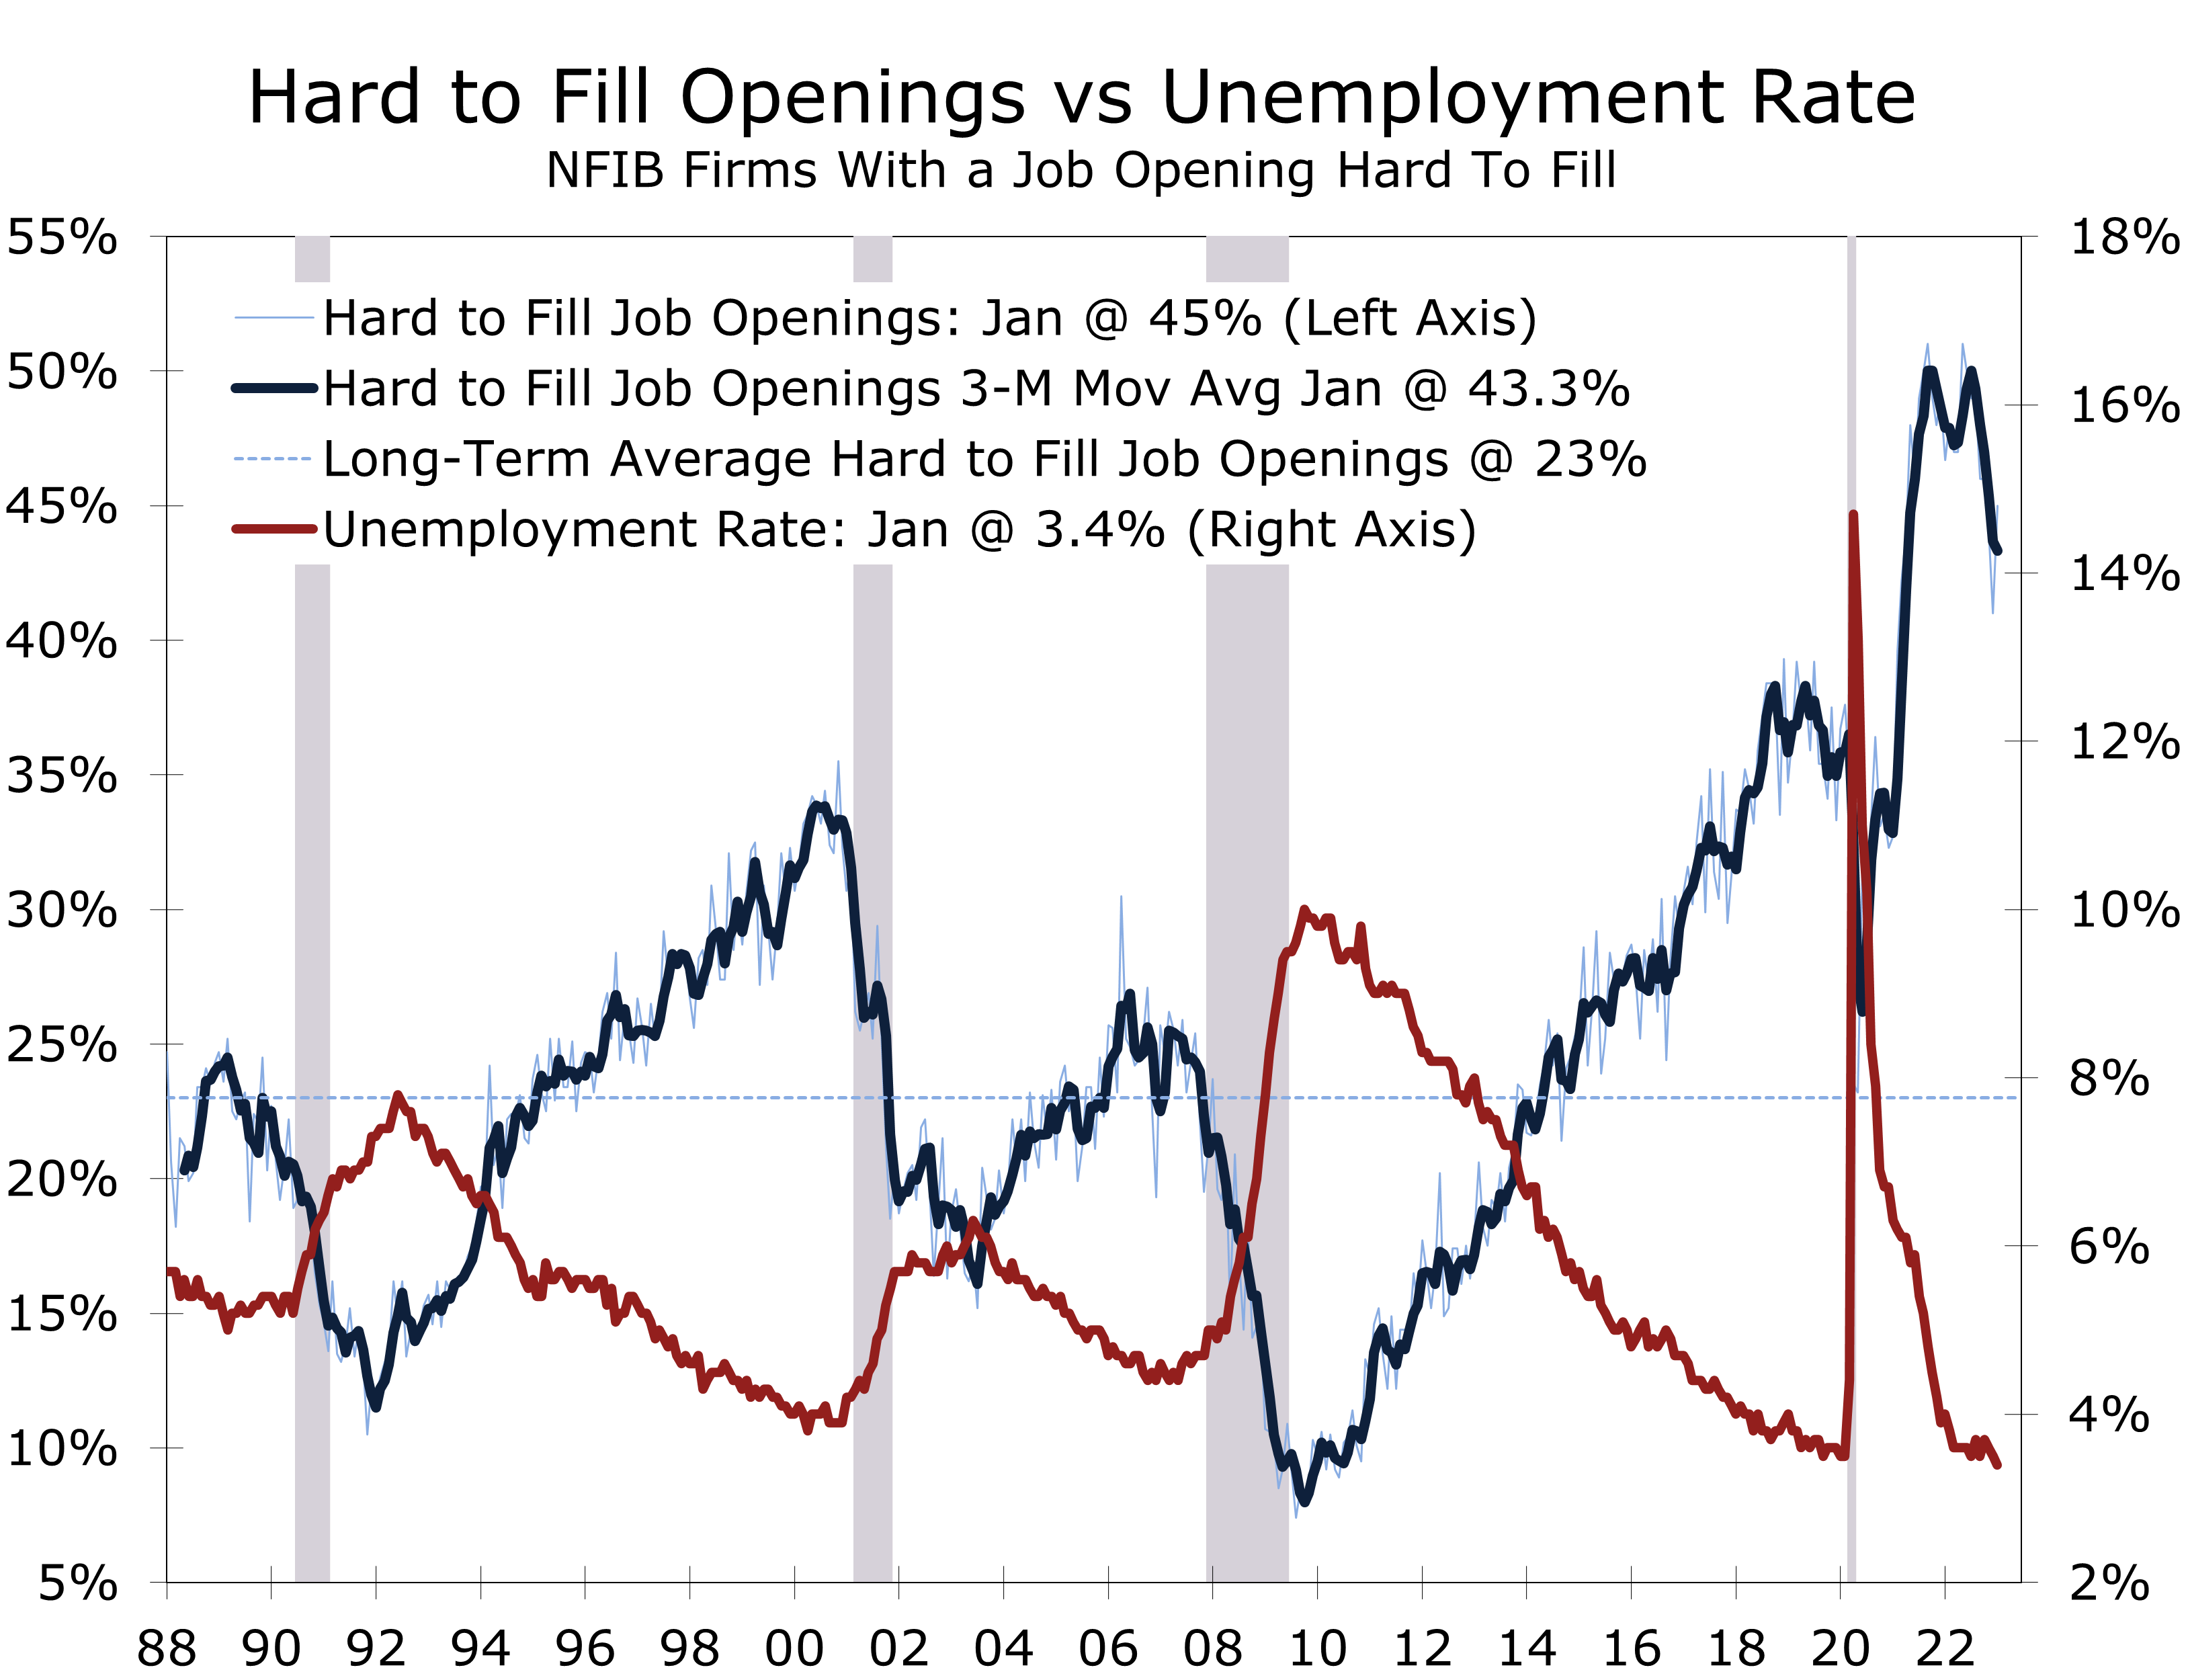
Concerns about the quality of labor have risen to historic heights, with 24% of small business owners rating labor quality as their top concern. Another 10% of business owners rate labor costs as their top problem, which is up 2 points from December.
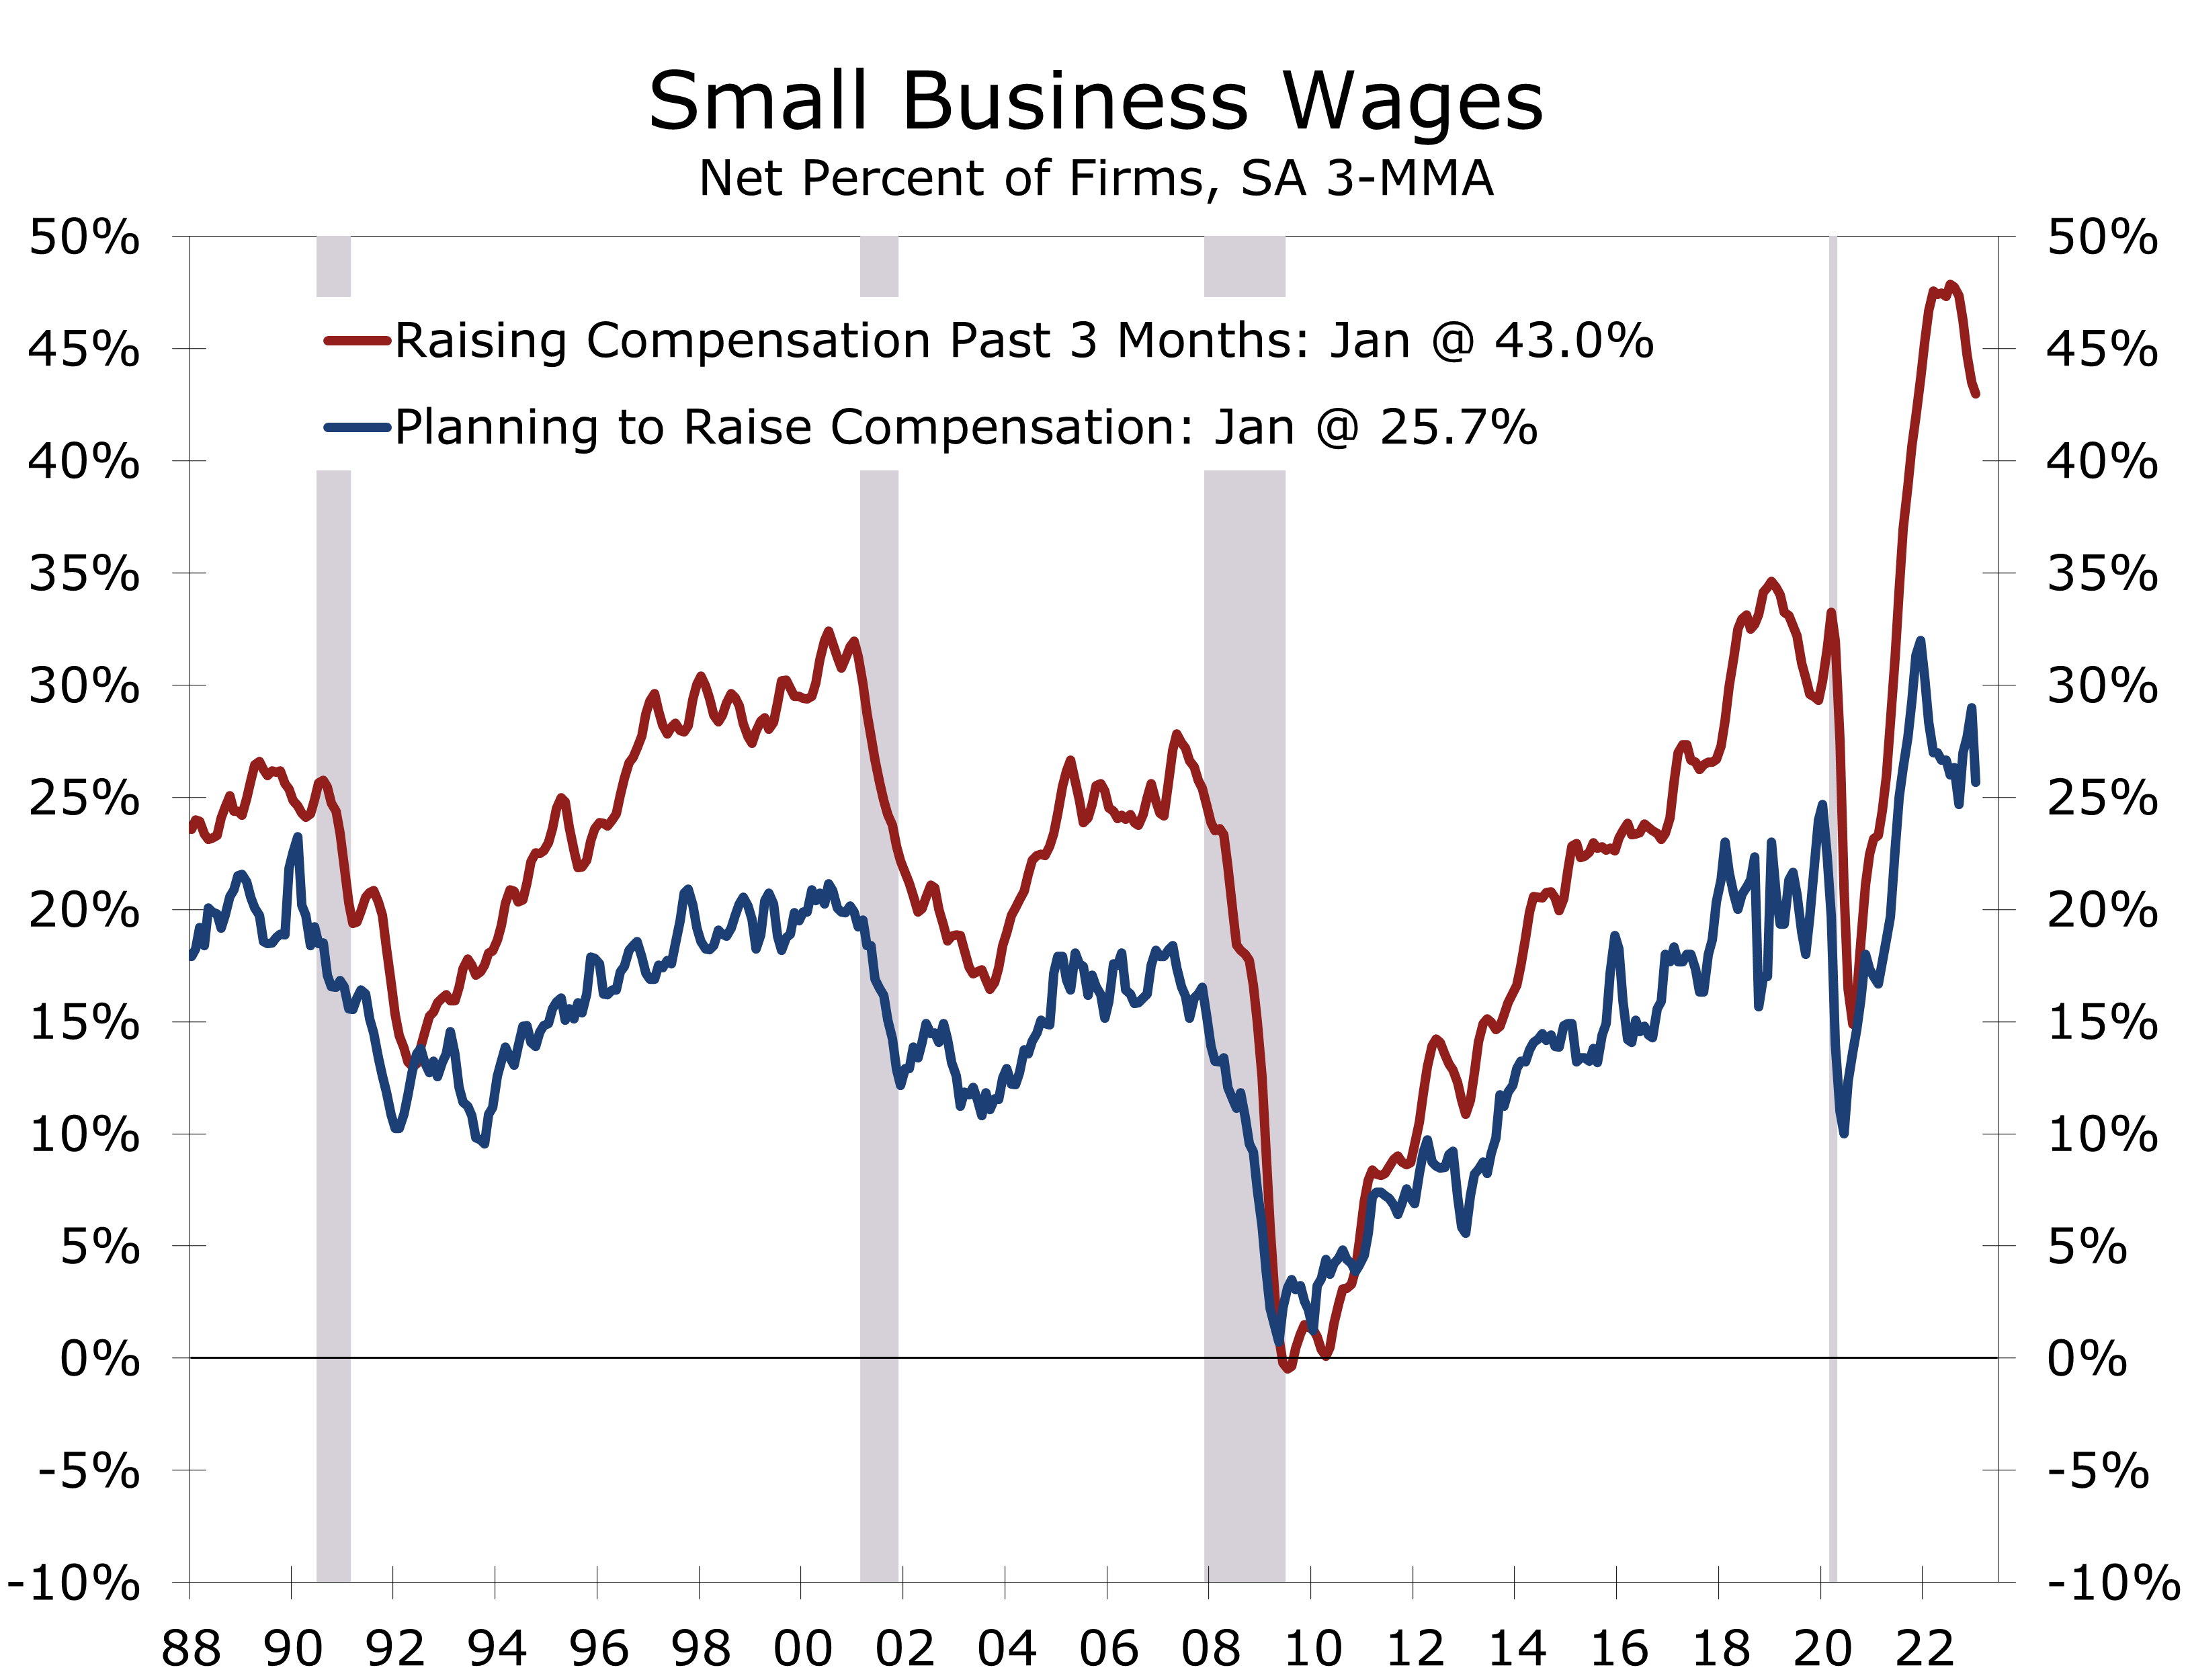
With labor markets so tight, businesses are having to pay more to attract and retain workers. A net 46% of business owners raised compensation during the past 3 months, which is up 2 points from the December and just 4 points below the record high hit in January of last year. The share of firms planning to raise compensation fell 5 points in January to 22%.
Significantly more businesses are boosting compensation than are planning to.
The share of businesses boosting compensation is more than twice the share planning to raise compensation. The gap is historically wide and provides insight into the persistence of stiff price hikes in labor-intensive parts of the economy as well as the ongoing pressure on operating margins.
Businesses are passing along their higher costs. Inflation in the most labor intensive parts of the economy rose 0.6% in January and is up 7.2% year-to-year. Today’s NFIB report shows the labor market remains too tight to support a sustained deceleration in wages and prices. The persistence of wage and price pressures raises the likelihood the Fed will raise rates a little higher this year and hold them there longer.
Disclaimer: This publication has been prepared for informational purposes only and is not intended as a recommendation offer or solicitation with respect to the purchase or sale of any security or other financial product nor does it constitute investment advice.
Stronger Employment Growth Shows the Economy Is Not Landing Anytime Soon
Employment Surges in January
- Nonfarm employment surged by 517,000 jobs in January, which was more than double consensus estimates.
- While hiring was led by another big jump in hiring at restaurants and bars, job gains were extremely broad based.
- The most cyclical parts of the economy -construction, manufacturing and trucking and warehousing – added a combined 66,900 jobs.
- Seasonal factors bolstered the overall job growth. More cautious holiday season hiring at retailers and delivery firms resulting in fewer than usual layoffs and a big seasonally adjusted gain in January.
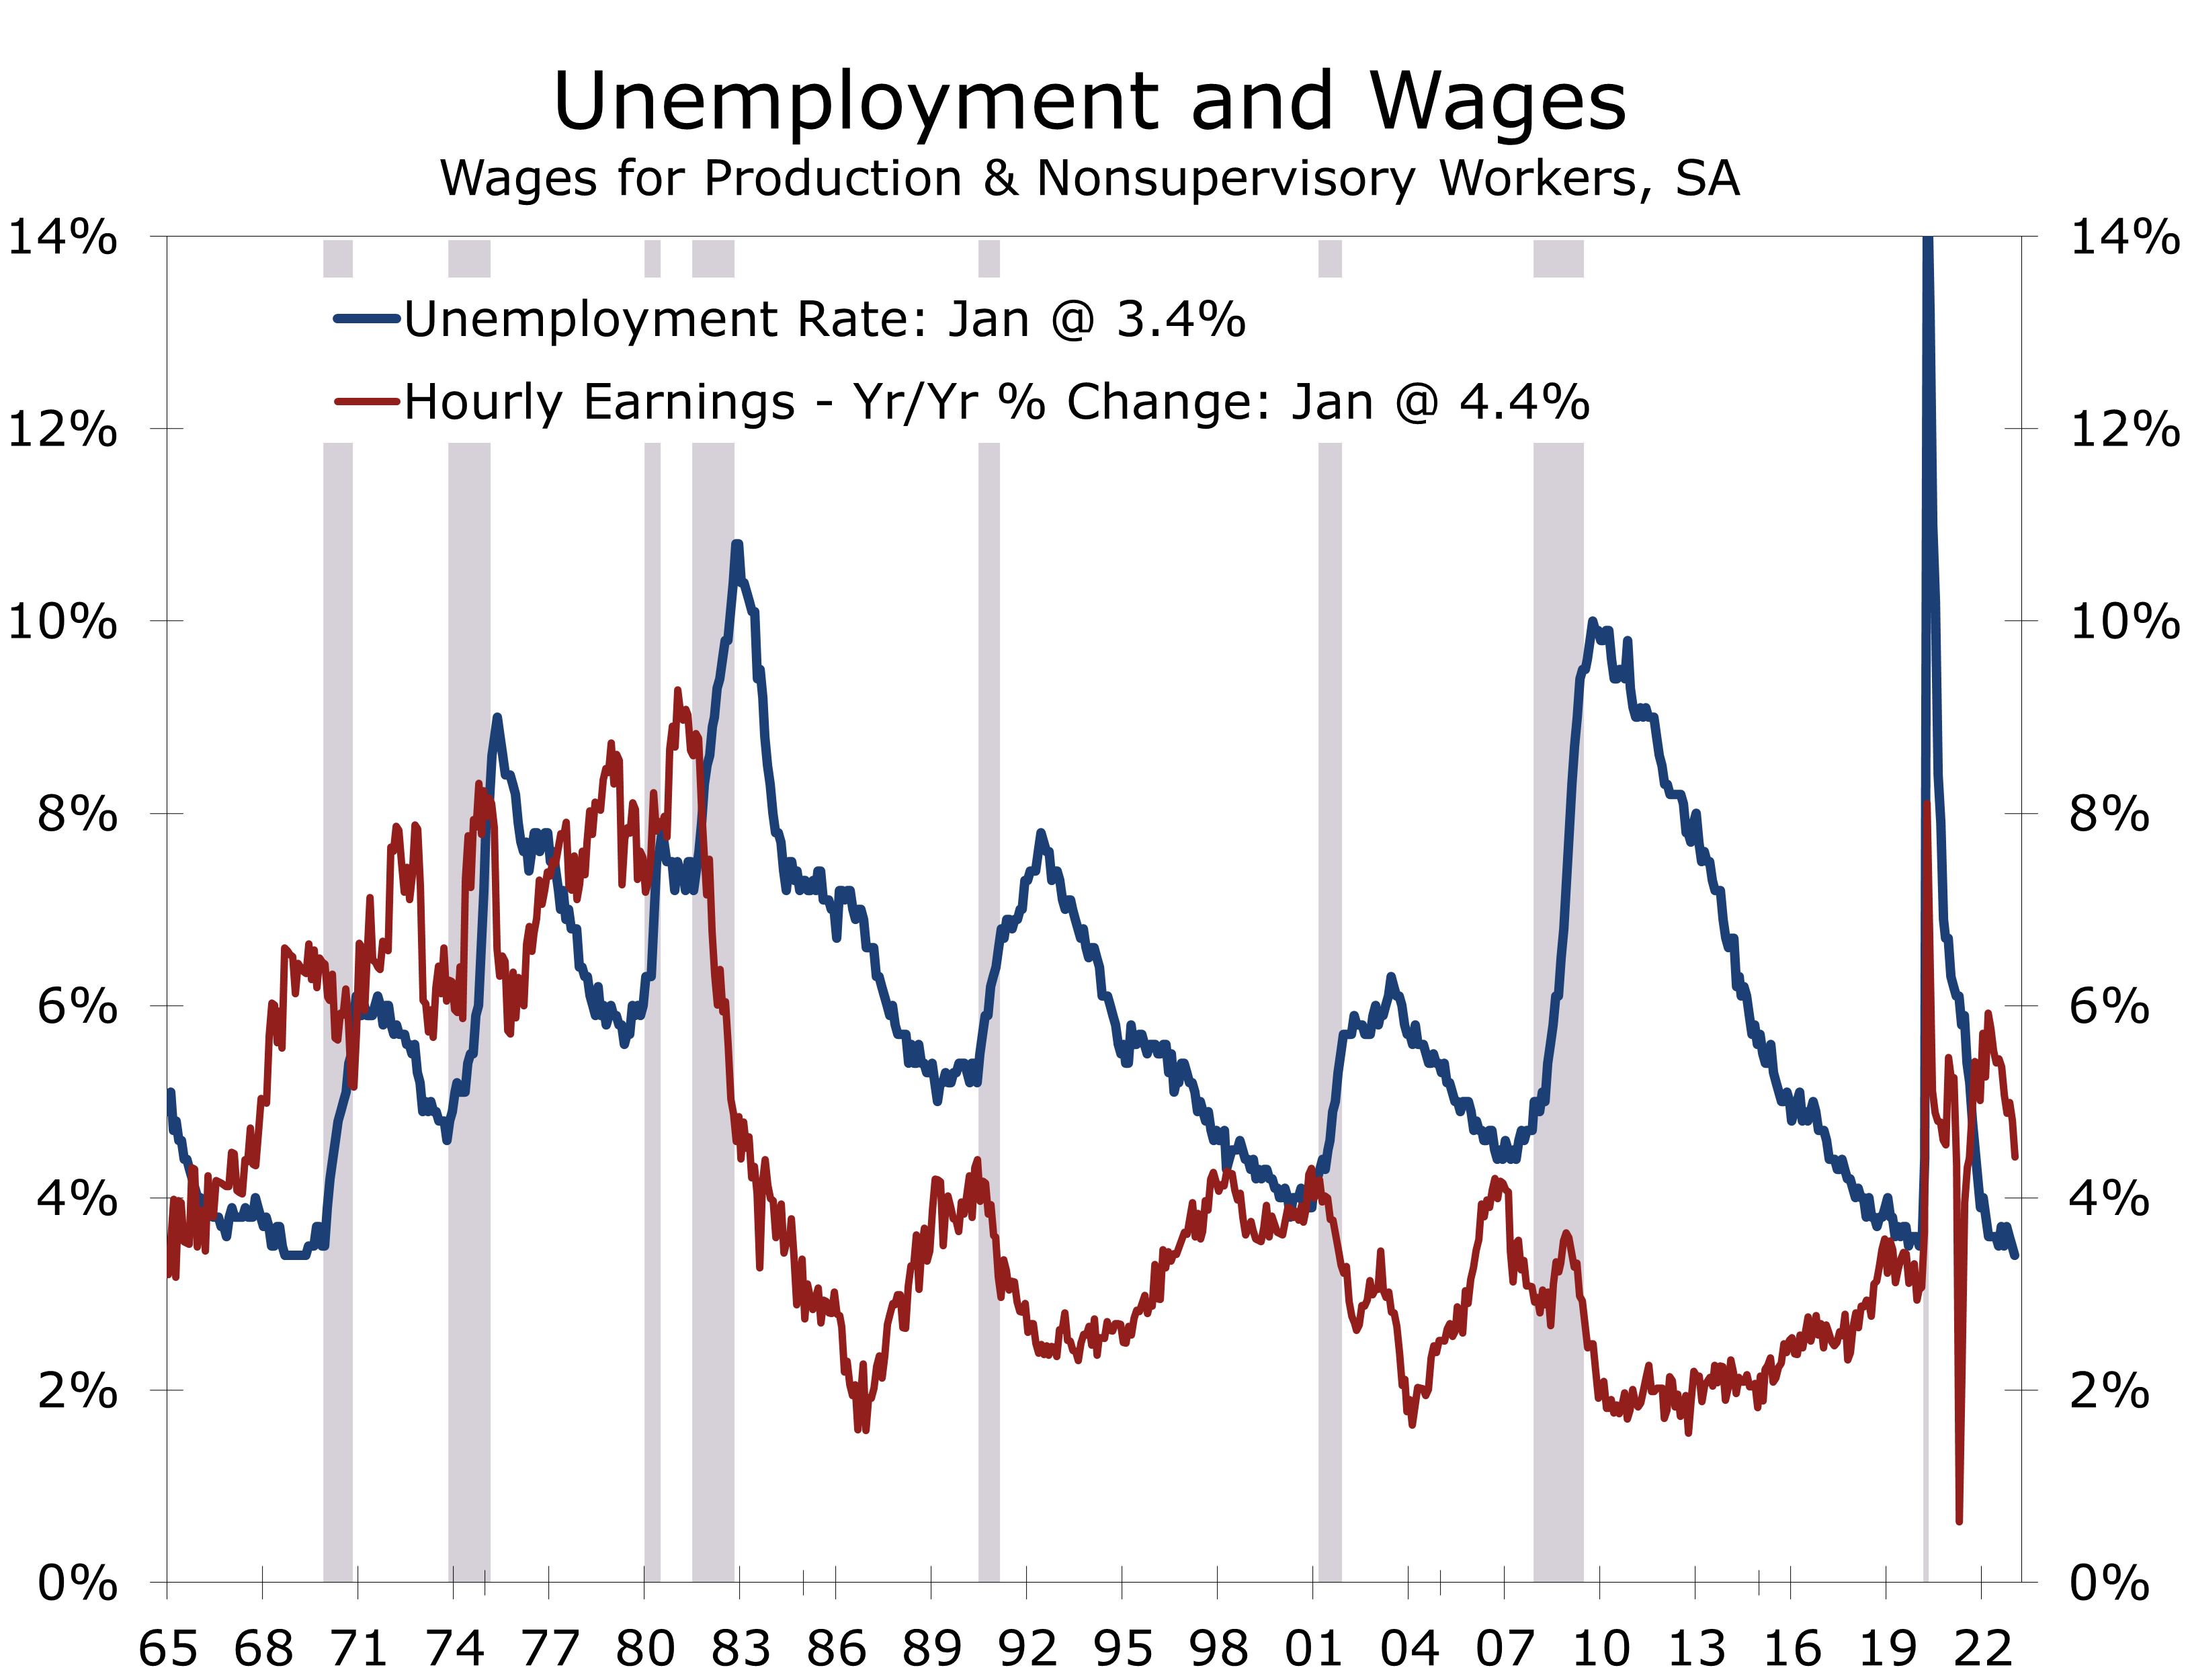
- The unemployment fell 0.1 percentage point to 3.4%, while average hourly earning rose 0.3% and are now up 4.4% year-to-year.
- Aggregate hours worked rose a whopping 1.5% in January, which pushes any thoughts about a recession at least a few months out.
There is quite a bit to unpack from this morning’s surprisingly strong employment report. The bottom line is job growth remains exceptionally strong. The January data include annual revisions to nonfarm employment, which incorporate more precise data on hiring. The benchmark revisions, combined with more complete reporting for the prior two months, show there were 813,000 more jobs on nonfarm payrolls in December than first reported. The benchmark revision was three times as large as normal.
Population estimates in the Household Survey were also adjusted to updated population estimates from the Census Bureau. The new data show a 1.1 million increase in the civilian population, and large related increases in the civilian labor force and the household employment measure. There was no net effect on the unemployment rate, which fell to 3.4%. The adjustment boosted the civilian labor force and employment-population ratio by 0.1% each. Both would have been unchanged without the new controls and will likely be reversed in February.
We believe it is still too early to assess the impact of the recent surge in tech layoffs.
The stronger nonfarm employment data appear to contradict the rising number of layoff announcements, most of which are in the tech sector. Weekly first-time unemployment claims have continued to trend lower. We believe it is still too early to assess the impact of layoffs. While employment fell slightly in some tech categories, many displaced workers will not fall off employer payrolls until March. This means these losses will show up in the March and April employment reports, which will be released in April and May.
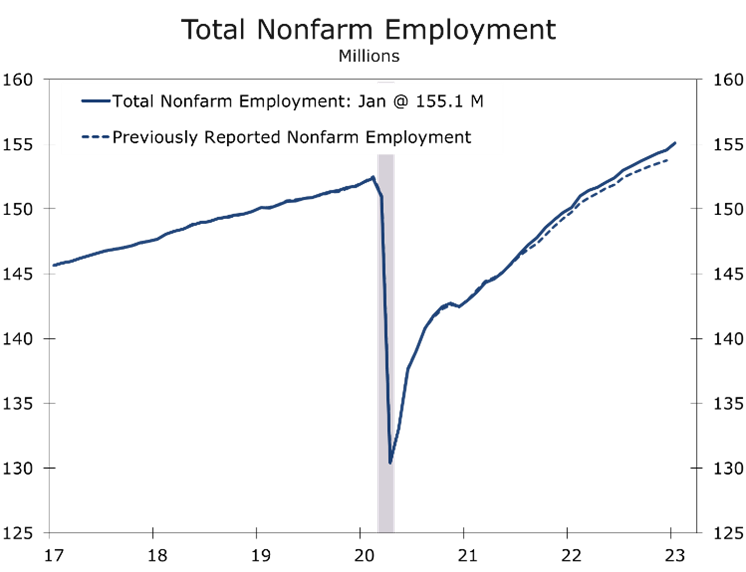
The upward revision to nonfarm employment also appears to contradict the findings of a recent Federal Reserve Bank of Philadelphia report, which pointed out job growth for the second quarter of last year appeared to be overstated by around 1 million jobs. That survey highlighted to the gap between the Quarterly Census of Employment and Wages (QCEW), which are the source data for the annual benchmark revisions, and the reported CES data. The Benchmark revision, the bulk of which stretches back to March 2021, would not include the second quarter 2022 QCEW data. So, today’s large upward revisions do not refute the Fed study.
The 2022 nonfarm data will be revised once again next February, and we will get some idea of the scope of those revisions when the QCEW data for the third quarter of 2022 will be released on February 22. Our sense is we will a see sizable downward revision next February. There are a whole host of government and private sector data that show economic activity moderating considerably since March 2022, which is when the Fed began to hike interest rates.
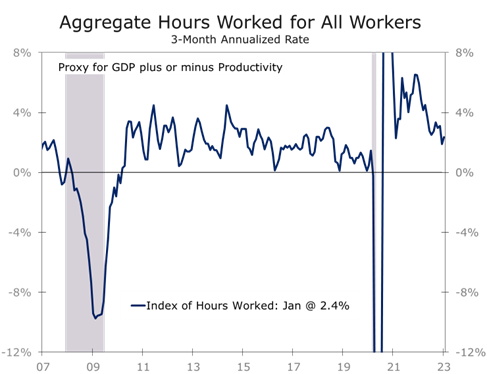
Even if we do see a downward revision to the 2022 employment data next year, the labor market clearly looks much stronger today. Any notion of an imminent recession has been pushed further out. Hiring rose across nearly every major industry in January, with even the most cyclical industry segments – construction, manufacturing and transportation and warehousing – adding a combined 66,900 jobs.
The factory workweek rose by 0.4 hours to 40.5 hours, and overtime hours rose 0.1 hour to 3.1 hours. The rise in hours suggests manufacturers are still looking to add workers. This is somewhat surprising given January’s weaker ISM-Manufacturing report and a whole host of weaker regional manufacturing surveys but is consistent with the rise in job openings. Total hours worked in manufacturing – a reliable predictor of industrial production – rose 0.9% in January.
One reason economists closely scrutinize the monthly jobs data is they provide clues about data for the rest of the month. In addition to a rise in industrial production, consumer spending should also rebound, following back-to-back declines. We come to that conclusion by combining the 1.2-point surge in aggregate hours worked and 0.3% rise in average hourly earnings.
The smaller rise in average hourly earnings likely reflects more hiring in lower paid occupations and some moderation in hiring for higher paid jobs. With the unemployment rate now at its lowest level since May 1969, we can expect the Fed to continue raising interest rates for at least the next couple of meetings.
Disclaimer: This publication has been prepared for informational purposes only and is not intended as a recommendation offer or solicitation with respect to the purchase or sale of any security or other financial product nor does it constitute investment advice.
The Federal Reserve Hikes Interest Rates Amidst Reports of Moderating Economic Growth
A Busy Day for Economic News
- The Fed raised its federal funds rate target a quarter percentage point to between 4.50% and 4.75%. The Fed also indicated ongoing increases will be appropriate.
- Consumer spending rose at a solid 2% pace, with the strongest gains coming in services.
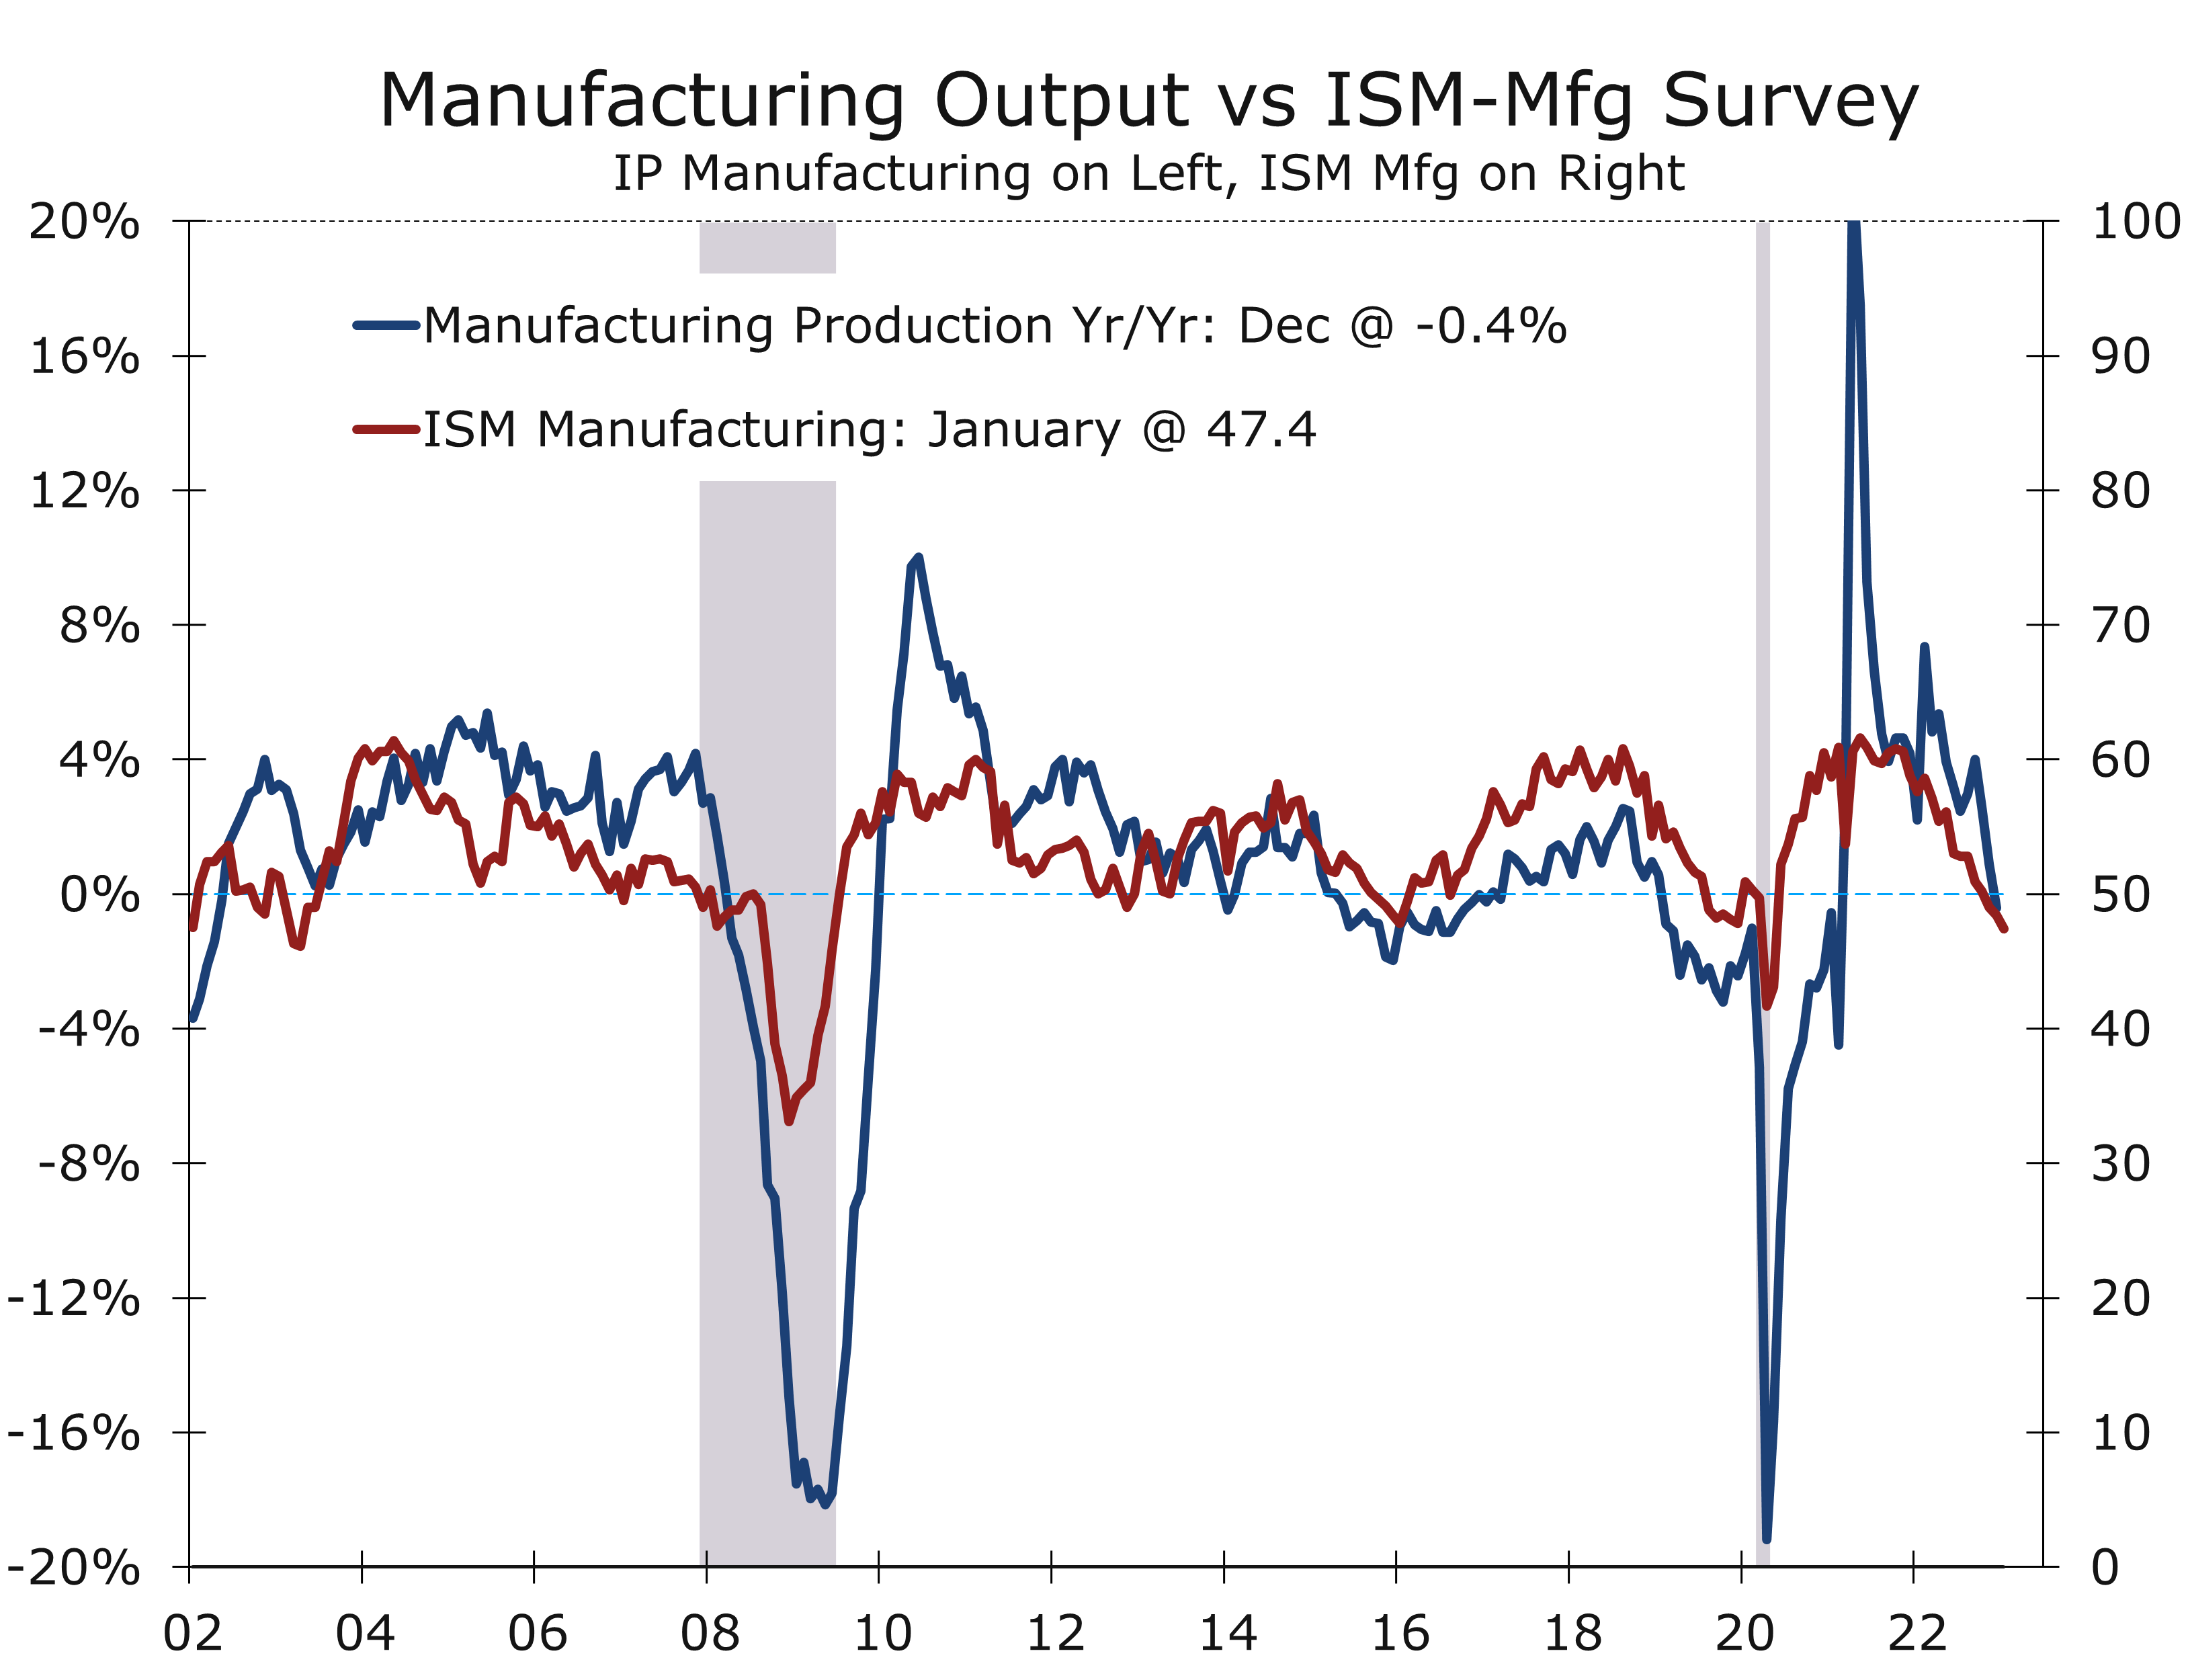
- The ISM Manufacturing Index fell 1 point to 47.4 in January, marking the fifth consecutive monthly drop.
- Overall construction spending fell 0.4% in December. Spending for private single- family homes fell a particularly sharp 2.3%.
- The ADP employment report showed hiring slowed in January, with private sector businesses adding 106,000 jobs, following a 253,000-job gain in December.
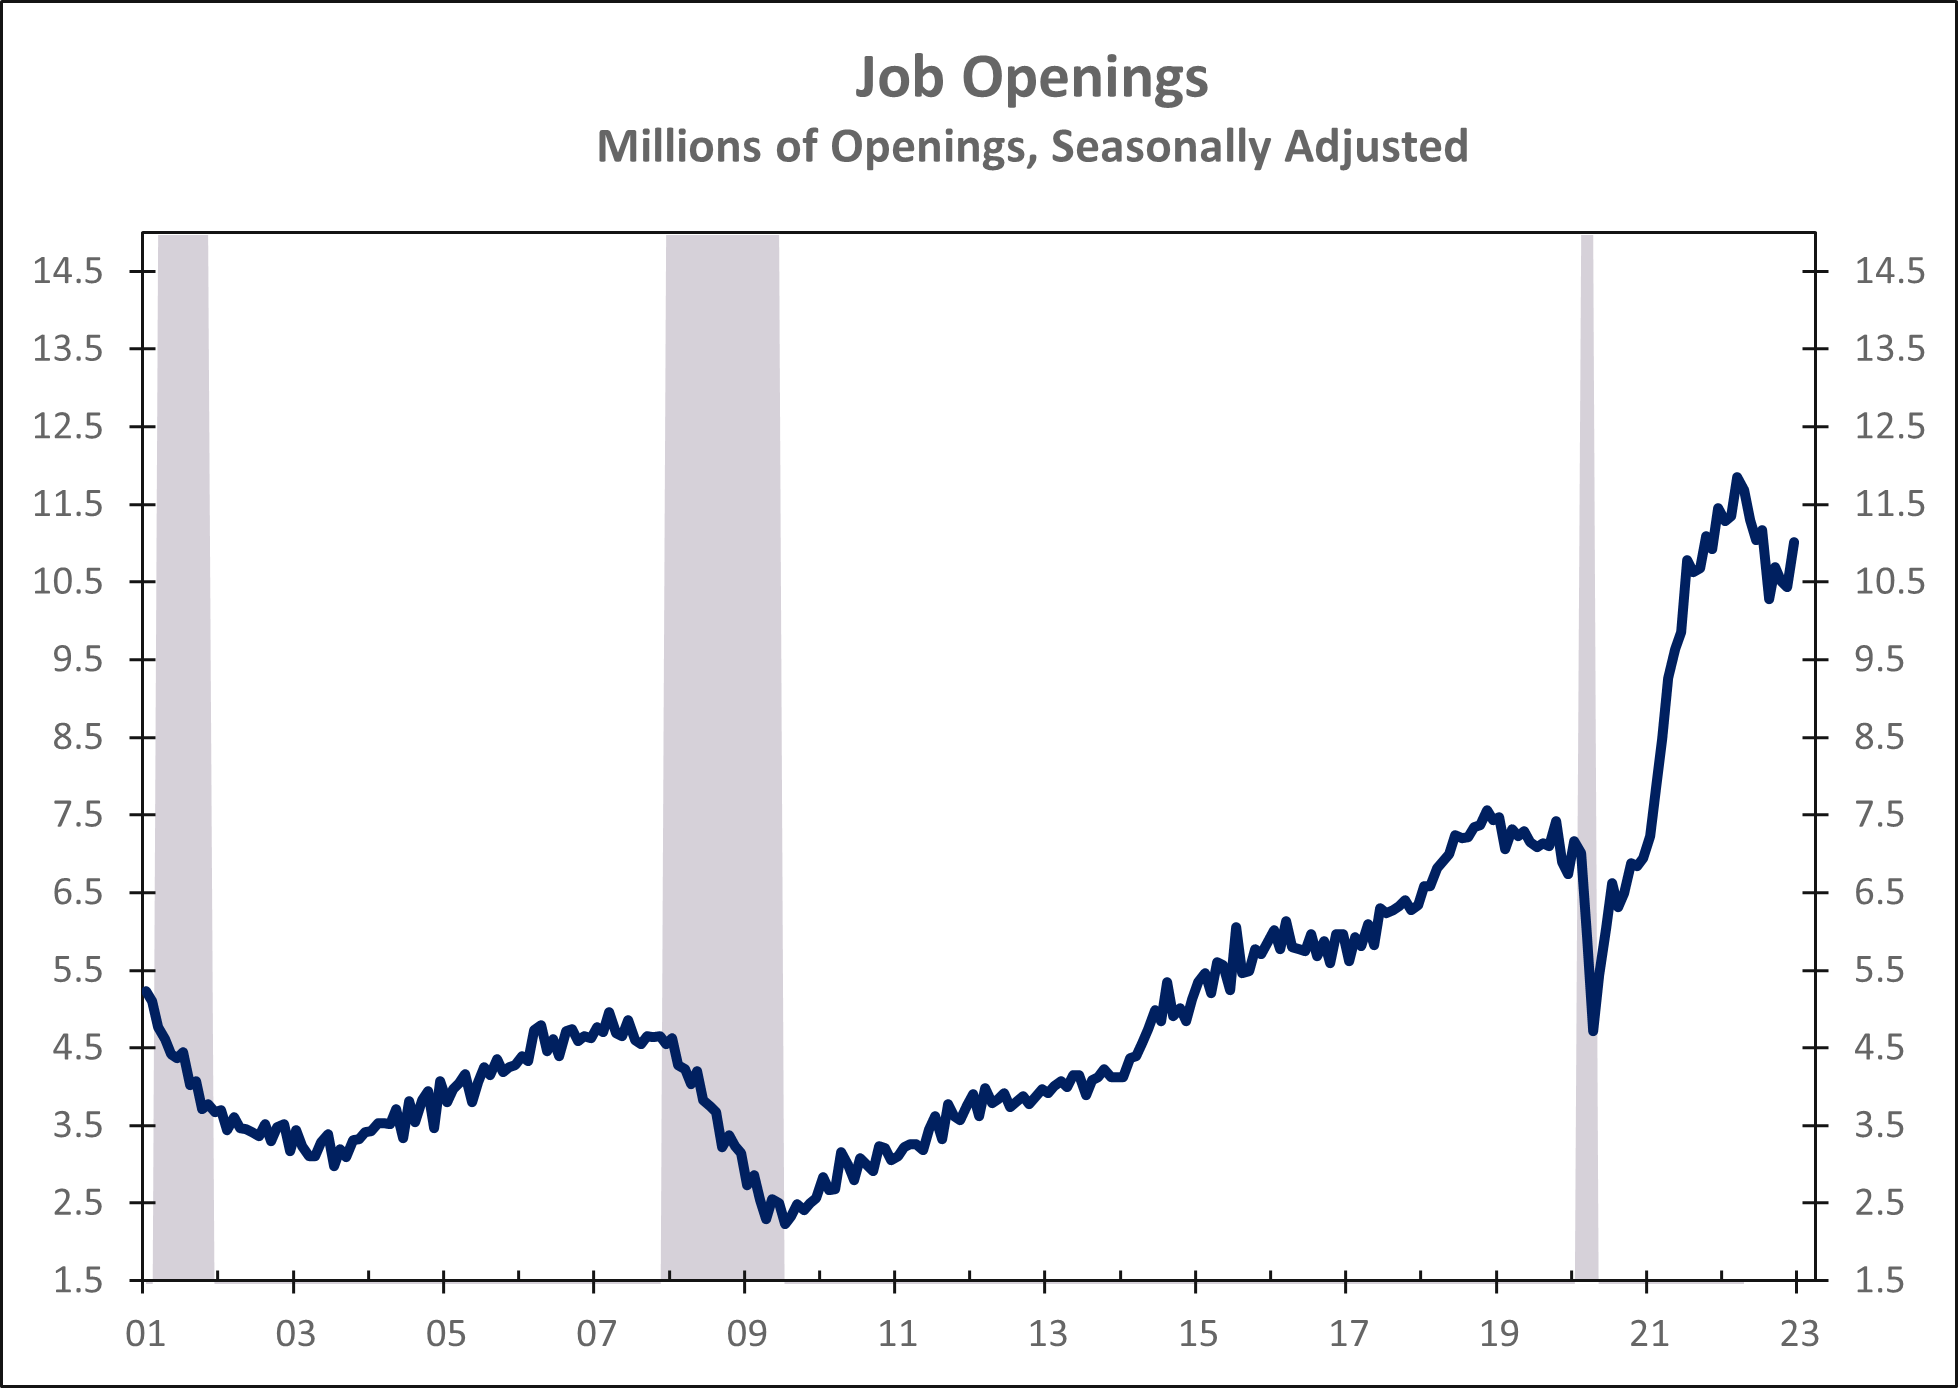
- Job Openings increased by a larger than expected 572,000 in December to 11 million. The bulk of the increase was in the leisure and hospitality sector. Openings fell in the IT sector and in manufacturing.
The Federal Reserve raised interest rates precisely in line with market expectations. The range for the federal funds rate target was increased by a quarter point to between 4.50% to 4.75%. The FOMC also noted they anticipate “ongoing increases in the target range will be appropriate.” Our read is the Fed is looking past the easing in supply chain inflation pressures and now sees tight labor markets and rising wages as the greatest risk to inflation.
The Fed’s assessment of economic conditions in the meeting’s Policy Statement was surprisingly upbeat, noting “recent indicators point to modest growth in spending and production.” The most recent data, however, show back-to-back declines in real consumer spending and three consecutive declines in industrial production. This morning’s ISM manufacturing survey shows even more convincing weakness, with the index declining for five consecutive months and hinting industrial production fell once again in January.
Employment conditions remain too strong for the Fed to end their policy tightening.
Employment conditions appear to be closer to the Fed’s assessment, which noted “job gains have been robust in recent months, and the unemployment rate has remained low.” The latest data are clearly supportive of that view, with weekly first-time jobless claims, the unemployment rate at 50-year lows and job openings rising by a surprisingly 572,000 to just over 11 million in December. Even this morning’s weaker ISM survey showed employment conditions in the factory sector remaining in positive territory, possibly suggesting manufacturers are hoarding working amidst and exceptionally tight labor market.
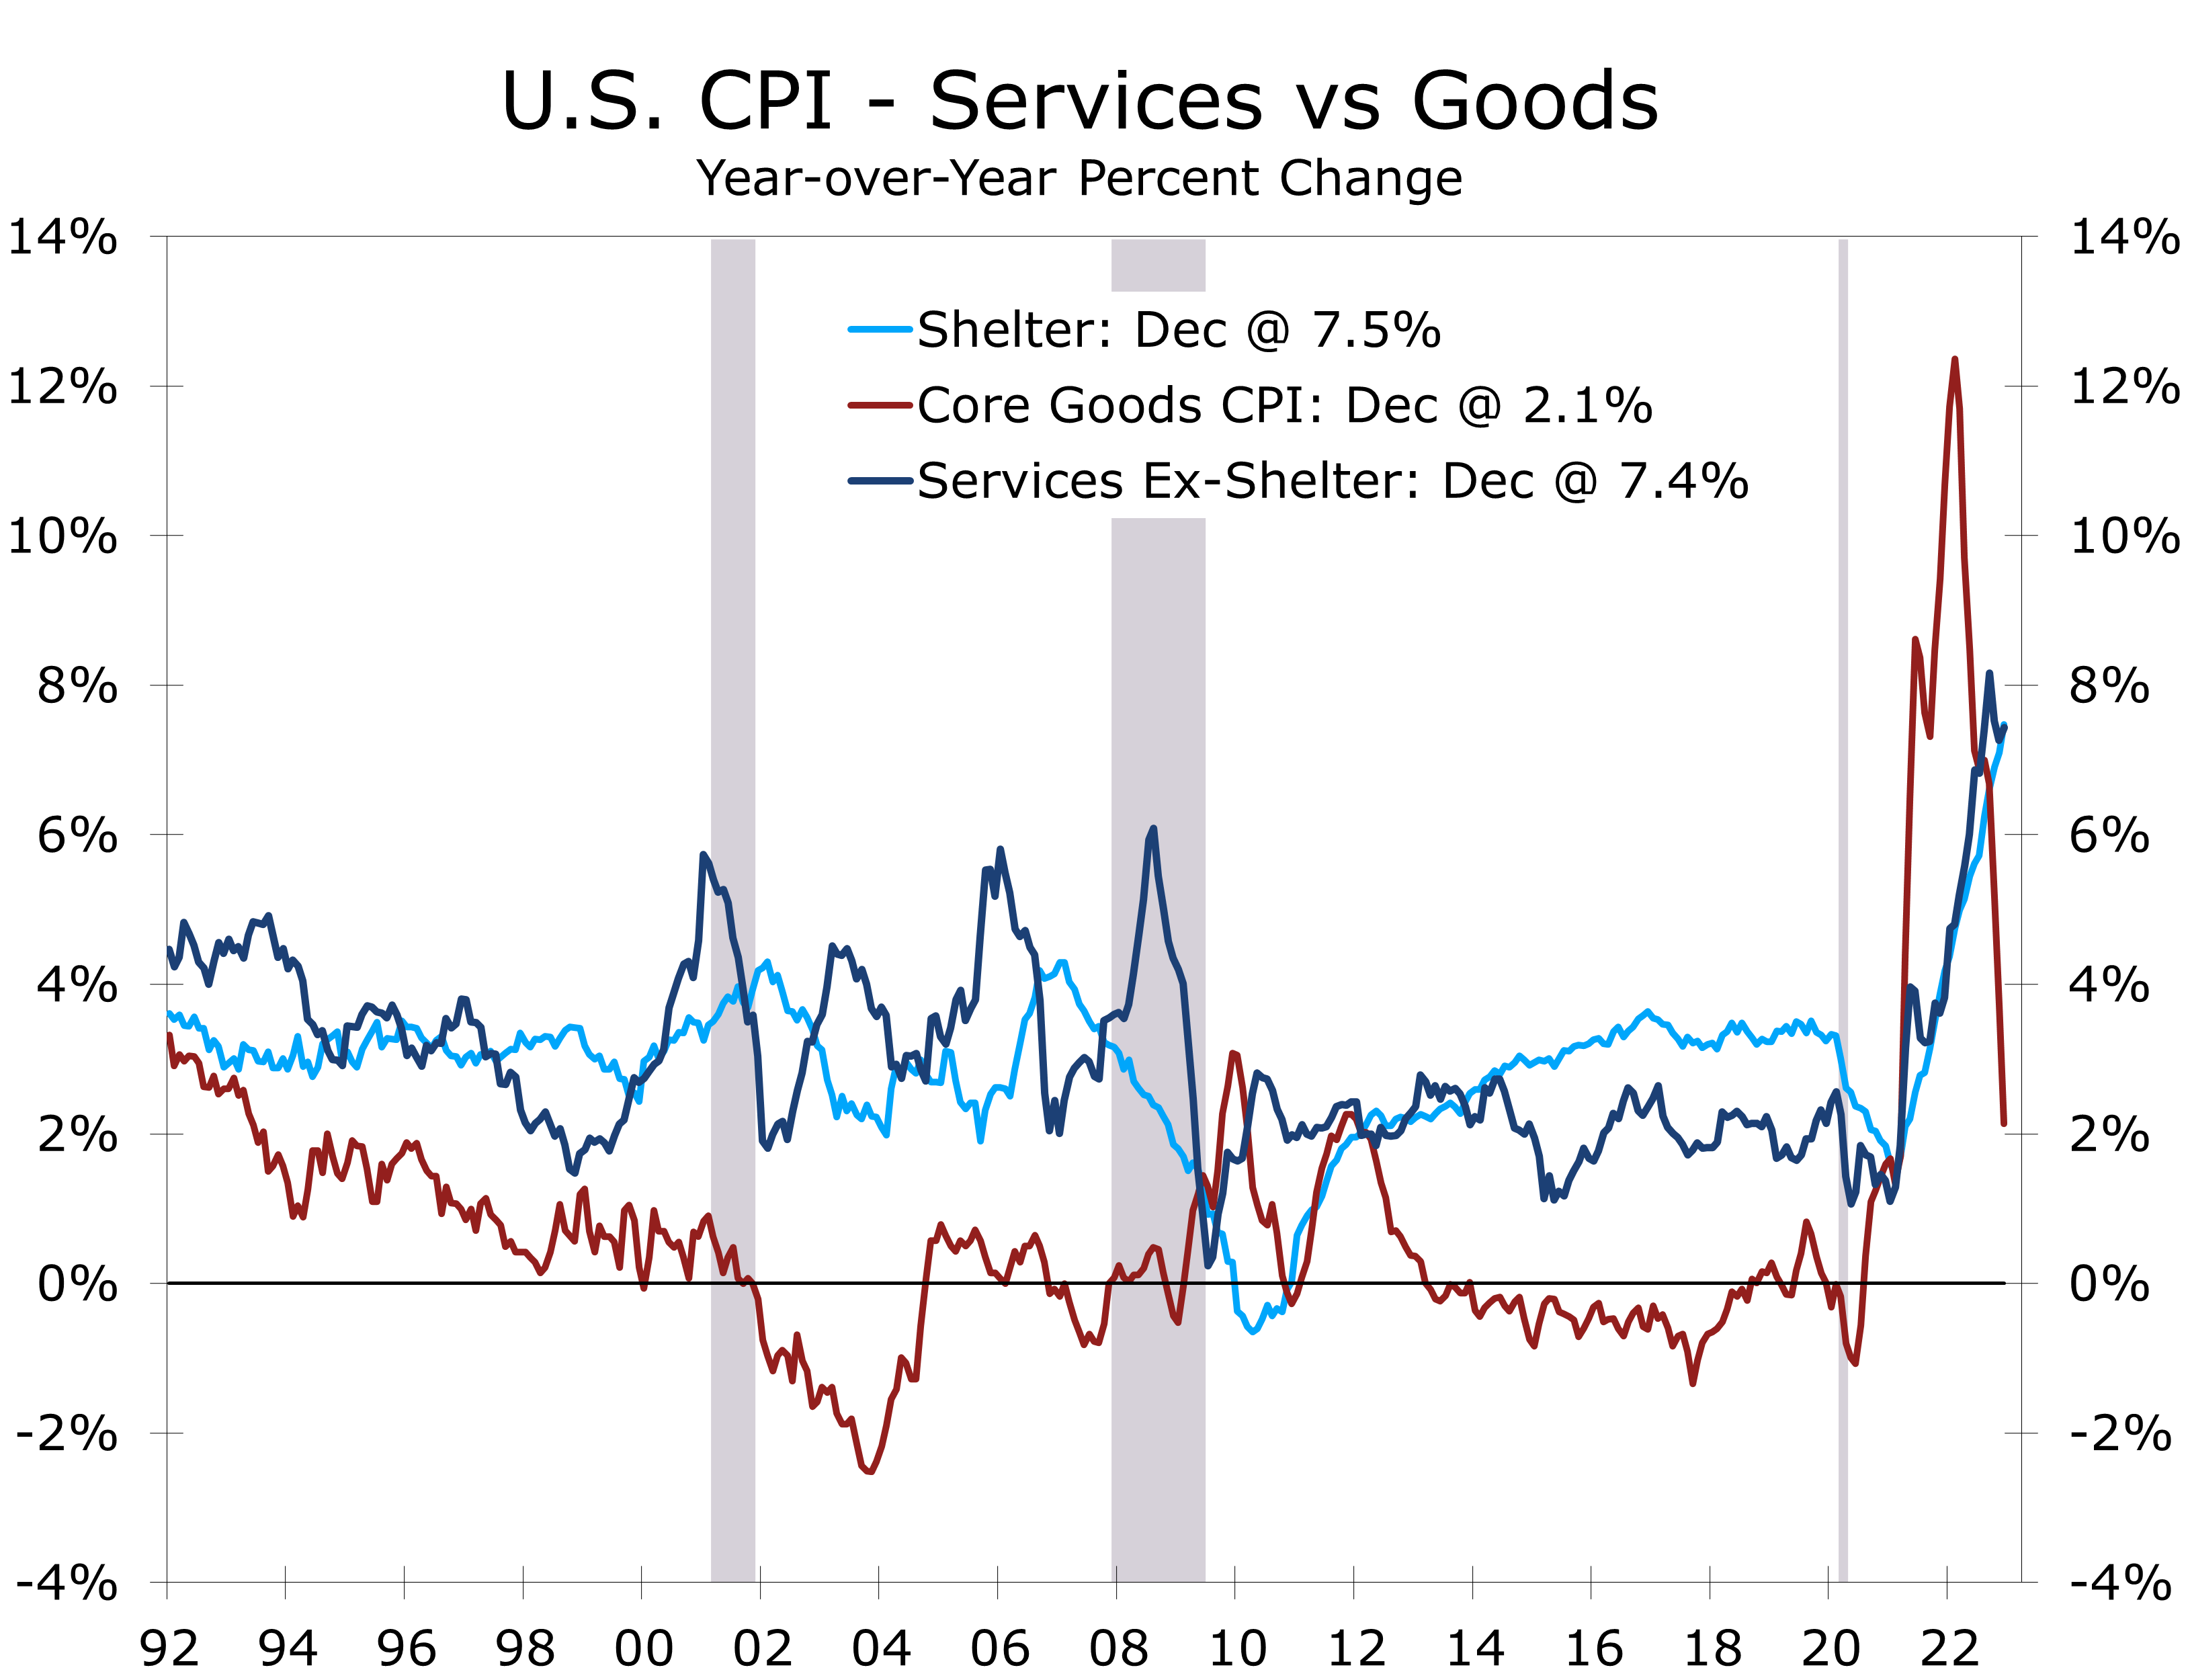
The Fed now sees the greatest risks to inflation coming from wages rising significantly faster than productivity growth due to the incredibly tight labor market. Chair Powell noted the disinflation process was now well underway, with consumers backing off goods purchases, which has helped ease supply shortages. Housing costs are also beginning to moderate. Powell described this as completing about half the job in bringing inflation back down. The key issue now is price pressures in more labor intensive parts of the service sector, with one of the key variables to watch being consumer prices for services, excluding shelter.
Powell’s tone in the press conference was considerably more balanced. While the inclusion of “ongoing increases” in the Fed’s statement remains consistent with the dot plot released in December, showing two more quarter point federal funds rate hikes, Powell did not put down the financial market’s notion the Fed only has one more rate hike. He reconciled the difference as to financial market participants perhaps being more optimistic about inflation coming down than members of the FOMC currently are.
Powell also appears to have shrugged off the recent easing in financial market conditions. Stock prices rose solidly in January, while bond yields declined. With consumer spending and industrial output declining, the Fed may now see an easing in financial conditions as something that would make a soft landing more likely. By contrast, Powell’s terse press speech at the Jackson Hole conference was widely seen as a warning to the financial markets to not get ahead of themselves and price in lower inflation and a Fed pivot. Today, the Fed is likely relieved mortgage rates have backed off their recent highs, which should help stem to slide in home sales and single-family home building.
The Fed now sees easing financial conditions as something that will help achieve a soft landing.
Powell mentioned the FOMC reviewed the latest Job Openings and Labor Turnover Survey (JOLTS) reported this morning. The data showed a surprising 572,000 increase in job openings in December. Most of these openings were in the leisure and hospitality sector, which includes hotels, restaurants, and entertainment venues – all of which have struggled to rehire staff following the pandemic. Job openings in the IT sector and manufacturing both declined in December.
While the Fed would like to raise rates a couple more times and bring the federal funds rate above 5%, the window for them to do so may not remain open that long. We doubt the Fed will continue to raise interest rates once nonfarm employment begins to decline, which we believe may occur before the May meeting.
Disclaimer: This publication has been prepared for informational purposes only and is not intended as a recommendation offer or solicitation with respect to the purchase or sale of any security or other financial product nor does it constitute investment advice.
Stronger Headline GDP Growth Masks Slowing Private Domestic Demand
Private Sector Growth Slows in Q4
- Real GDP grew at a 2.9% annual rate during the fourth quarter, which was toward the top side of market expectations.
- Consumer spending rose at a solid 2% pace, with the strongest gains coming in services.
- Inventory building added 1.5 percentage points to Q4 growth. The trade deficit also shrank, adding 0.6 percentage points to growth. Final domestic demand grew by the remainder, which was 0.8%.
- Government spending grew at a robust 3.7% annual rate. Federal outlays grew at a 6.4% pace, with nondefense outlays surging at a 11.2% pace – reflecting federal stimulus – while defense grew at a 2.4% pace.
- Private final domestic demand - the part of the economy most influenced by monetary policy - slowed to just a 0.2% pace in Q4.
- Outlays for consumer durables, housing, and business investment – the most cyclical parts of the economy - fell at a 2.6% pace.
Real GDP grew at a 2.9% pace in the fourth quarter, which was toward the top end of market expectations. Real GDP grew at 3.2% pace in Q3, after declining slightly in both the first and second quarters of the year. On a year-to-year basis, real GDP rose 1.0%. That meager economic growth was still enough to reduce the unemployment rate by nearly half a percentage point to 3.5%, which raises real questions about the lack of productivity growth and rising labor costs.
The composition of economic growth was not nearly as strong as the headline gain suggests. Real consumer spending rose at respectable 2.1% pace, with outlays for services climbing at a 2.6% pace and spending for goods rising at a 1.1% pace. Services outlays were led by spending for health care, housing and upkeep and other services. Spending for discretionary services, such as personal services, international travel and restaurant dining grew solidly, indicating consumers are still making up for experiences put off during the pandemic. Spending on goods was largely driven by outlays for motor vehicles and maintenance.
Consumer spending came in very close to our 2.0% estimate. Real personal consumption had risen 0.5% in October and was unchanged in November. Data for December will be reported tomorrow and are expected to be weak. Today’s GDP data implies a net decline of around 0.9% for December. The weakness at the end of the year means the current quarter faces a steep uphill climb. We are looking for consumer spending to rise at just a 1% pace in the current quarter and look for real GDP growth to be around a 0.4% pace.
Business fixed investment edged out a 0.7% annualized gain, all of which was in software. Equipment purchases fell sharply, particularly for IT equipment.

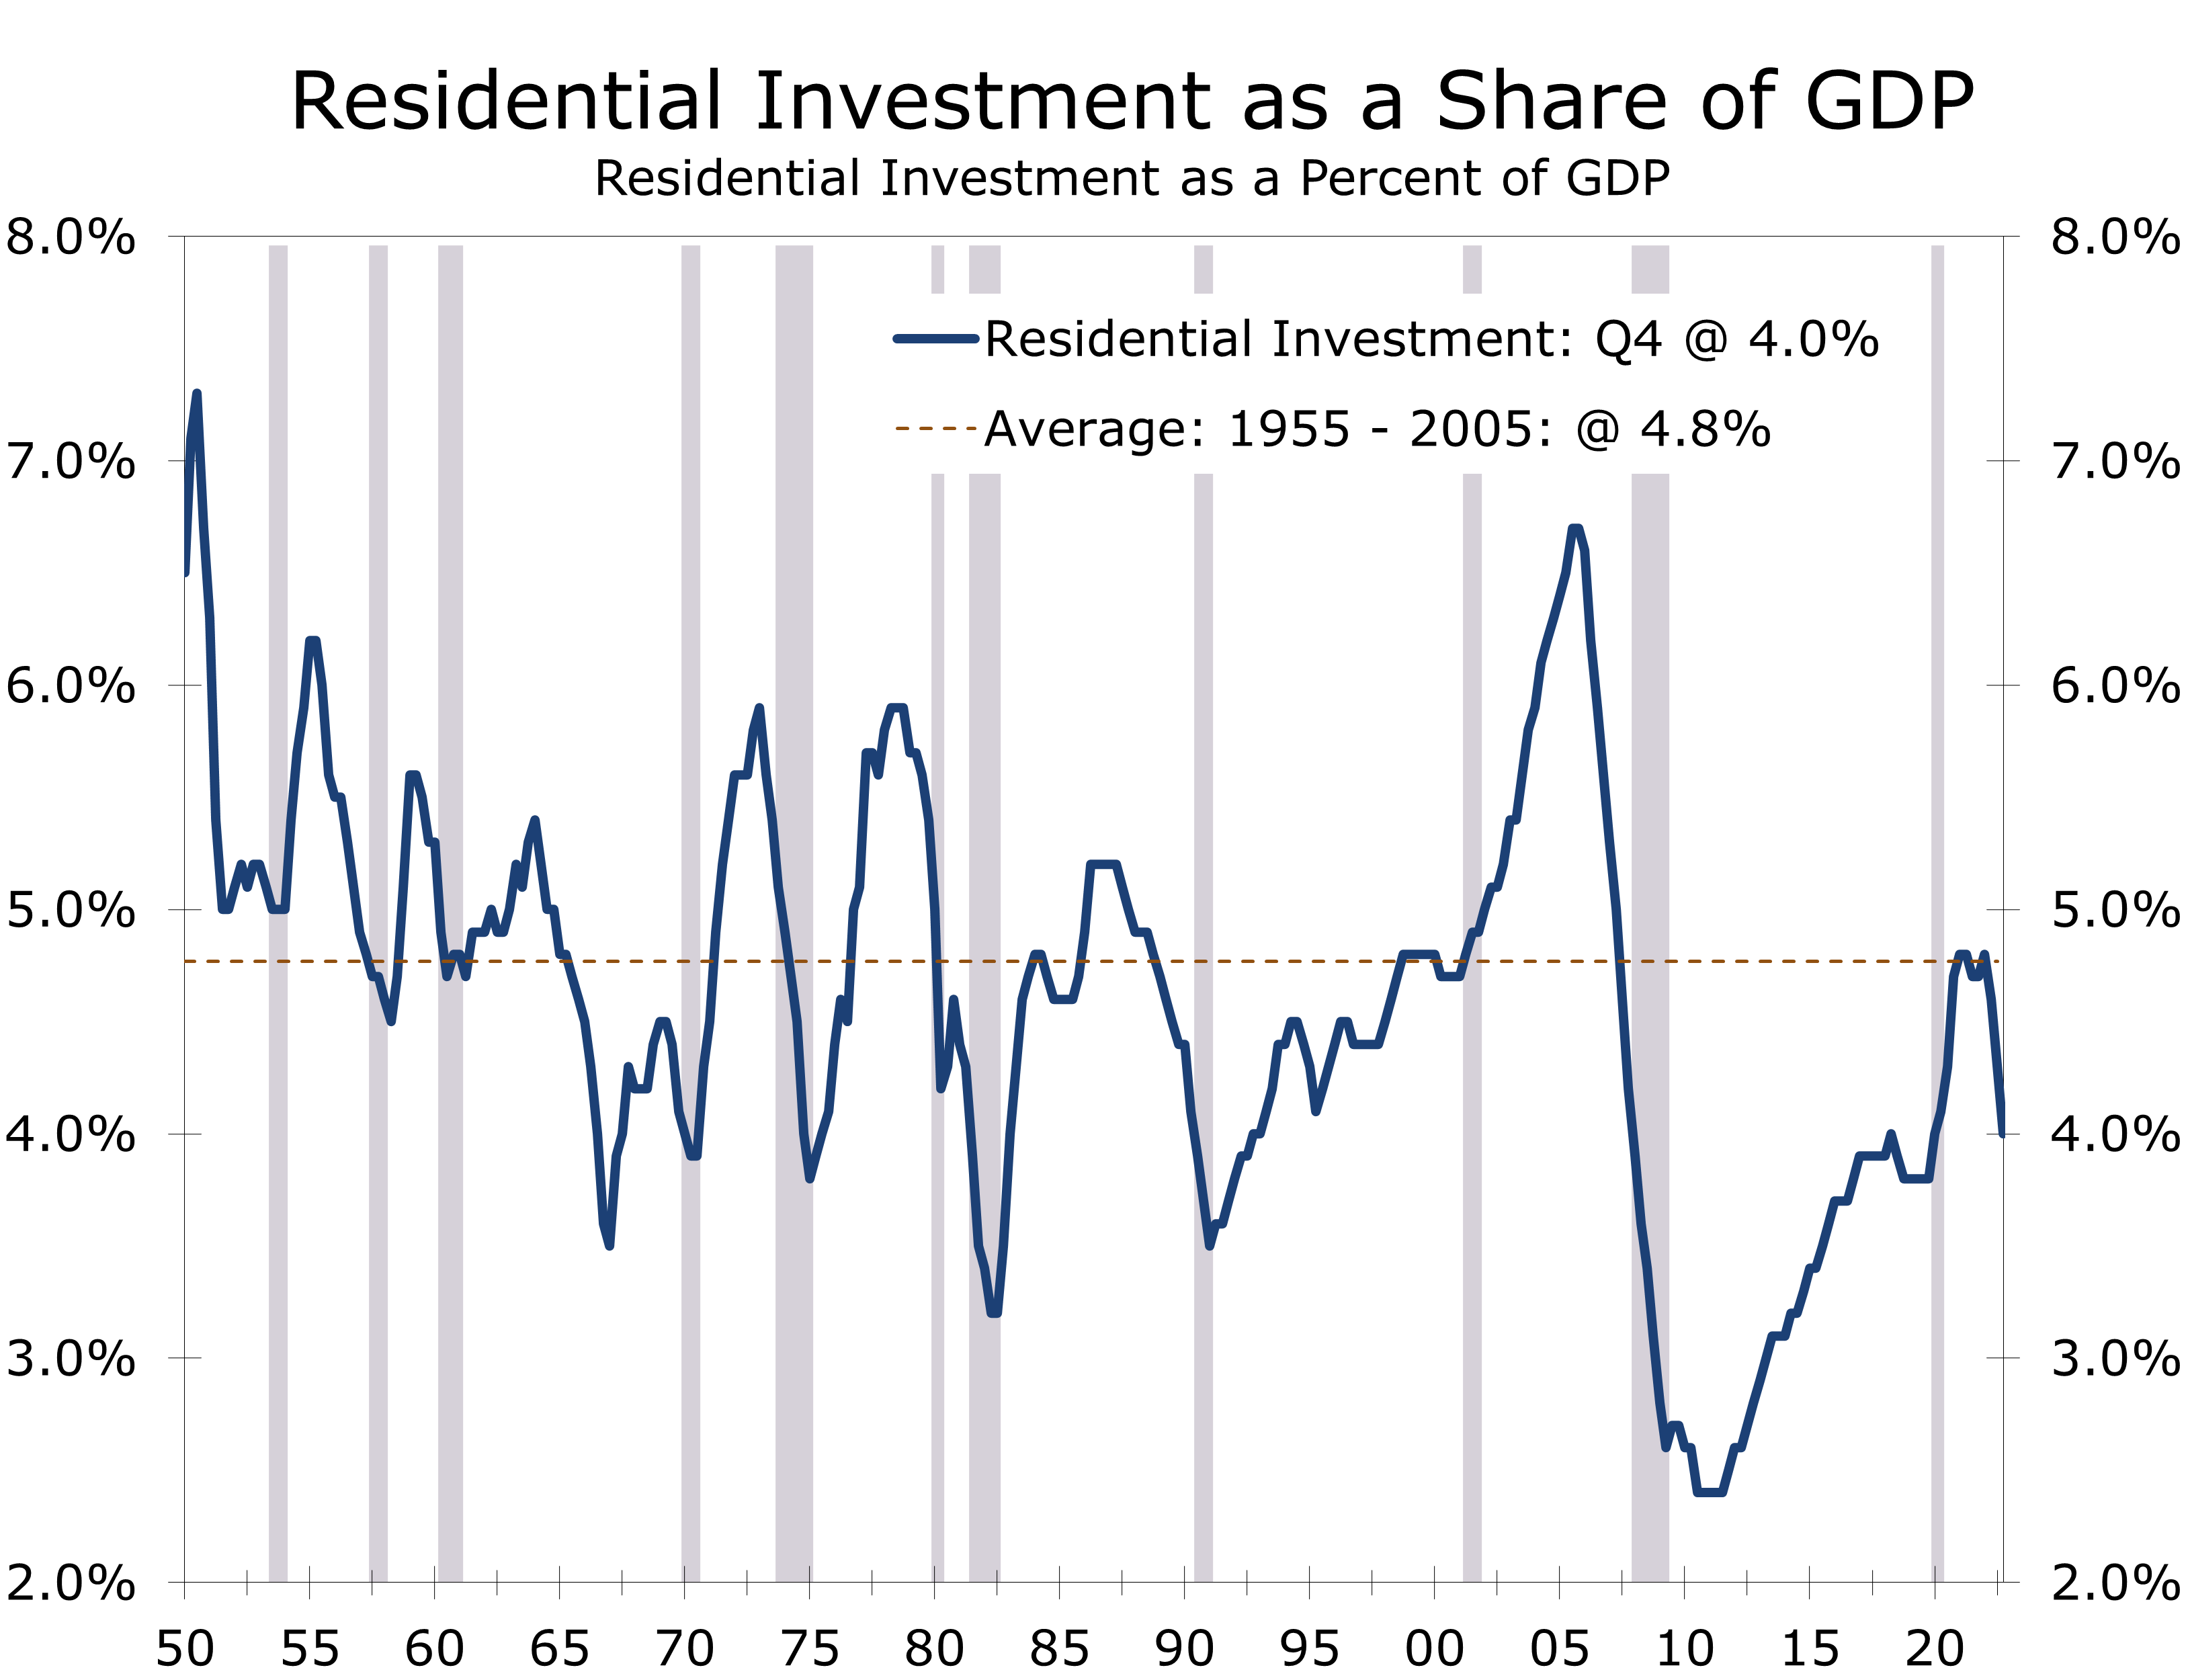
Housing is the clearest area of weakness. Residential investment tumbled at a 26.7% annual rate in the fourth quarter, following a 27.1% decline in the prior quarter and 17.8% annualized drop in Q2. Residential investment has now fallen for seven quarters in a row, which is the longest string of declines since the housing bust. Most of the drop has been in single-family construction, which has seen starts tumble some 29% since peaking two years ago. Home prices are also falling, which is reducing commission income.
The slide in housing is impacting other areas of the economy. Demand for furniture and appliances has slowed in recent quarters, although spending rebounded slightly in Q4. Demand for lumber and other building products has slowed significantly and several mortgage lenders have cut staff, as demand for mortgages has fallen along with home sales.
While the slide in home building is the longest and deepest since the housing bust, there are some important distinctions between the two periods. For starters, housing is not overbuilt like it was back then. While home building took off after the economy reopened, residential investment never climbed back to its long-run average of 4.8% of GDP. Moreover, much of the increase has been in apartment construction. The biggest challenge for the housing market today is affordability.
Inventory building accounted for half of the increase in fourth quarter GDP, and a slowdown in imports accounted for about a quarter of Q4 growth. The two are related. Concerns about a possible shutdown of West Coast ports caused shippers to divert traffic to the East Coast, which clogged up ports and distribution facilities. The surge in inventories added 1.5 percentage points to Q4 growth, but with warehouses filled and containers stacked up at major ports, imports slowed later in the fourth quarter.
The diversion of traffic to East Coast ports has clogged up ports and distribution facilities.
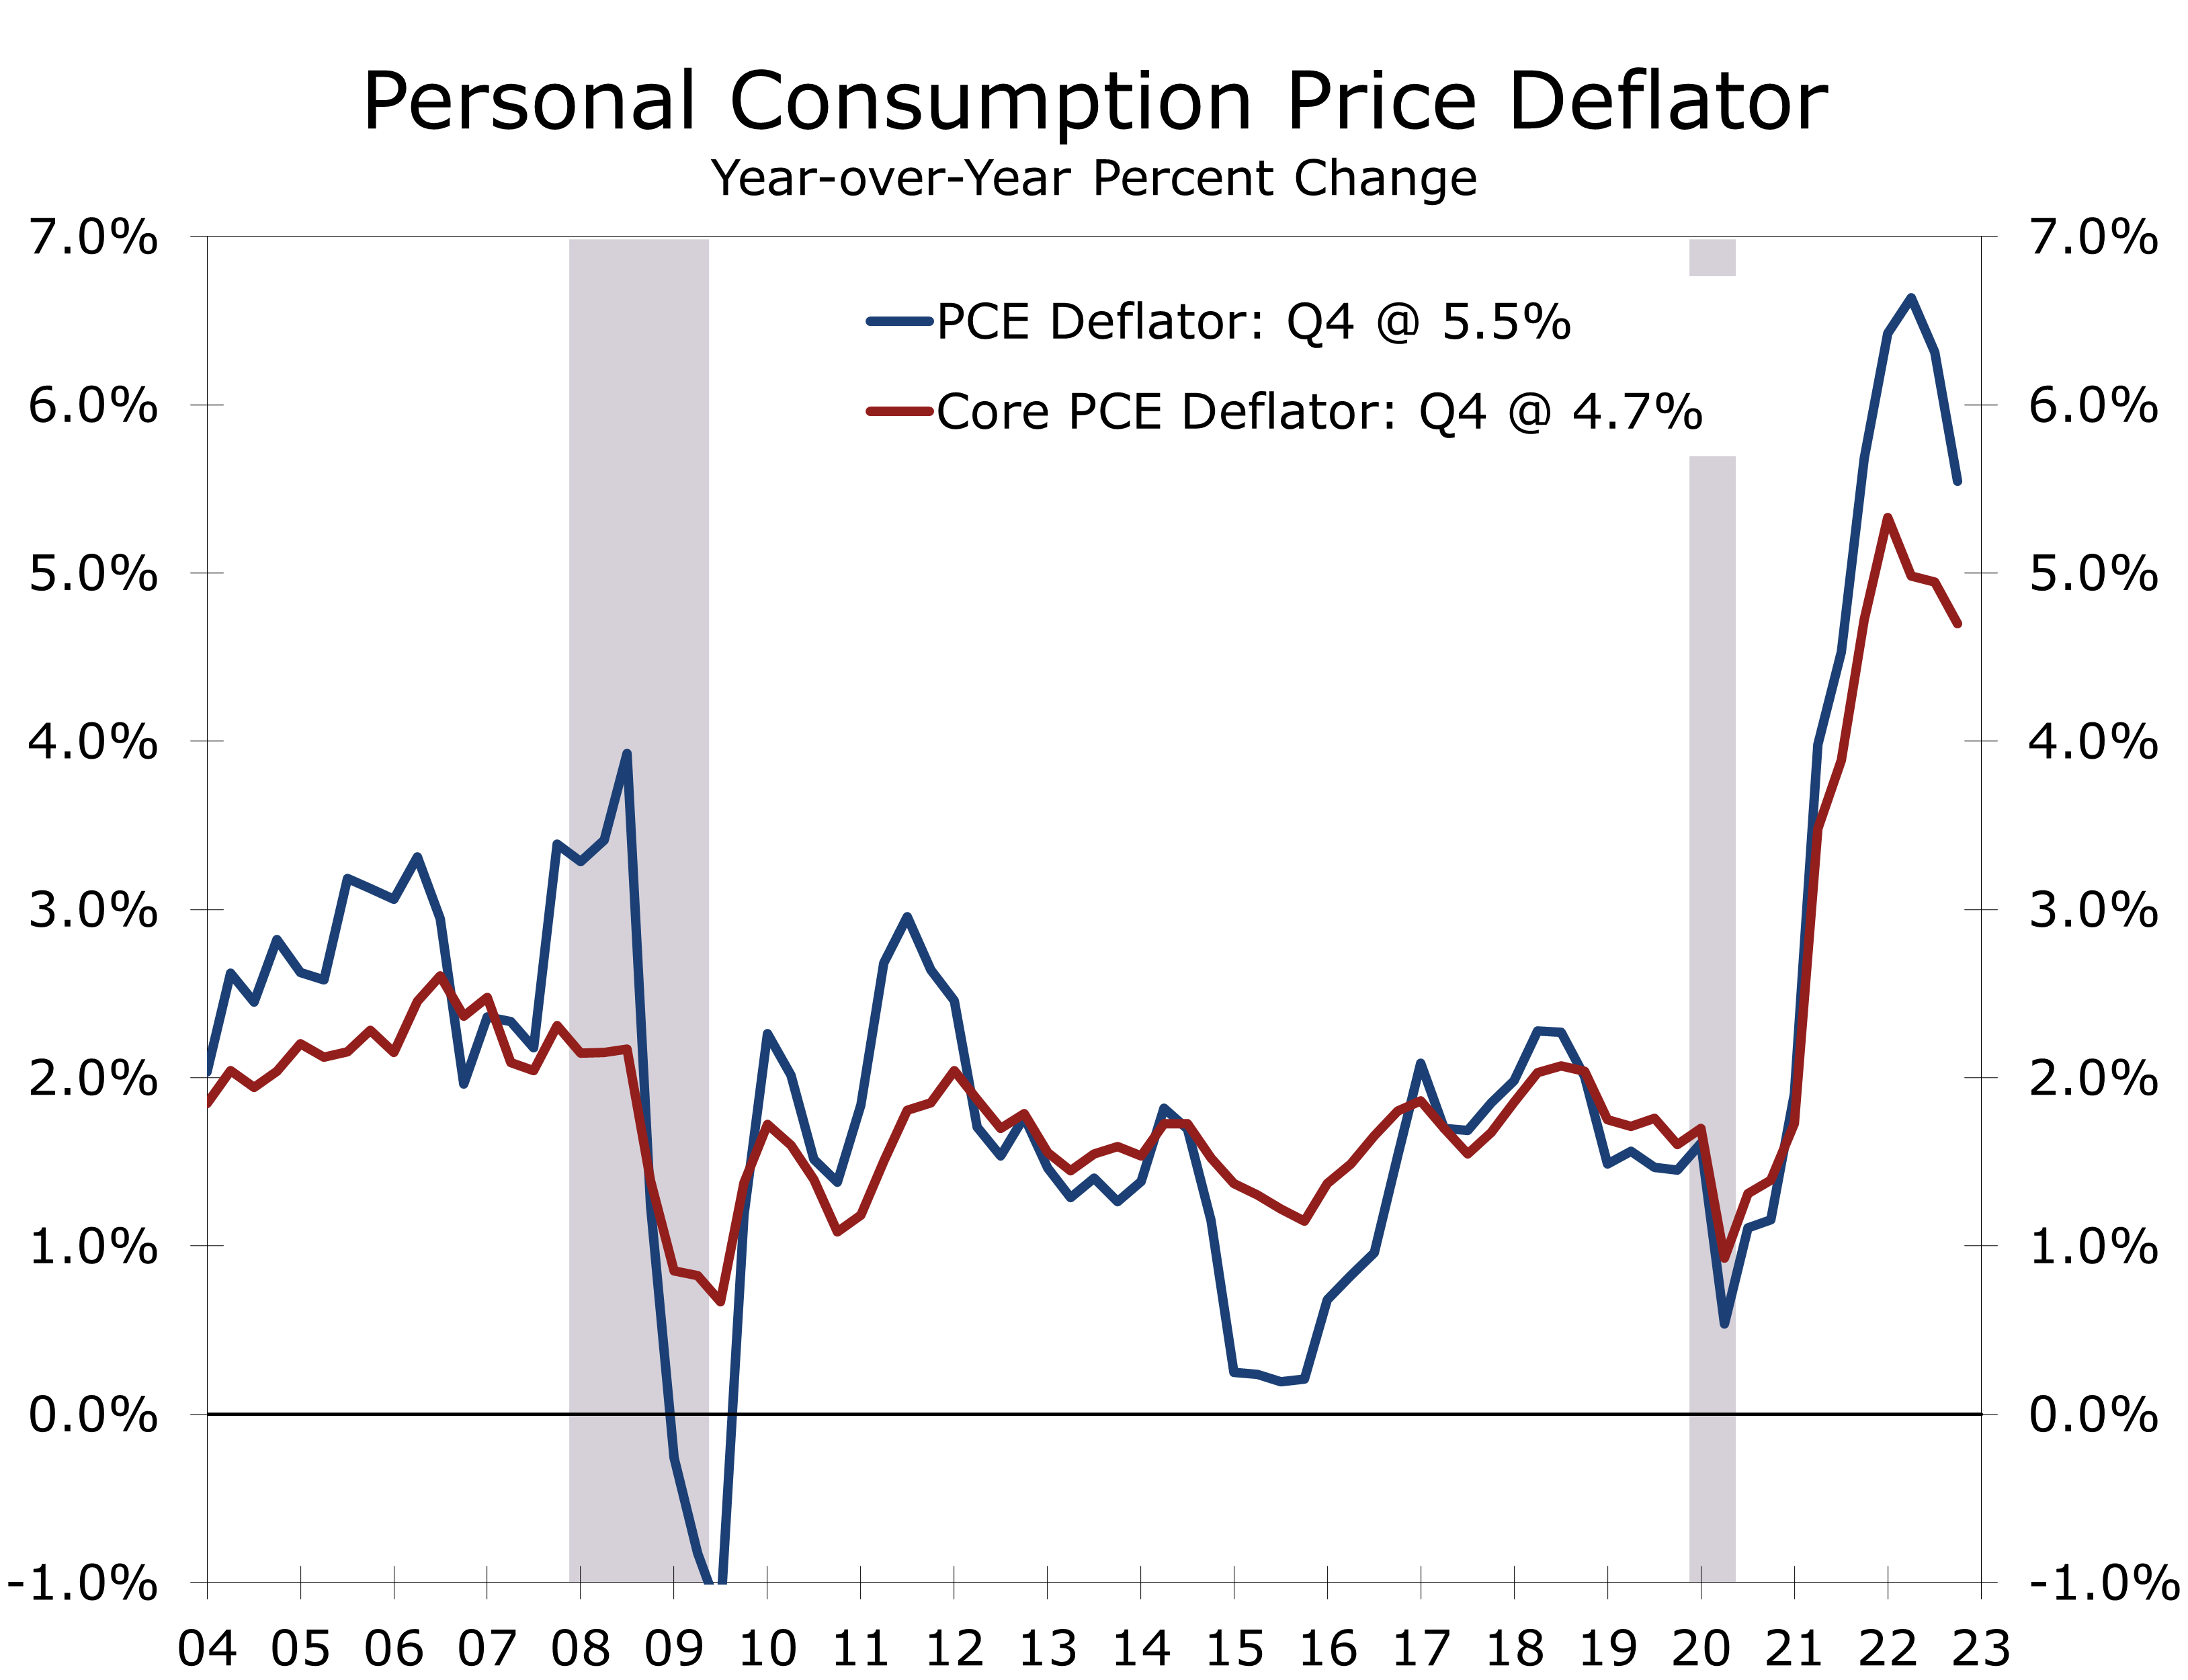
Inflation eased considerably in the fourth quarter. The overall PCE deflator ended the year up 5.5% and the core PCE deflator, which is the Fed’s preferred inflation measure, finished the year up 4.7%. Both numbers came in slightly below expectations and the core PCE deflator slowed to just a 3.9% pace in Q4, which was its slowest pace since the first quarter of 2021.
Stronger Q4 GDP growth gives the Fed the cover they need to boost rates by half a percentage point at next week’s FOMC meeting. The lower inflation data also give credence to those arguing for a smaller rate hike.
Disclaimer: This publication has been prepared for informational purposes only and is not intended as a recommendation offer or solicitation with respect to the purchase or sale of any security or other financial product nor does it constitute investment advice.
Existing Home Sales Fall Once Again
Home Sales Continue to Decline
- Existing home sales fell for the 11th straight month, although the pace of the pullback appears to be moderating.
- Existing home sales fell 1.5% in December to a 4.02-million unit annual pace. Sales are down 34% year-to-year, which was close to the peak sales pace for the cycle.
- Sales of existing single-family homes fell 1.1% to a 3.64-million unit pace, while sales of condominiums and co-ops tumbled 4.5%.
- Homes are generally taking longer to sell, and prices are falling month-to-month.
- Sales fell 2.2% in the South, declined 1.9% in the Northeast, slid 1.0% in the Midwest and were unchanged in the West.
- First-time buyers were 31% of sales, up from 28% in November and 30% last December.
- The non-seasonally adjusted median price of an existing home fell for the 6th straight month and is now up just 2% year-to-year.
Sales of existing homes fell 1.5% in December, marking the 11th consecutive monthly drop. Sales fell in every region except the West, where they were unchanged. December’s drop was less than expected and sales may have been helped by the recent slide in mortgage rates. The 4.02 million-unit sales pace is the slowest since May 2020. Sales of single-family homes fell 1.1% to a 3.64-million unit pace, which is the lowest since the lockdown in spring 2020. Homes are taking longer to sell, and prices are falling month-to-month.
Sales of single-family homes fell 1.1% in December, with much of the pullback occurring at higher prices points. Sales of homes priced at $1 million or more are down 45.2% from one year ago and made up just 5.3% of sales. Sales of homes priced between a half a million dollars and a million dollars have also slowed. Sales of higher-priced homes are more sensitive to interest rates. Many prospective buyers of higher priced homes have also likely been stung by the stock market selloff.
Homes priced at $1 million or more remained on the market an average of 30 days in December, and homes prices between $500,000 and $1 million were on the market for 27 days. The overall average was 26 days.
A slowdown in the affordability migration away from higher-priced metro areas is also disproportionately weighing on higher priced home sales. Ironically, San Francisco and Seattle have seen a reverse of the population outflows, as fewer people are choosing to work remotely and many of those that had are having second thoughts now that so many tech companies are trimming staff. Data from LinkedIn show both Seattle and San Francisco returning to the top ten markets with net gains from members switching locations.

With the affordability migration slowing, fewer homes are coming on the market. The inventory of single-family homes available for sale fell 14% in December to just 860,000 homes, which equates to just a 2.9 month supply at December’s slower sales pace. The number of existing homes for sale is still 13.2% higher than it was last December, when just 760,000 homes were available. That equaled just a 1.7-month supply back then because existing single-family homes were selling at a much faster 5.41 million-unit pace.
Most of the rise inventory this past year has come from homes remaining on the market for a longer period of time. As noted earlier, homes that sold in December had remained on the market for an average for 26 days, which is up from 24 days in November and just 19 days in December 2021.
The number of new listings has also fallen this past year. A larger proportion of current homeowners with a mortgage have one at significantly lower rate that prevails today. When coupled with higher prices, a growing number of homeowners are choosing to remain in place, rather than downsize or trade up.
With homes remaining on the market, sellers are increasingly discounting prices. The median price of an existing single-family home fell 1.6% in December to $372,700. The median price has fallen 11.5% since June on a non-seasonally adjusted basis.

Home prices usually decline toward yearend, but this past year’s declines were greater than usual. The median single-family home price is now up just 2% year-to-year, down from a peak of 26.1% in May 2021.
Other home price measures have also declined this past year and the drop in the Realtors’ median price appears to be in line with those other price measures. We expect home prices to ultimately decline 15% from peak-to-trough, based on the widely followed S&P CoreLogic/Case-Shiller National Home Price Index.
We expect home prices to ultimately decline 15% from peak-to-trough.
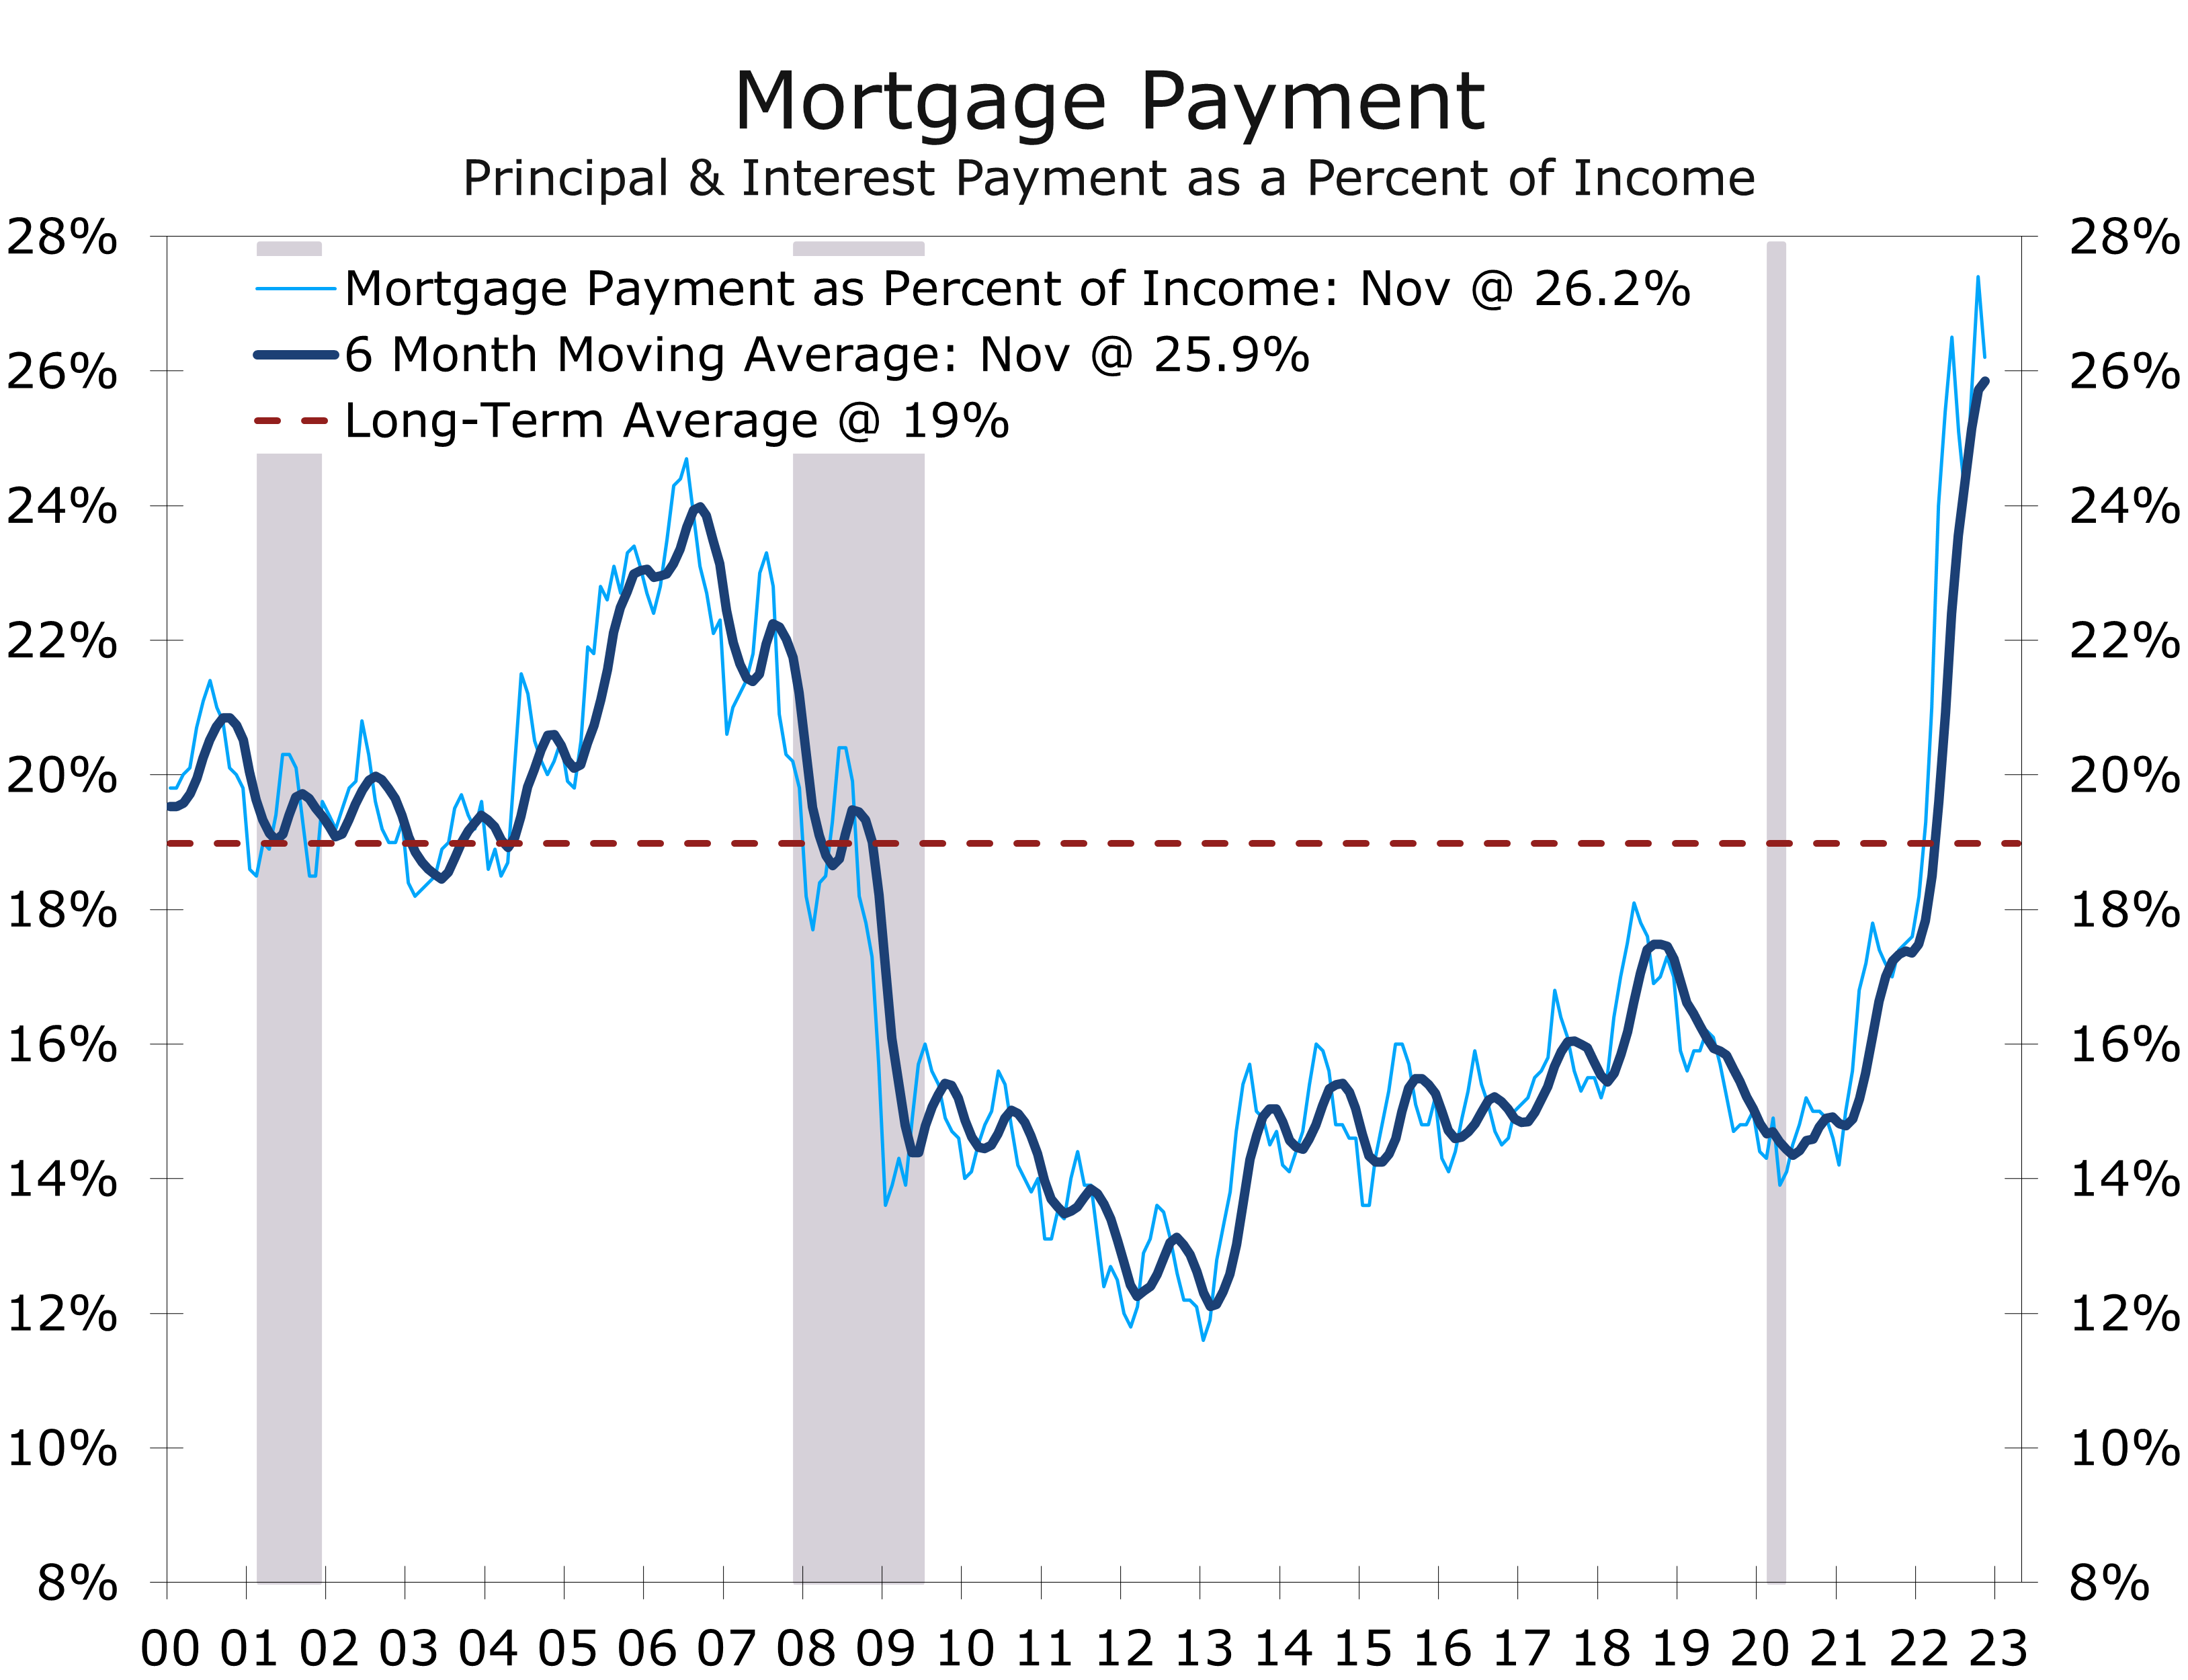
The post-pandemic housing surge differs from prior housing cycles in that the market never became over supplied. Affordability, or the lack thereof, is the critical issue today. The surge in home prices that accompanied the reopening of the economy coupled with sharply higher mortgage rates caused the share of income required to service principal and interest payments to spike to record heights. The housing market will not recover on a sustained basis until affordability falls back near its historic norm.
Disclaimer: This publication has been prepared for informational purposes only and is not intended as a recommendation offer or solicitation with respect to the purchase or sale of any security or other financial product nor does it constitute investment advice.