
Employment Growth Rises Solidly in April
Strong Job Growth Lessens Recession Risk
- Employers added 253,000 jobs in April, with gains evident across most major industries.
- The unemployment rate fell 0.1 point to 3.4%, as civilian employment rose modestly while the labor force declined slightly.
- Average hourly earnings rose 0.5% to $33.36 and are now up 4.4% year-to-year.
- April’s rise in nonfarm payrolls was almost perfectly in line with expectations, although job growth for the prior two months was revised down by 149,000 jobs.
- Job gains continue to be padded by a rebound in industries still recovering from the pandemic lockdown, namely health care, leisure and hospitality sector, and social assistance.
- Tech sector results were mixed. Information services added 1,000 jobs, with gains in cloud computing and web hosting offsetting loss at web search and social media.
- April’s stronger job gains should alleviate fears the U.S. economy is tipping into a recession, but also increase the odds the Fed raises rates once again in June.
Nonfarm employment rose by 253,000 jobs in April, close to our expectation. Revisions to the prior 2 months sliced 149,000 jobs off previous estimates. Employers have added an average of 222,000 jobs a month over the past three months, down from an average of 399,000 per month in 2022.
Job growth continues to be driven by industries hit hardest by the pandemic lockdowns. Health care added 39,600 jobs in April, with hiring up sharply at doctors’ and dentists’ offices, hospitals, and nursing homes. Health care providers have seen a resurgence in demand, as patients feel more comfortable with office visits and treatments. Demand for nursing homes and residential care facilities is also recovering.
Job growth continues to be driven by industries hit hardest by the pandemic lockdowns.
Leisure and hospitality added 31,000 jobs in April, with most of the gain coming at restaurants and bars. Hiring is also up solidly in arts, entertainment and recreation, a broad category capturing everything from theme parks and casinos to bowling alleys and arcades. Consumers are spending more on entertainment outside the home, driving strong demand across the sector. Leisure and hospitality employment remains 2.4%, or 402,000 jobs, below its pre-pandemic level.
Demand for childcare and family services also continues to drive rehiring. Social services providers added 24,600 jobs in April.

Construction firms added 15,000 jobs this past month. There was considerable variation among the major subcomponents, however, which provide some key insight into the state of residential and commercial construction. Employment declined in construction of residential and commercial buildings, with each losing 1,800 jobs during the month. Heavy construction and engineering construction firms also cut 8,100 jobs in April. Specialty trade contractors, however, added 26,700 jobs in April, with 16,000 jobs added in residential.
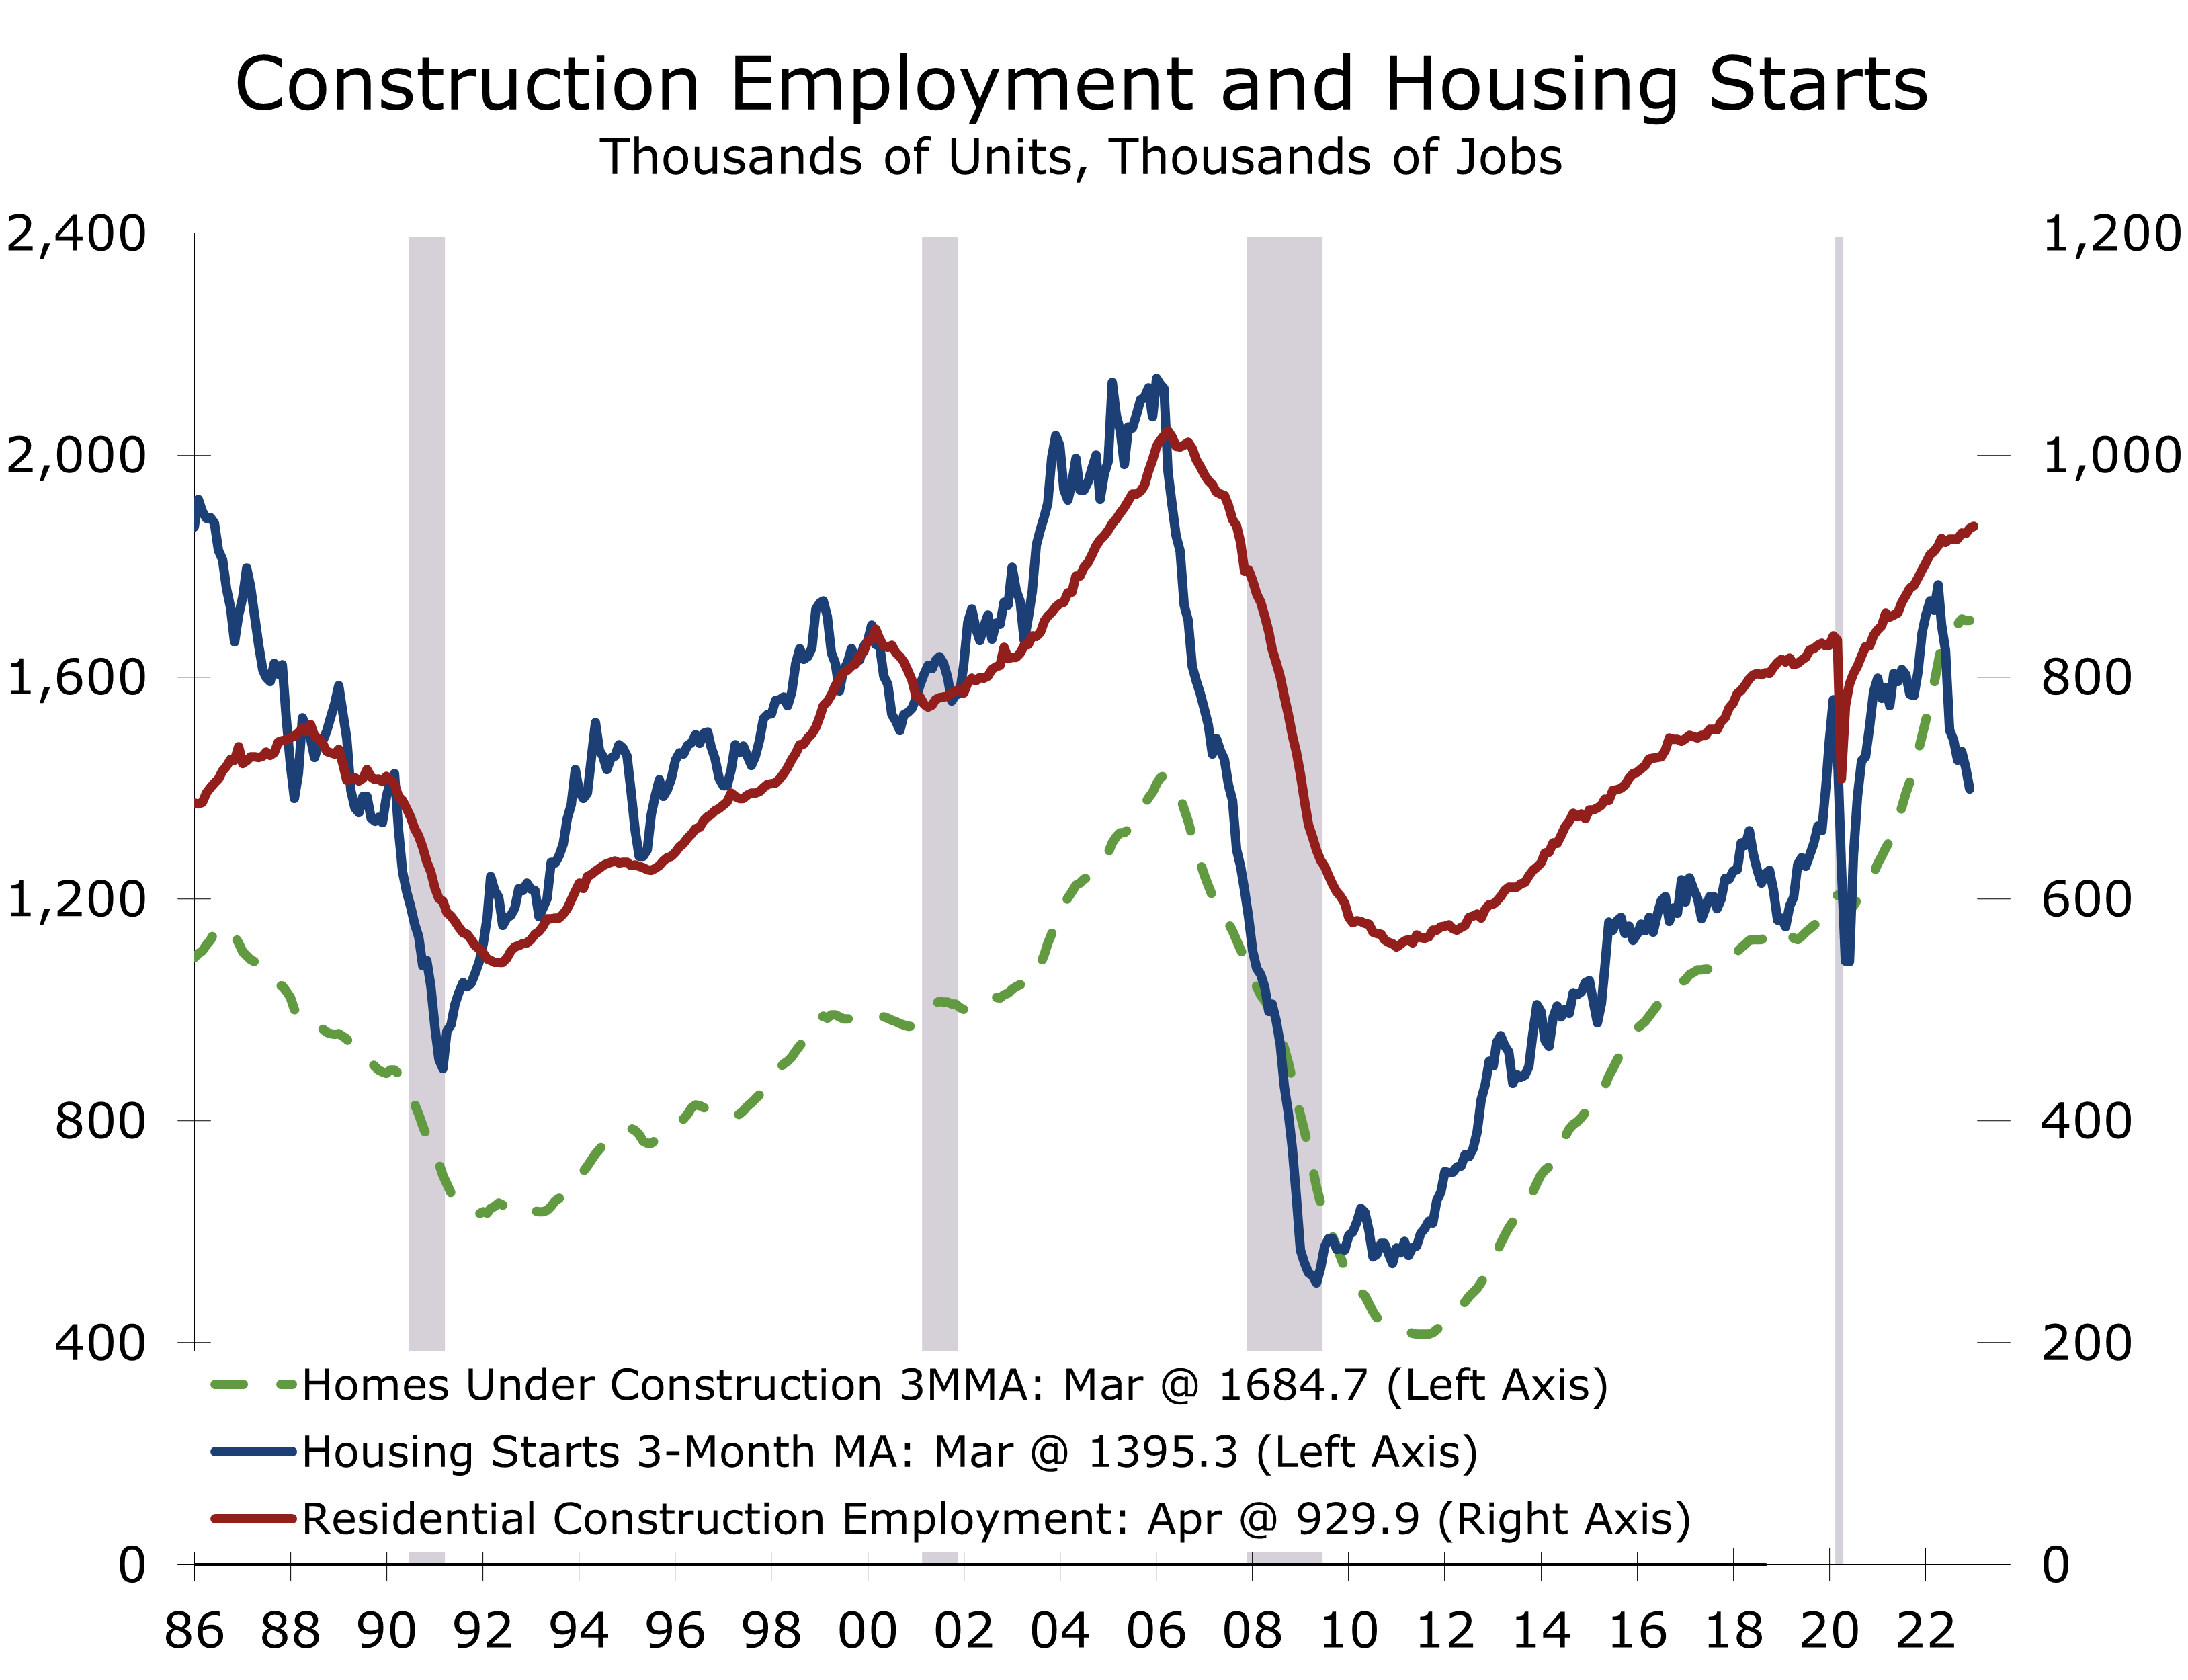
One of the more unusual aspects of the housing market is the exceptionally high level of homes currently under construction. Cycle times for apartments and single-family homes have lengthened considerably due to supply and labor shortages. The backlog of apartments currently under construction, much of which is in mid-rise and high-rise projects, is the largest since late 1973.
Single-family home builders are beginning to make headway at reducing their backlogs, with starts trailing completions for the past few months. Much of the work that is now needed to complete homes involves specialty contractors, such as plumbers and cabinet installers and floorers. The large backlog of homes under construction has created a break in the usually tight relationship between construction employment and housing starts.
Manufacturers added 11,000 jobs in April, more than reversing an 8,000-job drop in March. Fabricated metals and transportation equipment accounted for the bulk of April’s gain. Average weekly hours in manufacturing fell 0.1 to 40.2 hours. The goods sector has been under pressure the past few months as manufacturers and wholesalers strive to reduce inventories. Look for retailers to cut back stocks in coming months, which will likely weigh on transportation and warehousing jobs.
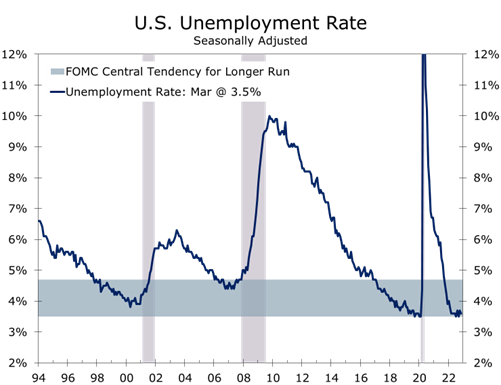
April’s stronger jobs data raise the probability the Fed will hike rates again when they meet in mid-June, a prospect we raised in our write-up following the Fed meeting. The unemployment rate is currently below the lower range of the Fed’s long-range target, while wages are rising at a pace that is consistent with a 3.5% inflation rate, which is well above the Fed’s target.
April’s strong jobs report raises the probability the Fed will hike rates when they meet in June.
The strength in hiring also reduces recession fears. Hours worked remain weak, however, rising at just a 1.2% pace over the past 3 months. That might be enough to keep GDP positive if productivity rebounds.

Disclaimer: This publication has been prepared for informational purposes only and is not intended as a recommendation offer or solicitation with respect to the purchase or sale of any security or other financial product nor does it constitute investment advice.

The Fed Hikes Rates and Maintains Flexibility About What to Do Next
A Hawkish Pause - If That
- As was widely expected, the FOMC raised their federal funds rate target a quarter percentage point to between 5% and 5.25%.
- The Fed dropped the sentence in its policy statement noting “additional policy firming may be appropriate” and replaced it with a slightly less dovish statement that leaves them room leave rates unchanged in June or raise them if conditions warrant.
- The flexibility written into the policy statement is purposeful, as employment and inflation may both surprise to the upside between now and the June 13-14 FOMC meeting.
- The Fed noted the “U.S. Banking system is sound and resilient”, a point reiterated at the start of Powell’s press conference.
- Powell also stressed that price stability is the key policy objective for the Fed right now, particularly given the ongoing strength of the labor market. The prominent placing of this statement is likely a response to the unusually public criticism of the Fed from elected officials.
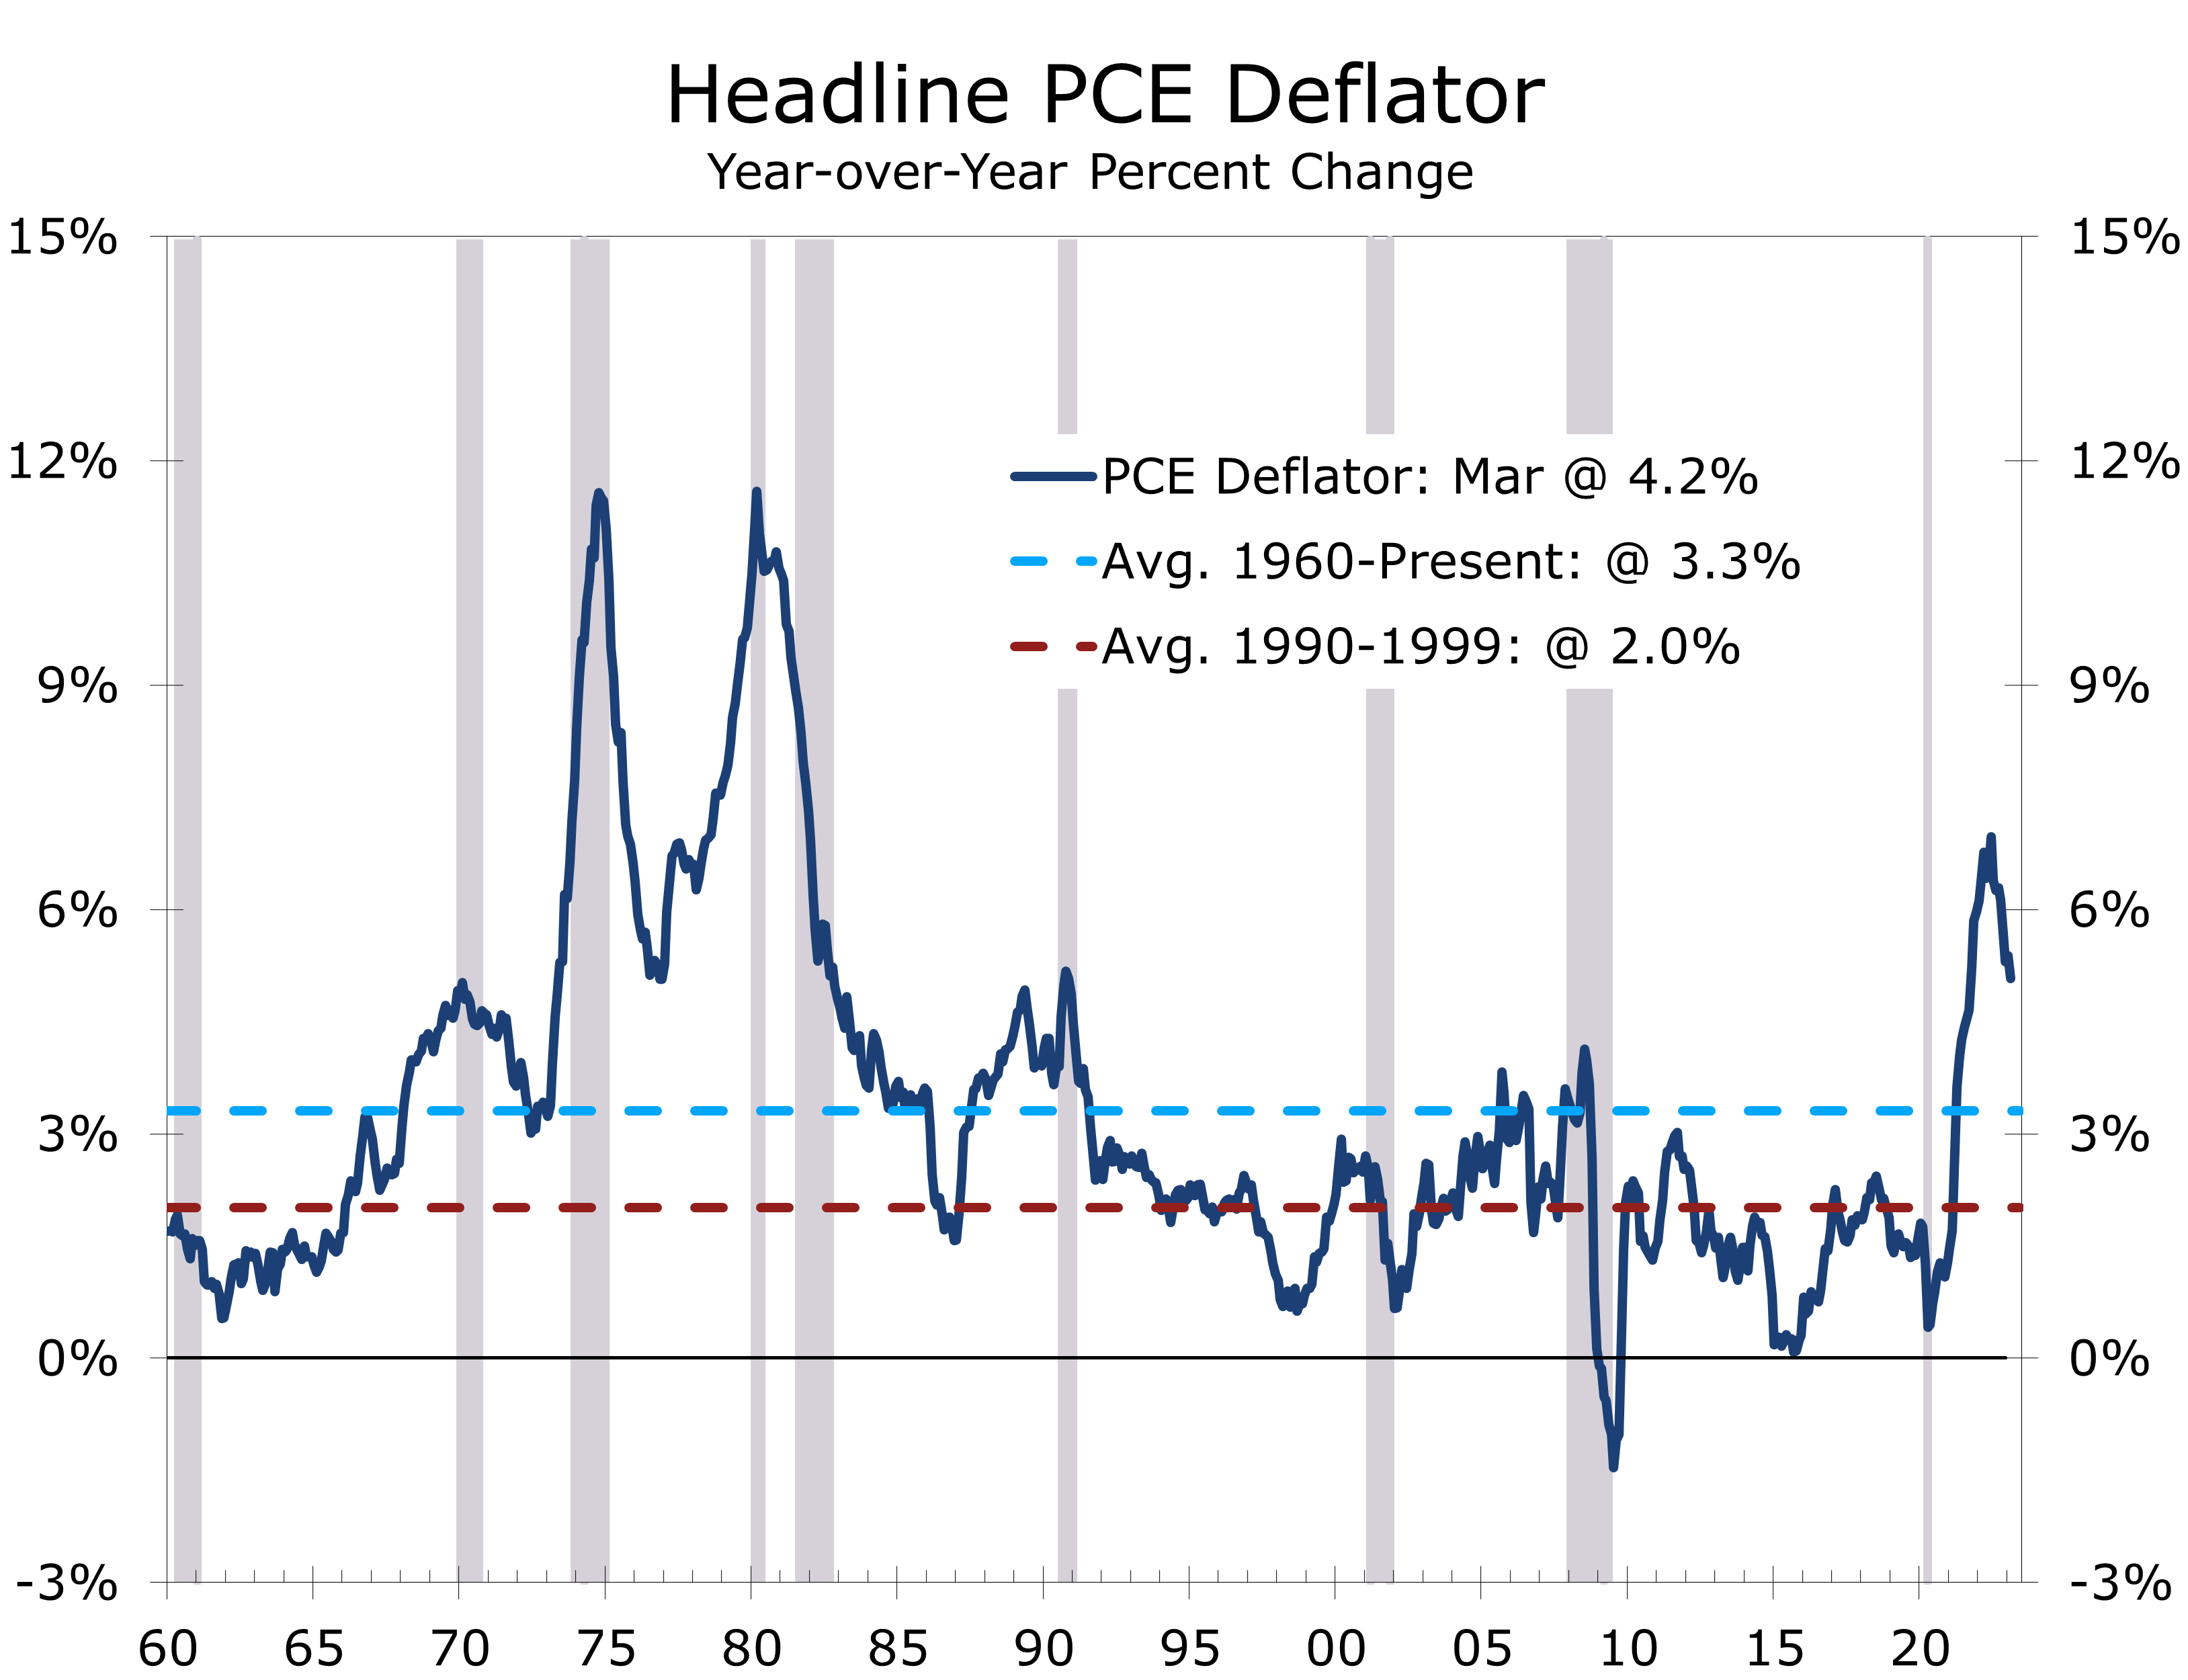
As was widely expected, the Federal Reserve raised its federal funds rate target by a quarter percentage point to between 5% and 5 1/4%. The policy statement released following the meeting was a bit more hawkish than the markets had expected. We see the likelihood of another quarter point hike in mid-June at just slightly better than 50%.
Market participants had expected the Fed to announce it would take a break from hiking interest rates following the May FOMC meeting. While the Fed may still pause in June, the policy statement left them plenty of wiggle room to push forward with hiking rates further in mid-June. The Fed may very well need that wiggle room if the employment data continue to come in strong and the recent moderation in inflation slows or possibly even reverse a bit. The Fed will see two more employment reports and two more CPI reports before their June 13-14 meeting.
Employment conditions still remain too strong for the Fed to end their policy tightening.
The Fed is aware of the pointed criticism it is seeing from elected officials, academics, and private prognosticators. The Fed also has a rich history to draw upon which shows the best way to meet their dual mandate over the long-term is to maintain price stability and to make certain long-term inflation expectations remain anchored around their 2% target. Employment conditions are currently at the lower bound of the Fed’s long-run target, while inflation is running more than 2 times higher than target.
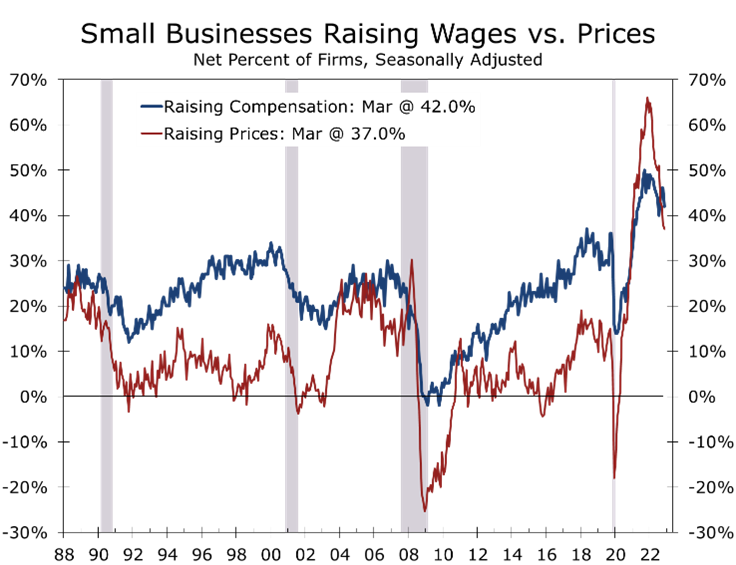
We expected the Fed to keep its options open for its June FOMC meeting after hiking rates in May. Recent evidence on wages suggest bringing inflation back to the Fed’s 2% target will take longer and be more difficult. The Employment Cost Index for the first quarter came in above expectations and survey data on wages show wage growth will likely remain well above levels consistent with bringing inflation back down to 2%.
Strategically, it is too early for the Fed to commit to a pause. The financial markets are already on edge due to the failure of Silicon Valley Bank, Signature Bank and First Republic, as well as continued struggles at some West Coast regional banks and specialty lenders. If the FOMC had signaled a pause and then had to reverse course because the jobs and inflation data came in much hotter than expected, then the volatility that would then be unleased would risk further damage to both the economy and banking system.
Powell cited the recent troubles in the banking system at the start of his press conference and noted conditions in the banking system had improved since the resolution of recent bank failures. He then shifted into a forceful explanation of the Fed’s dual mandate. The tone of Powell’s comments and the bulk of recent economic data suggest it is still too early for the Fed to declare victory.
The change to the policy statement receiving the most attention was the shift in the FOMC’s view on how they will determine what to do next. The statement “The Committee anticipates that some addition policy firming may be appropriate” was changed to “In determining the extent to which additional policy firming may be appropriate” This clearly implies the Fed is keeping their options open.
The Fed also dropped language in the second part of that sentence (following the word appropriate) “… in order to attain a stance of monetary policy that is sufficiently restrictive to return inflation to 2 percent over time.” This change raises the possibility the federal funds rate is now at a neutral level and is critical because if the Fed does pause in June, they do not want to raise concerns they are pulling in their horns too soon.
We expect the upcoming jobs and inflation data to be consistent with another quarter point hike.
We have consistently been more concerned about inflation and continue to believe the Fed has more work to do. We expect the jobs and inflation data to be consistent with another quarter point rate hike in June and expect the recent banking turmoil to subside.
Disclaimer: This publication has been prepared for informational purposes only and is not intended as a recommendation offer or solicitation with respect to the purchase or sale of any security or other financial product nor does it constitute investment advice.
ISM Manufacturing Rose Slightly in April
Manufacturing Continues to Show Resilience
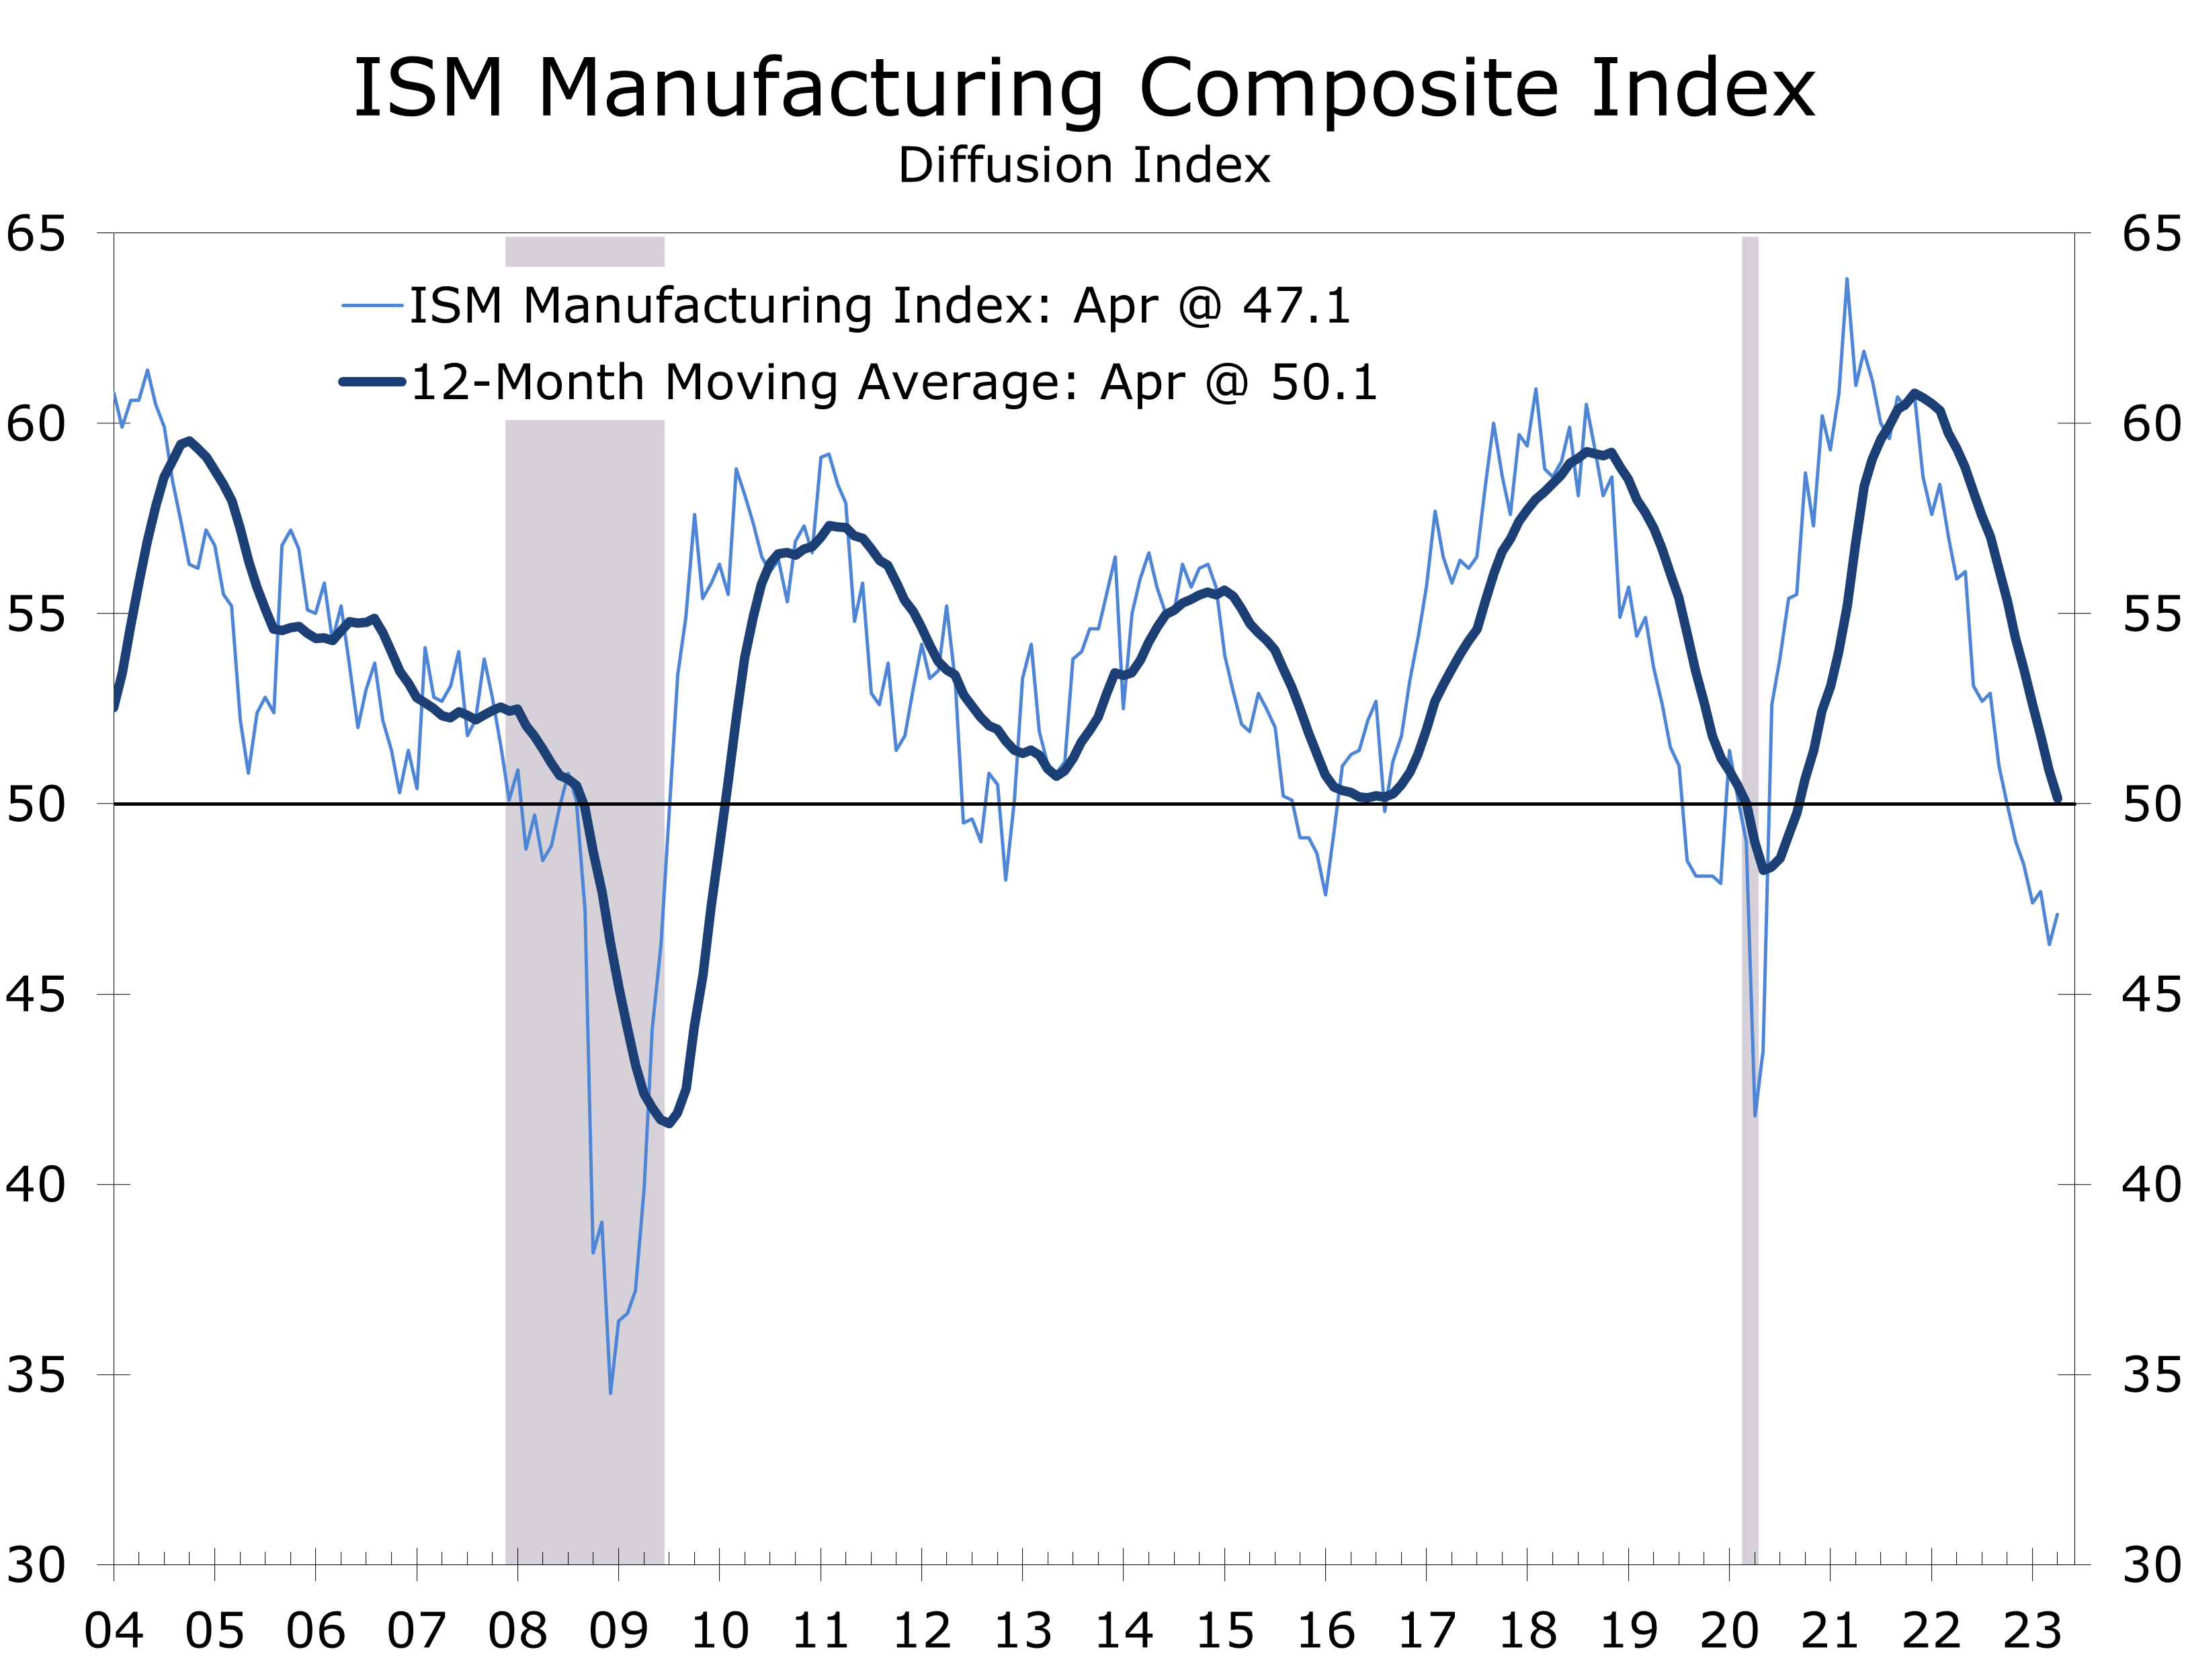
- The ISM Manufacturing index rose 0.8 points in April to 47.1, as the slowdown in the manufacturing sector moderated somewhat.
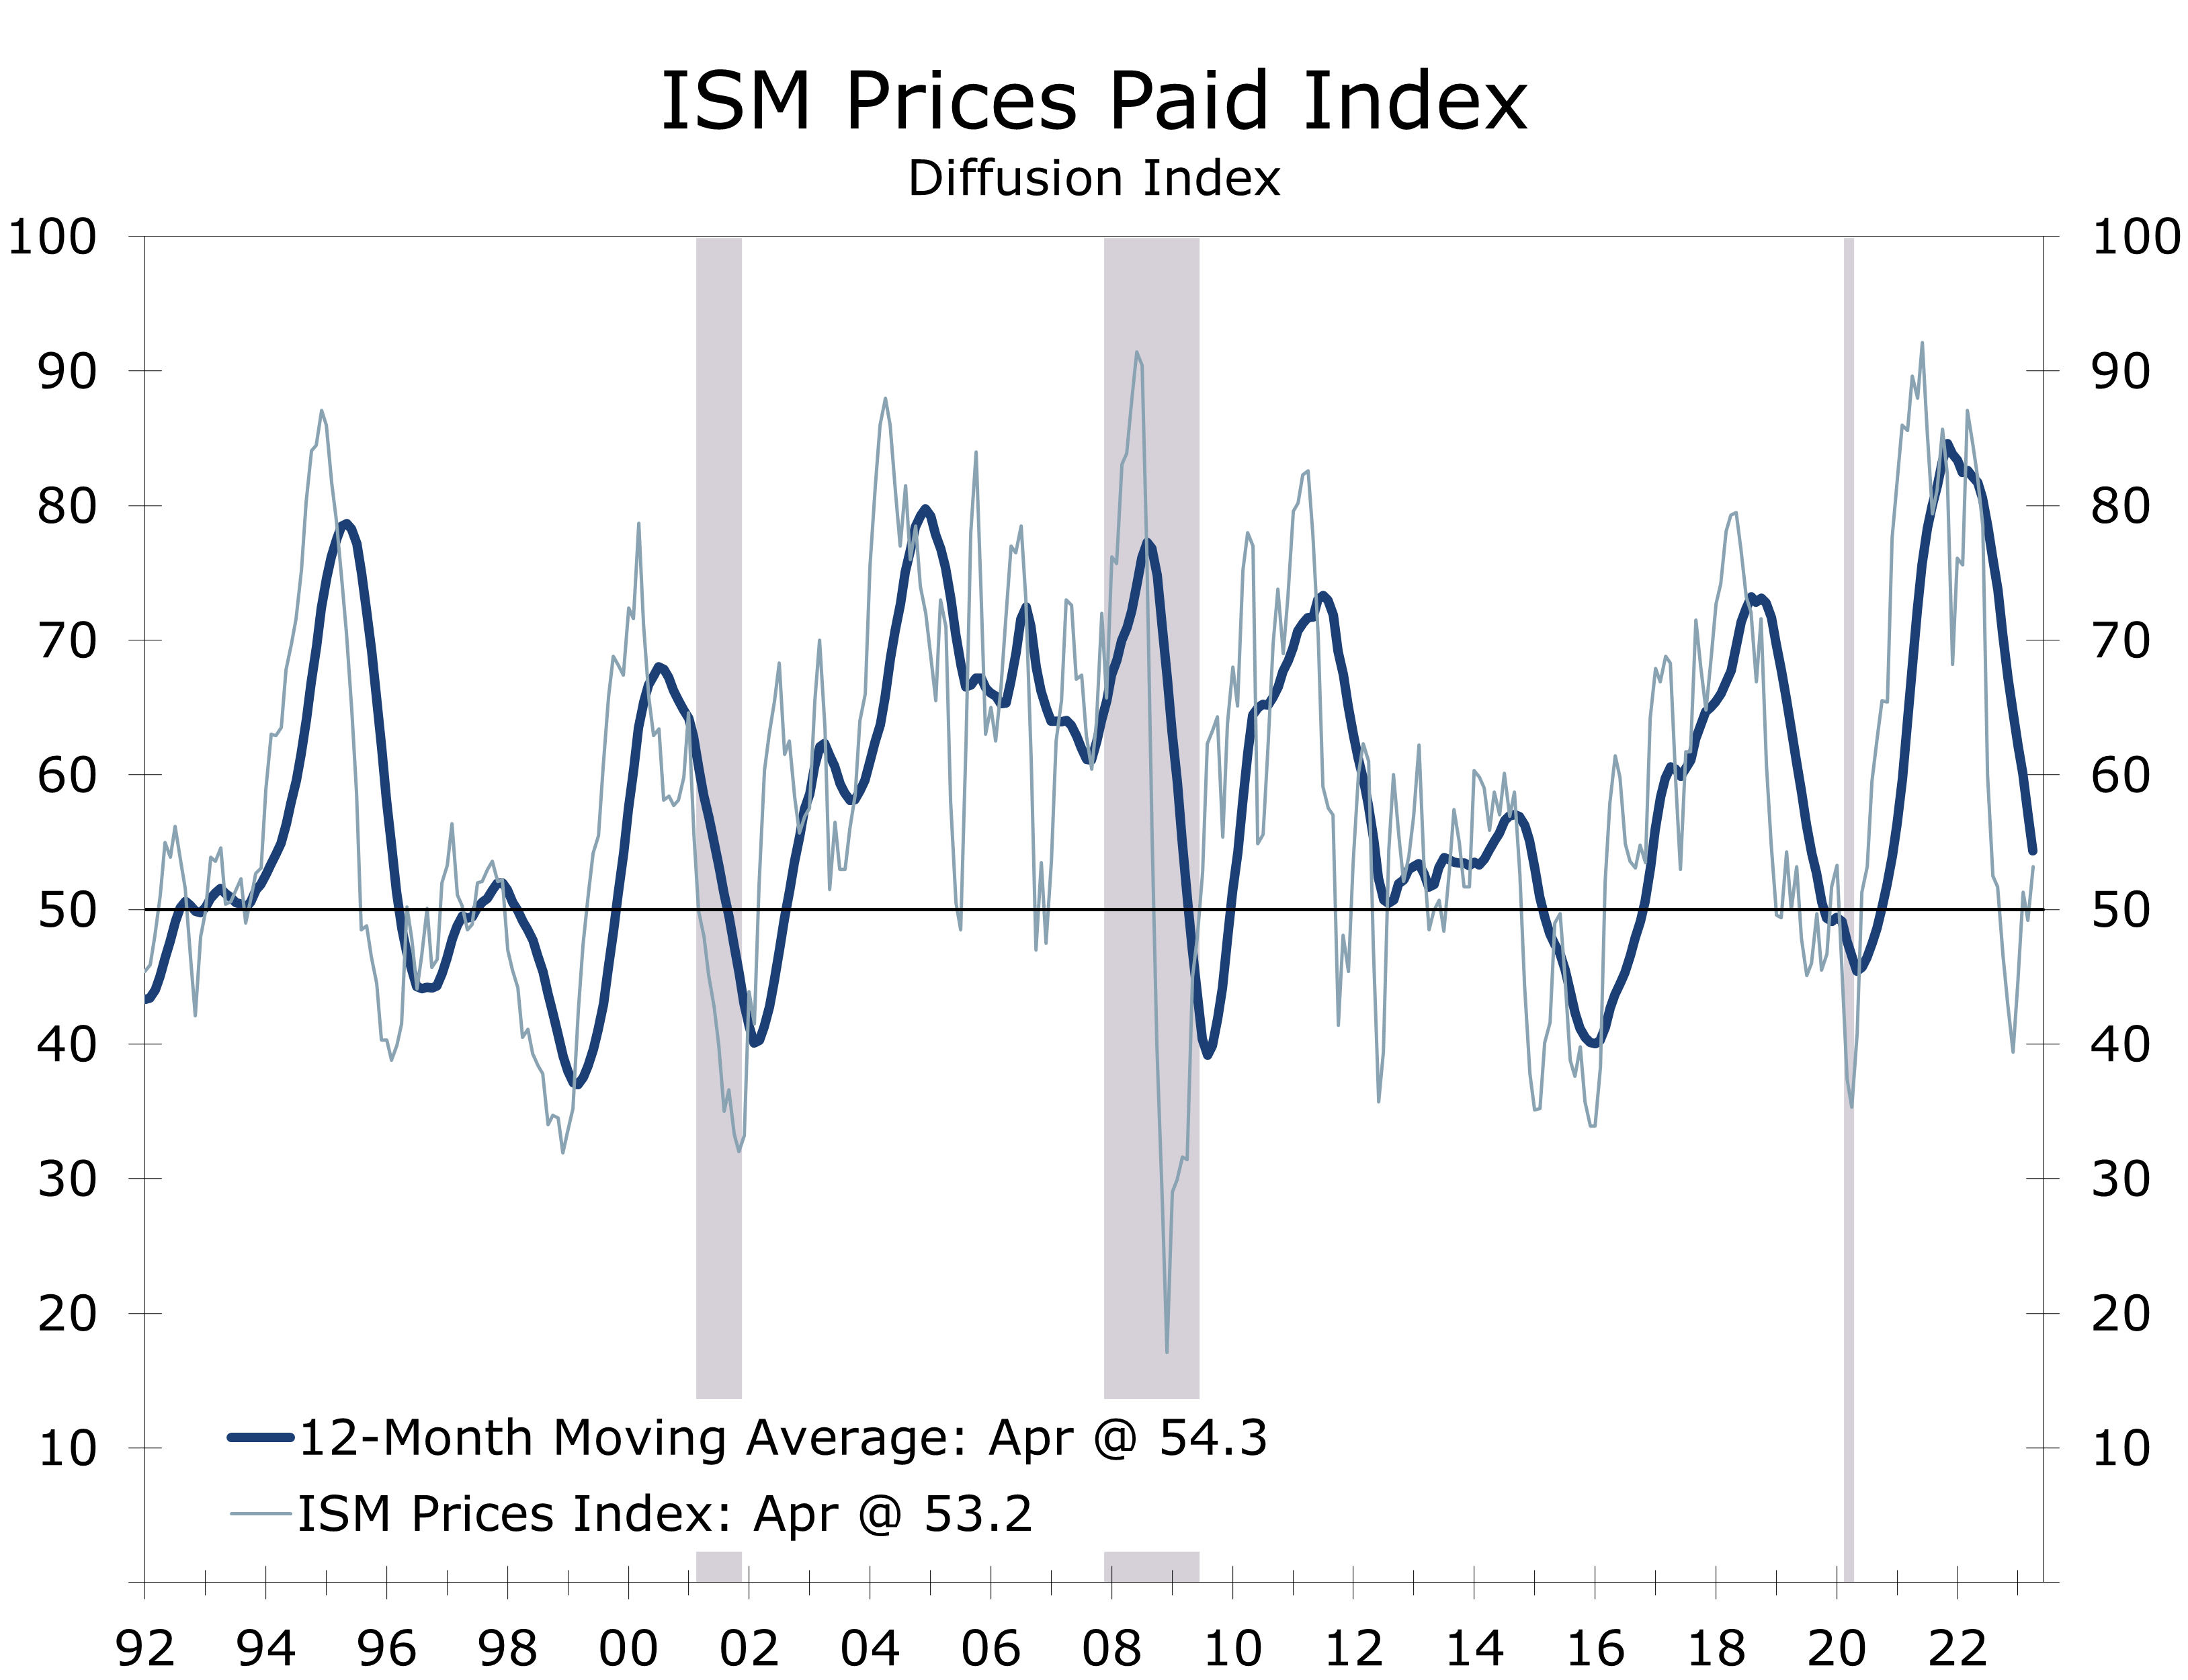
- While the index remained in contraction territory for a sixth consecutive month, the composition of April’s increase was quite strong. Seven of the ISM’s 10 components rose, with the prices paid series jumping 4 points to 53.2.
- The employment index also rose solidly, climbing 3.2 points to 50.2. Manufacturers cut 1,000 jobs in both February and March.
- Customer inventories rose 2.4 points to 51.3, and now look a bit high. Inventories have been falling at manufacturers and wholesalers, however.
- Manufacturers are working down their order backlogs and drawing down inventories to generate cash. The inventories index fell 1.2 points to 46.3, while order backlogs fell 0.8 points to 43.1.
Manufacturing activity improved slightly in April, with the ISM manufacturing survey rising 0.8 points to 47.1. The ISM survey is a diffusion index and provides insight into the breadth of strength or weakness within the factory sector. A reading above 50 means more manufacturers see conditions in their business improving than deteriorating.
April marks the sixth consecutive month the index has been below the key 50 break-even level, signaling a contraction in the manufacturing sector. Furthermore, the Institute for Supply Management notes any reading below 48.7 is generally consistent with a decline in overall economic activity, and the index has been below that level for the past five months.
Manufacturing has been unusually volatile in the wake of the Pandemic. Supply shortages had greatly extended delivery times, which helped pull the index to extraordinary heights as the economy reopened. Supply chains have normalized across many industries and the decline in the delivery times has tended to exaggerate the slide in the index to the downside.
Producers are actively working down their backlogs and reducing inventories to generate cash.
While manufacturing is showing a great deal of resilience, producers are actively working down their order backlogs and reducing inventories to generate cash. The shift may reflect some caution on the part of manufacturers in lieu of the troubles in the banking sector. There was no mention of credit conditions in the ISM report, however, and the reduction in backlogs might simply reflect normalizing supply chains.
Order backlogs surged following the pandemic, as demand recovered much faster than production. The order backlog index peaked about a year ago and has tumbled more than 20 points since. The latest data show the backlog index at just 43.1, a level that has typically been associated with manufacturing job loss.
Manufacturing activity is still being impacted by echoes from the pandemic, however. One of the reasons backlogs have slowed so rapidly is that deliveries of key raw materials and inputs are now much timelier and there are fewer shortages. One thing that remains in short supply, however, is labor and manufacturers appear to be in no hurry to reduce staff that has been so hard to hire and retain.
Backlogs are likely to continue to contract this year. While the advance first quarter GDP data noted a decline in inventories, all that drop occurred at manufacturers and wholesalers. Retailers saw inventories increase in the first quarter. That inventory build may be carrying over in the spring. Customers’ inventories rose 2.4 points in April to 51.3, which means more manufacturers report their customer inventories were too high than were too low, likely presaging a further pullback in orders.
On the plus side, export demand may be reviving. The export order index rose 2.2 points in April to 49.8. China’s reopening might possibly be boosting exports.

The 4-point rise in the prices paid component is one of the more notable swings in the April ISM report. The prices paid series had trended down sharply over the past year, as supply chains normalized and there were fewer bottlenecks and shortages. April’s reversal marks a break with this trend and might signal there is less price relief remaining in the pipeline. The Institute for Supply Management noted price increases for foundational purchased materials like steel, copper, plastics, and diesel fuel continue to put upward pressure on material costs.
The 4-point rise in the Prices Paid series signals there is less price relief left in the pipeline.
The ISM survey is one of the last pieces of data the Fed will see before they make their decision on interest rates this week. The FOMC is likely to take note of April’s 4-point rise in the prices paid component, as well as the resilience of manufacturing payrolls. We expect the Federal Reserve to hike the federal funds rate another quarter percentage point and look for the language in the policy statement and Chair’s press conference to suggest the interest rate decision at the June meeting remains an open question.
Disclaimer: This publication has been prepared for informational purposes only and is not intended as a recommendation offer or solicitation with respect to the purchase or sale of any security or other financial product nor does it constitute investment advice.
Rising Wages Make the Fed’s Job More Difficult
Wages Pressure is Proving Persistent
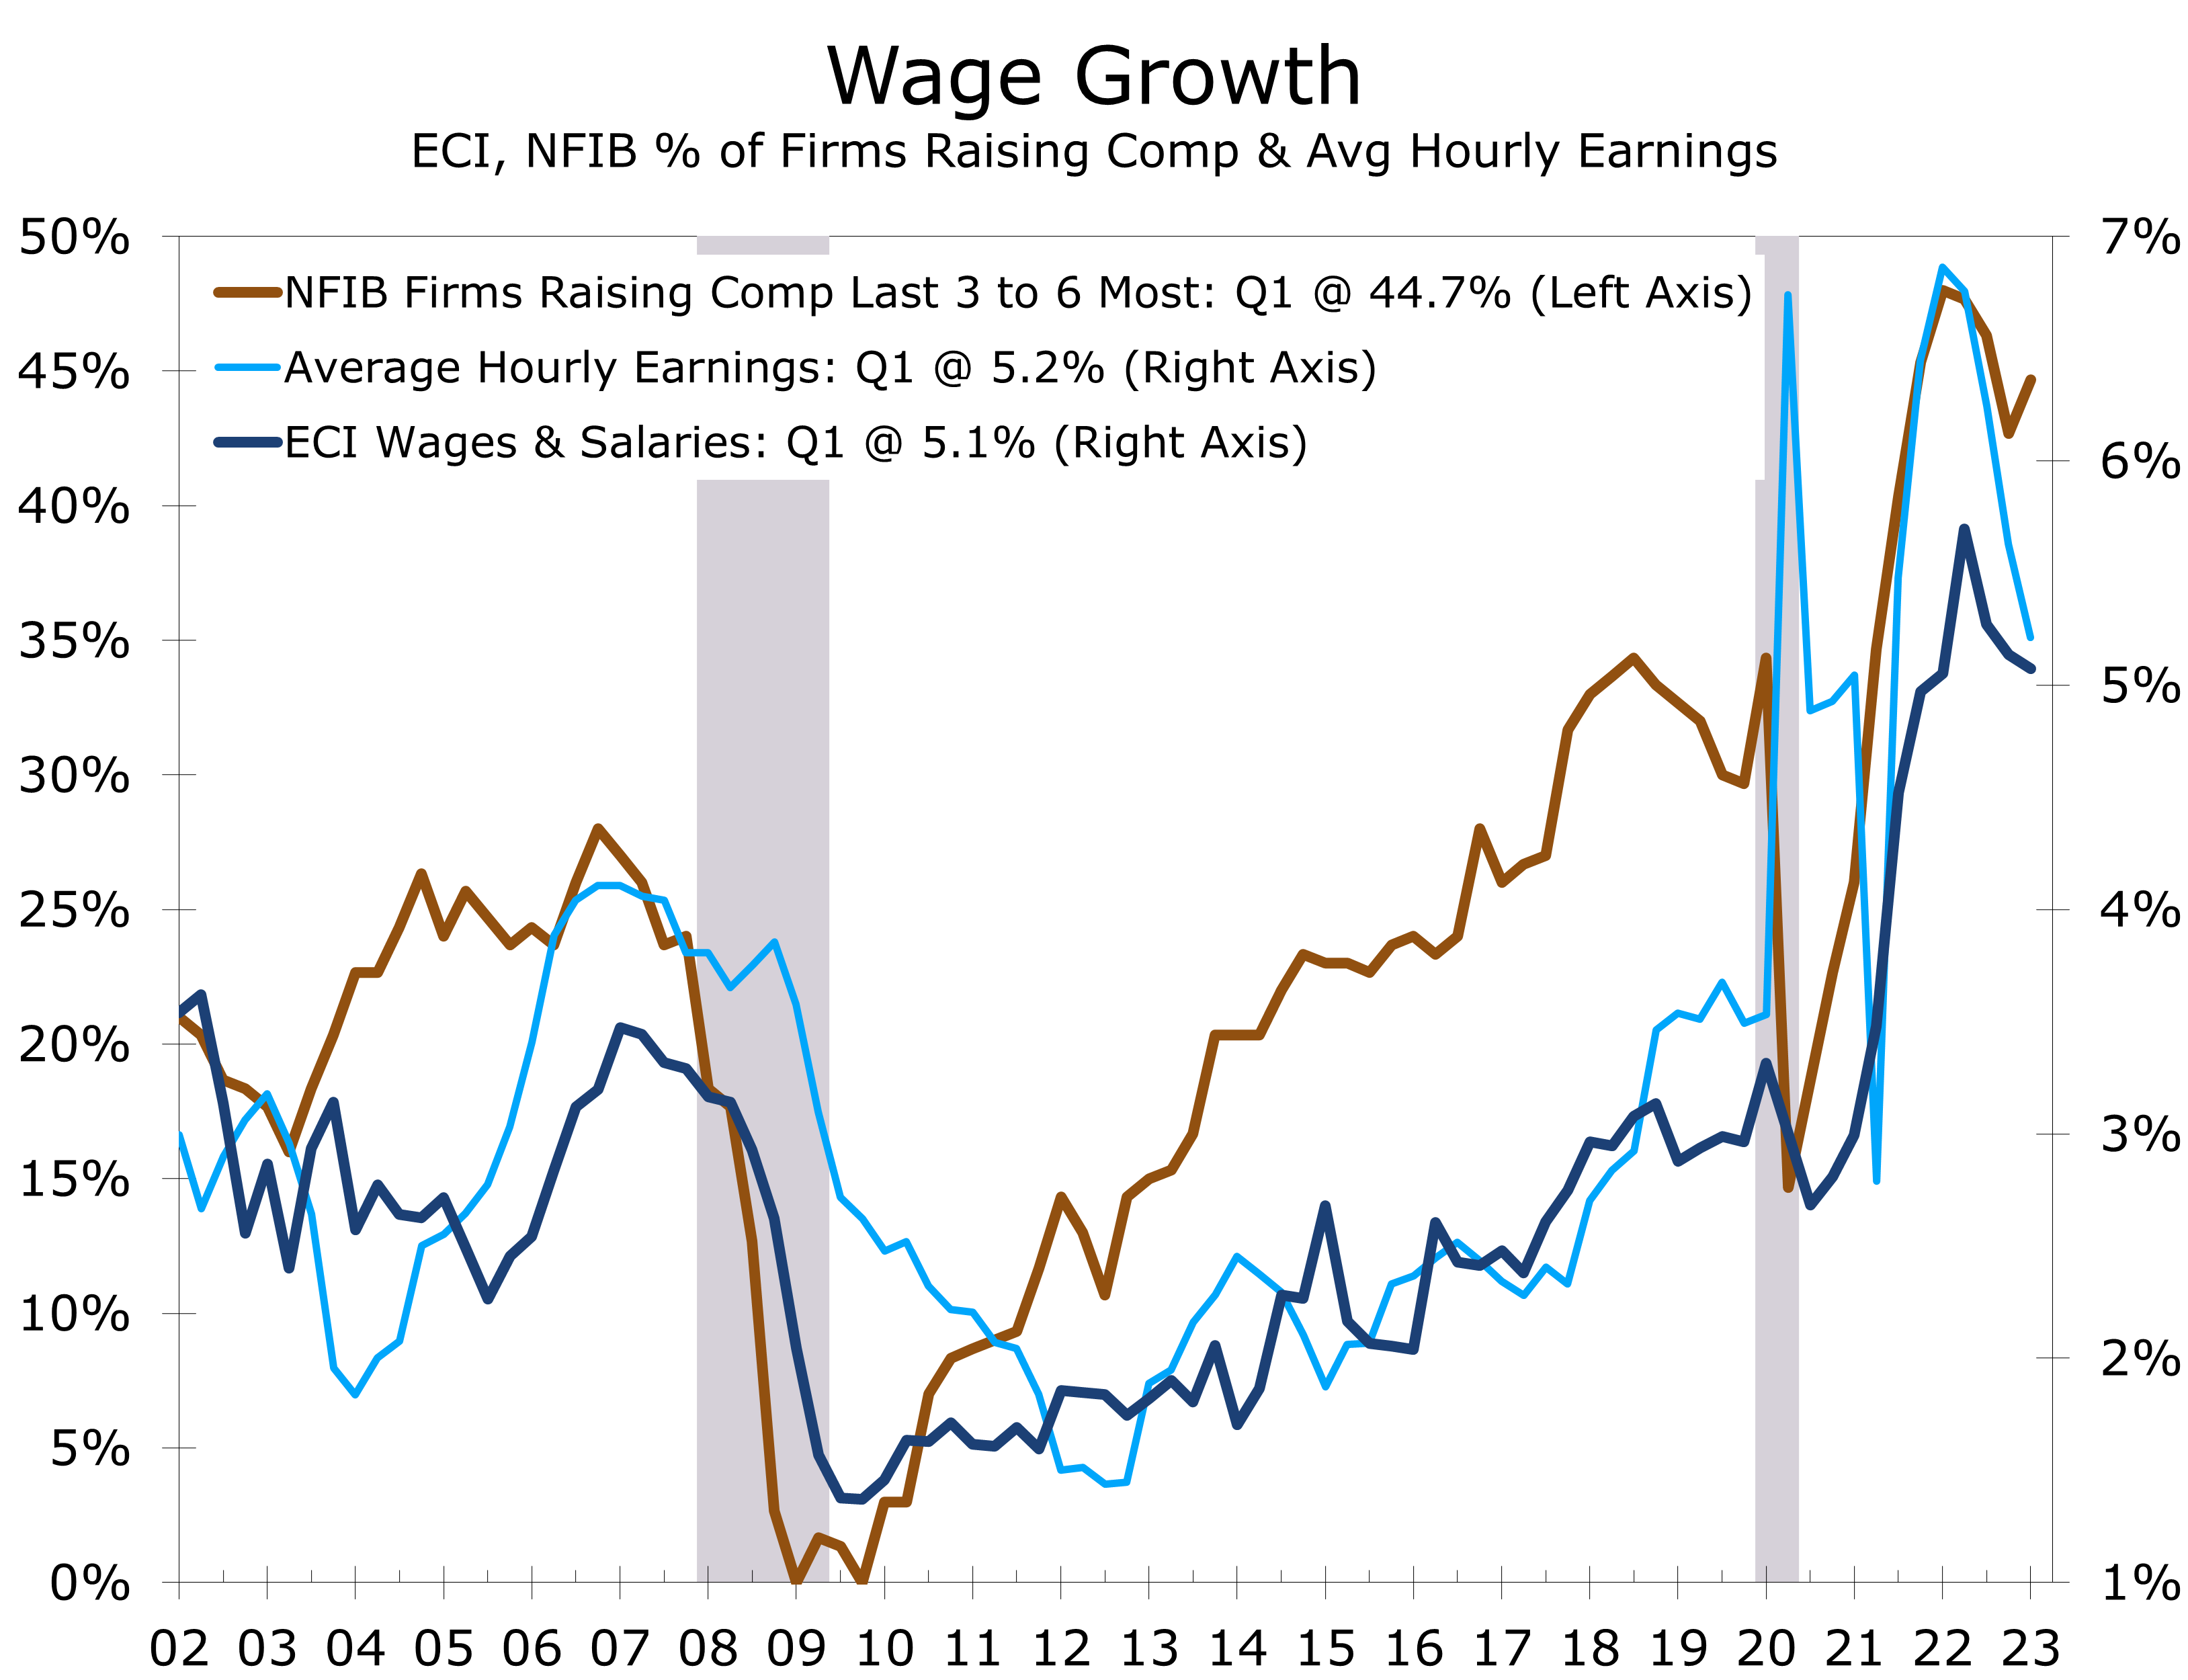
- Wage and benefit costs continue to rise at a highly elevated pace, making the Fed’s job of reining in inflation more difficult.
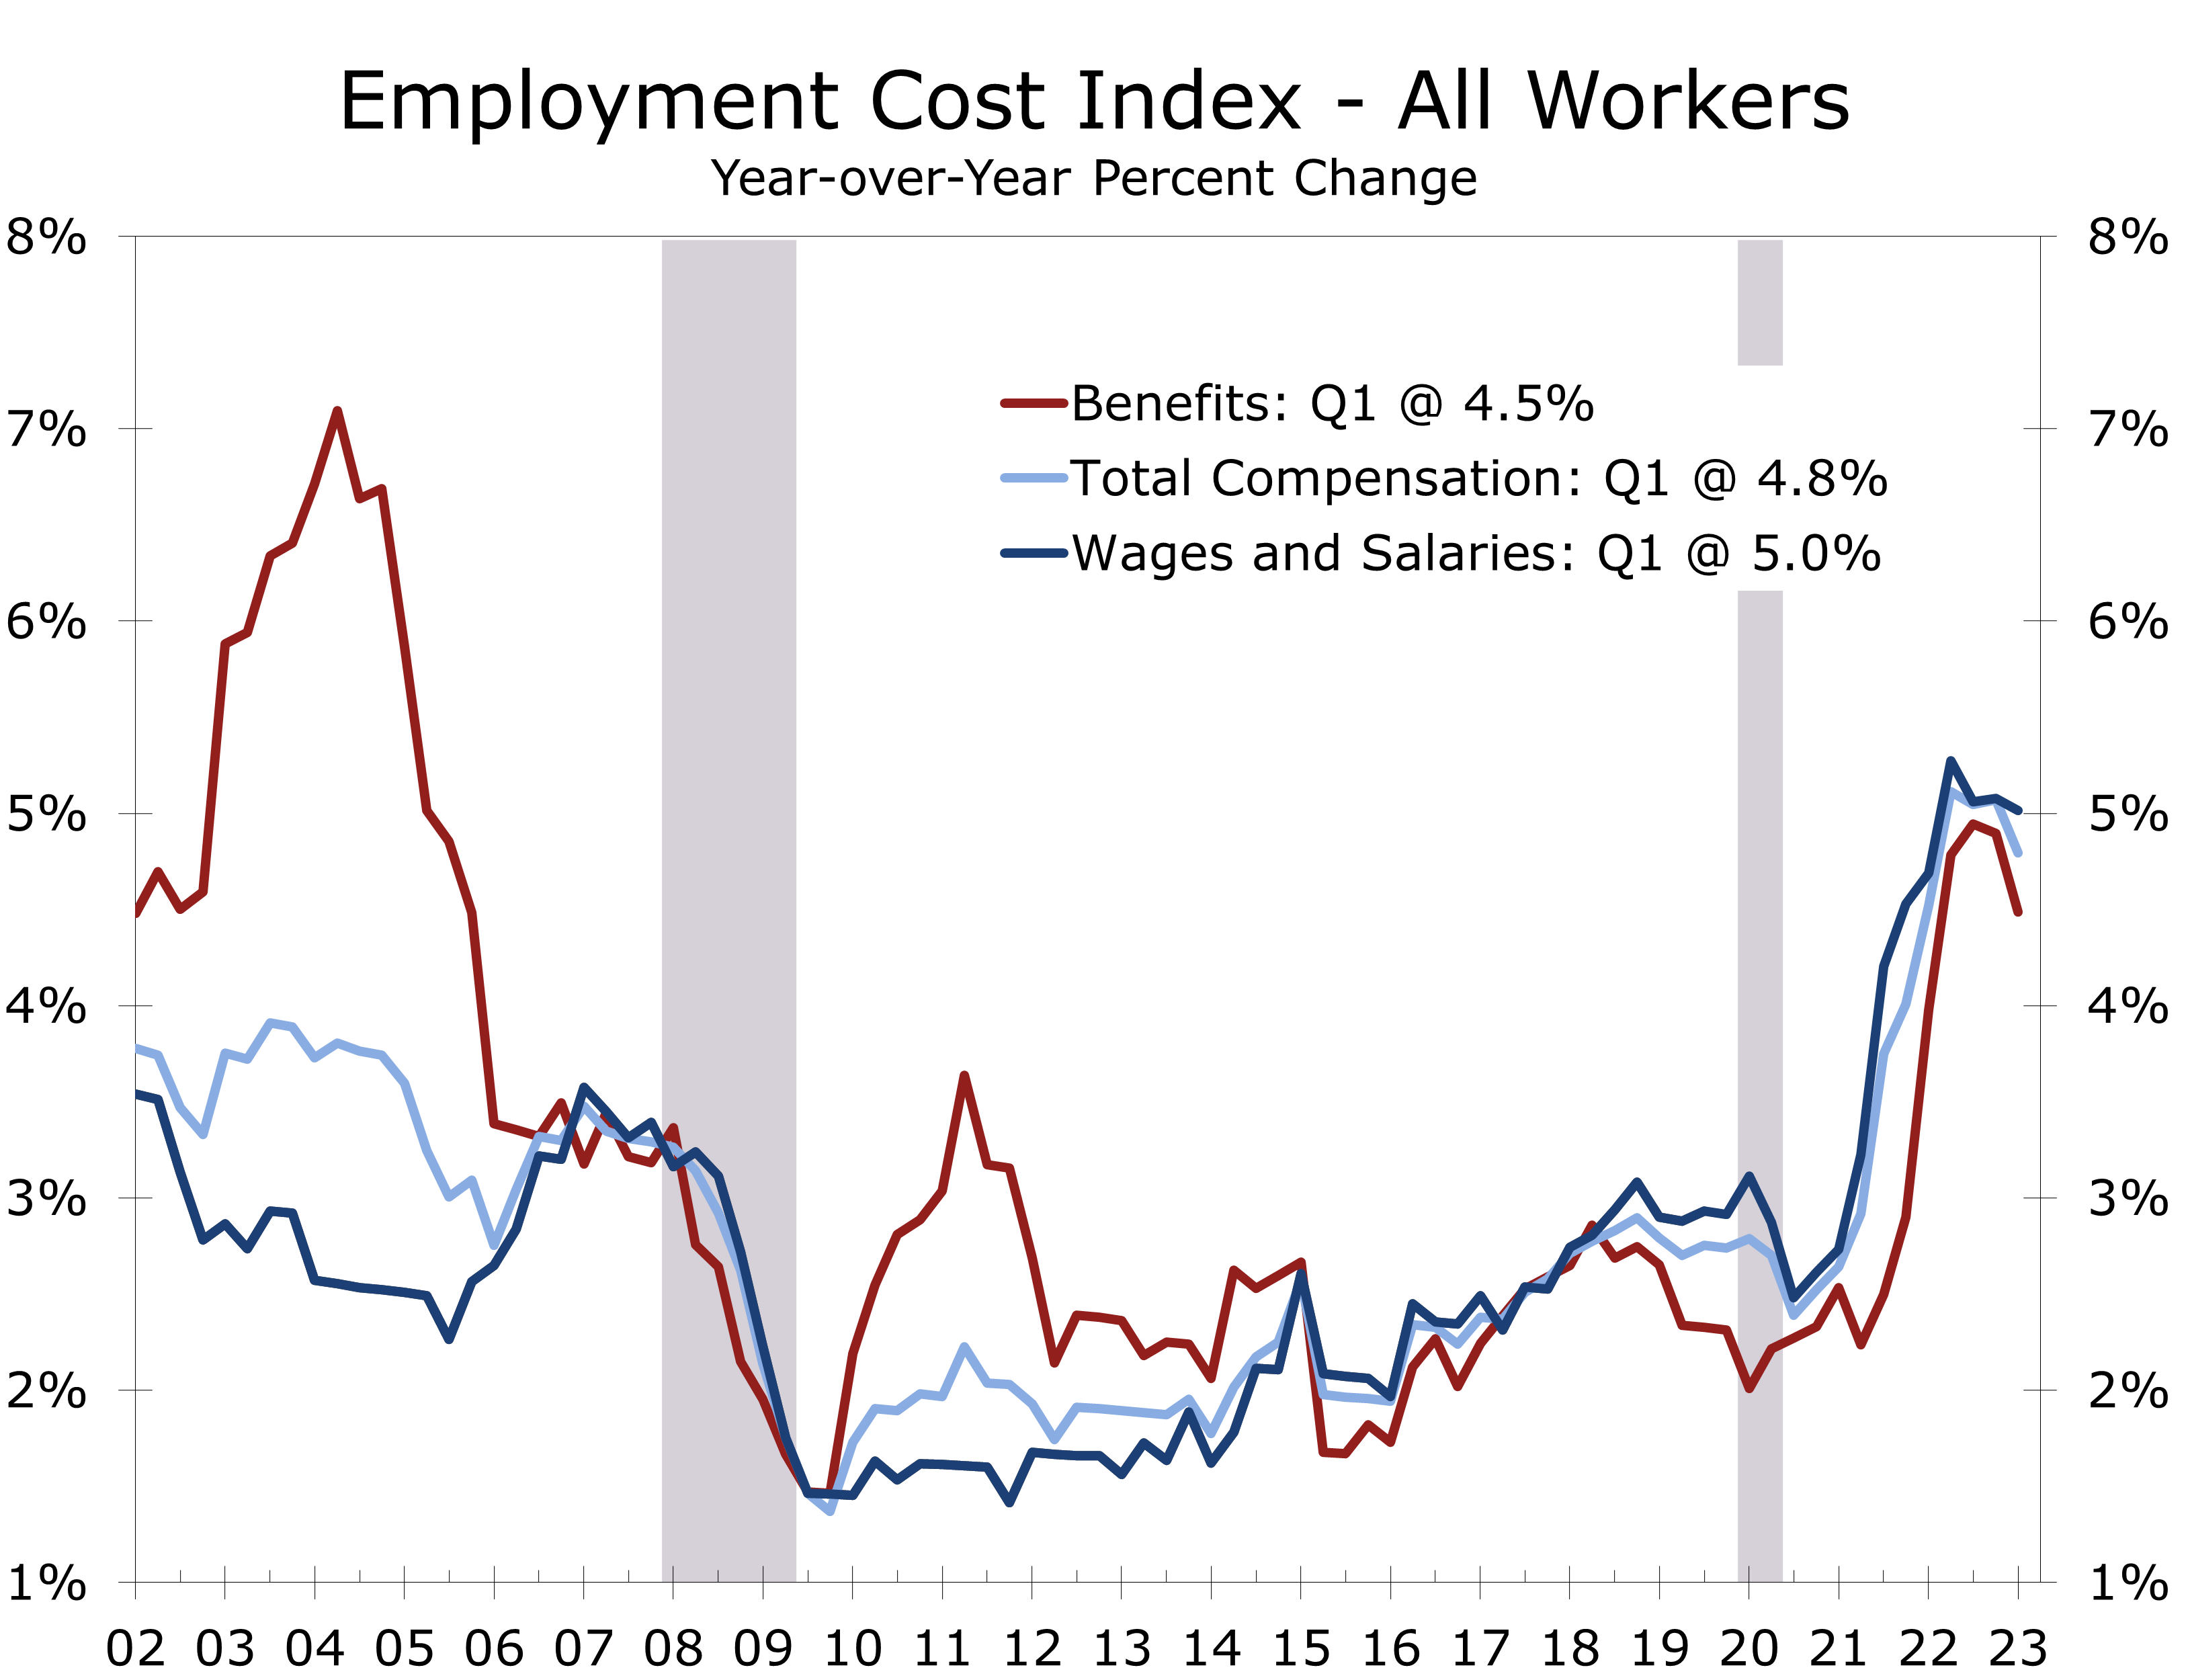
- The Employment Cost Index rose 1.2% in Q1, following a 1.1% rise the previous quarter.
- While the ECI eased slightly on a year-to-year basis, falling from 5.1% in Q4 to 5.0% in Q1, it remains too high. The ECI need to fall to 3.5% or less to bring inflation down to 2%.
- Wages rose 1.2%, the same pace as the prior quarter, while benefit cost ramped up to 1.2% from 1% in Q4.
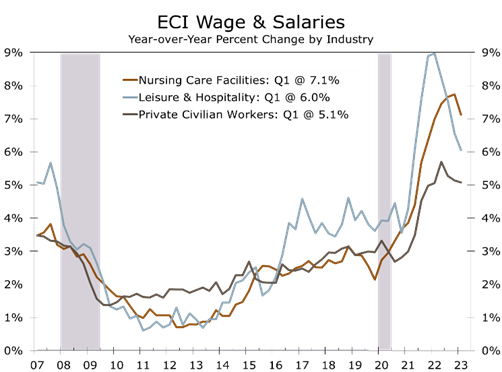
- While wages are up across the board, the sharpest increases continue to come from industries striving to staff back up from the pandemic, namely leisure & travel (+6.0%) and nursing care facilities (+7.1%).
- Wages are rising faster for nonunion workers (+5.1%) than for union workers (4.2%).
- The South Atlantic region posted the largest wage gains over the past year (+6.3%), following the West Coast and Mountain regions, where wages rose 5.6%.
The costs of providing wages and benefits to workers continues to rise at a pace that is inconsistent with the Fed’s mission to bring inflation back down to its 2% target. The Employment Cost Index rose 1.2% in Q1, which was above consensus expectations, and shows wage and benefit costs remain persistent across nearly every industry. Moreover, wages are rising the fastest in industries still striving to rehire workers lost during the pandemic, such as restaurants and bars, nursing homes and childcare centers.
Those latter industries accounted for the bulk of job growth during the first quarter. All are also relatively low paying industries, which is likely why they are the only major industries that have not regained their pre-pandemic employment levels. Since employers in these industries still need to add staff, we doubt wage pressures will fall off all that much in coming quarters.
Wages are rising fastest in industries still striving to restaff to their pre-pandemic levels.
On a year-to-year basis, overall compensation costs for all workers decelerated slightly, falling from 5.1% in Q4 to 5% in Q1. Compensation costs rose slightly in the goods sector, climbing from 5% to 5.1%, and declined slightly in the services sector, falling from 5.1% to 4.9%.
Wages and salaries in the private sector have risen 5.1% from March 2022, which was the same year-to-year pace as in Q4. Wages and salaries rose 5% from March 2021 to March 2022.
Wages and salaries are rising the fastest in industries striving to restaff their operations to pre-pandemic levels. Restaurants, bars, and hotels are one of the more notable examples. Wage gains in the leisure and hospitality sector peaked about a year ago at 9% but still climbed 6% year-to-year in the latest quarter, or nearly a percentage point more than for the private sector in general. Wages and salaries are up more dramatically at nursing care facilities, which saw staffing levels plummet during the pandemic.
Another area where wage gains could prove problematic is union workers. Union contracts tend to lag unanticipated swings in inflation. Pay for nonunion workers has risen 5.1% over the past year, easily outpacing pay for union workers (4.2%). The gap is even larger in the goods-producing sector, where wages for nonunion workers rose 2 full percentage points faster this past year (5.5%) than they did for union workers (3.5%). We suspect unions will attempt close this wage gap in future union negations, which will continue to put pressure on wage and benefit costs.
Union contracts tend to lag unanticipated swings in inflation and will catch up.
Wages rose fastest in regions of the country experiencing the strongest employment and population growth. Wages in the South Atlantic states, which includes Florida, Georgia, the Carolinas, and Virginia rose 6.3% over the past year. The Mountain region and West Coast both saw wages increase 5.6% over the past year, while wages in the Midwest (4.6%) and Northeast (4.4%) rose more modestly.
The persistent strength in wage gains will make the Fed’s job more difficult. Assuming productivity growth returns to its typical 1.5%, the Employment Cost Index would need to slow to around a 3.5% pace to be consistent with a 2% inflation rate. That appears to be a tall order right now. The latest NFIB survey of small businesses shows the share of firms raising compensation during the past 3 to 6 months ticked up during the first quarter and remains near historic highs.
The ECI needs to return to around a 3.5% pace to be consistent with the Fed’s 2% inflation target.
Absent a dramatic deterioration in the banking system this weekend or a plunge in Monday’s ISM report, we expect the Fed to hike the funds rate another quarter point at next week’s FOMC meeting. The wording of the policy statement and Powell’s press conference will likely suggest policymakers are keeping their options open for the June meeting and reemphasize that any cut in interest rates is a long way off.
Disclaimer: This publication has been prepared for informational purposes only and is not intended as a recommendation offer or solicitation with respect to the purchase or sale of any security or other financial product nor does it constitute investment advice.
Q1 Real GDP Rises Only Modestly
Inventory Drawdowns Slash Q1 Output
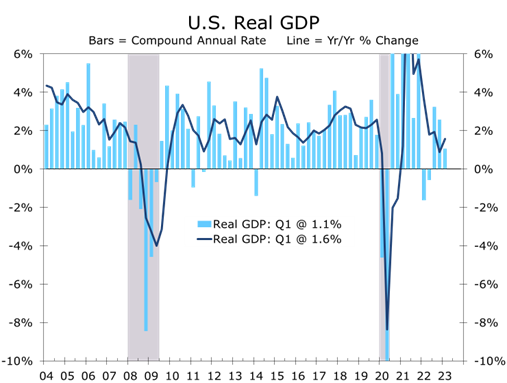
- Real GDP rose at a 1.1% annual rate, coming in a full percentage point below our forecast.
- Real personal consumption rose at a stout 3.7% annual rate. Spending started the quarter red hot, however, and ended the quarter ice cold.
- Business fixed investment fell at a 0.4% annual rate, with equipment outlays plummeting at a 7.3% pace.
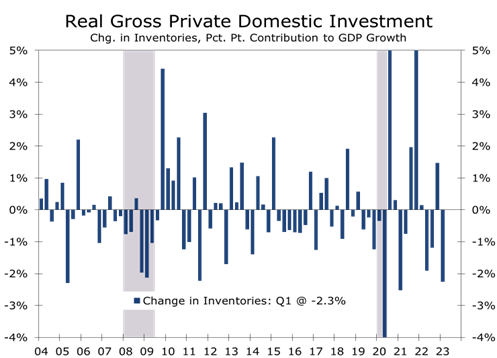
- Inventory drawdowns were much larger than expected, particularly among wholesales and manufacturers.
- Government spending was an upside surprise, with federal nondefense outlays surging at a 10.3% pace.
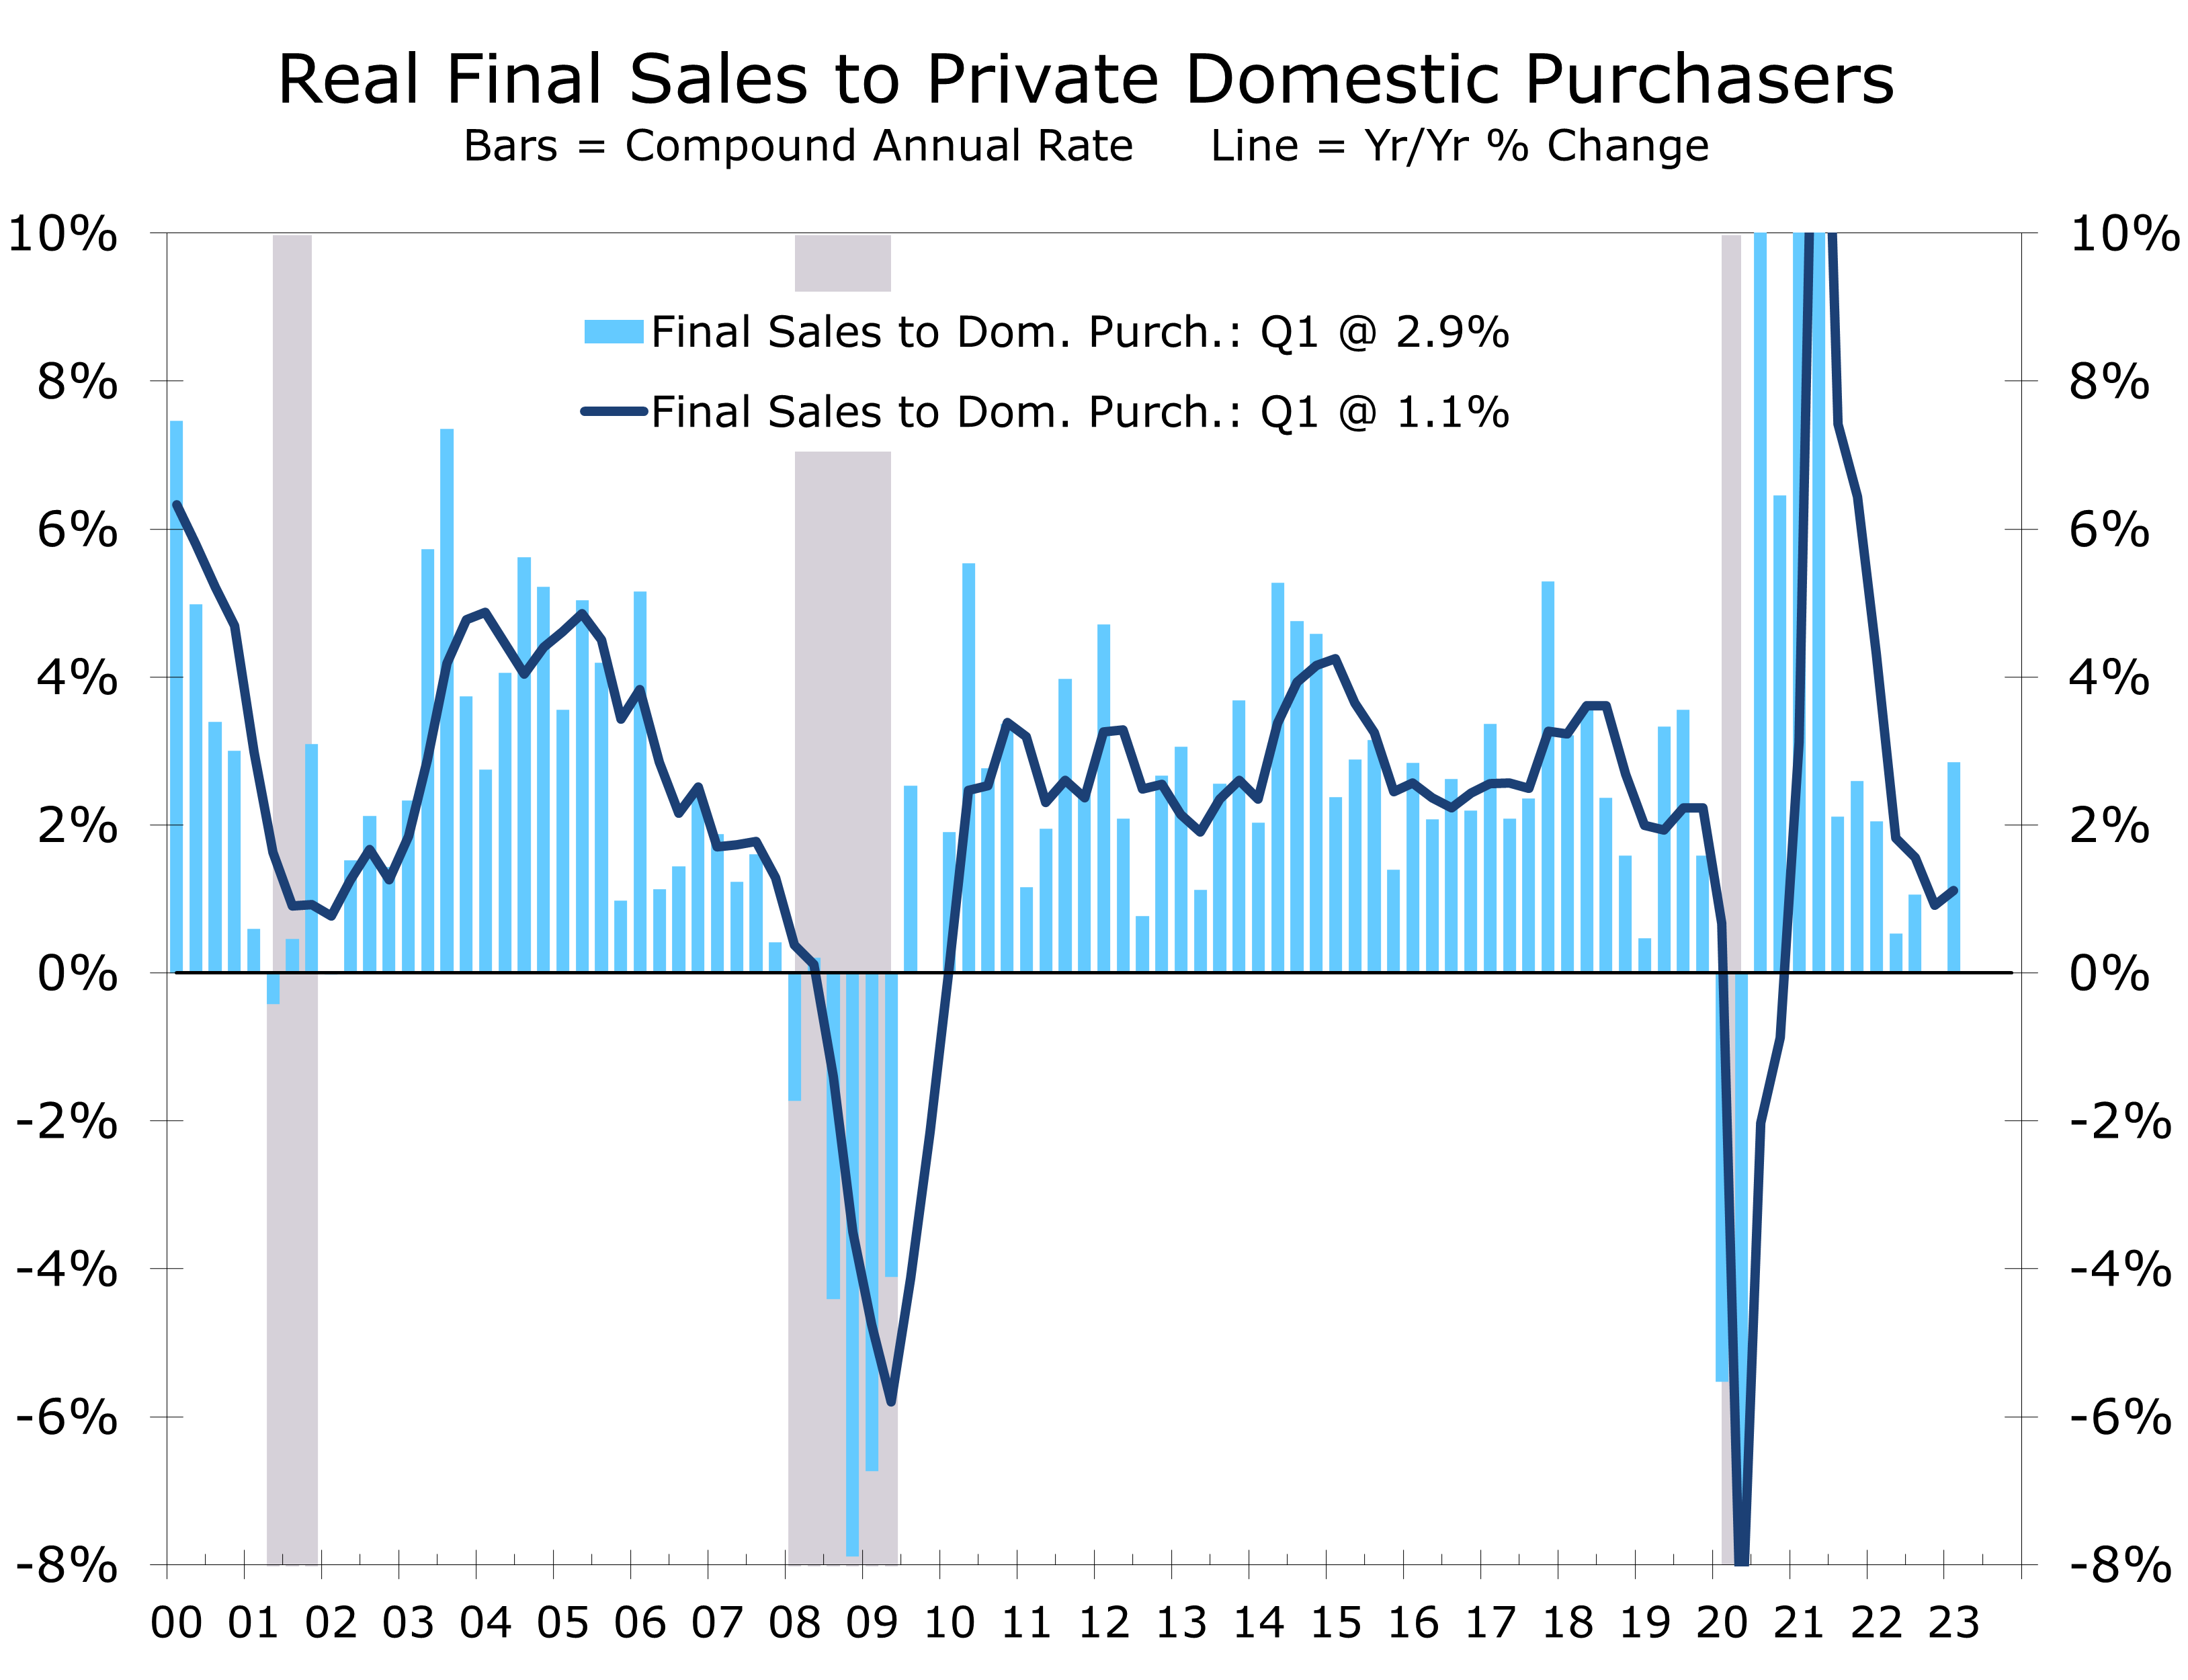
- Real final sales to domestic purchasers, or private final demand, rose at 3.2% pace, precisely in line with expectations.
- There is huge mismatch between output and employment, with employers adding more than a million jobs in Q1, while output climbed at just a 1.1% pace.
The advance report on first quarter real GDP came in on the softish side. Real GDP grew at just a 1.1% annual rate, as continued strength in consumer spending was largely offset by a big drawdown in inventories.
The underlying details of first quarter GDP were generally more positive. The large drawdown in inventories sliced 2.3 percentage points off overall growth. Inventories have been unusually volatile since the pandemic began. Much of the reduction in Q1 occurred at wholesalers and manufacturers. Real final sales to private domestic purchasers, which is our preferred measure of final demand, rose at a 2.9% annual rate in Q1 and is now up just 1.4% year-to-year.
While there is undoubtedly still more work to be done to bring inventories back in line with demand, particularly at retailers, a significant portion of this correction now appears to be behind us. The drawdown in inventories has weighed on industrial production in recent months.
The Fed has achieved a soft landing but needs to maintain it to pull inflation back to target.
Economic growth now appears to have slowed to a pace consistent with a soft landing. Getting there, however, was the easy part. With the core PCE deflator still up 4.9% over the past year, the Fed will likely need to hold growth at its current pace or less for at least a year to bring inflation down close enough to its 2% target that they can begin to ease.
Real personal consumption grew at a 3.7% annual rate, marking the strongest quarterly gain for consumer spending since the second quarter of 2021, when the last round of stimulus checks sent spending into overdrive. Transfer payments also helped support Q1 spending, as a big rise in social security payments fueled a surge in leisure and travel at the start of the year. Light vehicle sales were another bright spot. Spending on big-ticket items surged at a 16.9% annual rate, the strongest rise since the first quarter of 2021. Spending on nondurables rose at a 0.9% pace.
The spending spree lost momentum in February and March, however, and personal consumption will likely rise only marginally in Q2 as consumers have increasingly been tapping credit cards to support spending. Technical factors will also make it harder for spending to add to GDP growth in Q2. Unseasonably mild weather likely pulled some spending forward into Q1, which will weigh on spending this spring.
Consumer spending appears to be losing momentum, as consumers have increasingly been tapping credit cards to support spending.
The slide in inventories subtracted 2.3 percentage points off first quarter GDP growth. Wholesalers and manufacturers accounted for most of the drop, with a jump in shipments of commercial aircraft helping clear out inventories at aircraft manufacturers.
Sustaining a soft landing is difficult, as once economic growth slows that deceleration tends to become self-reinforcing. We are already seeing considerable knock-on effects as a growing number of businesses announce spending cuts and layoffs. Business fixed investment slowed to a 0.7% pace in Q1, with equipment purchases declining at a 7.3% pace. That drop was offset by another large gain in nonresidential structures, much of which appears to be fueled by the Inflation Reduction Act and CHIPs act.
Sustaining a soft landing is difficult, as the deceleration tends to become self-reinforcing.
Government outlays rose strongly in Q1, with federal outlays rising at a 7.8% clip. Defense spending rose at a 5.9% pace, while nondefense outlays surged 10.3%, marking their second consecutive double-digit gain. The surge in federal outlays is at the center of the current battle over the debt ceiling. We suspect some agreement will be reached, restraining nondefense outlays later this year and into 2024. Constraints on federal spending might make the soft landing a little softer but also make the Fed’s job a little easier, possibly even pulling interest rate cuts up a quarter or two.
Disclaimer: This publication has been prepared for informational purposes only and is not intended as a recommendation offer or solicitation with respect to the purchase or sale of any security or other financial product nor does it constitute investment advice.
Housing Starts Decline Slightly in March
Headwinds, Tailwinds and Crosswinds
- Overall housing starts fell 0.8% in March to a 1.42-million-unit annual rate.
- Single-family starts rose 2.7% to an 861,000 unit pace, while multifamily starts fell 5.9% to a 559,000-unit pace.
- Permits moved more emphatically, with single-family permits rising 4.1% to an 818,000-unit pace, and multifamily permits tumbling 22.1% to a 595,000-unit pace.
- Milder weather boosted single-family starts earlier this year, so starts picked up less in March than usual, leading to a smaller seasonally adjusted gain.
- Permits are less impacted by the weather.
- The larger drop in multifamily permits might reflect some pause on the part of developers, amidst growing backlogs, slower rent growth and tightening credit.
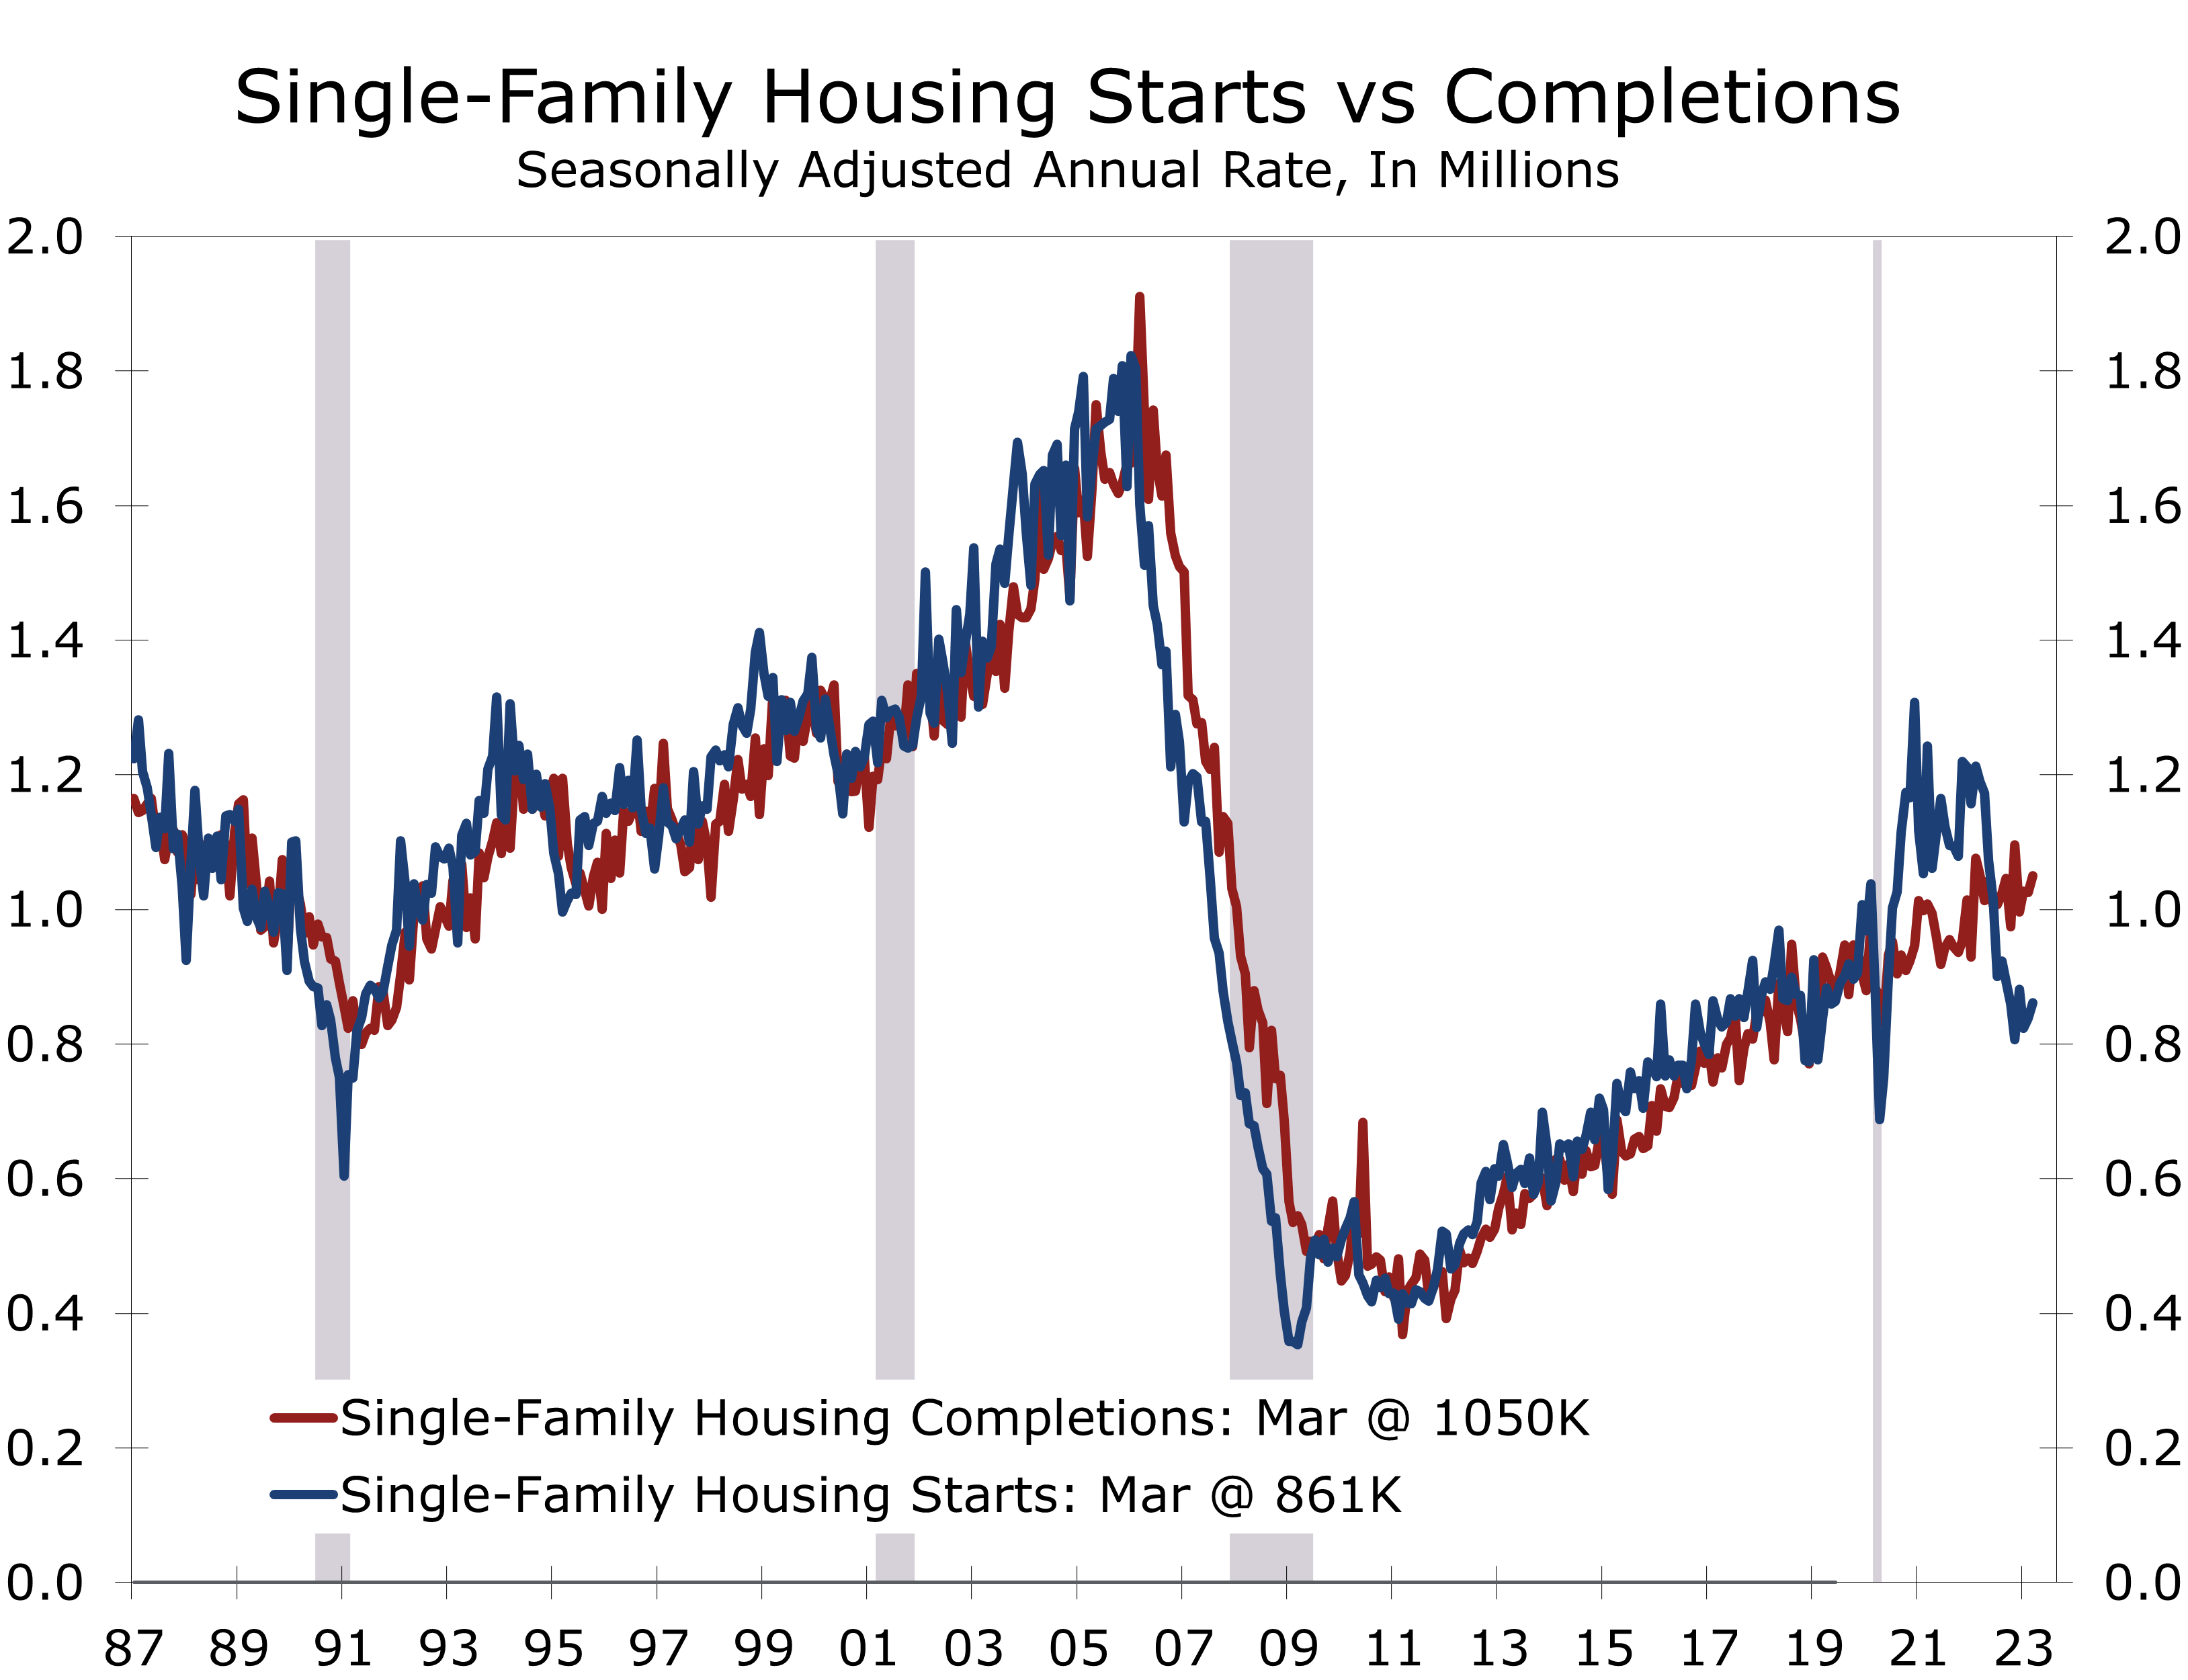
- Single-family completions are now running well ahead of starts, helping clear backlogs.
- The backlog of apartment developments continues to increase and is now greater than any time since November 1973.
While overall housing starts fell slightly in March, there is a great deal of activity beyond the headlines. Overall starts fell 0.8% to a 1.42-million unit pace, with a modest 2.7%-rise in single-family starts partially offsetting a larger 5.9%-decline in multifamily starts.
Single-family starts are benefitting from lower mortgage rates, which have boosted new home sales. The National Association of Home Builders (NAHB)/Wells Fargo Home Market Index (HMI) rose 1 point in April to 45, marking its fourth consecutive increase. Home builders are feeling increasingly confident as mortgage rates appear to have hit a ceiling at around 7% last fall and have since fallen to around 6.5%. Rates are low enough to entice buyers into the market but are still well above the rate many homeowners have on their existing mortgages, which is keeping a lid on inventories of existing homes.
Builders are still discounting homes, but discounts are less prevalent and less generous.
Home builders are still discounting homes, primarily through mortgage rate buydowns, but discounts are less prevalent than a few months ago and less generous. The share of builders discounting prices fell to 30% in April, compared to 31% in March and February, and 35% in December and 36% in November.
The upturn in the HMI preceded a turnaround in housing starts. Unseasonably mild weather exaggerated the extent of the improvement earlier this year, which will tend to subtract from starts this spring.

Permits provide a clearer indication of where the housing market is today. Single-family permits rose 4.1% in March, following an 8.9% rise the prior month. The latest permit data likely reflect a turning point of sorts. Single-family permits most recently peaked in February of 2022 and declined steadily until January of this year, tumbling a cumulative 40%. So even after healthy back-to-back gains, single-family permits through the first three months of 2023 are running 31.2% below their year ago pace.
Home builders were bracing for a hard landing late last year when mortgage rates spiked.
Home builders were bracing for a hard landing late last year when mortgage rates spiked and briefly topped 7%. Inventories of unsold homes increased, as many would-be buyers were priced out of the market. Builders slowed new construction and ramped up incentives late last year, effectively buying down mortgage rates and discounting prices in some cases. Those incentives worked, and the correction in single-family construction has now largely been played out.
The correction in the multifamily market, however, is just getting started. Multifamily permits peaked for the cycle back in December 2021 at a 720,000-unit pace and declined through much of 2022. Permits rose again late last year, however, as developers raced to get projects started ahead of tightening credit conditions.

Apartment development is clearly overheated from an overall perspective. The pipeline of projects under construction has risen to 958,000 units – the most since November 1973. The backlog has set off alarm bells, as demand for apartments has shown signs of cooling and concerns about the health of the economy and banking system have increased.
The apartment market today is much different than it was back in 1973.
Much of apartment construction in the early 1970s was in low-rise garden apartments in suburban areas that were completed relatively quickly. Today, a much larger share of apartment construction is mid-rise and high-rise units that take considerably longer to build. As a result, we are less likely to face a sudden deluge of apartments. This is not to say that the apartment will not become overbuilt. Vacancy rates will almost certainly rise as the economy slows further and rents will likely decline modestly.

The correction in the single-family market is now well underway, with starts now running roughly 200,000 units below completions, which is helping reduce the backlog of homes under construction.
Disclaimer: This publication has been prepared for informational purposes only and is not intended as a recommendation offer or solicitation with respect to the purchase or sale of any security or other financial product nor does it constitute investment advice.
Consumer Prices Ease Slightly in March
Inflation Continued to Decelerate in March
- The Consumer Price Index rose 0.1% in March and is now up 5.0% year-to-year.
- Prices excluding food and energy items, rose 0.4% and are now up 5.6% year-to-year.
- Energy prices fell 3.5% in March, with gasoline prices plunging 4.6%.
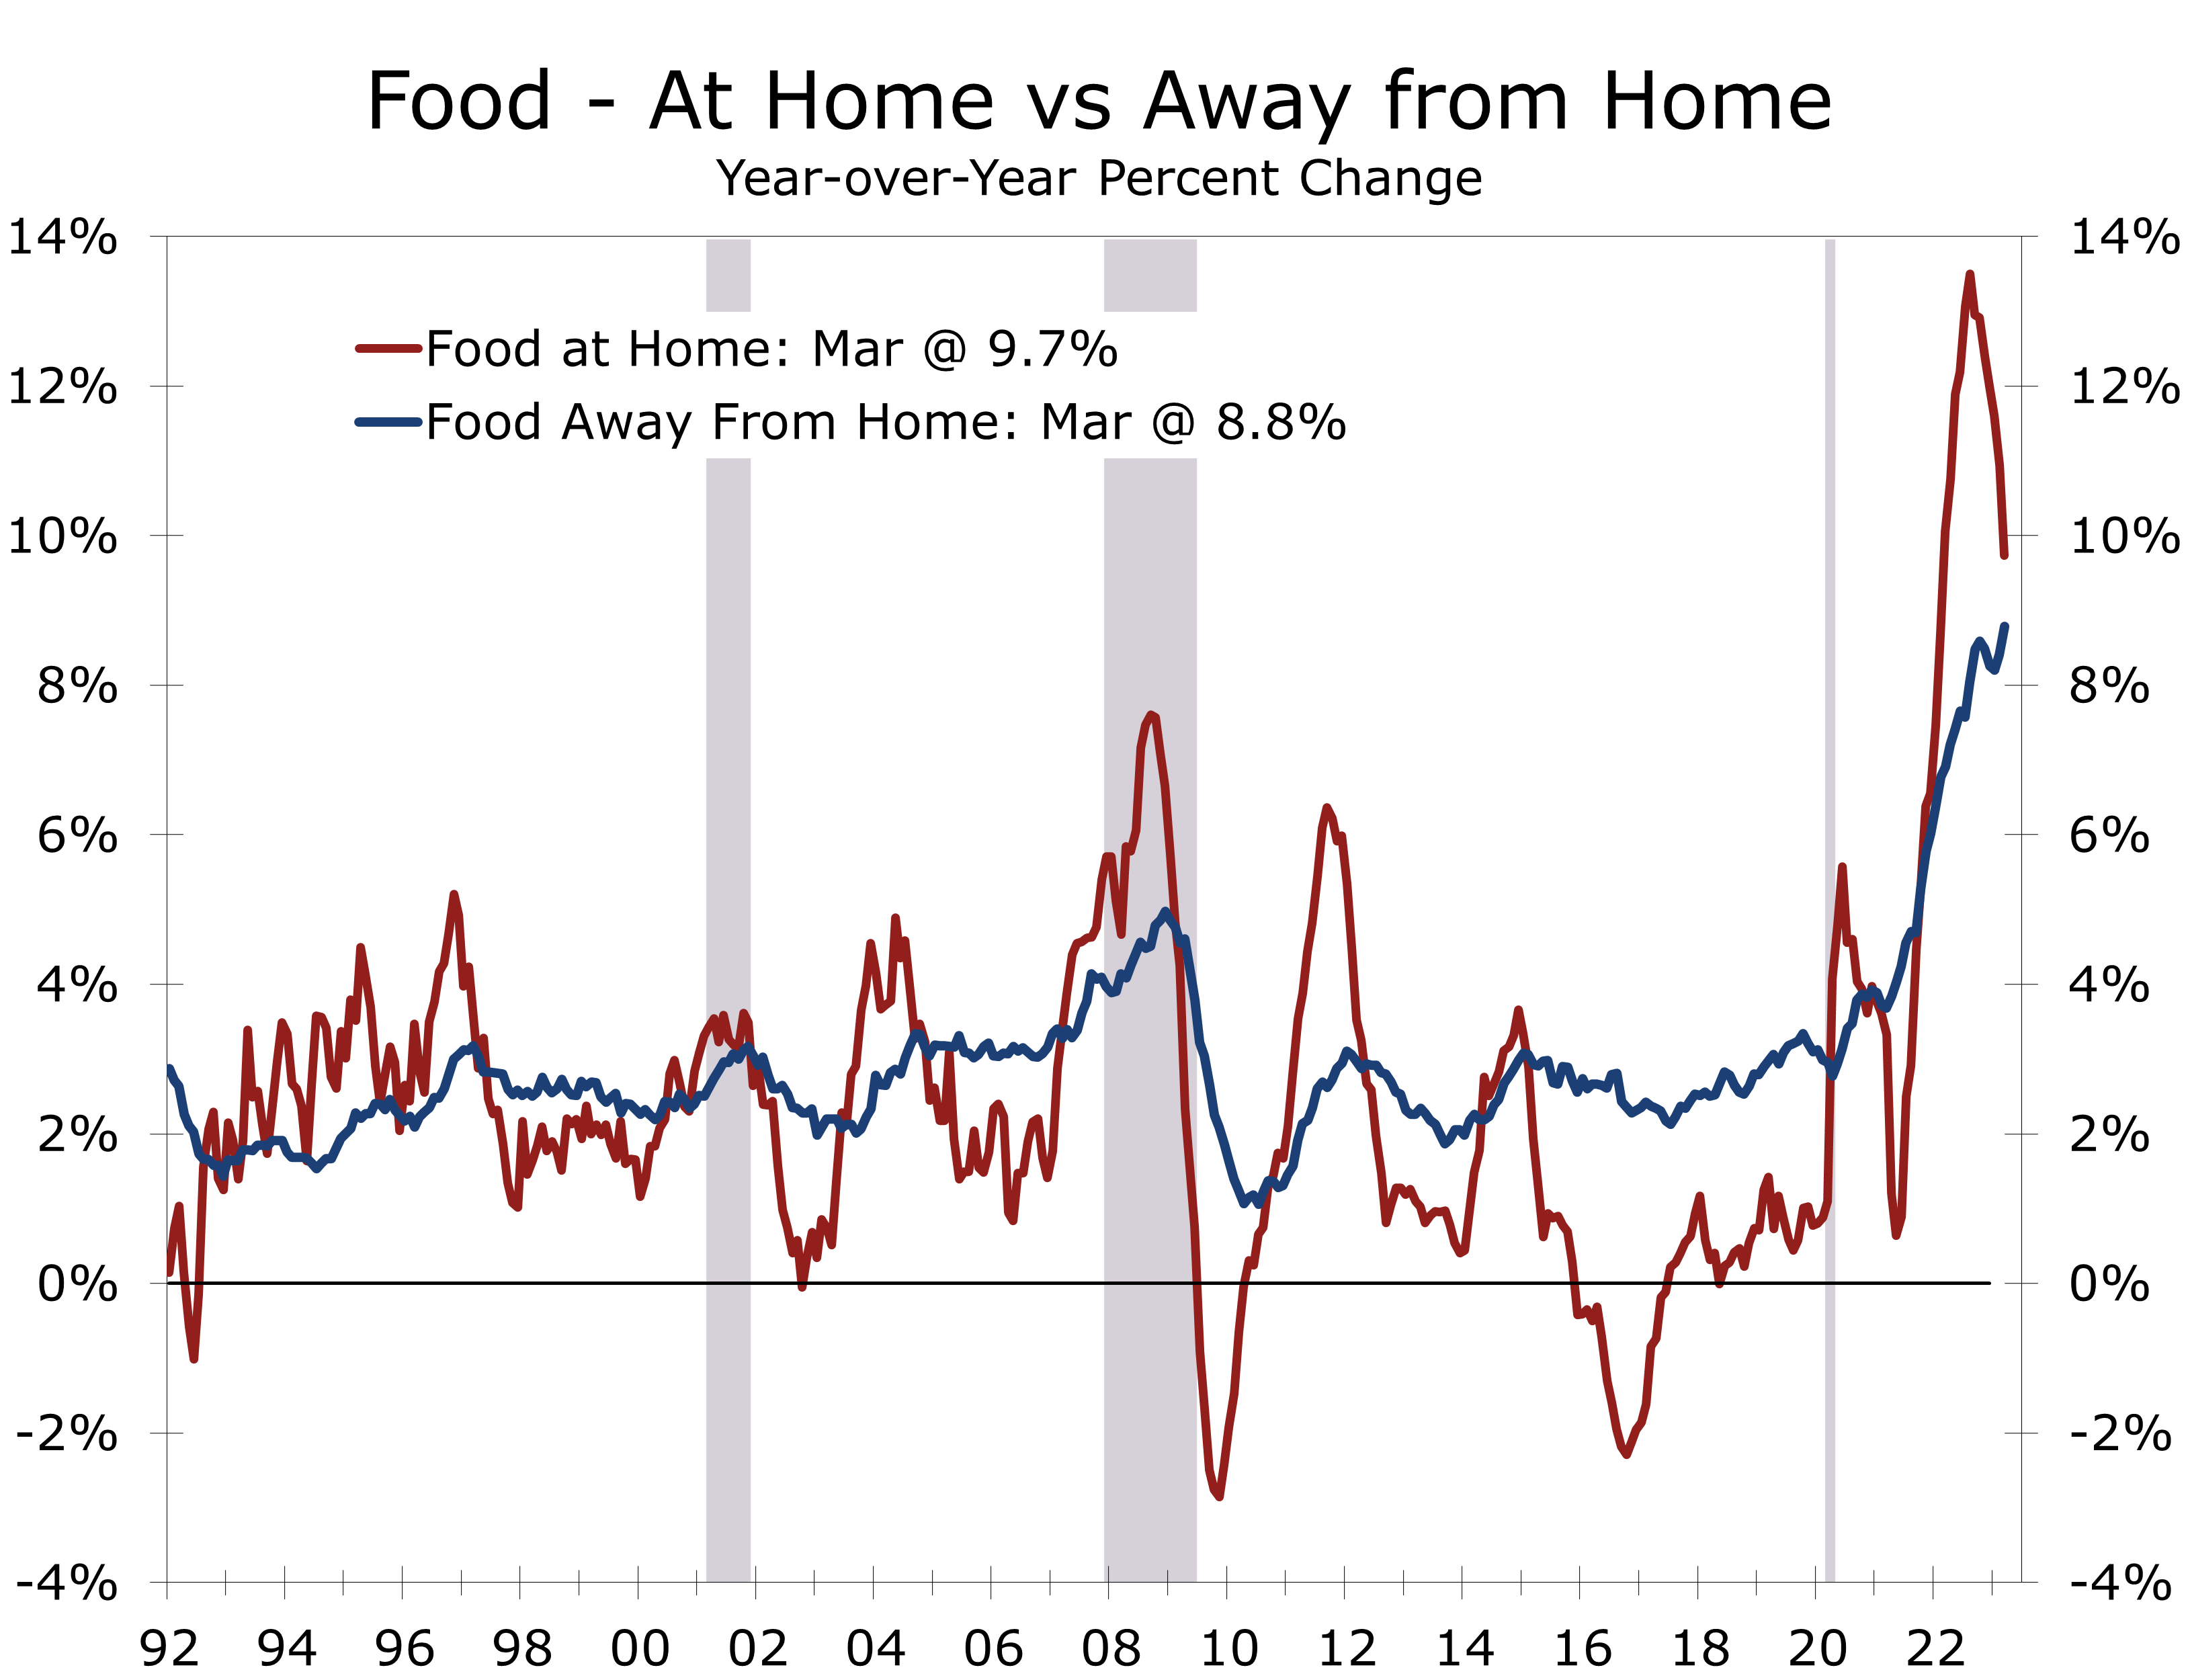
- Food prices were unchanged, as a 0.6% rise in prices at restaurants was offset by a 0.3% drop in prices at the grocery store.
- Shelter costs rose 0.6% in March, marking a slight deceleration from the three prior months. Both rent and owners’ equivalent rent rose 0.5%, while lodging cost rose 2.7%.
- Used car prices fell 0.9%, continuing its recent string of declines. Prices at used-car auctions have been rising, however, so this trend appears unsustainable.
- Prices for motor vehicle insurance rose 1.2% in March and are up 15% year-to-year.
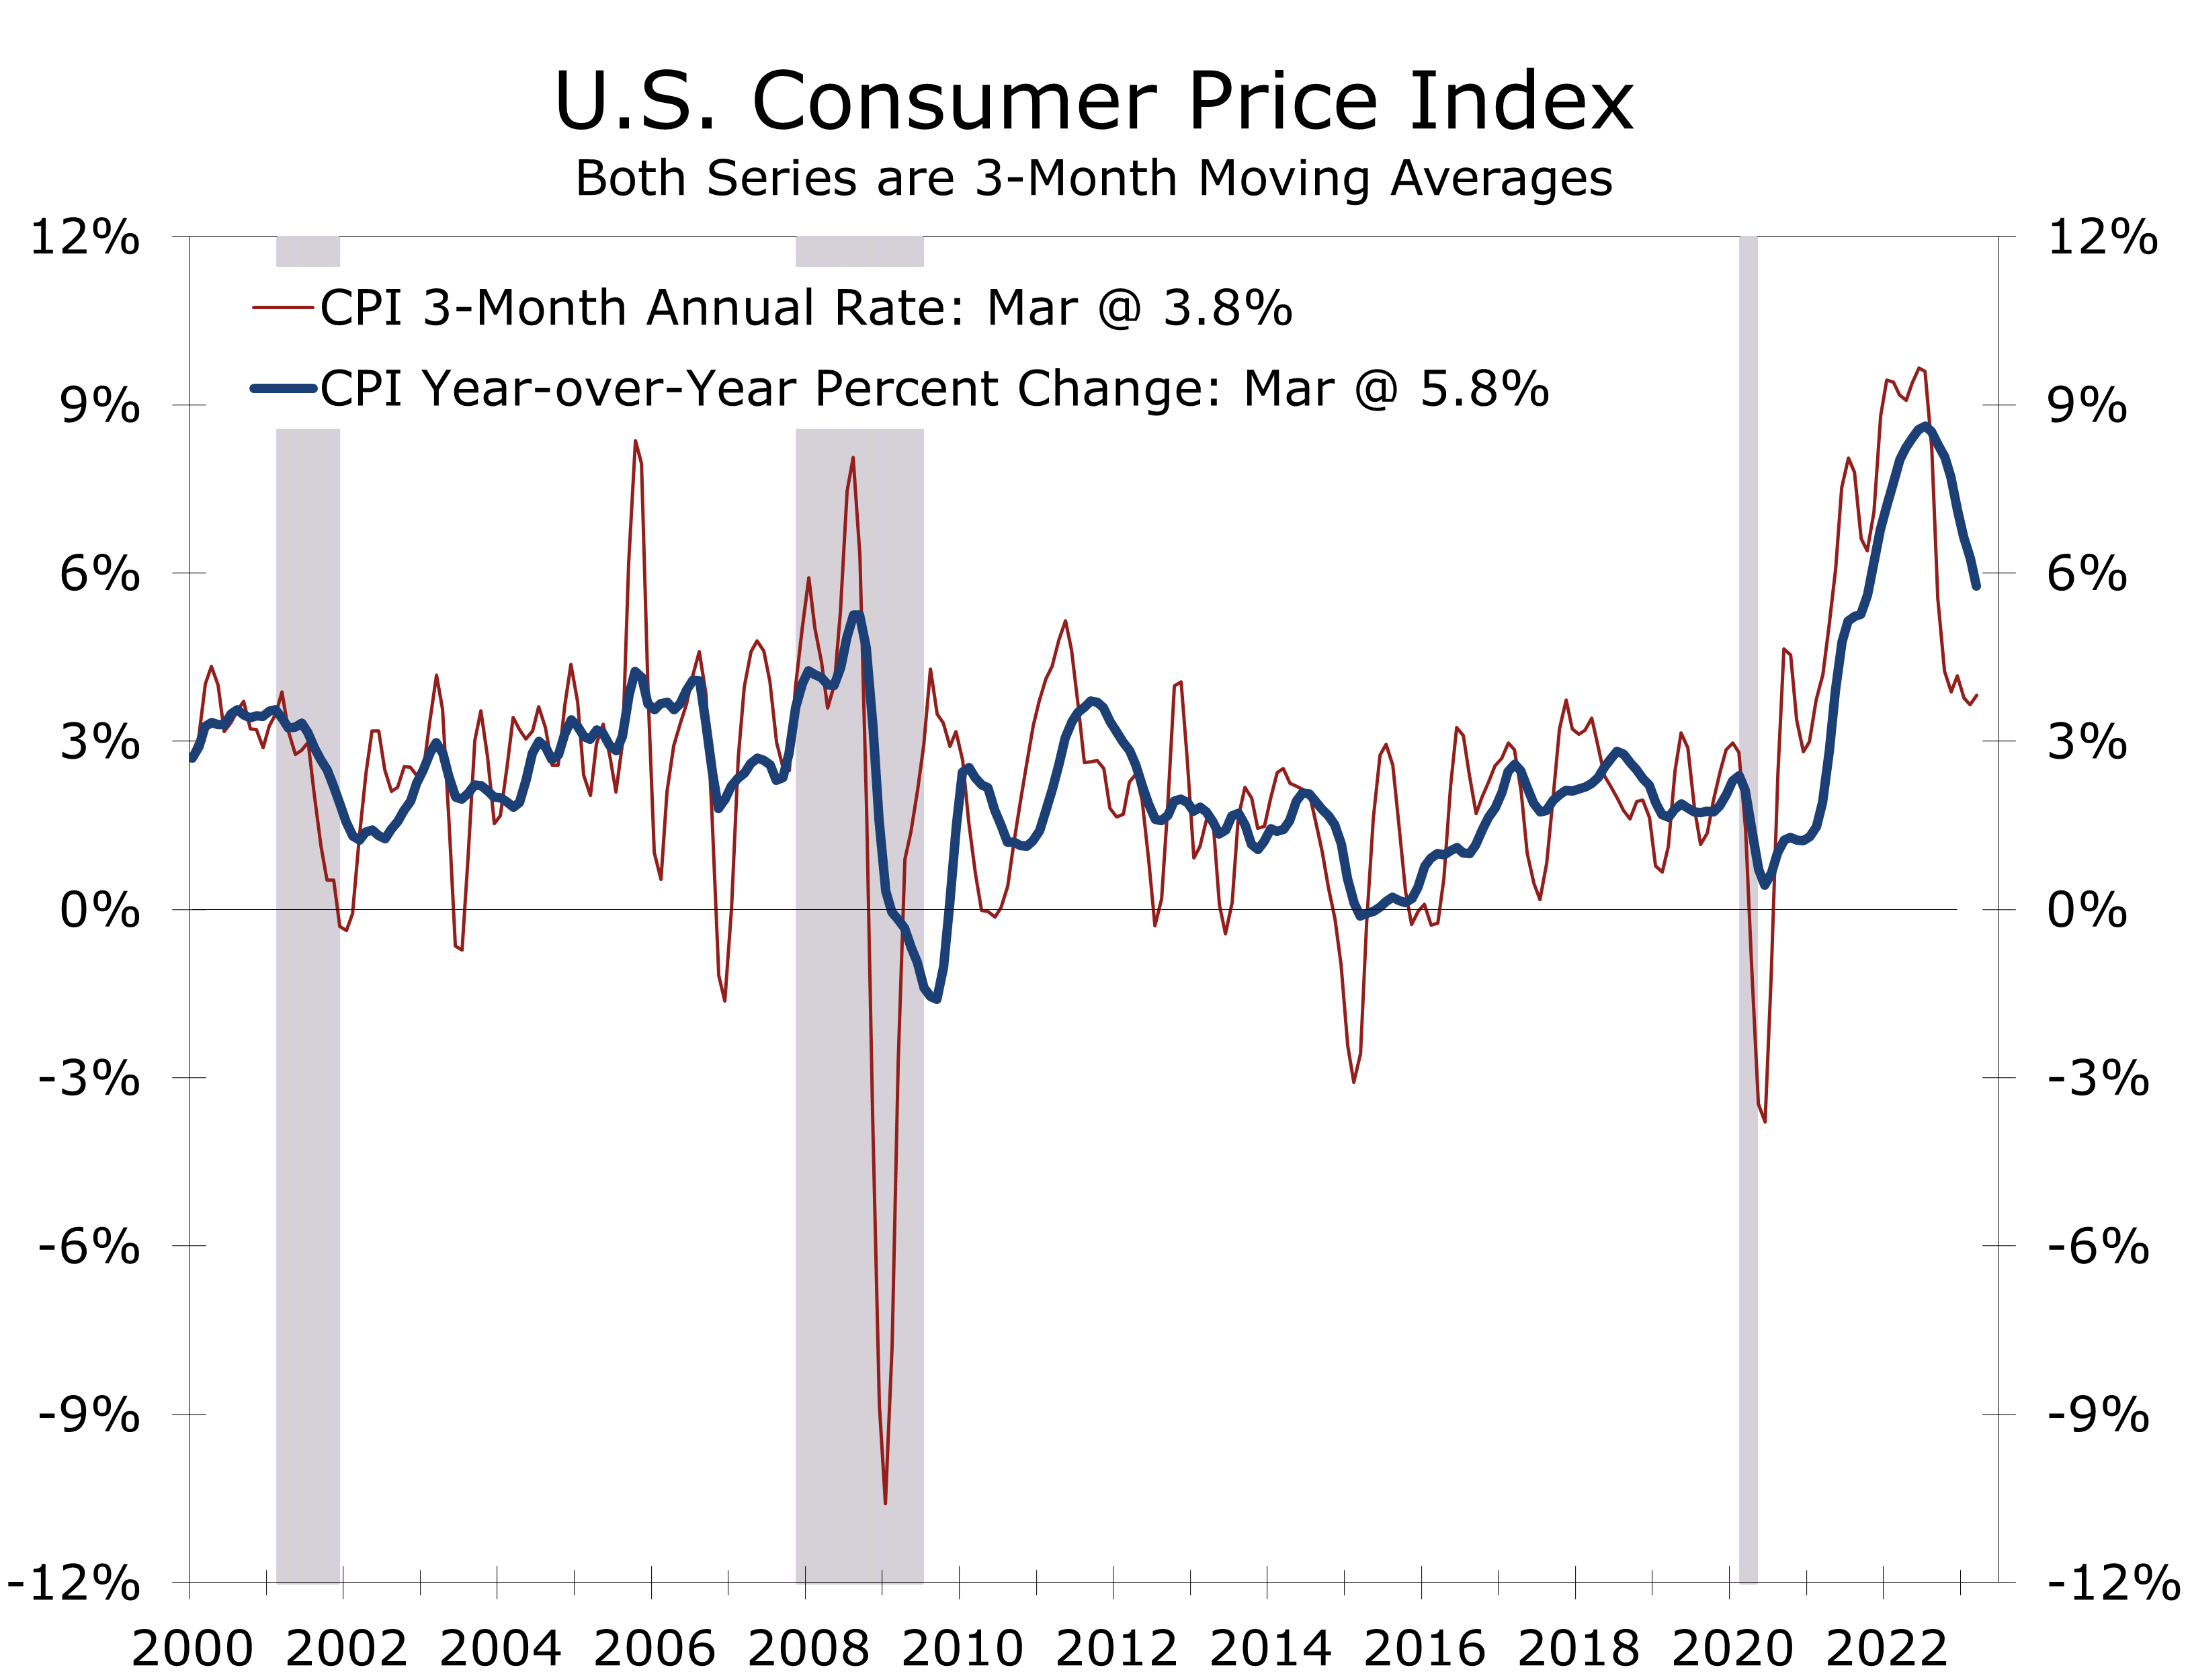
Consumer prices rose more modestly in March, with the headline Consumer Price Index rising just 0.1% following a 0.4% gain in February and 0.5% gain January. Prices have risen at a 3.6% annual rate over the past three months and are now up 5.0% over the past year. The year-to-year rate has been steadily decelerating since it peaked last June, although the pace of deceleration has ebbed.
The moderation in inflation is a relief to consumers and the financial markets. Prices of frequently purchased items such as groceries and gasoline eased notably. While overall food prices were unchanged, prices at grocery stores fell 0.3%. Prices for meats, poultry, fish and eggs fell 1.4%, with declines evident across every major category. Eggs saw the largest drop, with prices falling 10.9%, following a 6.7% drop the prior month. Prices are still up a whopping 36% over the past year, however. Prices for fresh fruit and vegetables fell 1.7% in March and are down 0.2% from the prior year.
Prices eased for many items consumers buy frequently, such as gasoline and groceries.
Energy prices fell 3.5% in March, with prices for motor fuels falling 4.7% and prices for fuel oil falling 2.5%. Prices for energy services also declined, as natural gas prices fell 7.1% and prices for electricity fell 0.7%.
The slide in gasoline prices might come as a surprise to folks that fill up their tanks regularly. Prices for all grades of gasoline have been rising in recent weeks. The increases, however, are less than they usually are this time of year, resulting in a seasonally adjusted decline. Oil prices have risen more recently, suggesting we will likely see gasoline prices rebound.
Energy prices fell 0.6% in February, following a 2% rise the prior month. The price of natural gas declined 8%, marking the largest 1-month drop since October 2006. The price of fuel oil fell 7.9% in February. Demand for both fell sharply this past month, as much of the country enjoyed unseasonably mild weather. Gasoline prices rose 1% in February, following a 2.4% rise the prior month.
Prices excluding food and energy rose 0.45% in February and remain up 5.5% year to year. Prices for core goods were unchanged in February and are now up just 1% year-to-year. Much of the deceleration in core goods prices is due to falling prices for used cars and trucks, which fell 2.8% in February and are down 13.6% over the prices year.
Shelter costs continue to increase, reflecting past increases in market rents.
Prices for services excluding energy rose 0.6% in February, with high shelter costs accounting for much of the gain. Shelter costs rose 0.8% in February and are up 8.1% year to year. Rent of primary residence and owners’ equivalent rent account for the bulk of shelter costs. Both measures are calculated by the BLS using a complex formula that appropriately captures the costs of housing for renters and homeowners but tends to lag changes in market rents.
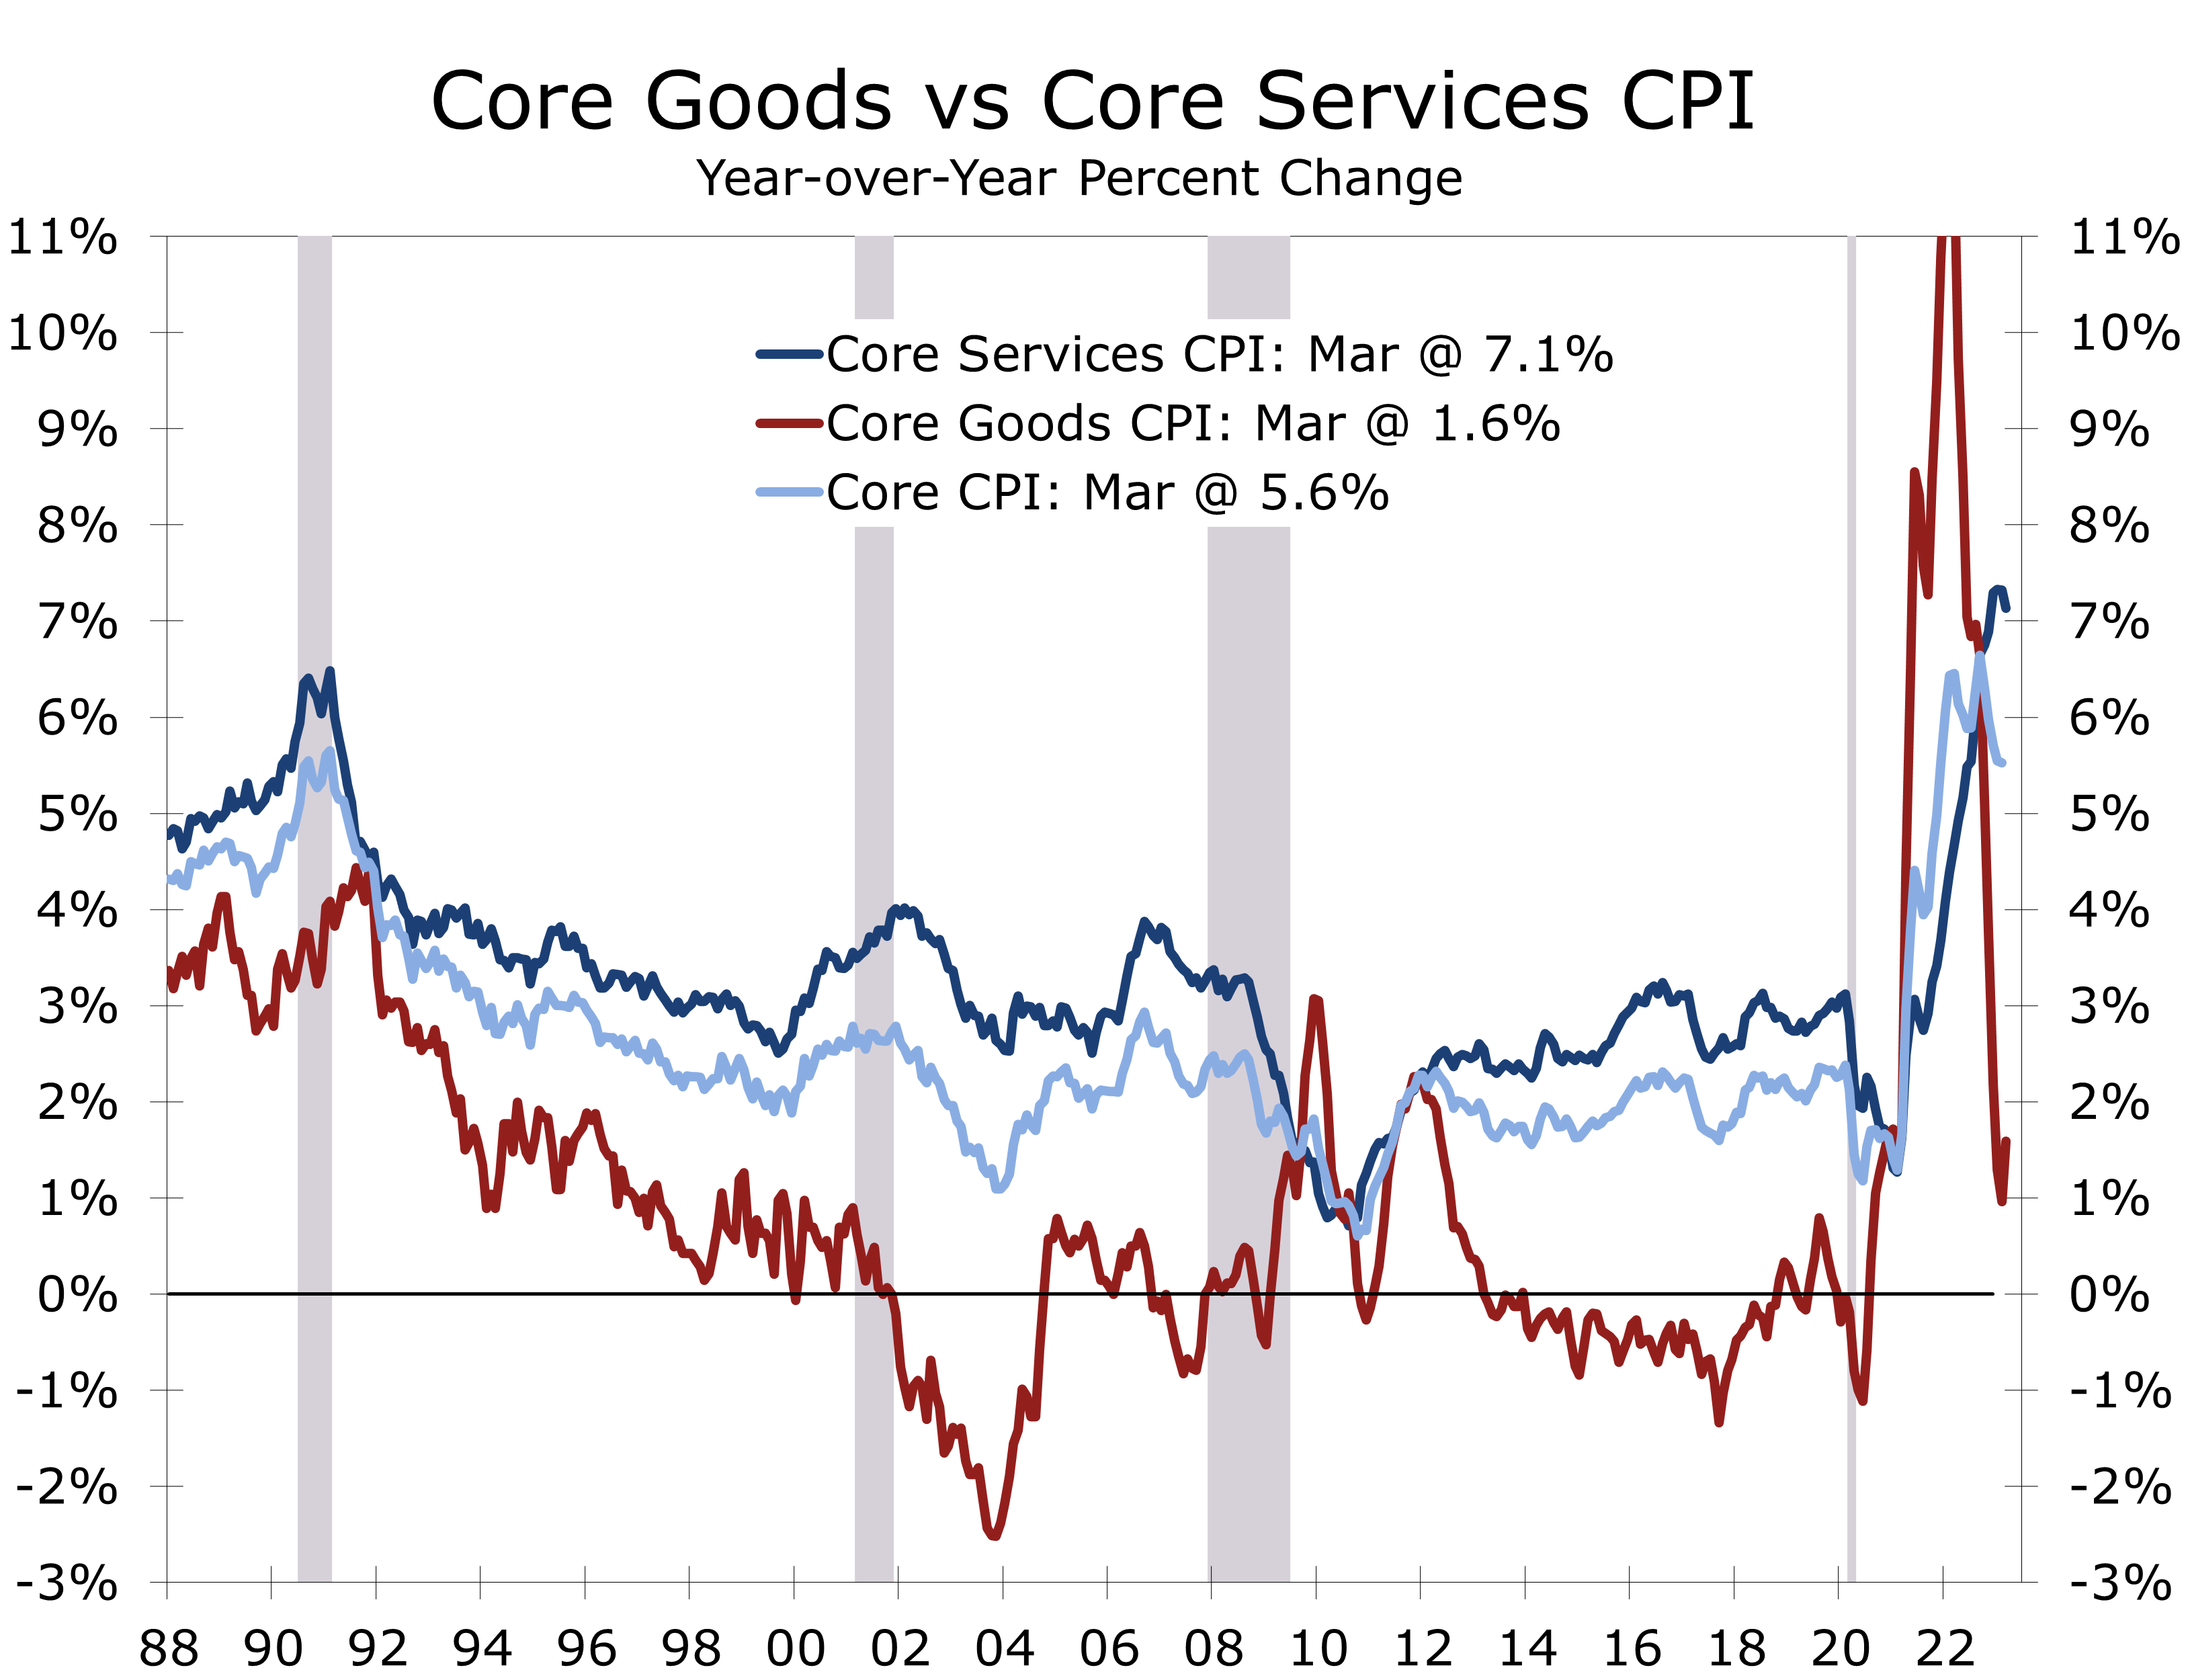
Prices for services, less energy, rose 0.4% in March and are up 7.1% year-to-year. Most of that increase is due to higher shelter costs, which are coming down. The BLS measure of rents and owners’ equivalent rent trails market-based rent measures, all of which have moderated substantially in recent months so we should see continued relief in the BLS measures.
Beyond shelter, services prices are proving persistent. Services prices, excluding energy and shelter, rose 0.4%. The sharpest price gains continue to be in labor-intensive areas or areas still enjoying a strong rebound from the pandemic. Travel in leisure spending is a notable hotspot, with airline fares rising 4.0% in March following a 6.4% rise in February. Fares are up 17.7 over the past year. Prices of other personal services rose 0.5% in March and are up 5.3% over the past year.
Taming services prices is essential if inflation is to return to the Fed’s 2% target.
While the March CPI data was in line with consensus expectations, the markets breathed a sigh of relief as there were no big negative surprises. Inflation appears to be moderating enough that the Fed will likely only need to hike rates 1 or 2 more times this cycle.
Disclaimer: This publication has been prepared for informational purposes only and is not intended as a recommendation offer or solicitation with respect to the purchase or sale of any security or other financial product nor does it constitute investment advice.
Small Business Optimism Slips In March
Business Owners Remain Weary
- The National Federation of Independent Business (NFIB) Small Business Optimism Survey fell 0.8 points to 90.1 in March, more than reversing the prior month’s rise.
- Small business owners remain deeply concerned about the overall economy, with the share of owners expecting the economy to improve over the next 6 months remaining unchanged at -47%.
- Small business owners are continuing to get squeezed by weaking sales and stubborn wage costs. The share of firms expecting real sales to increase fell 6 points to -15%, while 42% of business report hiking compensation.
- The net share of businesses reporting they raised prices over the past 3 months fell 1 point to 37%, the lowest since April 2021.
- The share of businesses reporting their last loan was harder to secure than previous attempts rose 4 points to 9%.
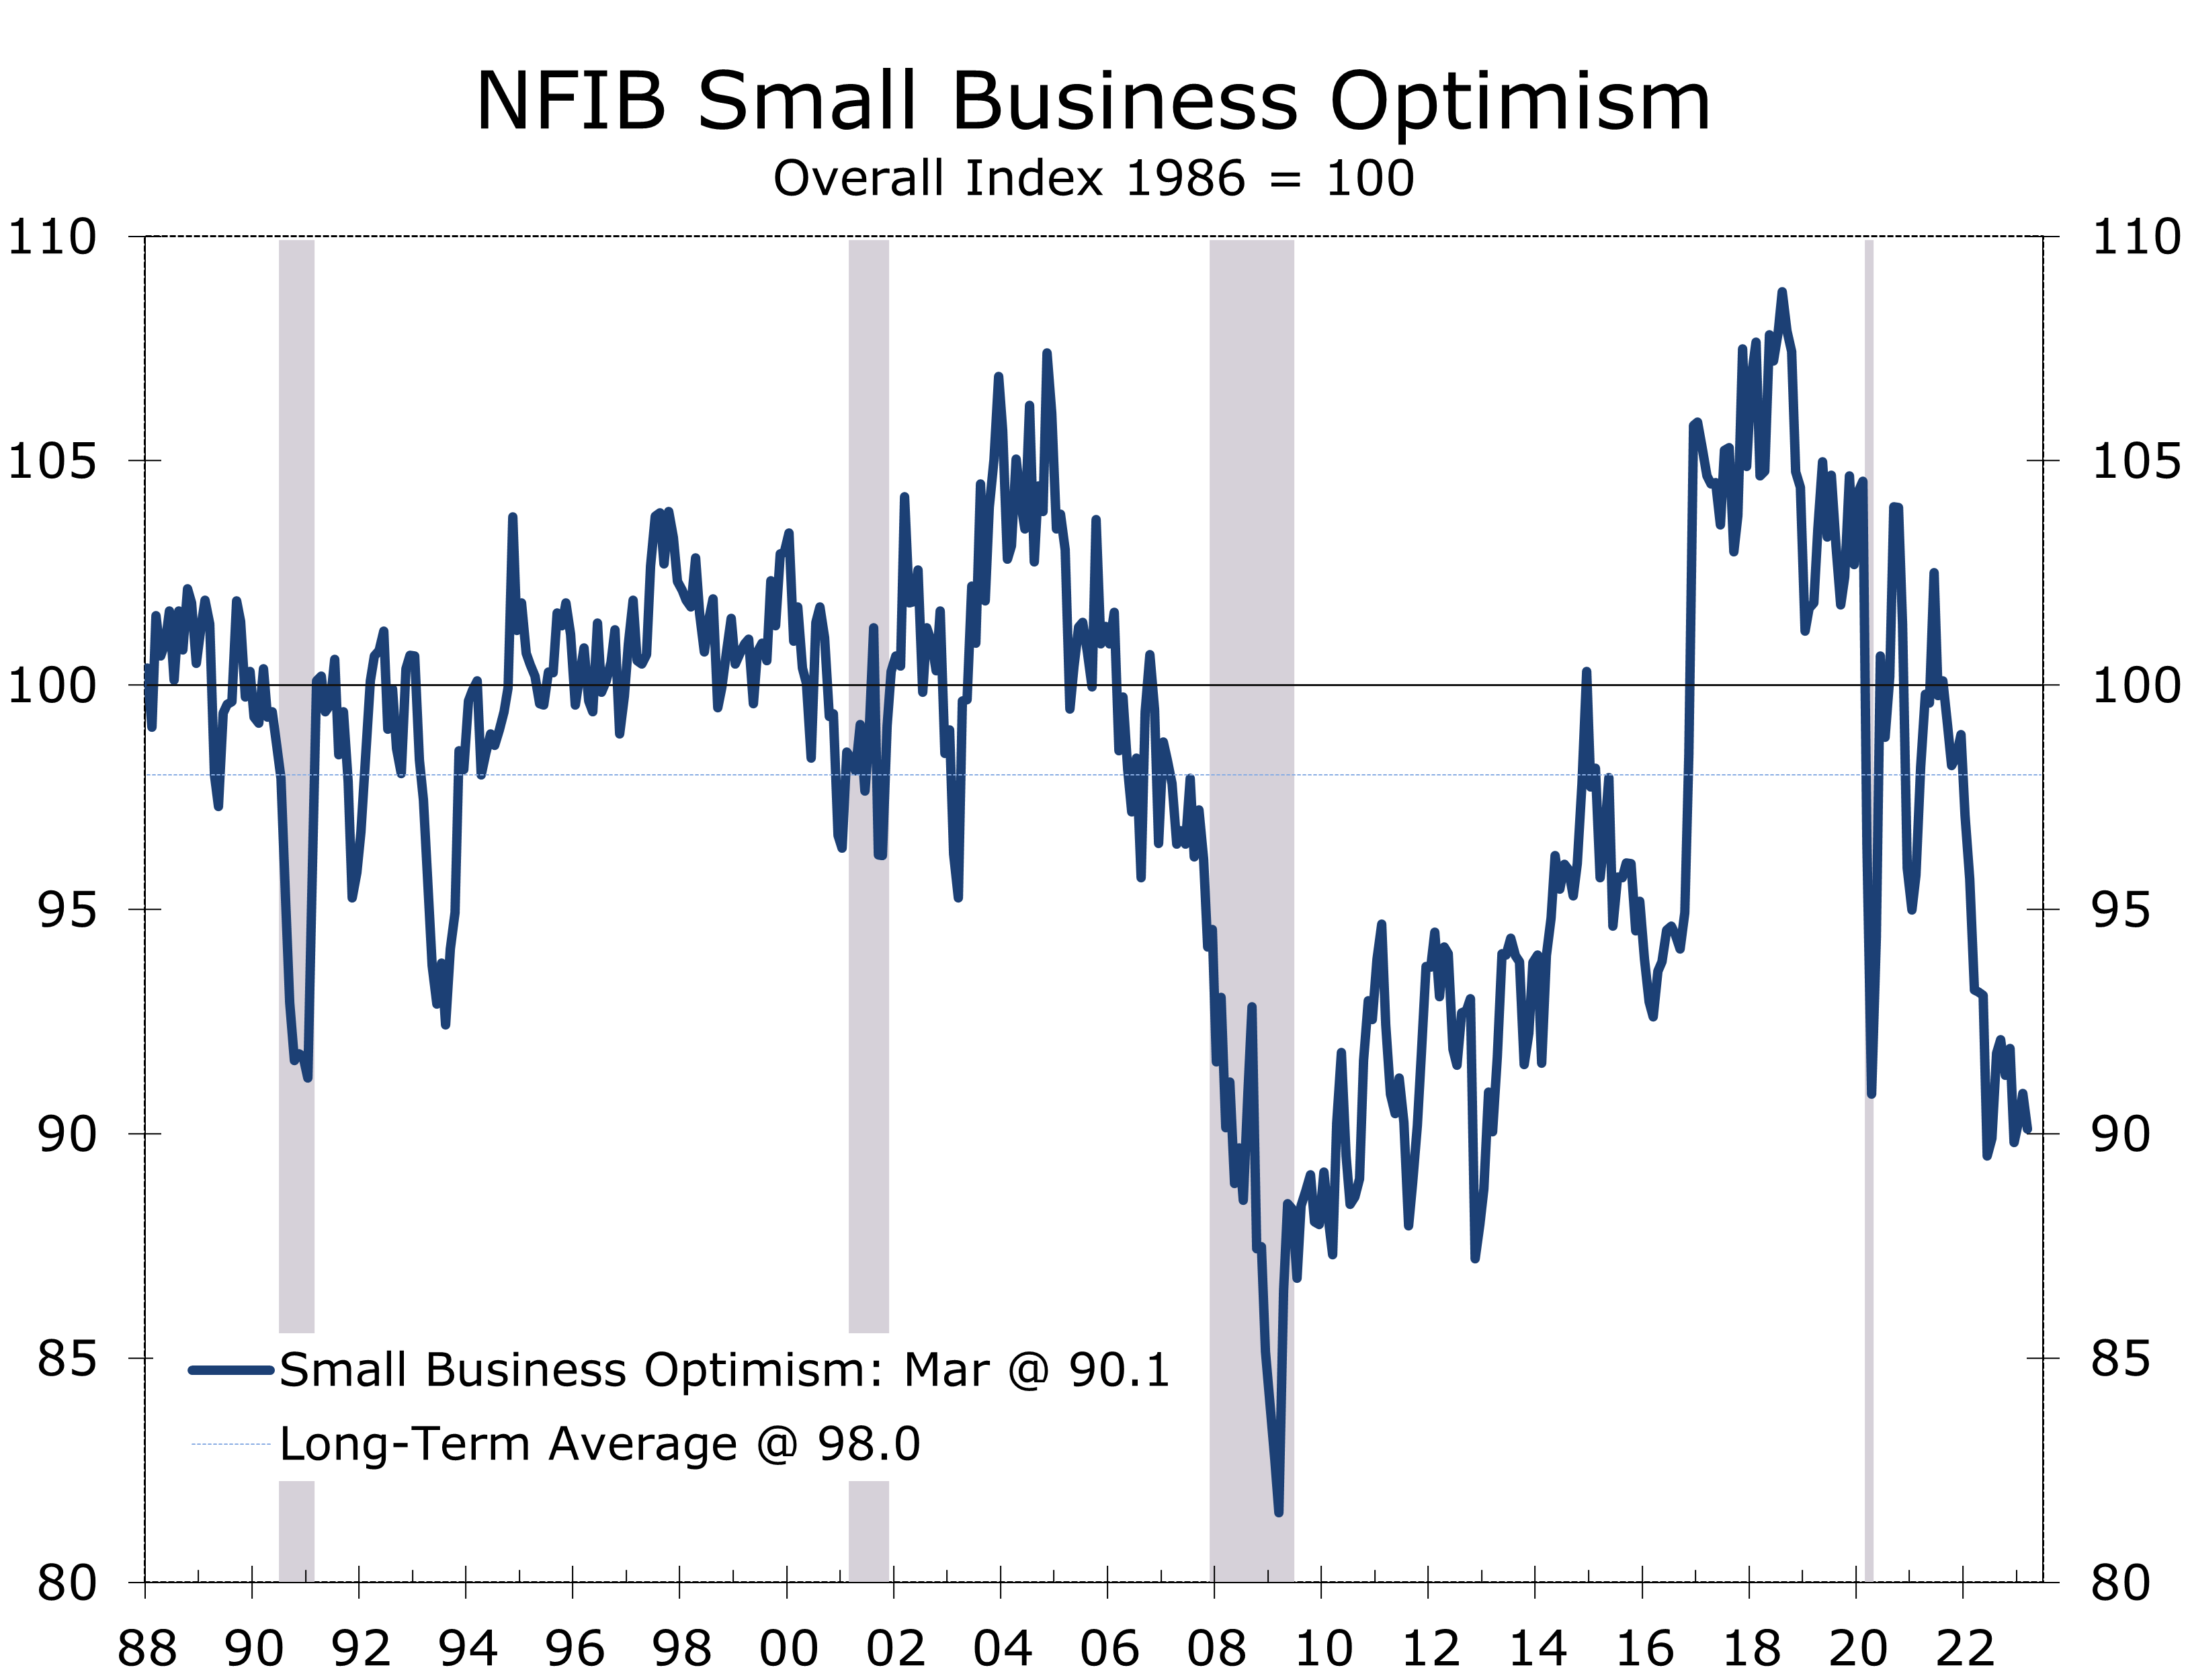
Small Business Optimism fell 0.8 points in March to 90.1. The Optimism Index has remained below its long-term average for the past 15 months. Small business owners are increasingly frustrated that slower economic growth is negatively impacting their sales much more than it is helping alleviate long running hiring challenges or reducing labor and input costs.
Six of the Index’s 10 components fell in March, led by a 6-point drop in expected sales and a 4-point drop in both the share of business owners that feel now is a good time to expand and the share with current job openings. Expected credit conditions also deteriorated, falling 3 points to -9%. Plans to increase employment and plans to make capital expenditures fell 2 points and 1 point, respectively.
On the plus side, the share of small business owners that feel current inventories are too low rose 5 points to 1%. Coincidentally, the share expecting to increase inventories rose 3 points to a net -4%. The share of business owners stating they expect their earnings to improve also rose 5 points, although it remains deeply negative at -18%.
The NFIB index remains at levels more typically seen at the bottom of a recession.
Small business confidence has been extraordinarily weak for much of the past year and has been far weaker than the ISM survey or Consumer Confidence survey, both of which it has tracked historically closely. We suspect the discontent is due to the unusual swings in spending following the pandemic. The NFIB has closely tracked real GDP growth over this period, with real GDP rising a lackluster 0.9% over the past year.
One of the more closely watched areas of the NFIB survey this past month is the credit conditions. The March survey occurred late enough that business owners should have been aware of the collapse of Silicon Valley Bank and Signature Bank, as well as the likely implications for credit availability for their firm.
Credit conditions deteriorated in March, but they did not fall off a cliff.
The net share of business owners reporting it was harder to get a loan than it was previously rose 4 points in March to 9%. The 4-point rise marks the largest single-month gain since December 2002 and brought the series to its highest level since December 2012.
The tightening in credit is likely greater than what is shown in the latest NFIB survey. Only 26.9% of small business owners say they borrowed regularly during the past 12 months, while back in 2002 about 35% borrowed regularly. Businesses have also been reducing inventories this past year, which frees up cash and reduces borrowing needs.
That said, only 2% of owners reported that all their borrowing needs were not satisfied, down 1 point from February, and only 3% of business owners said that financing was their top business concern. The net share reporting paying a higher rate on their most recent loan rose 2 points to 26%.

The NFIB’s inflation measures have come down substantially this past year, although the improvement appears to be lessening and both measures remain high by historical standards. The NFIB survey is a diffusion index and provides insight into the breadth of price changes, as opposed to the magnitude of those changes. The breadth of price changes has been a reliable predictor of future inflation trends.
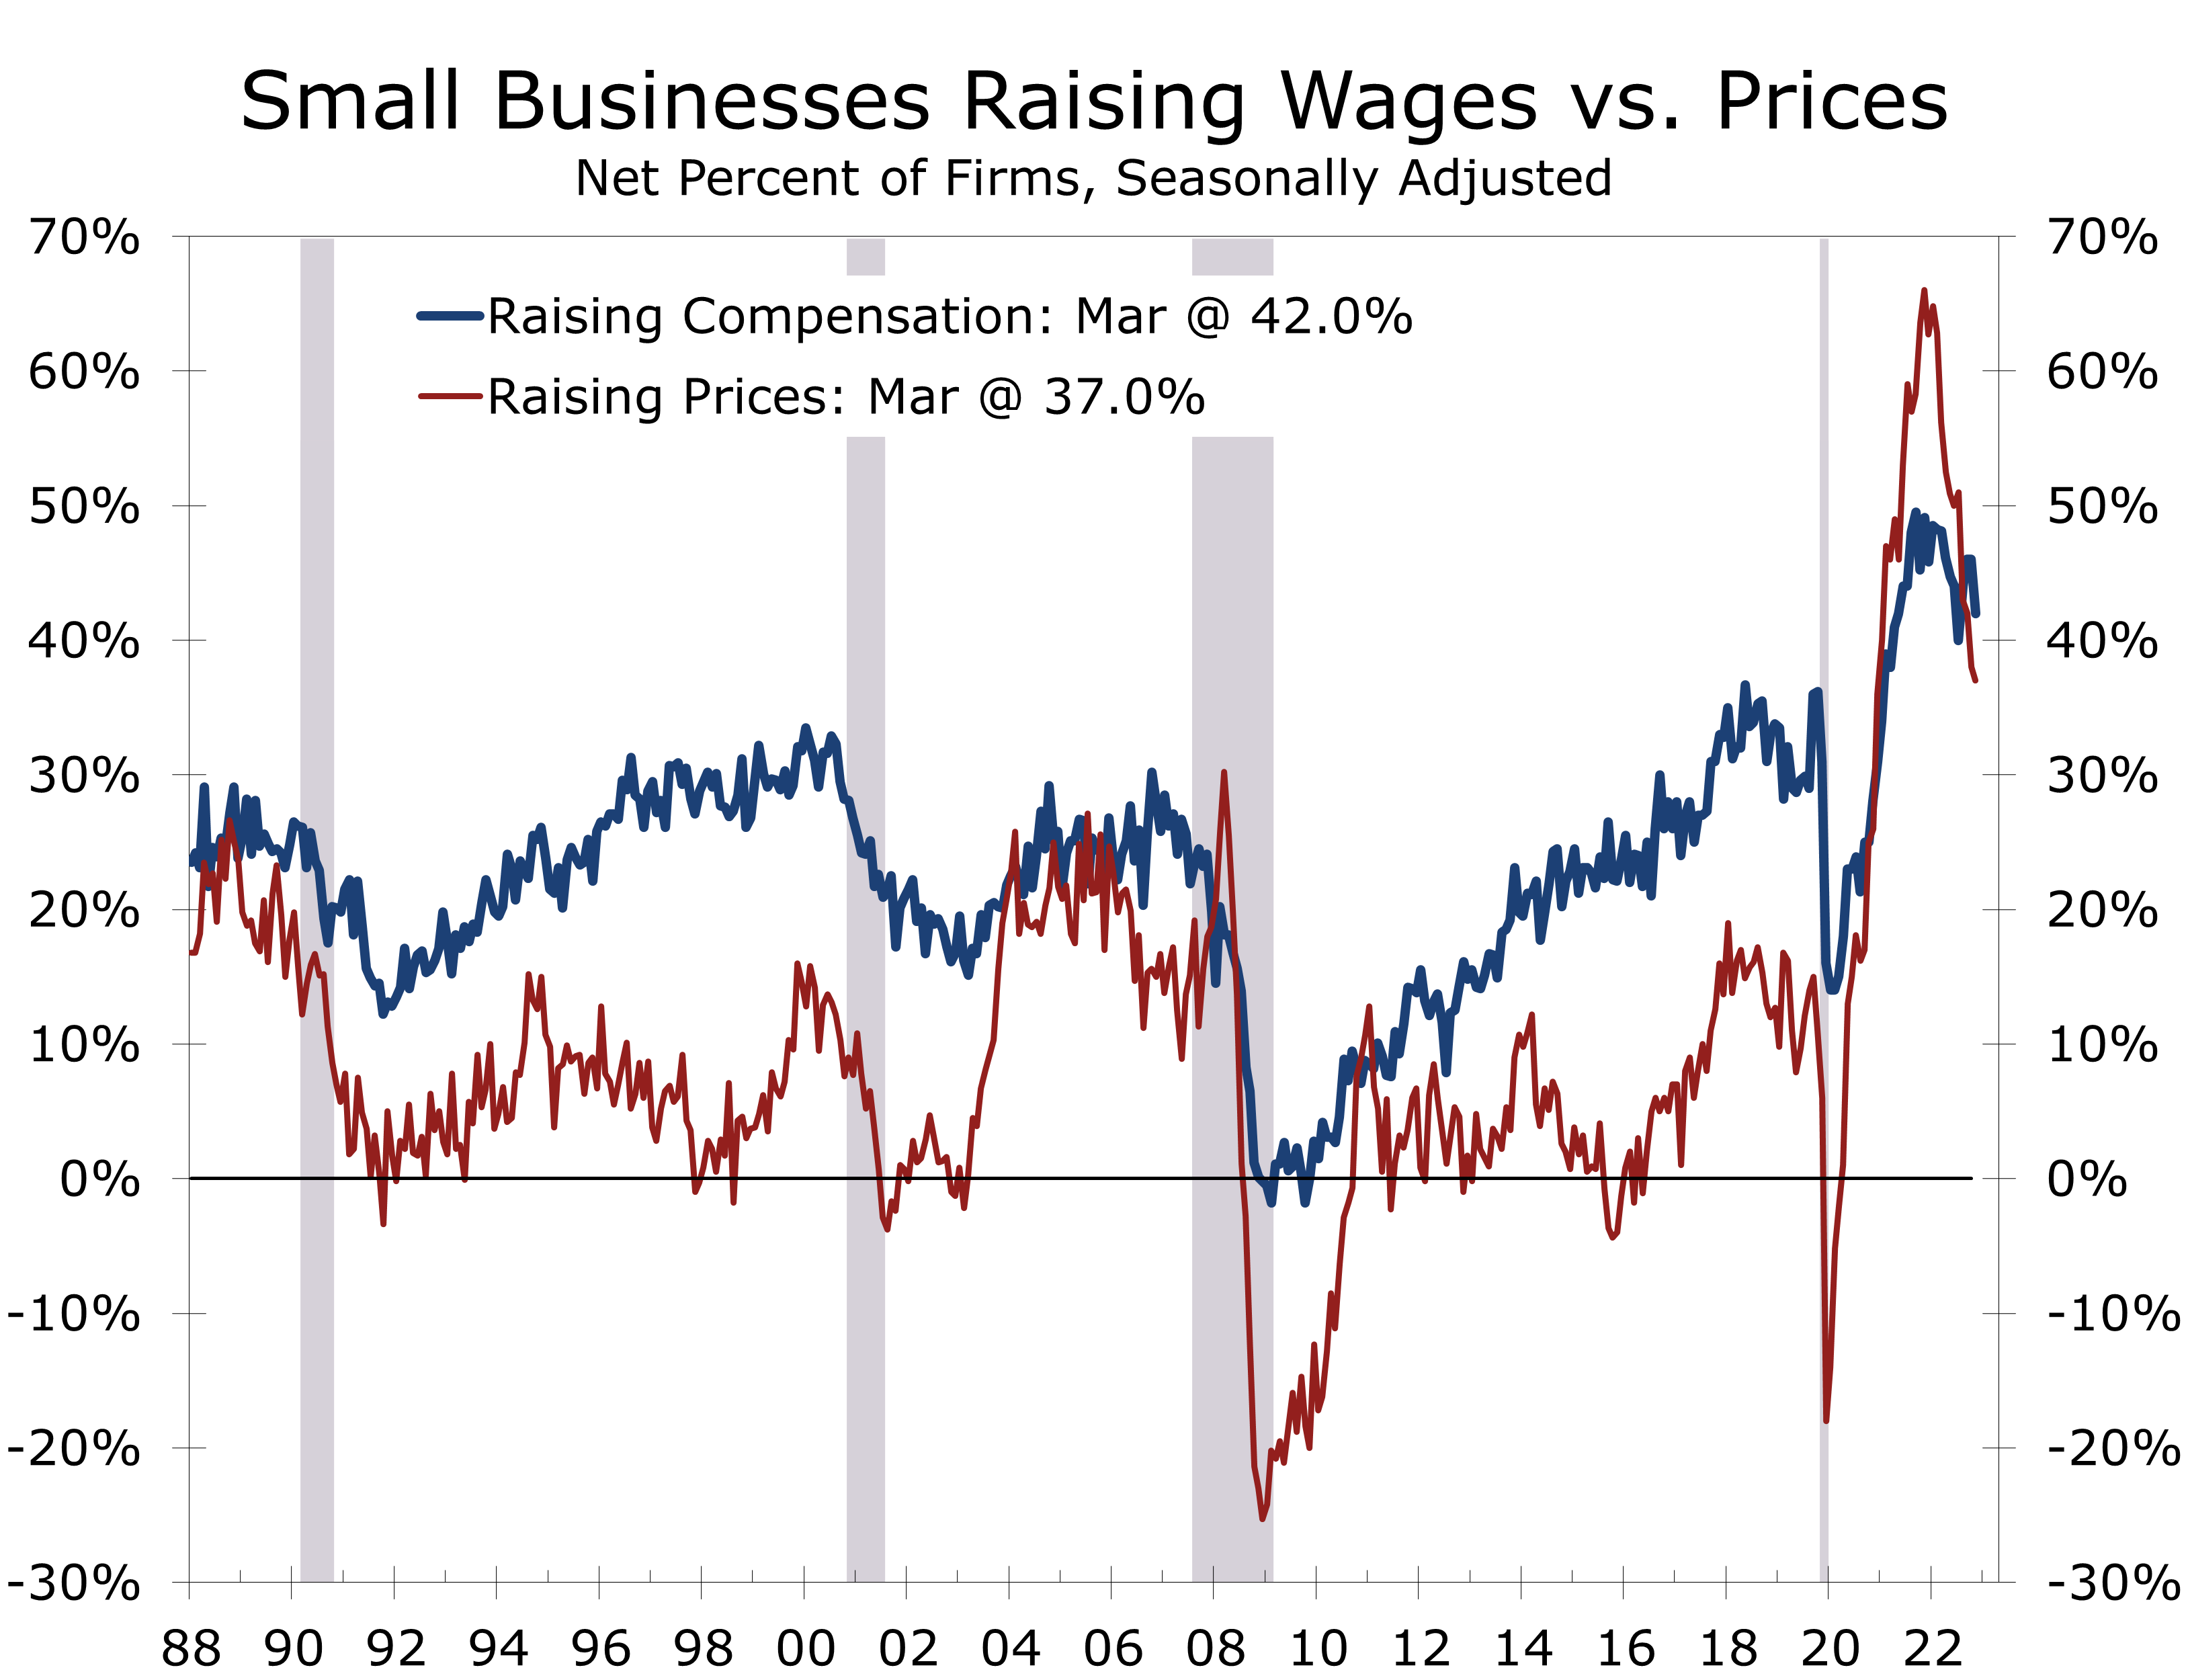
The net share of small businesses raising prices over the past three months fell 1 point to 37% in March and has fallen 29 points since peaking a year ago. The net share of firms planning to raise prices rose 1 point in March to 26%. Pricing plans also peaked a year ago and are down 26 points over that period.
Labor costs are proving stubborn, which will make it harder for firms to hold off hiking prices.
Pricing power has given way much faster than compensation costs have cooled off. The share of owners reporting compensation costs increased over the past three months fell 4 points to 42% in March but remains much closer to its highs than the share of firms raising prices. Both series remain historically high and suggest the Fed still has more work to do.
Disclaimer: This publication has been prepared for informational purposes only and is not intended as a recommendation offer or solicitation with respect to the purchase or sale of any security or other financial product nor does it constitute investment advice.
The Job Market Remains Remarkably Resilient
Q1 Will Likely Be the Strongest Quarter for Jobs
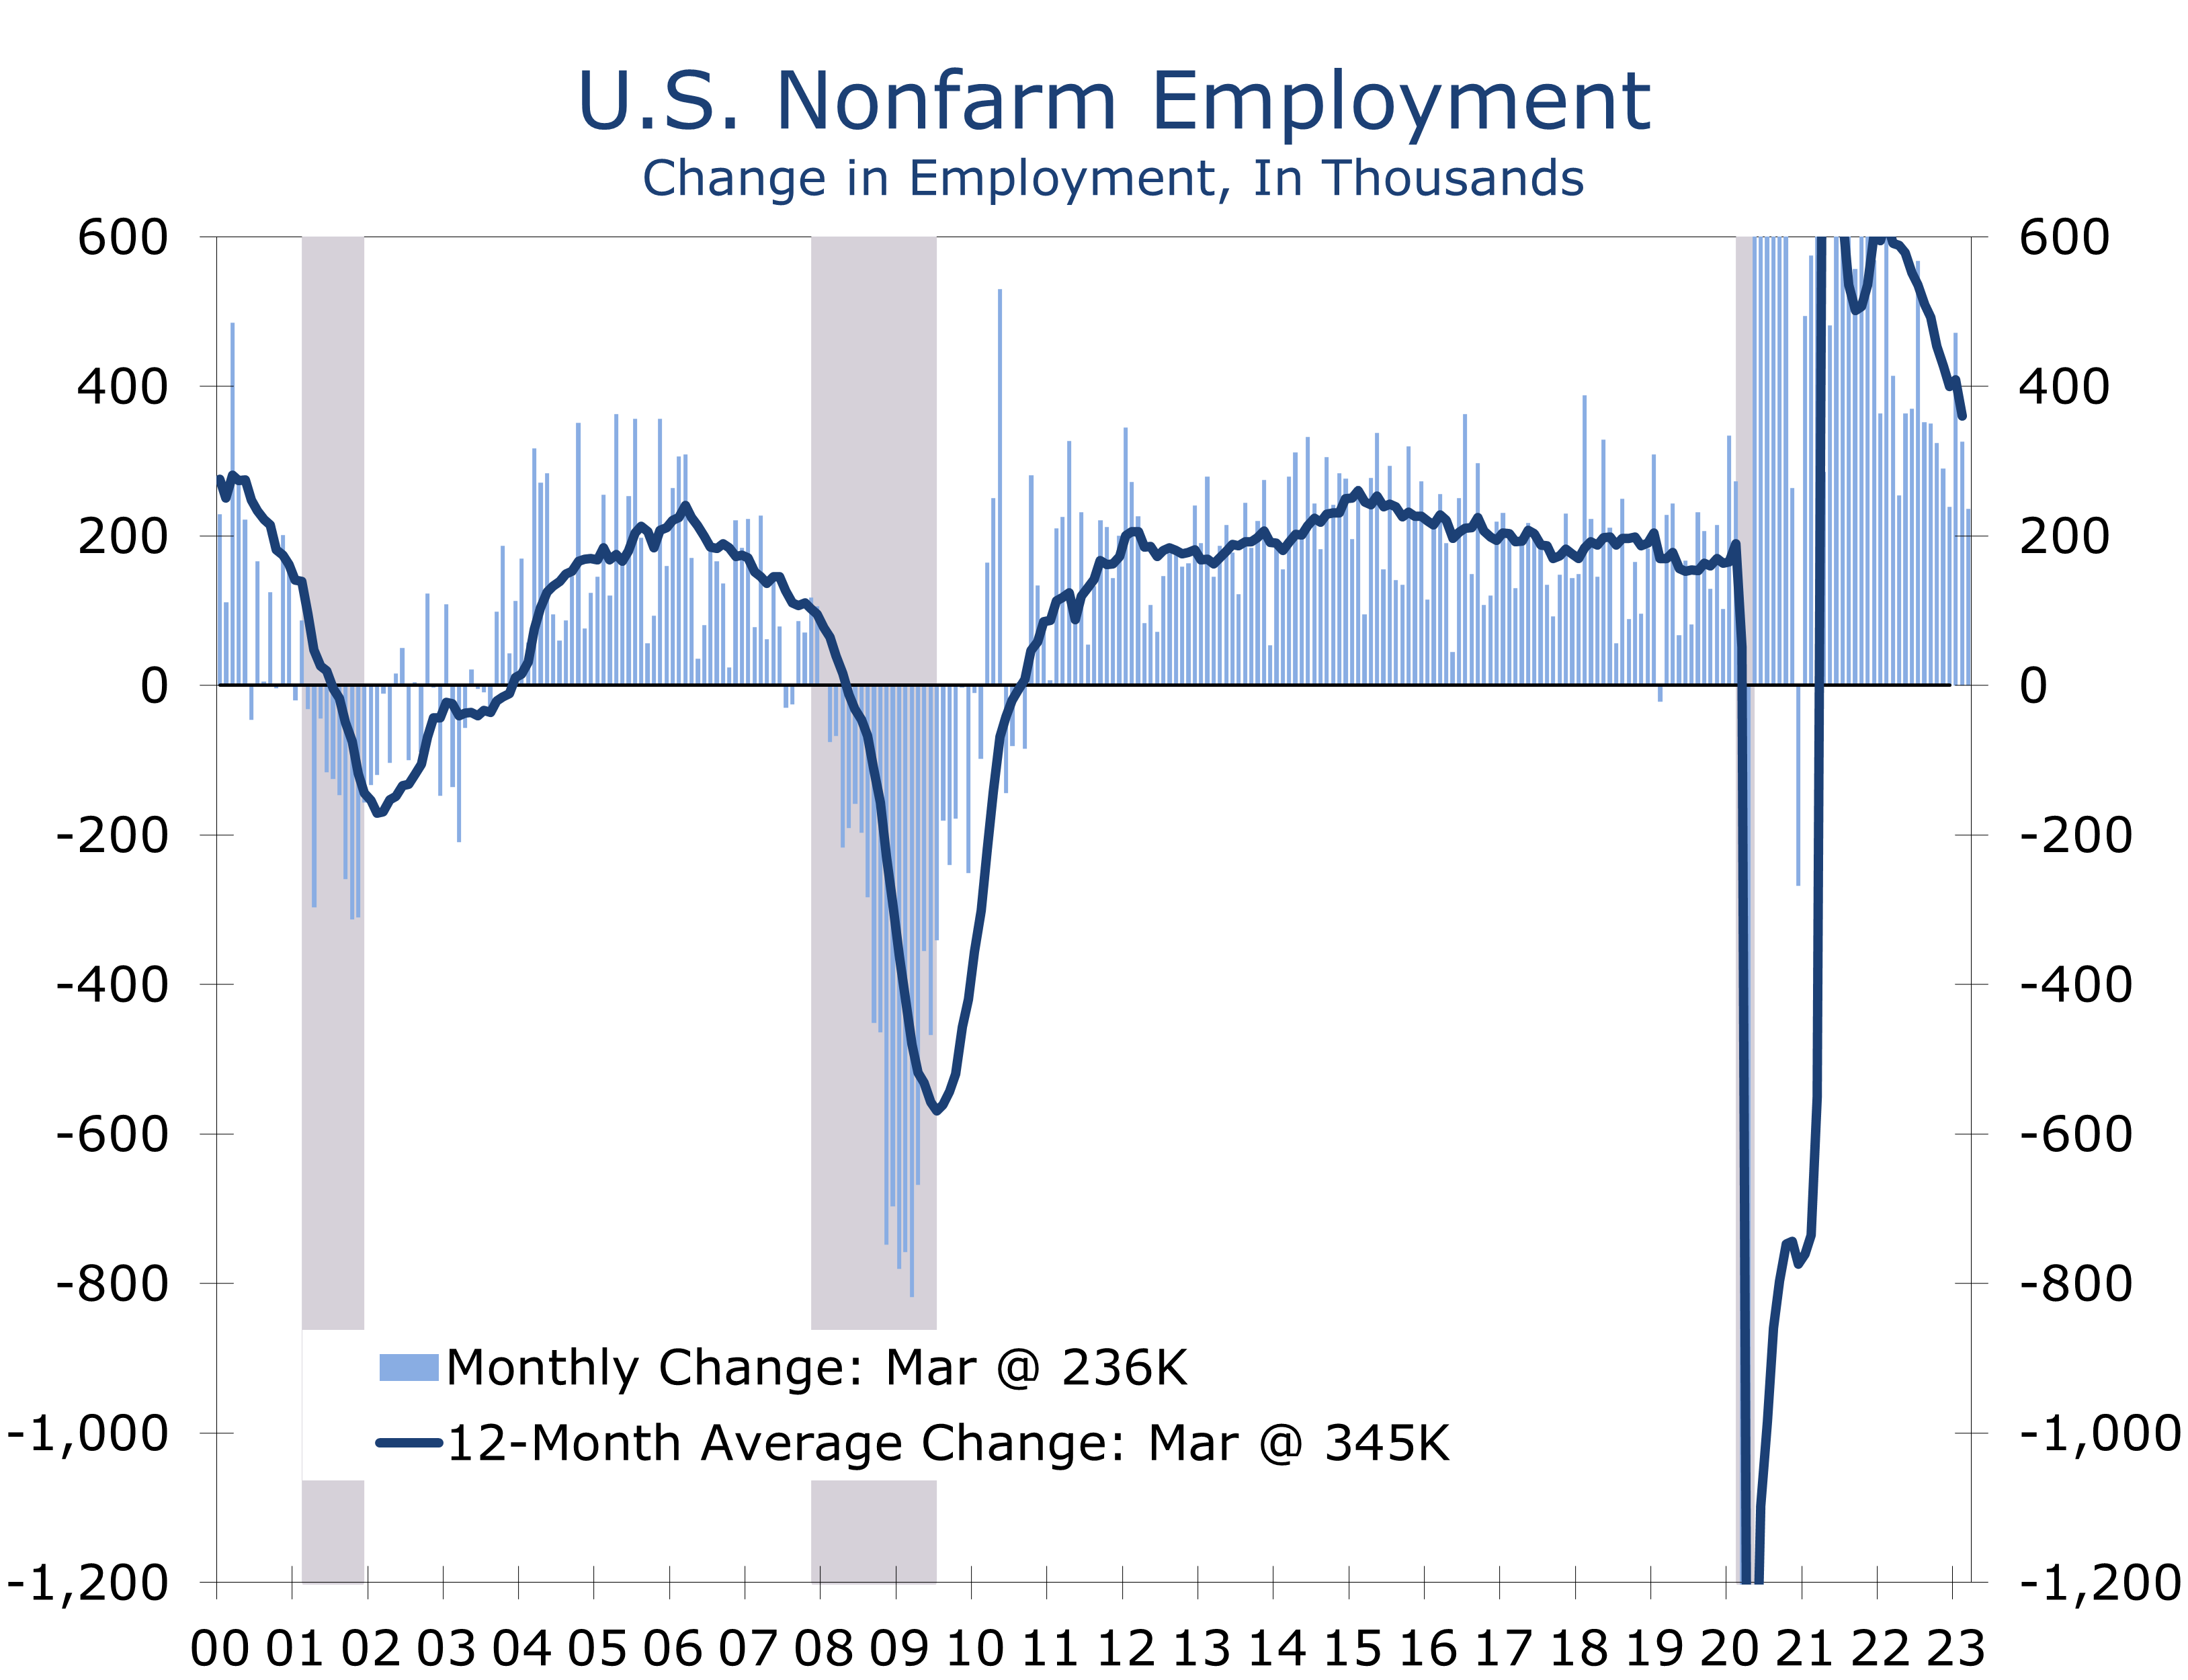
- Nonfarm employment rose by 236,000 in March. Revisions to the prior two months’ data subtracted a net 17,000 jobs.
- Private sector payrolls added a net 189,000 jobs in March, following gains of 266,000 in February and 353,000 in January.
- Job gains continue to be concentrated in industries that have generally struggled to add back workers. Leisure and hospitality added 72,000 jobs in March and health care and social assistance added 50,800 jobs.
- The most cyclically sensitive industries – construction (-9K) and manufacturing (-1k) lost jobs in March. In addition, temporary staffing firms cut 10,700 jobs.
- Aggregate hours worked edged 0.1 higher and rose at a 2.5% pace in Q1 – roughly equivalent with 3.5% real GDP growth.
- The civilian labor force participation rate rose 0.1 to a post-pandemic high 62.6.
- The unemployment rate fell 0.1 point to 3.5%, while average hourly earnings rose 0.3% and are now up 4.2% year-to-year.
Employers added a net 236,000 jobs in March and average hourly earnings rose 0.3%. Data for the prior two months were revised slightly lower, subtracting 32,000 jobs from January’s previously reported gain but also adding 15,000 jobs to the February data.
The first quarter will likely be the high-water mark for job growth this year. Employers added a total of 1.034 million jobs during the quarter. A disproportionate share of those gains came from parts of the economy that have struggled to rehire, most notably the leisure and hospitality sector, certain parts of health care and social assistance, and government. These three areas accounted for two-thirds of overall job gains.
Even with recent outsized gains, restaurants and bars still largely remain understaffed. Payrolls in the leisure and hospitality sector remain 2.2% below their pre-pandemic levels, or 368,000 fewer jobs. Employment at nursing and residential care facilities also remains well below its pre-pandemic level, as do payrolls at private child care centers. Government payrolls are 1.4% below their pre-pandemic level, or 314,000 jobs.
Despite the recent outsized job gains, a few cracks are now emerging in the labor market.
We look for job growth to decelerate this spring, partly as a payback for an earlier than usual rise in payrolls due to unseasonably mild weather in much of the U.S.
More fundamentally, job growth is slowing in response to higher interest rates and the expectation that credit will tighten further in coming months. More and more businesses are focusing on cutting costs, which has led to a decline in job openings. The process is most apparent in the tech sector but has spread more recently to financial services and increasingly to most other industries.
Hiring in the most cyclically sensitive parts of the economy has clearly slowed. Construction employment, which was buoyed by unseasonably mild weather in January and February, lost 9,000 jobs in March. Manufacturing payrolls lost 1,000 jobs for the second month in a row, with notable losses in chemicals, fabricated metal products and semiconductor manufacturing.
Mining remains a bright spot, with oil exploration in the Permian Basin continuing to drive hiring. Midland and Odessa, Texas posted the fastest job growth over the past year of any metropolitan area, with hiring up 10.1% and 6.6%, respectively.
One of the more reliable leading indicators of payroll growth is the trend in hiring at temporary staffing firms, which has fallen 4.1% over the past year and is now at levels that have coincided with recessions in the past. Temporary staffing firms cut a net 10,700 jobs in March and have lost 146,500 jobs over the past year.
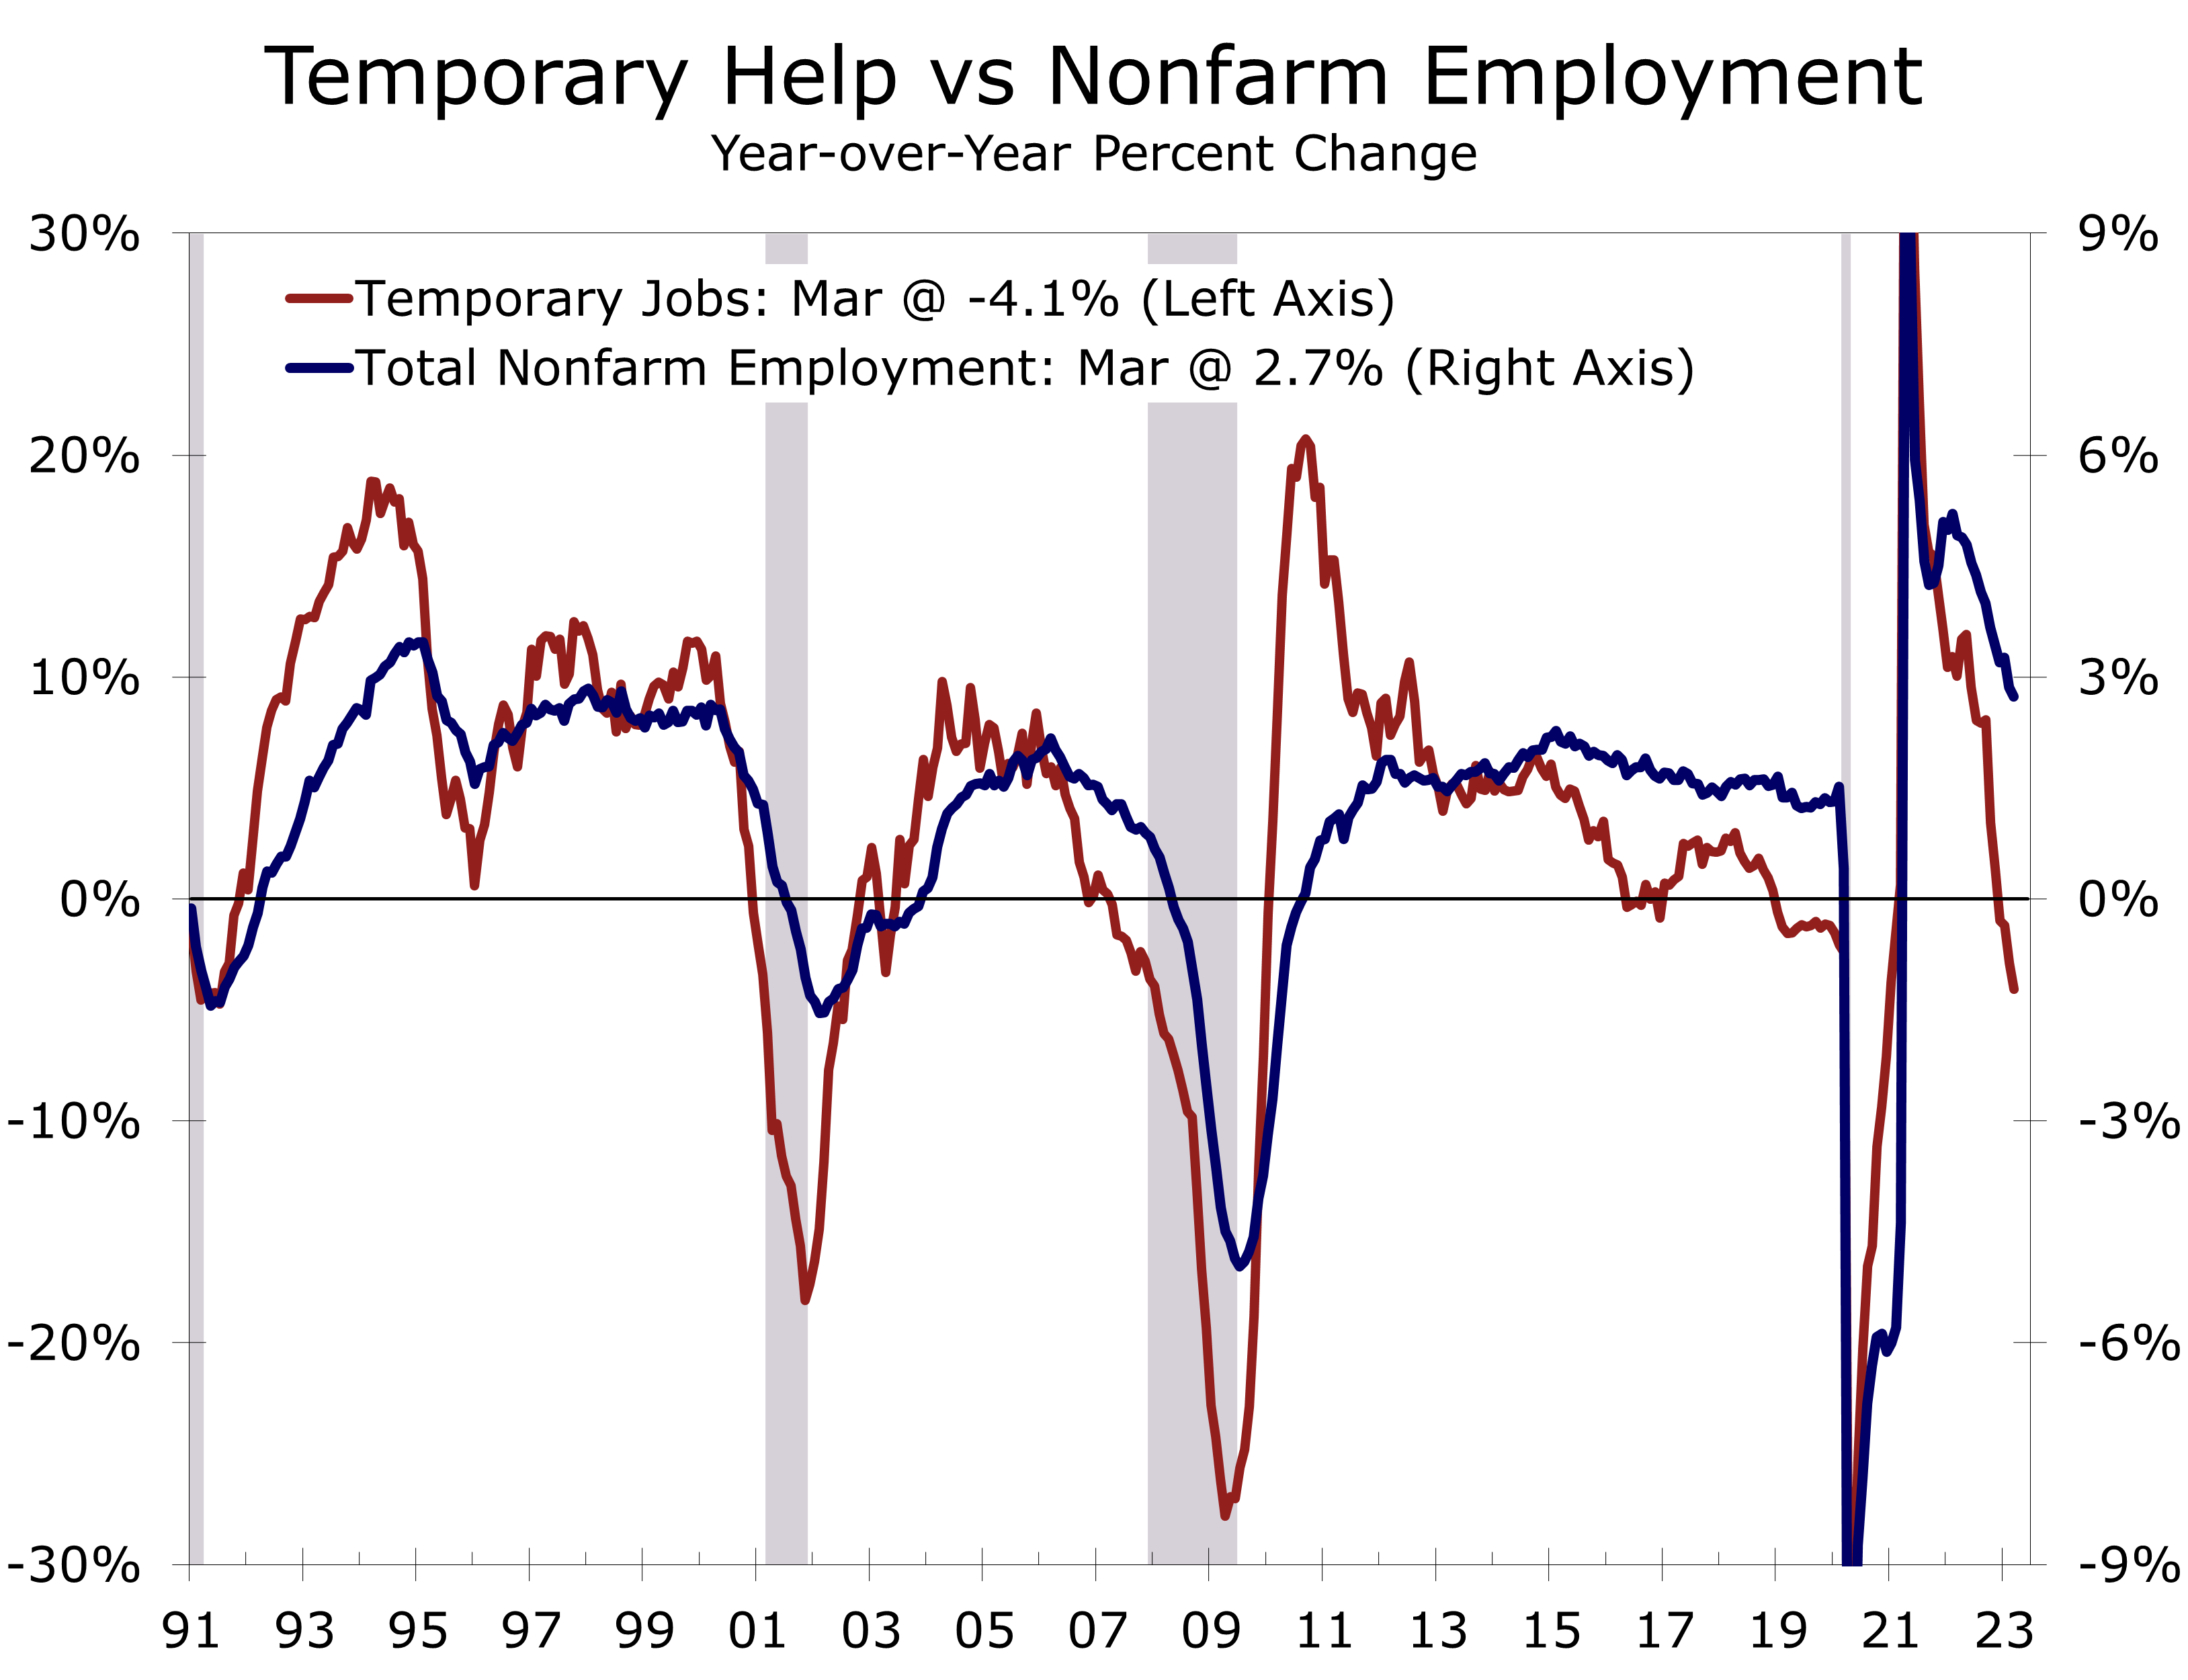
While the swoon in temporary staffing jobs looks ominous, most economic indicators continue to point toward a soft landing, at least in the near term. Job gains are still broad based, with 60.2% of industries adding jobs in March. Hiring is less broadly based than it used to be, however, with March marking the third smallest share since the start of the pandemic.
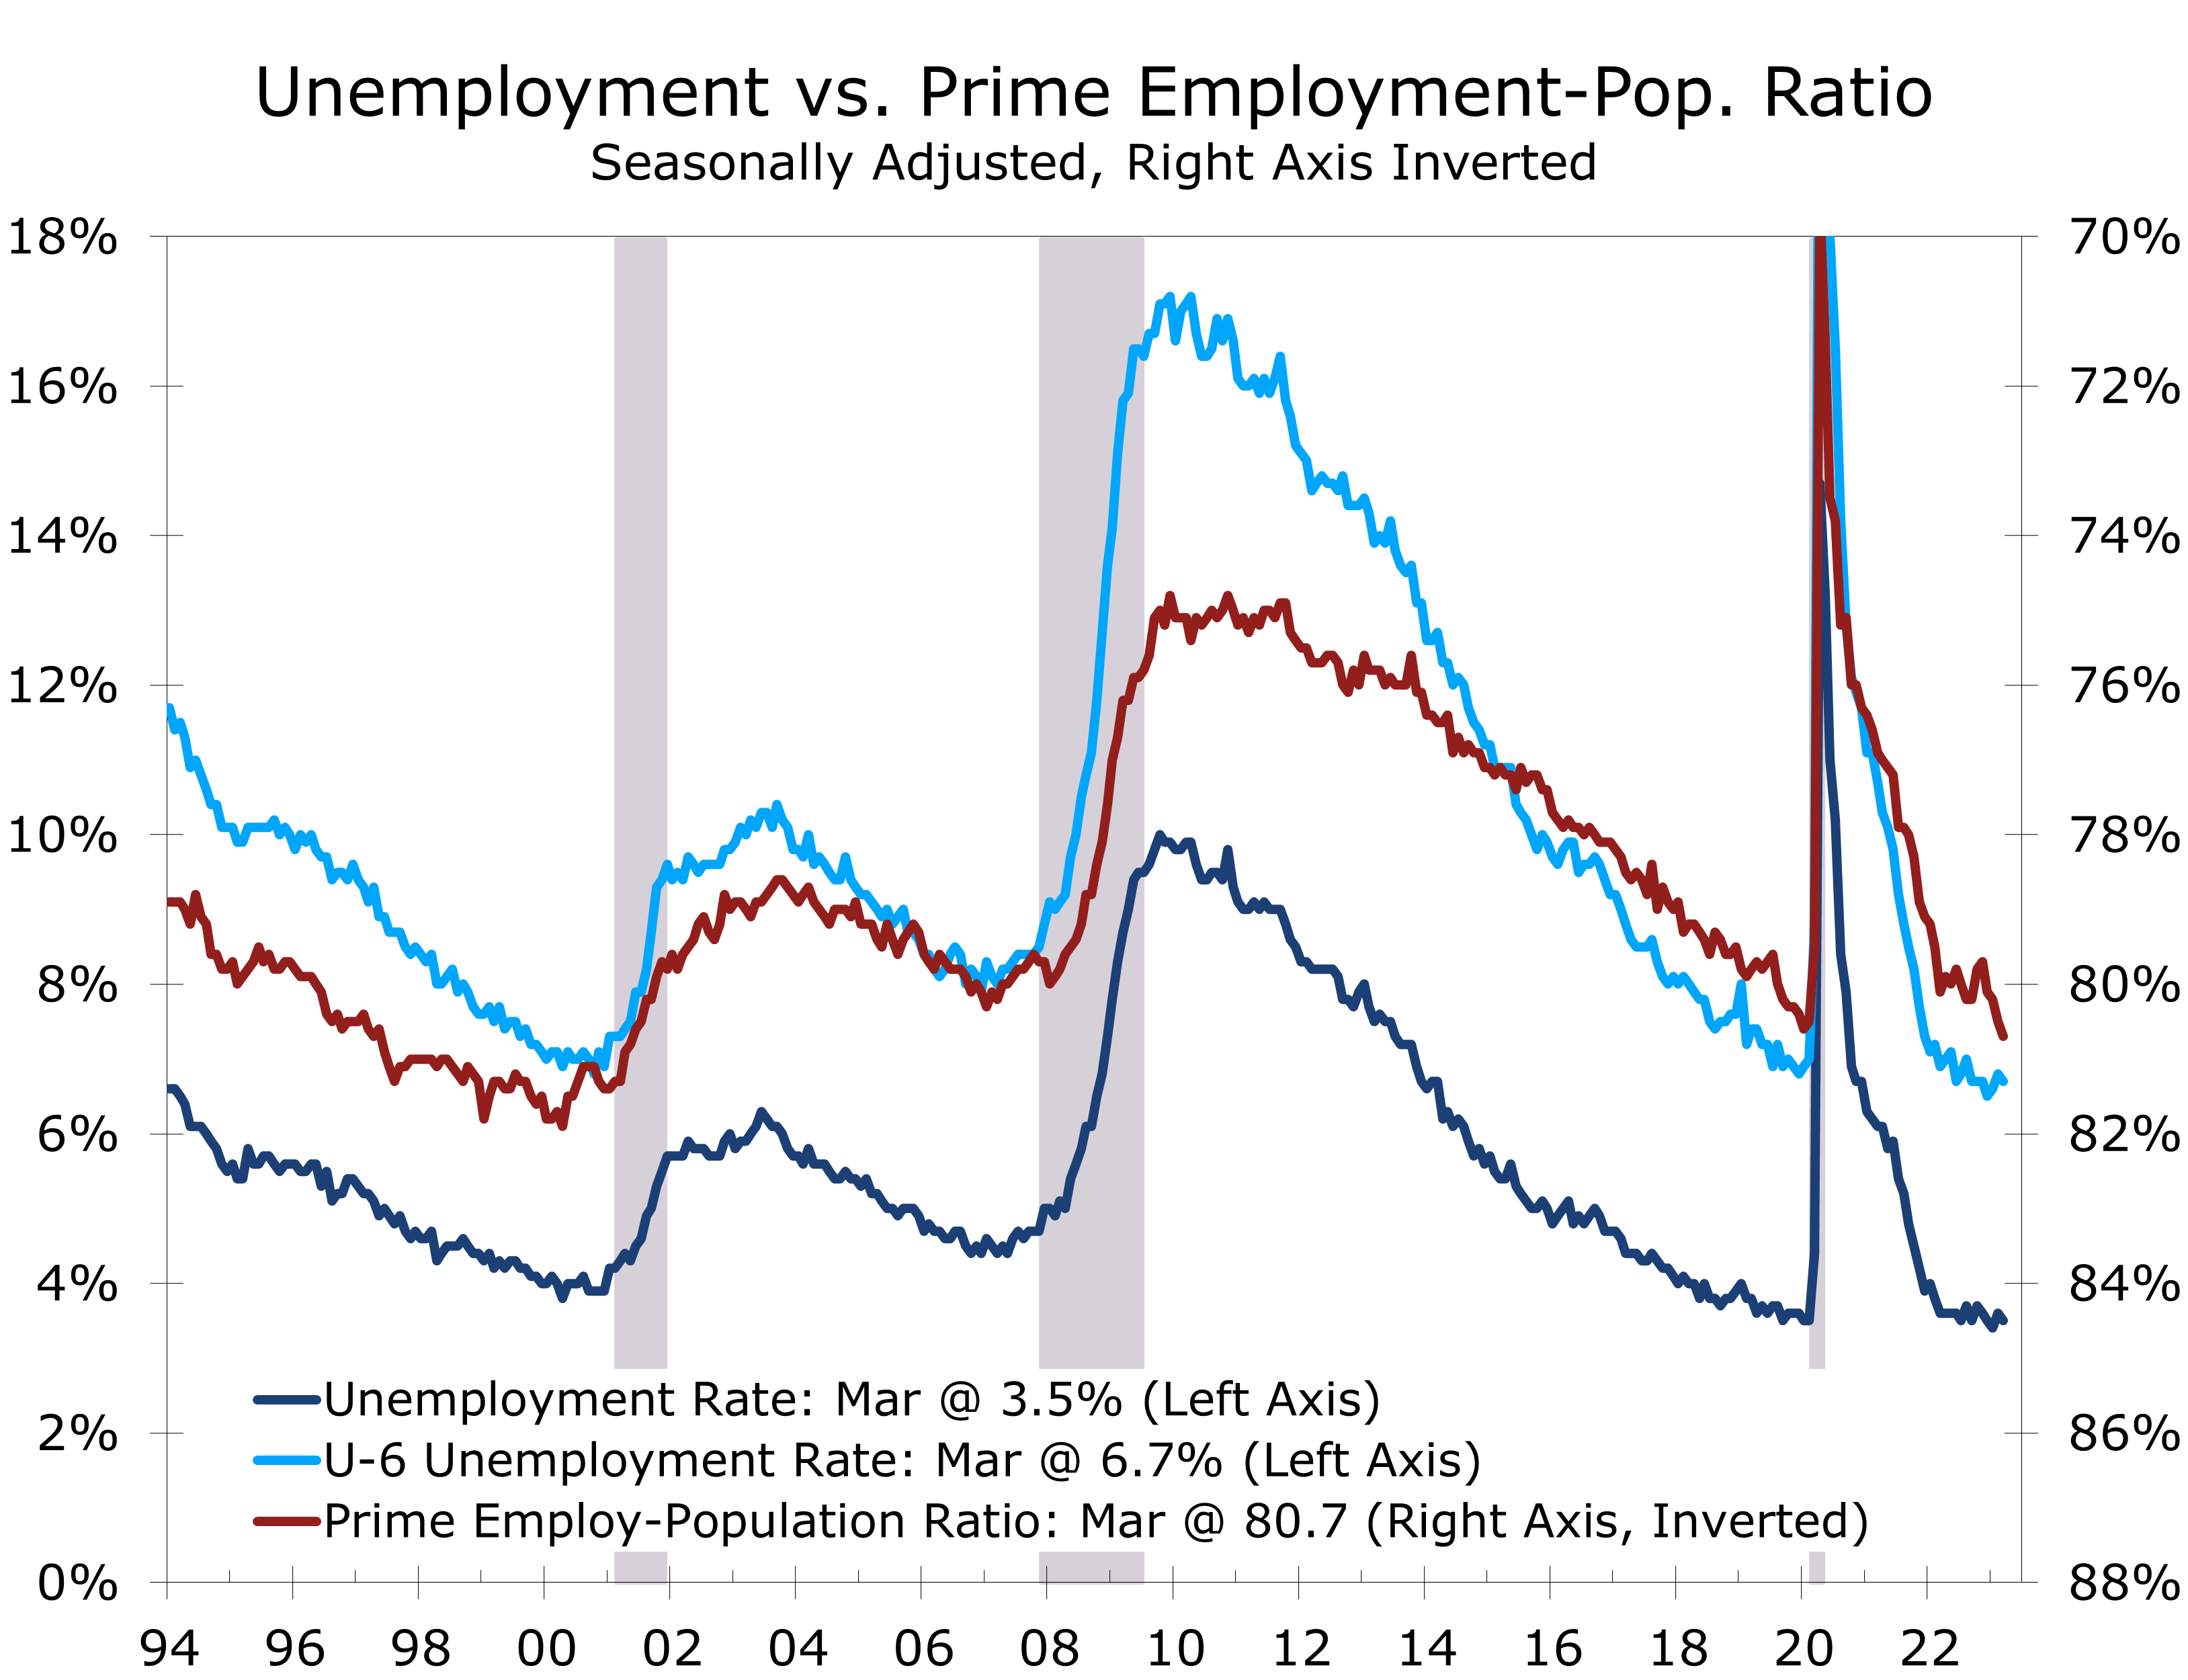
The unemployment rate fell 0.1 point to 3.5%.
The unemployment rate fell 0.1 point to 3.5% in March, as household employment rose by 577,000, outpacing a 480,000 rise in the civilian labor force. The labor force participation rate and prime employment population rate both rose in March, rising to their highest levels since the pandemic. The prime employment-population ratio rose 0.2 points to 80.7 and is now slightly higher than before the pandemic.
Given the latest employment data, the Fed is inclined to continue leaning toward another quarter-point interest rate hike at the May FOMC meeting. The May meeting will precede the April employment data, so March inflation reports are now front and center. The key report for the Fed, however, will likely be the April ISM report that will be reported on May 1.
Disclaimer: This publication has been prepared for informational purposes only and is not intended as a recommendation offer or solicitation with respect to the purchase or sale of any security or other financial product nor does it constitute investment advice.
Existing Home Sales Surge in February
Lower Rates Bring Buyers Back
- The National Association of Realtors reported that existing home sales surge 14.5% in February, which marks the largest increase since July 2020.
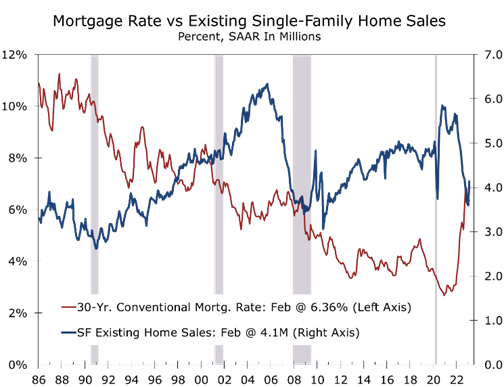
- The surge in existing sales reflects closings on contracts written in December and January when mortgage rates briefly fell back toward 6%.
- February is normally a slow month for home sales, so the seasonal adjustment is one of the largest of the year, which exaggerated the extent of the resurgence in sales.
- Sales were bolstered by the return of buyers that were priced out of the market when mortgage rates surged last fall and milder than usual weather across much of the US.
- Even with the surge in sales, homes are remaining on the market longer and prices are falling.
- The median price of an existing home has now fallen 0.2% over the past year, the first year-to-year decline since February 2012.
Sales of existing homes easily blew past expectations in February, with overall sales surging 14.5% to a 4.58 million unit rate. Sales of single-family homes rose an even larger 15.3% to a 4.14-million-unit pace, while sales of condominiums and co-ops rose 7.3% to a 440,000-unit pace.
February’s jump in sales, which was three times the consensus estimate, was fueled by a sharp pull back in mortgage rates in late December and January, when mortgage rates briefly fell back to 6%. Mortgage lenders likely dialed up clients that saw sales fall through as many buyers that had written contracts early last fall found they no longer quailed when mortgage rates surged to 7%. Milder weather also helped, as February is usually one of the slowest months for home buying.
The wide swings in home sales and mortgage rates mean last fall’s weakness was overstated.
The wide swings in home sales and mortgage rates mean last fall’s weakness was likely overstated, just as February’s resurgence now is. Some analysts have even gone as far to say that home sales bottomed last fall and look for sales to steadily increase this year. We doubt it, as mortgage rates have already rebounded, and housing affordability remains historically challenging. After averaging 6.36% in February, mortgage rates rose steadily during the first half of March and are currently around 6.75%.
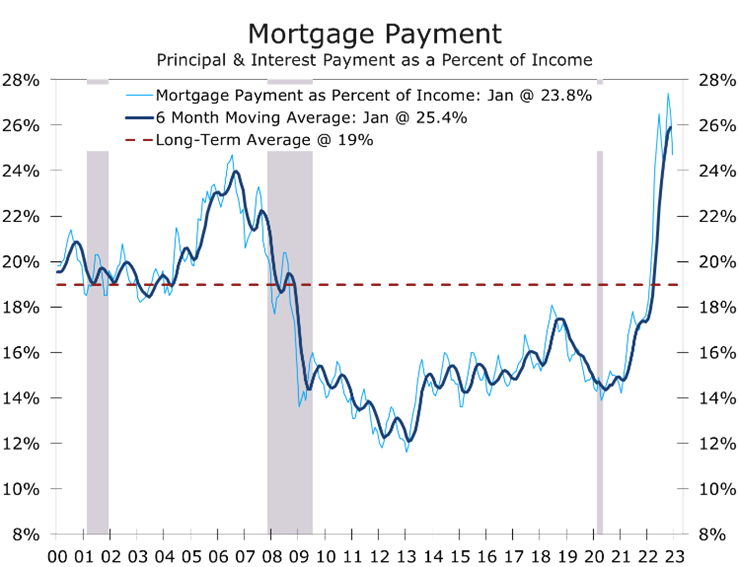
Lower mortgage rates and falling home prices had begun to make some inroads at restoring housing affordability. Qualifying income for a family earning the median income and purchasing the median price home has fallen 11% since October, from $98,064 to $86,736. The drop reflects the pullback in mortgage rates from 6.98% in October to 6.35% in January. The median price of an existing single-family home fell 5.6% over that 4-month period and is now down 13.7% since peaking in June.
Unfortunately, homeownership is still out of reach for far too many households. Monthly principal and interest payments for that median home totaled $1,807 in January, down from $2043 in October. Monthly principal and interest payments still consume an outsized 23.8% of median family income, which is roughly equivalent to what it was at the peak of the housing bubble 15 years ago.
For affordability to return to its long-run average, mortgage rates would need to fall more than a percentage point lower and home prices would have to fall further, while median family income increased. All those things are likely to eventually happen, but they will not happen quickly. Moreover, we are likely to see family income growth slow as job growth weakens. Credit underwriting will also likely tighten.
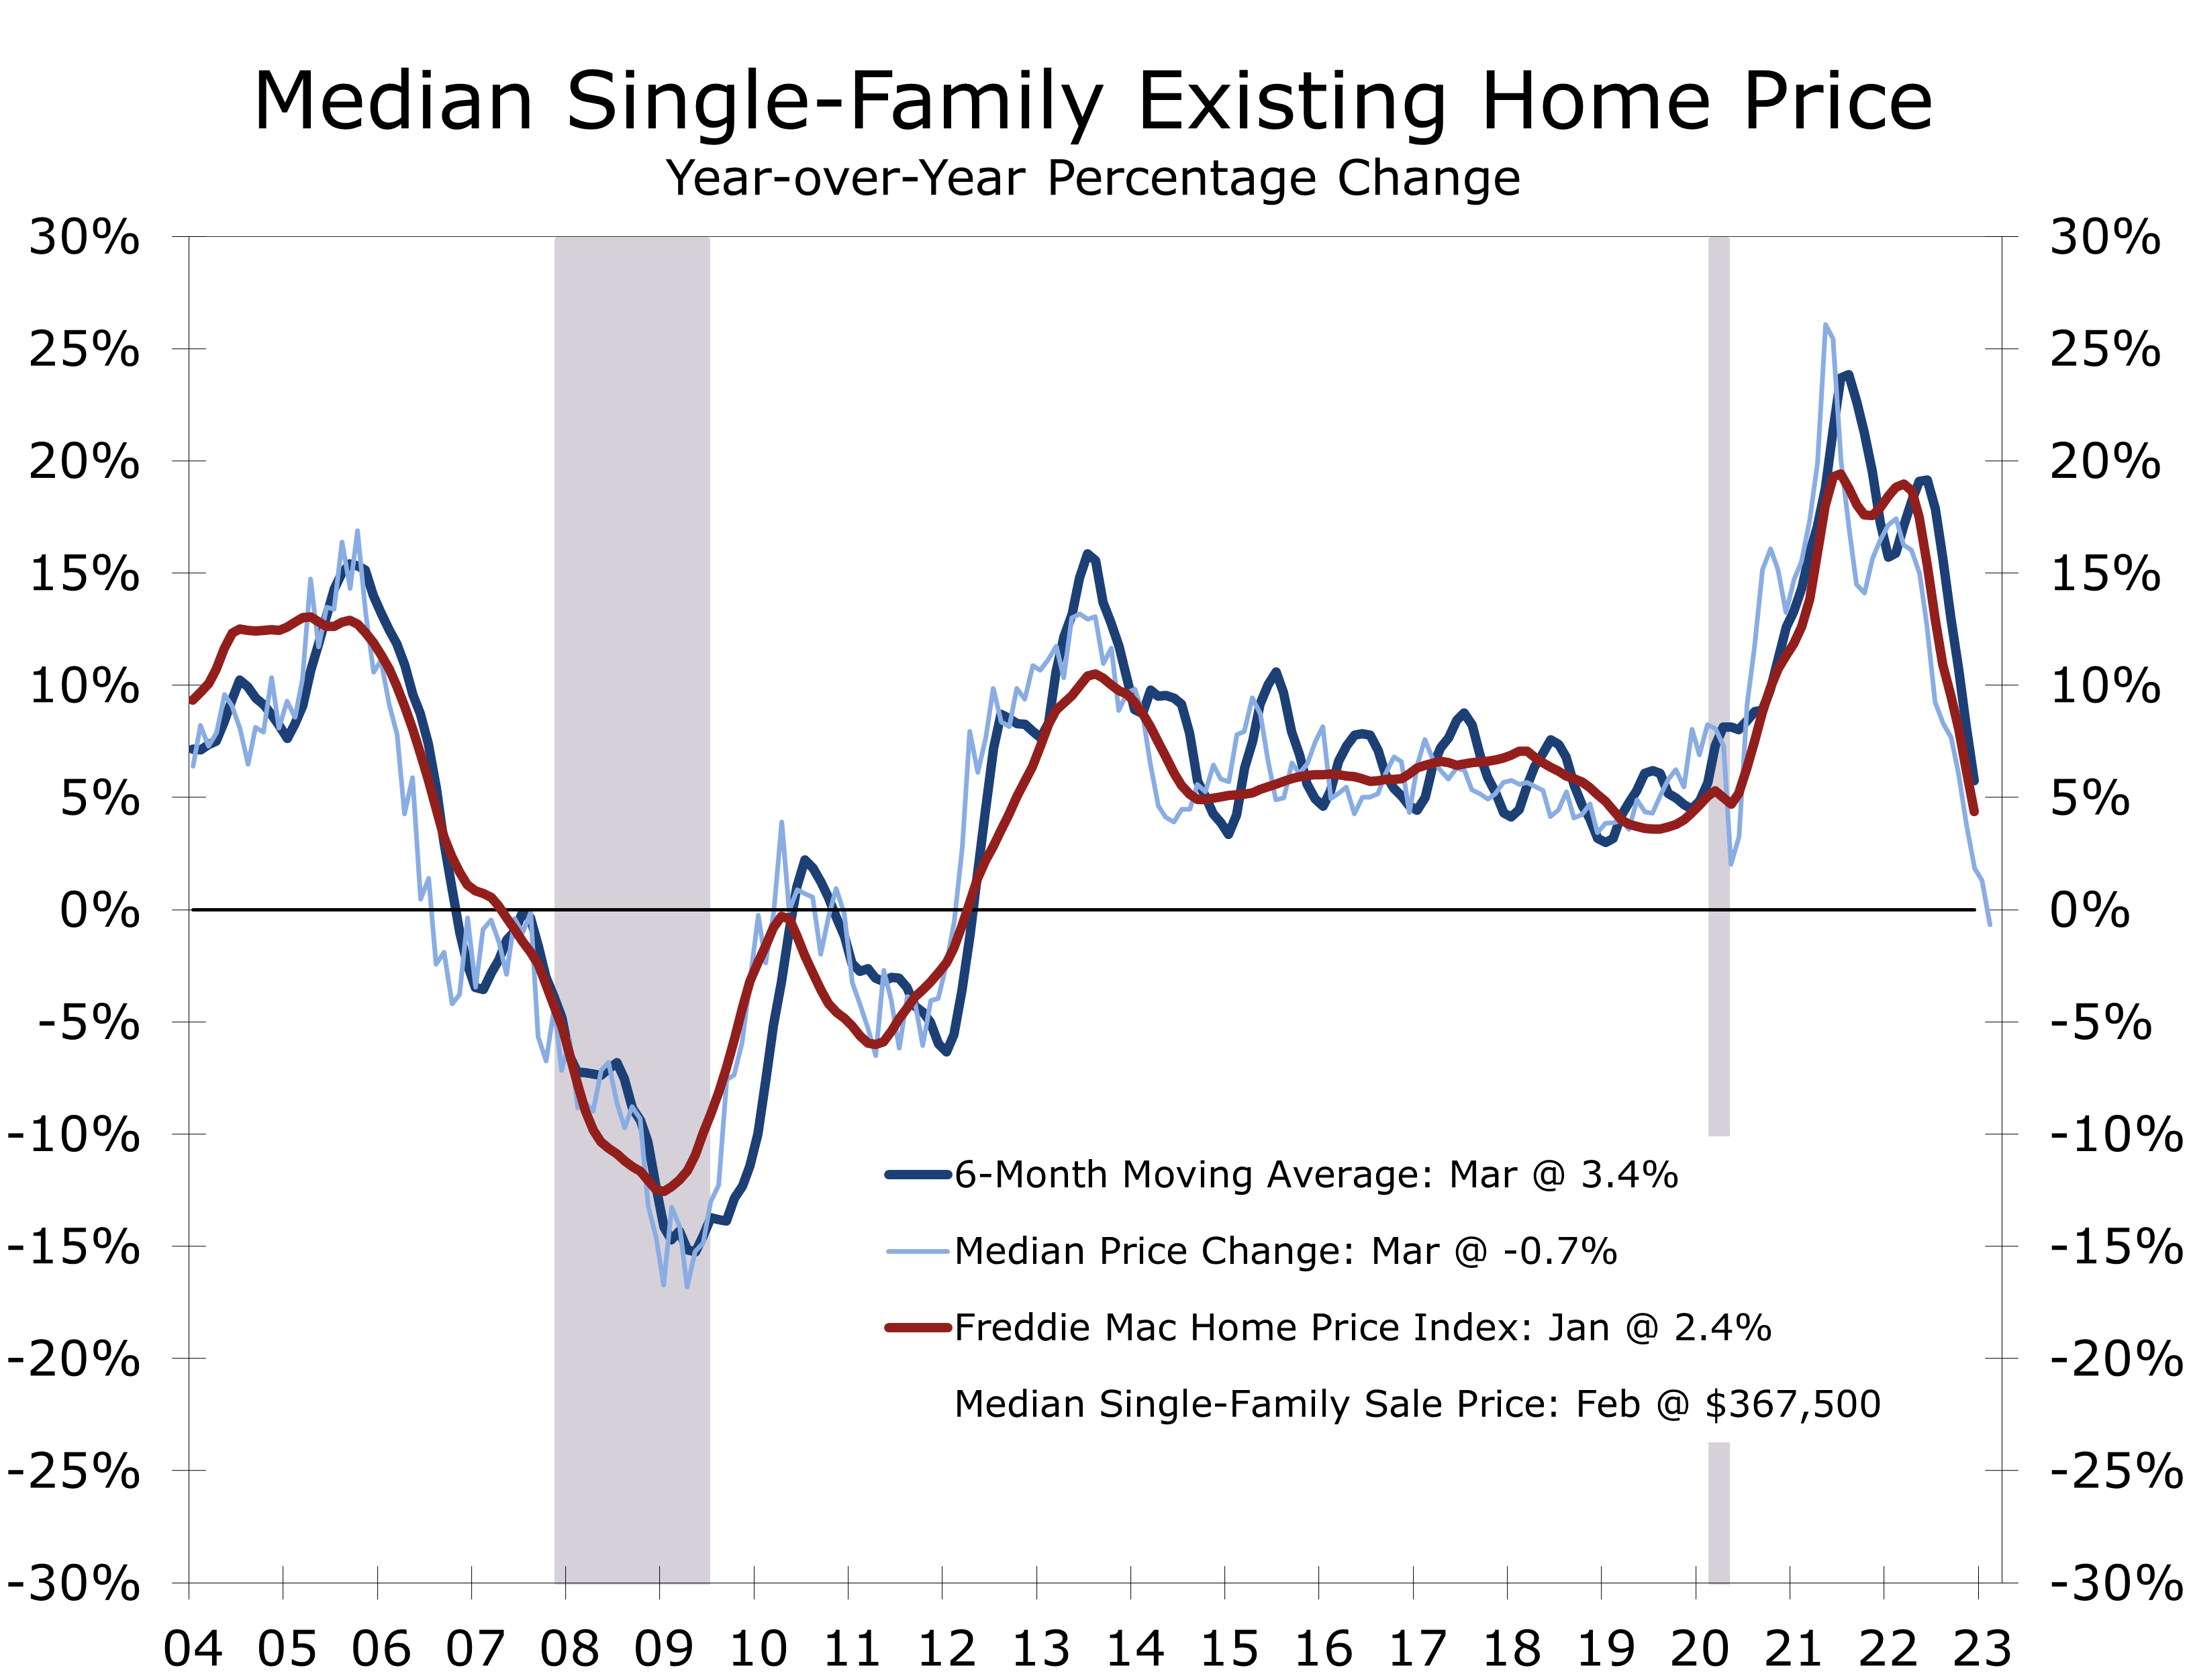
Home prices edged higher in February, with overall prices climbing 0.5% to $363,000 on a non-seasonally adjusted basis and prices of single-family homes rising 0.6% to $367,500. The gains mark the first increases in 8 months. Overall prices are down 12.3% since June of last year, while single-family prices have fallen 12.7%.
The median price of an existing home has fallen 12.3% since June and is down 0.2% year-to-year.
Home prices are now down 0.2% on a year-to-year basis and such comparisons are likely to deepen over the next 4 months, as comparisons with peak home prices will become more difficult.
February’s surge in existing home sales likely makes the Fed’s decision a little easier. We expect the Fed to hike the federal funds rate by a quarter percentage point at the conclusion of the FOMC meeting tomorrow and expect the target for the terminal funds rate for the cycle to come down from 6% to around 5.5%. The crisis surrounding Silicon Valley Bank and other West Coast Specialty lenders will likely result in some tightening of credit conditions ahead of the release of bank stress-test results in June. This will effectively do some of the Fed’s work for them.
Disclaimer: This publication has been prepared for informational purposes only and is not intended as a recommendation offer or solicitation with respect to the purchase or sale of any security or other financial product nor does it constitute investment advice.