
Mid-Year Housing Outlook & Chartbook
Housing Continues to Seemingly Defy Gravity
- Housing defied expectations and displayed surprising resilience in the first half of 2023.
- Sales of new and existing homes rebounded, as mortgage rates briefly fell back to 6% at the start of the year.
- Most homeowners hold mortgages at rates well below the prevailing mortgage rate, which has made them reluctant to sell.
- With existing inventories exceptionally low, the revival in sales rekindled bidding wars for those homes on the market and pushed many buyers toward new homes.
- After falling in the second half of last year, home prices rebounded modestly this spring.
- Bottom line: New and existing home sales outperformed reduced expectations during the first half of this year. Housing is undersupplied and the revival in demand is real. Unfortunately, affordability is stretched, and interest rates are likely to rise further.
This marks our first installment of our quarterly Housing Chartbook, which will track key trends driving the market, including recent trends in sales and construction, mortgage rates, inventory levels, housing affordability, buyer attitudes and regional conditions. We will also include a detailed forecast for single- and multi-family starts, new and existing home sales, home prices and interest rates. Look for a link at the end of the html version of this report.
New and existing home sales rebounded earlier this year, as mortgage rates reversed much of the spike that occurred last fall. Buyers who had canceled purchase contracts or put buying plans on hold, returned to the market in January and February.
The turnaround in home sales occurred when inventories were unusually low. Eighty percent of outstanding first-lien mortgages have rates below 5% and 60% have rates below 4%. With such low rates, fewer homeowners are looking to sell. The scarcity of new listings set off intense competition for what homes were on the market. Home prices, which had been falling since the middle of last year, did an abrupt about face. The lack of existing homes for sale has also pushed more buyers toward new construction.
The paucity of existing homes for sale has pushed more buyers toward new construction.
Following a spike in cancellations last fall, home builders shifted some of their production to rentals earlier this year. The influx of higher-margin traditional buyers has greatly boosted builder confidence. After slumping to 31 in December, the NAHB/Wells Fargo Housing Market Index has rebounded to 55.
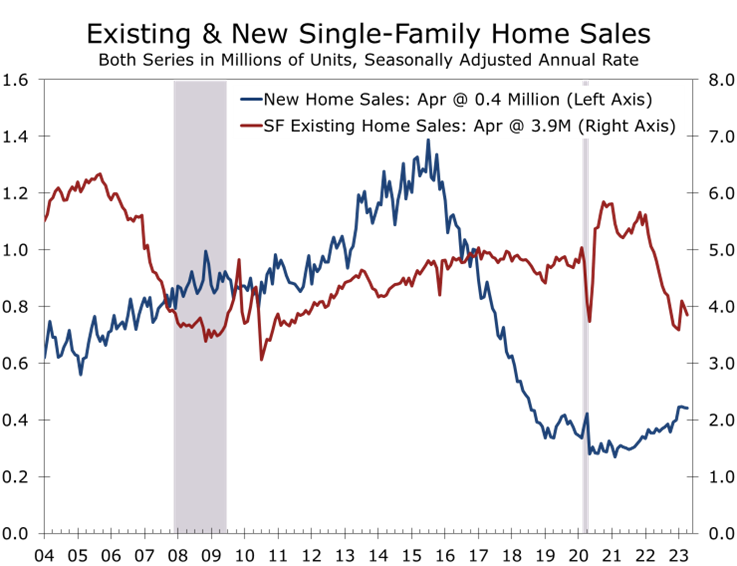
Following a pullback resulting from last fall’s mortgage rate spike, single-family starts have rebounded somewhat. We expect single-family starts to maintain their recent pace for a few months but slow later this summer amidst higher interest rates and slower economic growth. Builders still have a substantial backlog of projects underway, and many are looking to clear backlogs as supply chain disruptions diminish further.
Demand for homes revived most significantly in the South, benefiting from strong in-migration and greater relative affordability compared to the West Coast and Northeast. The West experienced the most significant price declines last year, while prices held up best in the South. Florida is currently seeing some of the strongest home price appreciation, which has greatly diminished affordability for native buyers.
Robust job growth continues to drive demand for apartments, particularly in the South. The limited availability of homes for sale has bolstered lease renewals for apartments, helping contributed to a 6% year-to-year increase in rents. There is an enormous supply of apartments due to be completed in the South this year and next, however, which will push vacancy rates up a couple of percentage points or more and weaken rents. Credit underwriting for new apartment projects is expected to tighten further, bringing about an overdue correction in apartment development.
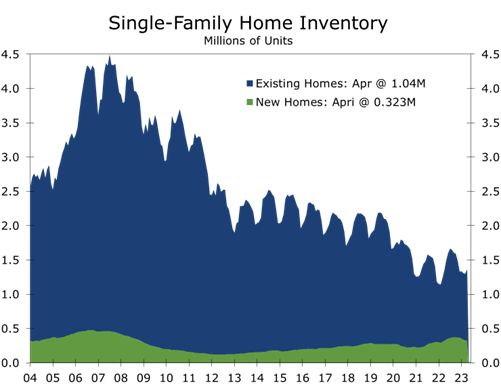
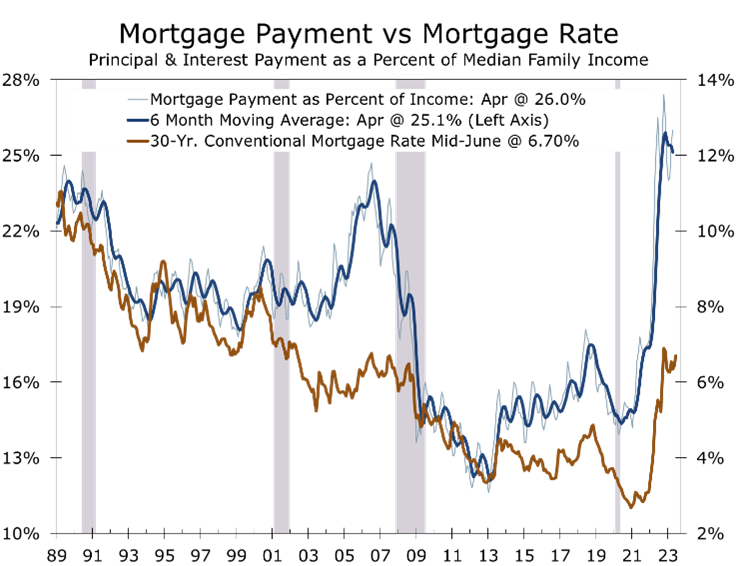
Affordability hurdles currently exceed levels hit at the height of 2005-2007 housing bubble. The monthly principal and interest payment on a median priced home has soared to $1,972, which equates to 26% of median household income. Property insurance and taxes have also risen across much of the country, creating an even greater hurdle.
With housing affordability so stretched a correction in home sales seems likely. The migration of well-heeled buyers from Northeast and West, where median household income is $103,337 and $99,543, respectively, to the South, where median family income is $83,537, has masked the extent to which affordability has deteriorated. Migration will likely taper off as job growth slows, more clearly exposing the lack of affordability for native buyers.
With the Fed expected to raise rates at least one more time and then hold rates at that level until next spring, mortgage rates will provide little near-term relief. There is room for mortgage rates to fall, however, as the spread between the 10-Year Treasury Note yield and 30-Year fixed rate mortgages is unusually wide. That spread should narrow as economic activity cools and interest rate volatility subsides.
Disclaimer: This publication has been prepared for informational purposes only and is not intended as a recommendation offer or solicitation with respect to the purchase or sale of any security or other financial product nor does it constitute investment advice.

June FOMC Meeting: Hawkish Pause +
Whatever It Takes to Bring Inflation Back to 2%
- The Federal Reserve left its federal funds rate target unchanged at 5-5.25%.
- There was relatively little change to the Fed’s policy statement, with recent data showing overall growth at a “modest pace” but with “robust” job gains.
- The Summary of Economic Projects (SEP) shows the Fed believes the economy is more resilient than previously thought and inflation is expected to be more persistent.
- A majority of FOMC members believe the federal funds rate will need to be raised at least 50 basis points by the end of this year.
- Powell was hawkish at his press conference, stressing the risks to inflation were still tilted to the upside and that the Fed was prepared to do whatever it takes to bring inflation back to their 2% target.
- Bottom line: The Fed’s upgraded forecast was slightly more hawkish than expected and may have been designed to remove any lingering expectations they would cut interest rates later this year.
The Federal Reserve took a break from raising interest rates at their June FOMC meeting and left the federal funds rate target unchanged at between 5 and 5 ¼%. The decision was widely expected but does not likely signal an end to the Fed’s interest rate hikes.
There was very little change in the policy statement that accompanied the Fed’s decision. The Fed still sees the economy growing at a modest pace and notes that job growth remains robust. The Fed also noted that “tighter credit conditions for households and businesses are likely to weigh on economic activity, hiring, and inflation. While that sentence is identical to the language in the May 3rd statement, it is also the primary justification for the Fed’s decision to hold rates steady. There is simply not enough conclusive evidence as to how much impact tighter credit standards are having. We will get key data on the bank stress tests and bank earnings ahead of the July 25-26 meeting.
The economy is expected to be more resilient, and inflation is expected to be more persistent.
While the policy statement was little changed, the Fed’s forecast shows the economy is expected to be more resilient than previously thought, particularly in the near term. Inflation, however, is expected to be more persistent. The median forecast for 2023 real GDP growth in the Summary of Economic Projections was raised by 0.4 percentage points to 1.0%, on a fourth quarter to fourth quarter basis, while the forecast for the unemployment rate was reduced by 0.4 percentage points to 4.1%. The median forecast for core inflation was raised by 0.3 percentage points to 3.9% year-to-year in the fourth quarter.

Decelerating to a 3.9% rise by yearend may prove difficult. The core PCE deflator currently sits at 4.7% and the index has risen an average of 0.38% a month over the past six months. To decelerate to a 3.9% rise by year end, the core PCE deflator would need to slow to an average of just 0.23% per month. While such a sudden sustained slowdown is not unprecedented it is exceedingly rare. Yearend core inflation is expected to slow to 2.6% in 2024 and 2.2% in 2025.
The Fed’s economic forecasts for 2024 and 2025 were less impacted. GDP growth for both years was reduced by 0.1 percentage point, to 1.1% and 1.8%, respectively, while the yearend unemployment rate was reduced by 0.1 percentage point to 4.5% in both years. A 4.5% unemployment rate looks credible and is at the upper bound of the range considered to be full employment, providing cover to the Fed against critics arguing the Fed is pushing the economy into recession.
With core inflation expected to remain higher for longer, the median forecast for the yearend 2023 federal funds rate target was raised by 50 basis points to 5.6%. The Fed is expected to cut the federal funds rate by a full percentage point in 2024, bringing the funds rate target back to 4.6% and to cut rates by slightly more in 2025, ending the year at 3.4%. The long run federal funds rate was unchanged at 2.5%. The Fed can cut rates, even though inflation remains above their target, because real interest rates will be rising.

The Fed’s forecast was a bit more hawkish than expected. Twelve of the 18 FOMC members are projecting at least 2 more rate hikes, with 4 projecting even more than that. The trending vernacular prior to the June meeting was the Fed would “skip” hiking rates at this meeting and resume hiking rates at the July meeting. Powell addressed this at the press conference, emphasizing July would be a “live meeting”, meaning any decision will be dependent upon the data released before the July 25-26 meeting.
Getting the message right is critical. Housing and the financial markets have already firmed, sensing the Fed is nearly finished hiking rates. The increase in the core inflation forecast and Powell’s blunt assurance to do “whatever it takes” to bring inflation back down to their 2% target should help temper that enthusiasm.
We continue to believe the Fed will hike rates only one more time but are inclined to take the Fed at their word. Core inflation is proving remarkably persistent and will likely top the Fed’s forecast this year. Still, we see no more than two more quarter-point hikes this year. Tightening credit conditions will do some of the Fed’s work for them and the Fed can still meet its objective by holding rates higher for longer.

Disclaimer: This publication has been prepared for informational purposes only and is not intended as a recommendation offer or solicitation with respect to the purchase or sale of any security or other financial product nor does it constitute investment advice.
Headline Inflation Eases Further in May
The CPI Looks Better Than It Was a Year Ago, But Core Inflation Remains Sticky
- The Consumer Price Index rose 0.1% in May, which was about half the consensus estimate.
- The smaller rise in the CPI brought the year-over-year change down to 4%, less half the gain seen a year ago.
- Energy prices fell 3.6% in May, with gasoline prices falling 5.6% and fuel oil prices tumbling 7.7%. Electricity prices fell 1.0%.
- Food prices rose 0.2% in May, with grocery store prices rising 0.1% and prices at restaurants climbing 0.5%.
- Prices excluding food and energy items rose 0.4% and remain up 5.3% year-to-year.
- Core inflation has been very persistent, rising 0.4% in five of the six past months. Shelter, used cars, and motor vehicle insurance were among the largest gainers.
- Bottom line: The smaller rise in the headline CPI gives the Fed room to pause in June. With the core CPI stuck at 5.3%, however, the Fed will likely signal they have more work to do.
The Consumer Price Index rose 0.1% in May, as sharp declines in energy and less price pressure at the grocery store offset gains elsewhere. Prices excluding food and energy items rose 0.4%, with shelter cost responsible for the bulk of that increase. Prices for used cars and trucks, motor vehicle insurance and clothing and apparel all rose solidly as well.
On a year-to-year basis, the headline CPI dipped back to 4% in May, which marks the smallest gain since February 2021. Inflation peaked on a year-to-year basis back in June of last year at 9.1%.
Much of the improvement in the headline CPI has come from lower energy prices. Gasoline prices have plunged 19.7% over the past year, while fuel oil prices have plummeted 37%.
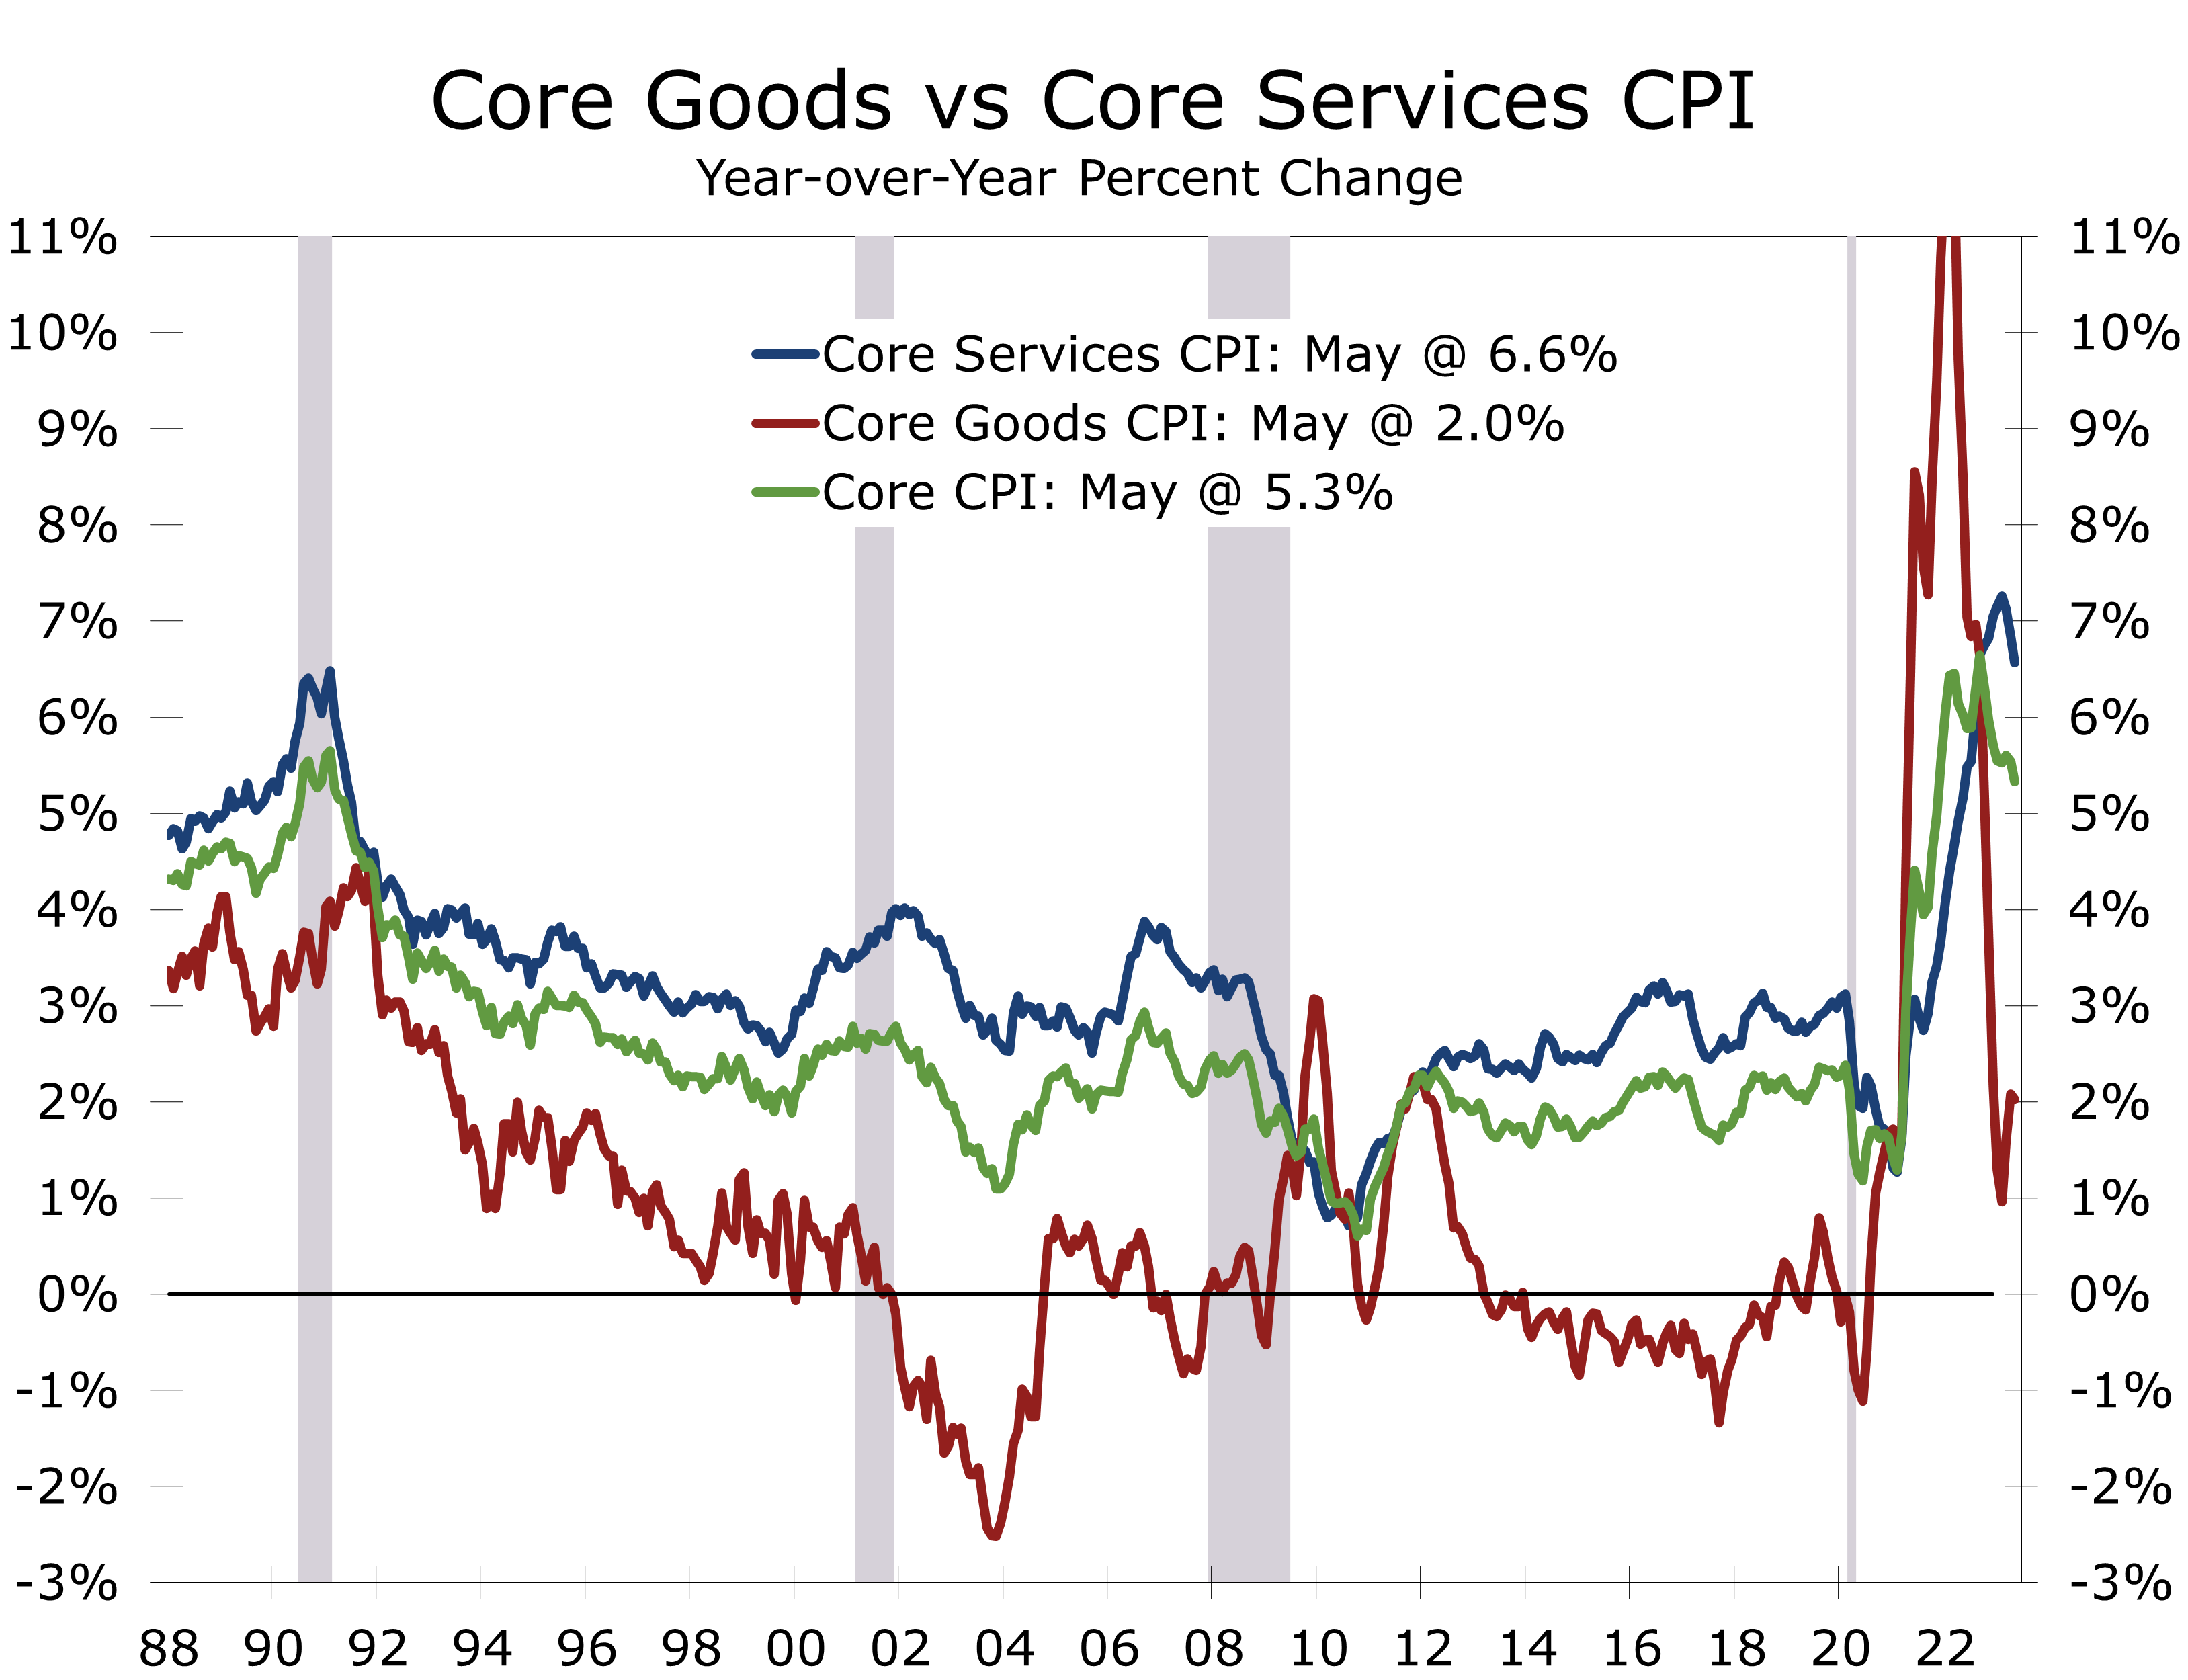
Prices excluding food and energy items rose 0.4% in May and are up 5.3% year-to-year. The core CPI has been remarkably persistent, rising 0.4% in five of the past six months. February was the lone exception when it rose 0.5%. The core peaked at 6.5% in March 2022 and has fallen much less than the headline series.
The core CPI has risen persistently, climbing 0.4% in five of the past six months.
The persistence of core inflation, particularly in the shelter and used car components, continues to focus attention on more leading measures of these prices. Market rents have been decelerating recently, with the latest Apartment List data showing apartment rents up just 0.9% year-to-year compared with an 8.7% increase in the BLS rent measure. Auction prices for used cars have also fallen somewhat.

The mismatch between the more leading market measures and the CPI is another reason for the Fed to take time to reassess where they are in the inflation battle and take a deeper look into how tighter credit conditions will impact the economy. So far, the Fed has been less swayed by the market measures. A rising proportion renters are renewing their leases at higher rents, as home prices have firm back up and mortgage rates have risen. The proportion of household income needed to pay rent or make principal and interest payments also remains near a modern-era high.
The one area where inflation has clearly cooled off is in areas tied to shortages and supply chain bottlenecks. Energy was one of those items and the emptying of the Strategic Petroleum Reserve brought about some immediate relief. Supply chain bottlenecks in general have eased as production has ramped up and shipping rates have fallen back below pre-pandemic levels.
Food prices are another area where inflation is cooling off. Overall food prices rose 0.2% in May, with prices for food at home rising 0.1% and prices for food away from home rising 0.5%. Much of the recent easing in prices at the grocery store has come from a reversal in earlier price spikes. Prices for eggs plunged 13.8%, fish and seafood prices fell 1.6%, and prices for dairy products fell 1.1%. Prices for beef and fresh fruits and vegetables continue to increase, however, and prices for cereals, breads, and snacks remain problematic.
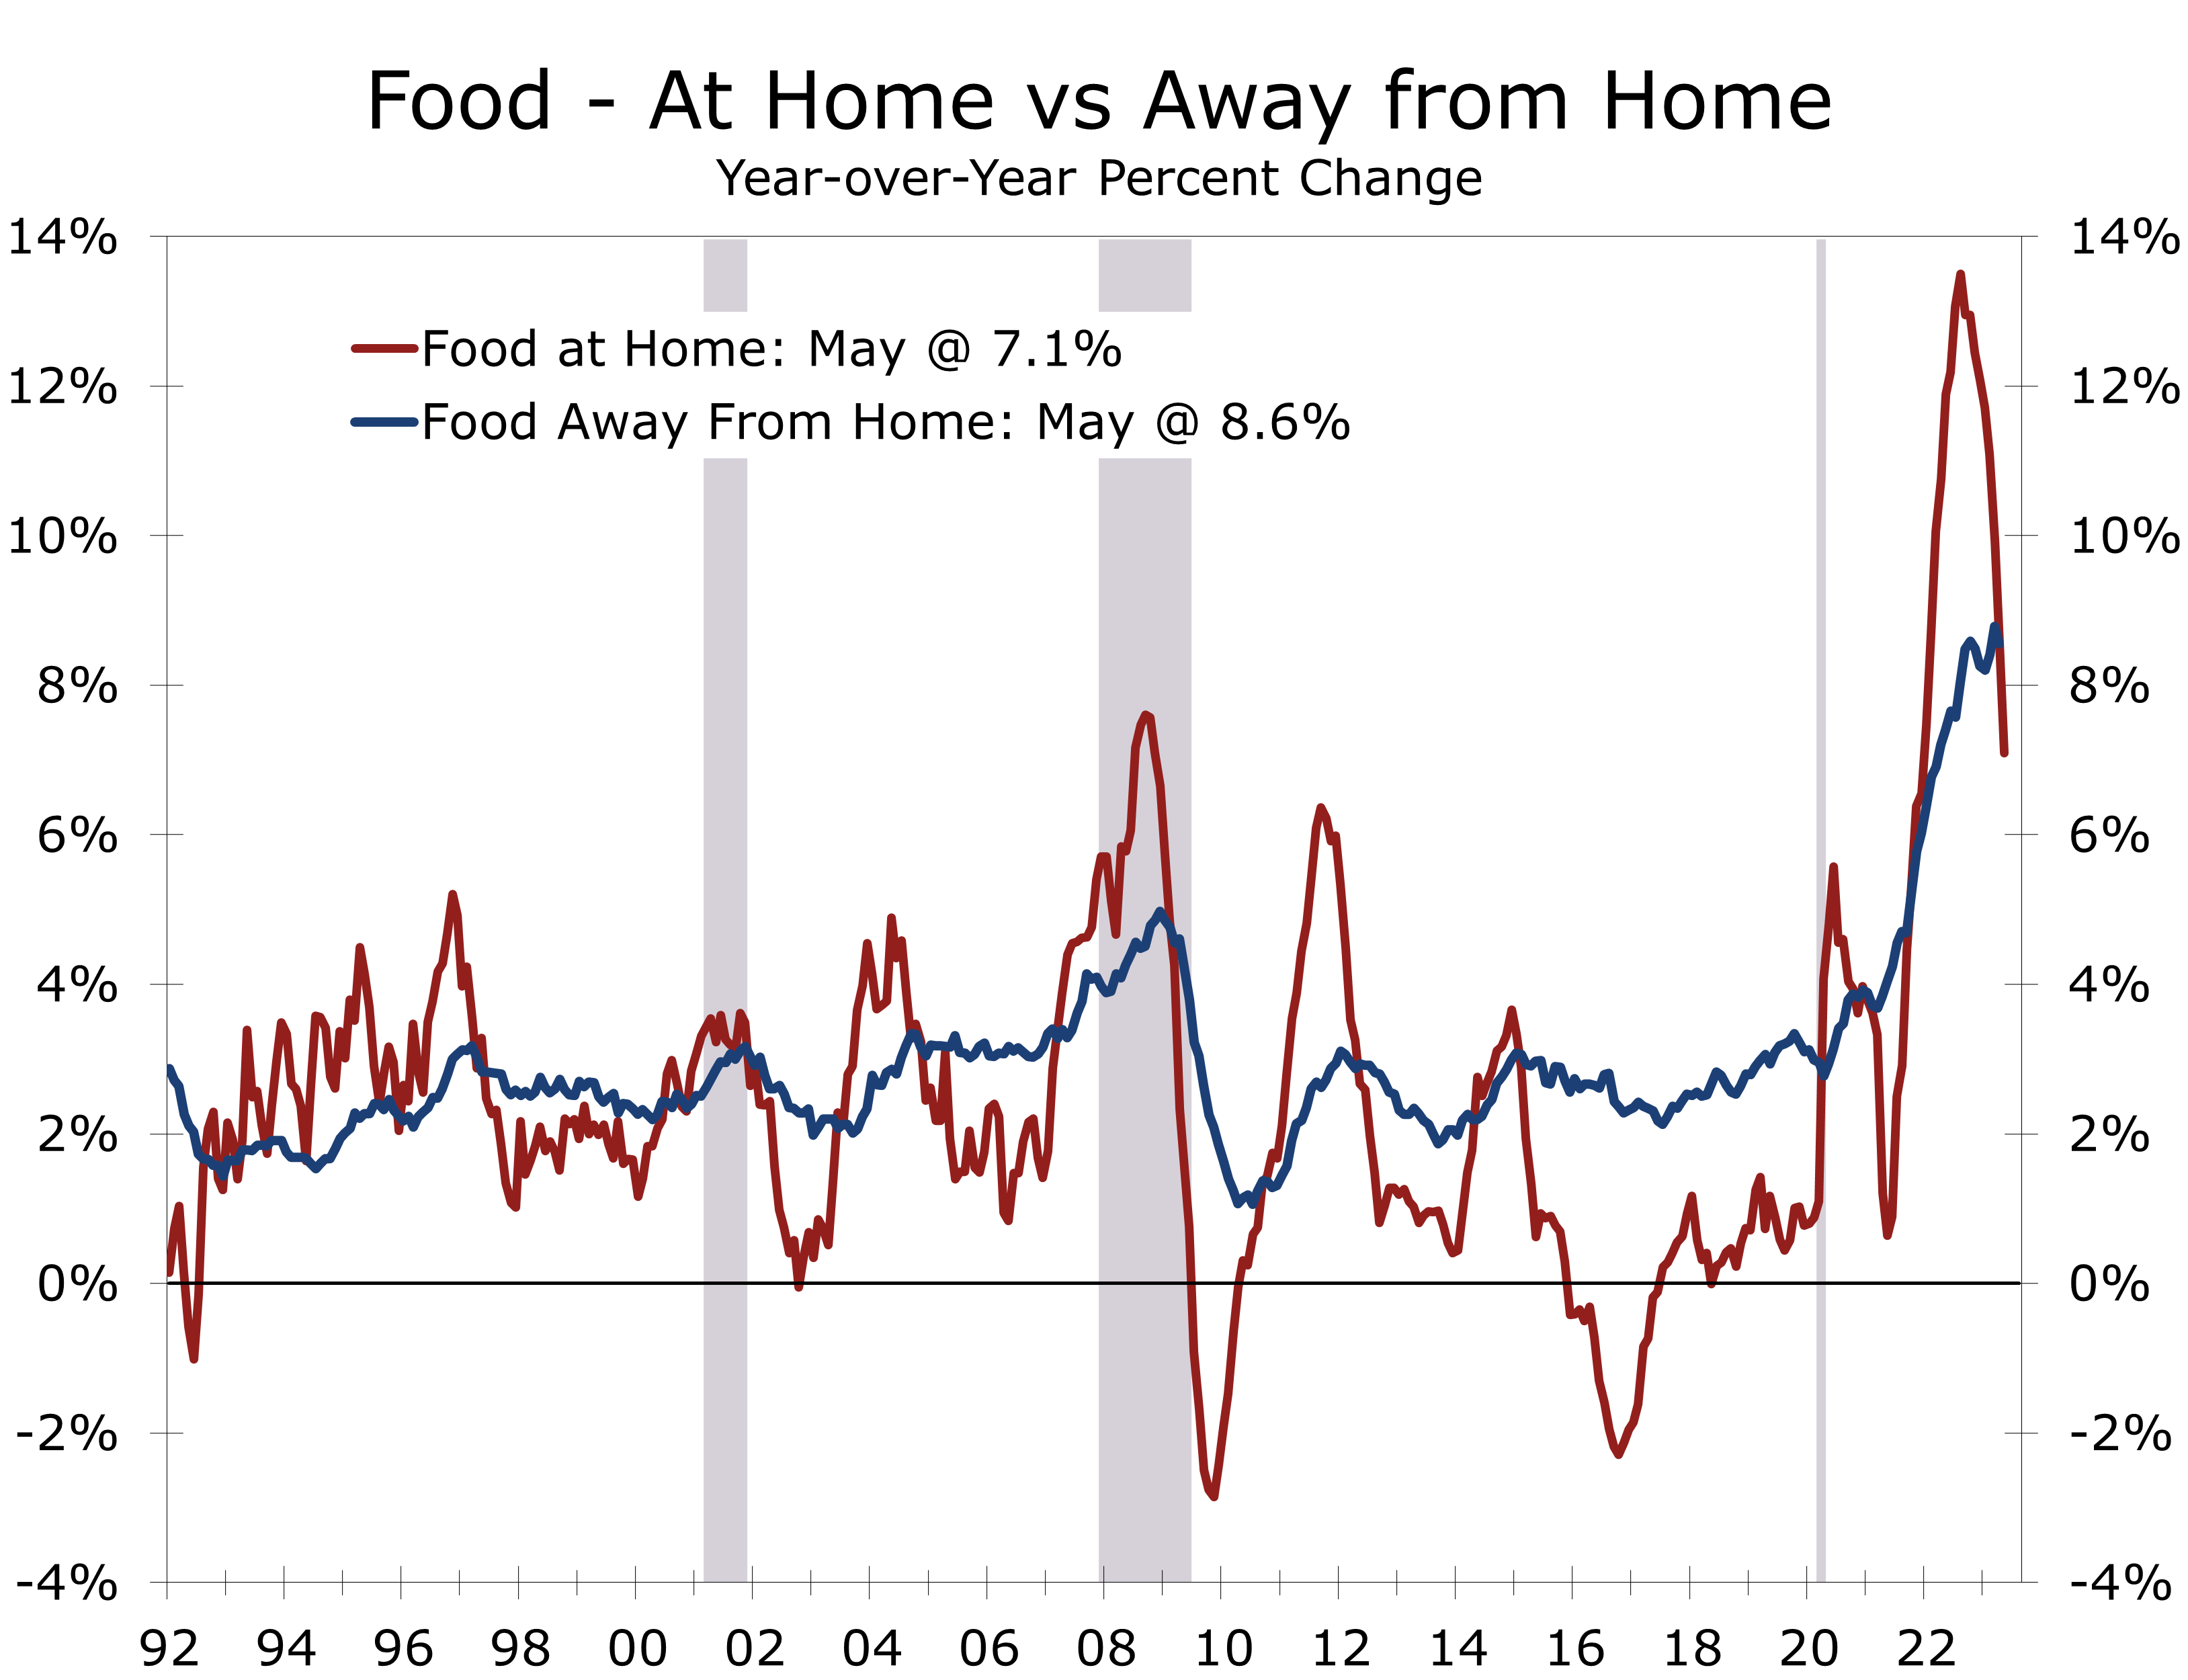
The Fed is also likely to further debate how much higher wages are fueling inflation. Wages are rising the fastest in areas of the economy that are still striving to rehire workers lost during the pandemic. Restaurants are a prime example. Prices at full-service restaurants rose 0.4% in May, while prices at limited-service restaurants rose 0.5%. On a year-to-year basis prices at limited-service restaurants are up 8%, likely reflecting high labor prices.
Services prices in general remain more problematic. Prices for services, excluding energy, rose 0.4% in May, marking the third straight month they rose by that amount. Core services prices are up 6.6% year-to-year. While shelter costs are responsible for much of this gain, prices are also rising in more labor-intensive parts of the economy and will likely persist.
The May CPI data are generally supportive of the Fed pausing its rate hikes in June.
We expect the Fed to leave its federal funds rate target unchanged tomorrow but signal more rate hikes are likely. We expect one more quarter-point hike, most likely in July, and look for tightening credit conditions later this year to do the rest of the Fed’s work for them.
Disclaimer: This publication has been prepared for informational purposes only and is not intended as a recommendation offer or solicitation with respect to the purchase or sale of any security or other financial product nor does it constitute investment advice.
Nonfarm Payrolls Jump in May
Job Growth Continues to Baffle Wall Street
- Employers added 339,000 jobs in May, easily outpacing the consensus forecast of 190,000. The whisper number was even lower.
- Job growth for the prior two months was also revised higher by a combined 93,000 jobs.
- Job gains were broad based, with nearly every key industry adding jobs in May.
- Health care and social assistance was the top gainer, adding 74,600 jobs.
- Business and professional services added 64,000 jobs, with particularly strong gains in professional, scientific, and technical services.
- Construction added 25,000 jobs, while manufacturing lost 2,000.
- The unemployment rate jumped 0.3 percentage points to 3.7%, as the household employment measure fell by 310,000 jobs.
- Bottom line: Job growth is still way too strong for the Fed to end its tightening regimen. While a pause is likely, May’s outsized job gains and upward revisions to prior data puts a quarter-point hike in June back on the table.
Employers added 339,000 jobs to nonfarm payrolls in May, easily blowing past the consensus estimate of 190,000 jobs. Gains for the prior two months were revised up by a combined 93,000 jobs, which weakens the argument that growth had cooled off enough for the Fed to either take a break from rate hikes in June or end them entirely. The more volatile household data were weak, however, with the number of employed declining by 310,000 in May. Reconciling the data to make them consistent with the nonfarm data, however, yields an even larger gain of 394,000 jobs in May.
While the net number of jobs added was stronger than expected, hours and earnings were soft. Average weekly hours fell 0.1 to 34.3 hours. Average hourly earnings rose just 0.3% and average weekly earnings were essentially flat. The factory workweek was unchanged at 40.1 hours, although overtime rose 0.1 to 3.0 hours. Hours and earnings for production and non-supervisory workers was a touch stronger, however, so industrial production and wages and salaries should remain modestly positive.
GDP growth will likely continue to lag job growth, reflecting sluggish productivity gains.
While the jobs figures throw more cold water on the notion the economy is on the precipice of recession, second quarter GDP growth still looks to be fairly sluggish. Aggregate hours worked have fallen in 2 of the past 3 months and are rising at just a 1.2% pace from their first quarter average.
After adjusting the household employment data so they are consistent with the nonfarm data, both show remarkably strong gains in May and the past 3 months.

Not only was job growth stronger than expected in May but gains continue to be exceptionally broad based. The largest gains continue to come from industries that have had the most trouble staffing back up following the pandemic. Health care and social assistance added 74,600 jobs in May, with strong gains at doctors’ and dentists’ offices and hospitals. The gains reflect some catchup with patients that had put off visits to the doctor during the pandemic. Nursing homes and childcare centers also continue to restaff, adding back a combined 12,500 jobs.
Leisure and hospitality continue to add jobs back at a rapid clip. Restaurants, bars, and hotels added 34,400 jobs in May and arts, sports and entertainment venues added 13,700 jobs. Even after May’s gains, leisure and hospitality employment remains 2.1%, or 349,000 jobs below its pre-pandemic level.
One of the bigger surprises this month was the outsized gains in professional and business services, which added 64,000 jobs in May, following a similar sized gain the prior month. Professional, scientific and technical services added 43,000 jobs with accounting firms and technology consultants posting strong gains.
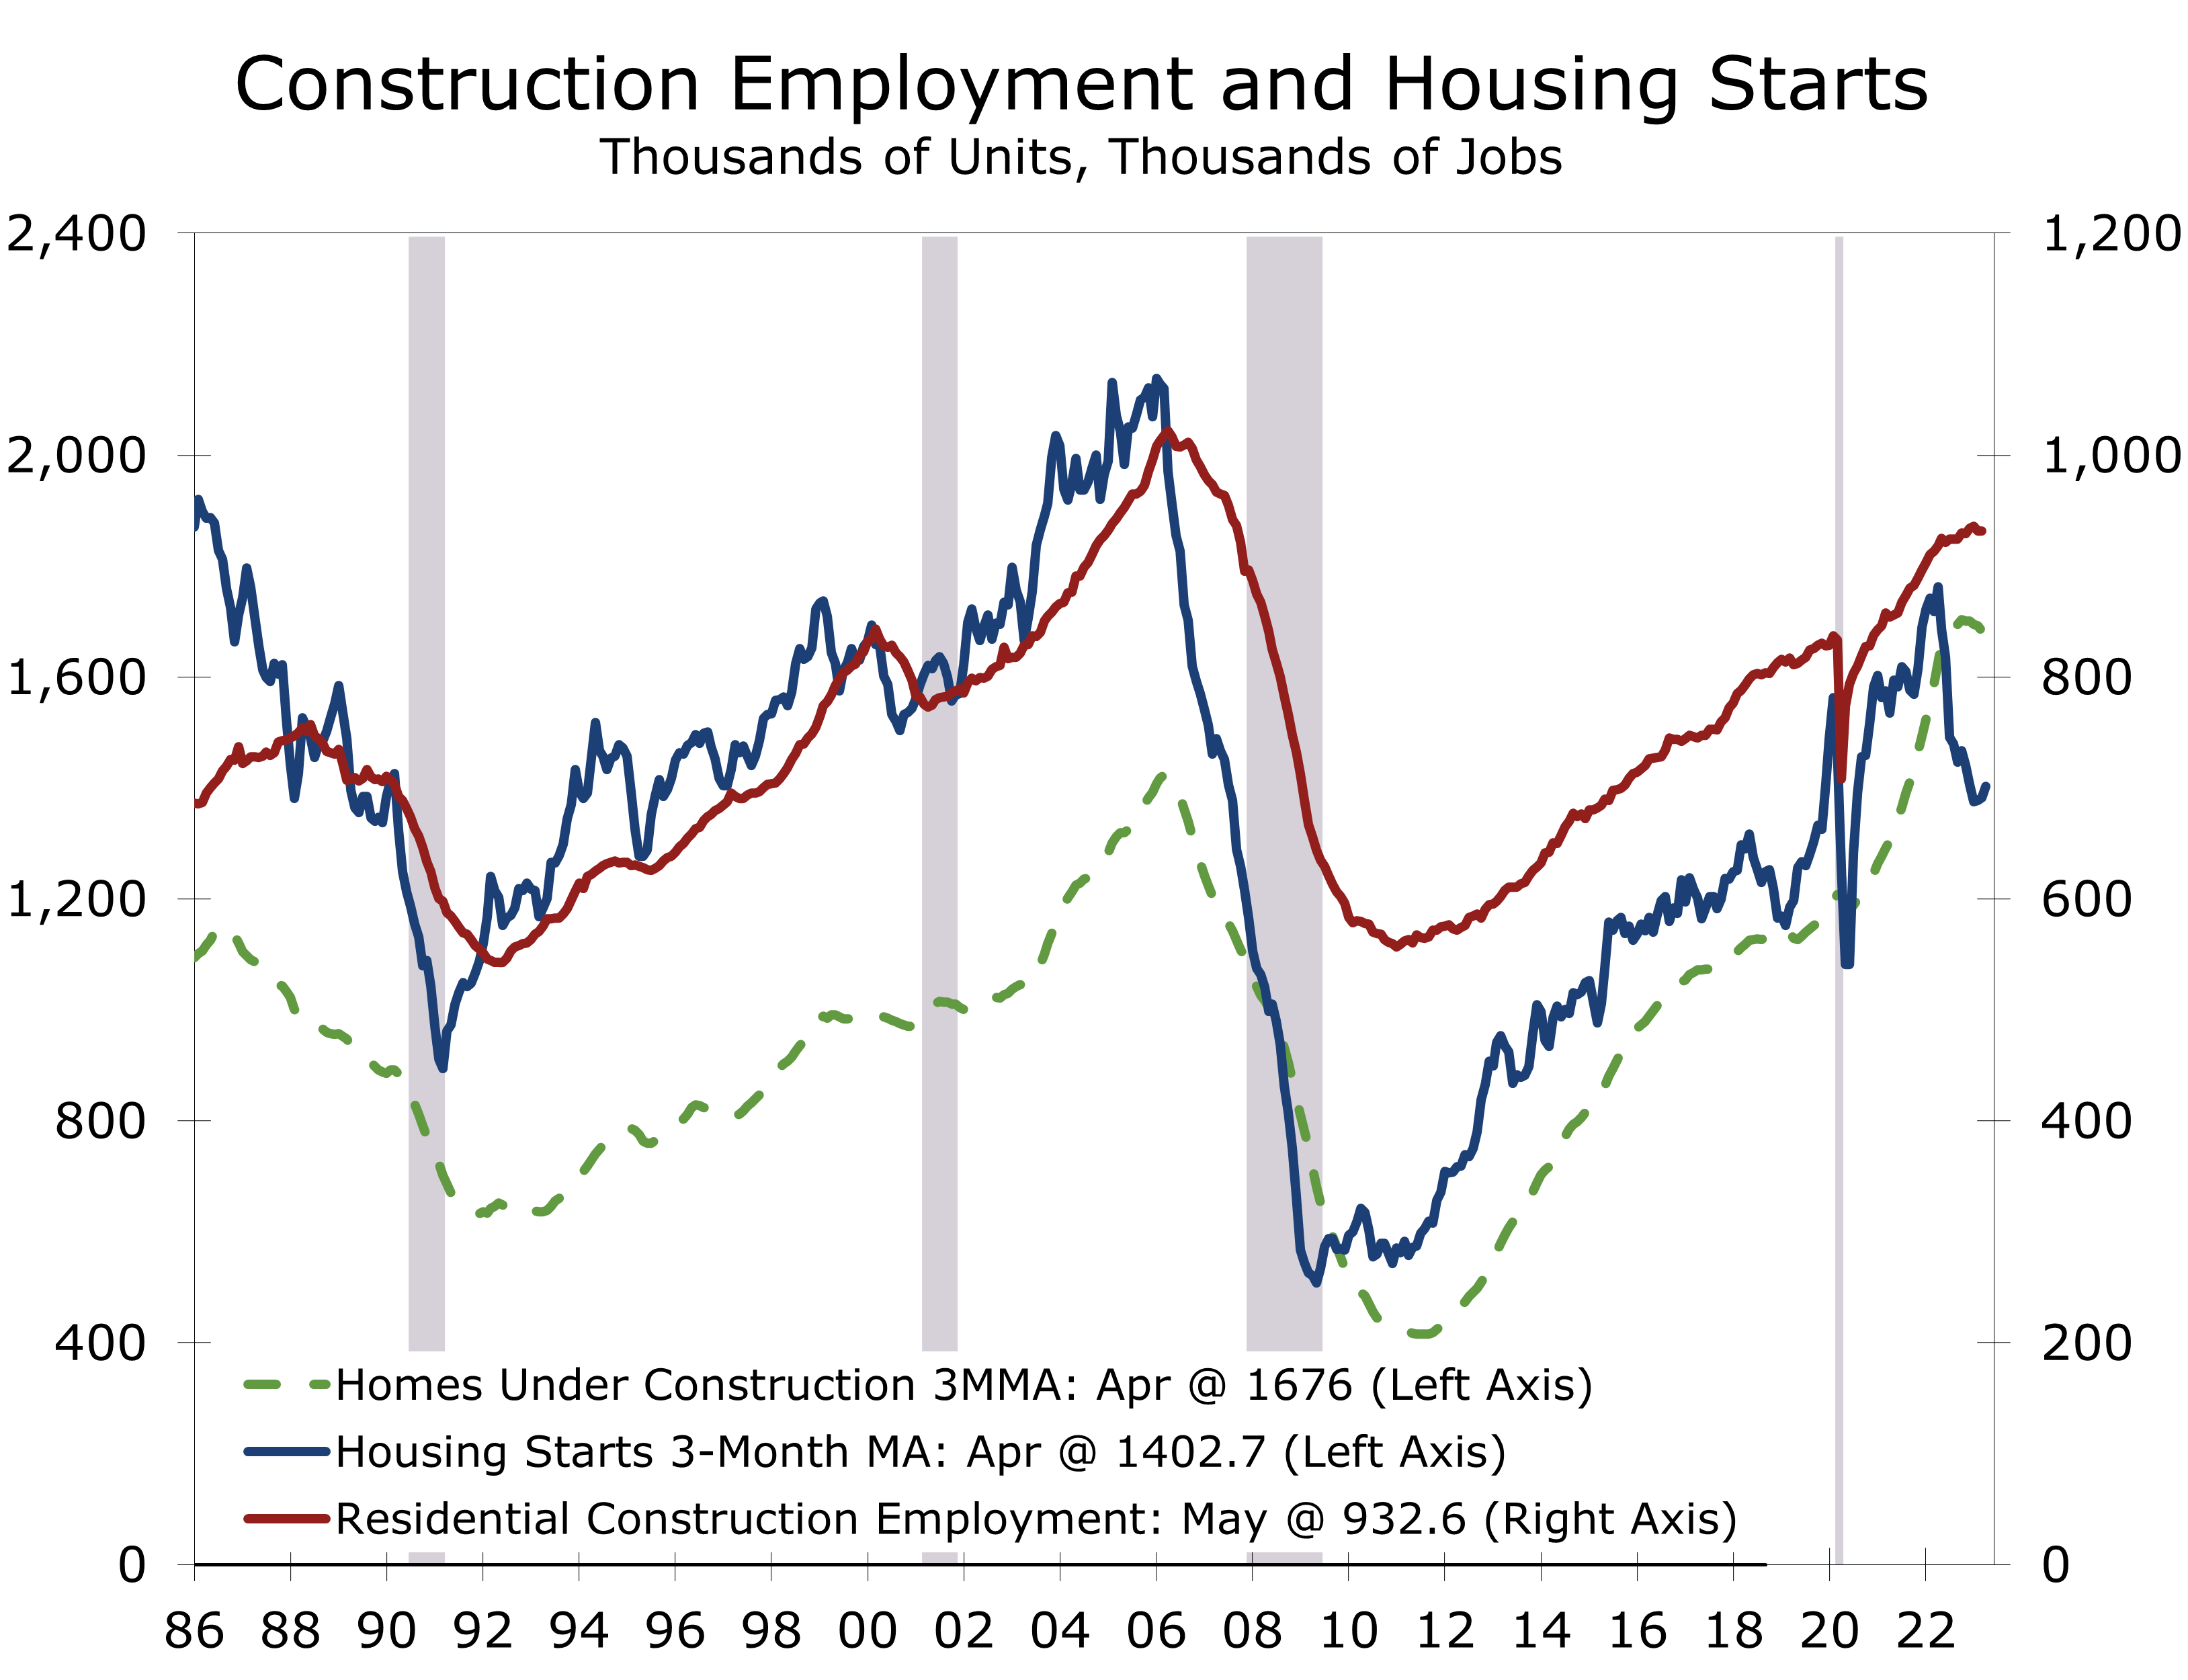
Construction remains a bright spot, with a net 25,000 jobs added in May. The growth reflects the unusually large number of homes and apartments currently under construction. Industry payrolls will likely soften a bit later this year, as more homes are completed.
The divergence between the strong employment gains and weak hours data is a red flag that something may be amiss in the employment data. Average weekly hours are usually a leading indicator for job growth and the recent weakness suggests hiring will slow or may be overstated. One area where we could see some payback is private and public education. The May and June data often see wide swings in such jobs due to the timing of the end of the school year, which varies from year to year. Private education added 22,300 jobs in May, while public schools added 24,300 jobs.
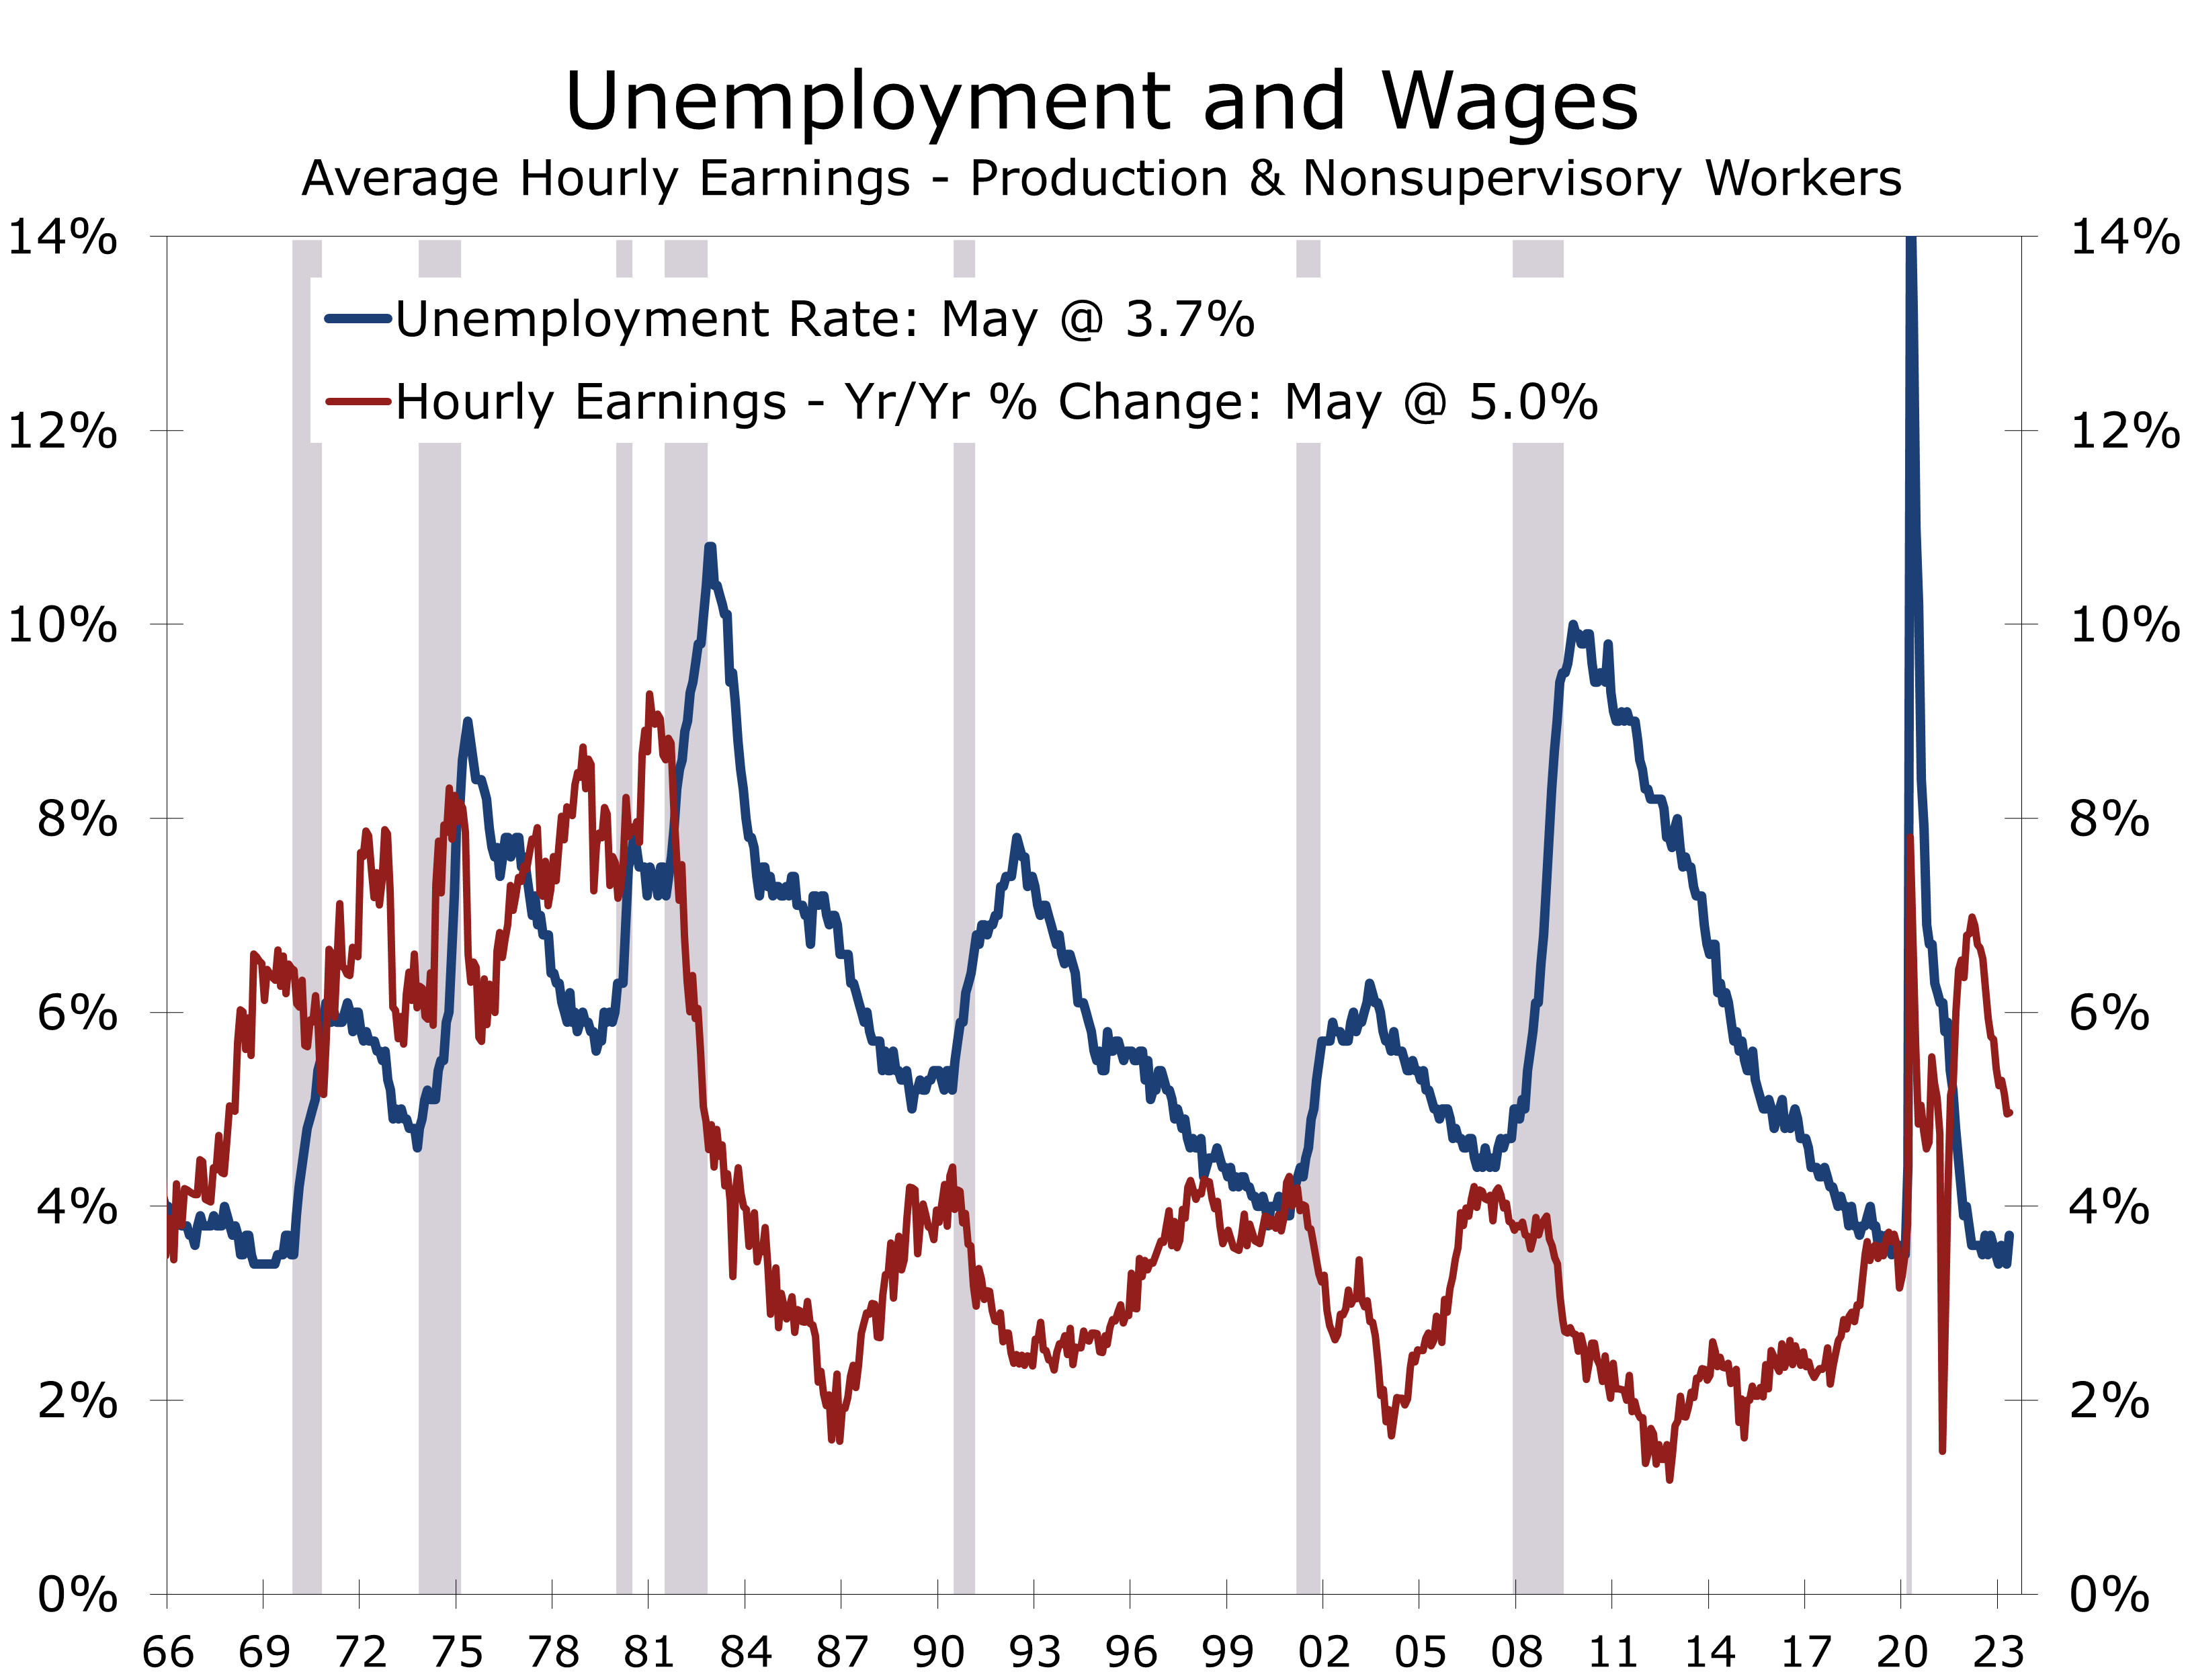
Of course, the other red flag is the 0.3 percentage point rise in the unemployment rate to 3.7%. The rise results from a 310,000 drop in household employment and a 130,000-person rise in the labor force. As noted earlier, however, household employment rose 394,000 after adjusting the data to be consistent with the nonfarm employment measure, with a suspiciously large drop in self-employment accounting for the difference.
The rise in the unemployment rate is due to a sharp, and dubious, drop in self-employment.
A 0.3 percentage point rise in the unemployment rate is still significant, however, and is consistent with the deterioration noted earlier this week in the job outlook components of the Consumer Confidence survey.
Disclaimer: This publication has been prepared for informational purposes only and is not intended as a recommendation offer or solicitation with respect to the purchase or sale of any security or other financial product nor does it constitute investment advice.
Manufacturing Activity Weakened in May
While Production is Holding Up, Manufacturing Is Clearly Losing Steam
- The ISM Manufacturing Index fell 0.2 points to 46.9 in May, marking its sixth consecutive month in contraction territory.
- Production and employment – the Index’s most current components - both rose in May and are consistent with gains in industrial production and employment.
- New orders – the most leading component – fell 3.1 points to 42.6. The order backlog series tumbled 5.6 points to 37.6 and is consistent with production cuts and manufacturing layoffs later this year.
- Supplier deliveries fell 1.1 points to 43.5, with fewer firms reporting shortages.
- The prices paid index plunged 9 points to 44.2 in May, more than reversing the prior month’s increase and falling to its lowest level this year.
- Bottom line: Normalizing supply chains and diminishing labor shortages are providing a short-term boost to manufacturing but conditions will likely weaken later this year.
The Institute for Supply Management (ISM) noted manufacturing conditions continued to weaken in May. The ISM Manufacturing Index fell 0.2 points to 46.9 and has now remained below the key 50-break even level for the past six months. The details of the report are mixed. The more current components rose in May and remain in positive territory, while the more leading components fell sharply and hit levels that in the past have presaged a pullback in manufacturing activity or outright recession.
Early in his tenure, former Fed Chair Alan Greenspan noted the ISM manufacturing survey was one of the key pieces of data he reviewed closely each month to determine the health of the economy. While manufacturing represents a smaller share of the overall economy today, it still accounts for the bulk of cyclical swings in economic activity and is one of the earliest and most reliable reports released each month. The data are generated by a private trade association and are rarely revised in a significant way.
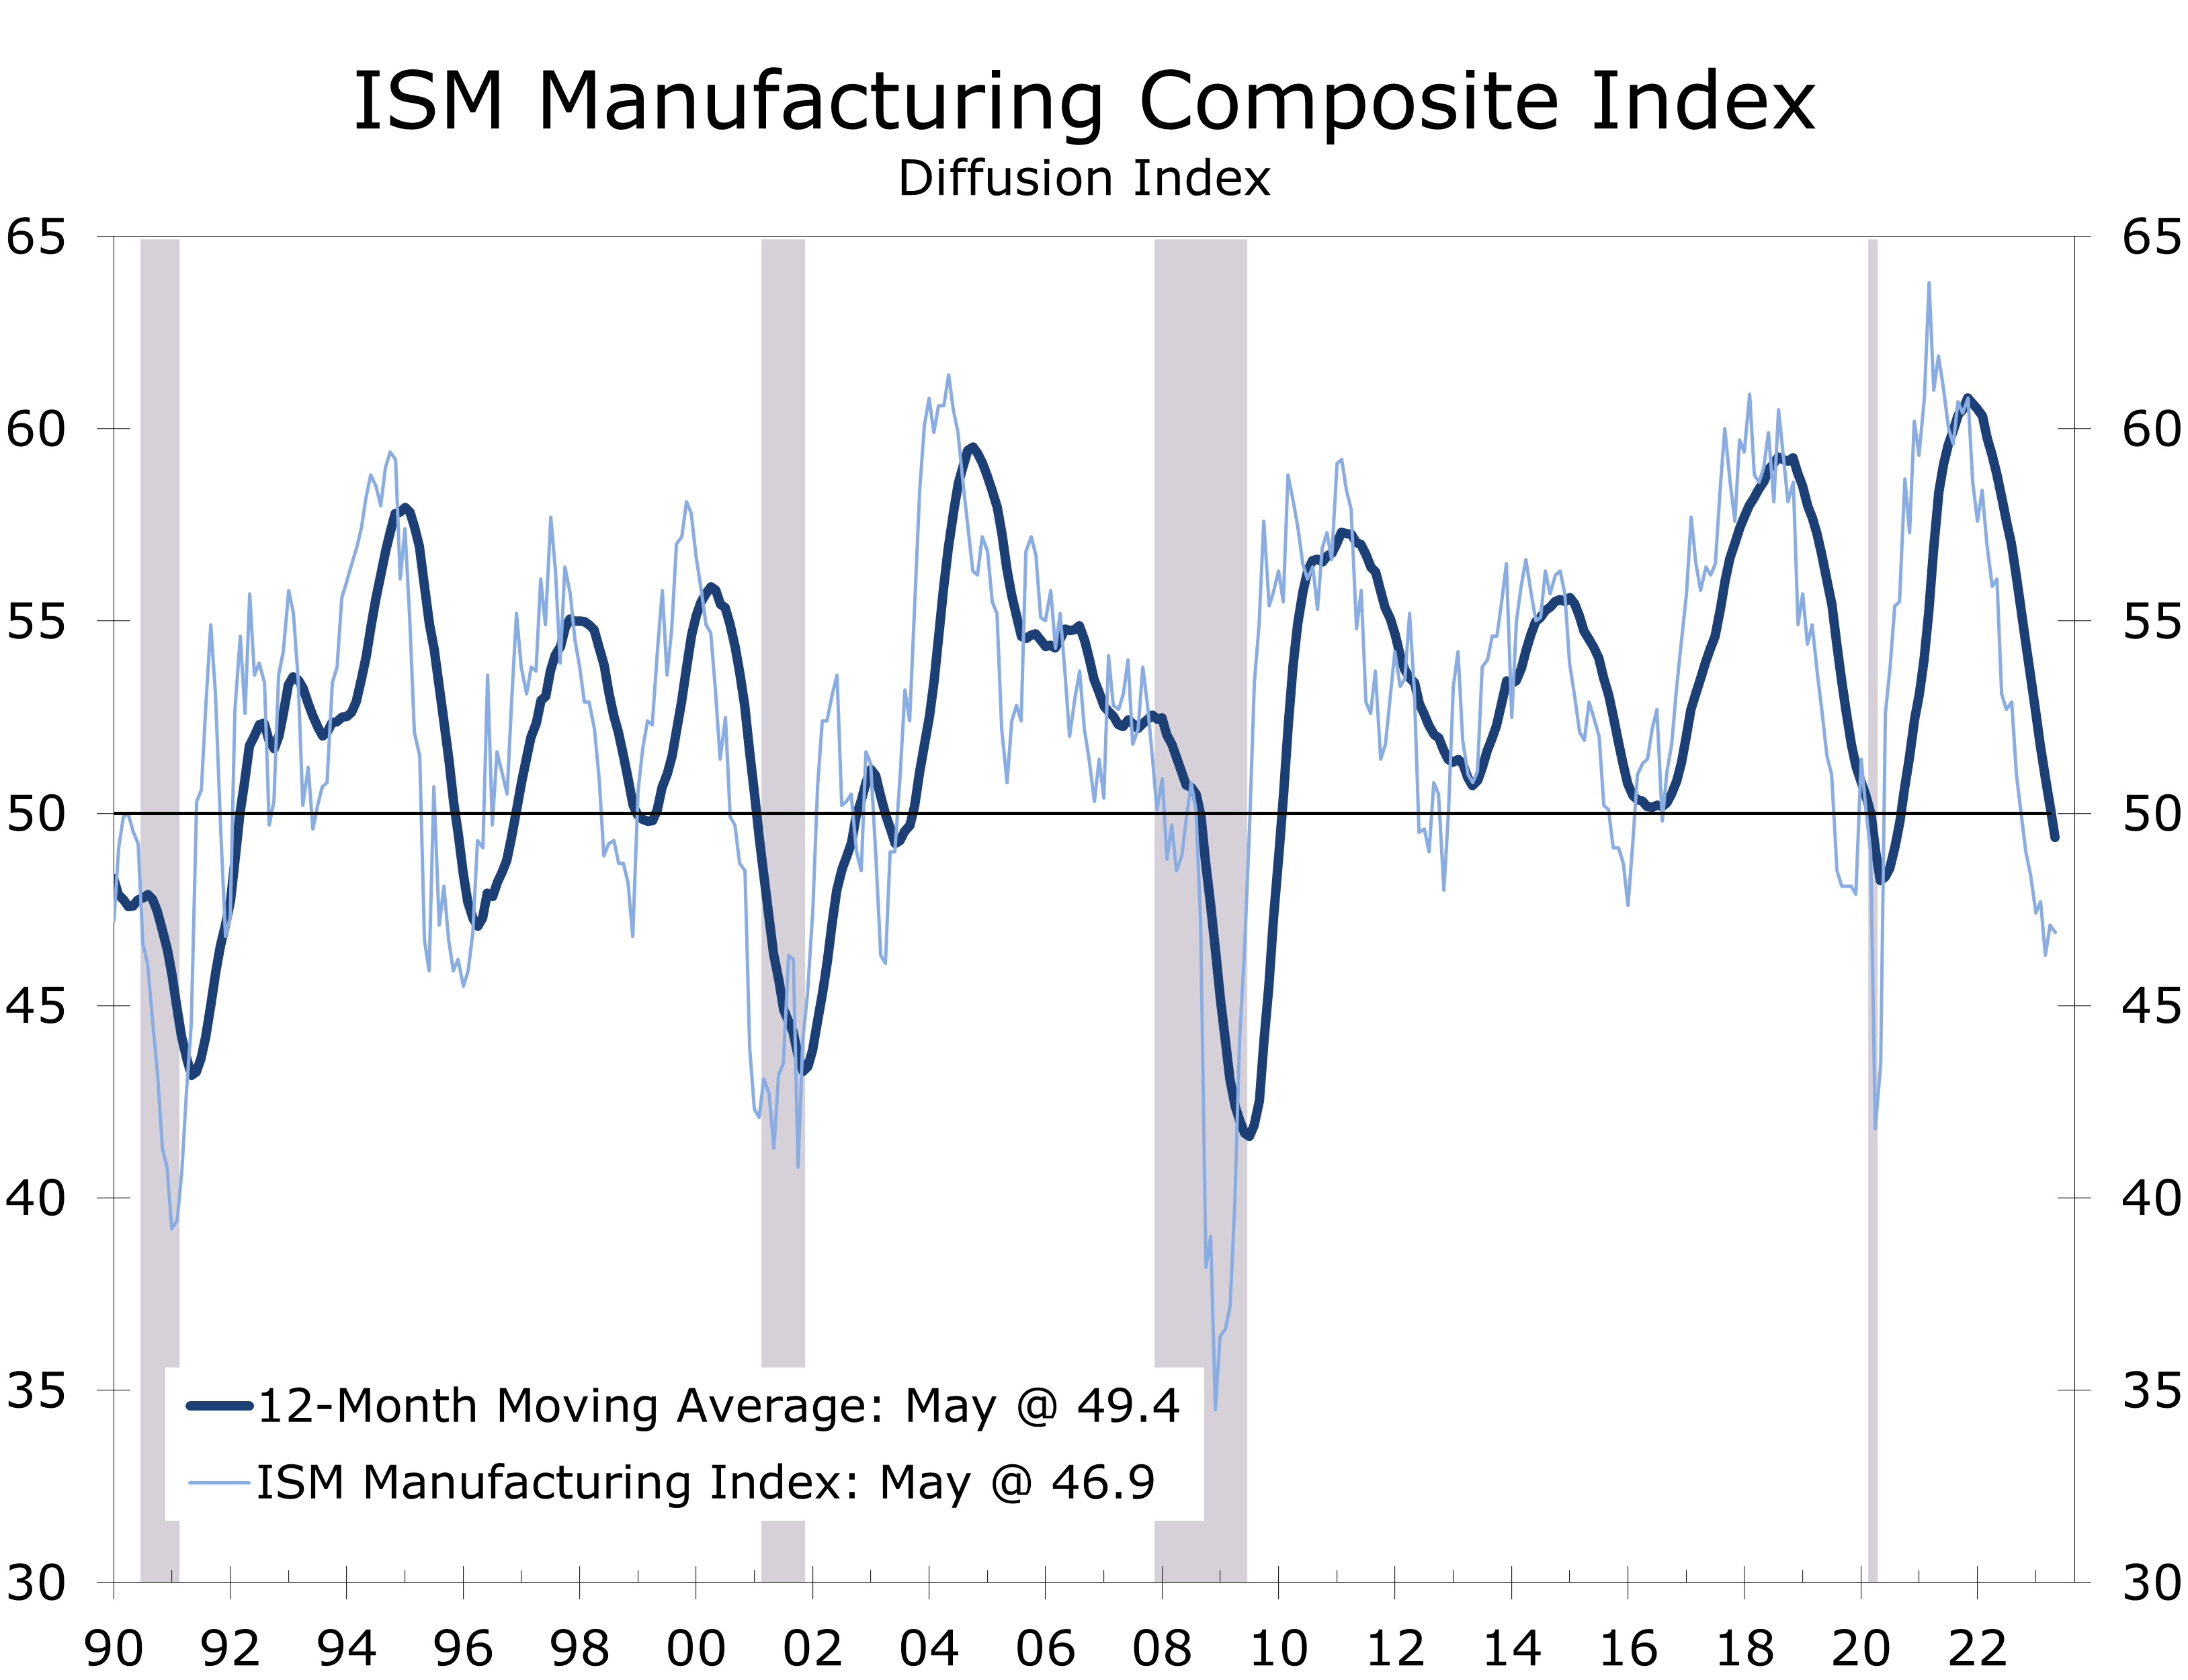
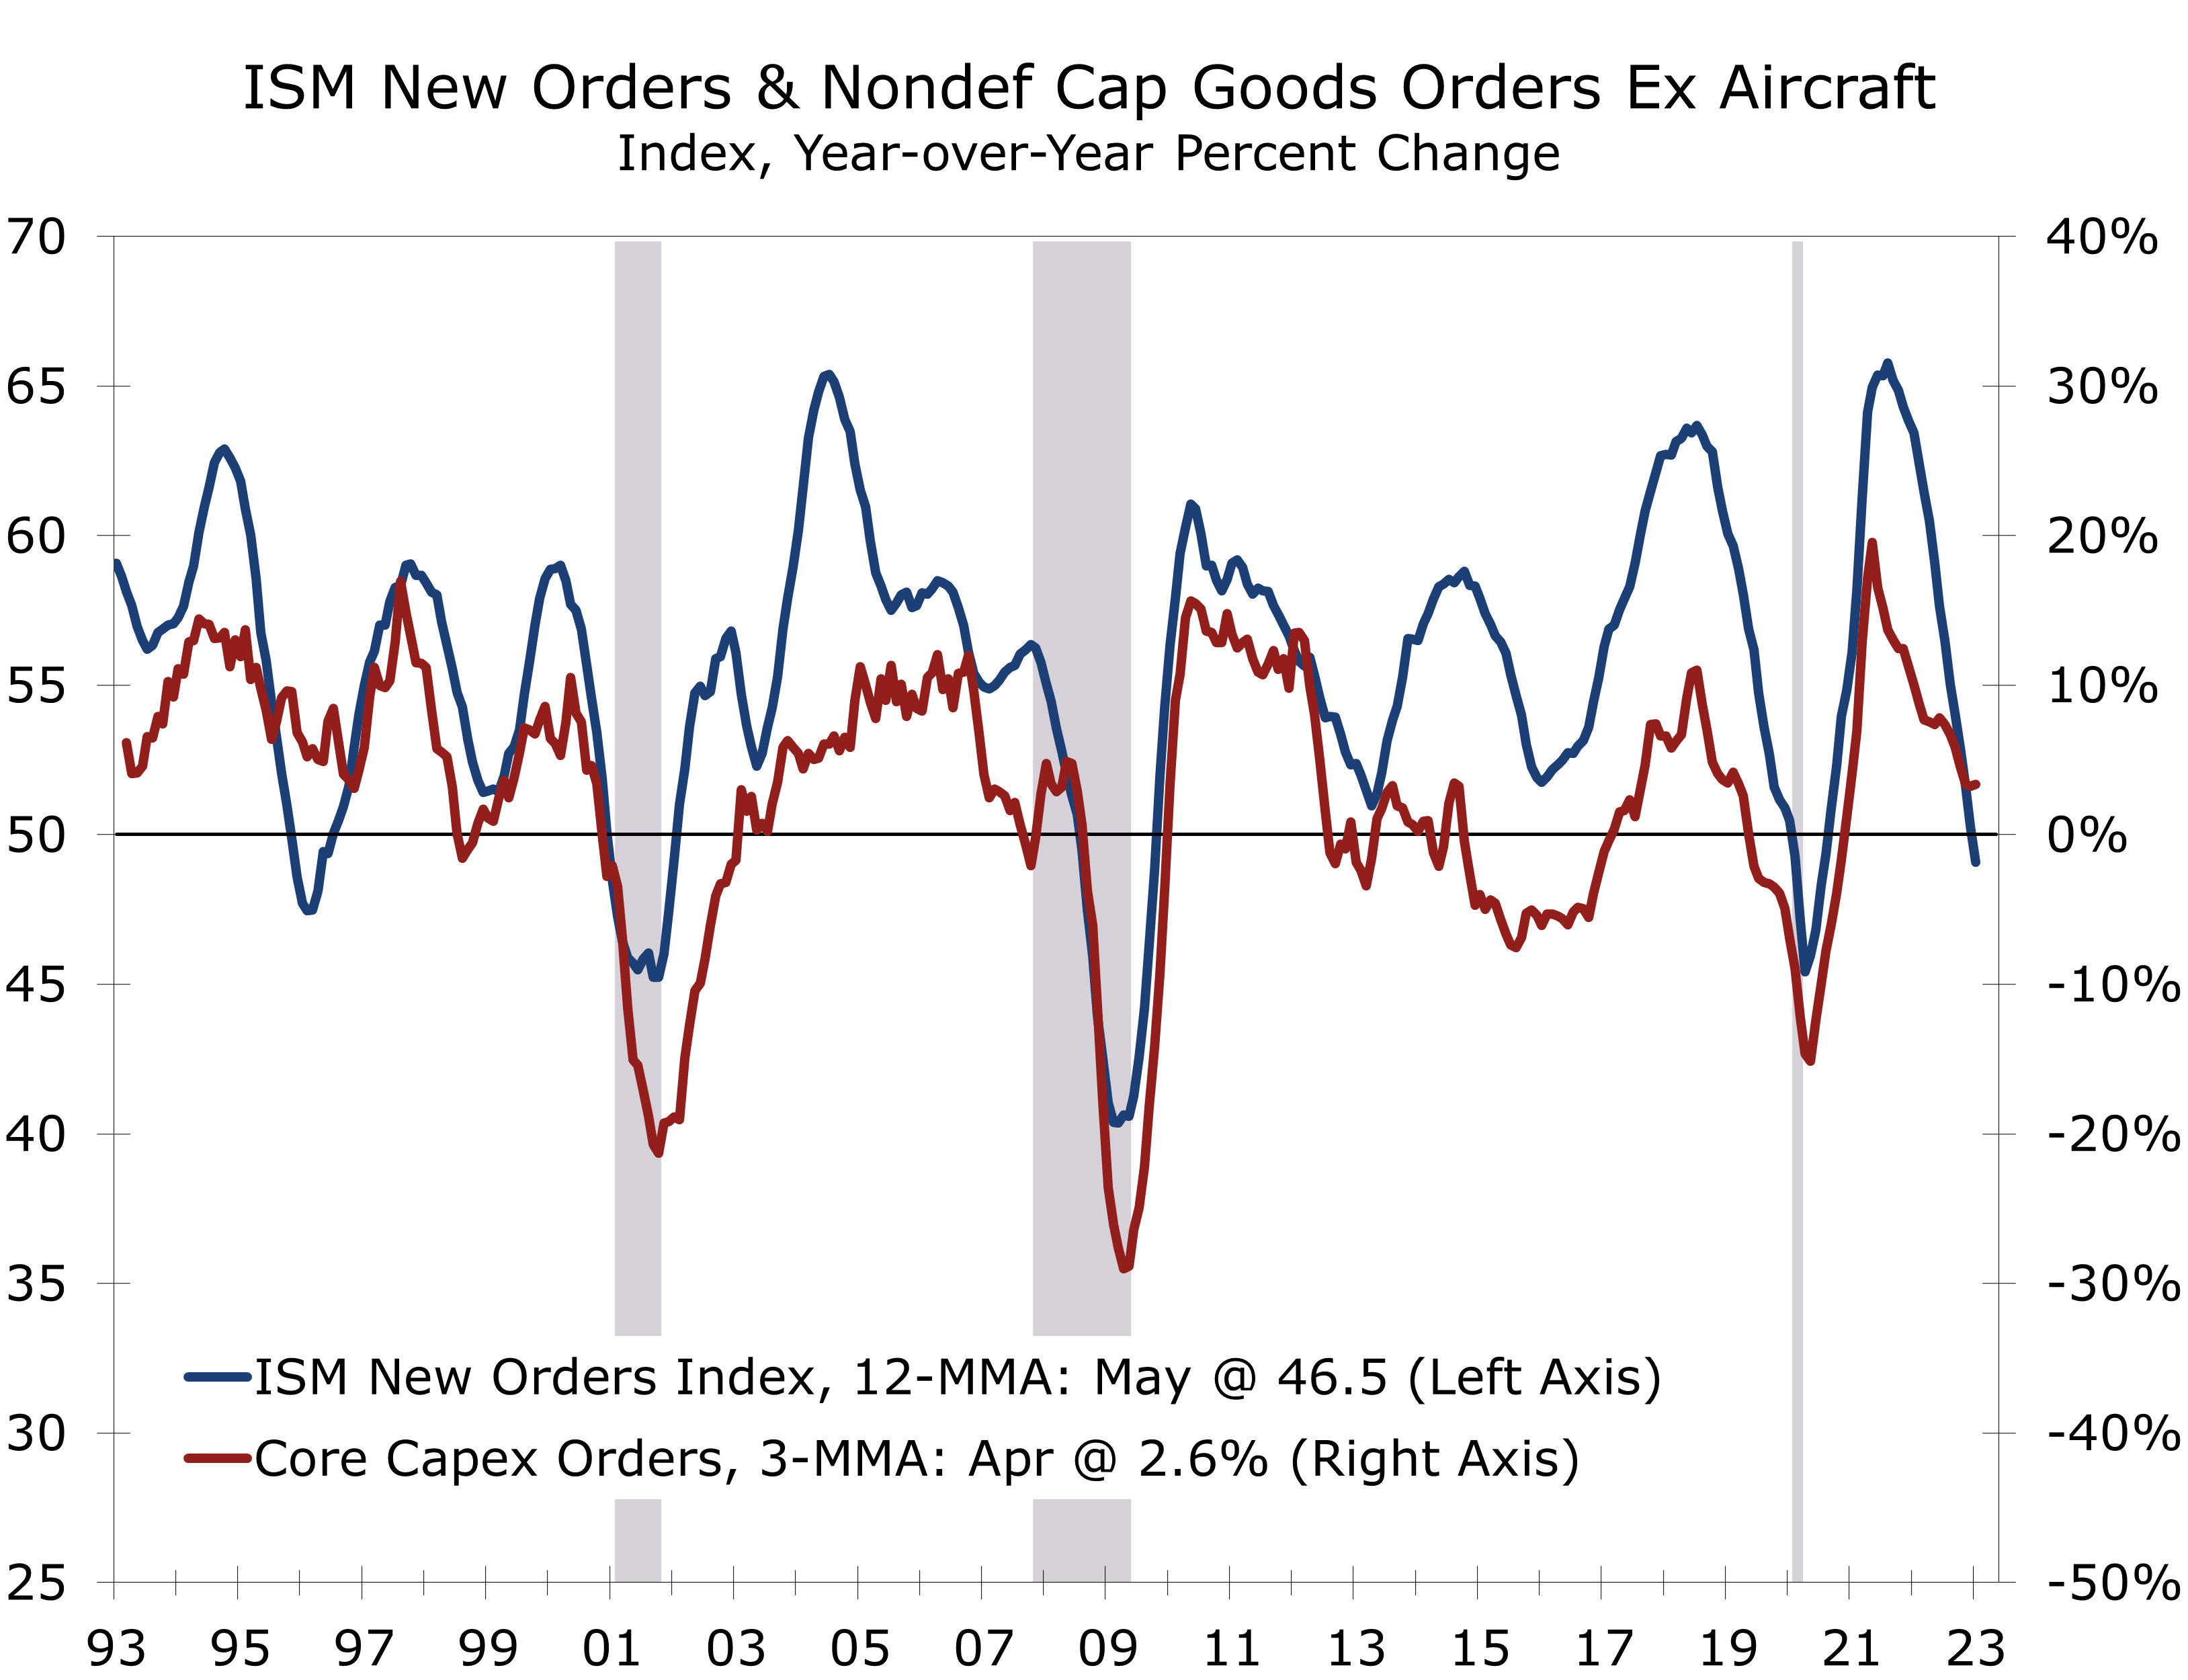
The 12-month average of the ISM has fallen below 50, consistent with a pause in rate hikes.
The ISM index provides insight into the direction and breadth of manufacturing activity. Generally, the broader a trend is, the more certain and enduring that trend will be. The 12-month moving average of the ISM index has now fallen below 50, something that has typically only occurred at the onset of a recession or soft landing. Moreover, in all prior instances, this event has also marked the end of Fed rate hikes.
The rebound from the pandemic has made interpreting the ISM report and most other economic data more difficult. The supplier delivery index surged as the economy reopened and vastly overstated the strength of the manufacturing sector, as longer delivery times are usually a sign that manufacturers are so busy, they take longer to respond to new orders. Following pandemic, however, epic supply shortages meant many manufacturers could not get the inputs needed to make their products.
Supply chains have normalized considerably over the past year, which has caused the supplier delivery index to plummet from its unusually high levels. Most manufacturers report delivery times have normalized, yet few have said they are unusually short. This may indicate normalizing supply chains are overstating the weakness in the overall ISM index.
One way you can easily see this is with the notable split between supplier deliveries and production. With inputs more readily available, production has increased. Transportation equipment is a notable example. Shortages of microchips slowed motor vehicle assemblies for months after the economy reopened. Production has ramped up more recently as shortages have subsided. The ISM noted that of the six biggest manufacturing industries, transportation equipment was the only one that grew in May.
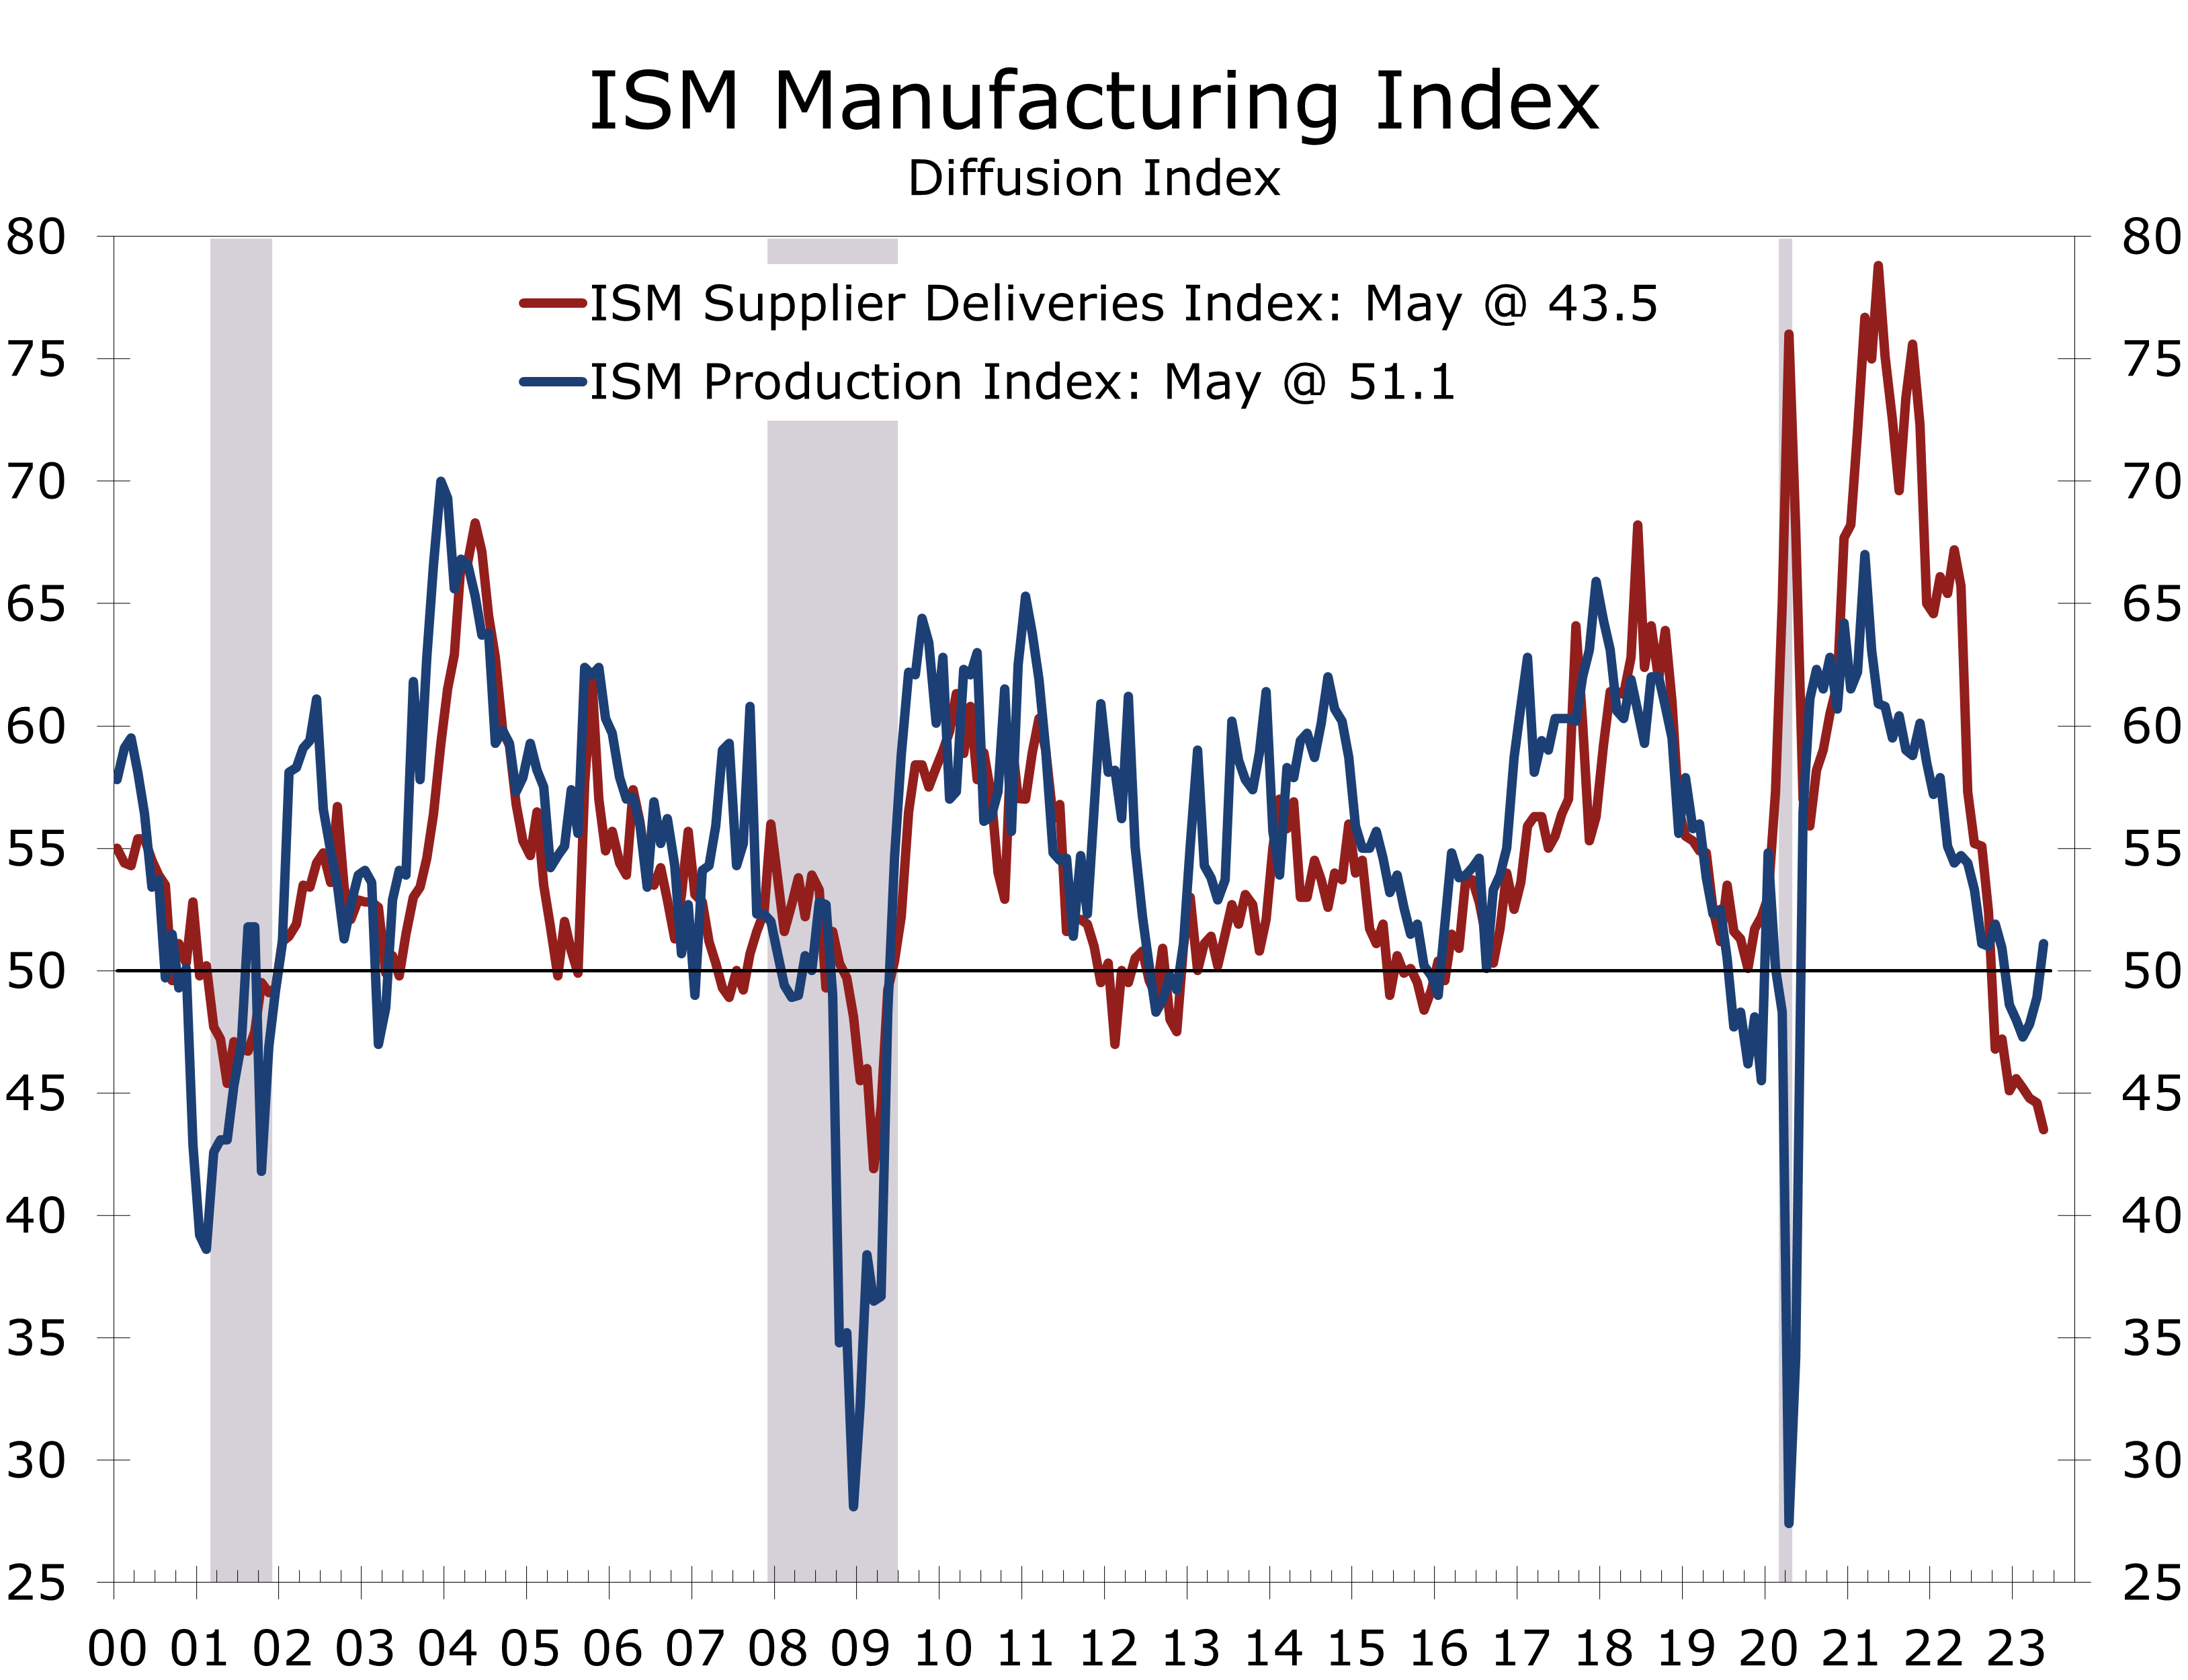
Labor shortages have also eased a bit, enabling more hiring. The ISM employment index rose 1.2 points in May to 51.4. Among the largest industries, producers of transportation equipment and machinery both reported employment gains.
While overall production and employment likely expanded in May, the more leading components of the ISM are clearly pointing to a slowdown. The new orders index fell 3.1 points in May to 42.6 and none of the six largest industries reported a rise in orders. The recent slide in the ISM orders index suggests capital spending will be a drag on growth later this year. Moreover, unfilled orders tumbled 5.6 points to 37.5, a level that in the past has presaged a recession or significant slowdown in manufacturing activity and resulted in meaningful job losses.
The recent slide in ISM orders suggests capex will be a drag on growth later this year.
Cooling economic growth in the US and around the world has helped normalize supply chains and reduce input prices. The ISM prices index plummeted 9 points in May to 44.2, which is another piece of supporting evidence for a pause in rate hikes in June.
Disclaimer: This publication has been prepared for informational purposes only and is not intended as a recommendation offer or solicitation with respect to the purchase or sale of any security or other financial product nor does it constitute investment advice.
Consumers Remain Resilient
Consumer Confidence Remains at Levels Consistent with Continued Economic Gains
- The Consumer Confidence Index fell 1.4 points in May to 102.3. Data for April were revised higher, so the Index still came in higher than expected despite the drop.
- The present situation series fell 3.2 points to 148.6 but remains consistent with strong economic growth.
- The expectations index fell 0.2 points to 71.5 and remains at levels consistent with a recession beginning within the next year.
- The share of consumers reporting jobs were plentiful fell 4 points in May to 43.5%, while the share stating jobs were hard to get rose 1.9 points to 12.5%.
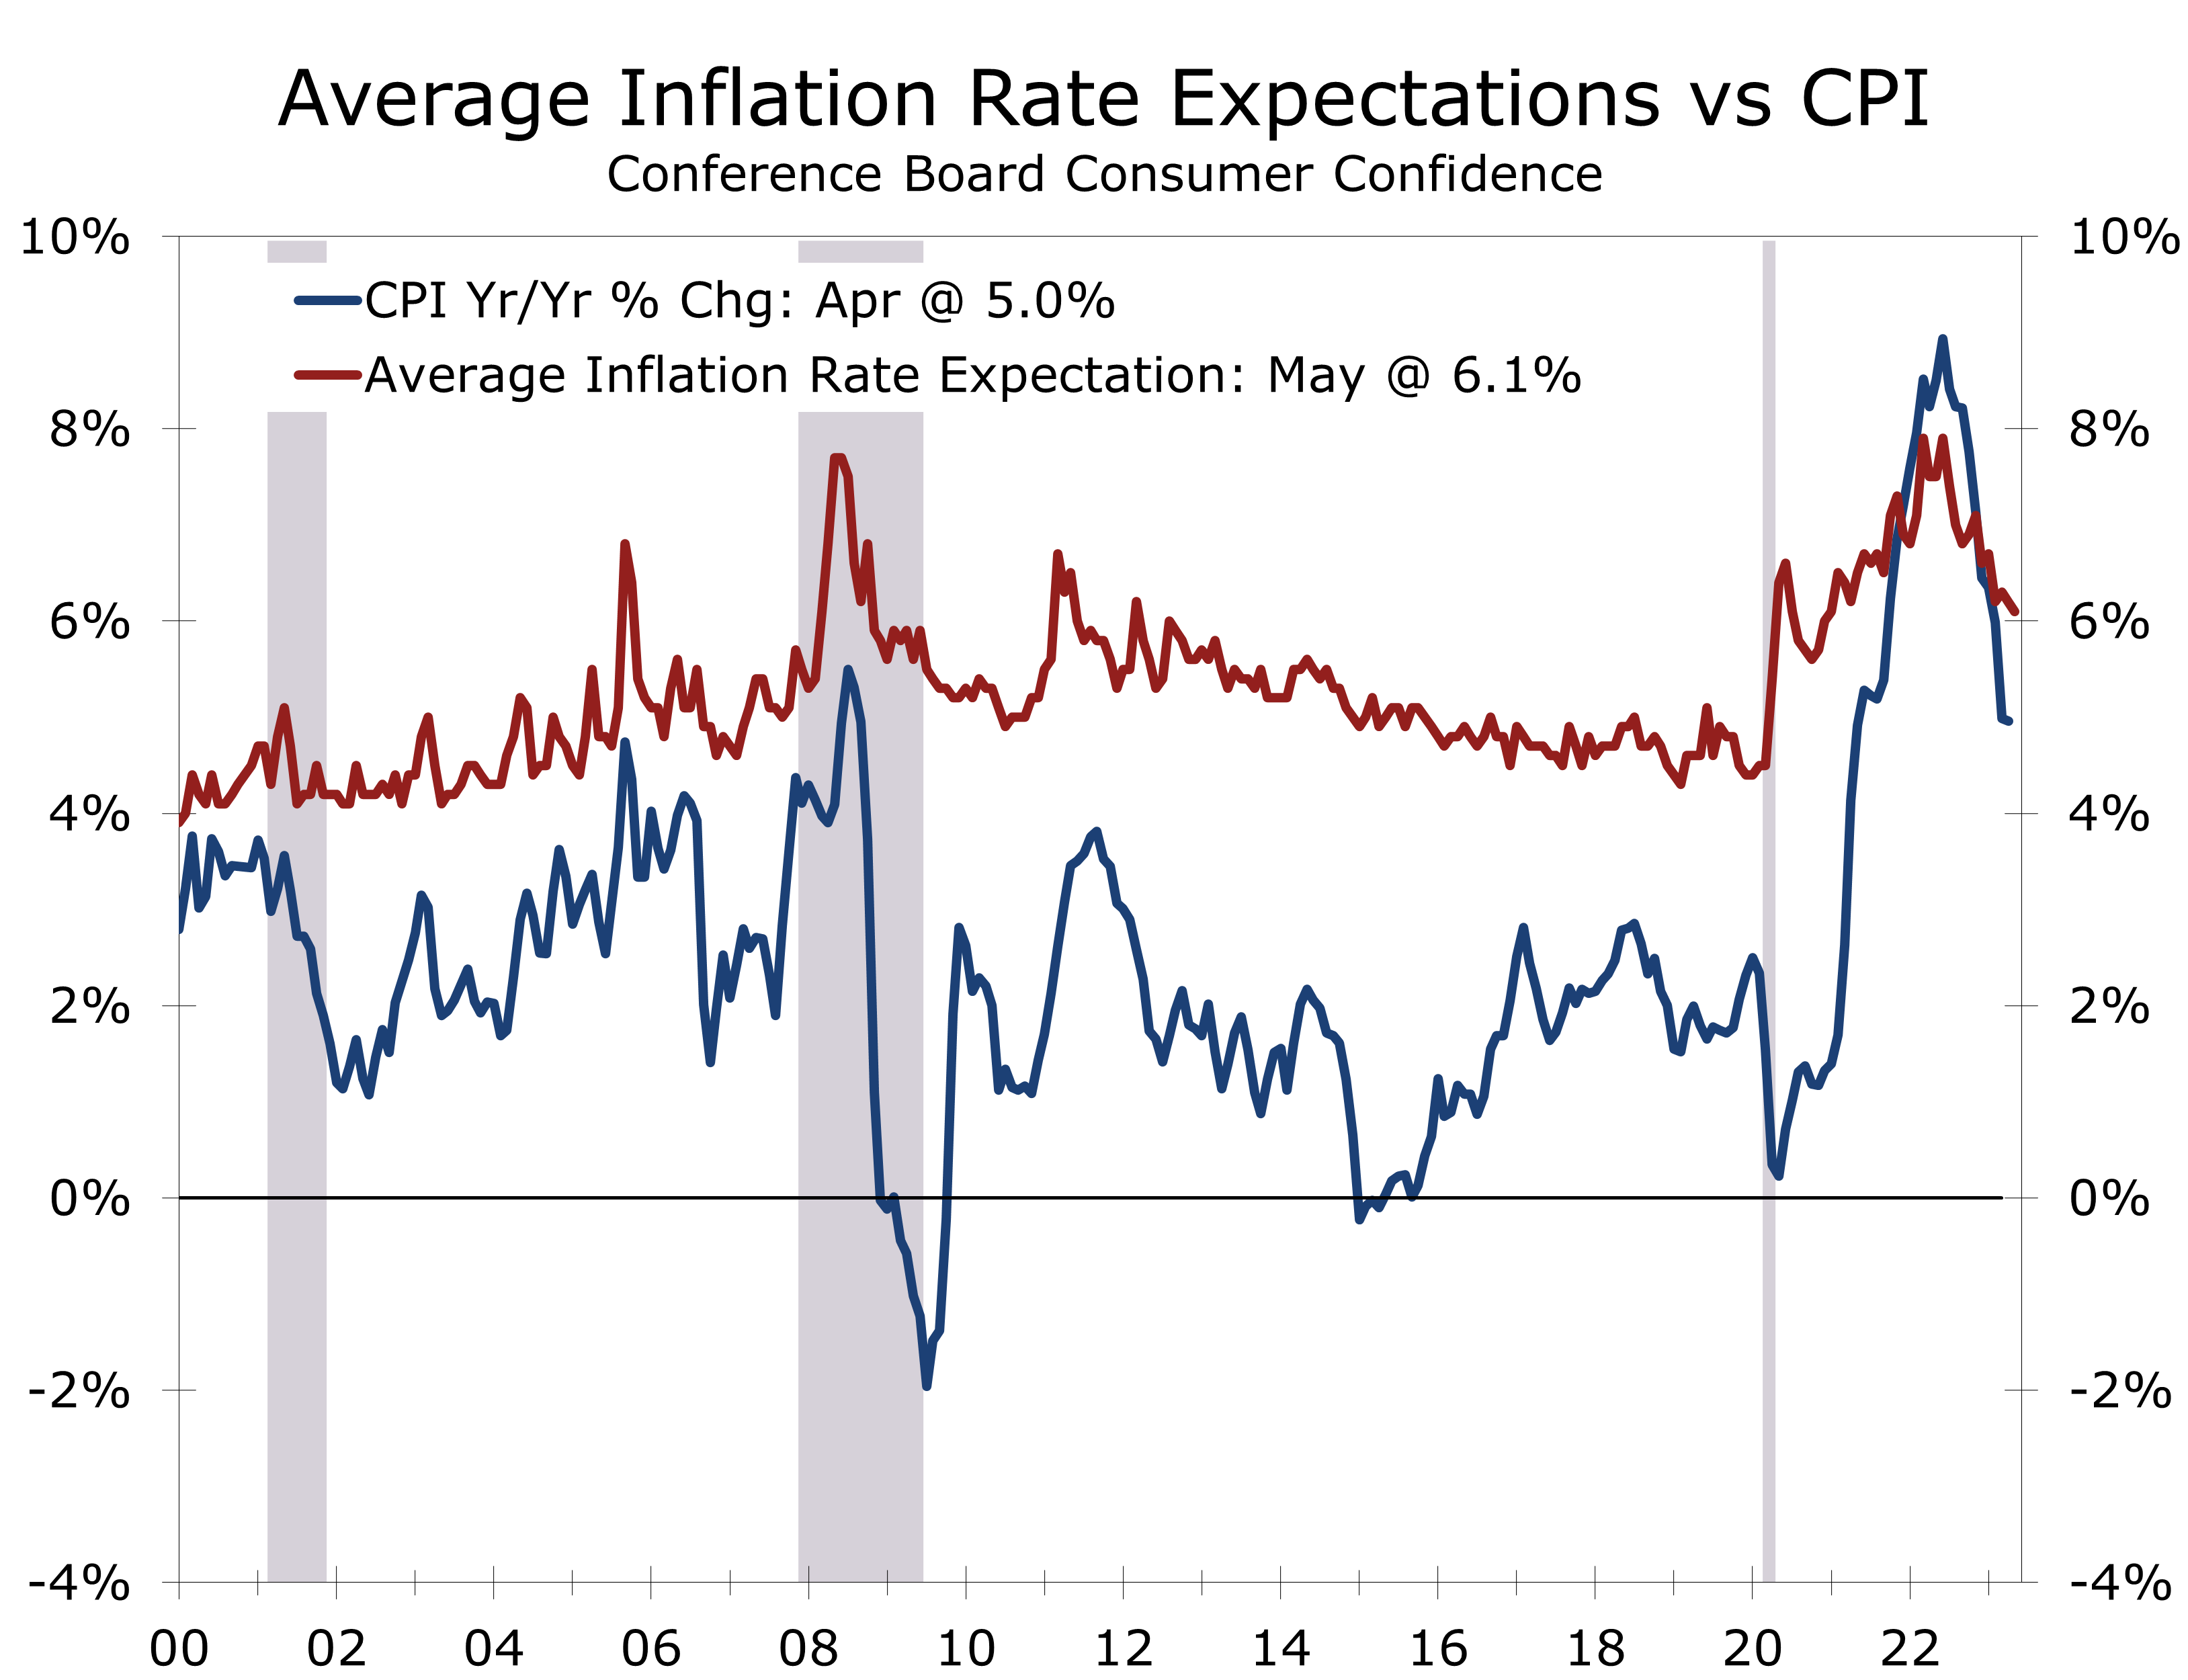
- Consumers expect inflation to average 6.1% over the next year, down slightly from 6.2%.
- Plans to buy major appliances edged higher in May, while plans to buy a home remained unchanged.
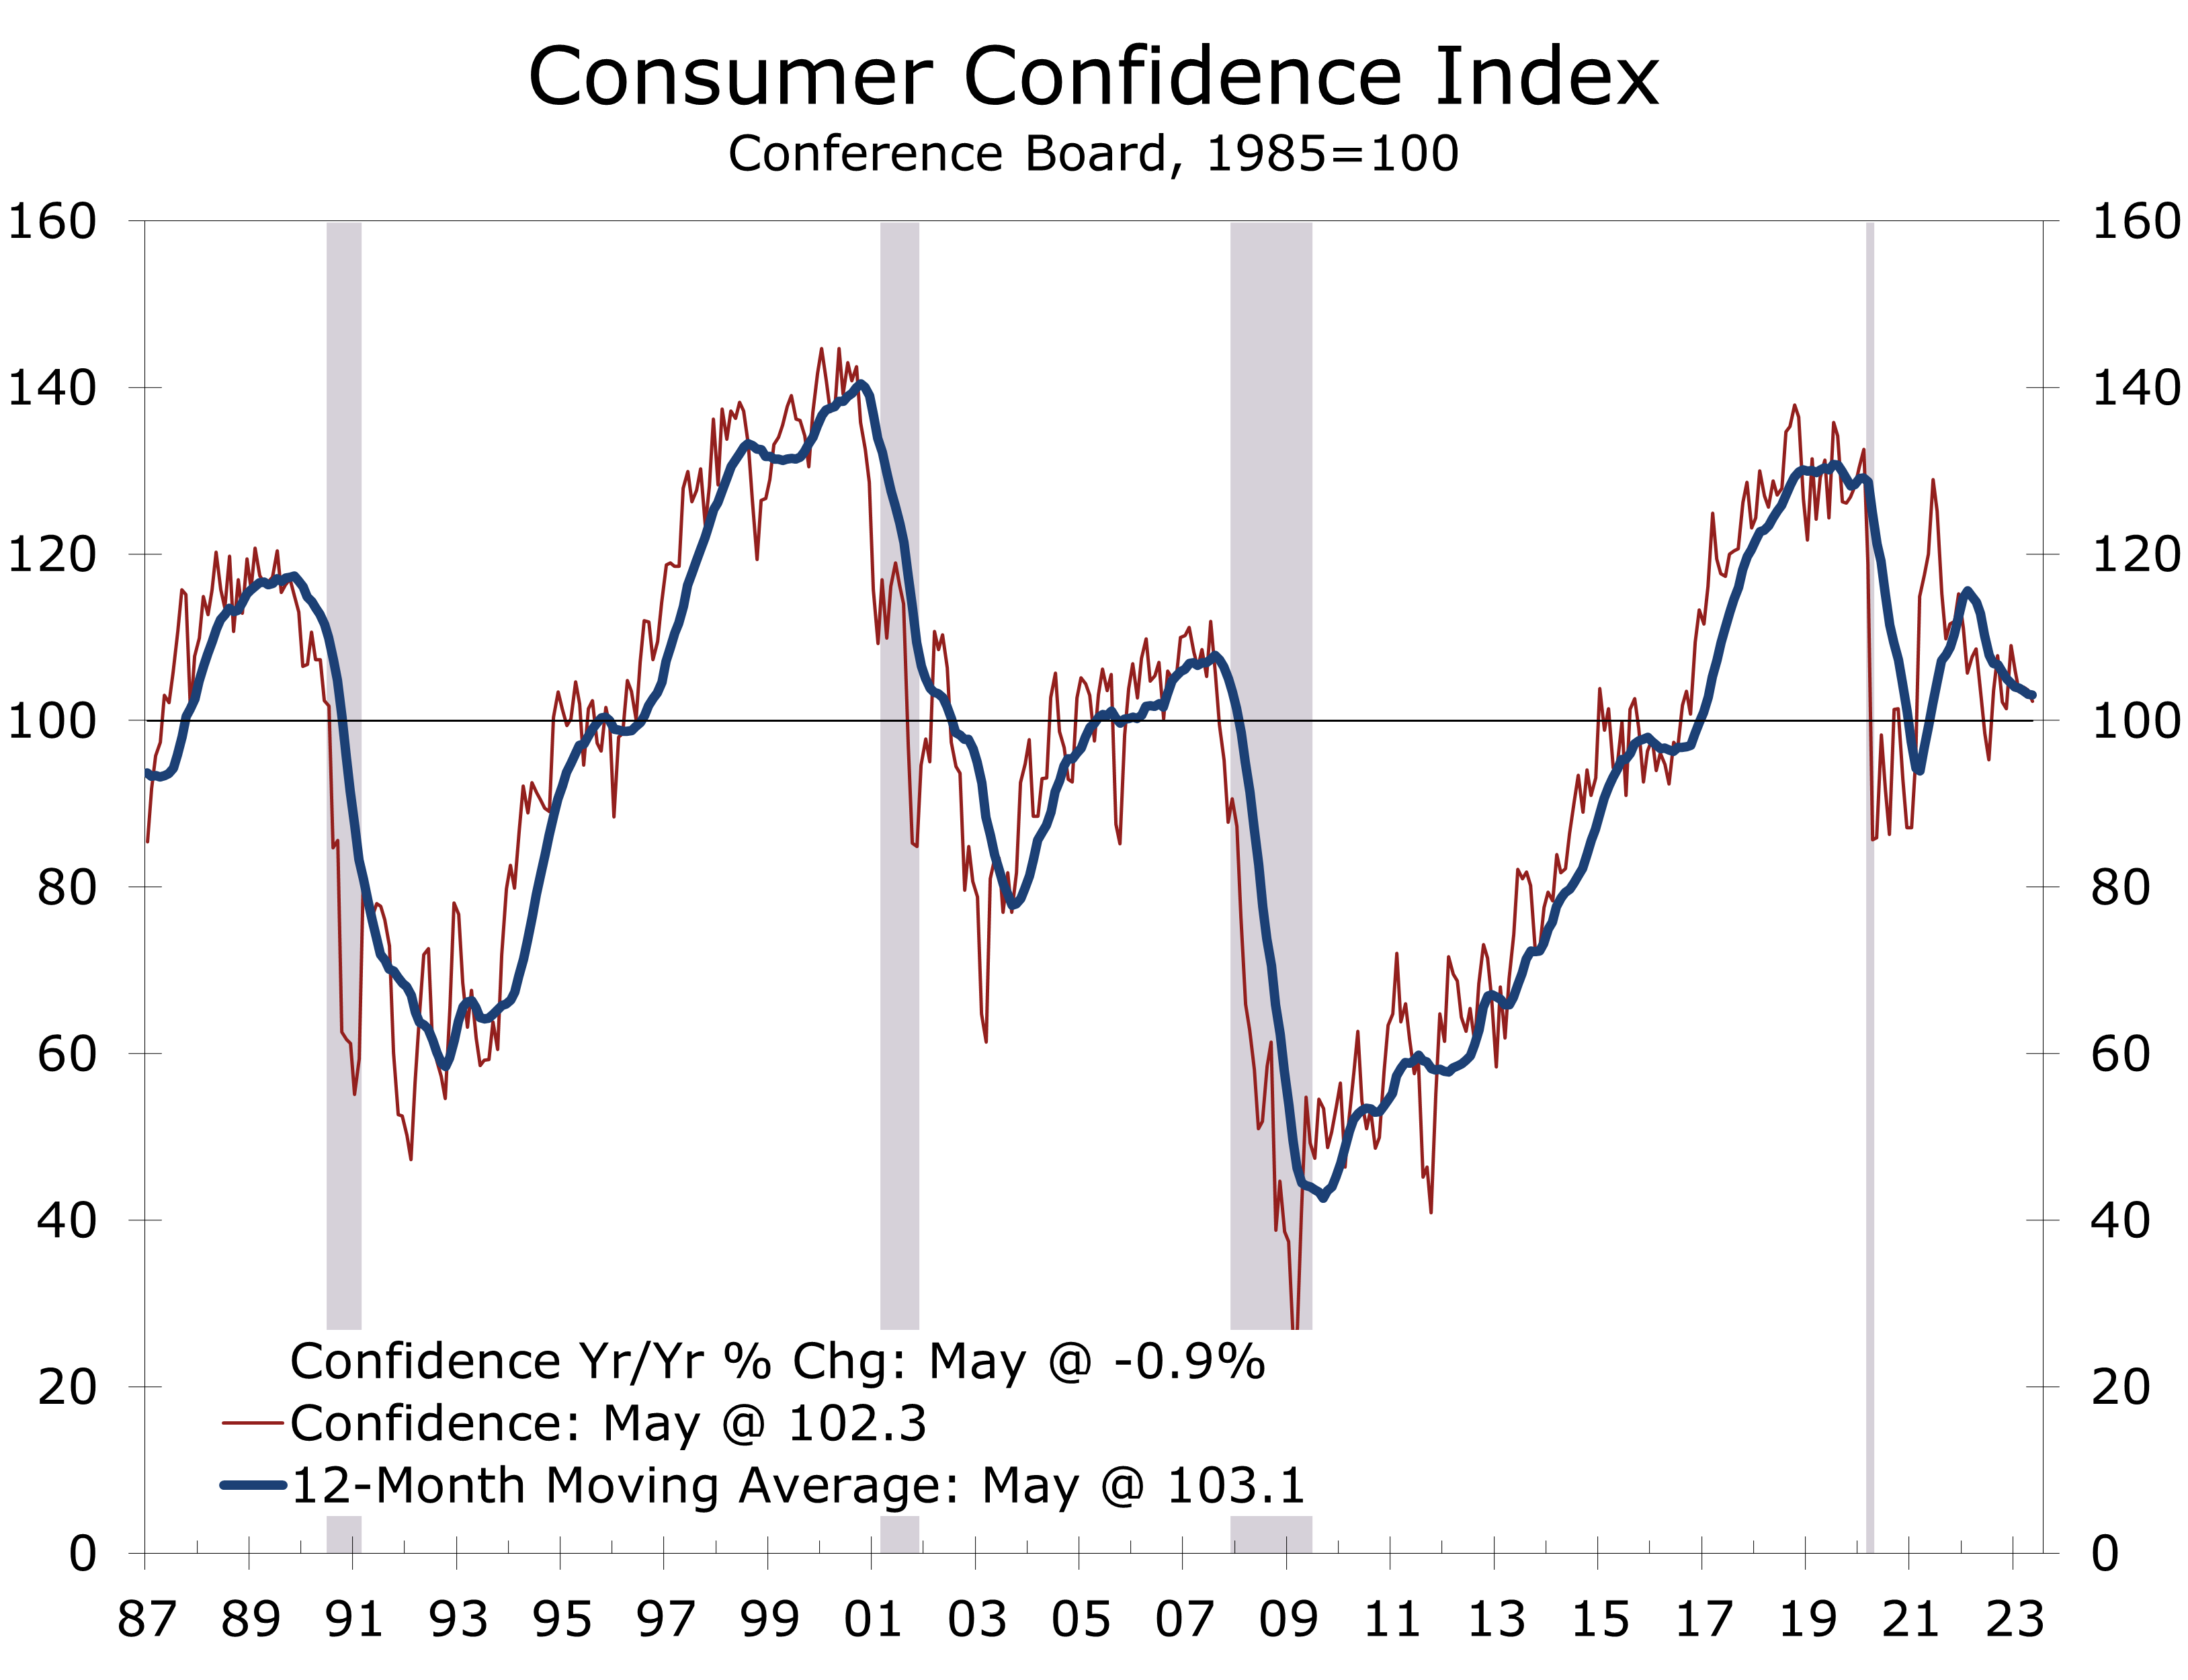
The Consumer Confidence Index fell 1.4 points in May to 102.3, marking the fourth drop in the past five months. Data for the prior month were revised higher, so Consumer Confidence remains at a relatively high level even at the latest drop.
As with many other economic indicators, Consumer Confidence provides widely divergent views on the state of the economy. The overall index remains slightly above its 1985 base year average and is consistent with solid economic growth. The present situation index fell 3.2 points to 148.6 and remains at a relatively high level. The expectations index, however, fell 0.2 points to 71.5 and has been below 80 every month since February 2022, except December. A reading below 80 has typically presaged a recession beginning within the next year.
The deterioration in expectations closely follows the period when the Fed began raising short-term interest rates. That period has been associated with heightened stock market volatility and a moderation in job growth and job openings. The unemployment rate has fallen slightly over this period, however, declining to 3.4% in April, slightly below its pre-pandemic low.
Consumer Confidence closely tracks employment conditions, which have so far remained resilient.
The Conference Board’s Consumer Confidence Index is much higher than the University of Michigan’s Consumer Sentiment Index, which has been at recession levels for much of the past year. The Conference Board survey puts more weight on still buoyant employment conditions, while the Michigan survey more closely tracks consumer finances and the financial markets, which have both been under stress.
Consumers’ assessment of current economic conditions weakened somewhat in May. The drop appears to have been tied to softening labor market conditions. The share of consumers stating ‘jobs were plentiful’ tumbled 4 points in May to 43.5%, marking the largest 1-month drop since October of last year. The jobs plentiful series peaked in March of last year at 56.7% and has fallen a cumulative 13.5 points since then, which is when the Fed began hiking rates.
The share of consumers stating ‘jobs were hard to get’ rose 1.9 points in May to 12.5%. This series bottomed out in March of last year at 9.5%. The labor market differential takes the difference of these two series and fell 5.9 points to 31, which is the lowest it has been since April 2021. This series has been a good predictor of changes in the unemployment rates. The deterioration in the labor market differential by itself is consistent with a 0.2 rise in the unemployment rate.
Consumers’ assessment of current conditions might have been influenced by the run-up in concerns about the nation’s debt ceiling. The survey was completed 3 days prior to the apparent agreement. Even with May’s 3.2-point drop, the present situation index remains above its 12-month average. The share of consumers’ rating current business conditions as “good” rose 0.6 points to 19.6% in May, and the share rating current conditions “bad” falling 1.1 points to 17% – lower than at any time since before the pandemic.
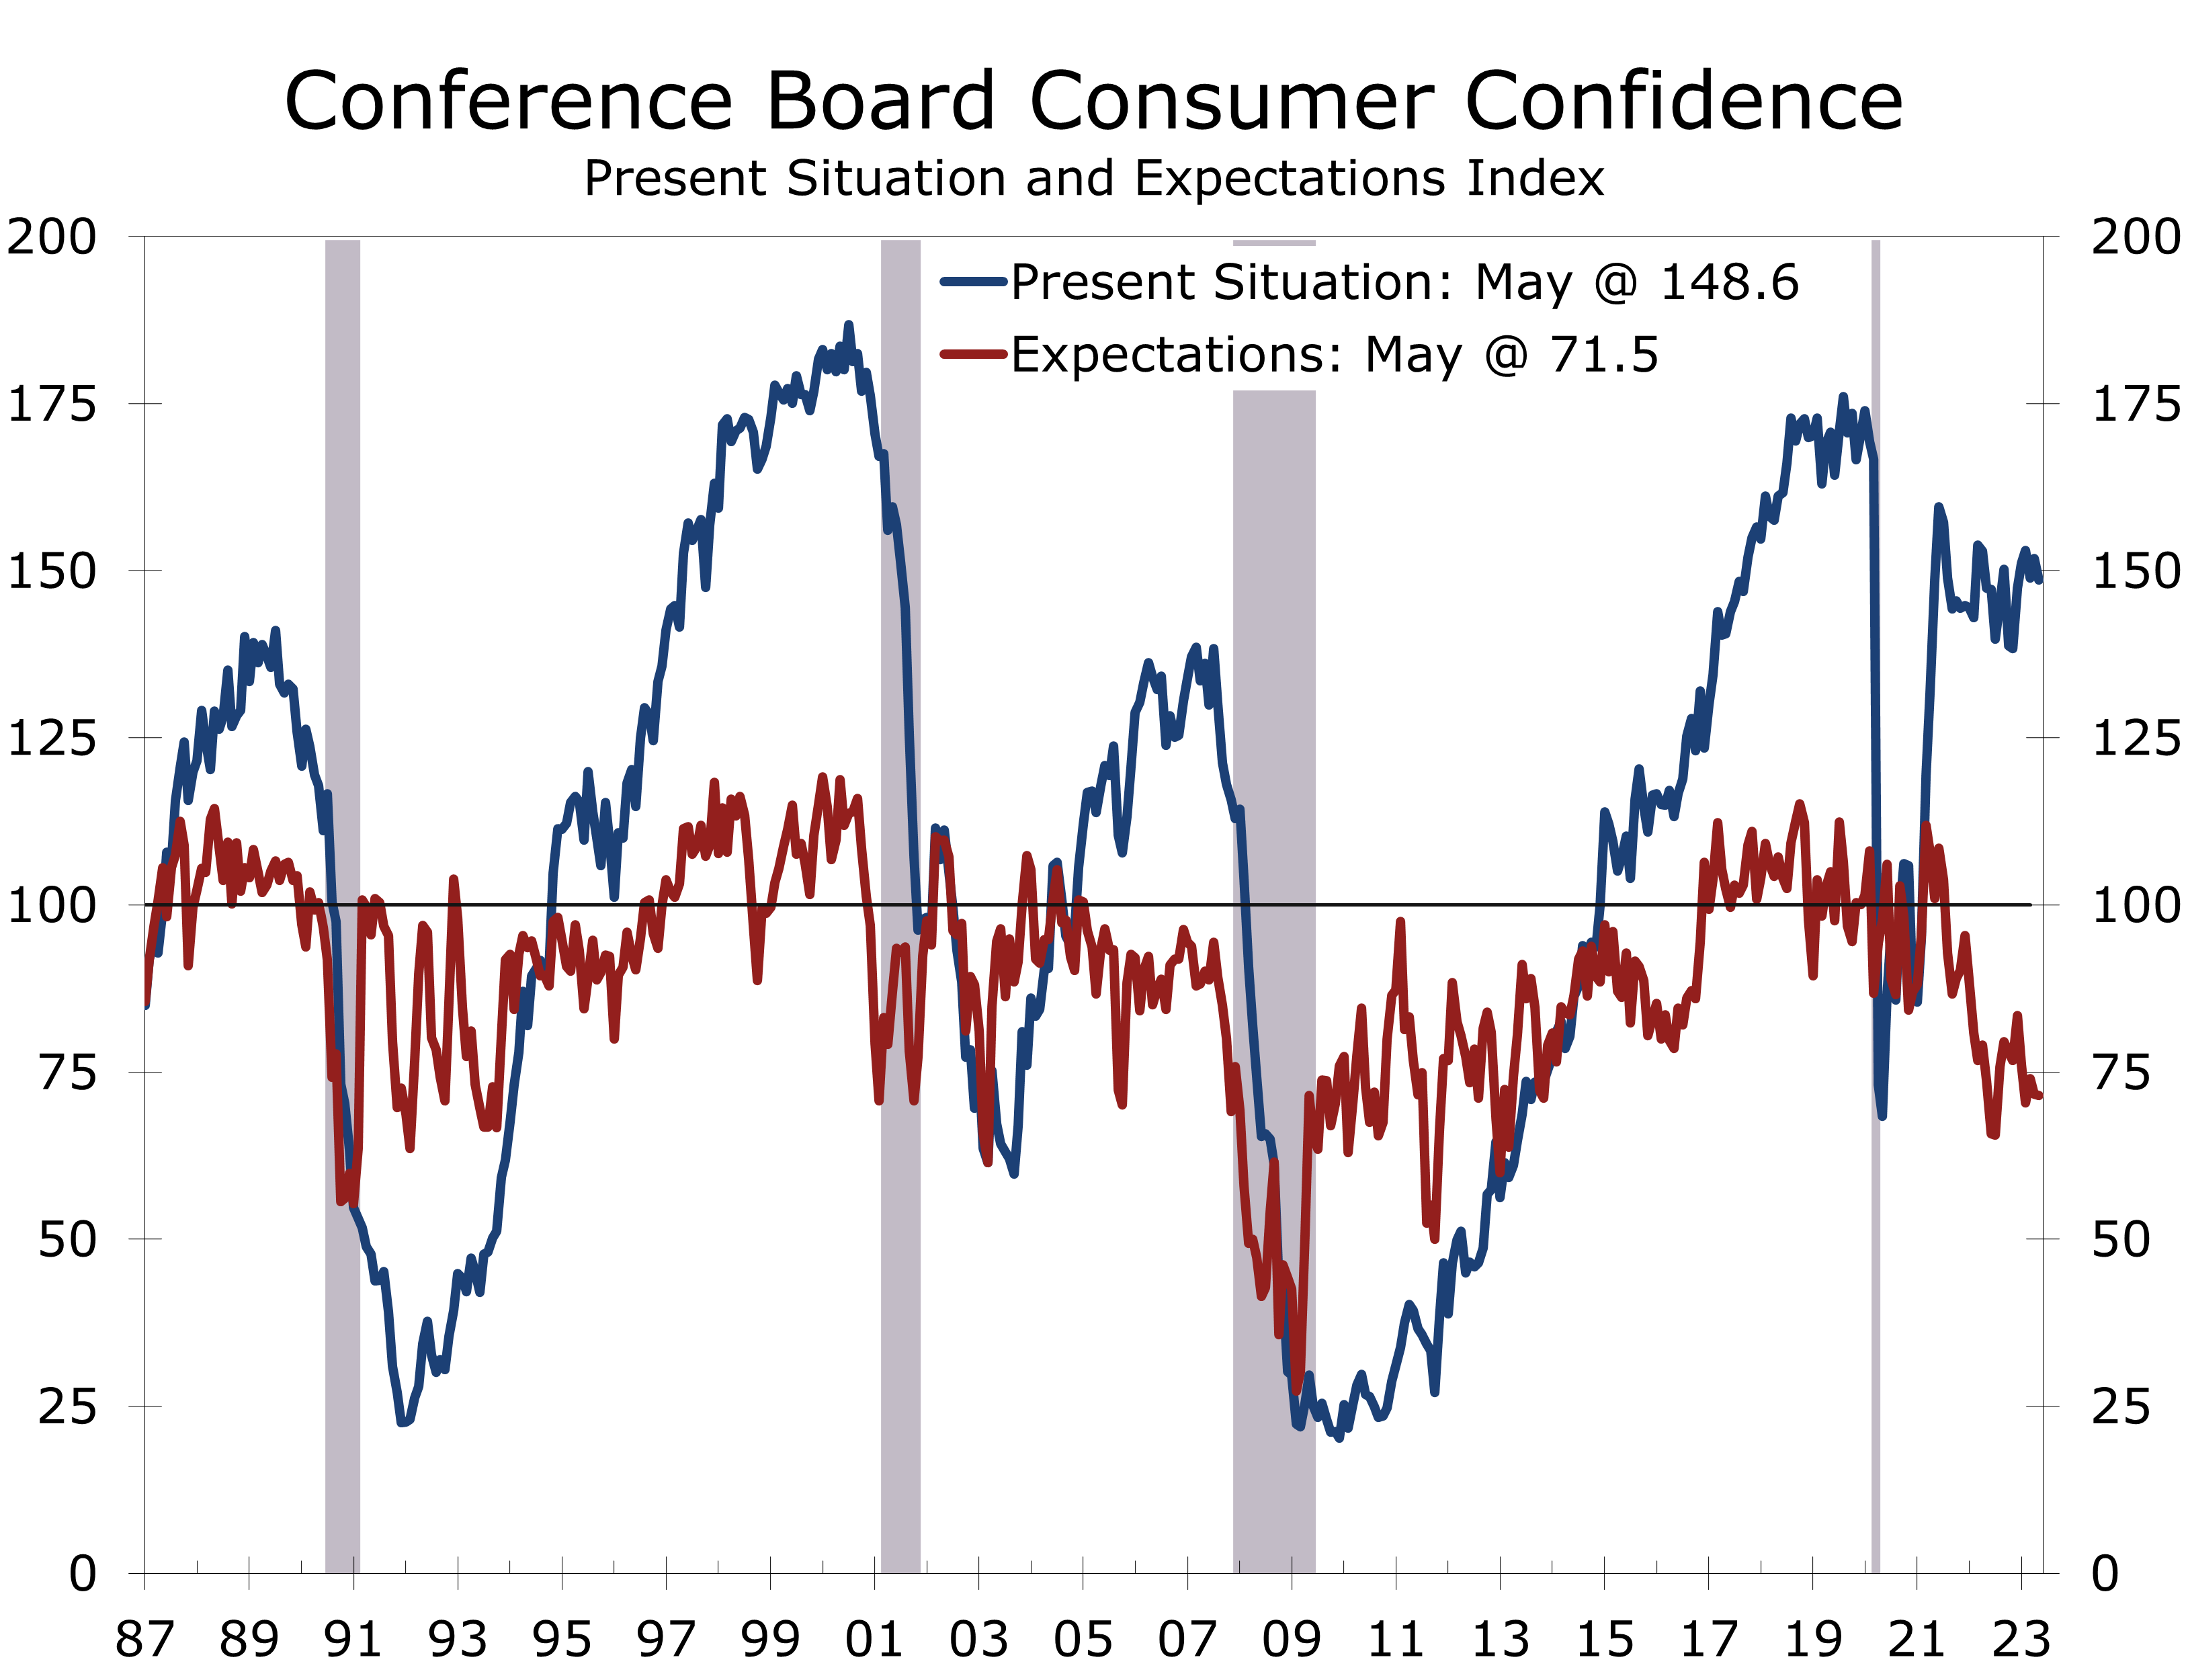
The expectations series is clearly the more problematic subset of consumer confidence. Expectations have averaged 74.9 since February 2022, consistent with a recession beginning in the next year. The series is derived from questions about business conditions, employment, and income six months from now.

The share of consumers expecting business conditions to improve over the next 6 months fell 1.2 points in May to 12.9%, but the share expecting condition to worsen also fell 0.8-points to 20.6%. Views about the availability of jobs six months out saw similar declines, with the share expecting more jobs to be available falling 0.7-points to 13.6% and the share expecting fewer jobs to be created falling 0.9-points to 20.2%.
Expectations for the labor market and inflation are moderating.
The moderation in expectations for the job market and inflation is exactly what the Fed is looking for. The question is whether it is enough to justify a pause in rate hikes? The Fed will need to see solid evidence that the pullback in expectations is matched by a further moderation in hiring and inflation, which they should have a better idea of before their mid-June meeting.
Disclaimer: This publication has been prepared for informational purposes only and is not intended as a recommendation offer or solicitation with respect to the purchase or sale of any security or other financial product nor does it constitute investment advice.
New Home Sales Rose Solidly in April
New Home Sales Rose in April, But Mortgage Rates Have Risen Sharply More Recently
- New home sales rose 4.1% in April to a 683,000-unit annual rate.
- Historically low inventories of existing homes have made new home sales a more attractive option for home buyers.
- The median price of a new home fell to $420,800 in April and is 8.2% below its year ago level.
- Sales rose in the South and Midwest, while declining in the higher-priced West and Northeast.
- Homes not yet started accounted for all of April’s increase in new home sales. The bulk of new home sales, however, continue to be under construction or completed homes.
- The number of new homes available for sale rose slightly in April, with all the increase coming among homes not yet started.
New home sales rose 4.1% in April to a 683,000-unit annual rate. The increase reflects efforts by home buyers to stay ahead of anticipated hikes in interest rates, as well as historically low levels of existing home inventories which pulled more home buyers into the new home market. Home prices moderated in April, at least partially reflecting regional shifts in home sales.
Housing is the most cyclical part of the economy and April’s increase in sales may seem counterintuitive given the recent rise in mortgage rates. Demand for housing is proving resilient, however, particularly in parts of the country that are seeing strong population and employment growth. The rise in sales also occurred before rates shot back up this past week.
Home builders are generally upbeat, with the most recent NAHB/Wells Fargo Home Builder Index rising to 50 in May and the present sales index rebounding to a solid 56. Unfortunately, mortgage rates have risen sharply since that report, with the rate for a 30-year fixed rate mortgage climbing to 6.95%. Mortgage rates were a good bit lower than that in April, when the rate on a 30-year fixed-rate mortgage averaged 6.34%, which is close to its average for the past 35 years.
Residential investment is poised to add slightly to second quarter real GDP growth.
Downward revisions to the March data also make the April data look better. New home sales for March were revised down by 27,000 units, while sales for February were revised up by 8,000 units. The upshot is new home sales were about as strong in April as we had thought they were in March. The revisions also show new home sales are beginning the second quarter about 5.8% above their first quarter average, which raises the prospect residential investment will add slightly to second-quarter GDP growth.
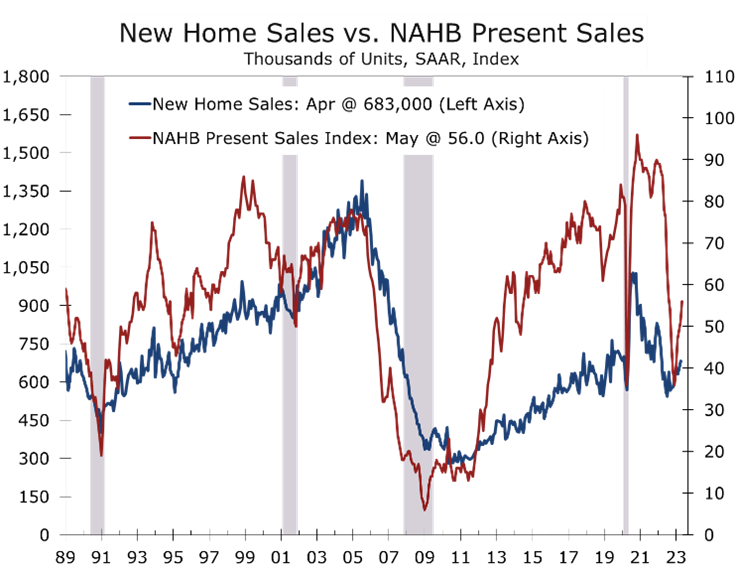
Demand for new homes is clearly being bolstered by the paucity of existing homes currently available for sale. Many existing homeowners have locked in interest rates of 4% or are less likely to move, as their mortgage payment would likely rise even if they purchased a smaller or less expensive home. With fewer existing homes on the market, buyers are increasingly looking at purchasing a new home.
Another trend that is favoring new home sales is the ongoing shift away from higher priced housing markets to more affordable markets in the South and, to a lesser extent, the Midwest. The South, which accounted for over 60% of new home sales this past year, saw new home sales rise 17.8% in April and sales are up 23.4% on a year-to-year basis. Sales also rose solidly in the Midwest, climbing 11.8% in April and rising 20.6% over the past year. The Midwest, however, accounted for just 10% of the nation’s new home sales this past year.
New home sales fell in both the Northeast and West, where home prices are among the highest in the nation. The Northeast saw new home sales tumble 58.6% in April and sales are down 46.7% year-to-year. The Northeast enjoyed seasonably mild weather through most of this past winter, which helped pull new home sales higher earlier this year. That said, sales through the first four months of 2023 are still down 19.2% from the first four months of last year.
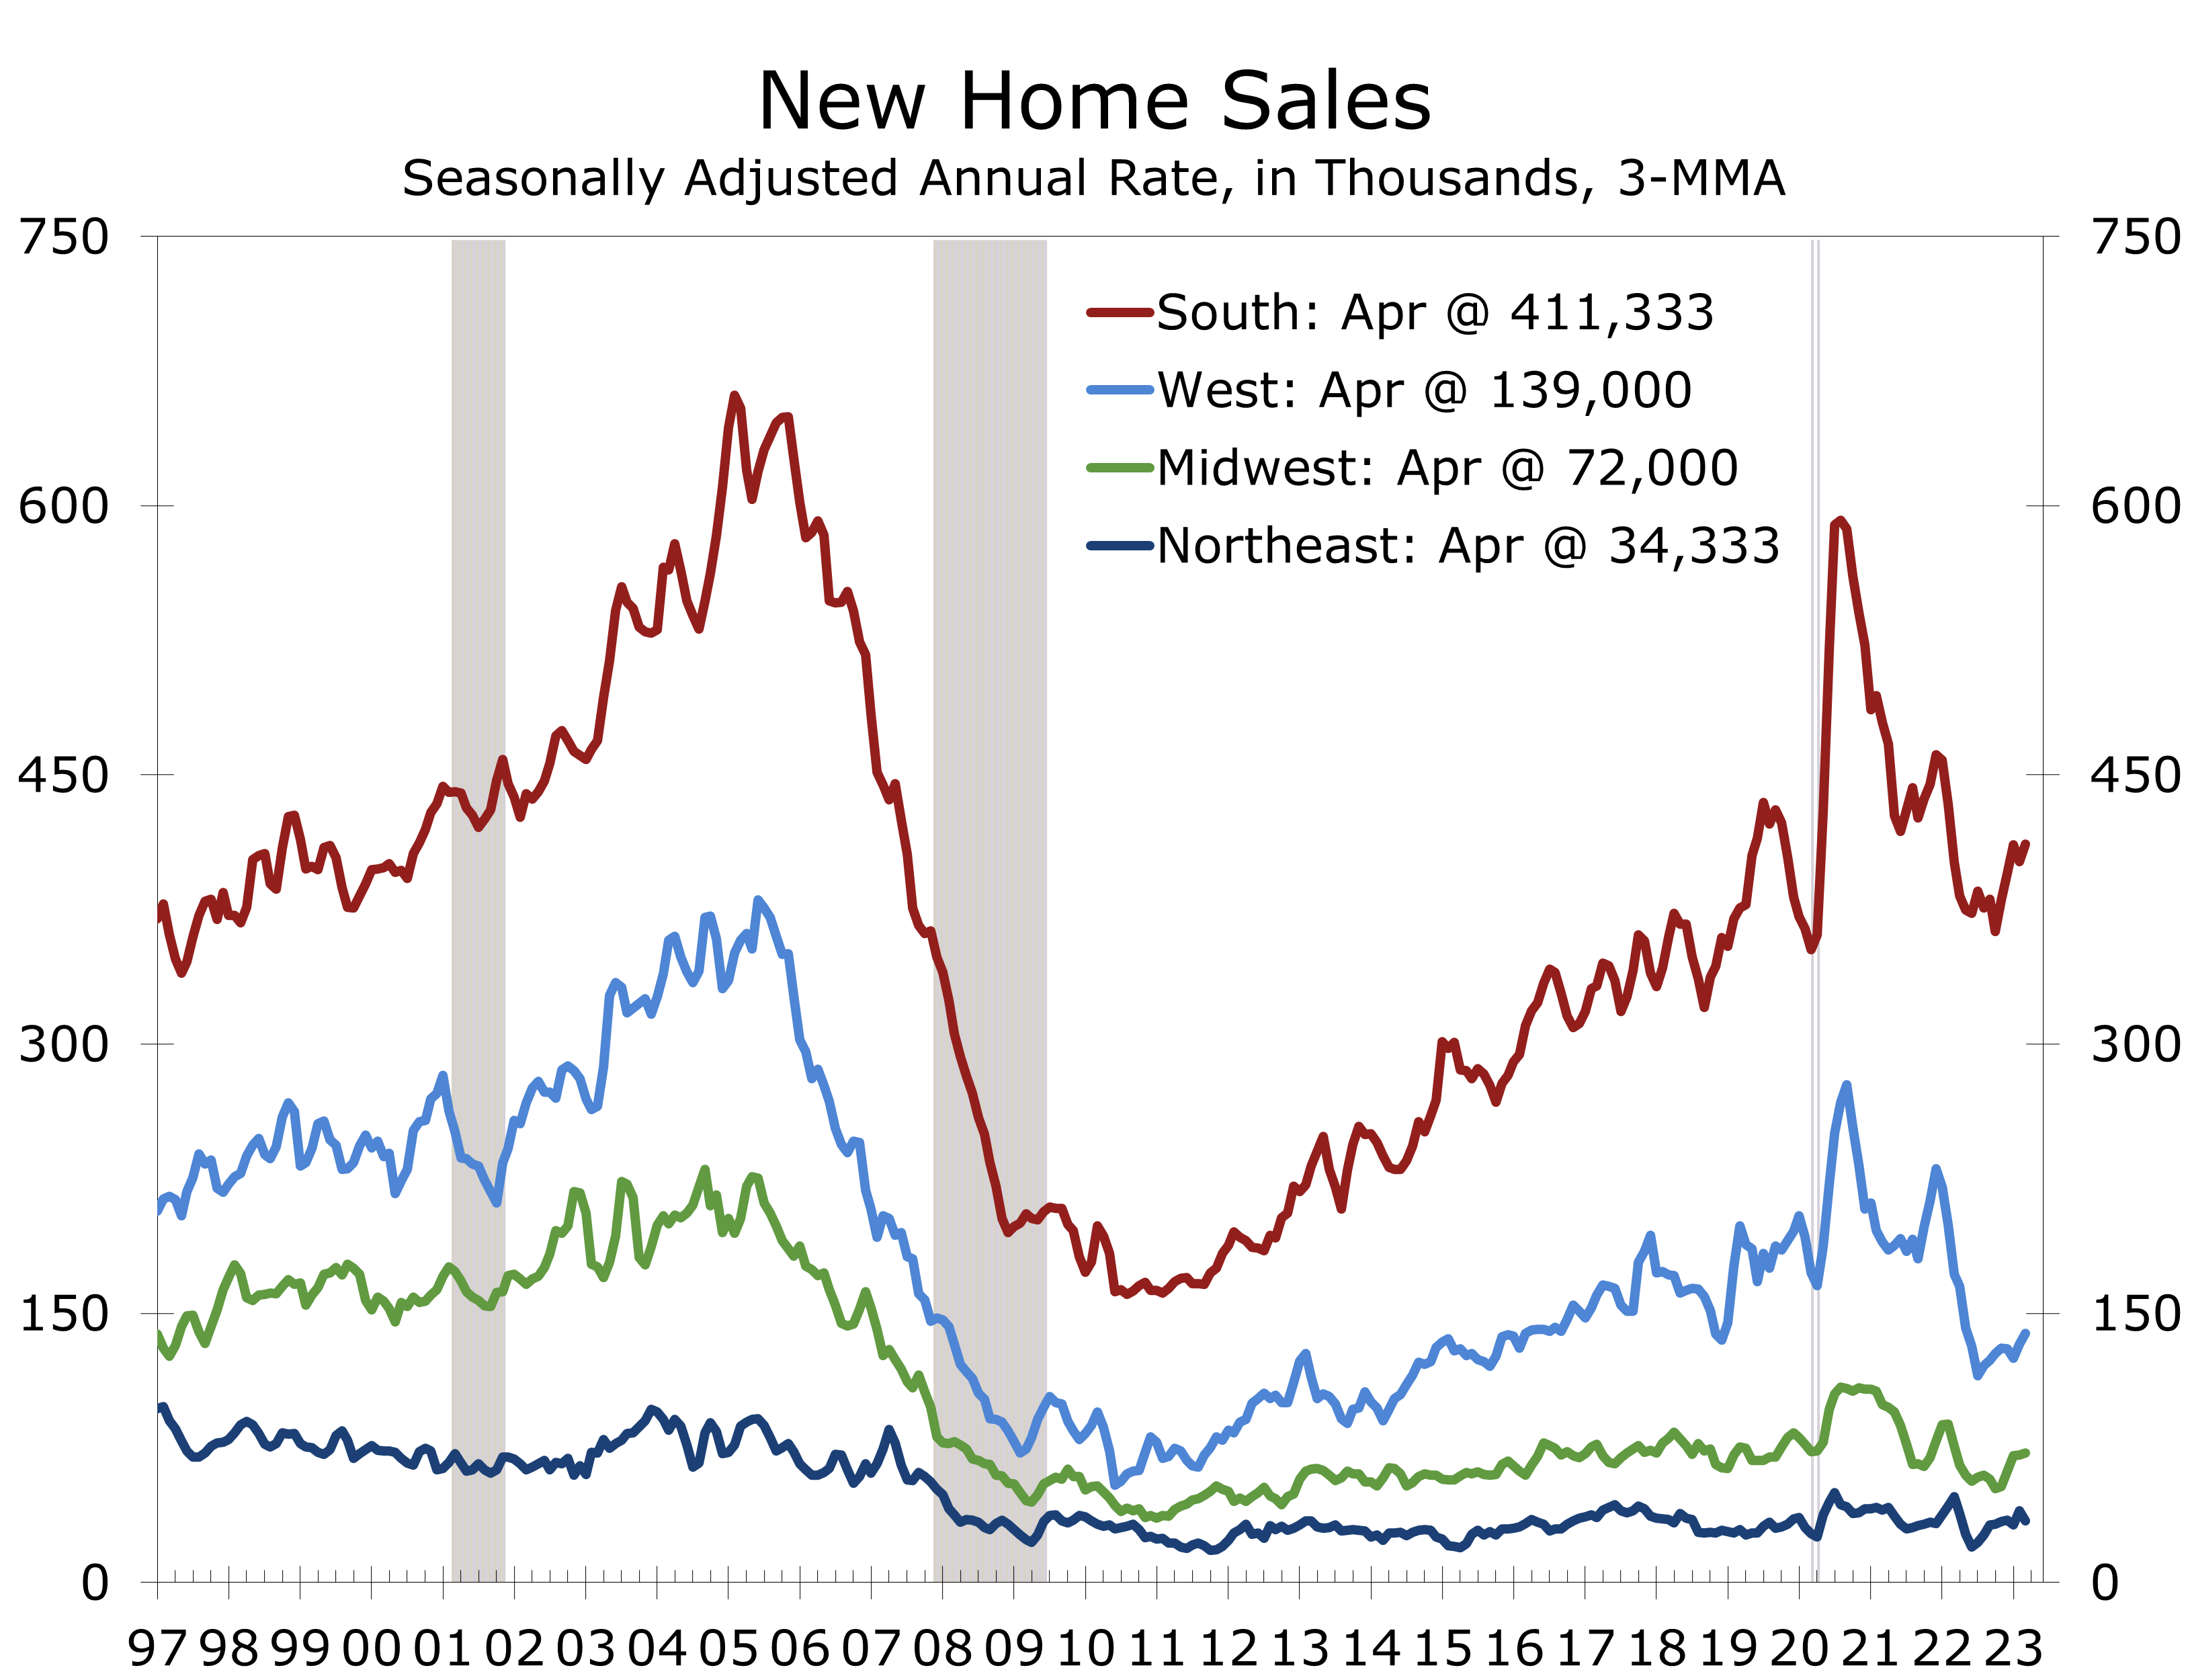
Sales fell 9.1% in the West during April. While California dealt with incessant rain throughout much of the winter, weather in other parts of the West was not much different from historic norms. The biggest problem in the West continues to be the lack of affordability, which is fueling an out-migration primarily to Texas and other parts of the South.
With sales down in the two highest priced regions of the country, the median price of a new home fell 7.7% on a month-to-month basis, non-seasonally adjusted. With the drop, the median price of a new home is now 8.2% lower than it was last April, marking the first year-to-year drop since August 2020.
The median price of a new home fell 8.2% over the past year, the first drop since August 2020.
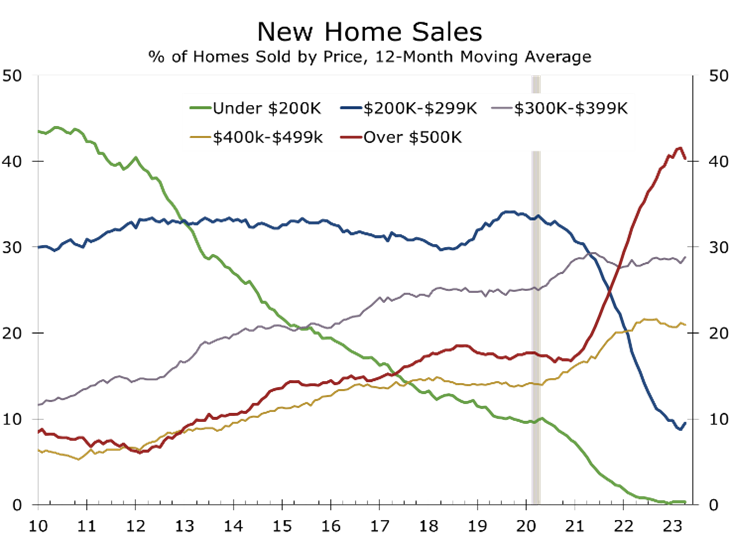
Sales of homes priced over $500k fell 9 percentage points to 30% in April. By contrast, there was a 5 percentage point uptick in sales of homes priced between $200k and $300k (15%) and a 4-percentage point rise in the share of new homes sold between $300k and $500k (55%). The share moves around quite a bit from month-to-month. Our chart shows the share by price range using a 12-month moving average.
Disclaimer: This publication has been prepared for informational purposes only and is not intended as a recommendation offer or solicitation with respect to the purchase or sale of any security or other financial product nor does it constitute investment advice.
Existing Home Sales Fell Slightly in April
Lean Inventories Limit Sales in April
- Sales of existing homes fell 3.4% in April to a 4.28-million-unit annual rate. Sales have fallen in 14 of the past 15 months are down 23.2% over the past year.
- Sales of single-family homes fell 3.5% to a 3.85-million-unit pace, while sales of condominiums and co-ops fell 2.3% to a 430,000-unit pace.
- Single-family sales fell in all four regions in April and are down most in the West.
- For-sale inventory rose 7.2% in April to 1.04 million units and is up 1% from a year ago but remains historically low.
- The median price of an existing home rose 3.6% in April to $388,000 (non- seasonally adjusted) but is down 1.7% from last April.
- Despite the drop, housing affordability remains stretched, with 25.4% of median household needed to make interest and principal payments on a median price home.
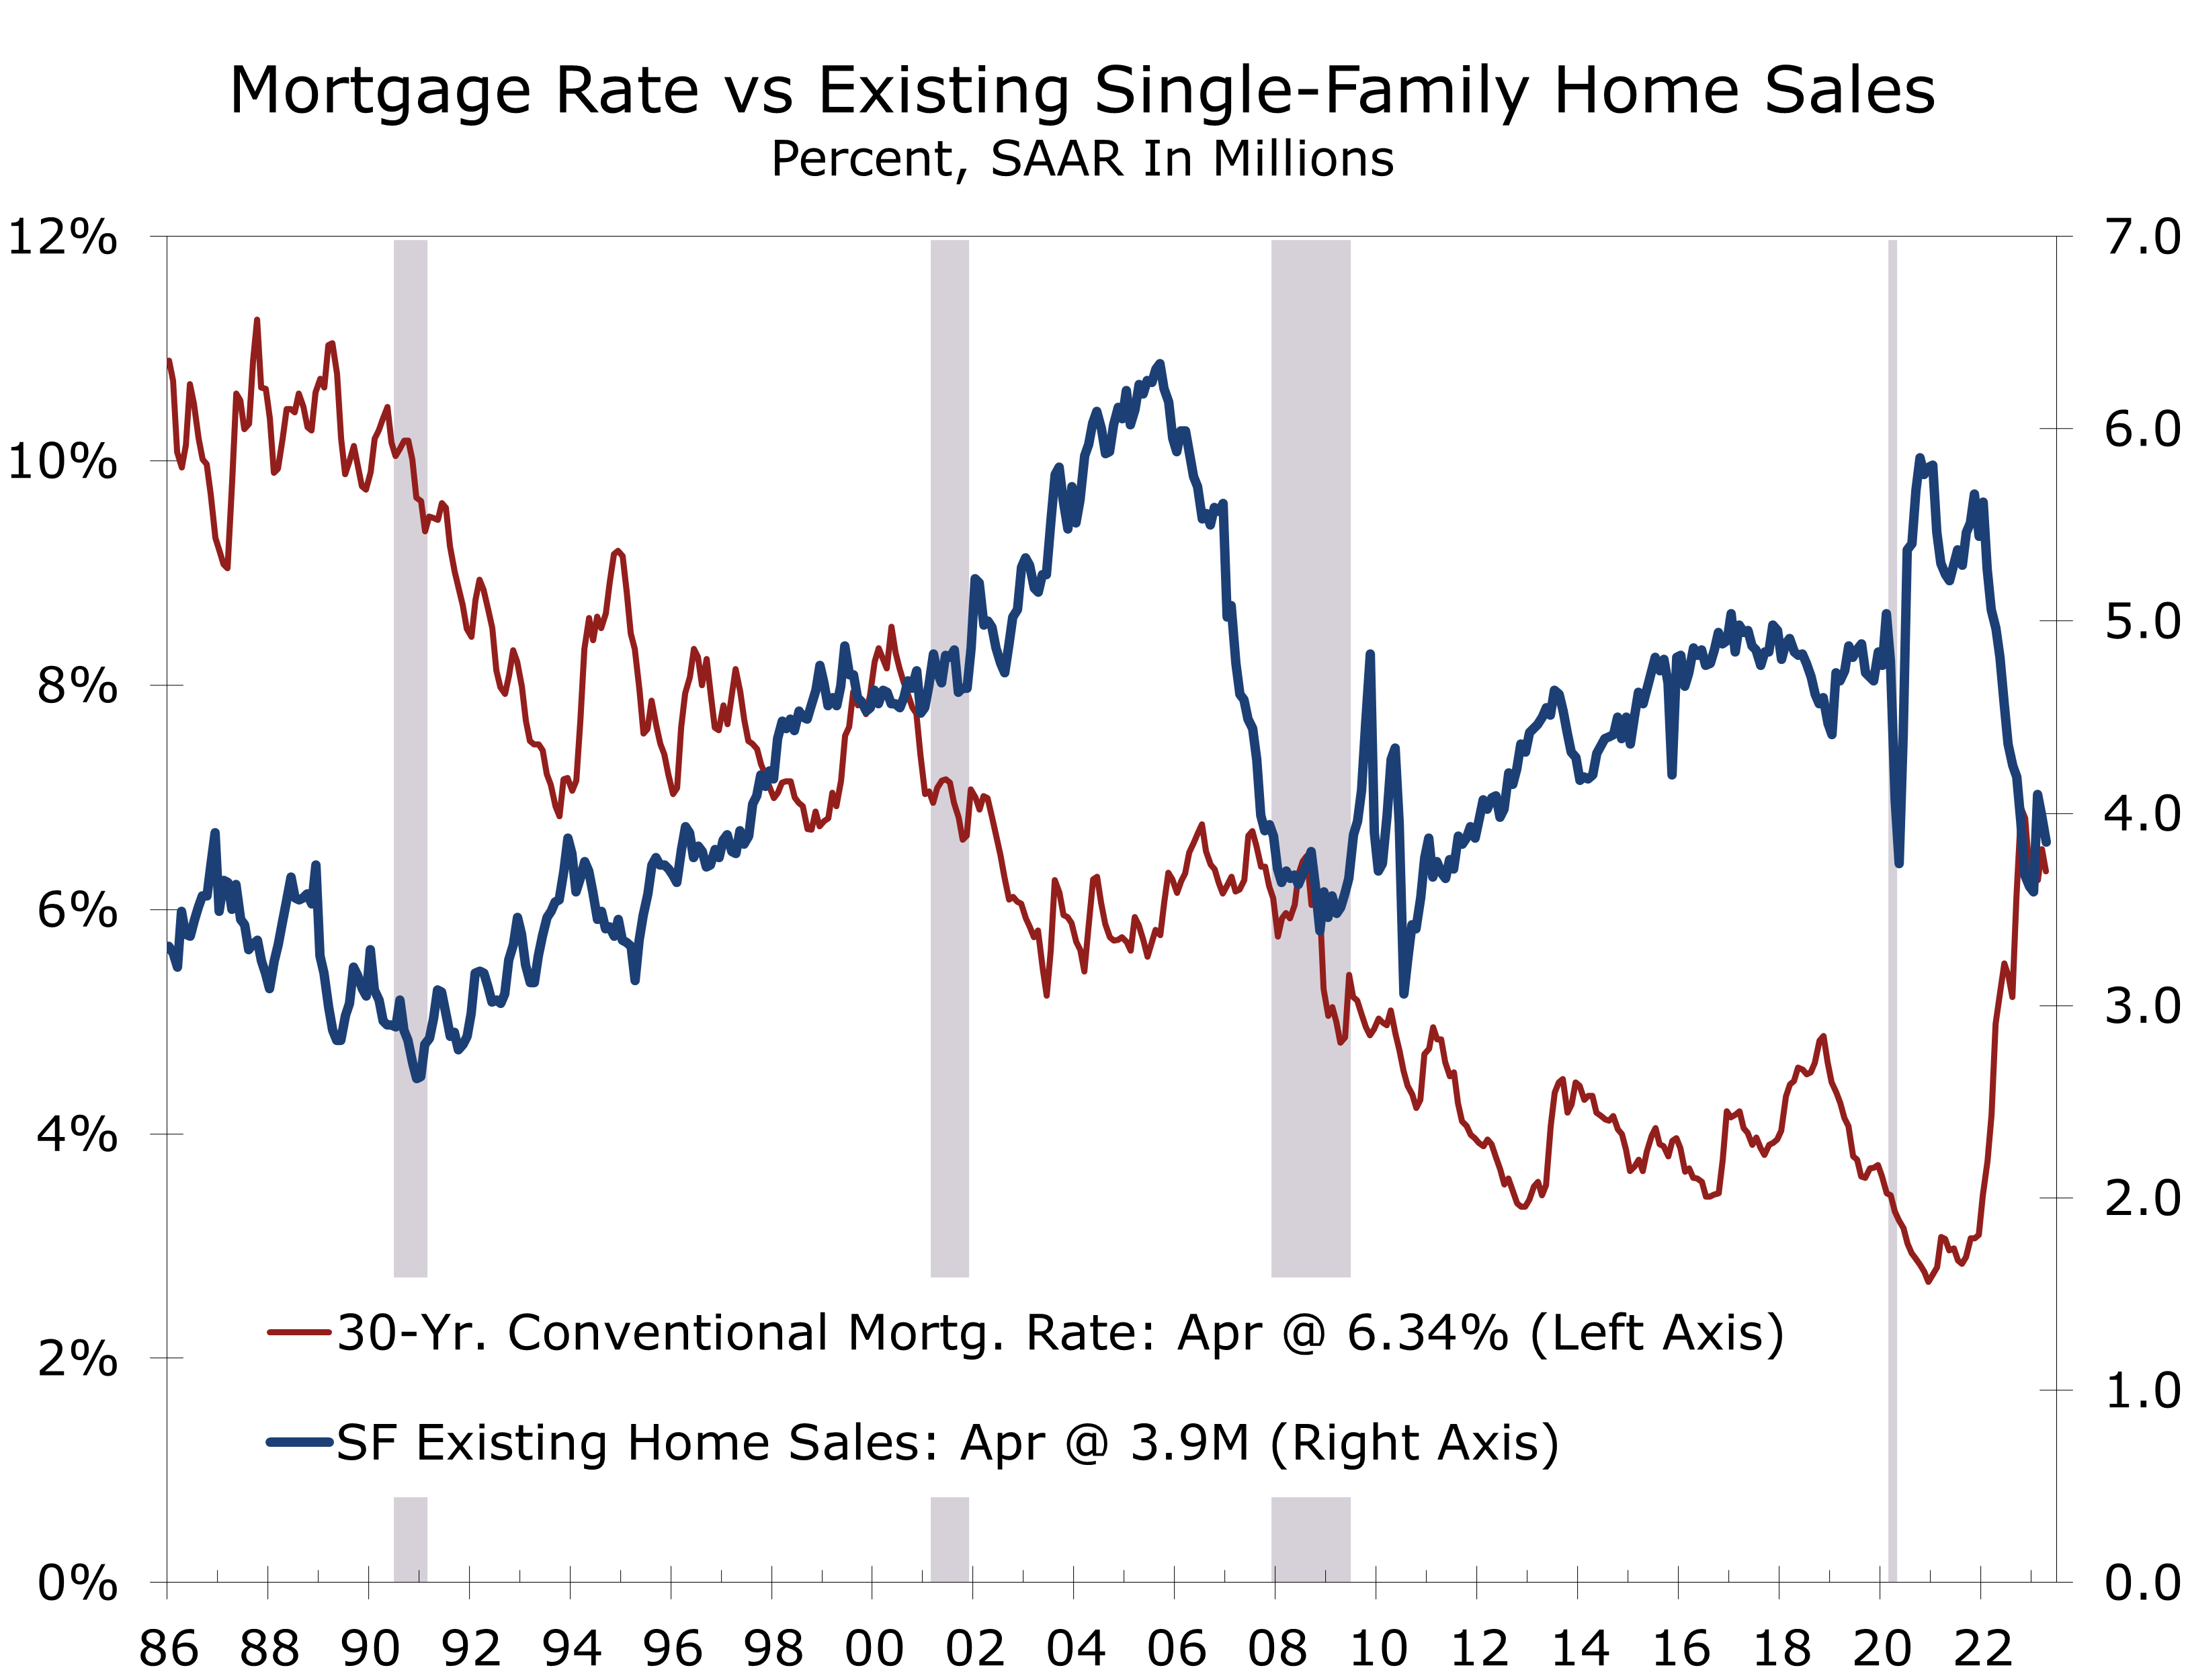
Existing home sales fell 3.4% in April to a 4.28-million-unit annual rate. March sales were also revised lower by 10,000 units to a 4.43-million-unit pace. Demand for homes is stronger than the headline figures suggest. Inventories of existing homes remain exceptionally lean for this time of year, frustrating many would-be buyers and likely boosting sales of new homes.
After spiking last fall, mortgage rates retreated late last year, which brought buyers back into the market in January. Existing sales, which are tallied at closing, jumped 13.8% in February, which is normally a seasonally slow time for sales. With sales picking up earlier than usual this year, sales rose less than usual this spring, resulting in seasonally adjusted declines in March and April. The bottom line is existing home sales have regained some of the strength they lost last fall. Some buyers priced out when mortgage rates surged to 7% last November likely came back into the market when rates fell back near 6%. Sales are still well below their year ago pace, and are unlikely to strengthen in a meaningful way this summer, as affordability is stretched, and inventories remain exceptionally lean.
Affordability remains stretched due to higher mortgage rates and the earlier spike in home prices.
Mortgage rates averaged 6.34% in April, close to their average for the past 35 years. Unfortunately, home prices soared following the pandemic, which made homes unaffordable for a large segment of the population. A home buyer purchasing a median priced home, with a 20% down payment, would need to devote 25.4% of median family income to interest and principal payments, or $1,929/month. The historic average is 19%, or $1,734/month.
Inventories of existing homes rose 7.2% in April to 1.04 million units, which is about 1% higher than they were one year ago. Inventories normally rise in the spring, however, and remain low by historic standards. At April’s sales pace, there is currently a 2.9-month supply of homes on the market, up from 2.6 months in March and 2.2 months in April 2022. The long-time historic norm had been 5 to 6 months but is now widely believed to be around 4 to 5 months.
Given so many homeowners currently have mortgages with fixed rates of 4% or less, the spike in mortgage rates this past year means fewer homeowners are likely to put their homes on the market this spring and summer, which will keep inventories lean and weigh on existing home sales. New listing are down sharply around the country.
The limited supply of homes for sale will support home prices, at least nationwide. After falling 13.2% on a non-seasonally adjusted basis from July 2022 through January 2023, the median price of an existing single-family home has risen in each of the past 3 months. The year-to-year change, however, has fallen to -2.1%, and will likely fall further in coming months as year-to-year comparisons become more difficult through July. Other home price measures, including the widely followed S&P/Case Shiller and Freddie Mac Home Price Index are already firming somewhat on sequential basis and remain up year-to-year.

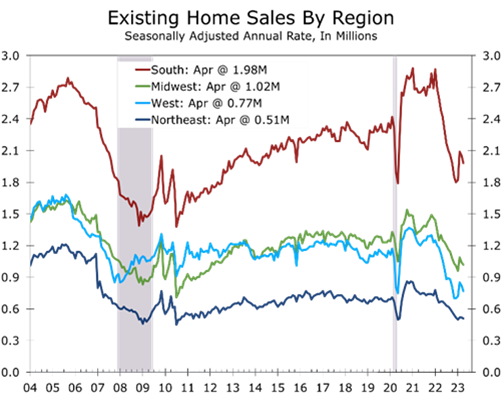
Sales of single-family homes fell in all four regions of the country during April, tumbling 8.9% in the South and 8.2% in the West. Sales fell somewhat less in the Northeast and Midwest, declining 6.5% and 2.7% respectively.
Single-family home prices rose in all four regions in April on a non-seasonally adjusted basis. Over the past year, however, prices are down 8% in the West and are down 1% in the South. Prices are 2.3% higher year-to-year in the Northeast and up 1.8% in the Midwest. Prices have fallen the most in tech-driven markets, most notably the San Francisco Bay Area and Seattle.
Home prices have fallen the most in the West, with tech centers posting the largest drops.
Recent economic data has come in slightly stronger than expected and, with the turmoil in parts of the banking system seemingly settling down, we are beginning to hear more hawkish sentiment from the Fed. We continue to see a slightly better than even chance the Fed hikes rates again in June but doubt long-term rates will retest the highs hit before the banking problems surfaced back in February. Mortgage rates may firm a bit from current levels but will not likely retest the highs hit last November.
Disclaimer: This publication has been prepared for informational purposes only and is not intended as a recommendation offer or solicitation with respect to the purchase or sale of any security or other financial product nor does it constitute investment advice.
Inflation Continues to Moderate Off Recent Highs
Consumer Prices Ease on a Year-to-Year Basis
- Both the headline and core CPI rose 0.4% in April, which pulled the year-to-year change for both slightly lower.
- A good inflation figure is a matter of perception. April’s increase was in line with expectations but less than the market feared. A 0.4% increase still translate into a 4.9% annual rate, nearly two-and-a-half times the Fed’s target.
- Prices for food and energy items, other than gasoline, continue to ease, which has helped pull the year-to-year change in the headline CPI to 4.9%.
- Grocery store prices fell 0.2% in April, marking the first back-to-back decline since August 2019, as pandemic-driven shortages continue to wind down.
- Prices for food consumed away from home rose 0.4%, reflecting continued strength in restaurant dining.
- Shelter costs rose just 0.4% in April, which is the smallest rise since January of last year.
- Core services prices excluding shelter continue to moderate, albeit at a slower rate than either the core or headline figures.
The Consumer Price Index rose 0.4% in April, as supply bottlenecks and shortages continue to ease throughout many key industries. Both the headline and core CPI rose 0.4%, which was close to consensus expectations but less than the markets had feared.
The runup in inflation that followed the reopening of the economy has focused considerable attention on the monthly CPI report and several forecasts are now released leading up to the report. The Federal Reserve Bank of Cleveland CPI Nowcast had projected the year-to-year rise in the CPI would rise back to 5.2 % in April and financial market participants were bracing for some payback from the prior month’s better than expected CPI report. When those fears proved unwarranted the markets briefly rallied.
Two key sources of inflation relief – oil and used car prices – have now been largely played out.
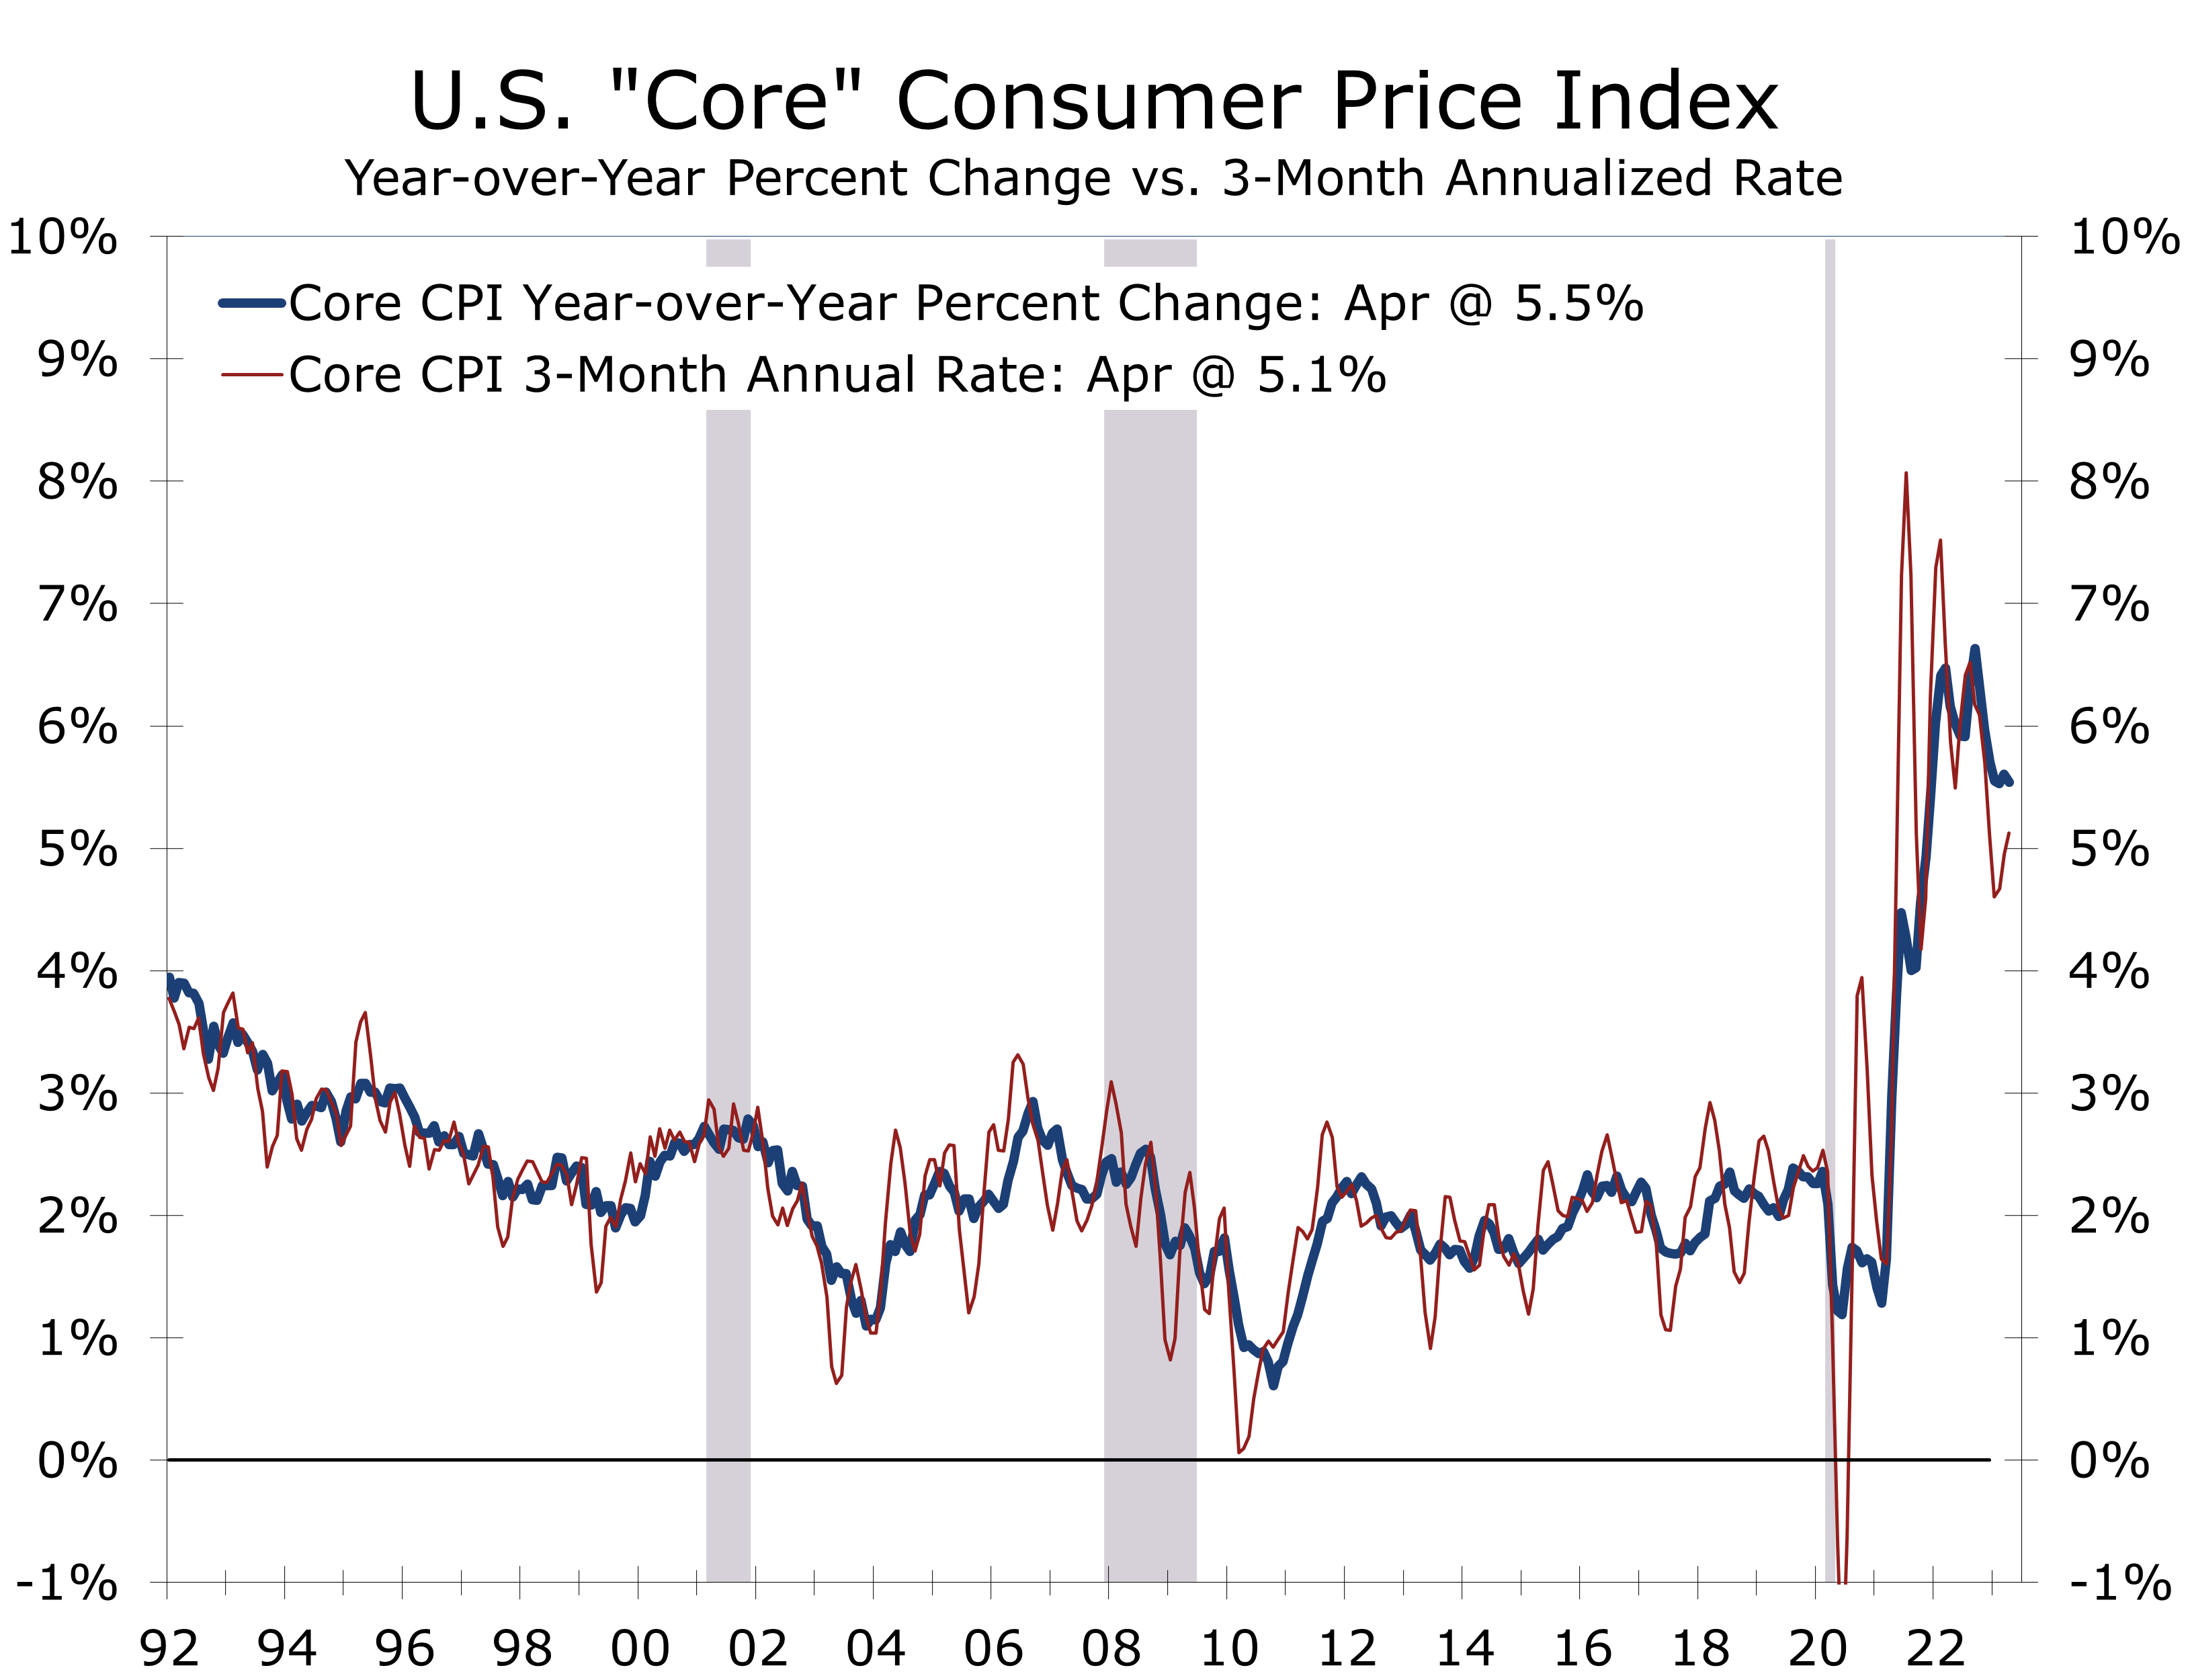
A good inflation report is a matter of perspective. Even with the recent moderation, the CPI remains up 4.9% year-to-year and the core CPI is up 5.5%. Moreover, most of the improvement this past year has come from lower energy prices, most of which result from the drawdown of the Strategic Petroleum Reserve and a pullback in used car prices. Those two sources of relief now appear to be behind us. Gasoline prices rose 3.0% in April and used prices rose 4.4%. Those gains were offset by large declines in prices for natural gas, fuel oil, and groceries. Shelter costs also rose less, thanks to lower lodging costs.

The unwinding of pandemic-drive shortages, multiple waves of stimulus payments, and the uneven reopening of the economy wreaked havoc with the seasonal adjustment process. This often leads to considerable frustration among folks who closely follow the CPI. One of the greatest frustrations has been that the BLS measure of rent considerably lags changes in market rents, which initially caused inflation to be understated and may now be overstating the inflation threat.
Residential rent provides a keen insight into why wage pressures are proving stubborn.
We have consistently downplayed the criticism of the BLS rent measure. Residential rent captures the cost of renting an apartment for all renters, not simply renters renewing their lease during a given month. As such, the BLS measure lags market rents. We do not see this as a shortcoming but rather a keen insight into why wage pressures are proving so stubborn. With rent of primary residence up 8.8% over the past year, renters are making greater wage demands out of necessity or are switching to higher paying jobs.
Prices for used cars have been another source of angst. The BLS data do not always follow market based measures of used car prices. Demand for used cars surged as commuters shunned mass transit during the pandemic and migration from transit-oriented cities to more car-dependent metro areas accelerated.
Grocery store prices fell 0.2% in April, marking a second consecutive drop. Prices for meat, poultry, fish, and eggs fell 0.8% and prices for fresh fruit and vegetables fell 0.5%. Egg prices continue to fall back from their recent highs, declining 1.5% in April following a 10.9% drop the prior month. Egg prices remain 21.4% higher than they were a year ago. Grocery store prices are up 7.1% over the past year. Prices for food away from home rose 0.4% in April and are up 8.6% year-to-year, with the largest gains coming at quick services restaurants.
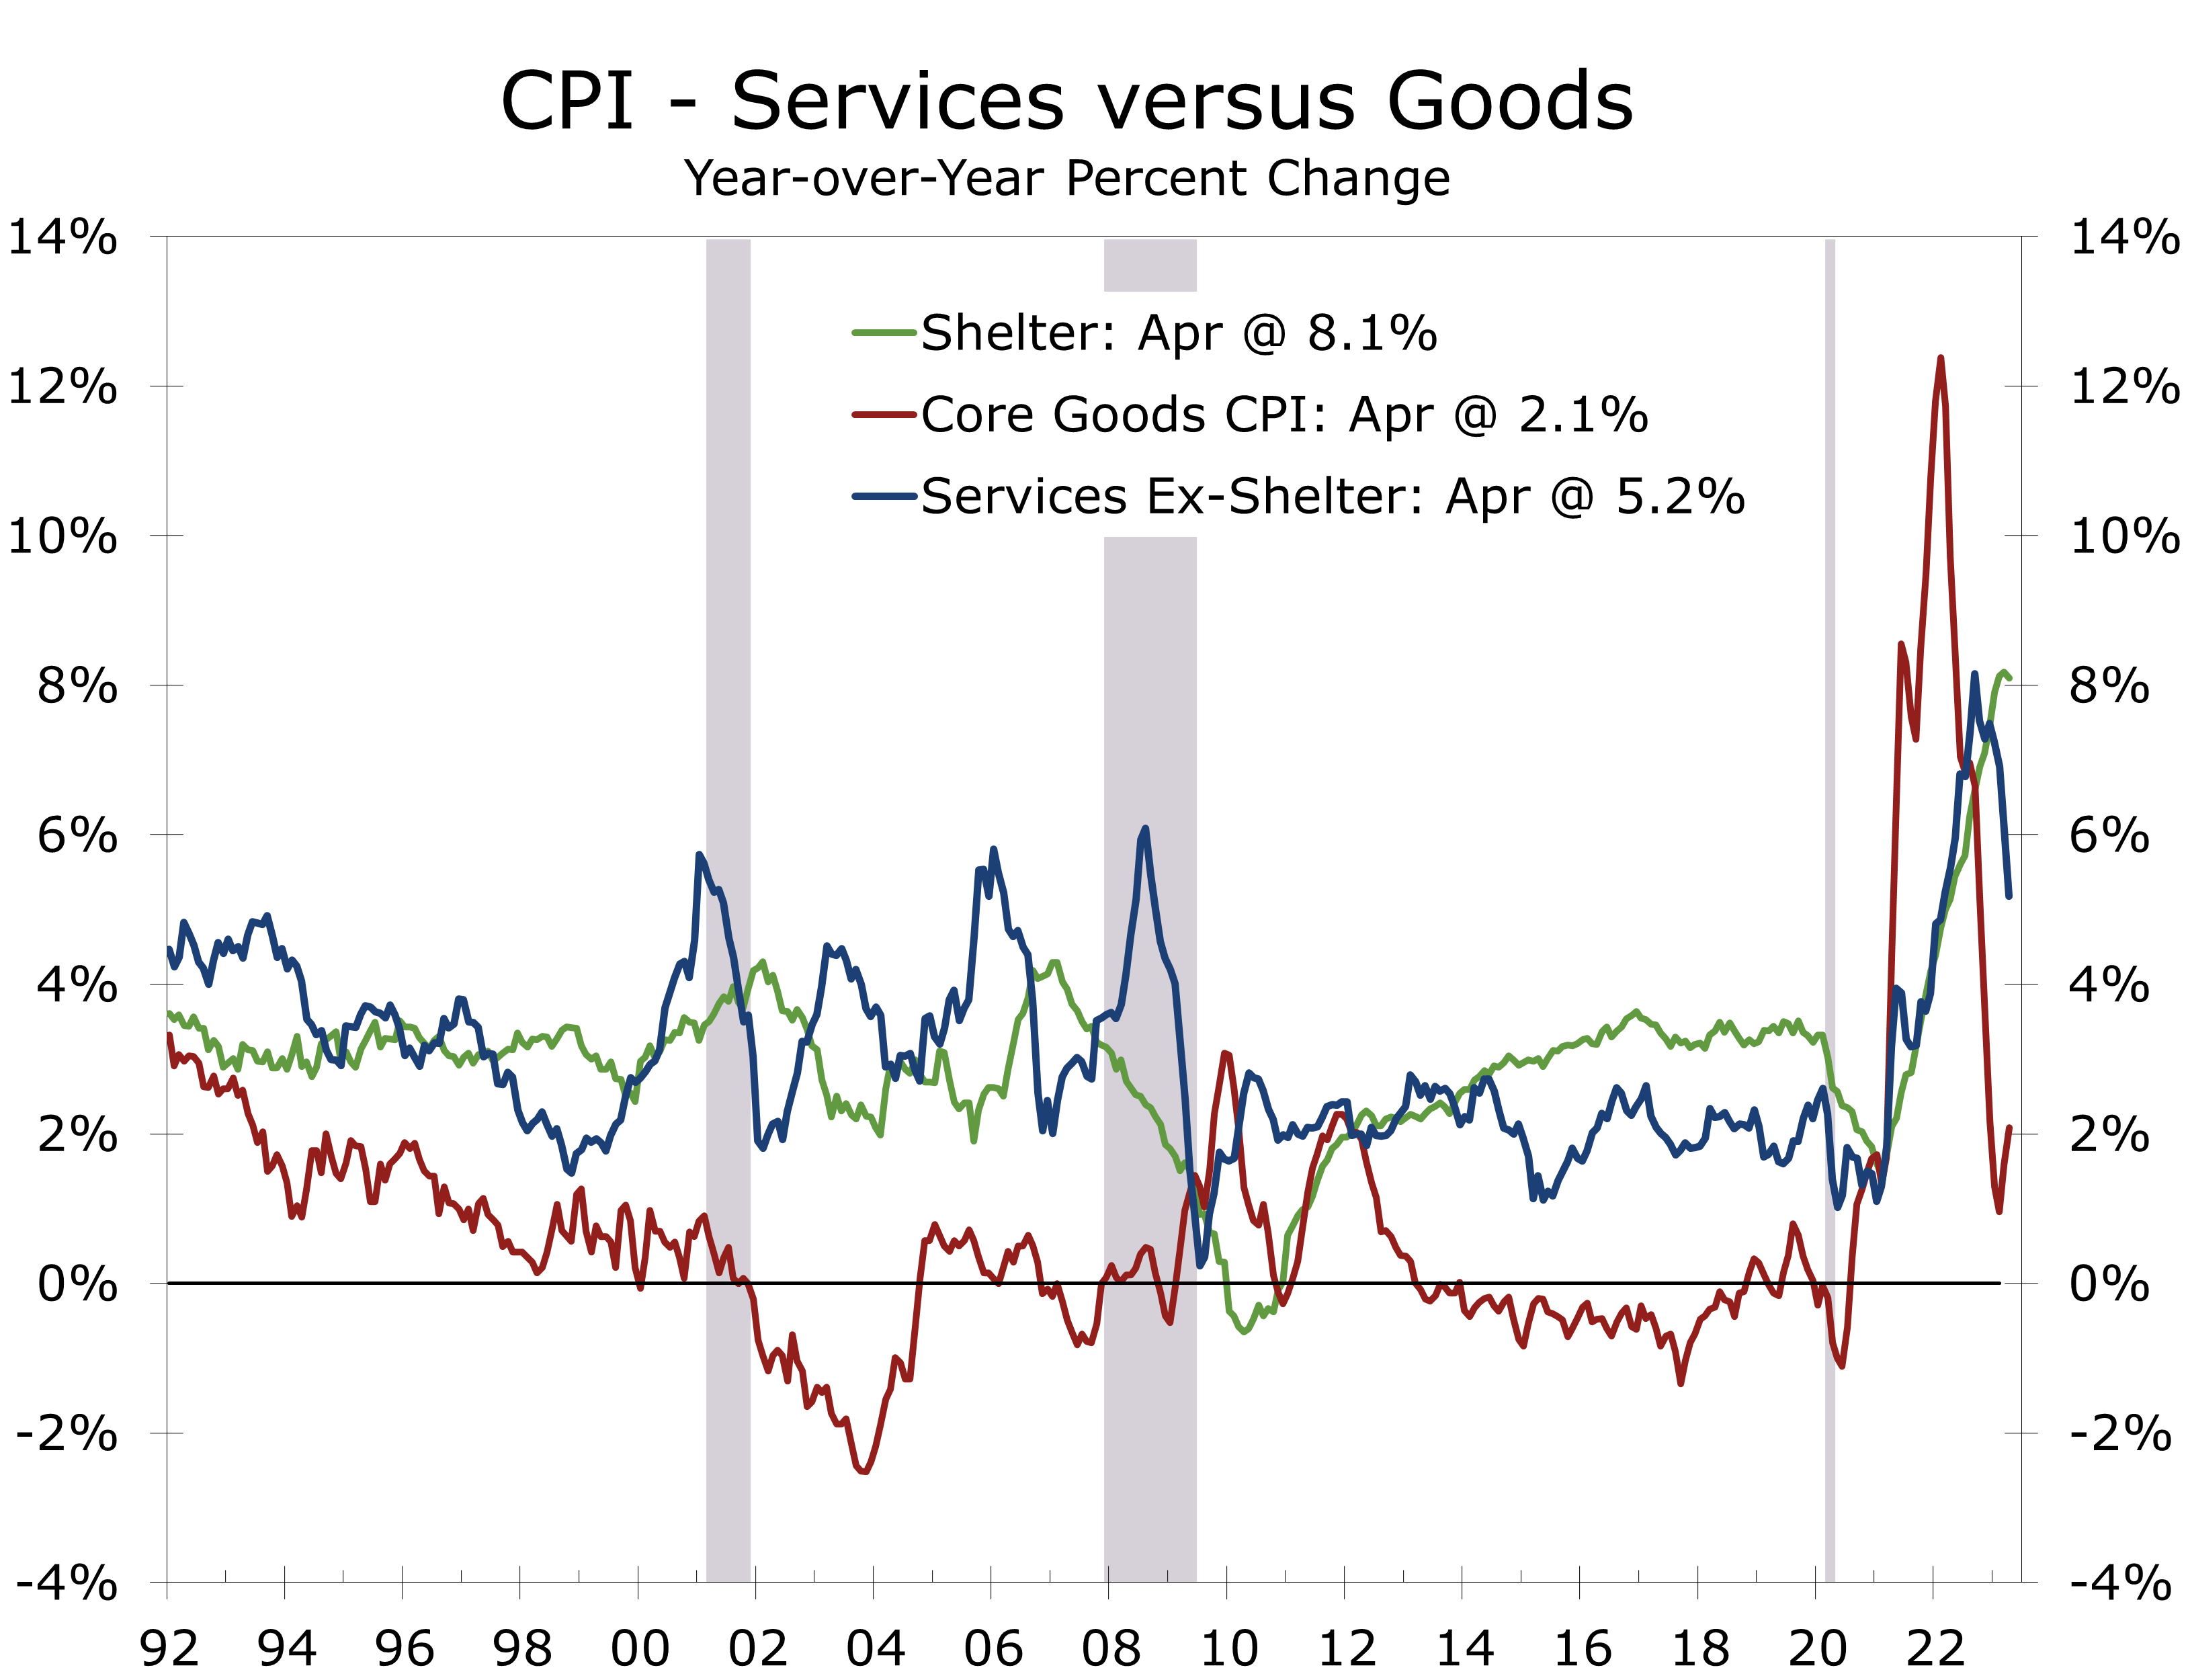
Shelter accounts for around 60% of the increase in the core CPI over the past year.
Core inflation has moderated less than the headline data, with prices still up 5.5% year-to-year. Moreover, the core CPI has risen at a 5.1% annual rate over the past three months. Shelter costs account for about 60% of the increase in the core CPI over the past year. Core goods prices have slowed to just 2.0% over the past year, reflecting the easing of supply-chain issues. Aside from shelter costs, the primary challenge to even lower inflation is coming from labor intensive parts of the service sector, including such items as hospital services, daycare, pet care and tax preparation.
Disclaimer: This publication has been prepared for informational purposes only and is not intended as a recommendation offer or solicitation with respect to the purchase or sale of any security or other financial product nor does it constitute investment advice.
Small Business Optimism Falls in April
Small Business Confidence is Getting Squeezed
- The NFIB’s Small Business Optimism index fell 1.1 points in April to 89.0, marking the 16th consecutive month the index has remained below its long-term average of 98.
- The proportion of owners expecting the economy to improve over the next six months fell 2 points to a net -49%.
- Six of the index’s 10 components fell in April, led by a 6-point drop in the current inventory series, which means more firms feel they have too much inventory.
- Labor quality remains the top concern of business, cited by 24% of firms, followed by inflation at 23%.
- Expected credit conditions improved by 1 point, partially reversing the prior month’s drop. More firms also report they are borrowing regularly.
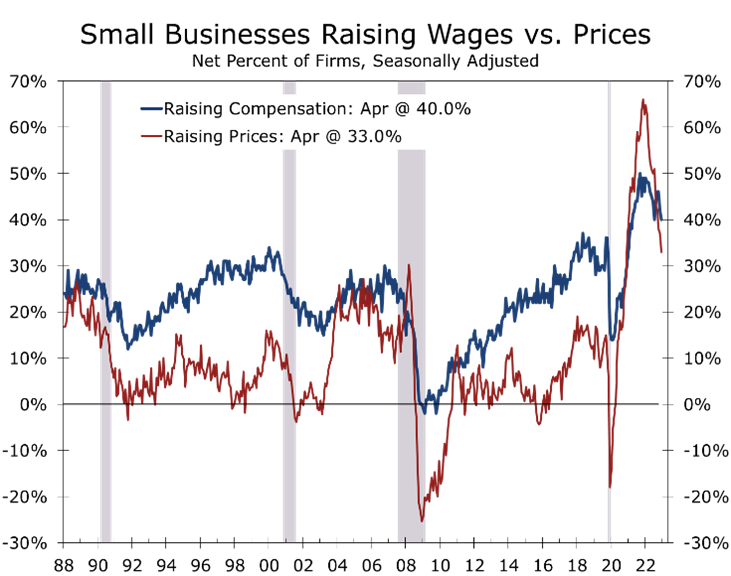
- The net share of firms raising prices fell 4 points to a still historically high 33%, continuing its recent string of improvement.
- A net 40% of business owners reported raising compensation in April, down 2 points from April. Labor quality is a much greater concern among owners than compensation.
The latest survey data from the National Federation of Independent Business (NFIB) provide another glum assessment of current and future economic conditions. The NFIB Small Business Optimism Index fell 1.1 points to 89, hitting its lowest level since January 2013.
Small business owners continue to get squeezed by rising costs, slowing sales, and diminishing pricing power. The banking crisis impacting some specialty lenders, predominantly on the West Coast, appears to be having only a modest impact on small businesses, with only 2% of firms reporting all their credit needs were not currently being met. A net 6% of firms report their last loan was more difficult to get than previously, down 3 points from March. More firms report they are borrowing regularly, however, so higher interest rates are taking a larger bite out of operating income.
Only 2% of small business owners reported all their credit needs were not satisfied in April.
The issues dogging small businesses are more fundamental: sales are slowing, and costs are rising. The net share of small business owners reporting sales improved fell 3 points in April to -9%. Moreover, the share of owners expecting sales to improve fell 4 points to -19%. With sales slowing, the share of businesses reporting they have too much inventory rose 6 points in April to a net 5%, which is one reason more firms report they are borrowing regularly. The share of firms borrowing regularly rose 1 point in April to 31% and is up 5 points over the past year.

Borrowers are paying higher interest rates than they were a year ago and are likely experiencing a little more difficulty in securing loans. The share of regular borrowers reporting they are paying higher interest rates has risen 10 percentage points over the past year to 26%. Over this time, the average short-term interest rate for regular borrowers has risen 320 basis points to 8.5%.
Labor quality has eclipsed inflation as a business’s top concern, with 24% of owners citing labor quality as their number one problem. Labor quality is a catch-all description for labor issues and differs from labor costs. The share of firms citing labor costs as their top concern fell 2 points to 9% in April.
Concerns about labor quality are mostly due to the poor quality of job applicants and new hires. Forty-five percent of owners reported job openings they could not fill in April, up 2 points from March. Construction, transportation, and manufacturing reported the greatest difficulty. On an overall basis, however, 92% of firms trying to hire workers reported few or no qualified applicants for the jobs they were trying to fill.
The lack of qualified workers is apparent in the poor first quarter productivity data, which showed nonfarm productivity tumbling at a 2.7% annual rate. Weaker productivity is driving operating costs higher and causing firms to lose business.
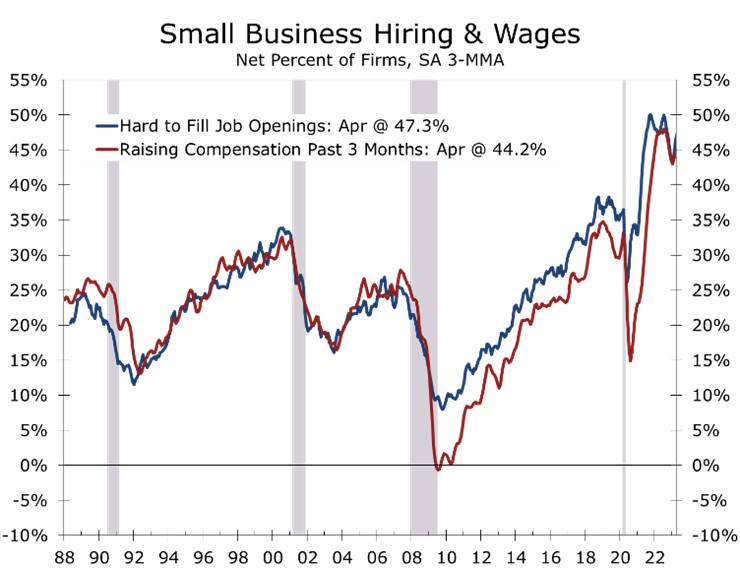
The high level of concern small business owners are voicing about labor quality comes at a time when the labor market is giving mixed signals. Layoff announcements have clearly risen, yet the unemployment rate has returned to its multi-decade low of 3.4%. The proportion of the prime working-age population that is currently employed or looking for work has also risen back above its pre-pandemic level, suggesting business owners are not likely to see any improvement in the quality of job applicants in coming months.
Heightened concerns about labor quality are a warning about corporate earnings more broadly.
Our read on small businesses heightened concerns about labor quality is that earnings are likely to come under stress more broadly throughout the economy. Remember, the NFIB survey was prescient in identifying the threat intensifying inflation posed to the broader economy at a time when the Fed was firmly holding onto its transitory line. Progress at reducing inflation will also likely lessen, as fewer firms are able to avoid passing on rising compensation costs. This is another data point suggesting the Fed may need to hike rates further and/or hold rates higher for longer.
Disclaimer: This publication has been prepared for informational purposes only and is not intended as a recommendation offer or solicitation with respect to the purchase or sale of any security or other financial product nor does it constitute investment advice.