
Inflation is Still Running Hot
Inflation Once Again Tops Expectations
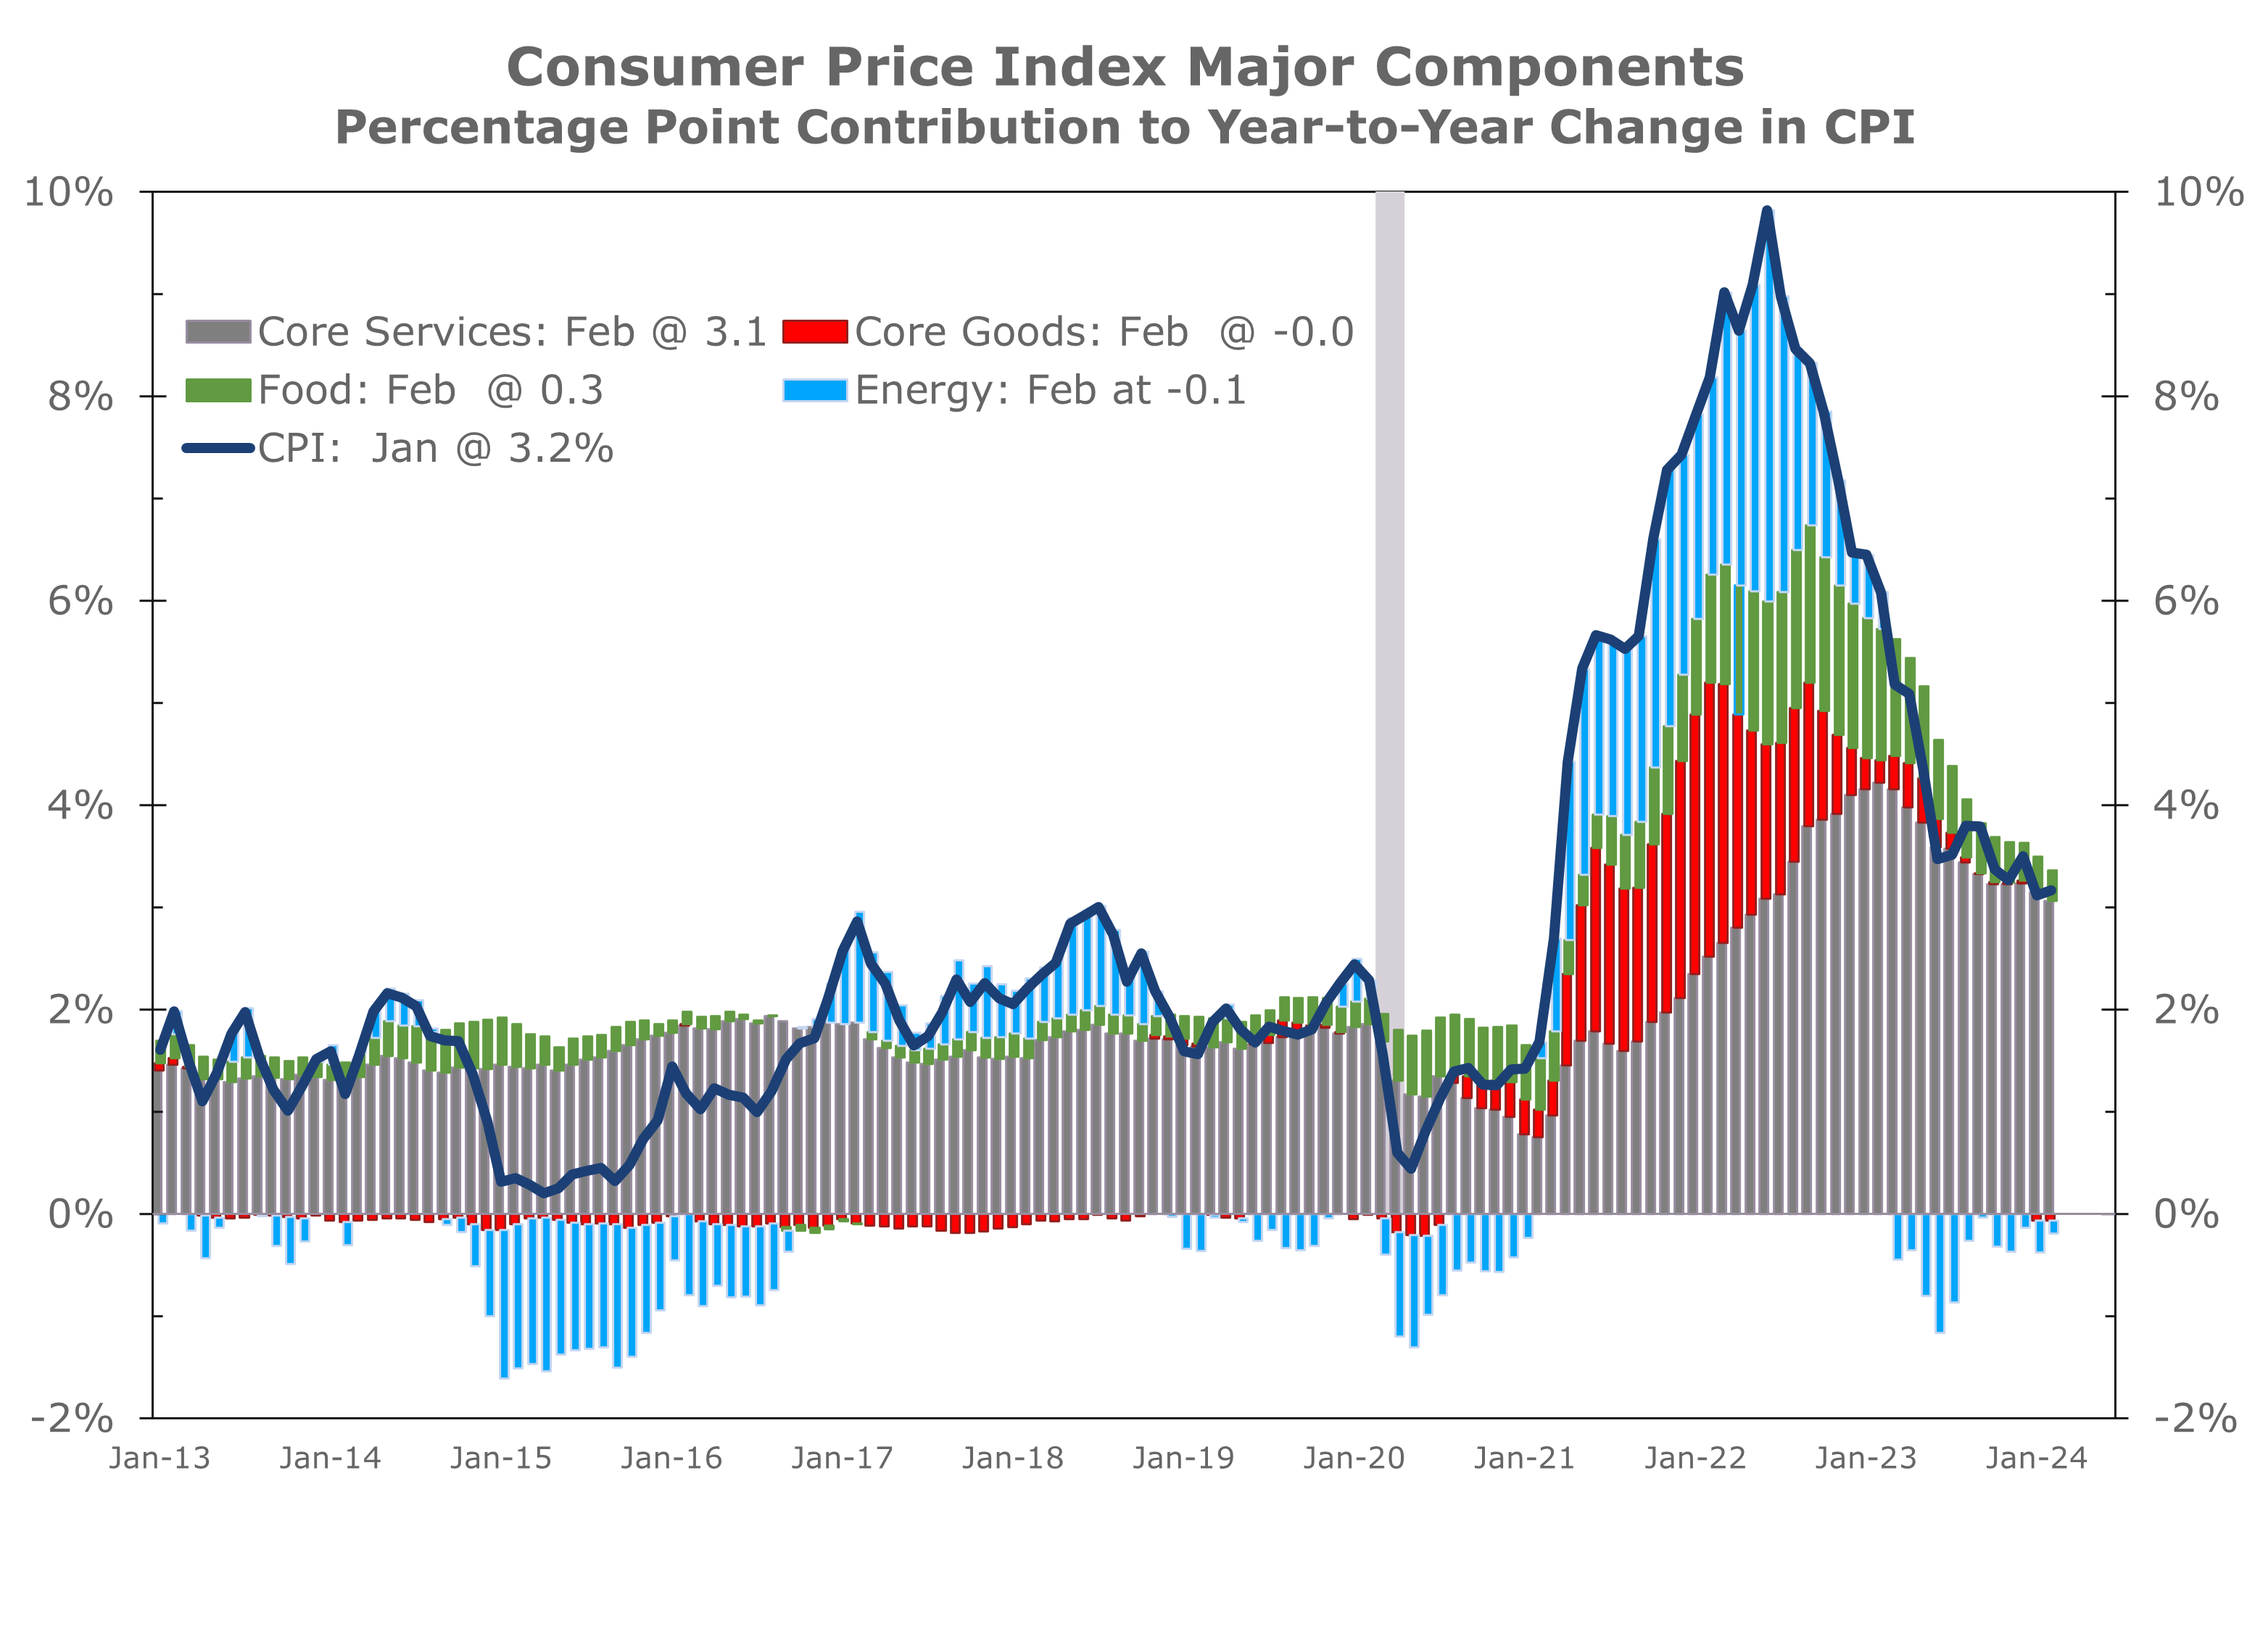
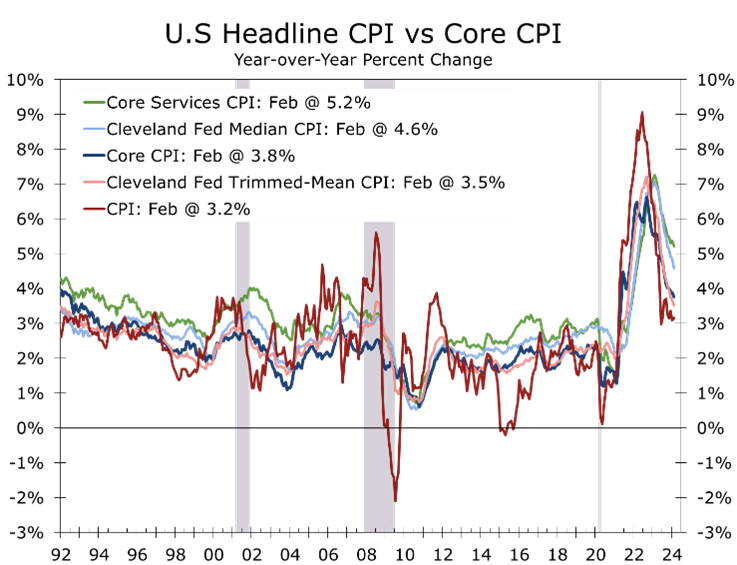
- Both the overall CPI and the core CPI rose 0.4% in February and are now up 3.2% and 3.8% year-to-year, respectively.
- We have continuously warned inflation would remain stubbornly high during the first half of 2024, reflecting continued pressures from labor-intensive sectors as well as some seasonal adjustment issues.
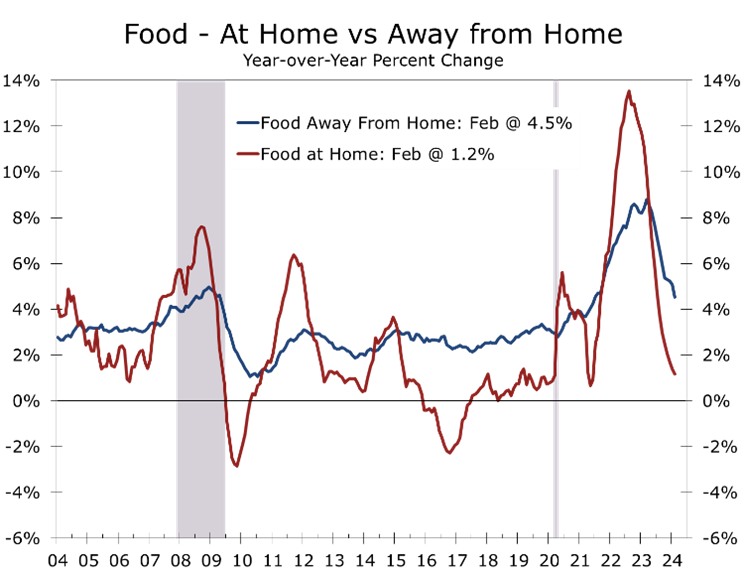
- Prices held steady at grocery stores and rose only slightly at restaurants. Unfortunately, both remain sharply higher than prior to pandemic, leaving budgets stretched.
- Energy prices rose 2.3% in February, with gasoline prices jumping 3.8% and prices for natural gas (+2.3%), fuel oil (+1.1%) and electricity (+0.3%) all climbing.
- Excluding food and energy products, the core CPI rose 0.4%, driven by another outsized rise in shelter costs. Prices for airline fares (+3.6%) and car insurance (+0.9%) also rose sharply.
- Inflation continues to come in hotter than expected. The breadth of price increases is narrowing, however, with much of this past month’s gains coming from higher housing and energy costs. We continue to expect the Federal Reserve to begin cutting interest rates in June, followed by additional quarter-point cuts in September and December.
Inflation once again exceeded expectations in February, with the CPI rising 0.4% and prices excluding food and energy also rising 0.4%. Despite the disappointing report, price increases were slightly less widespread than in January and show signs of moderating. However, the pace of moderation is slower than what financial markets had anticipated, leading many forecasters to push the Fed’s first rate cut out to June, a position we have held for some time.
One clear bright spot in the February data is that food prices are rising less rapidly. Prices remained unchanged at grocery store, following a 0.4% increase in January. Prices at restaurants rose just 0.1%, compared to a 0.5% increase in January.
Despite the moderation in food costs, consumers have not seen much relief. Grocery store prices are currently 25% higher than they were in February 2020 – the month before the pandemic hit.
Although prices eased last month, groceries and restaurant costs remain burdensome.
Prices at restaurants have risen by a similar magnitude since February 2020, surging 25.5%. Labor costs have increased sharply at both, rising by 24.9% at grocery stores over the past four years and 28.5% at restaurants. With wages sticky, a moderation in price increases is about as good as it is likely to get.
Persistently high food prices are one reason consumers feel discouraged about the economy. Families are spending 11% of their after-tax income on food, the highest proportion since 1991 according to recent USDA figures. With more income devoted to food, consumers have had to spend less on other items, had to dip into savings, or gone further into debt.
Election year politics is mischaracterizing the causes and remedies for high food costs.
President Biden has taken note of higher food prices and repeatedly cited “Shrinkflation” as one of the causes of higher inflation. Shrinkflation involves reducing the size or quantity of a product while keeping the price steady. The inference is that greedy companies or store owners are behind the higher prices. However, this explanation for inflation is fundamentally flawed and has been used over time, mostly by politicians, to shamelessly shift blame for higher prices, often toward middleman minorities.
Persistent inflation is always a monetary phenomenon. The money supply increased dramatically following the onset of the pandemic, as the Federal Reserve accommodated the massive increase in federal spending by increasing its purchases of federal debt. The growth in the money supply nearly perfectly matches the 25% cumulative increase in food prices.
Energy prices rose by 2.3% in February after two consecutive months of declines, with gasoline prices jumping by 3.8%. Energy prices have been the main contributor to lowering inflation over the past year. Even a slight reversal could significantly slow the improvement in the headline CPI.
Excluding food and energy, the core CPI increased by 0.4% and rose by 3.8% year-on-year. Most goods experienced moderate price changes, although apparel and used car prices rebounded last month. Core goods prices fell 0.3% over the past year.
Core services present the greatest inflation challenge, with prices climbing 0.5% in February and 5.2% over the past year. Housing, particularly residential rent, drove much of the increase, with rents for single-family homes and lease renewals seeing significant rises. In contrast, rents for new leases are slightly declining.
We expect inflation to slowly moderate this spring and summer, allowing the Fed to begin cutting the federal funds rate in late June. We continue to closely monitor the median and trimmed mean inflation figures published by the Federal Reserve Bank of Cleveland, which continue to show a slower and longer journey back to the Fed’s 2% inflation target.
Disclaimer: This publication has been prepared for informational purposes only and is not intended as a recommendation offer or solicitation with respect to the purchase or sale of any security or other financial product nor does it constitute investment advice.
Mark Vitner, Chief Economist
mark.vitner@piedmontcrescentcapital.com
704-458-4000

Another Confounding Employment Report
Softening is Evident Beneath the Headlines
- Nonfarm employment once again topped consensus expectations, with employers adding a net 275,000 jobs in February.
- While hiring rose in most industries, gains were concentrated in health care, leisure and hospitality and government.
- Weather also boosted job growth, lifting construction payrolls, and also contributed to a big rebound in weekly hours.
- Job growth was revised lower by a combined 167,000 jobs for the prior two months.
- The unemployment rate also jumped 0.2 pp to 3.9%, as household employment fell by 184K and the labor force grew by 150K, lifting unemployment by 334K.
- Newly released data indicate third-quarter payrolls were also significantly overstated.
- The monthly employment data remain confounding, with initial reports continuing to come in well ahead of market expectations but downward revisions to prior data allaying fears of the economy overheating. We believe hiring is slowing more than the headlines suggest and look for payroll growth to meaningfully decelerate this spring.
Nonfarm employment blew past consensus expectations, with employers adding 275,000 jobs in February. Upside surprises to monthly payroll growth are becoming the norm. The markets appear to be discounting the strong headline gains; however, data have repeatedly been revised lower.
This was the case in the February report, which saw payroll growth revised lower for January and December by a combined 167,000 jobs. Even after the downward revisions, payroll growth for the past three months still averaged a whopping 265,000 jobs per month. Nonfarm employment has risen at a 2% annual rate over the past three months, slightly ahead of the 1.8% pace maintained over the past year.
We suspect job growth is currently significantly overstated and look for hiring to decelerate.
Job growth around yearend is notoriously volatile and may be even more so today, given the wide swings in economic activity during and after the pandemic lockdowns. These wider swings likely distorted seasonal adjustments.
We suspect payrolls are now overstated, as recently released QCEW data reveal only a 1.5% year-to-year increase in Q3 2023, approximately 800,000 jobs fewer than the currently reported 2.4% growth. The smaller job gain will show up in next year’s annual revisions.
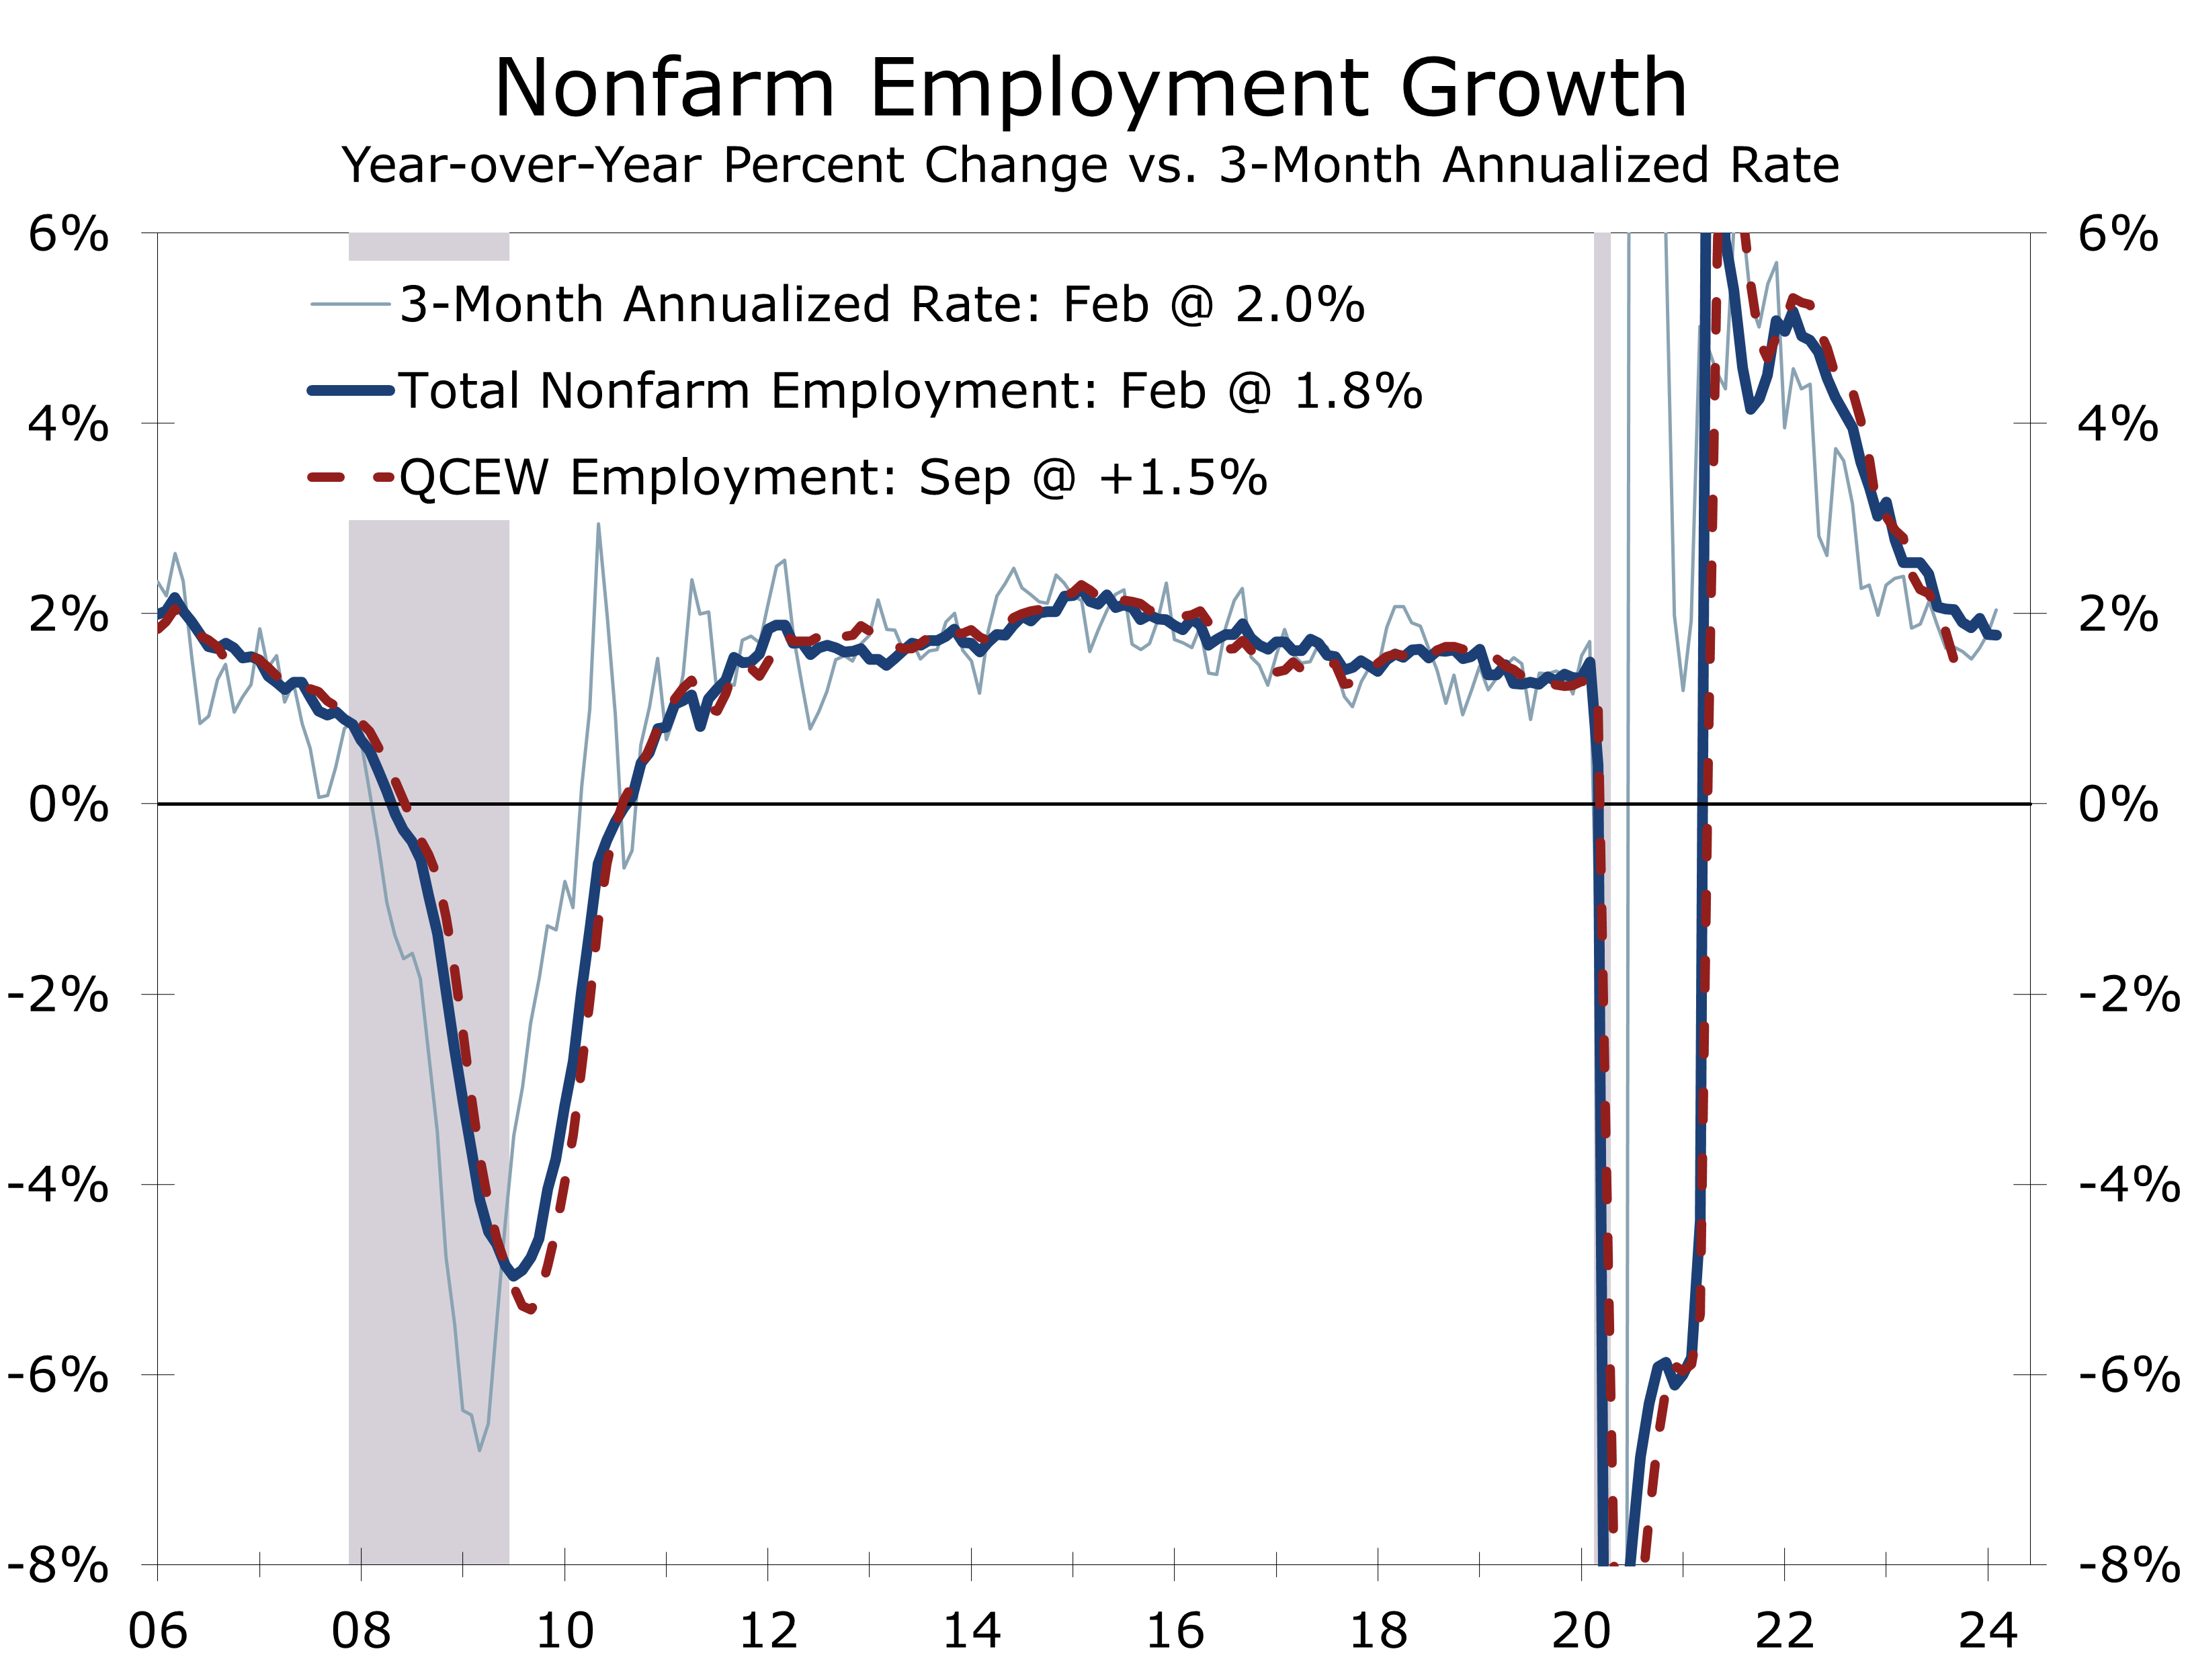
We do not believe there is anything nefarious in today’s overstated jobs figures. For starters, the response rate to the monthly employer survey is well below its pre-pandemic norm, resulting in larger revisions to prior month’s data. Seasonal adjustment is also likely being exaggerated by the larger swings in payrolls that occurred around the pandemic. Additionally, employers are holding onto seasonal hires amidst a persistently tight labor market.
Hiring was broad based, as improved weather lifted hiring in a number of industries.
Job growth was broad-based in February, as hiring rebounded in several industries previously hindered by unusually harsh winter weather in January. Construction payrolls rose by 23,000 in February, driven by significant gains in heavy construction. Hiring also saw a resurgence in transportation, warehousing, retail, and restaurant sectors. Overall, we estimate that the improvement in weather contributed to around 50,000 of February’s net job gains.
Although hiring rebounded in many industries, job growth remained highly concentrated, with health care (+66.7K) and social assistance (+24K) accounting for nearly one-third of February’s gain. Government (+52K) and leisure and hospitality (+58K) also experienced robust job gains. However, manufacturers cut 4,000 jobs.
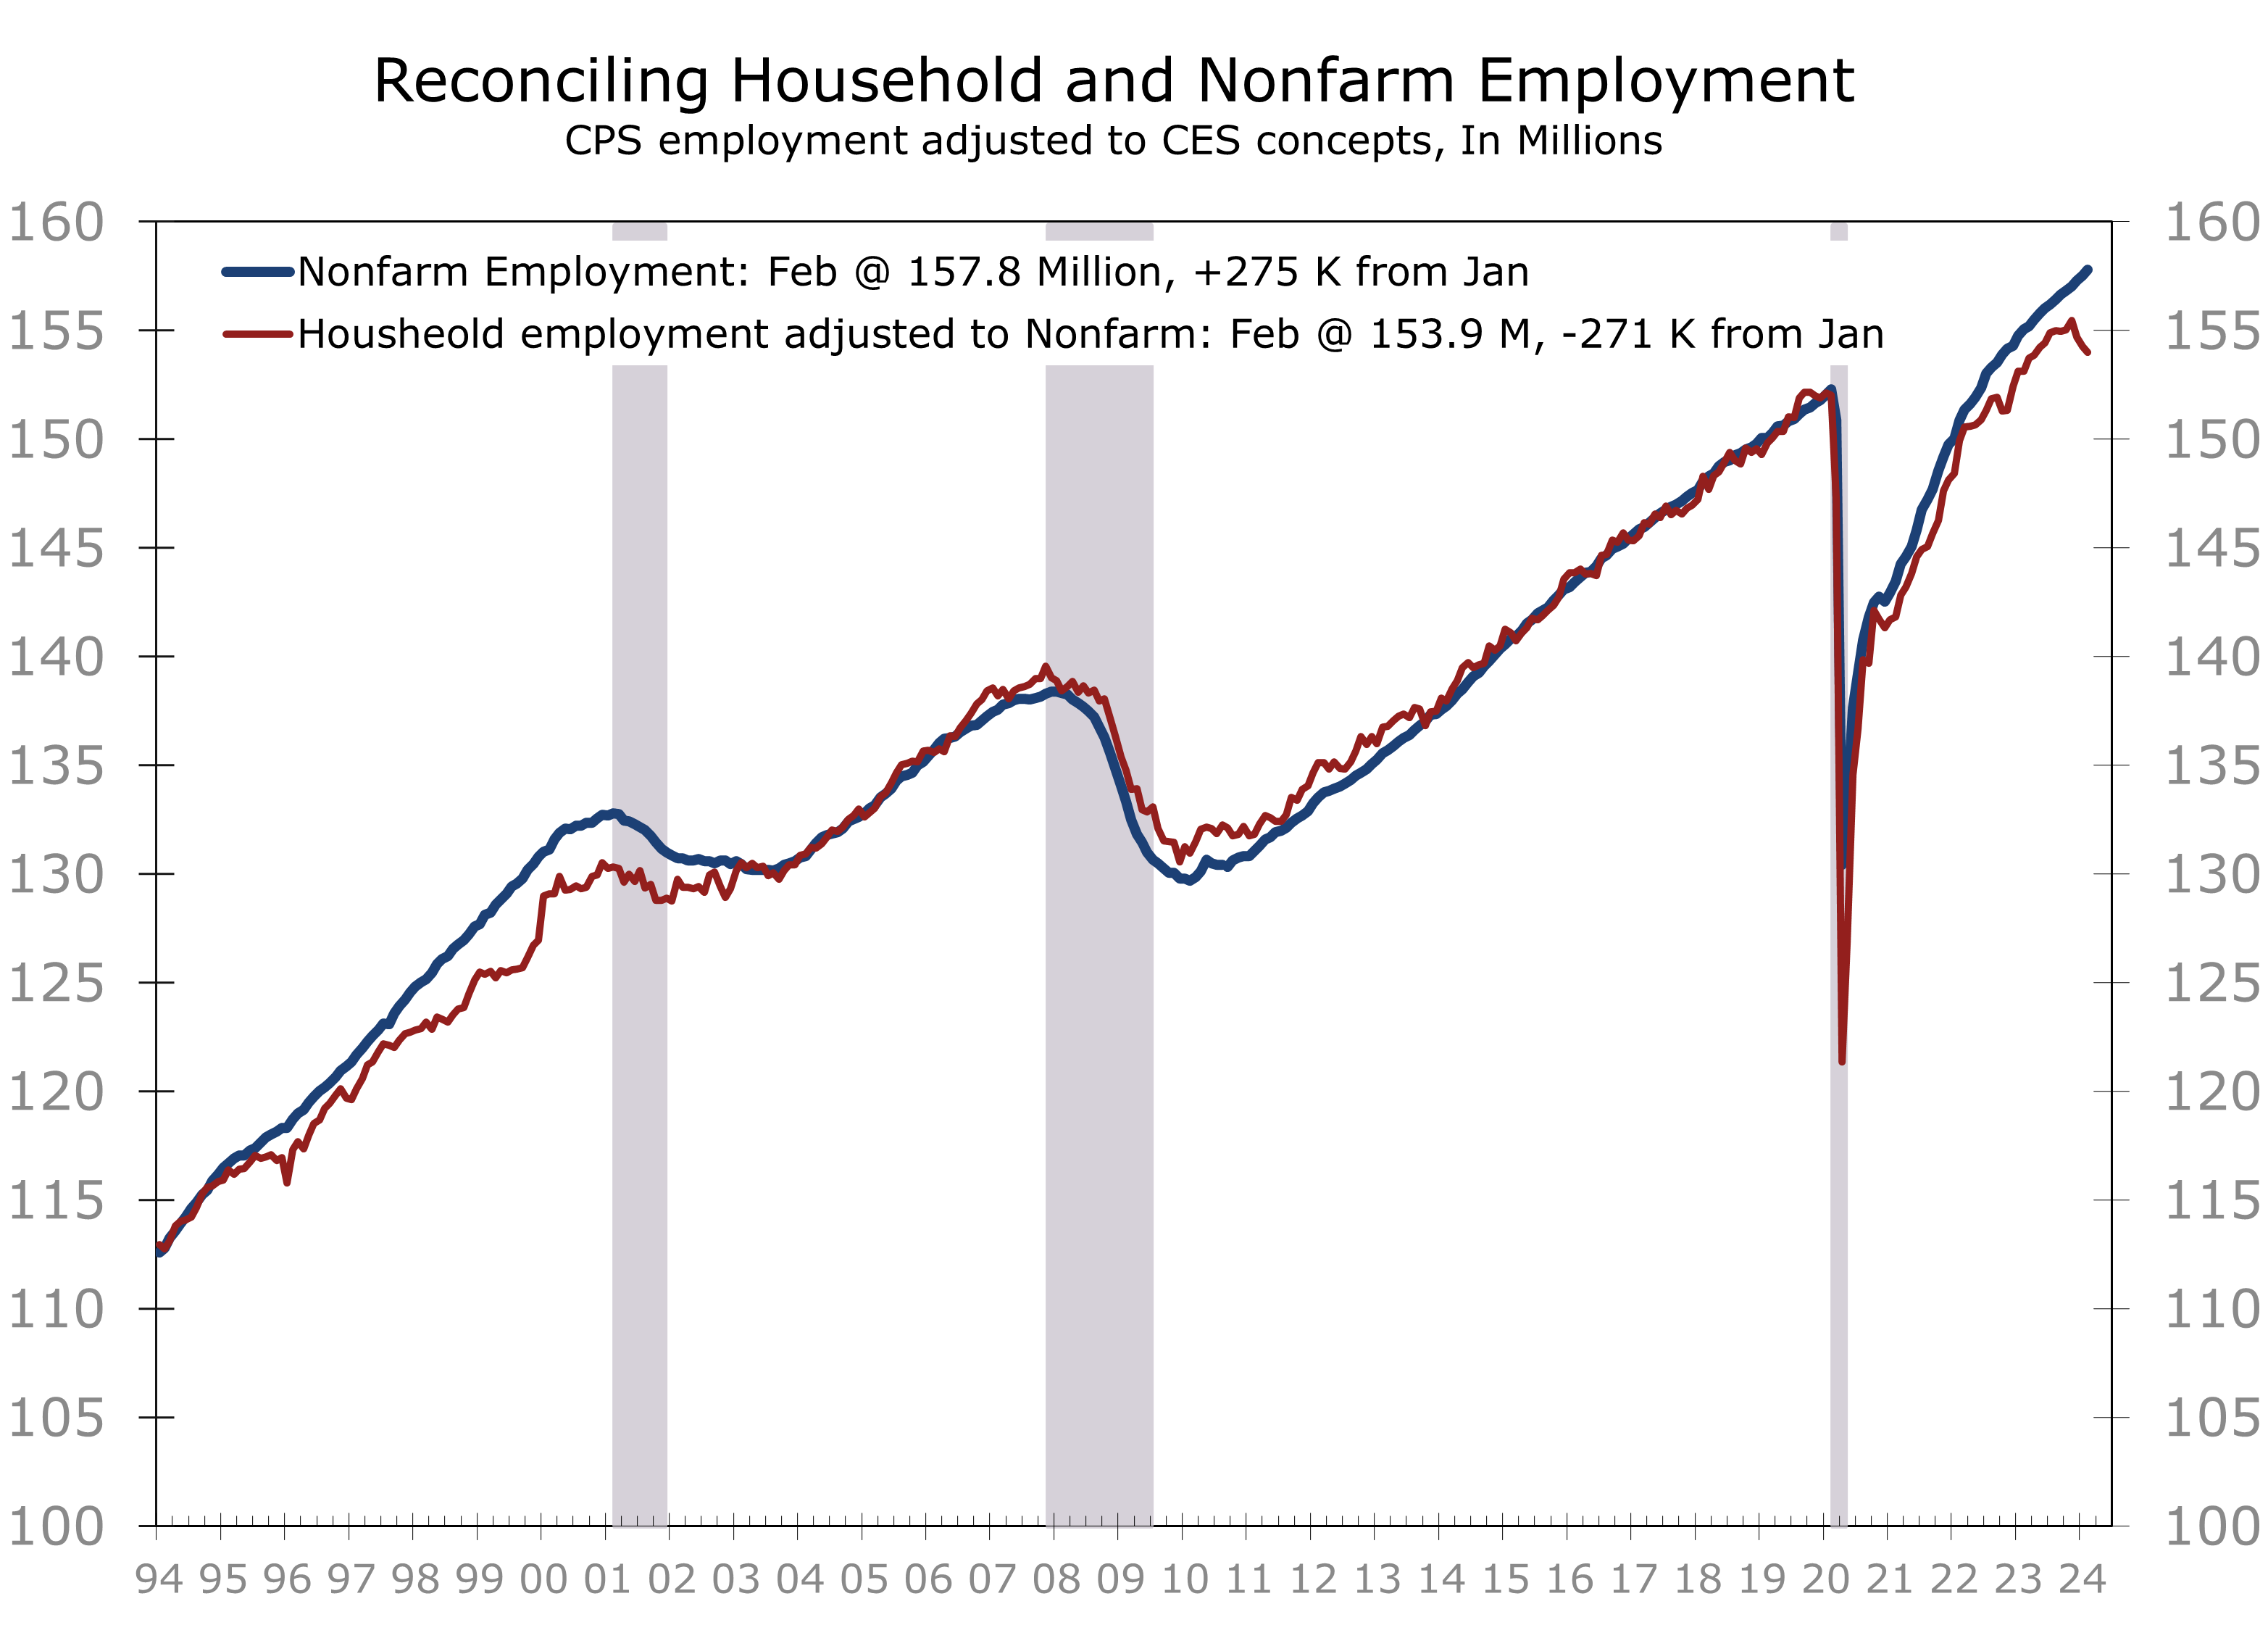
We expect nonfarm payroll growth to decelerate to 160,000 jobs per month this spring. The unemployment rate is also expected to edge higher to just over 4%. This should allow the Fed to cut the federal funds rate by a quarter point in June, followed by similar cuts in September and December.
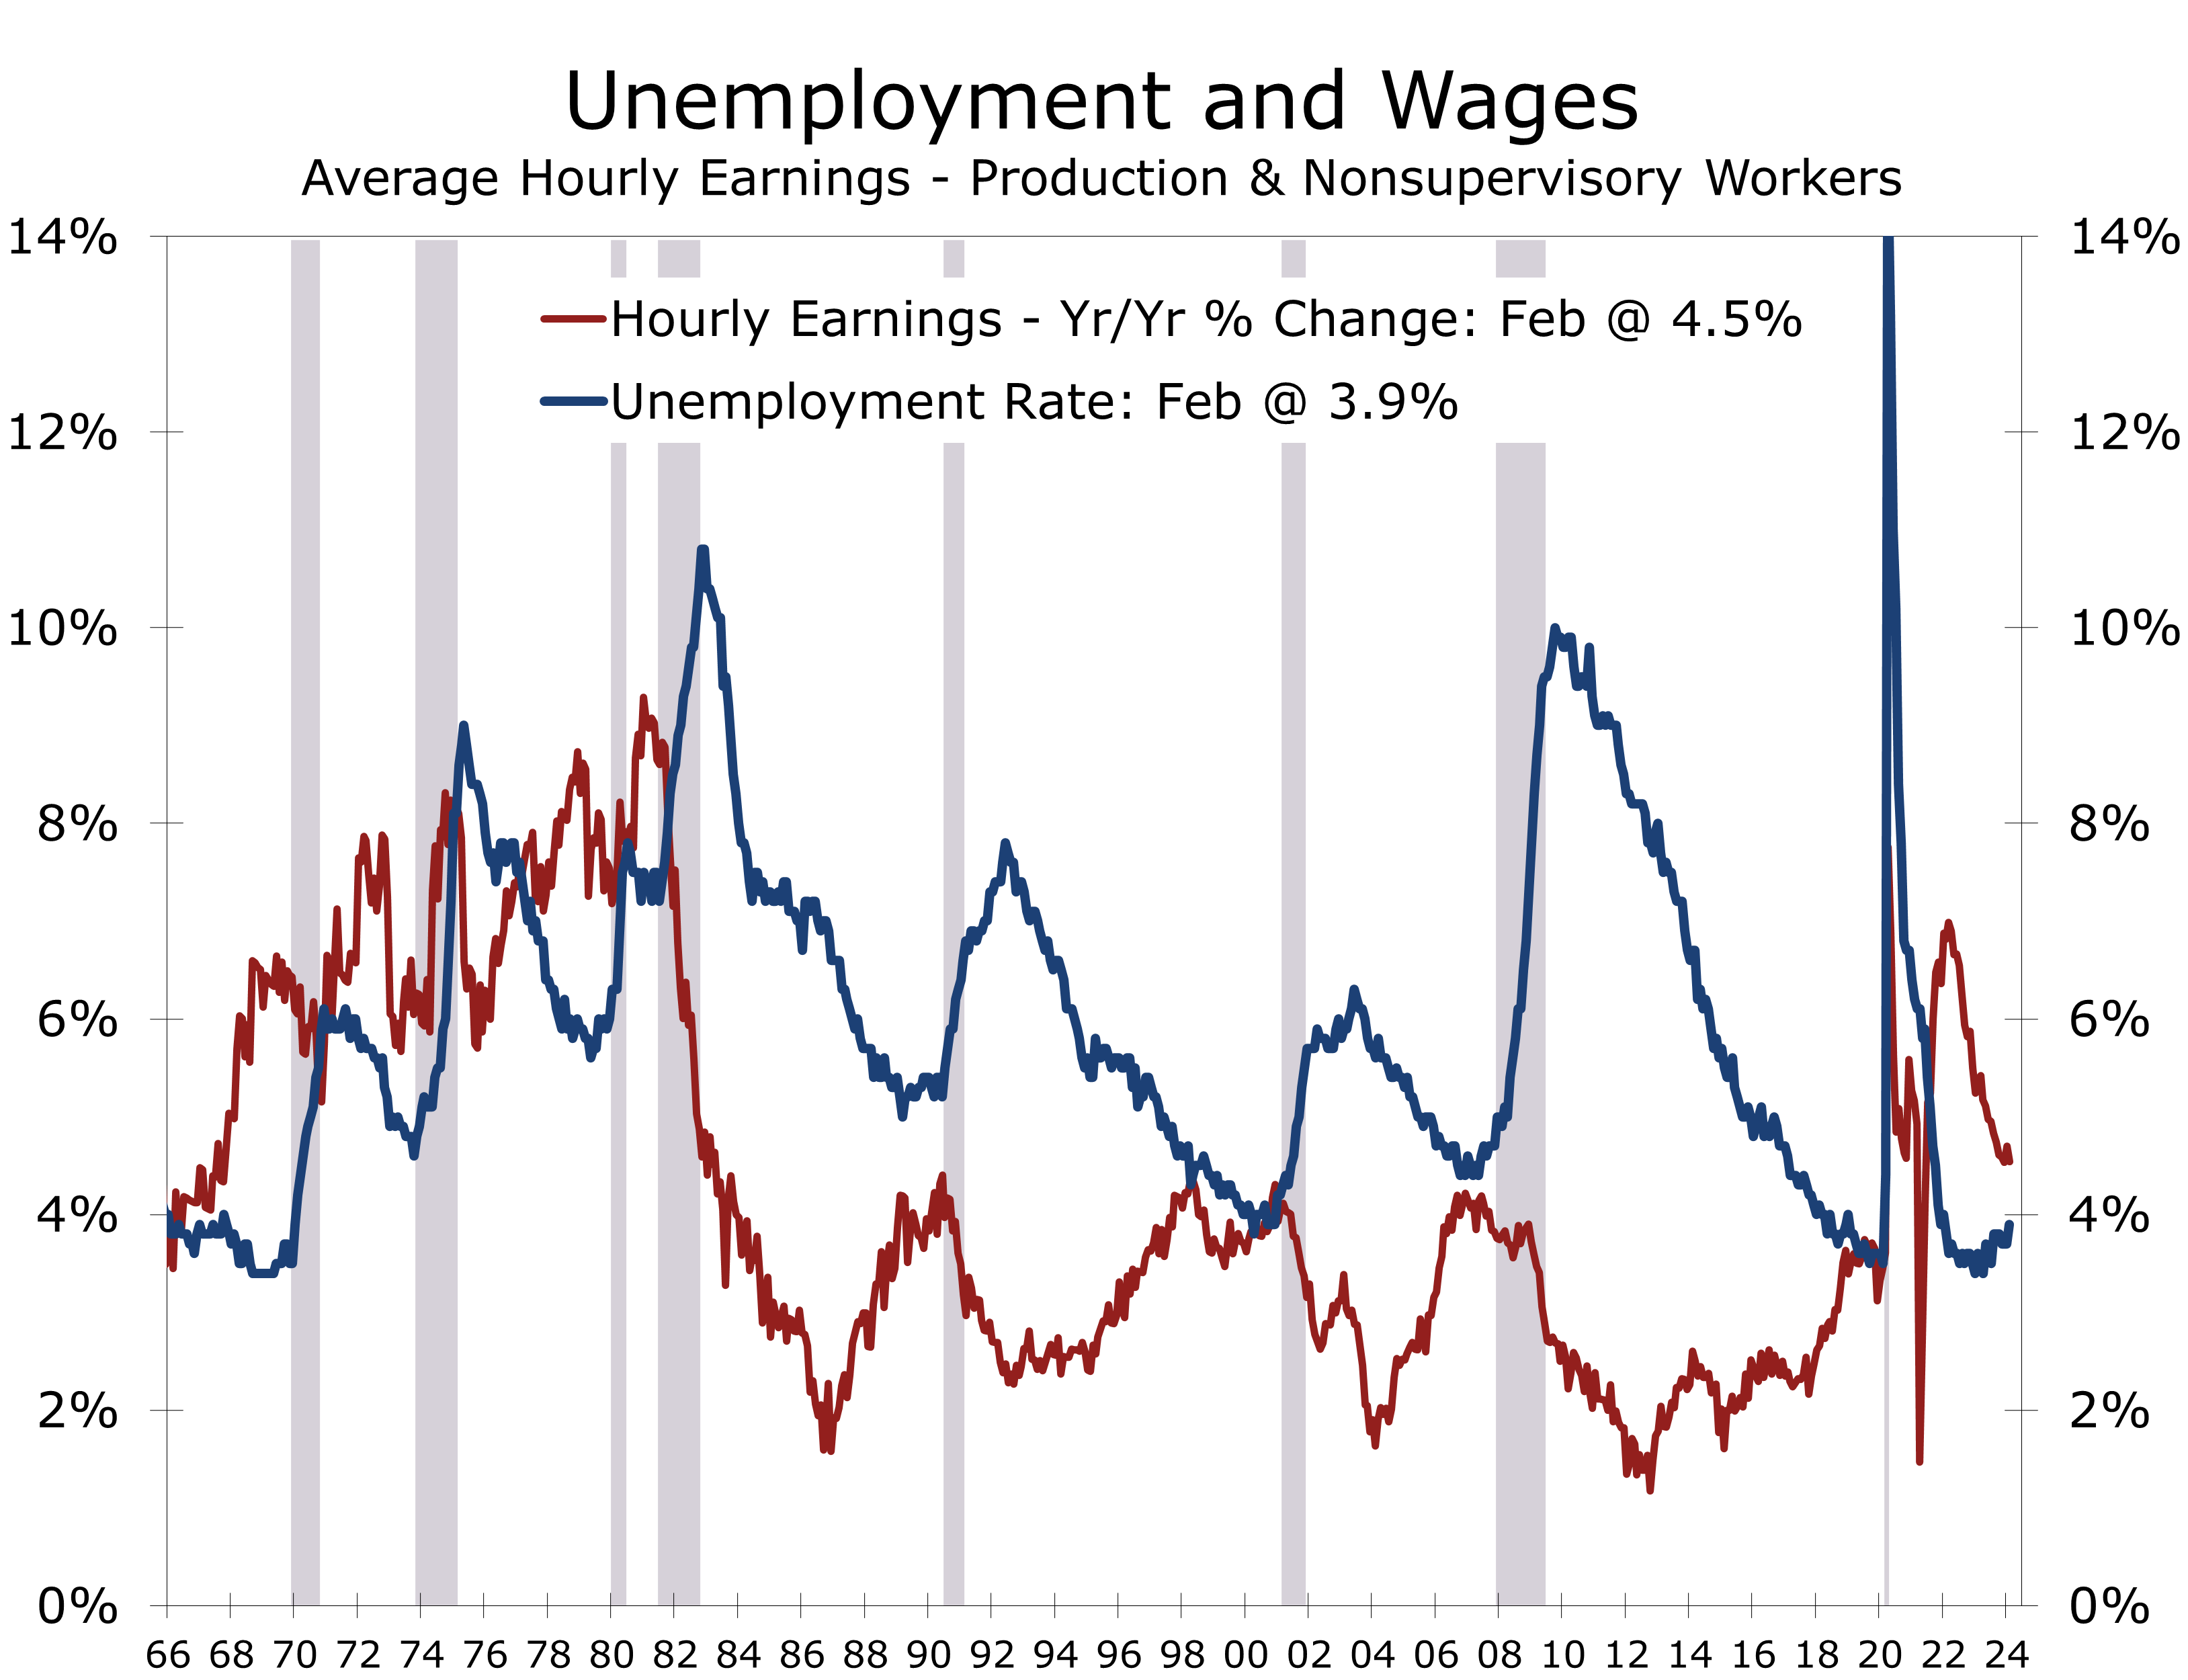
February’s household employment data was surprisingly weak. The number of employed individuals fell by 184,000, while the labor force increased by 150,000, resulting in 334,000 more unemployed. As a result, the unemployment rate rose to 3.9%.
A rebound in weekly hours helped reverse last month’s spike in average hourly earnings.
Household employment, which has historically been good at detecting turning points, is meaningfully weaker than the payroll data when viewed on a consistent basis. Adjusted household employment has now fallen for three consecutive months and is down a collective 1.474 million jobs since November.
Rising unemployment should help contain inflation. Average hourly earnings grew by just 0.1% in February and are now up 4.3% over the past year.
Disclaimer: This publication has been prepared for informational purposes only and is not intended as a recommendation offer or solicitation with respect to the purchase or sale of any security or other financial product nor does it constitute investment advice.
In Rate Cuts We Trust
Soft Landing Hopes Are Closely Tied to Rate Cuts
-
- January’s astonishing 356,000-job rise in nonfarm employment and upward revisions to prior months’ data suggest the economy began the year with surprisingly strong momentum. Consensus forecasts for first quarter GDP growth have been ramped up and remain above 2%, even following disappointing reports on retail sales and industrial production. Our own forecast calls for real GDP to rise at a 2.4% in Q1 and 2.5% for all of 2024 (annual basis).
- A larger than expected rise in the January’s Consumer Price Index was the most disruptive data point this past month. The slightly larger than expected increase in both the headline and core price measures indicates inflation will not likely moderate as fast as the markets had expected. Broader prices measures, such as the Cleveland Fed’s Median CPI, show that inflation remains sticky in many labor-intensive parts of the economy. The PPI data also came in on the high side.
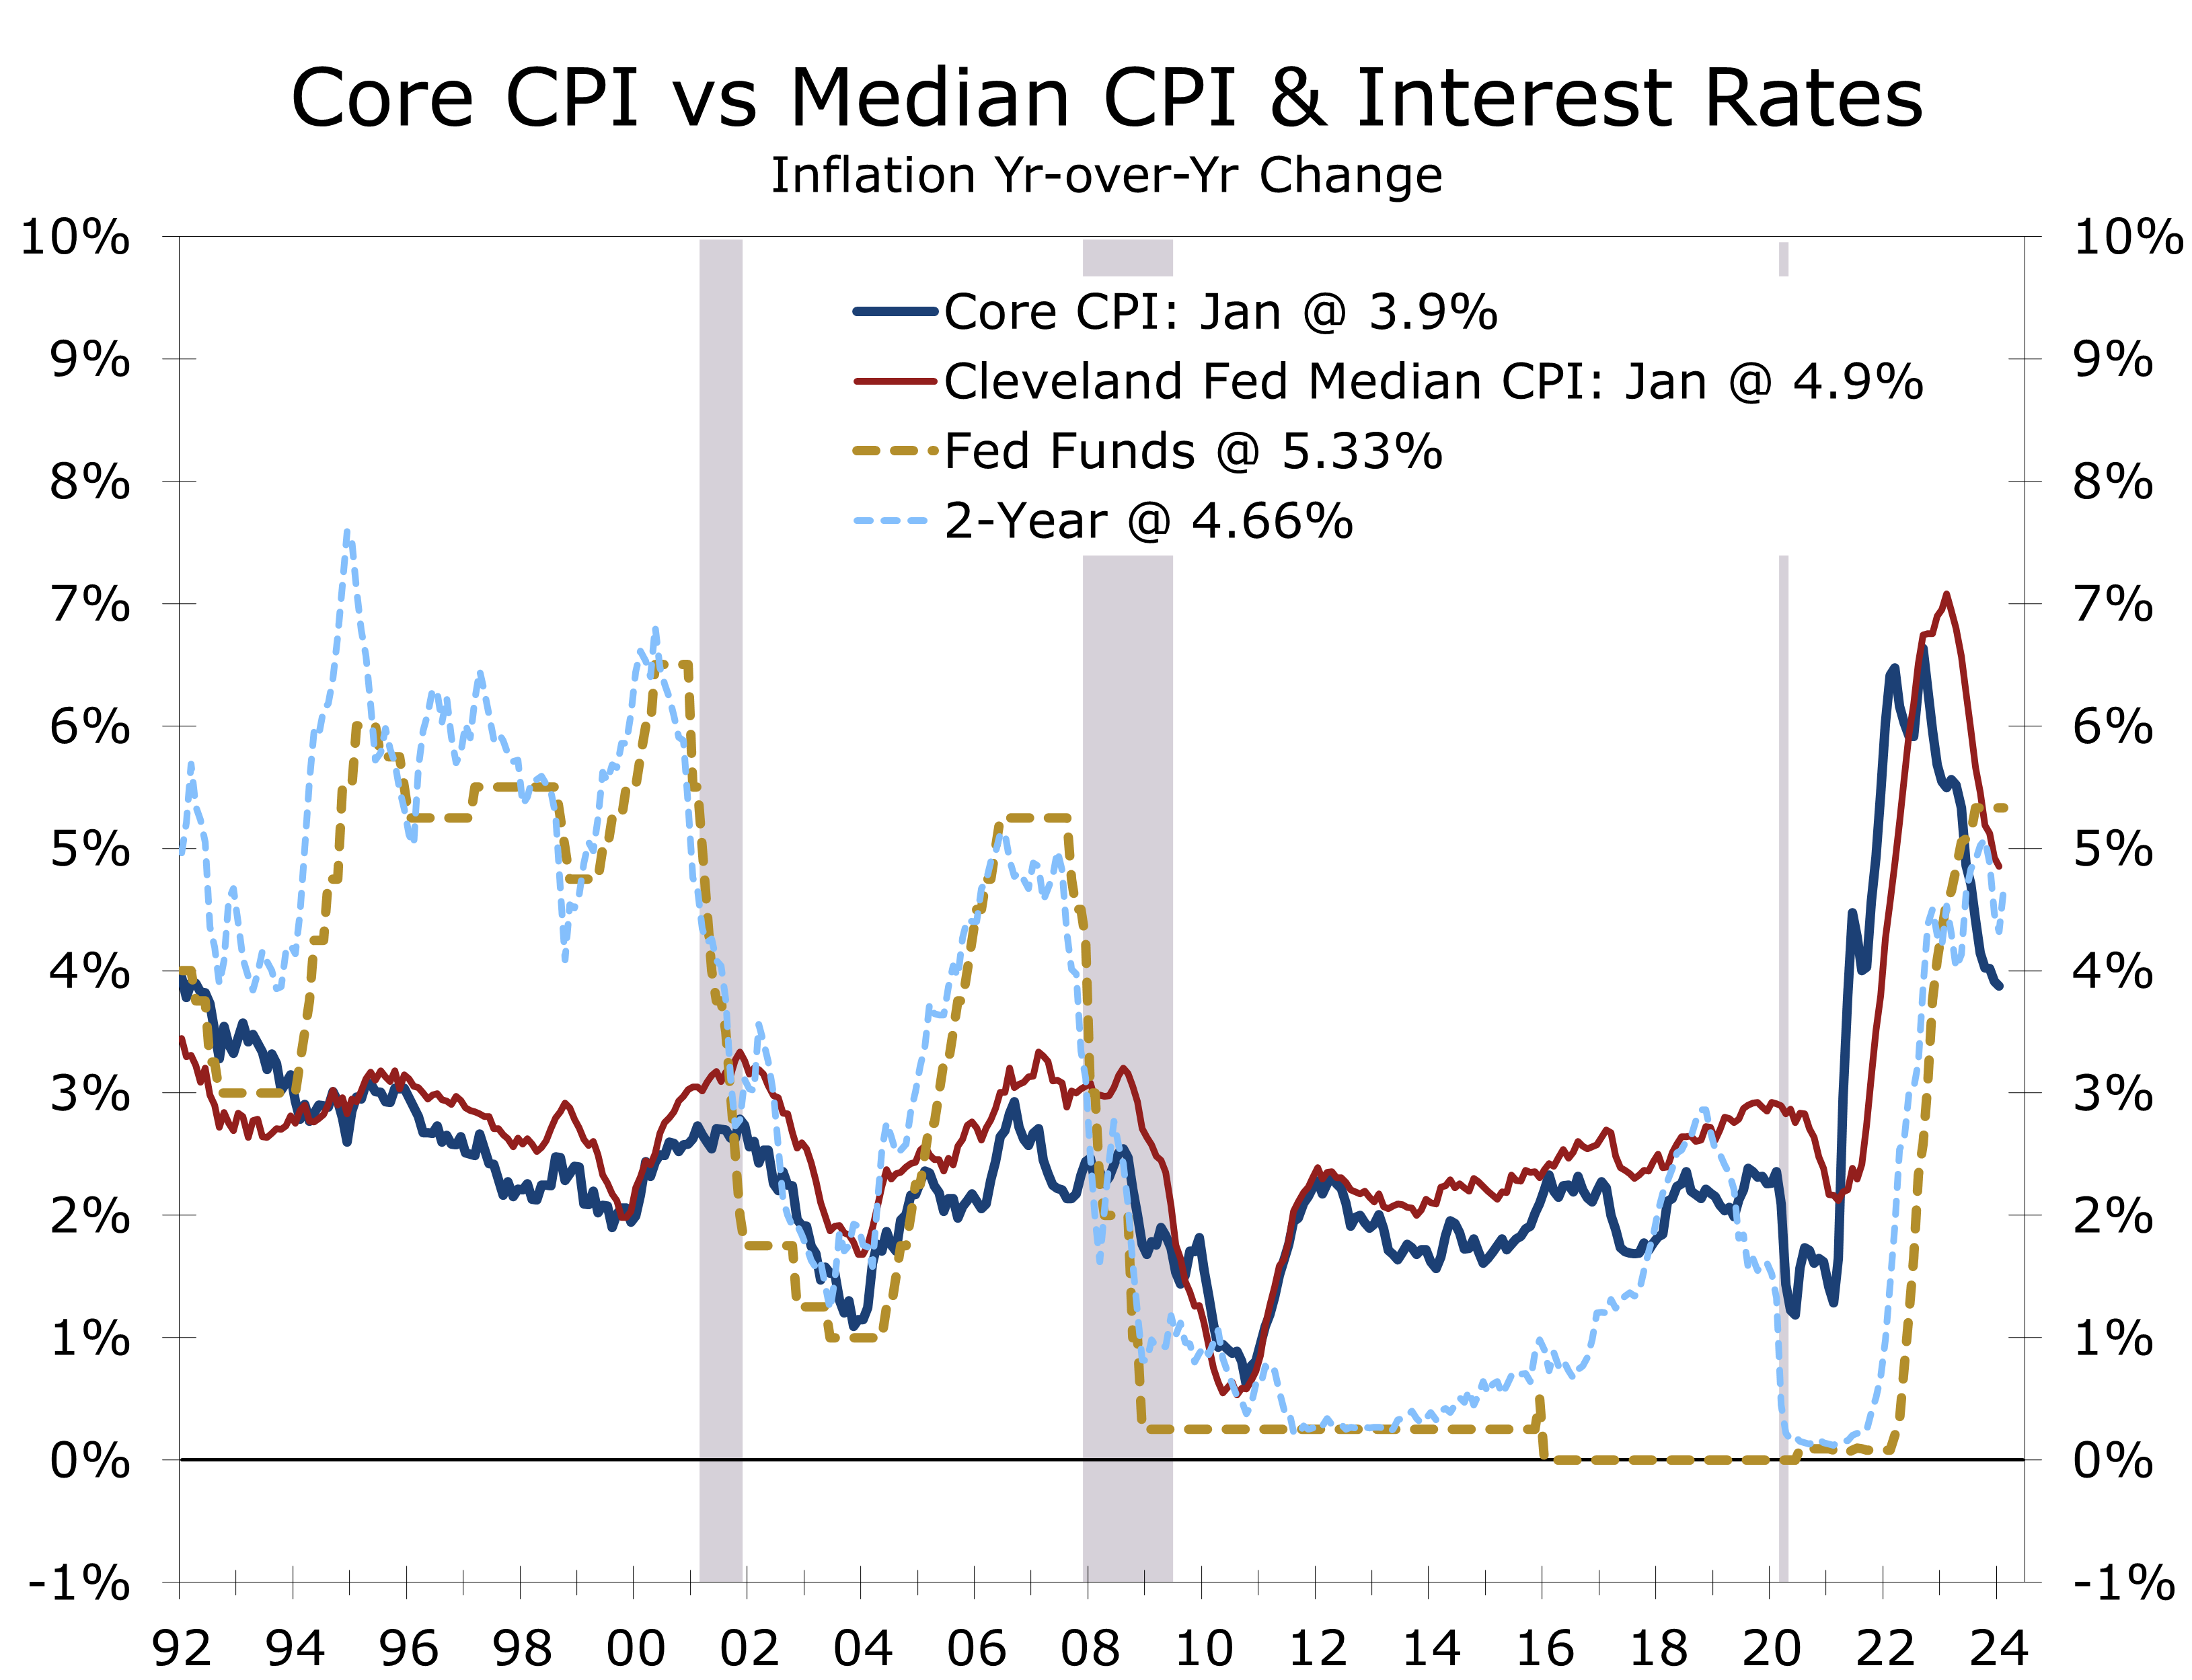
- Higher and stickier inflation throws a wrench into the mechanics of forecasts calling for aggressive cuts in the federal funds rate this year. If inflation remains higher, real rates will rise less and likely limit the Fed to 3 or, at most, 4 quarter-point cuts this year, beginning in May or June. That trajectory is in line with the recent 2-Treasury yield, which consistently provides a good approximation of the federal funds rate one year out.
- While the U.S. economy is proving resilient, global economic growth is surprisingly weak. Concerted efforts by manufacturers to diversify their production base and supply chains continues to weigh on China’s economy. Japan and the U.K. have both fallen into recession. The US, India and Mexico are notable upside surprises and offset part of this weakness.
- Weaker global growth should help curb inflation, giving the Fed room to cut rates. Geopolitical risks are boosting shipping costs, however, adding to global uncertainty. While the U.S. economy has repeatedly proved resilient, the business cycle appears both old and delicate in some respects, while vibrant and dynamic in others. Notably, the stock market's strength, driven by the AI revolution, mirrors the mid-1990s technology boom, producing a then record-long expansion.
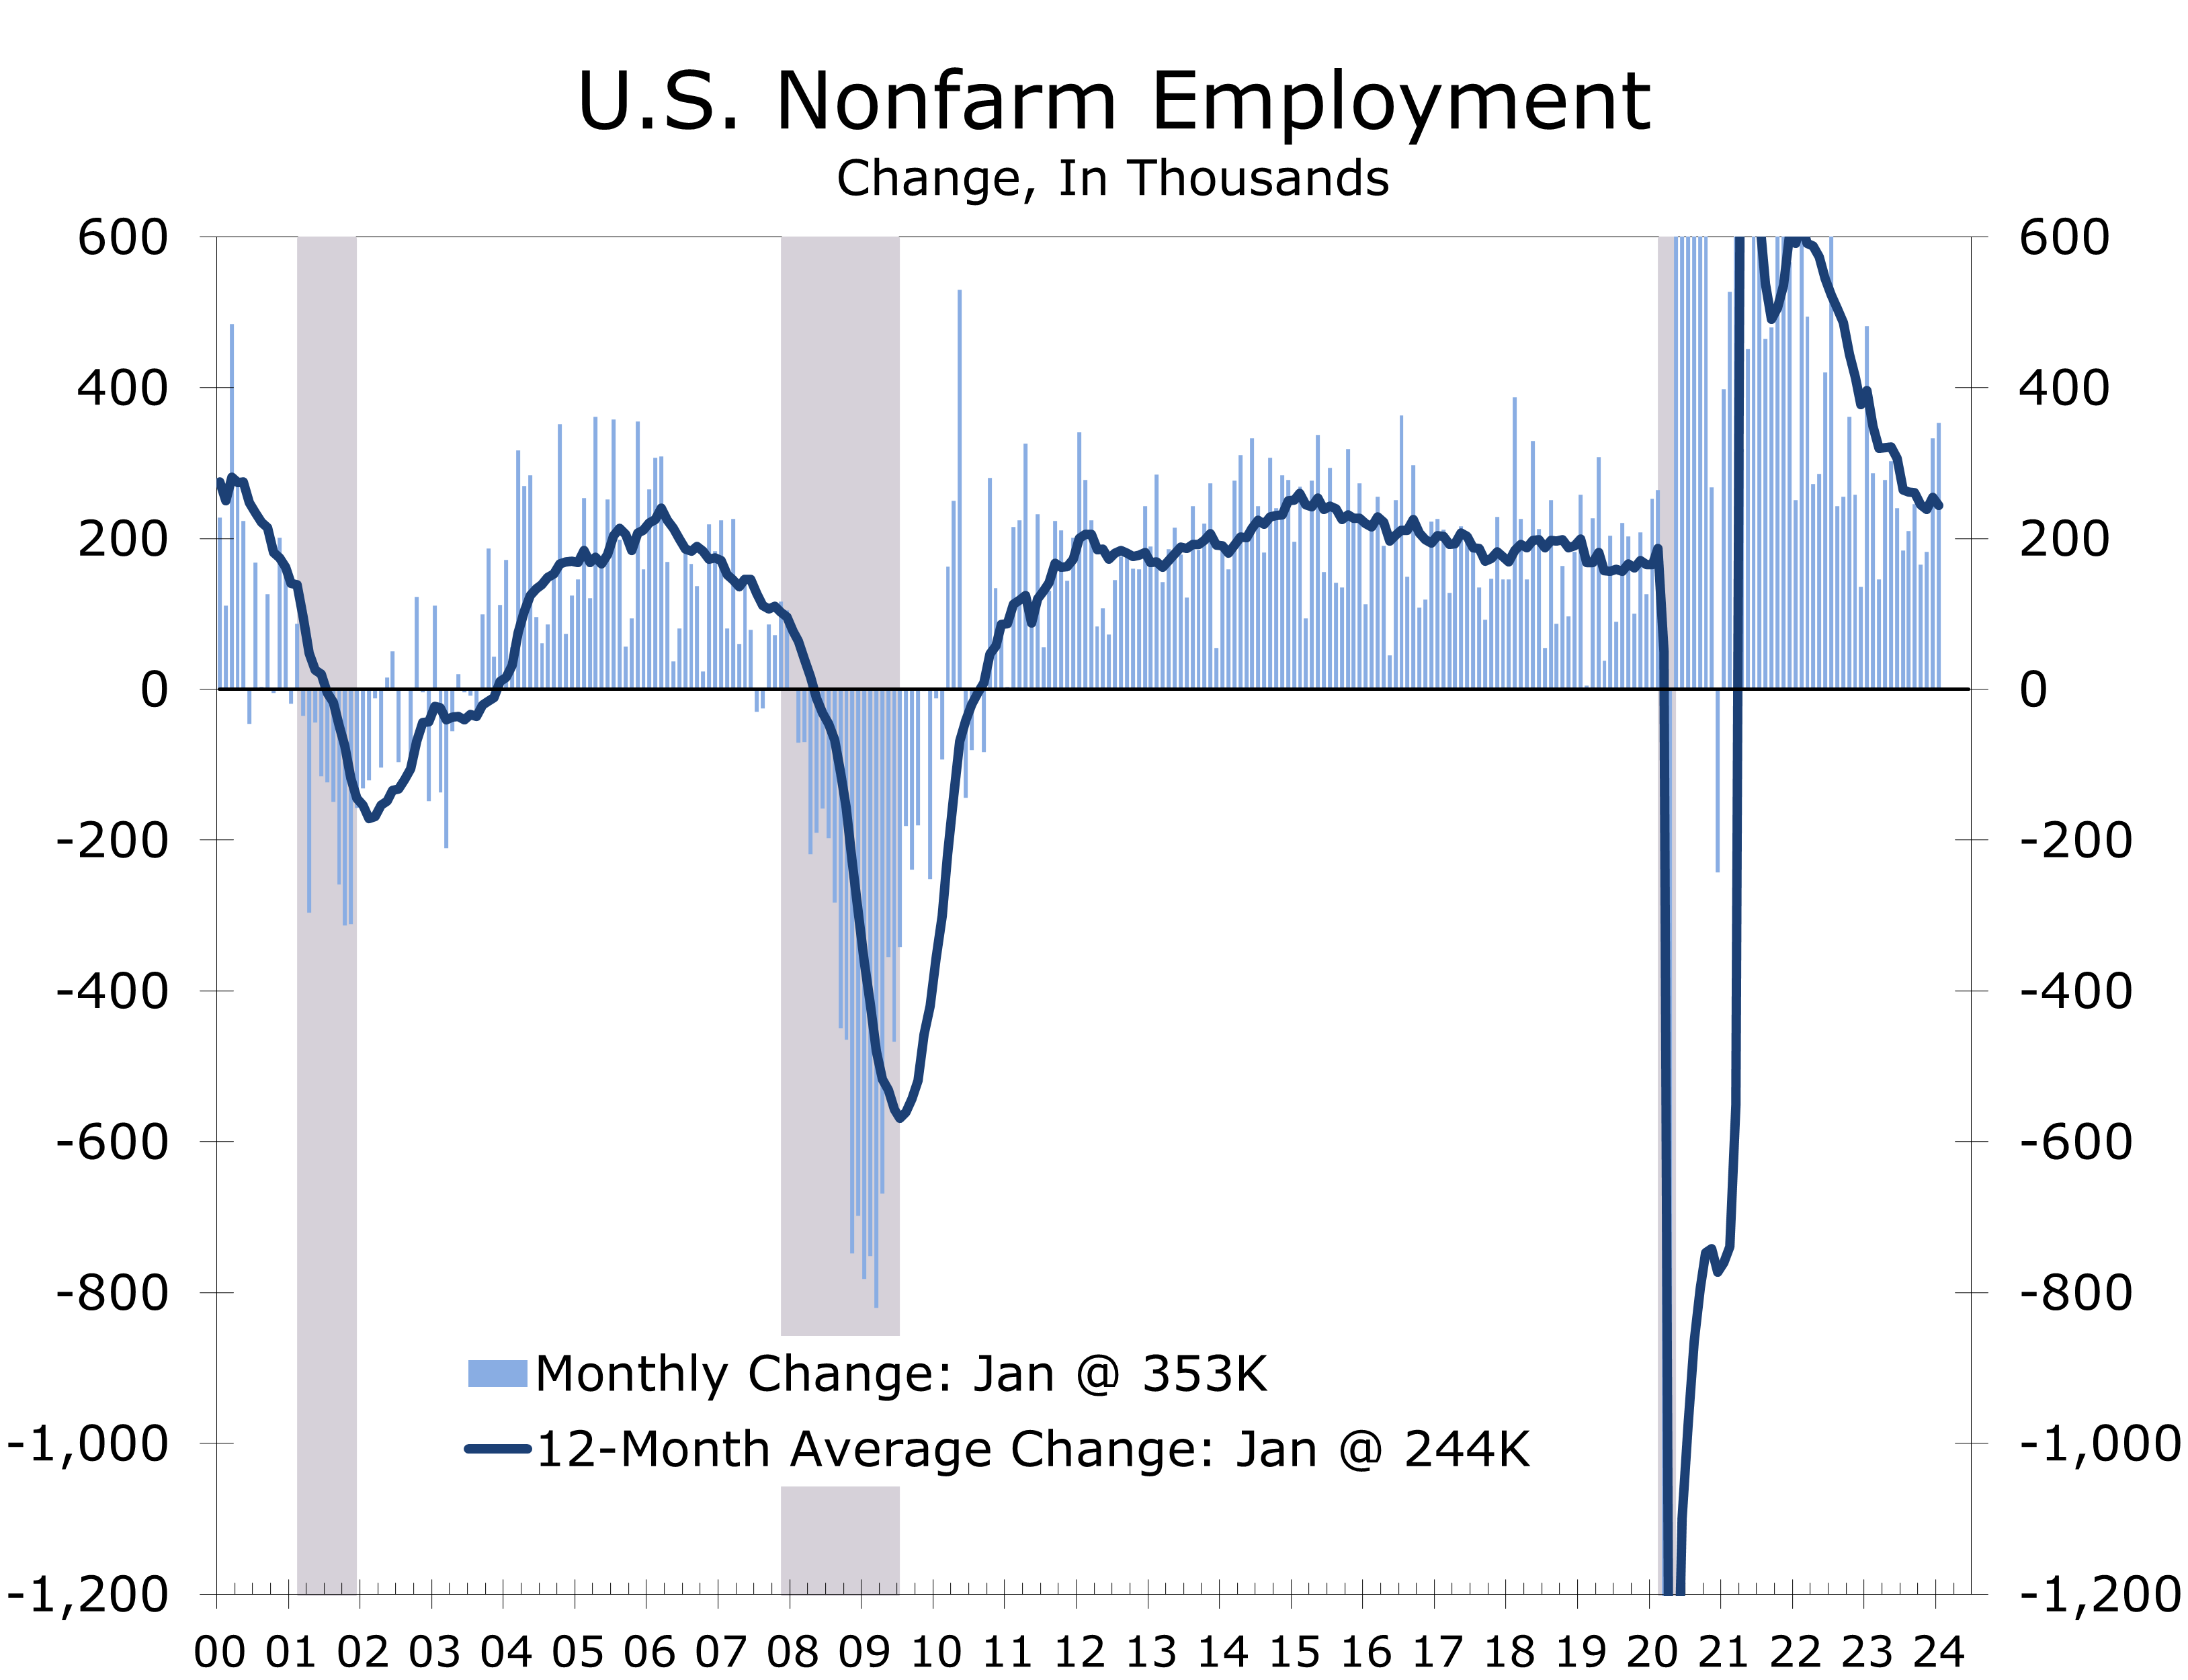
Early data for the first quarter show the economy had strong momentum headed into the new year. Most notably, employers added 356,000 net new jobs in January and job gains for preceding months were revised higher. The gains were a bit of a surprise, as the annual benchmark revisions released with January’s data lowered the level of employment for the March 2023 benchmark month by 266,000 jobs. Hiring bounced back in the second half of the year, however, and ended the year slightly higher than previously reported under the 2022 benchmark. With the revisions, average monthly job growth for 2023 was revised up to 255,000 from 225,000 previously.
The upward revisions to the second half of the year’s jobs data are extremely unusual. Typically, revisions to subsequent months’ job growth follow the direction of the benchmark revisions, which were about 0.2% lower. While data for most months were revised slightly lower, data for December was revised up sharply, more than making up for the slight downward revisions. While unusual, the stronger job gains are consistent with stronger GDP growth during the second half of the year, which averaged a whopping 4.1% pace. The breadth of employment growth also improved toward the end of the year and in January.
How much weight should be assigned to January’s stronger employment data remains unclear. Nonfarm employment growth has averaged a 289,000-job pace over the past three months, much of which was due to a surge in job growth in December (333,000) and January (353,000). By comparison, employment growth in the prior year averaged just 244,000 jobs per month.
Employment is unusually volatile around yearend, with holiday hiring at retailers, restaurants, and delivery services spiking in November and December and typically plummeting in January. Seasonal adjustment smoothed these swings but the pandemic and changes in consumer behavior afterward have distorted this process. Just how large these seasonal factors are cannot be exaggerated. On a non-seasonally adjusted basis, employers cut 2,635,000 jobs in January. Since that was fewer job losses than usual, the seasonally adjusted data reported a 353,000-job gain.
Average weekly hours declined in January, falling 0.2 to 34.1 hours, the lowest since the Pandemic. The drop was impacted by harsh weather during the survey week. After leaping to 4.2% following the ISM manufacturing and construction spending reports, the closely watched Atlanta Fed GDPNow forecast for first quarter GDP growth settled in at 3.5% in the aftermath of the strong employment figures. This measure has since retreated to 2.5% as more economic data have been released, close to our own forecast of 2.4% growth.
Stronger employment growth also implies the stellar productivity data reported for the fourth quarter might be revised lower from their preliminary 3.2% pace reported. The preliminary data also show productivity for the nonfarm business sector rose 1.2% for the year, which should be impacted slightly less. With 1.2% productivity growth and 4.5% wage growth, the Consumer Price Index will have a tough time breaking significantly below the most recent 3.1% year-to-year increase. Indeed, prices have been sticky for about anything where labor makes up a large proportion of costs.
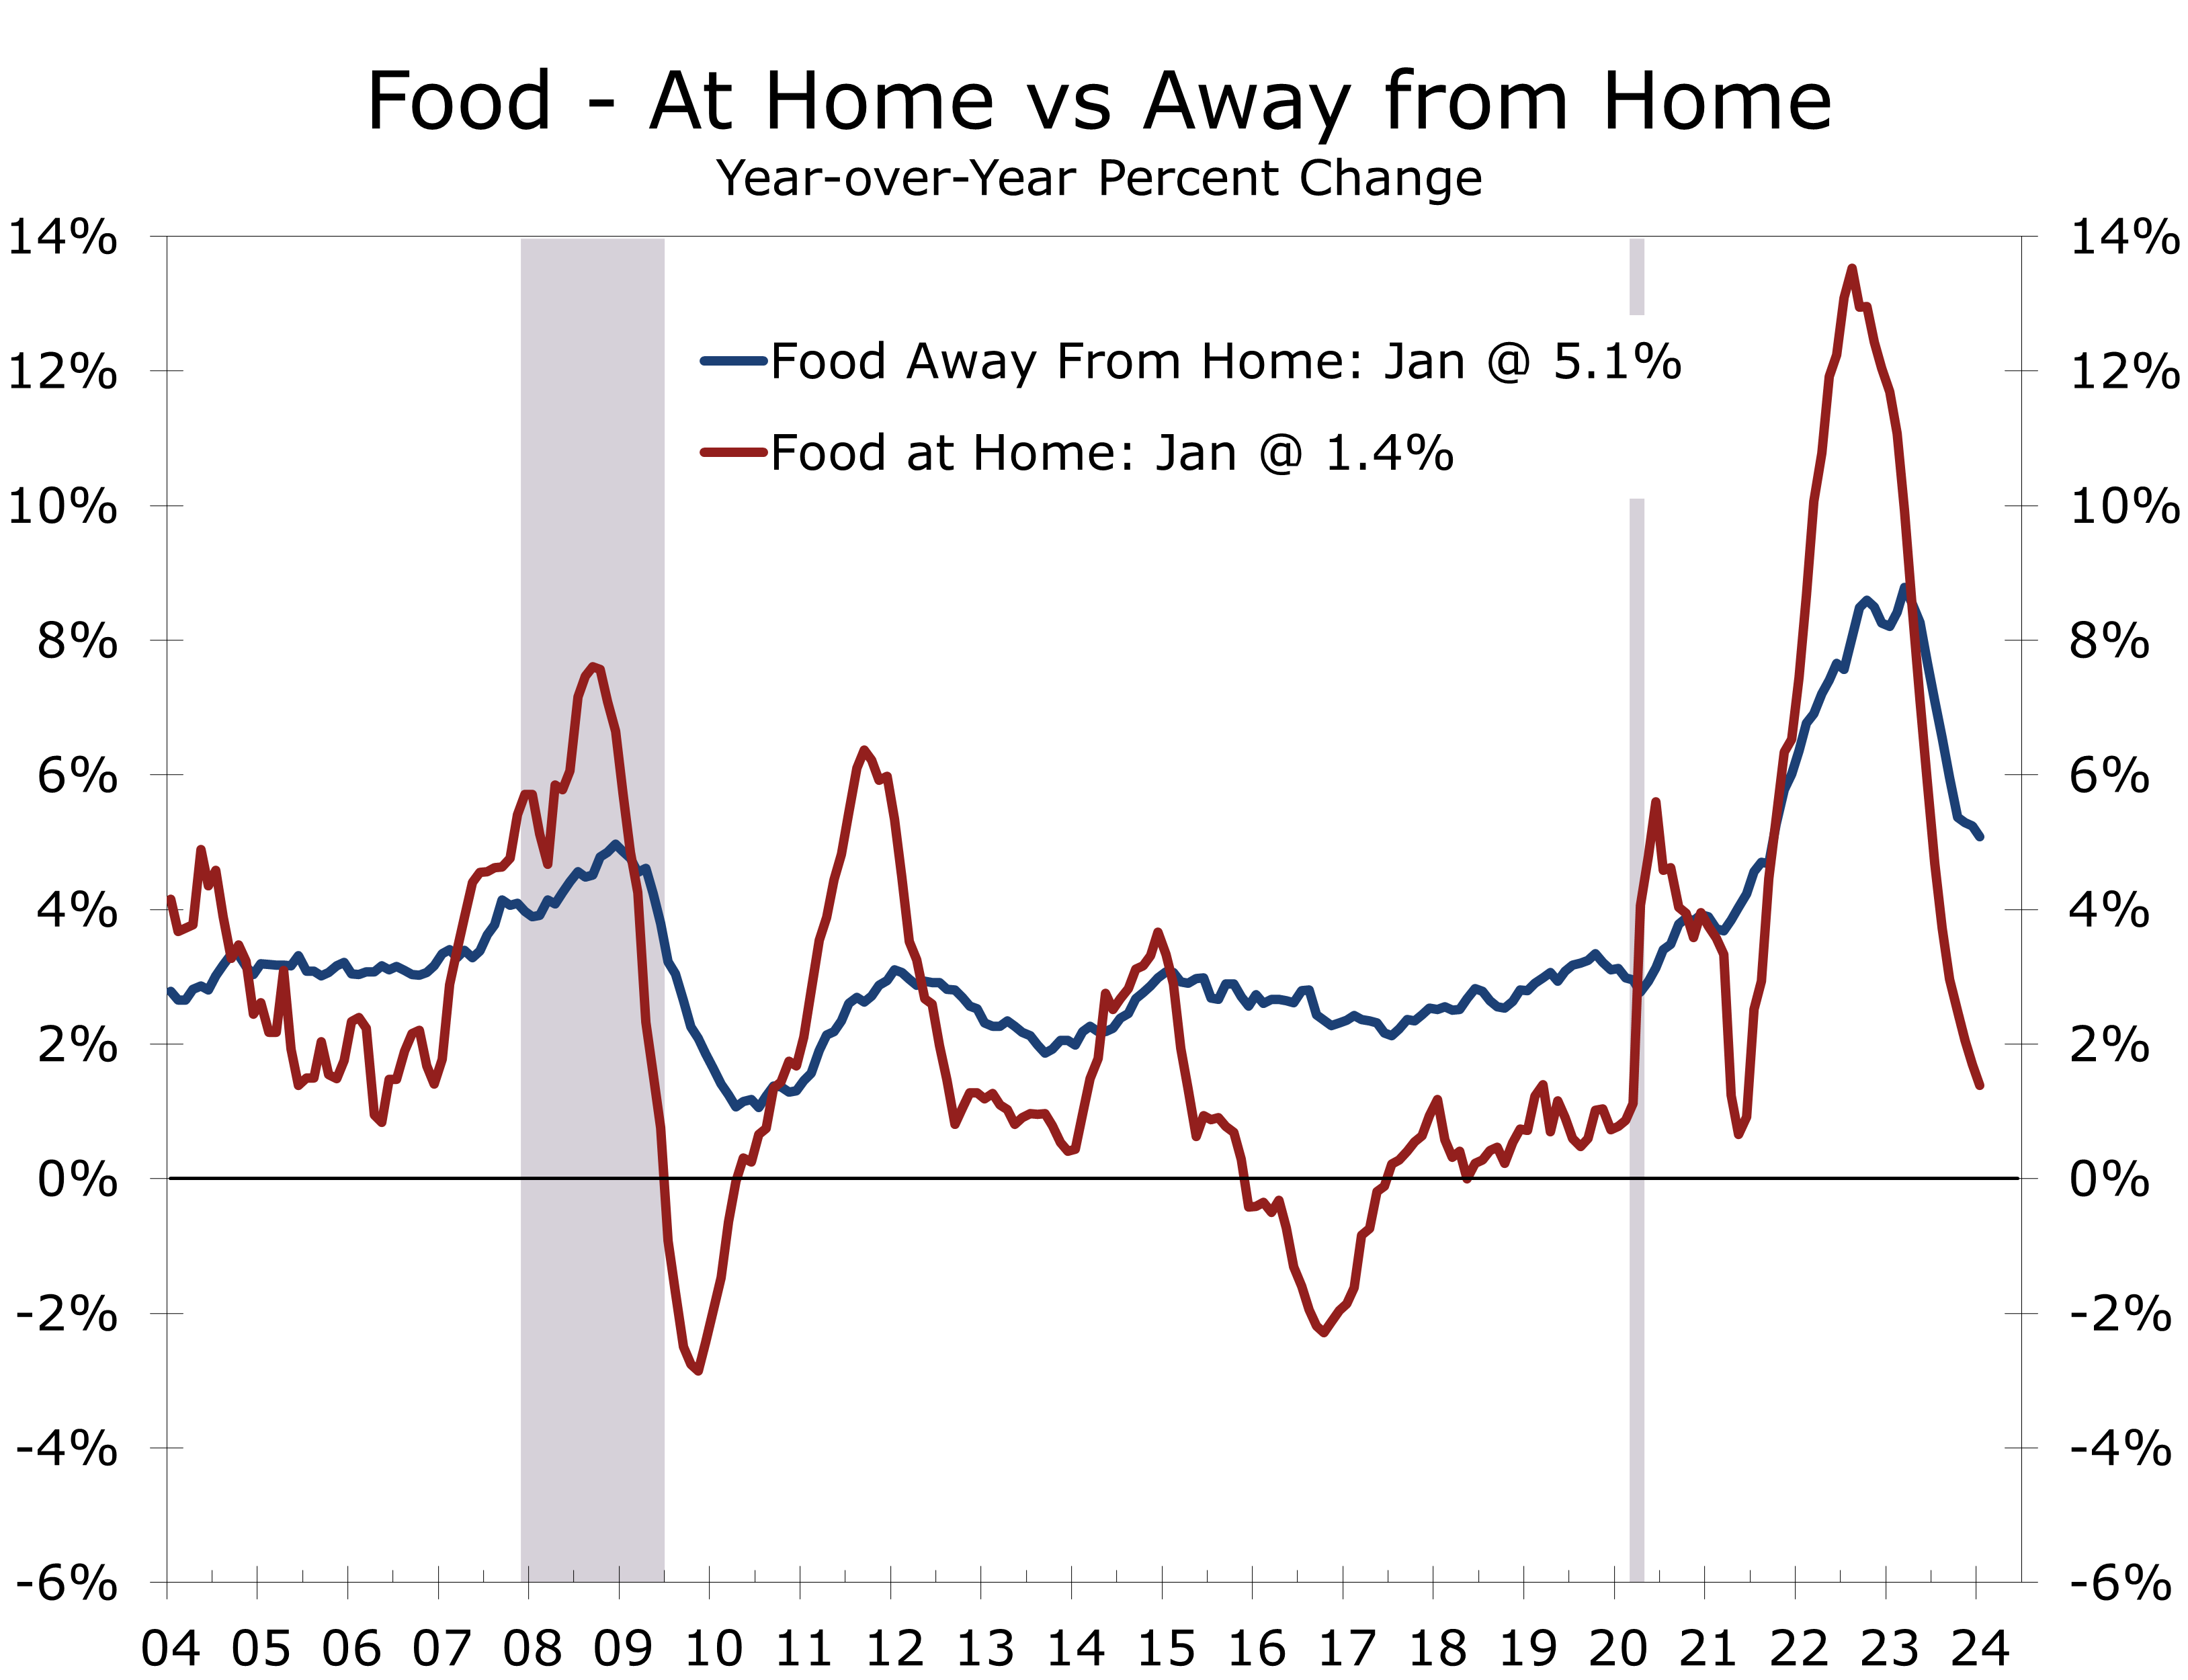
Wages appear to have risen sharply in January, when higher minimum wages took effect in 22 states. Grocery prices rose 0.4% in January but have risen a modest 1.4% this past year. Prices have surged by 21.1% over the past three years, however, four times the pace of the preceding three years! The increase over the past three years is equivalent to the cumulative rise in grocery store prices from 2008 to 2021.
President Biden addressed rising grocery prices in a TikTok message before the Super Bowl, blaming ‘greedy’ corporations for what he called Greedflation and Shrinkflation. Shrinkflation involves reducing package sizes while maintaining the same price. Lael Brainard from the White House National Economic Council echoed these concerns, emphasizing wider profit margins at grocery stores. We see the inflation problem as more genuine. Average hourly earnings for grocery store workers skyrocketed 18.3% over the past three years and consumers have pushed back at efficiency measures, such as self-checkout. The problem with inflation is one of too much money chasing too few goods. While product shortages have diminished, wages are sticky and grocery stores, which historically operate on paper thin profit margins, have little capacity to cut prices.
Restaurants are another area where higher wages are being passed along to customers. Restaurants have been short staffed since the economy emerged from the Pandemic, which has sent average hourly earnings soaring 31.7% over the past three years. Not surprisingly, prices are up substantially, making restaurant dining more of a luxury for about everyone. Sales at restaurants and bars were one of the bright spots in an otherwise dreary January retail sales report. Sales at restaurants rose 0.7% in January and are up 6.3% over the past year. After accounting for inflation, however, sales rose just 0.2% in January and are up just 1.2% over the past year.
We remain cautious about inflation. Pandemic-driven price swings, particularly for used cars, health care services, and apartments, skewed seasonal adjustments and understated inflation as prices stabilized in 2023. We expect inflation to remain firm through the middle of this year, as prices for health care services rebound during the second half of last year.
The Cleveland Fed’s Median CPI provides a more consistent assessment. Despite higher readings, this measure still suggests moderating prices, enabling the Fed to initiate a quarter-point cut in the federal funds rate by the end of June, followed by successive cuts in September and December. Our forecast is well below the market consensus, as shown by the CME’s fed funds futures but the aligns with the recent trend in the 2-Year Treasury Note, which has reliably provided an indication of where the federal funds rate will be one year ahead. Fed funds futures are continuing to look for five or six quarter-point cuts over the next year.
Let there be no doubt, the Fed is walking a fine line. Monetary policy is tight today, as can be seen by higher real interest rates. The effective federal funds rate is currently 5.33%, which is 213 basis points (bp) above the latest change in overall CPI and 143 bp over the core CPI. A neutral fed policy, with the economy at full employment, would peg the real federal funds rate at between 50 bp and 100 bp over the core CPI. The Fed would like to be able to lower interest rates, which might extend the business cycle and help avoid the problems in the commercial real estate sector from metastasizing into a systemic threat. The Fed does not want to ease too early or by too much, which would put its hard-won gains at bringing down inflation at risk.
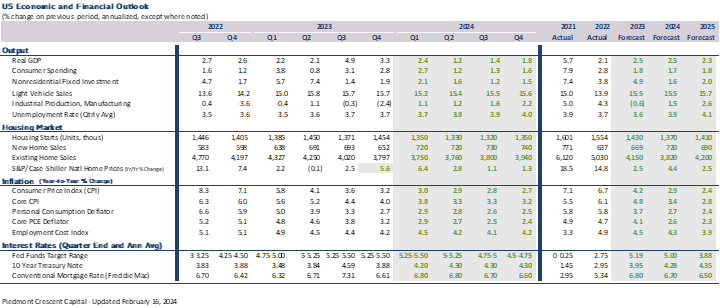
We see the overall CPI easing to 2.7% by the end of 2024 and look for the core CPI to decelerate to 3.2%. That should provide the Fed with enough room to cut the funds rate three or four times by year-end. While our forecast still has three rate cuts in it, recent data show the global economy slowing more abruptly. China is now a source of global disinflation in goods, reflecting efforts to stem the exodus of firms looking to diversify their supply chains. Growth has also weakened in Japan and the UK – both of which are in recession. Weaker global growth may cause inflation to ease faster and might allow the Fed to ease a little sooner.
The Fed also must guard against further fueling asset bubbles. The stock market has rallied strongly ever since the December FOMC meeting when the Fed made it clear that they had finished raising interest rates. While the markets suffered a brief setback following January’s disappointing CPI report, the market quickly bounced back and handled the disappointing Producer Price Index data much better. Initial public offerings and mergers and acquisitions have also increased, as have share buyback announcements and even the venture capital market. All of which are good things in moderation but can lead to a massive hangover if they rise out proportion with the underlying fundamentals.
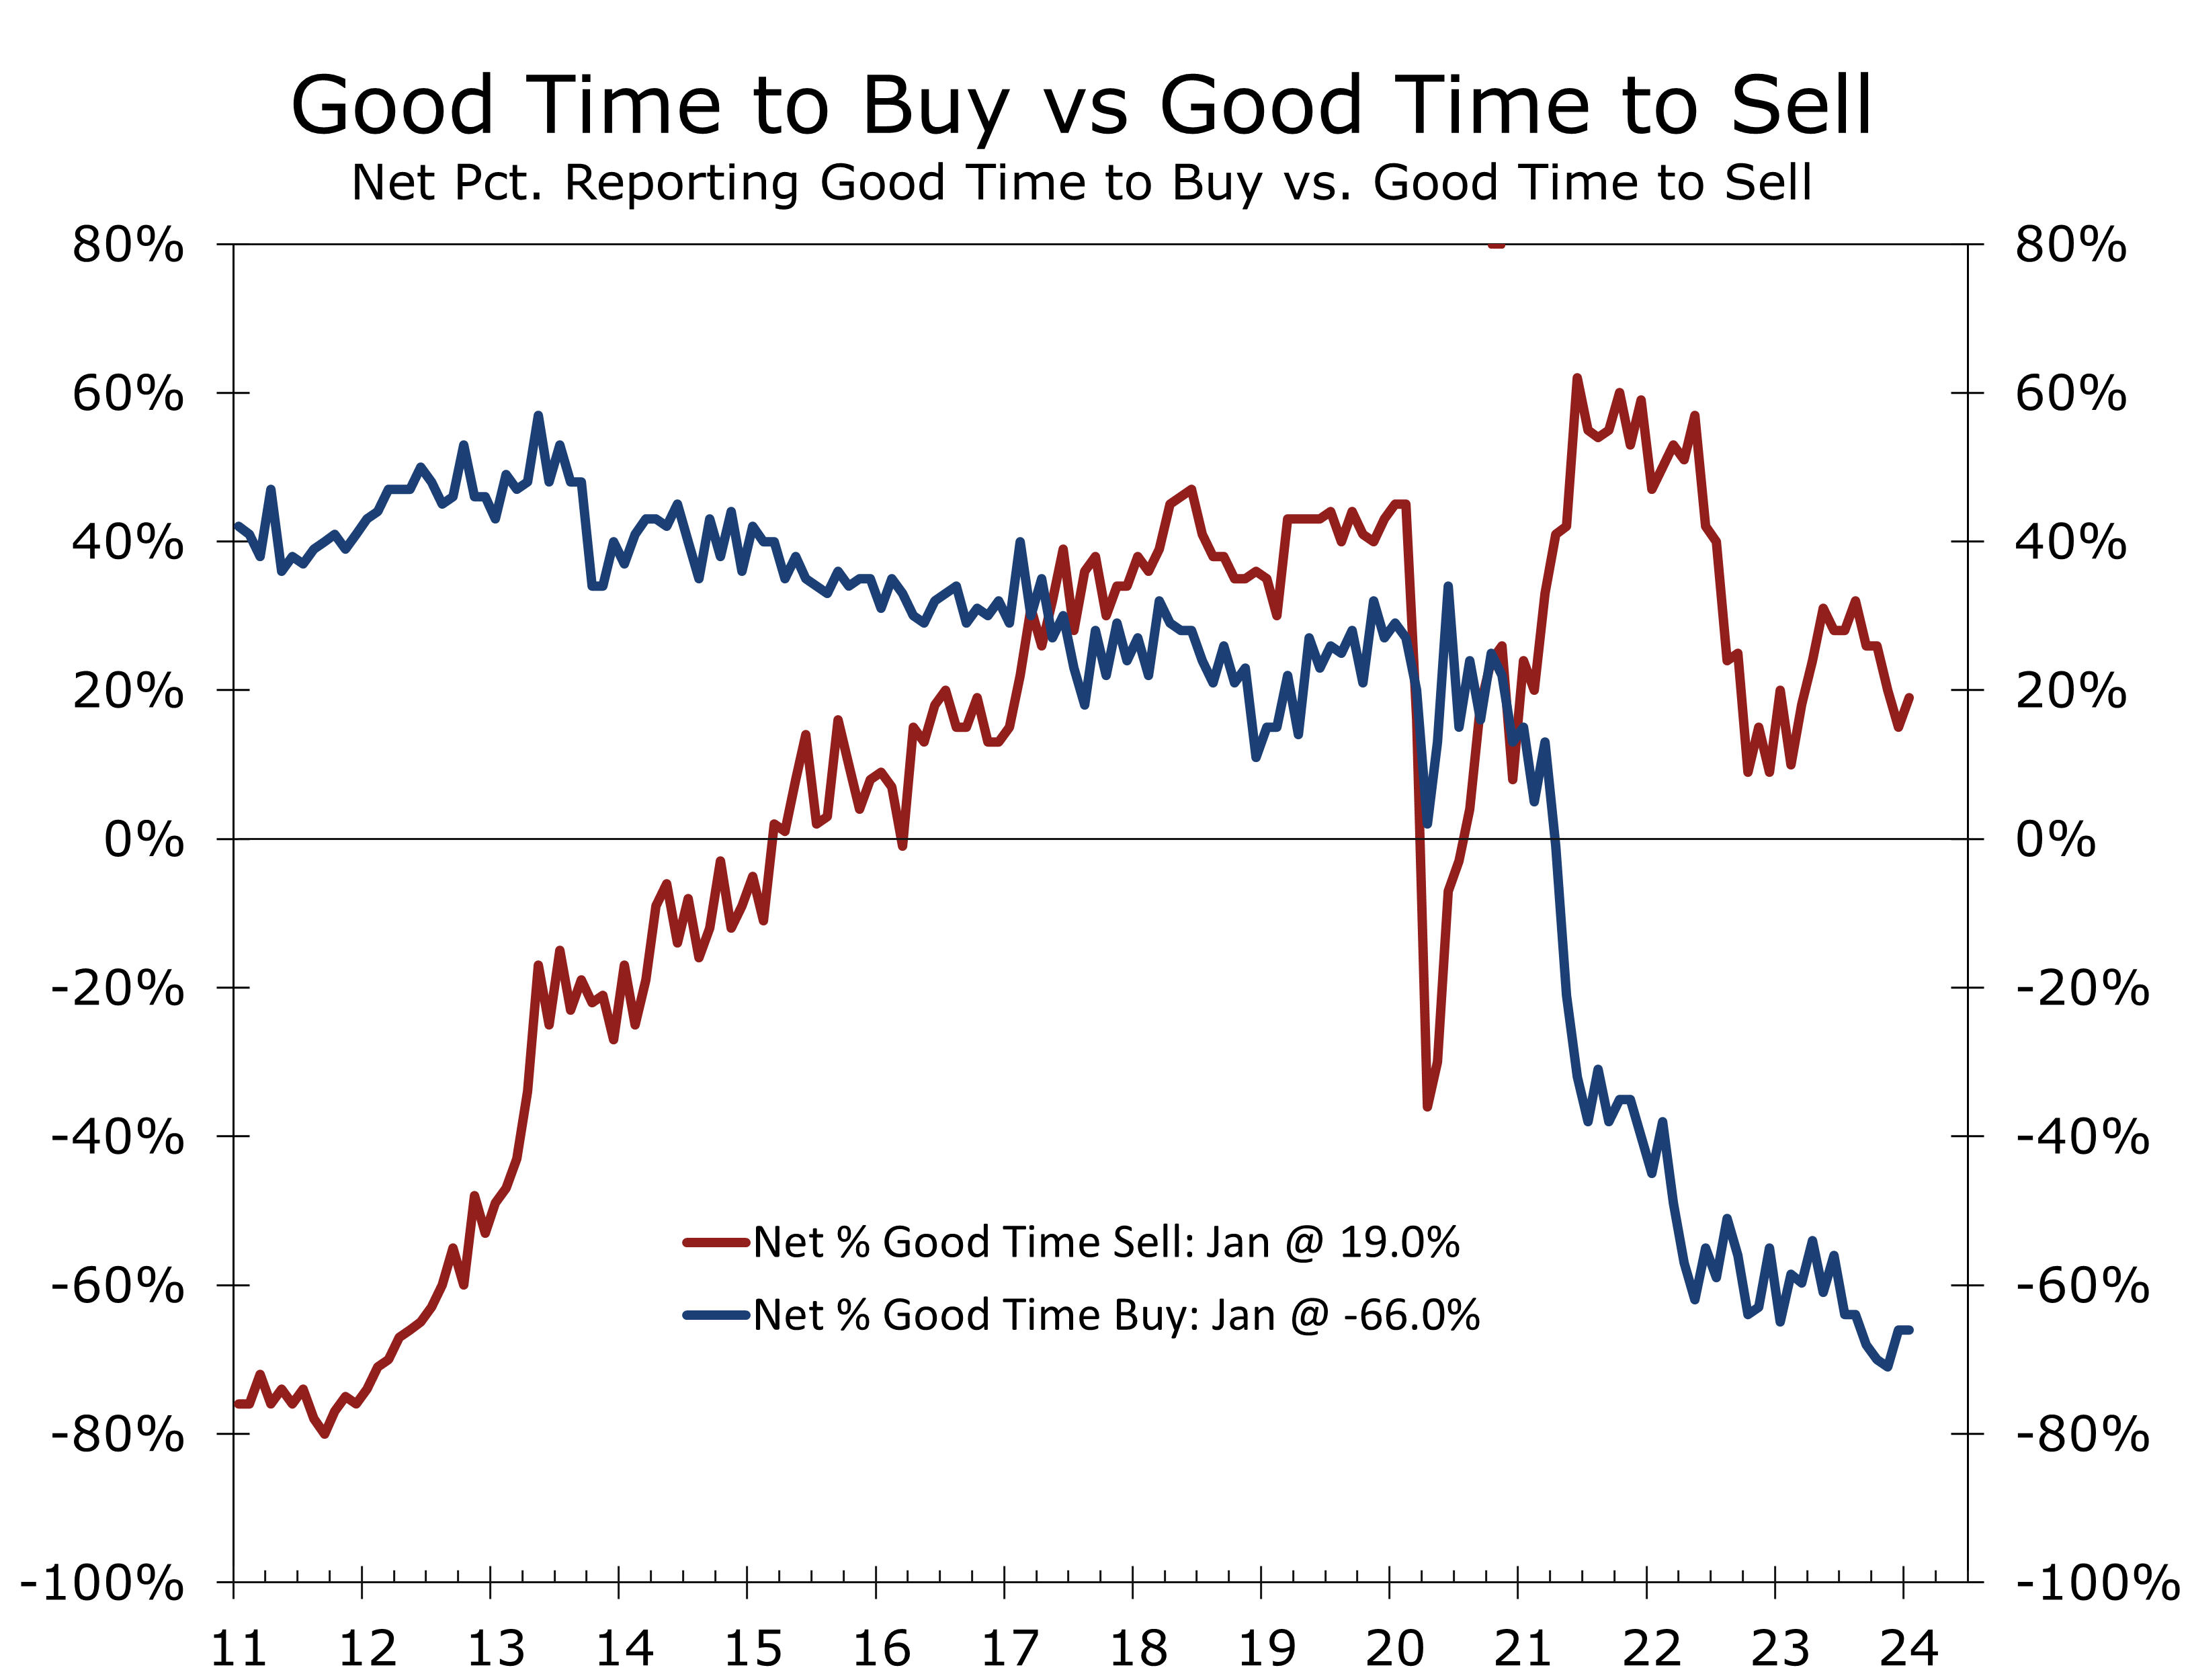
Lower interest rates would surely benefit the housing sector. Many current homeowners secured ultra-low interest rates during the prolonged period of near-zero short-term rates during and immediate after the pandemic. Presently, around 78.7% of first-lien mortgages have rates of 5% or less, with 59.4% below 4% and 22.6% below 3%. With current mortgage rates hovering around 6.80%, homeowners are understandably hesitant to sell their homes, fearing significant increases in their housing cost even if they are downsizing. Consequently, there is a shortage of existing homes for sale, which has driven up prices and led to near-record lows in housing affordability.
The dearth of existing homes has been a godsend for home builders. Many potential home buyers that would have purchased an existing home are now looking to purchase a new home and home builders have ramped up their offerings of entry-level homes. Home builders are also offering financing incentives to reduce the sting of higher mortgage rates. The result is a two-tiered housing market. New home sales and single-family housing starts are holding up well, while existing home sales, which is a much larger market, continue to struggle.
Mortgage rates had pulled back prior to January’s surprising CPI report but have now surged back toward 7%. That earlier pullback in mortgage rates had boosted home buying but buyer traffic has slowed more recently. We expect mortgage rates to decline gradually this year and to end the year around 6.40%. Unfortunately, mortgage rates will have to drop well below 6% before a substantial number of existing homeowners will feel comfortable enough to part with their current low-rate mortgage and put their current home on the market.
Lower interest rates would be even more beneficial in helping resolve the brewing troubles in commercial real estate. Real estate values are closely tied to interest rates, as the stream of rents earned from owning income producing properties is more valuable when interest rates are lower. Property values skyrocketed during the pandemic period and its immediate aftermath, when short-term interest rates were near zero and real estate investors who were overcommitted to gateway markets rushed into secondary markets in the Sun Belt. Apartments and industrial properties saw the largest increase. Prices for retail and office properties rose less.
Property price appreciation surged in late 2021 and early 2022, but then slowed sharply as the Fed raised interest rates more aggressively than anticipated. Office building prices, especially older ones in downtown areas, were significantly impacted. Concerns have arisen about a potential repeat of the Global Financial Crisis, but Fed and Administration officials, including Treasury Secretary Janet Yellen, do not foresee a systemic crisis threatening the banking system.
The problems in commercial real estate are both simple and complex. From a simple standpoint, commercial real estate values have come under pressure because interest rates have risen abruptly, while rents have risen less rapidly or fallen. Moreover, insurance and operating costs have risen substantially. Changes in consumer behavior in the aftermath of the pandemic introduce a more complex component into the outlook. One of the most obvious changes has been the slow return to the workplace, particularly in downtown areas, which has led many large employers to consolidate office space and sent values for some office buildings plummeting.
Not all office buildings are struggling, however, and office buildings are just one asset class within commercial real estate. Newer office buildings are performing relatively well, as employers are striving to entice workers back to the office. Many suburban properties are also faring better, as workers are more inclined to return to offices in the suburbs that are closer to home and do not charge for parking.

Commercial real estate looks far less menacing outside of the office market. There are a record number of apartments currently under construction, which will cause vacancy rates to rise later this year. But all these apartments will not be completed at once and there is an undersupply of housing in general. Nevertheless, property prices will fall this year and some investors may have trouble rolling over their maturing debt. Lower interest rates would make this easier.
Elsewhere, the industrial market and retail market are likely to see few problems. To be certain, property prices are correcting but demand remains strong. The industrial market is benefiting from reshoring and continued growth in online retailing. Both have much further to run. The retail market is also doing better. The sector has seen little construction this past decade and is seeing strong demand for open-air retail space. Flexible work schedules mean workers have more time to shop, travel and entertain, which is good for brick-and-mortar retail.
We have once again boosted our near-term forecast and see real GDP rising at a 2.4% annual rate during the first quarter. When taken together with the stronger growth in the second half of last year, real GDP is likely to grow 2.5% this year on an annual average basis, even though not one single quarter will see growth that high. On a fourth quarter-to-fourth-quarter basis, we look for real GDP to rise 1.7% in 2004.
Inflation is expected to continue to moderate, although labor-intensive services will continue to see larger price gains. Shipping delays due to the attacks in the Red Sea and low water levels in the Panama Canal have also boosted container rates, which presents some near-term risk. We look for a more meaningful deceleration in inflation in the second half of this year, which should allow the Fed to gradually reduce the federal funds rate.
Disclaimer: This publication has been prepared for informational purposes only and is not intended as a recommendation offer or solicitation with respect to the purchase or sale of any security or other financial product nor does it constitute investment advice. Any forward-looking statements or forecasts are not guaranteed and are subject to change at any time. Information from external sources have not been verified but are generally considered reliable.
© 2024 CAVU Securities, LLC
February 20, 2024
mark.vitner@piedmontcrescentcapital.com
Chief Economist (704) 458-4000
Haley Tries to Make a Stand in South Carolina
Are the Primaries Over Before They Get Started?
- South Carolina's upcoming primary, traditionally pivotal, is expected to be a mere formality this year, given the dominance of Trump and Biden in previous contests.
- The Democrats already held their primary in South Carolina, which was their first official primary. Biden easily won with 96% of the vote. Voter turnout was extremely light.
- Nikki Haley is the sole remaining Republican challenger to Donald Trump and trails the former president badly despite being a popular former governor and successful UN Ambassador for President Trump.
- Despite facing a likely defeat in her home state, Haley remains determined to continue her campaign through Super Tuesday, eyeing delegate-rich states to gather support and potentially challenge Trump at the convention.
While we are still at the start of the primary season, with just three states having cast their votes so far, the outcomes of both the Democrat and Republican races appear to have already been decided. On the Democrat side, President Joe Biden has faced only token opposition, while a bevy of Republican challengers to former President Donald Trump has been narrowed down to one: former South Carolina Governor and UN Ambassador Nikki Haley.
The Iowa Caucuses, the inaugural event of the primary season, mirrored pre-caucus polling, extinguishing the hopes of anti-Trump Republicans. Formerly perceived as a formidable contender, Florida Governor Ron DeSantis bowed out of the race following a lackluster performance and threw his support behind the former president. The Democrats skipped Iowa altogether.
Anticipation surrounded the New Hampshire primary, where a potential showdown between Trump and former Governor Nikki Haley was projected. Trump emerged as the unequivocal victor, however, further cementing his frontrunner status. With Haley remaining as the only major Republican challenger, Trump maintains a commanding lead in polling. On the Democrat side, Biden cruised to an easy victory.
The upcoming South Carolina primary, traditionally a pivotal event, is now poised to serve as a mere formality. In 2020, the South Carolina primary proved crucial for Joe Biden, who beat back an unexpectedly strong challenge from Bernie Sanders following a key endorsement from Congressman Jim Clyburn. South Carolina was the turning point of Biden’s campaign.
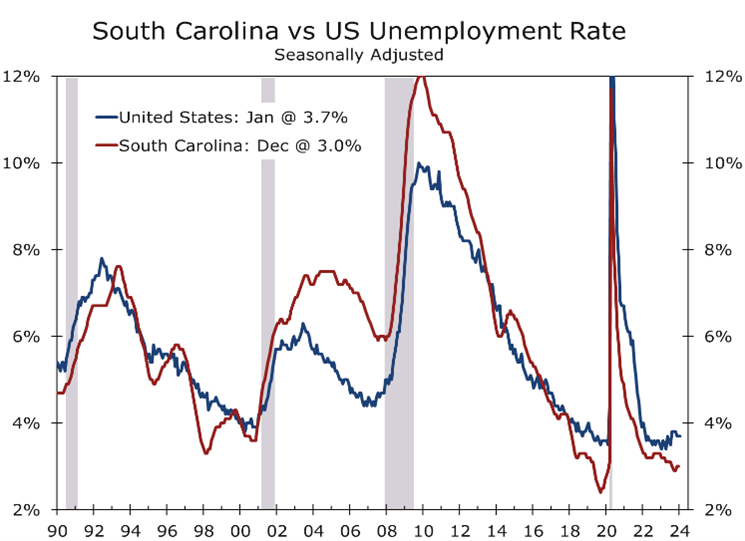
The Democratic primary was held earlier this year, partially to build off the momentum Biden gained from the 2020 South Carolina primary. Biden faced only token opposition and won the Palmetto State, garnering 96.2% of the vote. However, voter turnout was extremely light, with just 4% of registered Democrats casting their votes, down from 16% in 2020.
The Republican primary will be held on Saturday, February 24th. Despite running against a popular and charismatic former governor, Donald Trump has maintained a substantial lead in every major poll, averaging over thirty points most recently. Trump has also garnered multiple endorsements, including Governor McMaster and Senators Tim Scott and Lindsey Graham.
Despite being a popular and well-liked former governor, Nikki Haley has few endorsements.
Haley’s list of allies in her home state is comparatively thin. Her most significant endorsement comes from Congressman Ralph Norman, who represents the Rock Hill area.
Nikki Haley was viewed as a top contender for the Republican nomination for years before her campaign’s launch. She involved herself directly in the 2016 primary by endorsing Senator Marco Rubio of Florida. Haley’s work as UN Ambassador in the Trump administration kept her in the national spotlight.
Her tenure at the UN is viewed as extraordinarily successful. Haley was a staunch advocate for Israel and pushed back forcefully against critics of both the United States and Israel. Her unwavering support for Israel became especially relevant after the October 7th attack and subsequent war in Gaza. She is one of a handful of Trump appointees who left the Administration in good standing.
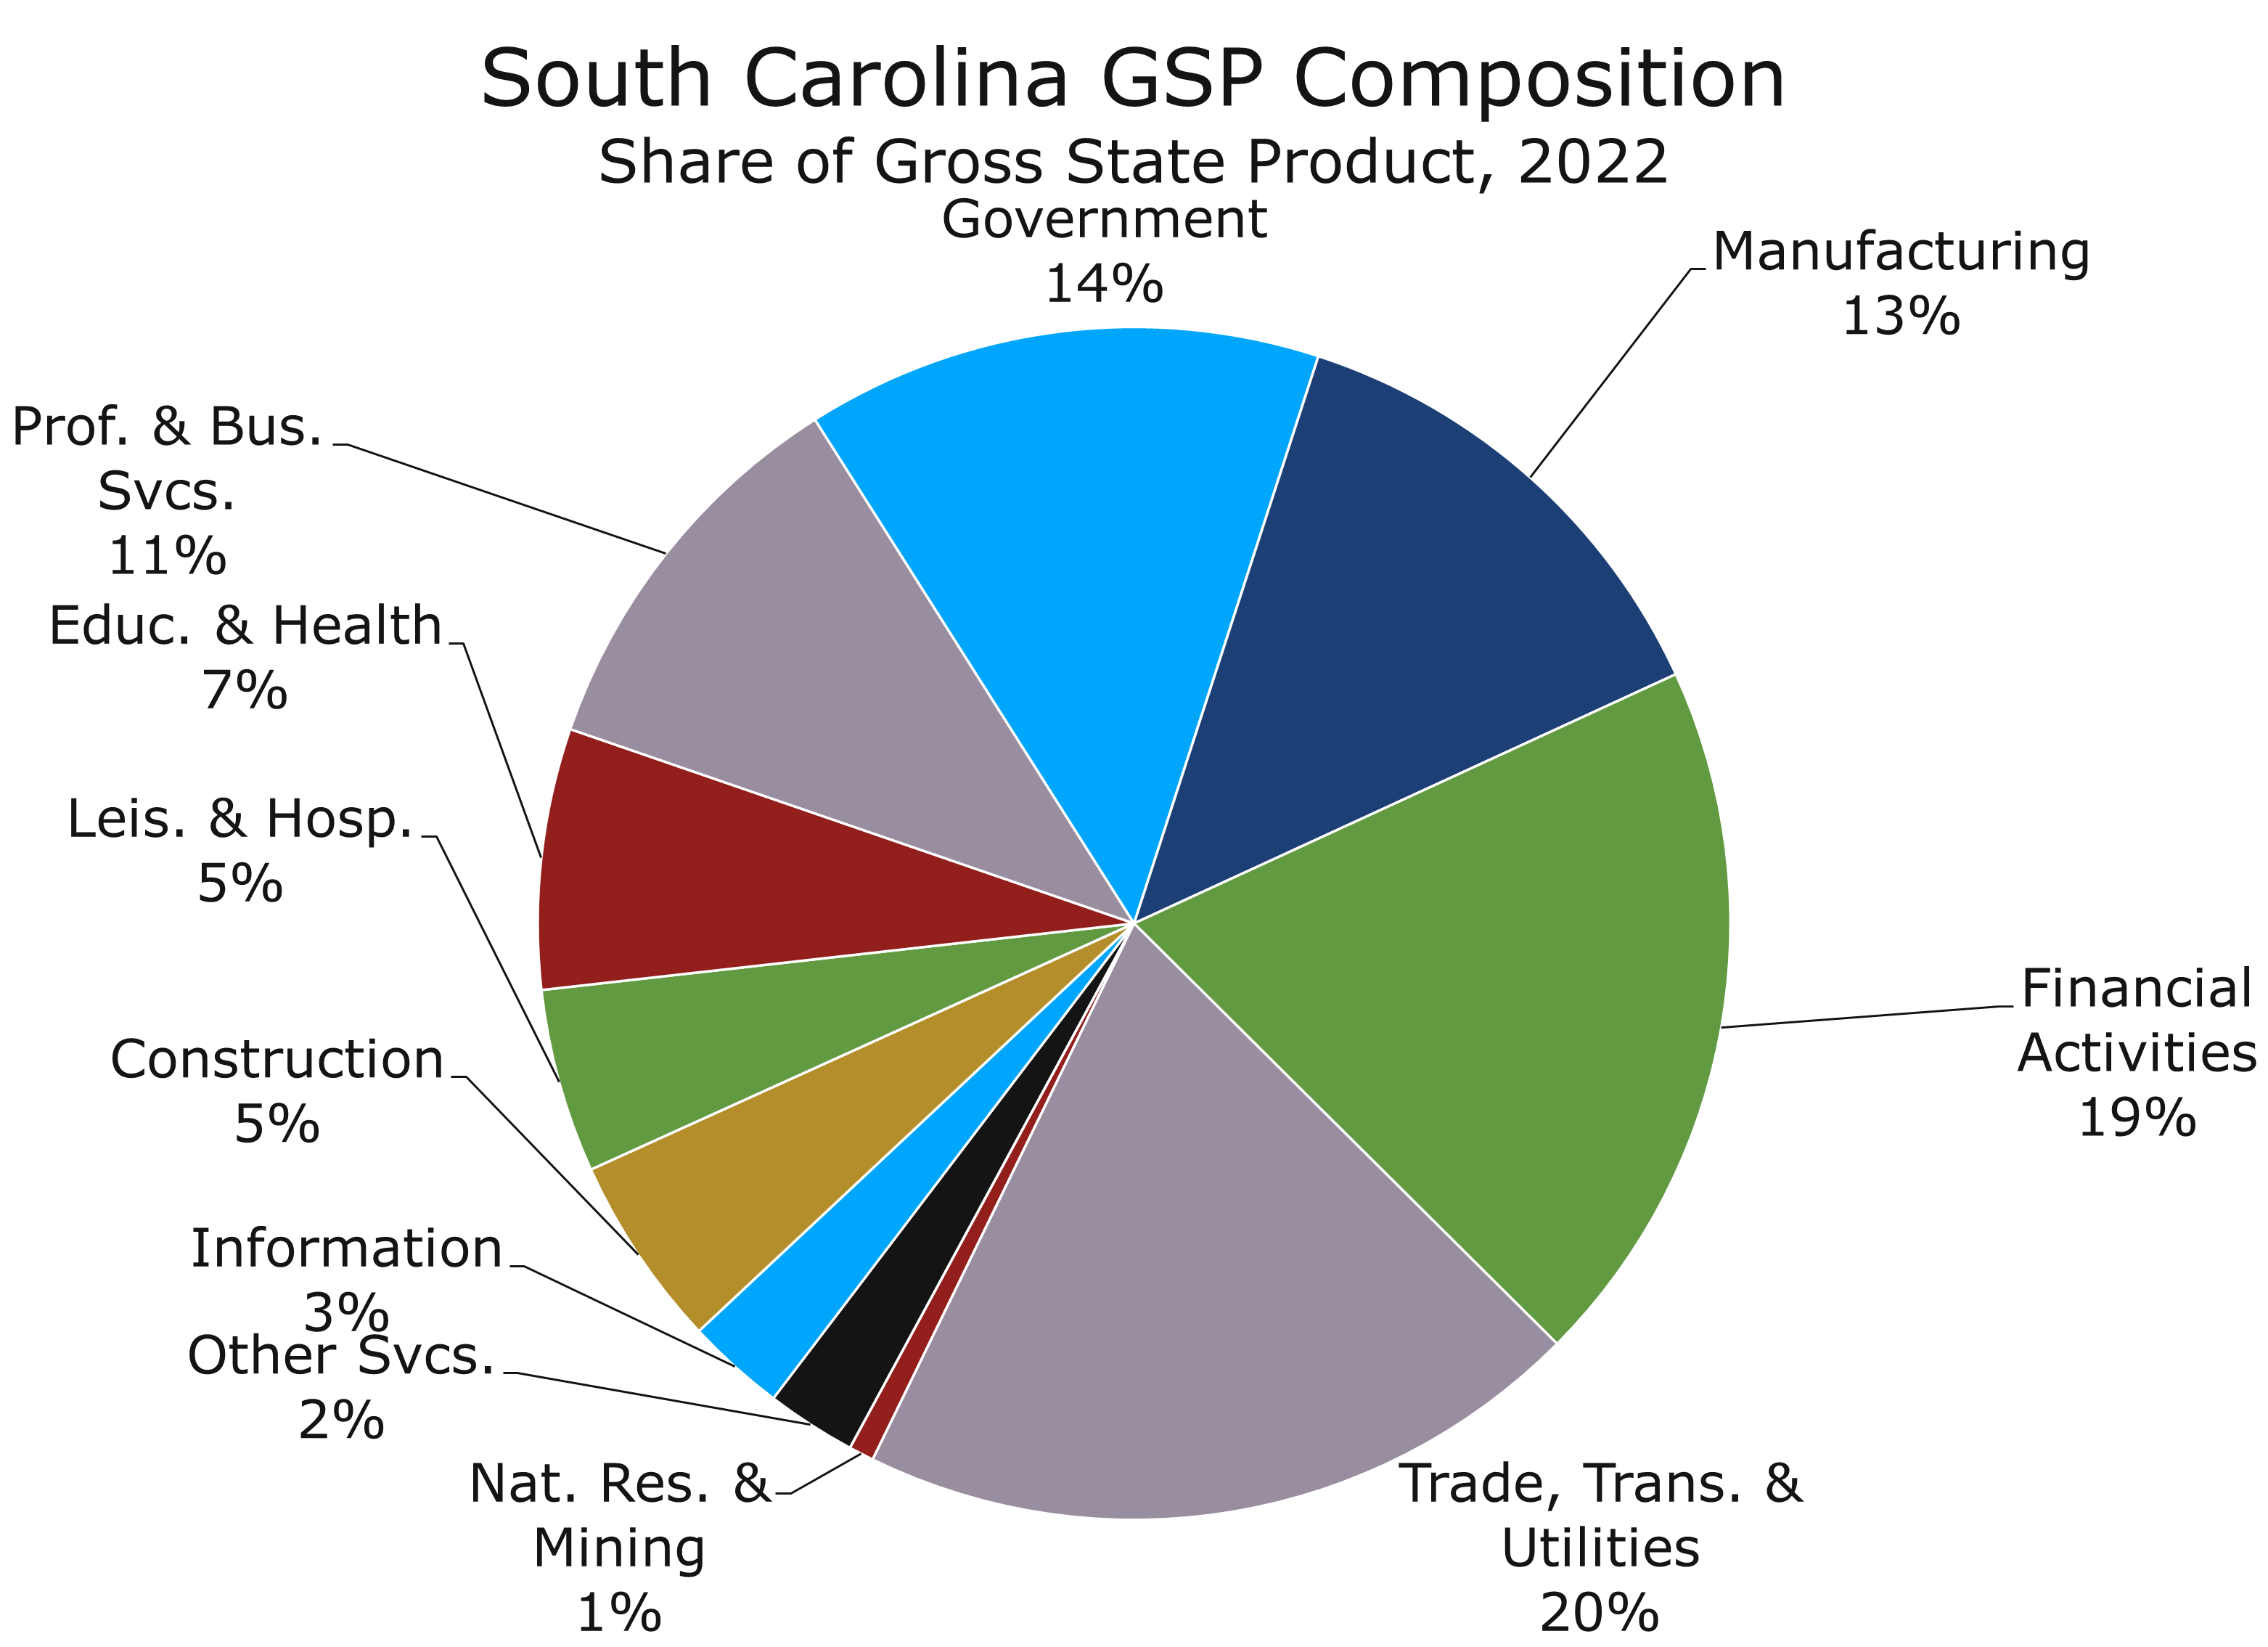
Haley’s tenure as governor, which extended from January 2011 to January 2017, is also widely viewed as successful. South Carolina consistently outperformed the nation as the economy recovered from the Great Recession and welcomed waves of new businesses.
Despite being a popular and well-liked former governor, Nikki Haley has few endorsements.
South Carolina particularly excelled in attracting international investment, boasting the highest foreign direct investment per capita in the nation. Notable projects secured during Haley’s leadership include new plants for companies like Volvo, Mercedes Benz, Continental Tire, and Torey Materials. Additionally, Haley helped secure a major expansion of Boeing’s operations in North Charleston and subsequently joined their board of directors. These successes earned South Carolina the nickname “Beast of the Southeast,” a label proudly touted by Haley during her campaign.
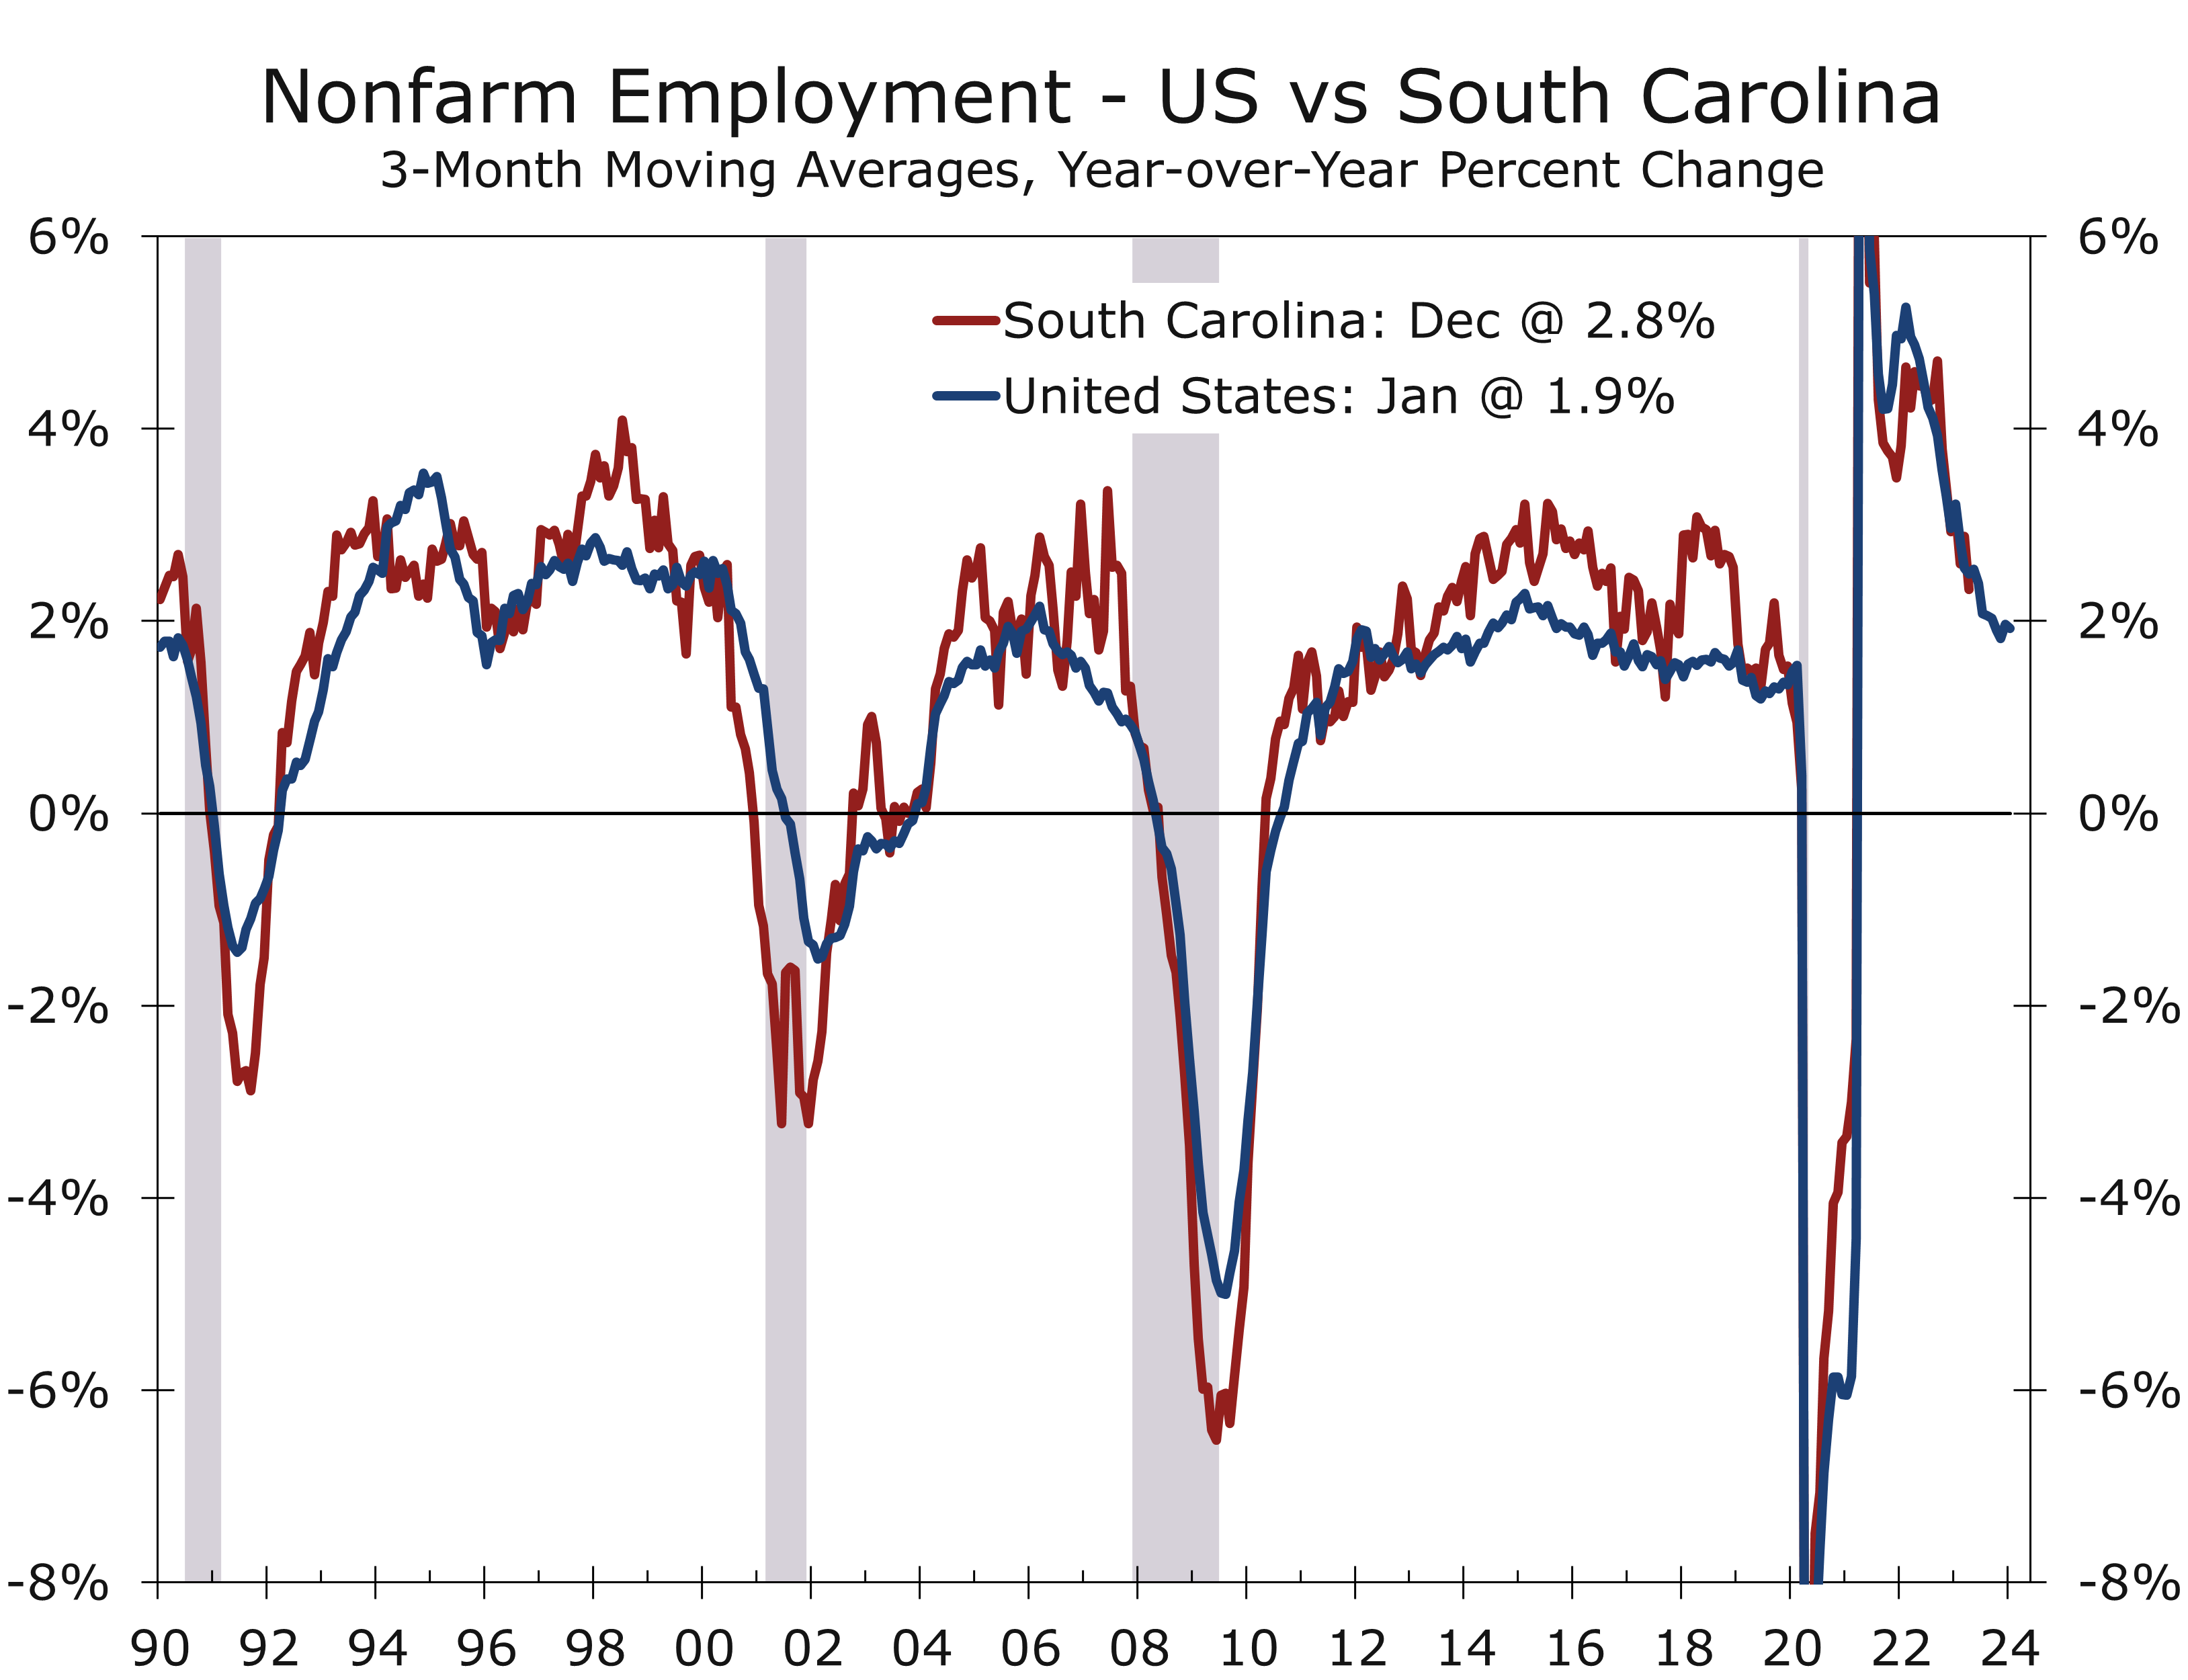
Haley governed South Carolina as a pro-business conservative. She cut taxes and regulations, courted new industry, and expanded investments made by her predecessors. Additionally, she took on organized labor and defeated a unionization attempt at Boeing. She did this at a time when the US economy was slowly emerging from the Great Recession and faced competitive challenges from neighboring states.
While some critics suggest Haley gets too much credit for South Carolina’s success, the record shows she played an active role in the state’s economic growth and attracting industrial investment in particular. Moreover, Haley, who hails from Bamberg, South Carolina, a small city in the state’s Lowcountry region, did a remarkable job in ensuring the investment boom reached every corner of the state.
Haley also adeptly managed delicate social crises. Following the 2015 mass shooting at Charleston’s Emanuel Church and the shooting of Walter Scott, an unarmed African American man pulled over for a traffic stop, Haley drew national attention when she orchestrated the removal of the Confederate flag from the state capitol. The debate over the Confederate flag had been a long-running divisive issue and became increasingly more difficult to defend as South Carolina’s population grew and new industry relocated to the state. Haley stopped short of condemning the flag altogether, stating that for many, the flag symbolizes heritage rather than hate.
Haley’s skill in handling race-related issues as a southern governor was commendable, but her recent omission of slavery as the root cause of the Civil War in New Hampshire drew criticism and tarnished her otherwise well-thought-of reputation on the subject.
Haley’s center-right stance on cultural issues, including her refusal to support a North Carolina-style bathroom bill and her opposition to national abortion legislation, has drawn criticism from some likely Republican primary voters. Despite this, many see these positions as key to her electability in the general election.
If Haley overperforms expectations on Saturday, she would owe it to South Carolina’s status as an open primary state. Independents and Democrats who did not cast ballots in the earlier Democratic primary will have the option to vote in the Republican contest. These voters would presumably break for Haley over Trump. The Haley campaign banked on such crossover votes in New Hampshire, however, and still fell considerably short. South Carolina is significantly more conservative than New Hampshire, so Haley will need more than just moderates to make it close.
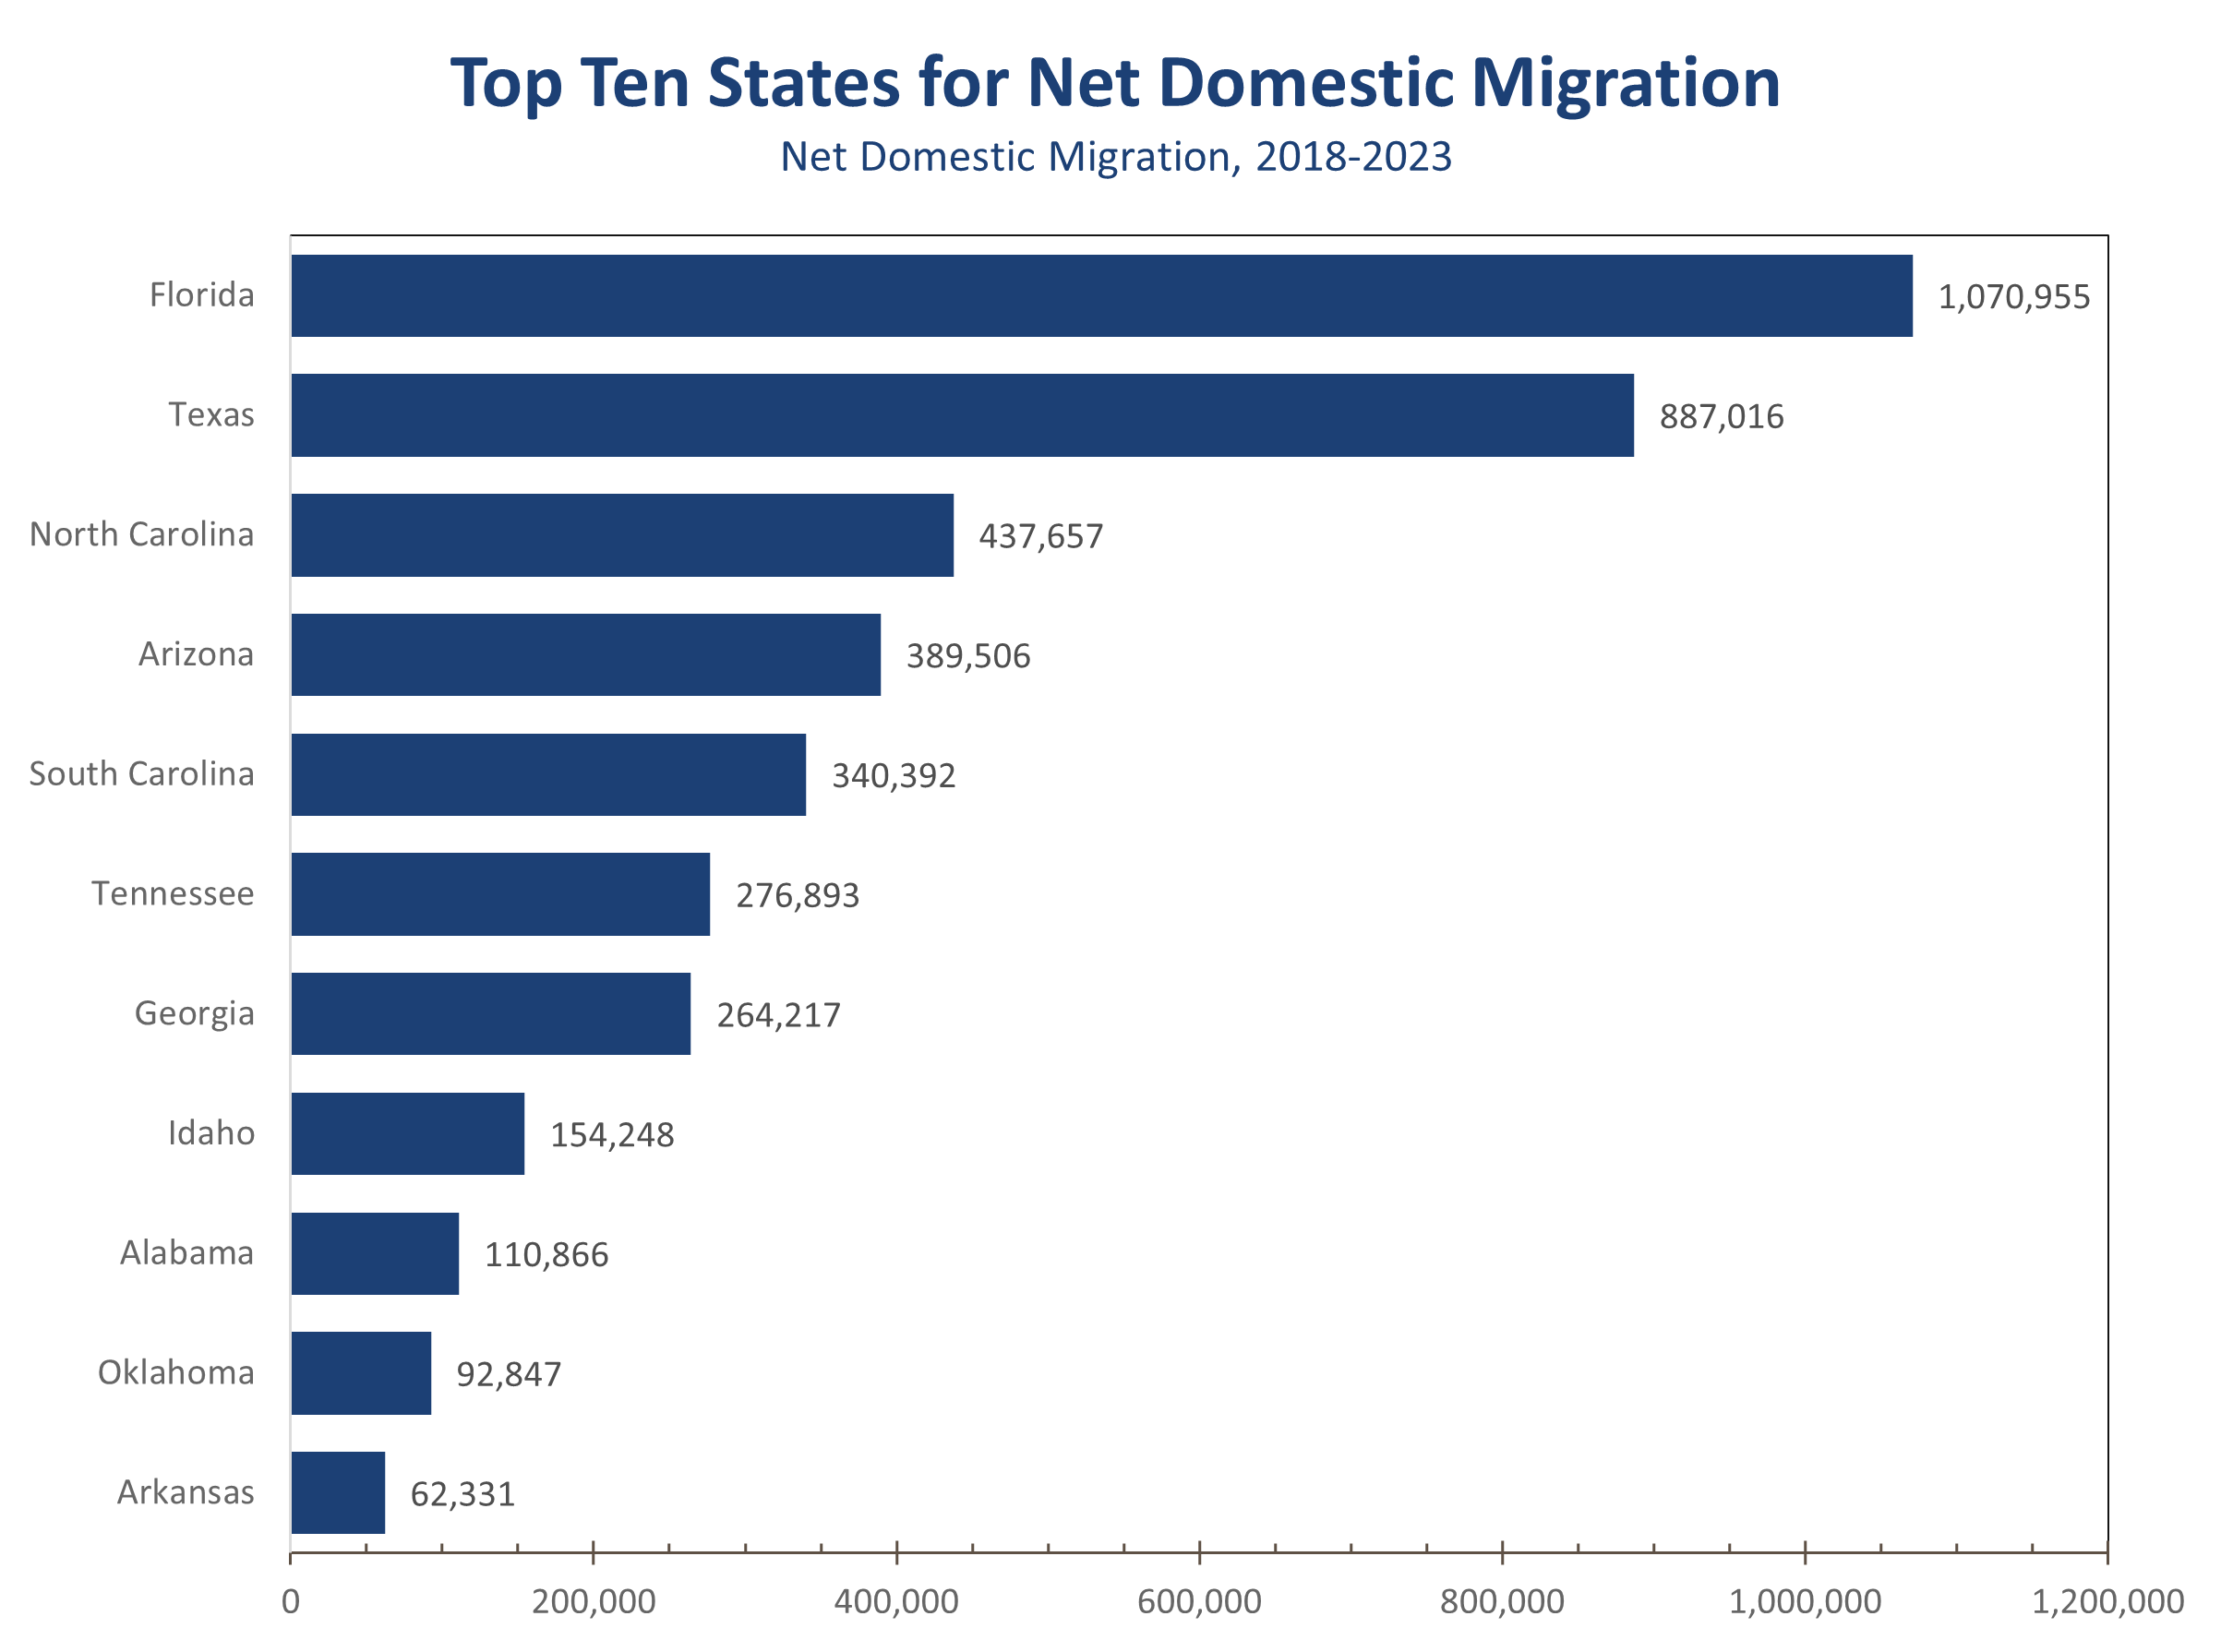
New voters might also help. South Carolina has enjoyed strong domestic in-migration in the past few years and led the nation in domestic in-migration in percentage terms this past year. In absolute numbers, 340,392 more people have moved to South Carolina over the past 5 years than moved away, with many relocating from the Northeast.
Despite facing a likely defeat in her home state, Haley vows to continue her campaign through Super Tuesday, focusing on delegate-rich states like California and Massachusetts. While victory in any state on March 5th seems improbable, her aim is to gather enough delegates to present a viable option at the convention, especially if Trump’s campaign encounters setbacks away from the campaign trail.
Disclaimer: This publication has been prepared for informational purposes only and is not intended as a recommendation offer or solicitation with respect to the purchase or sale of any security or other financial product nor does it constitute investment advice.
February 22, 2024
mark.vitner@piedmontcrescentcapital.com
Chief Economist (704) 458-4000
saul.vitner@piedmontcrescentcapital.com
Policy Analyst (704) 458-8570
The CPI Comes in Higher Than Expected
Inflation Rises Slightly Faster in January
- The Consumer Price Index rose 0.3% in January, a touch above the consensus estimate of 0.2%.
- Prices excluding food and energy items rose 0.4%, also 0.1 percentage point above expectations.
- The slightly larger price gains reflect larger than usual start-of-the-year price hikes in many labor-intensive categories.
- Price increases for several health care services categories posted outsized gains relative to recent months.
- Shelter costs were another problem area, rising 0.6% in January. Owners’ equivalent rent rose 0.6%, while rent of shelter rose 0.4% and lodging costs jumped 2.4%.
- Price increases also picked up at the grocery store, rising 0.4%, while prices at restaurants rose 0.5%. Used care prices continued their retreat, falling 3.4%.
- January’s CPI data are a wake-up call for those that believed the Fed had the all-clear signal to cut rates. Last year’s deceleration in inflation was likely overstated due to pandemic-related price swings. We are now seeing a bit of catch up, which supports our view that the Fed will remain cautious.
Inflation came in slightly higher than expected in January, with the headline CPI rising 0.3% and the closely watched core CPI rising 0.4%. Both were 0.1 percentage point above consensus expectations, which disappointed the financial market. Year-to-year, the CPI is now up 3.1%, while the core is up 3.9%.
Food prices picked back up in January, with prices rising 0.4% at the grocery store and climbing 0.5% at restaurants. Grocery store price increases had largely moderated during the second half of the year, rising at just a 1.8% pace form June to December. Prices for sugar and sweets, fats and oils, other foods each rose 0.6%. Prices for fresh vegetables also increased, rising 0.4%, and prices for eggs jumped 3.4%.
Restaurant prices, influenced more by labor costs, moderated less than grocery prices last year. Minimum wage increases in many areas, effective in January, partly contributed to this past month’s outsized rise.
Labor-intensive services saw significant price increases, partly due to a higher minimum wage.
Energy prices fell 0.9% in January, which is one reason why inflation expectations were so low. Gasoline prices did fall sharply, declining 3.3%, while fuel oil prices fell 4.5%. Electricity prices rose 1.2%, however, and natural gas prices rose 2.0%. Those large price hike likely reflect earlier enacted regulatory approvals that kicked into effect at the start of the year.

Grocery store prices are up a surprisingly modest 1.2% over the past year. The modest increase follows colossal gains in prior years, however. Grocery store prices are up a collective 21.1% over the past three years, which is roughly four times as much as they rose in the prior three years. The increase over the past three years is roughly equivalent to the cumulative rise in grocery store prices from 2008 to 2021.
Shrinkflation? Grocery store prices are up a collective 21.1% over the past three years.
Shelter costs rose 0.6% in January and accounted for over two thirds of the increase in the core CPI. Owners’ equivalent rent, which is the index that attempts to capture the cost of homeownership, rose 0.6% in January and is up 6.2% over the past year. Rent of shelter, which captures the cost of rental apartments and single-family rentals, rose 0.4% and is up 6.1% over the past year.
Shelter costs account for roughly 36.2% of the overall CPI and a whopping 45.4% of the core CPI. The BLS rental measure lags behind market rates, which currently show minimal changes for new leases and about a 2.5% increase for renewals. There is a tidal wave of apartments slated to be completed to be completed this year, which should put additional downward pressure on rents and consumer prices.

Prices for certain pandemic-impacted items, like used cars and trucks, declined by 3.4% in January and fell 3.5% over the past year. In contrast, these prices had surged by 24.2% over the previous two years. Gasoline prices have also fallen sharply, plunging 14.2% this past year.
Still other prices remain highly problematic. The cost of motor vehicle insurance has surged 20.6% over the past year. Prices for tickets to sporting events are up 13.5% and prices for hospital services, home health services, nursing homes and day care are all up sharply as well.
Inflation is decelerating more slowly than widely thought, which will push rate cuts further out.
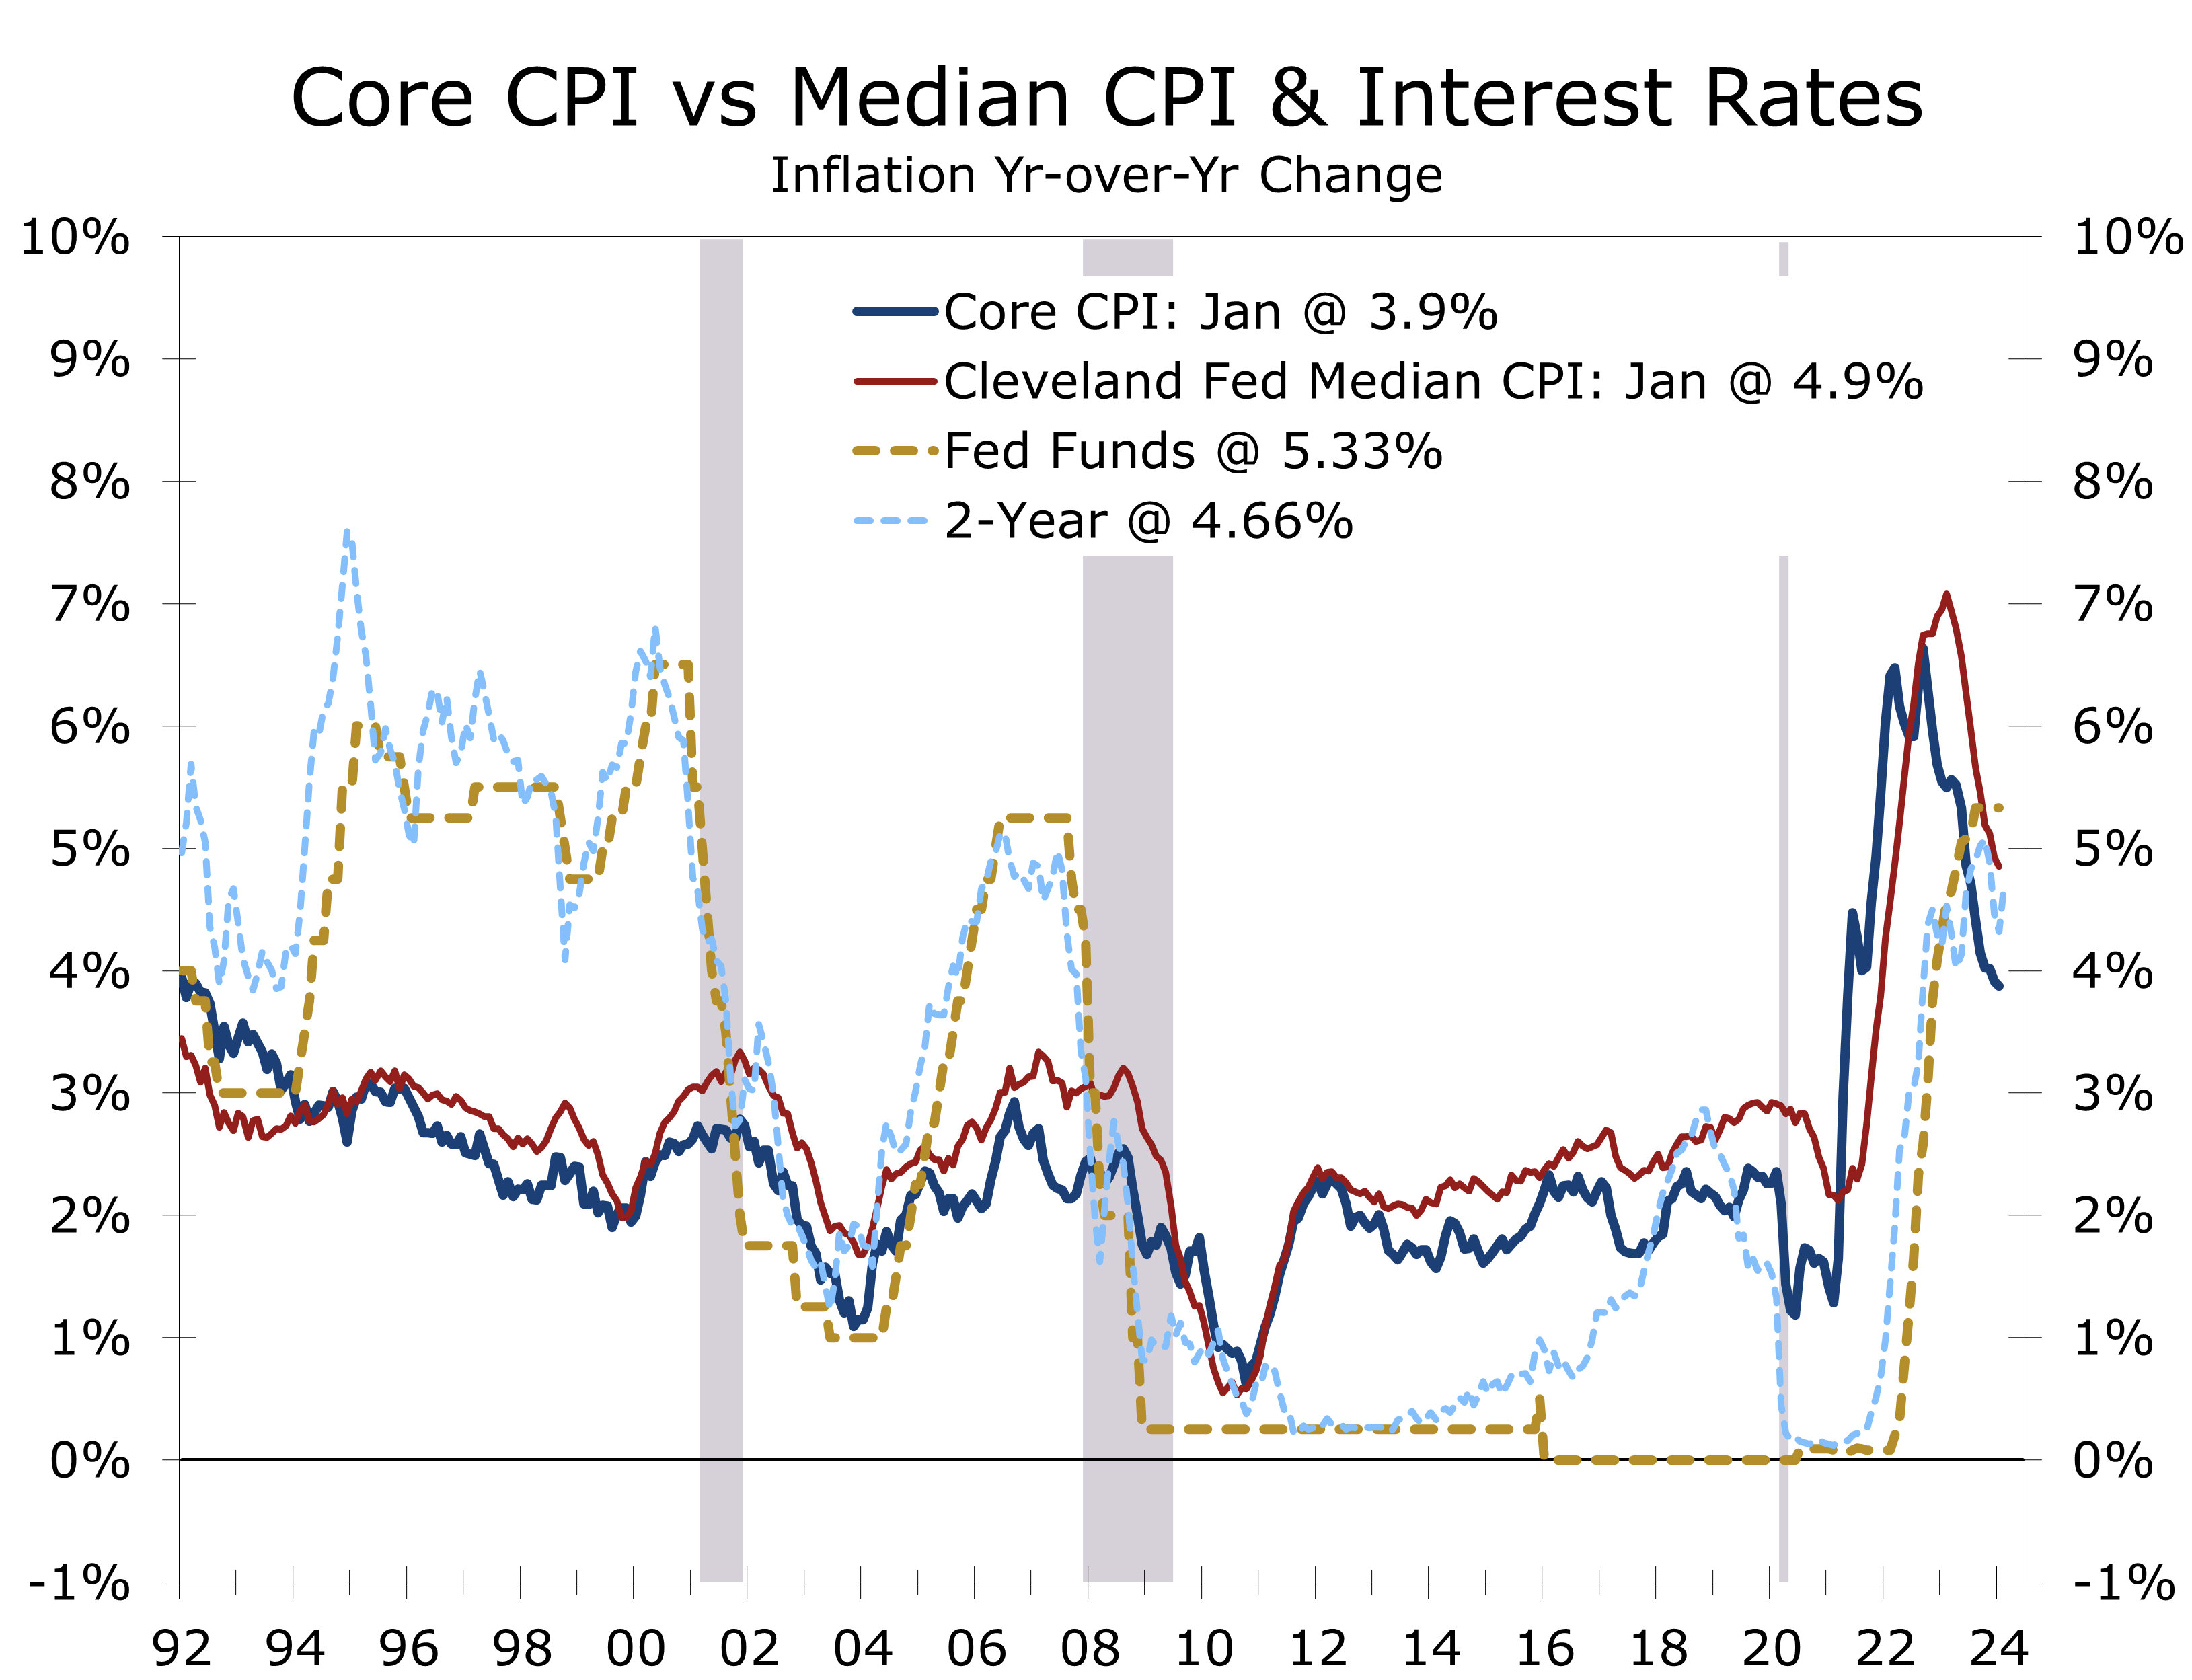
We maintain a cautious view on inflation. Unusually wide pandemic-induced price hikes for key items, such as used cars and apartments, likely distorted seasonal adjustment and understated inflation as prices eased in 2023. The Cleveland Fed’s Median CPI mitigates the impact of these swings. While higher, prices by this measure are still moderating, which should allow the Fed to start cutting the federal funds rate by a quarter point in June, followed by further cuts in September and December — a path is consistent with the 2-Year Treasury, which leads changes in the funds rate.
Disclaimer: This publication has been prepared for informational purposes only and is not intended as a recommendation offer or solicitation with respect to the purchase or sale of any security or other financial product nor does it constitute investment advice.
February 13, 2024
mark.vitner@piedmontcrescentcapital.com
Chief Economist (704) 458-4000
Small Business Owners Remain Cautious
High Operating Costs Squeeze Small Businesses
- The NFIB Small Business Optimism Index declined by 2 points to 89.9 in January, marking the 25th consecutive month it has remained below its 50-year average of 98.
- ix of the 10 components fell in January, while 2 remained unchanged, and 2 rose.
- Sales expectations tumbled 12 points, and now show a net -16% expect sales to increase over the next three months.
- Rising operating costs, including compensation, combined with slowing sales and diminishing pricing power continue to squeeze profit margins.
- Earnings trends also fell 5 points and now show a net -30% believe their earning have improved over the past 3 months.
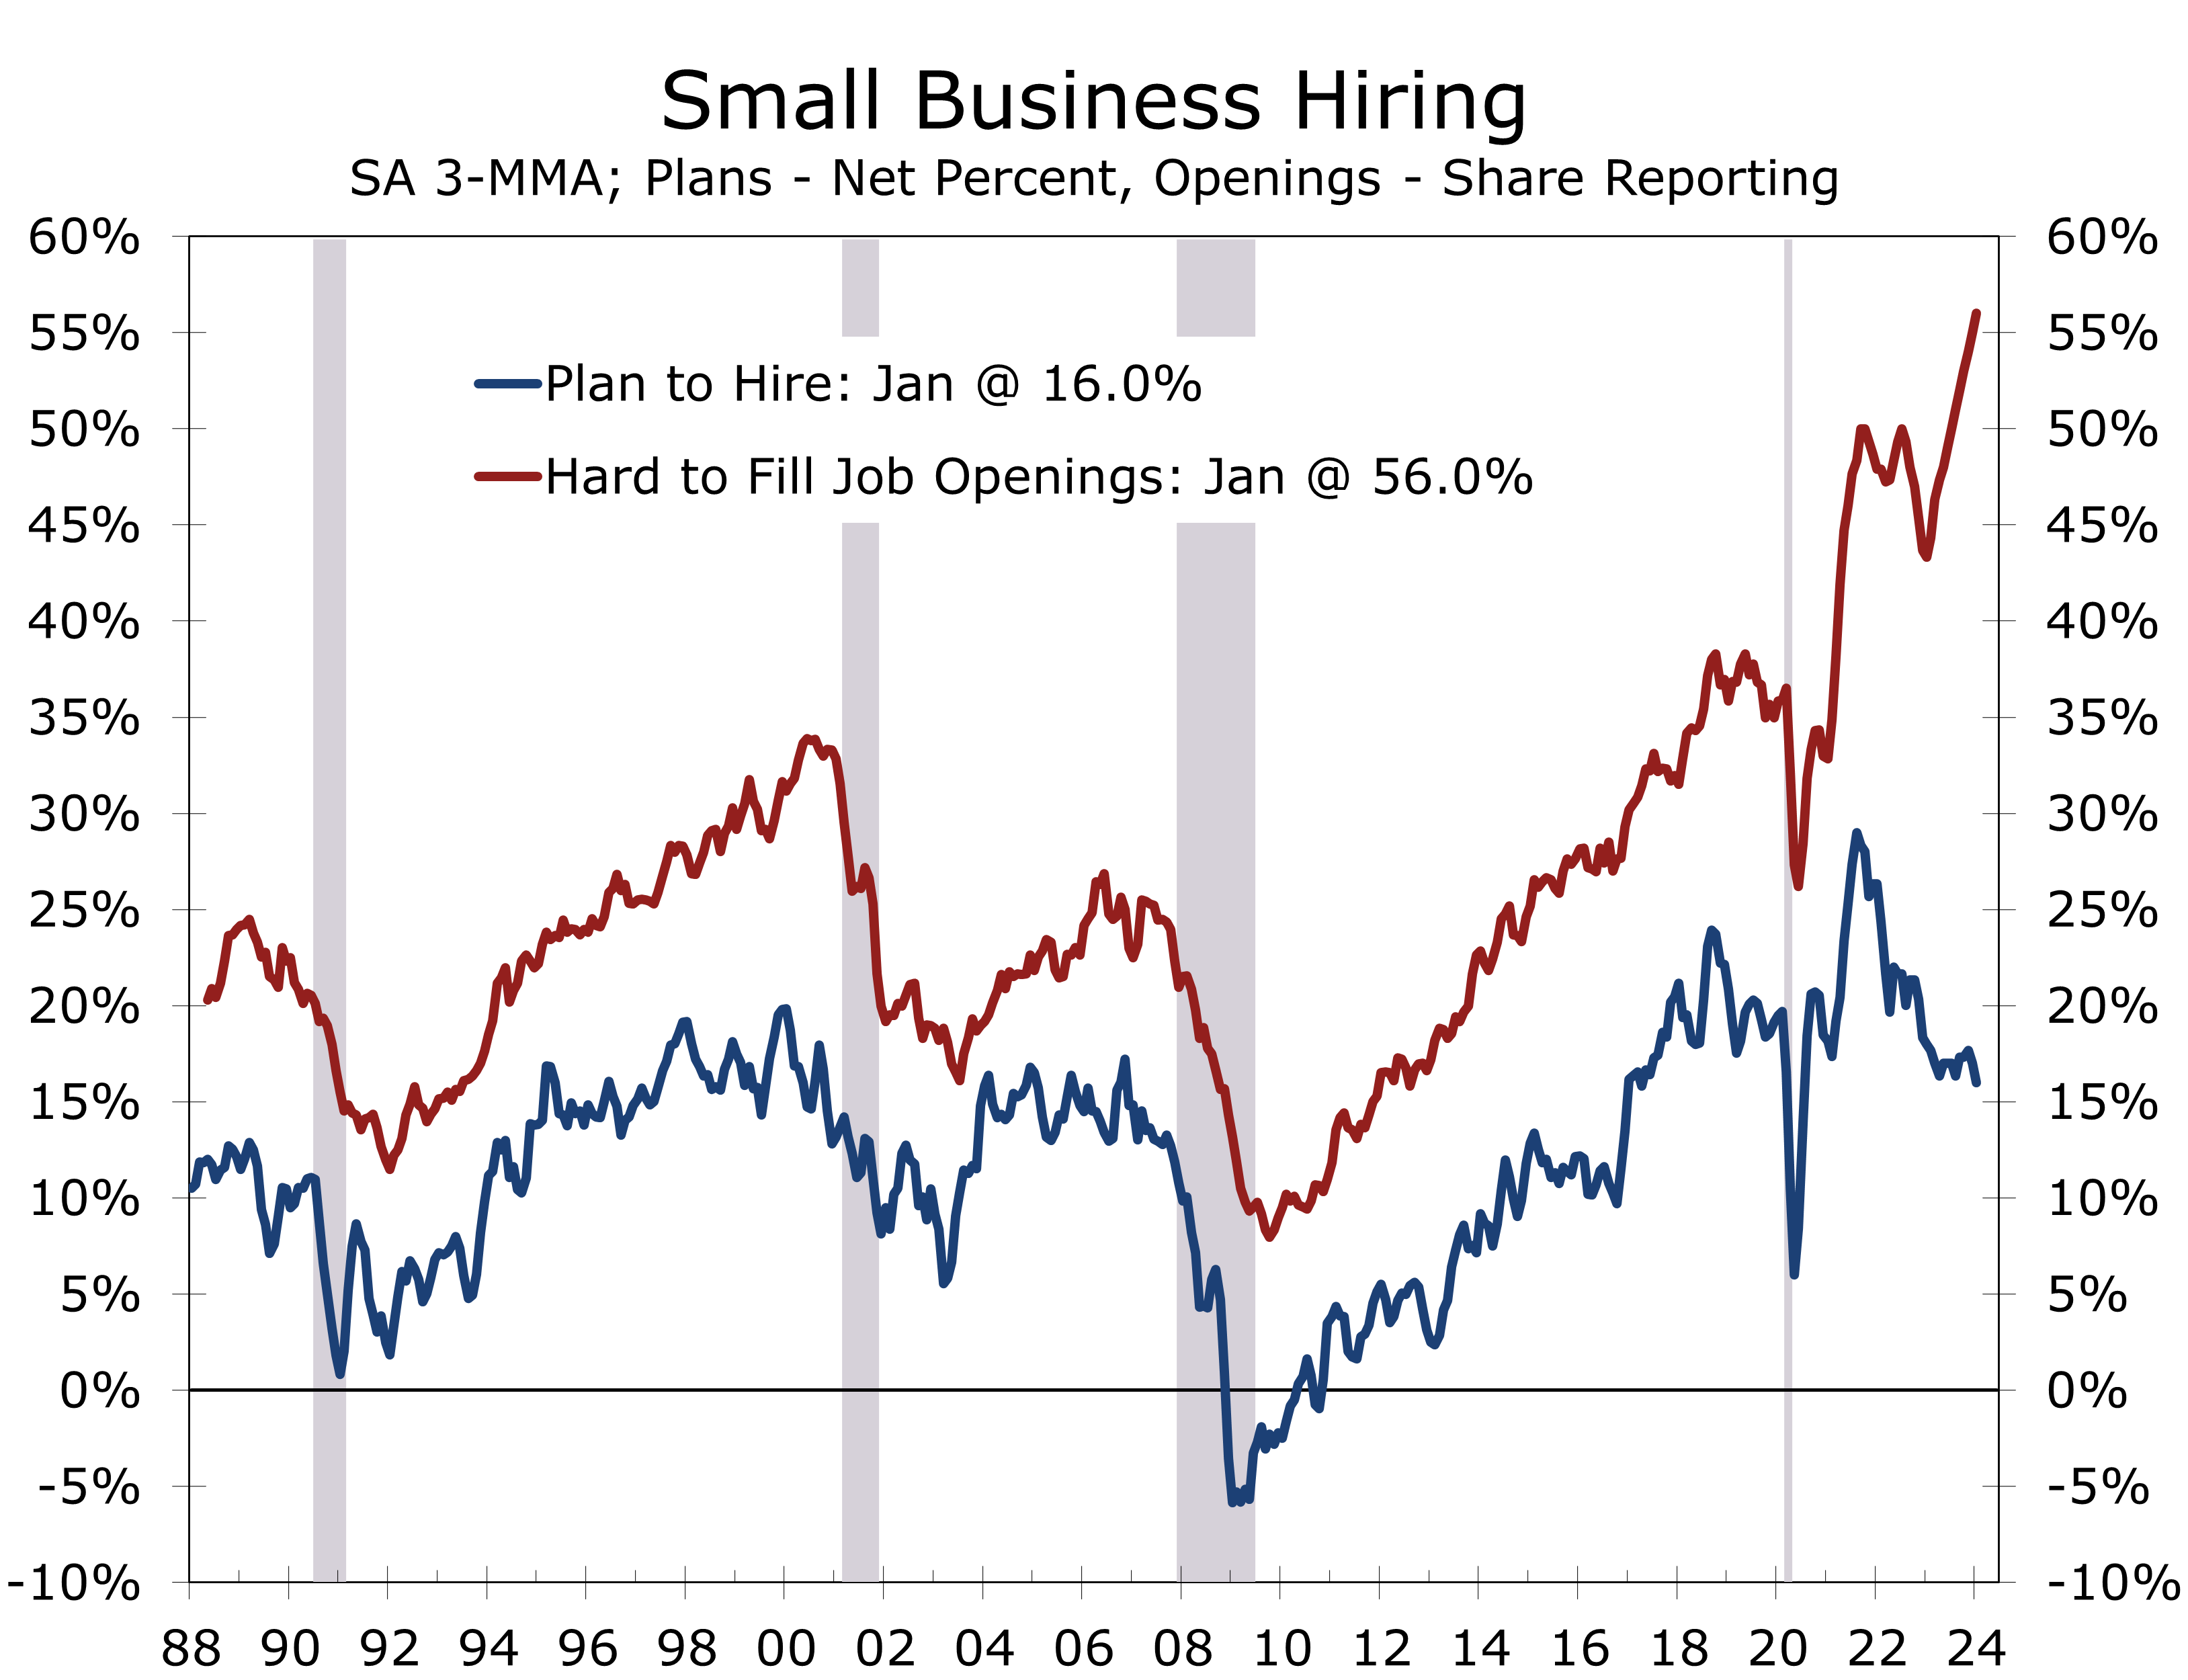
- While job openings remain historically high and businesses continue to have a hard time filling open positions, fewer firms plan to increase staff over the next 3 months.
- Small businesses continue to get squeezed by higher operating costs, which they are increasingly unable to pass along to their customers. Business owners also remain concerned about higher interest rates and geopolitical uncertainty.
Small business owners remain cautious amidst continuing uncertainties surrounding inflation, interest rates and geopolitics. The NFIB Small Business Optimism Index fell 2 points in January and has now remained below its 50-year average of 98 for 25 consecutive months. Six of the indexes 10 components fell in January, while just 2 increased.
Sales remain lackluster, with a net -11% stating sales had increased over the past 3 months. Expectations for future sales weakened even more, with the proportion of business owners expecting sales to rise over the next 3 months tumbling 12 points to a net -16%, the lowest since May of last year.
With sales under pressure, business owners are paying even closer attention to reducing expenses. Fewer firms are planning to add staff, with the share planning to create new jobs over the next 3 months falling 2 points to 14% and hitting its lowest level since May 2020. Small businesses are also maintaining minimal inventories, even at the risk of losing sales.
Small Businesses are getting squeezed by higher operating costs and are holding off hiring staff.
Given the weakness and sales and persistence of costs pressures, just 8% of small businesses feel now is a good time to expand. When asked why they feel that way, 33% cite weak economic conditions and 10% blame the pollical climate. An additional 7% cite financial conditions and higher interest rates.
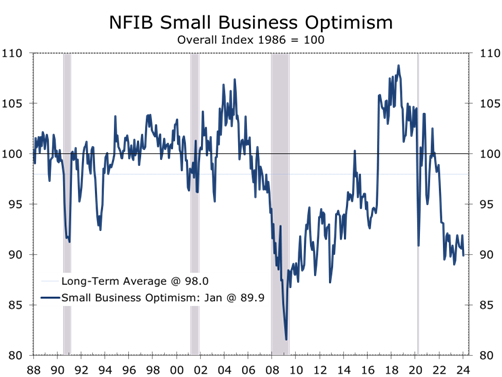
The weaker Small Business Optimism report runs somewhat counter to some of the hard data reported for January. Nonfarm employment growth surprised to the upside in January, with employers creating 353,000 net new jobs. Our sense is the NFIB data may be more telling, particularly since January’s weaker NFIB data continue a long running trend. Small business owners are increasingly less likely to add staff, even though job openings remain historically high, and they continue to have a hard time filling many positions.
Weaker hiring plans add some fuel to the notion that January’s job gains were overstated.
Thirty-nine percent of small business owners reported they had a job opening they could not fill, down 1 point from December and the lowest level since January 2021. Open positions are particularly challenging to fill in construction, manufacturing, and non-professional services. Construction job openings declined 11 points in January, but almost half of construction firms have a job opening they cannot fill. Professional services and finance have the fewest openings.
While job openings are inching lower, the proportion of firms struggling to fill them continues to climb, rising 1 point in January to a record 57%. The continuing rise likely stems from the growing number of retirees, particularly in construction and manufacturing.
Weaker sales and higher operating costs continue to squeeze profit margins. Reports of positive profit trends fell 5 points in January to a net -30%, a very weak number. Among owners reporting lower profits, 32 percent attributed it to weaker sales, 15 percent to increased material costs, another 15 percent to seasonal changes, and 11 percent to labor costs.
Weaker sales and higher operating costs continue to squeeze profit margins.
Weaker sales are hindering business owners’ ability to offset higher operating costs. The percentage of firms raising prices in the past 3 months fell 3 points to 22%, the lowest since January 2021, while those raising compensation rose by 3 points to 39% in January. While compensation costs have been sticky, January’s rise was likely bolstered by rising minimum wages in several jurisdictions throughout the country.
January’s weaker NFIB small business confidence report takes some of the shine off January’s spike in nonfarm payrolls and suggests inflation is moderating less than the financial markets have been counting on. We continue to look for three quarter-point cuts in the federal funds rate this year, beginning in June.

Disclaimer: This publication has been prepared for informational purposes only and is not intended as a recommendation offer or solicitation with respect to the purchase or sale of any security or other financial product nor does it constitute investment advice.
February 13, 2024
mark.vitner@piedmontcrescentcapital.com
Chief Economist (704) 458-4000
Manufacturing Activity Improves Slightly in January
A Few Green Shoots in the Factory Sector
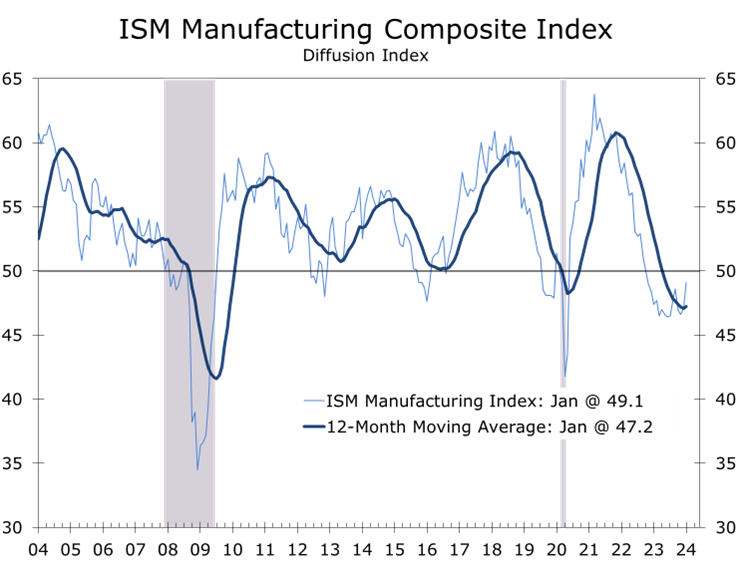
- The ISM Manufacturing Index rose 2 points to 49.1 in January, exceeding expectations.
- Most regional manufacturing surveys had posted declines in January, including notably sharp declines in surveys by the New York and Dallas Federal Reserve Banks.
- New orders, which are the most leading component of the ISM survey, surged 5.5 points to 52.5.
- Production, which rose 0.5 points to 50.4, also returned above the break-even level.
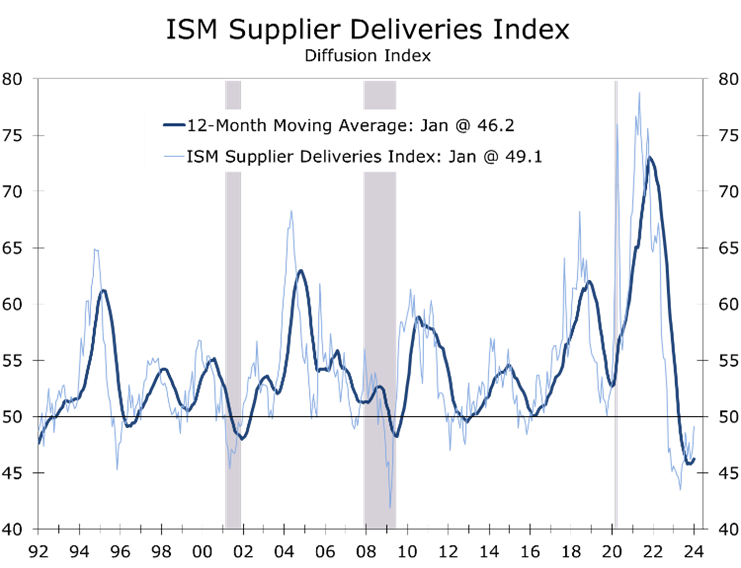
- The supplier deliveries index increased by 2.1 points to 49.1, indicating slower deliveries. While it is likely too soon to see effects from disruptions in the Red Sea, ongoing delays at the Panama Canal may be impacting delivery times.
- The prices-paid index soared 7.7 points to 52.9, likely indicating an end to the easing of raw material prices.
- January’s ISM report exceeded expectations, which had been weighed down by a series of weak regional manufacturing reports. While encouraging, the improvement in the ISM appears to be narrowly based. Manufacturers remain concerned about weak demand for goods and sluggish growth overseas.
The ISM Manufacturing Purchasing Managers’ Index (PMI) exceeded expectations in January, rising 2 points to 49.1, its highest level since October 2022. This follows declines in several regional manufacturing indexes earlier in the month. Despite remaining below the crucial 50-point threshold for the 15th consecutive month, there are signs of improvement, notably a 5.5-point increase in new orders and a 0.5-point rise in production.
The New Orders Index rose to 52.5, marking only the second time it has surpassed 50 in the last 20 months. Three major industrial sectors—Chemical Products, Transportation Equipment, and Fabricated Metals—saw increased orders. This improvement is attributed to strong demand for appetite suppressant medications, recovery from the UAW strike, and growth in industrial construction.
The long slide in manufacturing activity may be ending but a recovery remains uncertain.
The narrow improvement in new orders leaves the timing and extent of recovery uncertain. Only 20.2% of manufacturers noted a rise in new orders, while 23.5% saw a decline. Moreover, exceptionally low customer inventories suggest lower interest rates and less geopolitical uncertainty might quickly lift new orders.
Supplier deliveries rose by 2.1 points to 49.1, reflecting a lengthening in shipping times. Supplier delivery times have been normalizing for some time, even for highly sought after products such as semiconductors. The lead time for production materials increased by 1 day this past month, reaching an average of 83 days. This is still well above 66 days averaged in the year prior to the pandemic but well below the peak of 100 days last reached in July 2022.
Following the wide swings surrounding the pandemic, supply chains are now normalizing.
We believe it is too early to see any impact from delays emanating from attacks on shipping in the Red Sea and the resulting rerouting of traffic. Moreover, the impact from those delays is likely to be greater in Europe than in the U.S.
The Red Sea is not the only trouble spot. Delays in the Panama Canal due to low water levels have been a long running problem that looks likely to persist. Once onshore, however, goods are moving swiftly, with trucking, rail, air, and warehouses all operating with well within historic capacity norms.
With supply chains normalizing, fewer products are in short supply. Long-running shortages of electrical components and electronic components continue. In addition, steel alloy remains in short supply.
The ISM Employment index fell 0.4 points to 47.1, marking the for consecutive month the index has been below 50. Transportation equipment was the only large manufacturing sector where payrolls rose in January. One an overall basis 11% of manufacturers said they added to payrolls, down from 11.7% the prior month. The share of manufacturers reducing payrolls rose 0.4 points to 18.4%.
The moderation in raw materials prices appears to have largely run its course.
The ISM Prices-Paid Index surged 7.7 points to 52.9 in January, ending an 8-month run below 50. Key raw material prices have normalized due to lower energy costs, better supplies, and reduced shipping rates. However, recent energy price increases and higher global shipping rates, triggered by attacks on Red Sea shipping, suggest prices will like firm further.
While January’s ISM data are mixed, they generally support of the Fed’s intention to hold rates steady through late spring or early summer. At 49.1, the ISM index is consistent with 1.9% real GDP growth, which is close to consensus but well below the early projections from the Atlanta Fed’s GDPNow, which are at 4.2%.

Disclaimer: This publication has been prepared for informational purposes only and is not intended as a recommendation offer or solicitation with respect to the purchase or sale of any security or other financial product nor does it constitute investment advice.
Argentina's Warning to the West
Milei Puts the West on Notice
- Argentina's President Javier Milei's speech at the World Economic Forum staunchly defended free-market capitalism and warned against creeping socialism.
- Argentina has endured a long and arduous slide from one of the world’s wealthiest economies to one of its most troubled.
- Since winning the presidency, Javier Milei, a libertarian economist, has initiated significant reforms, including reducing government ministries, reshaping foreign policy, and issuing Decree 70/2023, which reduces energy and transportation subsidies and does away with rent control.
- The U.S. and the West can learn from Argentina's economic challenges, especially regarding the impact from the persistence of large budget deficits, the pervasive growth of the administrative state, and ever-expanding entitlement commitments.
During this year’s World Economic Forum in Davos, Argentina’s President Javier Milei delivered a notable speech defending free-market capitalism and cautioning against the dangers of creeping socialism. Drawing from Argentina’s decades-long economic challenges, Milei emphasized the detrimental effects of extensive government intervention policies, including income redistribution, price controls, and burdensome regulations, which have led to increasing poverty. He stressed the effectiveness of free-market capitalism in reducing poverty throughout the world and cautioned against moving away from it, foreseeing disastrous consequences.
Researchers often refer to the rise and fall of Argentina as the “Argentine Paradox.” Once one of the wealthiest countries in the world, Argentina experienced a tenuous century of economic decline and political instability. The fall has served as a warning, mostly to Western governments that have run persistent fiscal deficits and have incessantly grown their administrative states. Argentina elected libertarian economist Javier Milei as president, who has vowed to reverse the decline by embracing free market economic principals.
The service sector is the largest in Argentina, contributing to over three-fifths of Argentina’s GDP while manufacturing comprises another fifth. Agriculture is a smaller portion of the Argentine economy, although Argentina is a leading exporter of wheat, soybeans, and beef.
Argentina’s abundance of natural resources sets it apart from much of South America, allowing for energy self-sufficiency. Deposits of minerals including uranium, zinc, copper, and silver are found throughout the country. Despite facing challenges, Argentina boasts a moderate quality of life, on an overall basis, ranking second in South America on the Human Development Index, and surpassed only by Chile. Moreover, it leads the region with the highest literacy rate.[1] Still, more than 40% of Argentines currently live in poverty and years of unfulfilled promises of reform have left the general populace disheartened.
A century ago, Argentina’s GDP per capita rivaled Belgium, France, and Germany, and easily surpassed its former colonizer, Spain.[2] The capital, Buenos Aires, was widely viewed as the Paris of the West. The population is generally composed of people of European heritage and Argentina is widely viewed as the most European-like nation in Latin America.
[1] Spruk, R. The rise and fall of Argentina. Lat Am Econ Rev 28, 16 (2019). https://doi.org/10.1186/s40503-019-0076-2
[2] https://www.economist.com/special-report/2004/06/05/becoming-a-serious-country
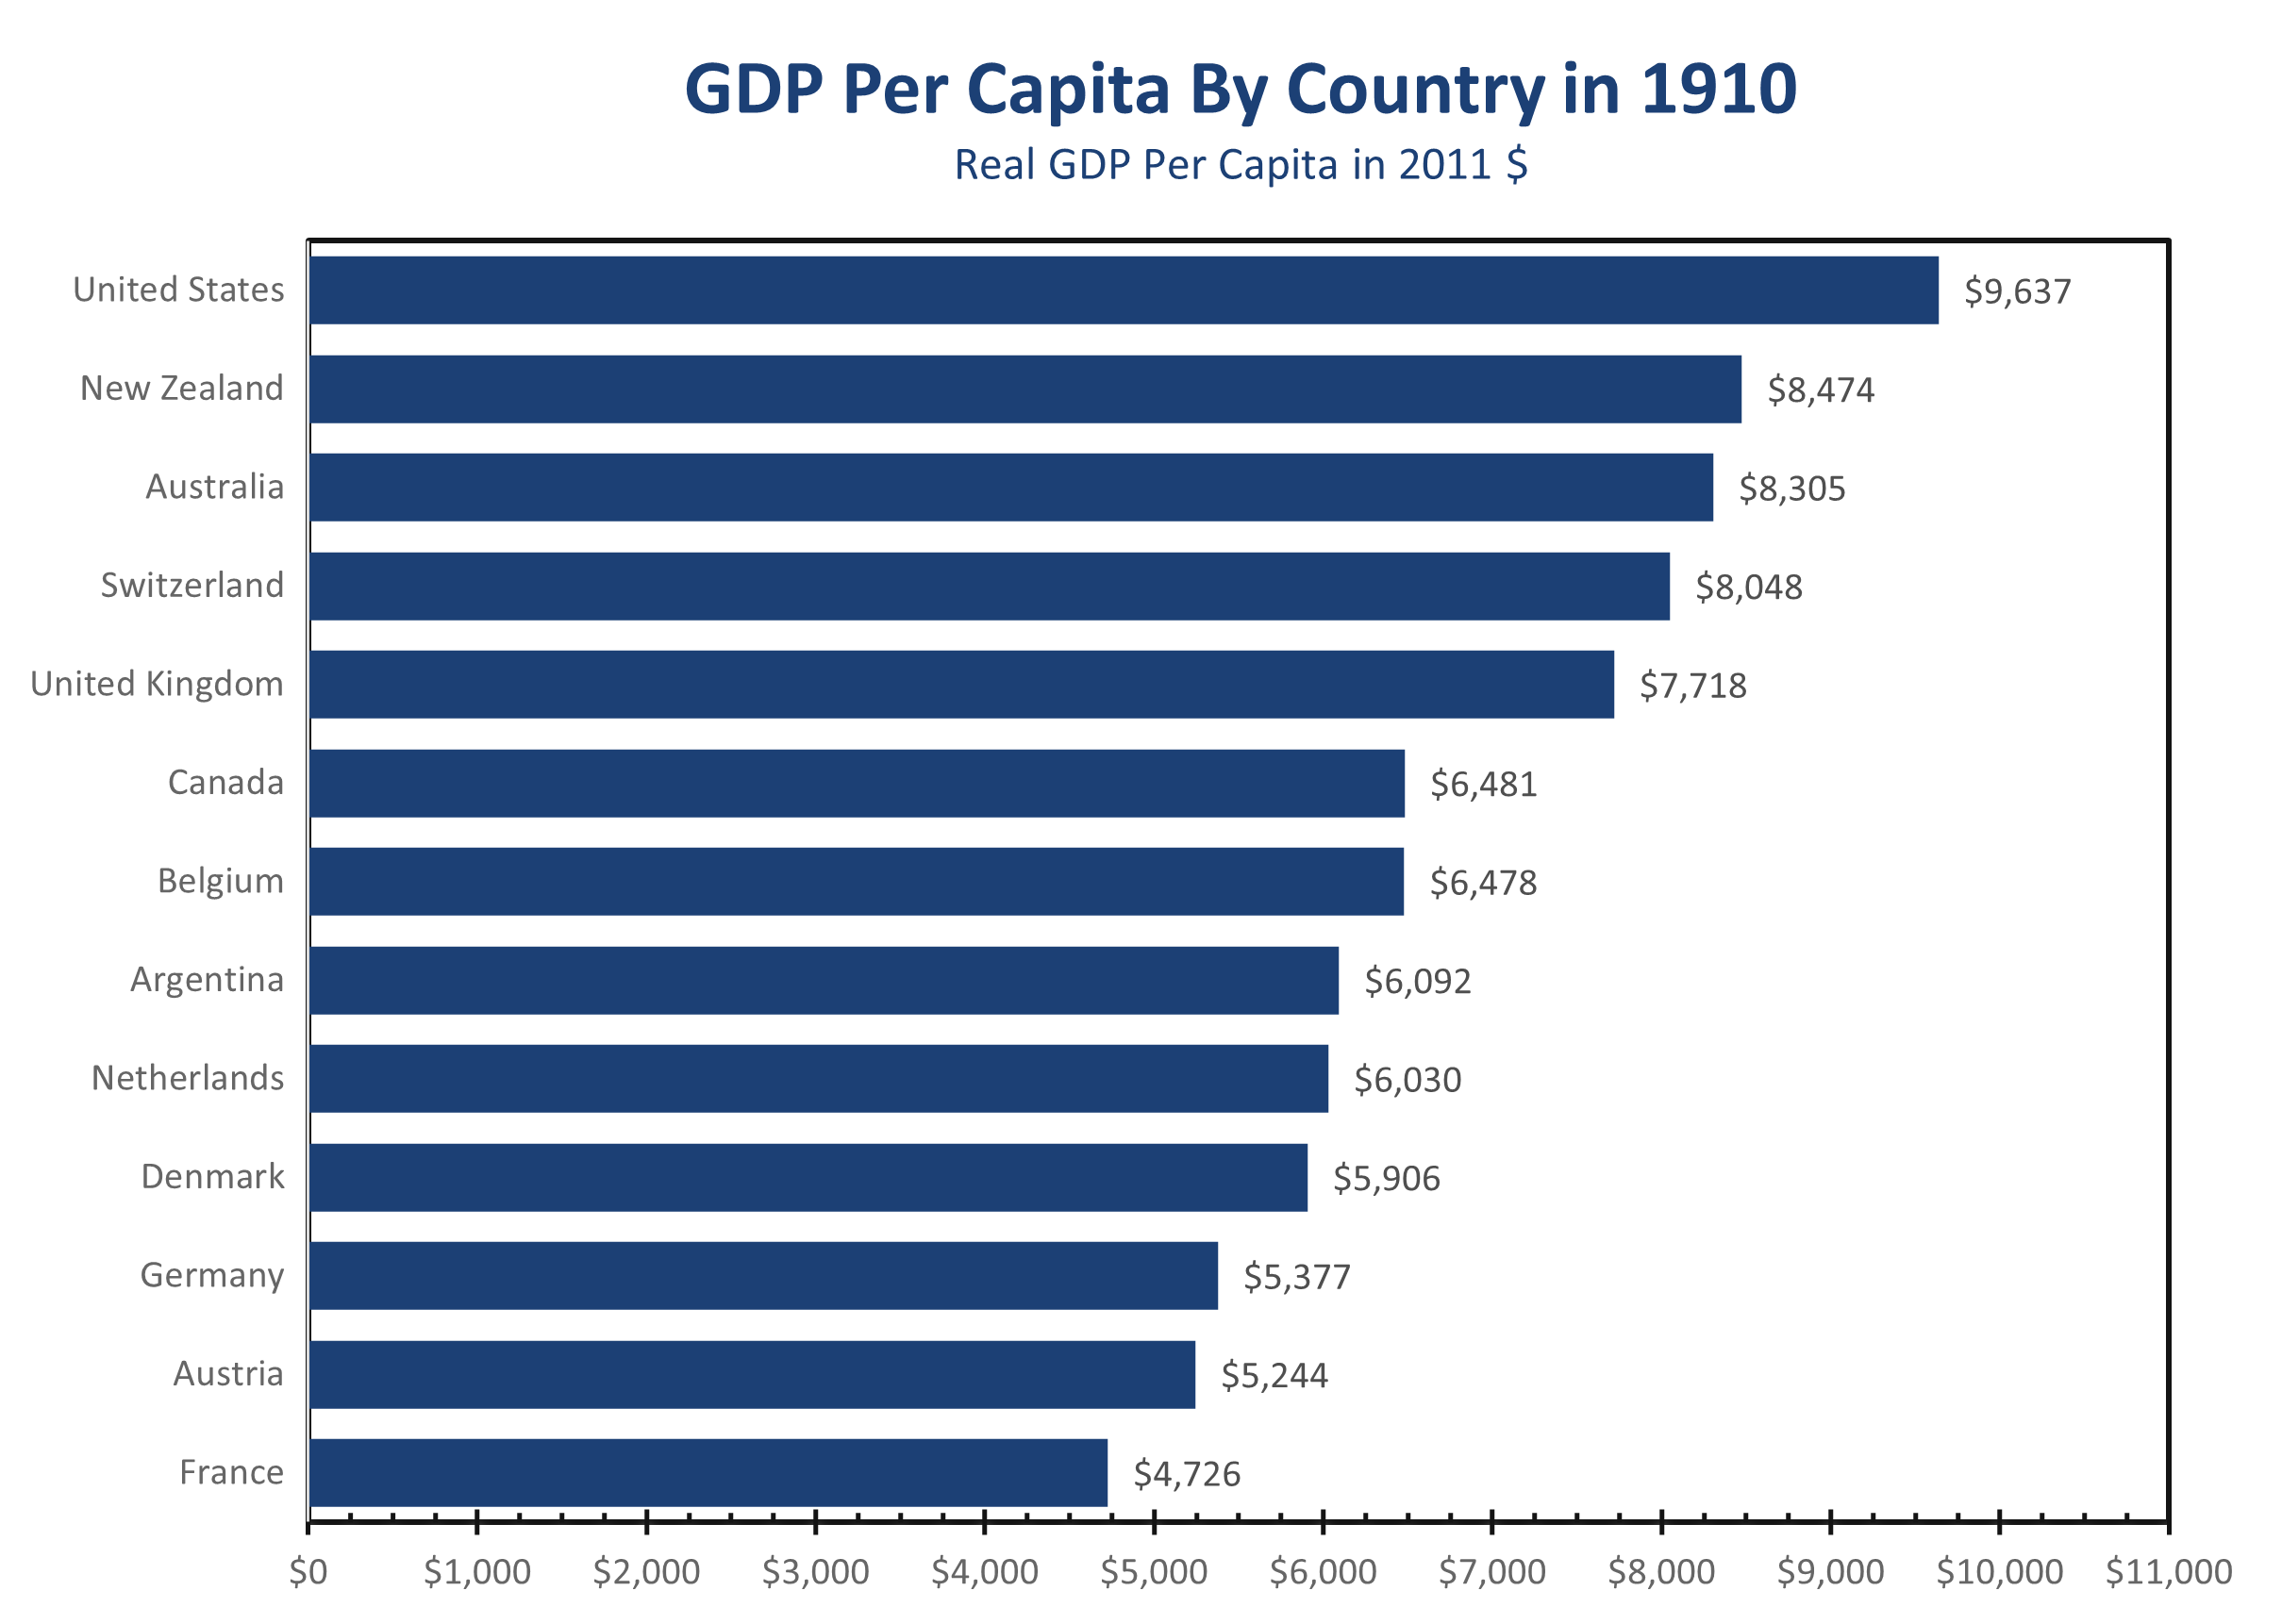
In the early 1900s, agriculture dominated Argentina’s economy, with the country excelling at exporting corn and beef to Europe while relying on imports of fuel and manufactured goods. World War I and its aftermath marked the start of Argentina’s decline, as rising protectionism in Europe and the United States led to a sharp drop in demand for Argentine goods. The isolationist trend intensified during the Great Depression, culminating in a severe economic downturn, a military coup, and the end of over sixty years of civilian government.
The military government of the 1930s introduced import substitution to protect Argentine industry and develop self-sufficiency. The practice continued into the 1940s when Juan Peron took power. Hailing support from the labor unions, Peron enacted many populist and left-wing reforms including wealth redistribution, nationalization of public services, and rent control. Although Peron was forced from office by the military in 1955, Peronist ideas became entrenched in Argentine politics, as once provided, benefits and social programs are extremely difficult to scale back or eliminate.
During the tumultuous 1960s and 70s, Argentina experienced a series of coups and intermittent shifts between military and civilian rule. Widespread terrorism plagued the country during this instability. In an attempt to attract investment, Argentine leaders devalued the peso, leading to rampant inflation. By 1976, inflation had surged to a staggering 600%. The unpopular civilian government was overthrown by the military that year.
Military rule marked the end of import substitution and the introduction of liberal free market reforms. Increased government spending and inefficient production by the junta sent inflation sent inflation soaring above 1000% in 1980. The military regime lasted until the end of the Falklands War in 1982, by which time the Argentine economy was in shambles.
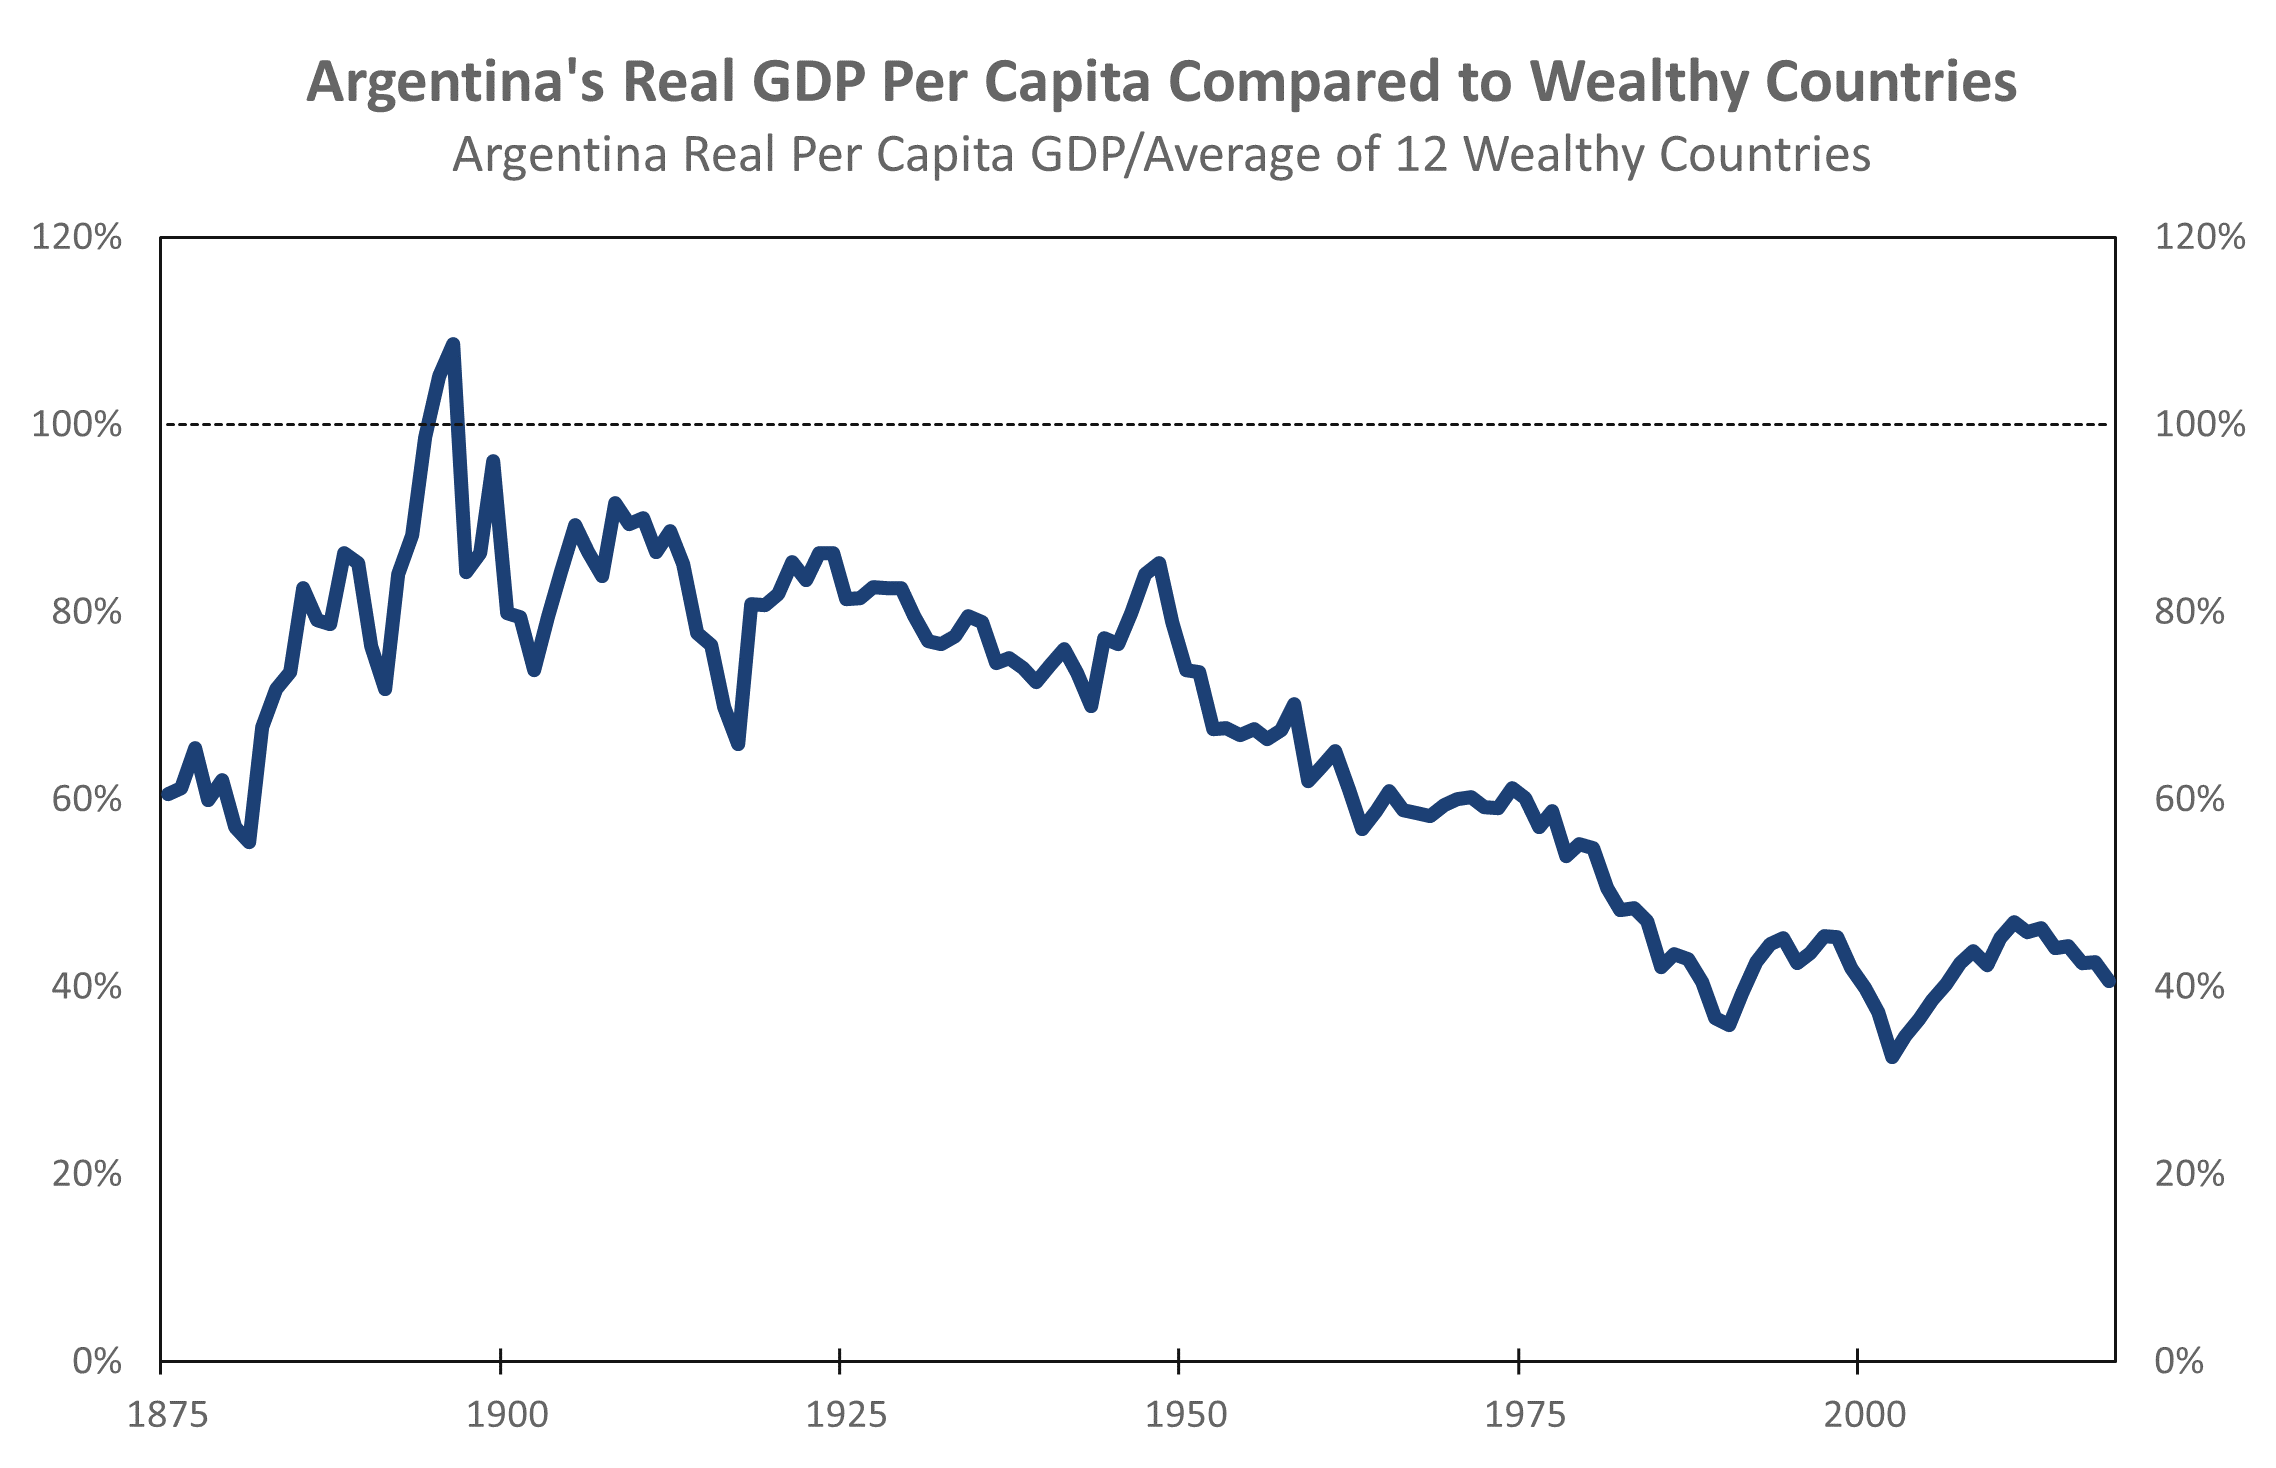
After its return to democracy, Argentina underwent austerity measures in the 1980s and 90s to bring down inflation. A new peso was established in 1992 and pegged to the US dollar. Many state industries were privatized. While inflation appeared under control in the early 90s, the Mexican peso crisis of 1994 and subsequent recession prompted further austerity measures.
Argentina defaulted on its foreign debt at the turn of the century amid a prolonged recession and mass protests throughout Buenos Aires. The peso was once again devalued, and inflation soared. The subsequent Kirchner administration saw success in restructuring Argentina’s debt. However, inflation rose once again at the end of his term.
Kirchner was succeeded by his wife, Cristina Fernandez de Kirchner in 2007. The economy seemingly rebounded going into the 2010s, although Argentina’s inflation rate was still among the highest in the western hemisphere. Argentina defaulted on its debt once again in 2014 when negotiations with US hedge funds collapsed.
Center-right Mauricio Macri won the presidency in 2015, breaking a decades-long Peronist grip over Argentina. Macri was initially unable to enact any sweeping economic reforms with his party in the minority in Congress. He removed certain taxes on exports, negotiated debt settlements, and raised interest rates to combat inflation. The latter triggered a recession in 2016, although Macri’s party made gains in the 2017 midterms and granted him more control over the economy. Despite this, Macri’s policies proved underwhelming. Inflation and poverty soared in 2018, and Macri lost reelection the following year to Peronist Alberto Fernandez.
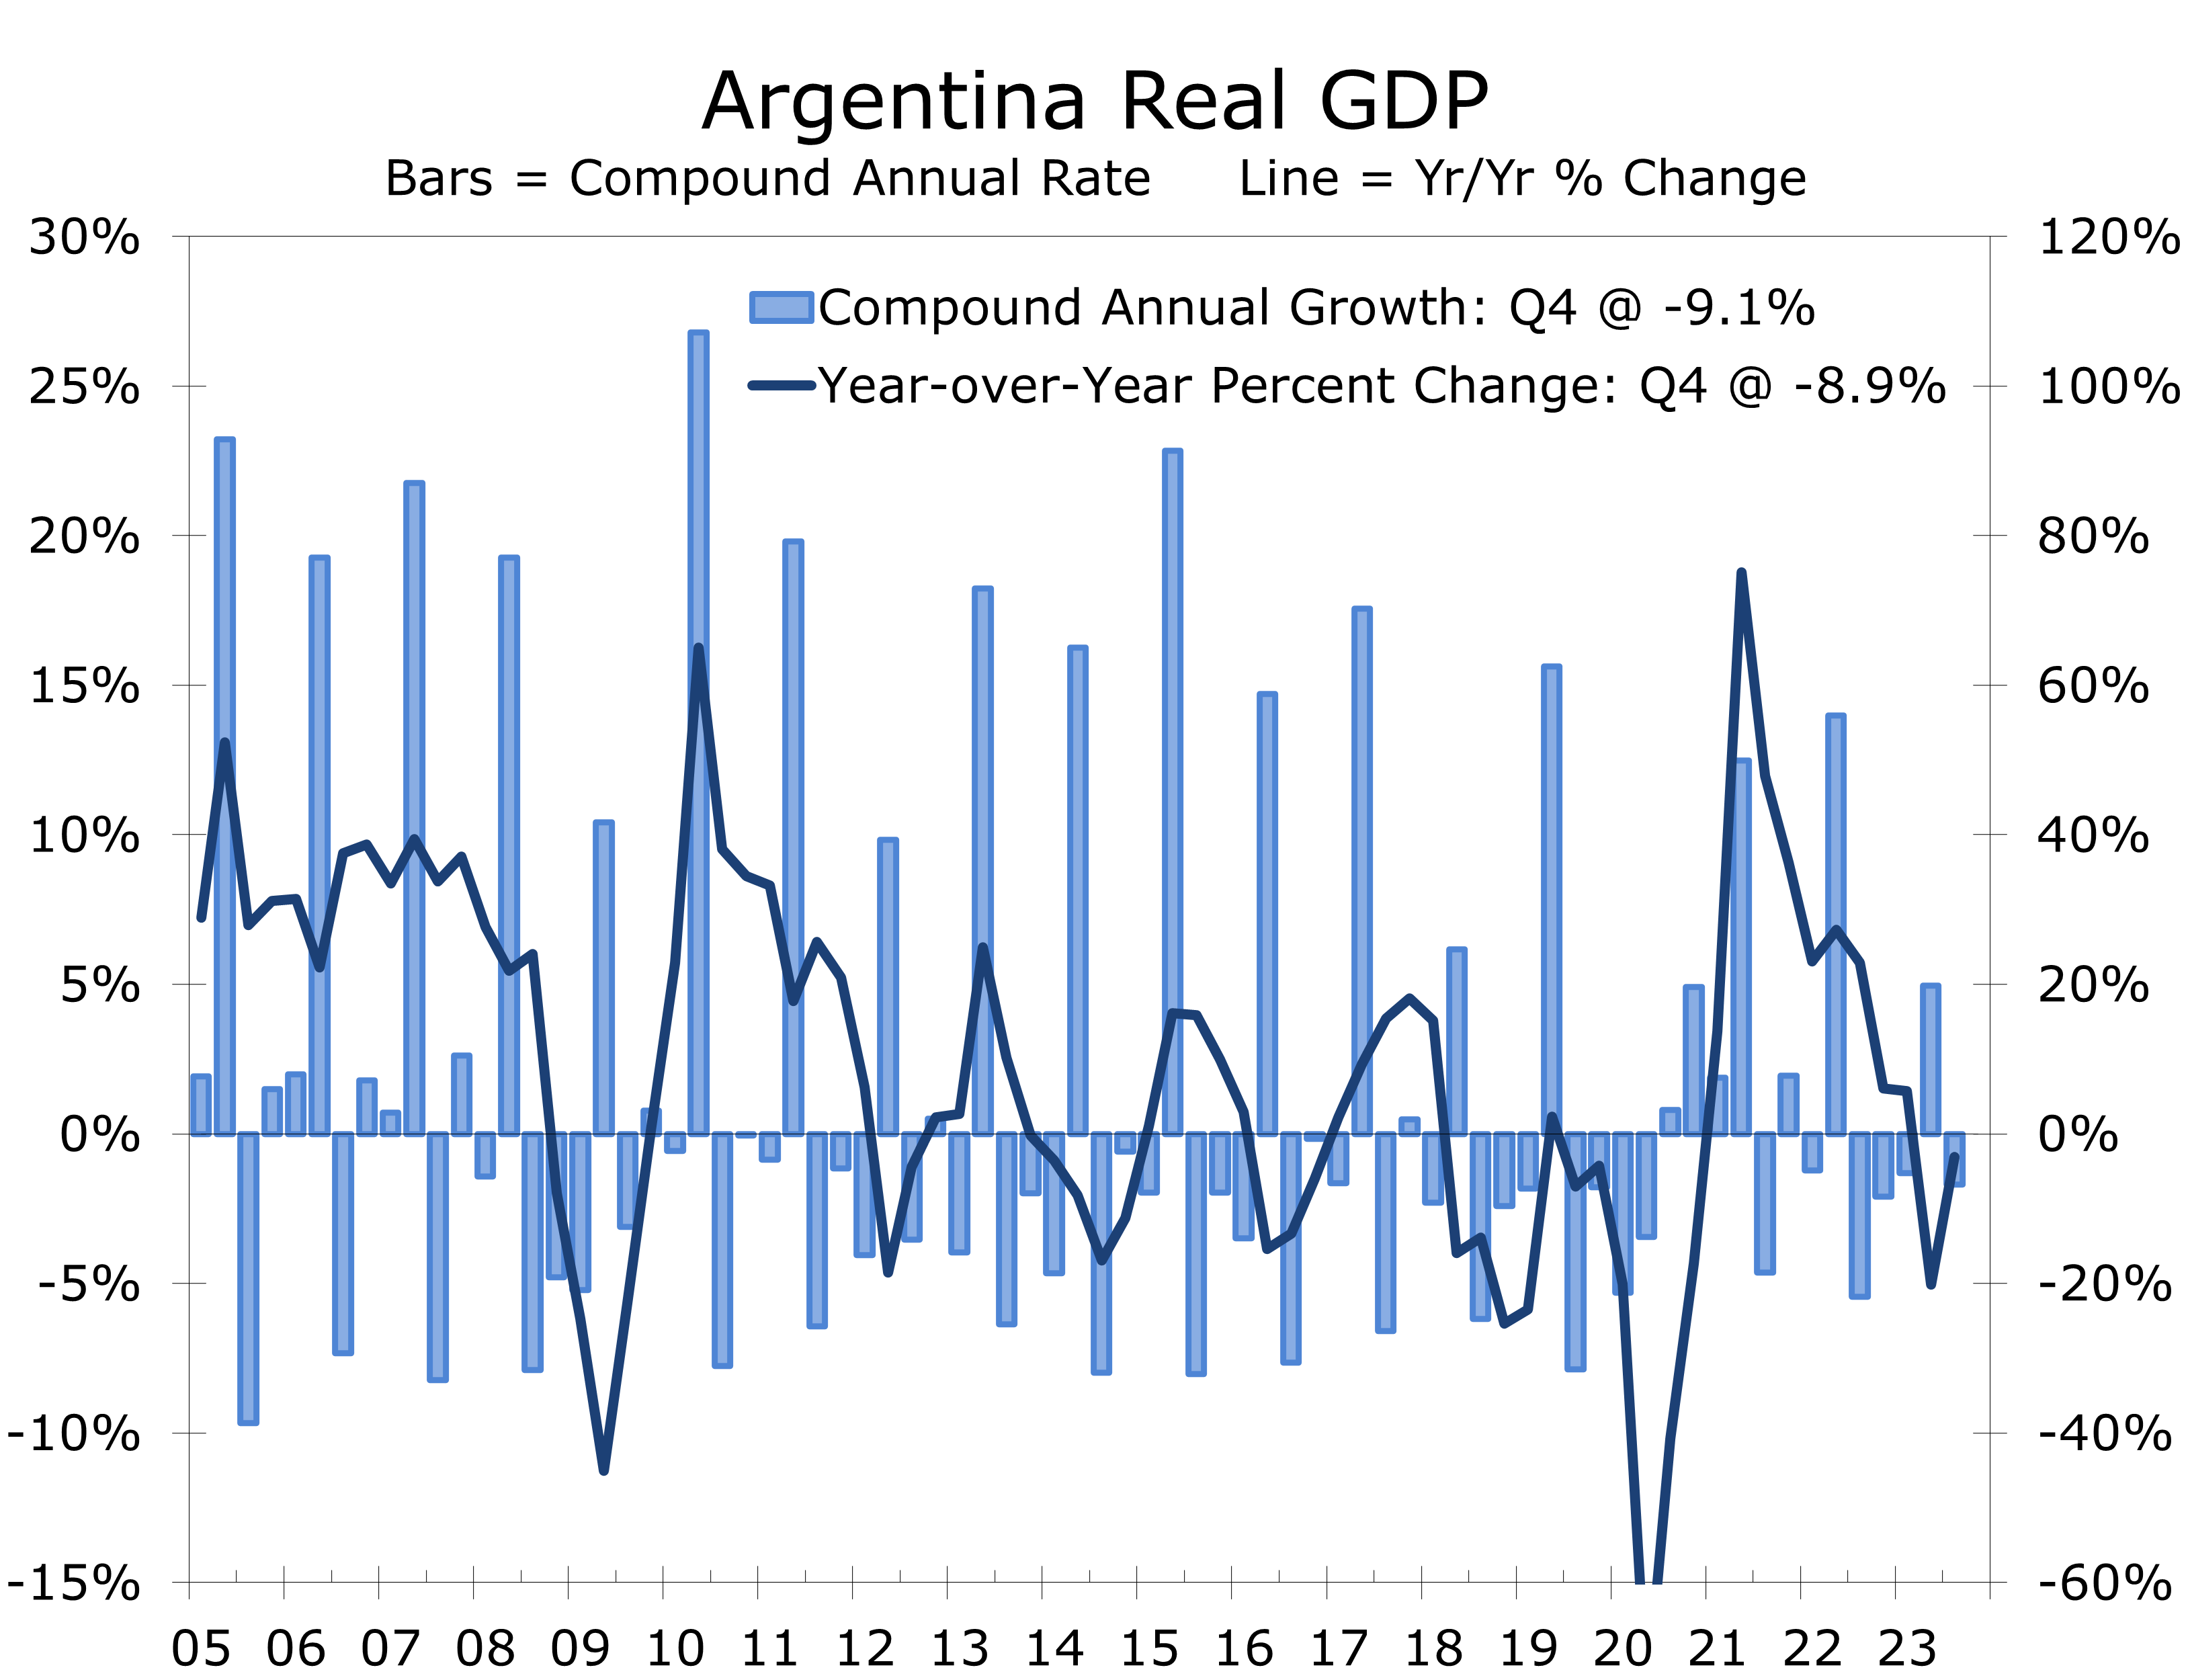
COVID-19 impacted Argentina particularly hard. Its GDP contracted by 10% at the pandemic’s onset. Inflation grew rapidly in 2021 and worsened the following years following the Russian invasion of Ukraine and a domestic drought.[1] Triple-digit inflation, not seen since the late 1980s, returned to Argentina. After decades of economic mismanagement from all factions of the Argentine political class, there was a hunger for drastic change going into the 2023 elections.
Argentina enters a new chapter of history with the election of Javier Milei to the presidency. A libertarian, Milei gained notoriety for his unconventional personal style and forthright opposition to socialism. Amid crippling hyperinflation, Milei champions libertarian proposals including the elimination of government ministries, the deregulation of the economy, and the privatization of state-owned industries. His most radical proposal is the dollarization of the Argentine economy, which entails shutting down the Argentine Central Bank and adopting the US dollar as the primary currency in Argentina.
To outside observers, Javier Milei seemingly came out of nowhere. His Libertarian Party was formed just five years prior to the 2023 elections, and it initially polled far behind the traditional center-right and Peronist parties. When Milei unexpectedly received the most votes during the August primary, he became the favorite to win the presidency virtually overnight.
Milei’s victory was far from guaranteed going into the fall elections. Sergio Massa, a Peronist and the sitting Minister of Economy, won the first round even as inflation neared 140%. Massa’s initial success was credited to waves of income tax cuts enacted in the weeks preceding the election.[2] Milei recovered the momentum after securing key endorsements from the center-right, and he won the November runoff by a convincing eleven-point margin.
[1] Spruk, R. The rise and fall of Argentina. Lat Am Econ Rev 28, 16 (2019). https://doi.org/10.1186/s40503-019-0076-2
[2] https://www.reuters.com/world/americas/how-argentinas-massa-pulled-off-election-upset-with-tax-cuts-bus-fares-2023-10-23/

When Milei took office in December, annual inflation was reported at 161% and four out of ten Argentinians were in poverty. Argentina was $45 billion in debt to the IMF and had a lopsided trade deficit of $43 billion. Milei’s inaugural address highlighted upcoming challenges, emphasizing the financial constraints by stating “there is no money.” He also conveyed that economic conditions would likely deteriorate further before showing signs of improvement.[1]
Milei’s party does not have a majority in the Chamber of Deputies or the Senate. His agenda is therefore limited to what center-right and independent parties within the legislature will support. Milei has already made some concessions by tapping members of President Macri’s Republican Proposal to head certain ministries. He notably selected Luis Caputo, a former president of the central bank and Macri’s Minister of Finance, to head the Ministry of Economy. The move was perceived as a pivot from his more extreme position of closing the central bank.
Despite some concessions to the center, Milei has followed through on key promises. He reduced the number of ministries from nineteen to nine. Several, including the Ministries of Education, Labor, and Culture, were merged into the newly created Ministry of Human Capital. Others like the Ministry of Women, Gender, and Diversity were eliminated entirely. Caputo stated that this move has cut 34% of public sector jobs.
Milei has also begun to reshape Argentine foreign policy. He declined Argentina’s invitation to BRICS, cut ties with Venezuela, Cuba, and Nicaragua, and developed closer relations with Israel. The realignment poses interesting questions for Argentina’s trade policy. Brazil and China are Argentina’s largest trading partners, and Milei harshly criticized the leadership of both countries during his campaign. Brazil’s Luiz Inacio Lula da Silva, or more commonly known as Lula, did not attend Milei’s inauguration.
The first major tests for the Milei administration will occur in the coming weeks. Milei issued Decree 70/2023 shortly after taking office, a sweeping act which overturned more than 300 regulations and removed various subsidies. The decree encompasses labor law liberalization, the repeal of real estate regulations and price controls,(including rent control and tenancy restrictions), and permits contracts in foreign currencies, including cryptocurrency.[2]
[1] https://www.pbs.org/newshour/world/argentinas-newly-sworn-in-president-milei-warns-of-shock-adjustment-to-economy
[2] https://www.cato.org/blog/argentina-one-most-regulated-countries-world?utm_campaign=Cato%20Today&utm_medium=email&_hsmi=287939859&utm_content=287939859&utm_source=hs_email
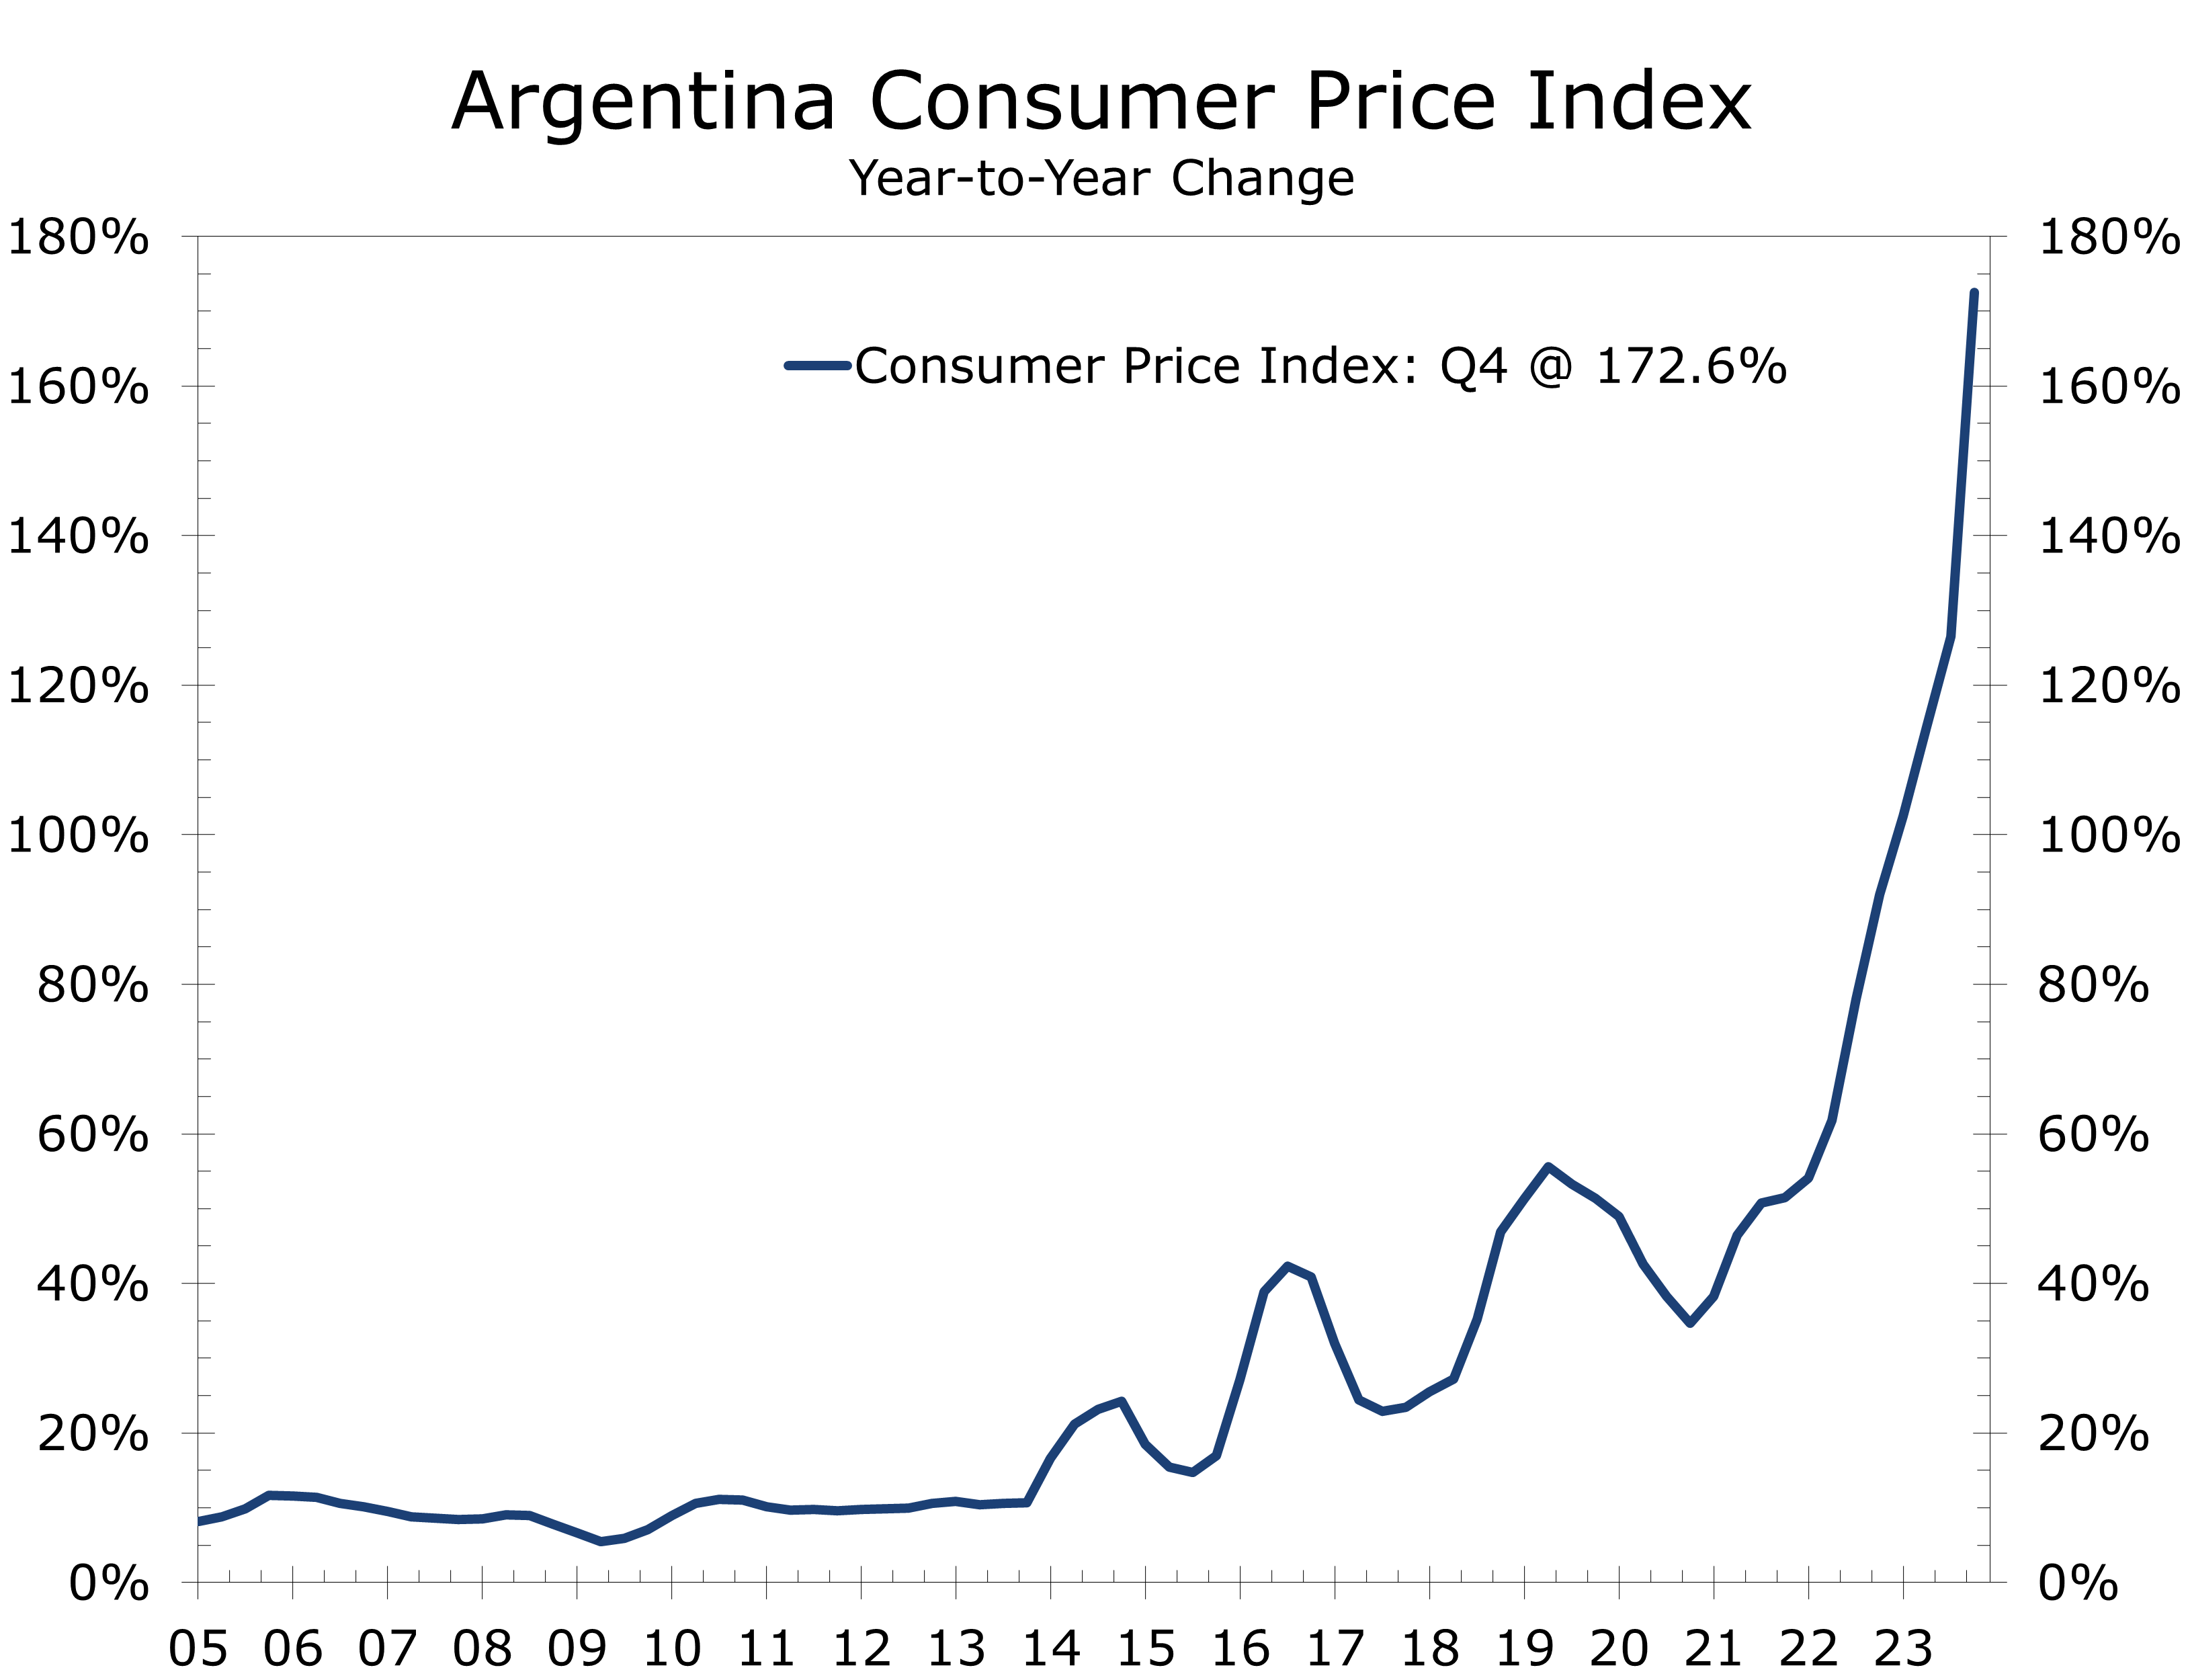
The immediate impact has been excruciating, particularly on Argentina’s middle class. Prices have spiked further, particularly for rents, fuel, and electricity. Though in effect, the decree could be nullified should both chambers of Congress vote to repeal it, there is at least some limited support for enduring the pain in hopes of shifting the economy back to a more sustainable and prosperous trajectory. Peronists have already voiced strong opposition to the decree and labor unions have threatened strikes.
If successful, Decree 70/2023 could pave the way for more ambitious reform, including dollarization, should it survive the scrutiny of Congress. Dollarization would be challenging but not wholly unfeasible. Roughly $200 billion in US dollars are already in circulation throughout Argentina, more than any other country in the world, aside from the U.S.[1] Argentinians have used dollars for significant payments, like real estate purchases, due to the lack of a strong peso. Other Latin American countries like Ecuador and El Salvador have already dollarized, although Argentina would easily be the largest country to do so.
In his inaugural address, Milei emphasized that the Argentine economy will face short-term challenges due to shock therapy. He devalued the peso by over 50% since taking office, pegging it to the dollar at 811:1, with a monthly 2% devaluation anticipated. To complement this, Milei implemented significant spending cuts, including substantial reductions in fuel and transport subsidies.
The IMF has expressed approval of Milei’s economic reforms thus far. Argentina is currently in negotiation with the IMF for a review of its $44 billion debt program, which under the Fernandez administration had neglected. IMF staff and Argentine authorities recently agreed on economic policies to restore stability and get the current program back on track. Pending ongoing policy implementation, the agreement will be presented for approval by the IMF Executive Board in the coming weeks. Upon completion, Argentina would be able to access approximately US$ 4.7 billion (or SDR 3.5 billion), aligning with some rephasing within the program’s scope, which would help cover some immediate funding needs.
[1] https://www.nytimes.com/2023/11/24/world/americas/argentina-economy-peso-dollar-javier-milei.html

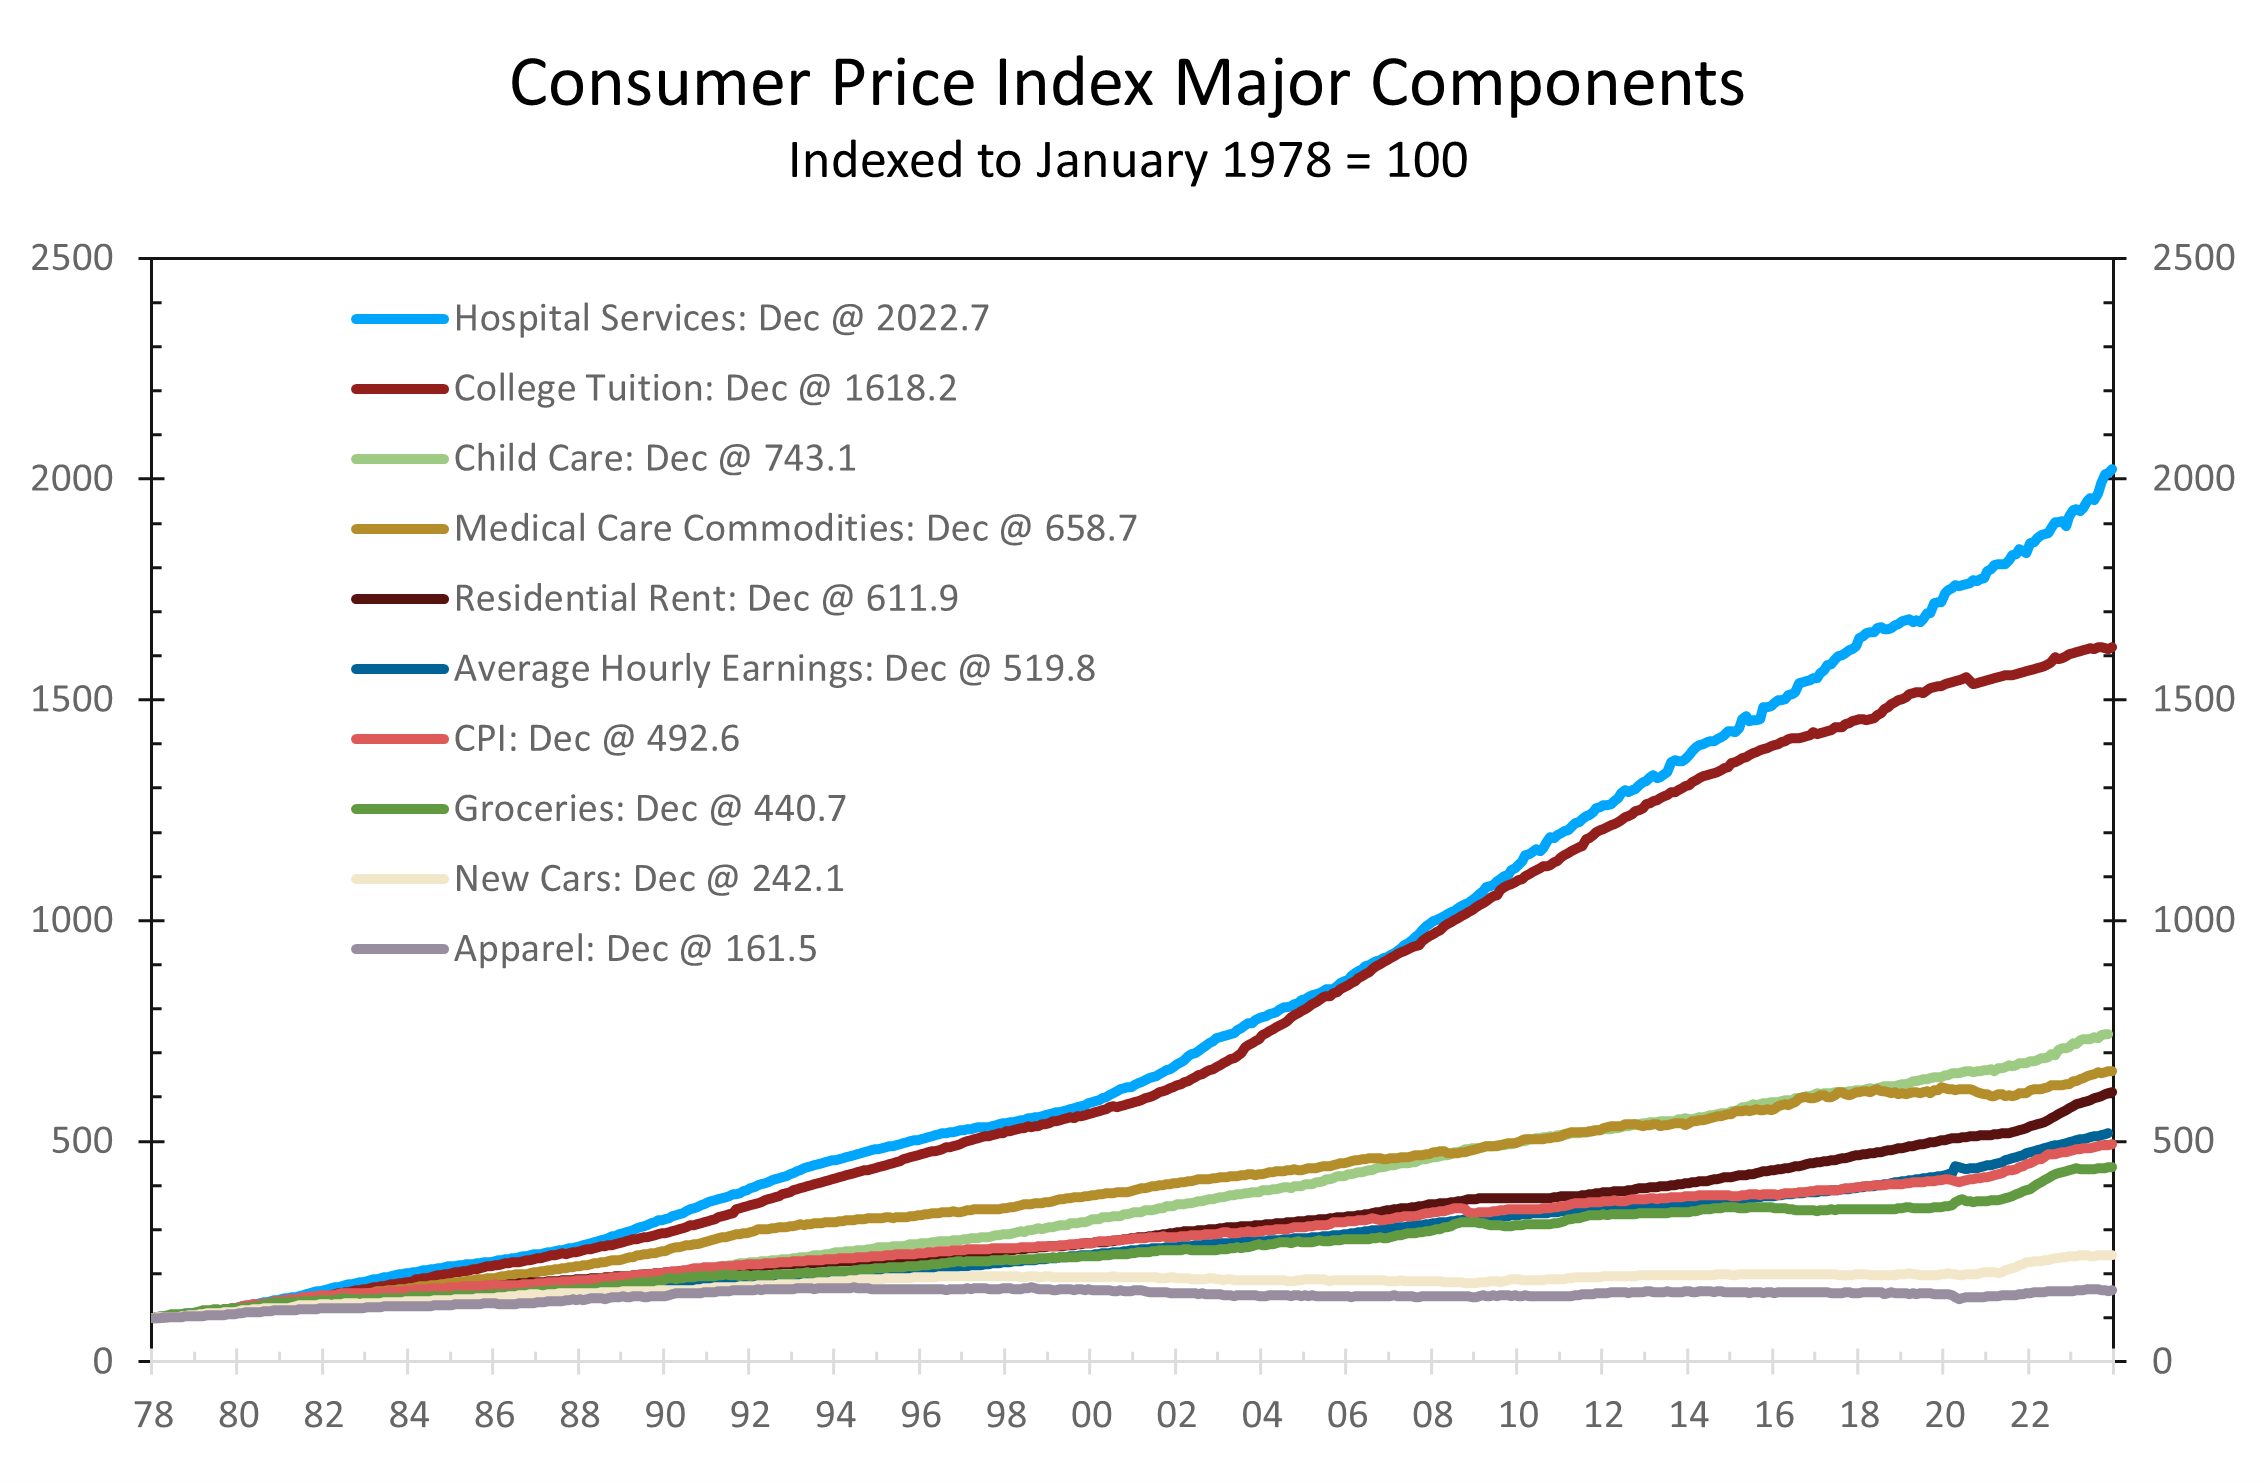
Argentina’s economic travails have often been cited as a cautionary tale for the U.S. The U.S. has experienced persistent budget deficits, coupled with significant growth in the administrative state and entitlement commitments in recent decades. The rapid increase in federal spending, supported by accommodative monetary policies, played a major role in the post-pandemic inflationary spike. Longer term, the expansion of social programs and the administrative state, primarily driven by increased regulations, has contributed to higher inflation. Notably, categories receiving the most government support and intervention have endured the largest price increases over time (health care, higher education, childcare and housing).
One easy way to think about this chart is that every $100 spent on college tuition in January 1978 would cost $1,618.20 today. The basket of goods and services, represented by the Consumer Price Index, rose from 100 in January 1978 to 492.6 currently, meaning that $100 basket of goods and services in 1978 would cost $492.60 today.
One crucial distinction between the U.S. and Argentina is U.S. debt and unfunded liabilities are backed by the full faith and credit of the U.S. Treasury. The dollar and value of U.S. debt are supported by an approximation of the present value of risk-adjusted cash flows from all sources (the theoretical tax base), within the world’s largest economy. Additionally, U.S. debt is denominated in dollars, the world’s reserve currency.

Argentina’s experience may be more instructive for California. The Golden State has lost its luster in recent years, as higher taxes and crushing regulations have sent businesses and residents scurrying to other states, most notably Arizona, Nevada, Texas, and Florida. The outflow is increasingly including many of the state’s wealthier residents, including leading figures from Silicon Valley and Hollywood.
The outflow appears to be taking a toll on the state’s economic performance, which has seen job growth slow and its unemployment rate increase. The outflow is also worsening the state’s fiscal position, as its revenue base narrows further and becomes even more dependent on the tech sector the state’s top earners. Spending has continued to increase, with the state’s generous social benefit programs continuing to expand. The combination has led to an abrupt swing in the Golden State’s fiscal position from a $100 billion surplus in 2022 to a projected $68 billion deficit in 2024.
Unlike Argentina, California must balance its budget and the state is unable to print currency to satisfy is obligations. Persistent budget challenges mean California will constantly be on the lookout for new revenue sources, which will encourage more middle and upper income residents to seek sanctuary in lower tax states.
Disclaimer: This publication has been prepared for informational purposes only and is not intended as a recommendation offer or solicitation with respect to the purchase or sale of any security or other financial product nor does it constitute investment advice.
January 24, 2024
mark.vitner@piedmontcrescentcapital.com
Chief Economist (704) 458-4000
saul.vitner@piedmontcrescentcapital.com
Policy Analyst (704) 458-8570
Economic Growth Once Again Tops Expectations
Economic Growth Once Again Tops Expectations
- Real GDP grew at a 3.3% annual rate in the fourth quarter, easily topping expectations that were centered around a 2% pace.
- While growth topped expectations, inflation came in lower, with the core PCE deflator rising at a 2% annual rate in Q4.
- Q4 growth was solid, with consumer spending rising at a 2.8% pace and business fixed investment climbing at a 1.7% pace.
- Both nonresidential and residential construction rose, climbing at a 3.2% and 1.1% pace, respectively. The gain reflects the large pipeline of projects underway.
- International trade was a major surprise, with a narrowing trade deficit adding 0.4 percentage points to Q4 GDP growth.
- Inventories came in stronger than expected, adding 0.1 percentage point to headline GDP growth.
- Economic growth continues to come in well above expectations, defying an anticipated slowdown indicated by measures like the Leading Economic Index. The unexpected strength is likely due to lingering stimulus and the still historic construction backlog of factories, apartments, and homes.
The economy ended the year on a strong note. Real GDP grew at an impressive 3.3% annual rate during the fourth quarter, easily surpassing market expectations that were centered around 2%. Growth was broad based, with every major component posting gains. The strength remains at odds with other leading and coincident measures of economic activity, including the Leading Economic Index and the ISM surveys.
Consumer spending rose at a 2.8% pace in Q4. Durable goods outlays particularly stood out, surging at a 4.6% annual rate, while nondurables climbed at a 3.4% pace. The strength in durable goods is surprising, considering the lingering effects of the United Auto Workers Strike depressed sales of cars and SUVs. All of the growth in durables came outside the automotive sector.
Spending on nondurable goods was fueled by outlays for pharmaceuticals and might reflect demand for new appetite suppression drugs. Continued growth in travel and leisure and a rebound in health care outlays drove growth in services.
The strength in GDP appears at odds with other key measures of aggregate economic activity.
The Conference Board’s Leading Economic Index has declined for 21 straight months, and both the ISM manufacturing and services surveys for December were weaker than expected. This divergence between these key measures is unusual is one reason why consensus estimates for Q4 GDP were so low.
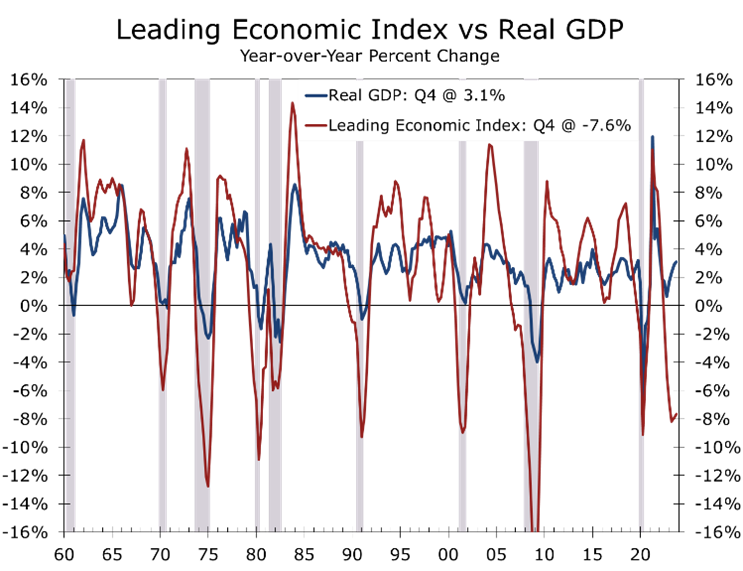
The gap between real GDP growth and other economic indicators likely stems from volatile shifts during the Pandemic. The sudden reopening post-vaccines disrupted supply chains, inflating the Leading Economic Index and ISM surveys. Now that supply chains are normalizing, the decrease in order backlogs and faster deliveries are exaggerating the slowdown.
While growth is moderating, there is still plenty of stimulus in the pipeline. Real GDP grew 3.1% on a fourth quarter to fourth quarter basis, led by a 4.3% spike in government outlays. Most of that was at state and local governments, which continue to benefit from the American Rescue Plan. Hiring at state and local government has also increased, as public schools, universities and municipalities look to replace workers displaced during the pandemic.
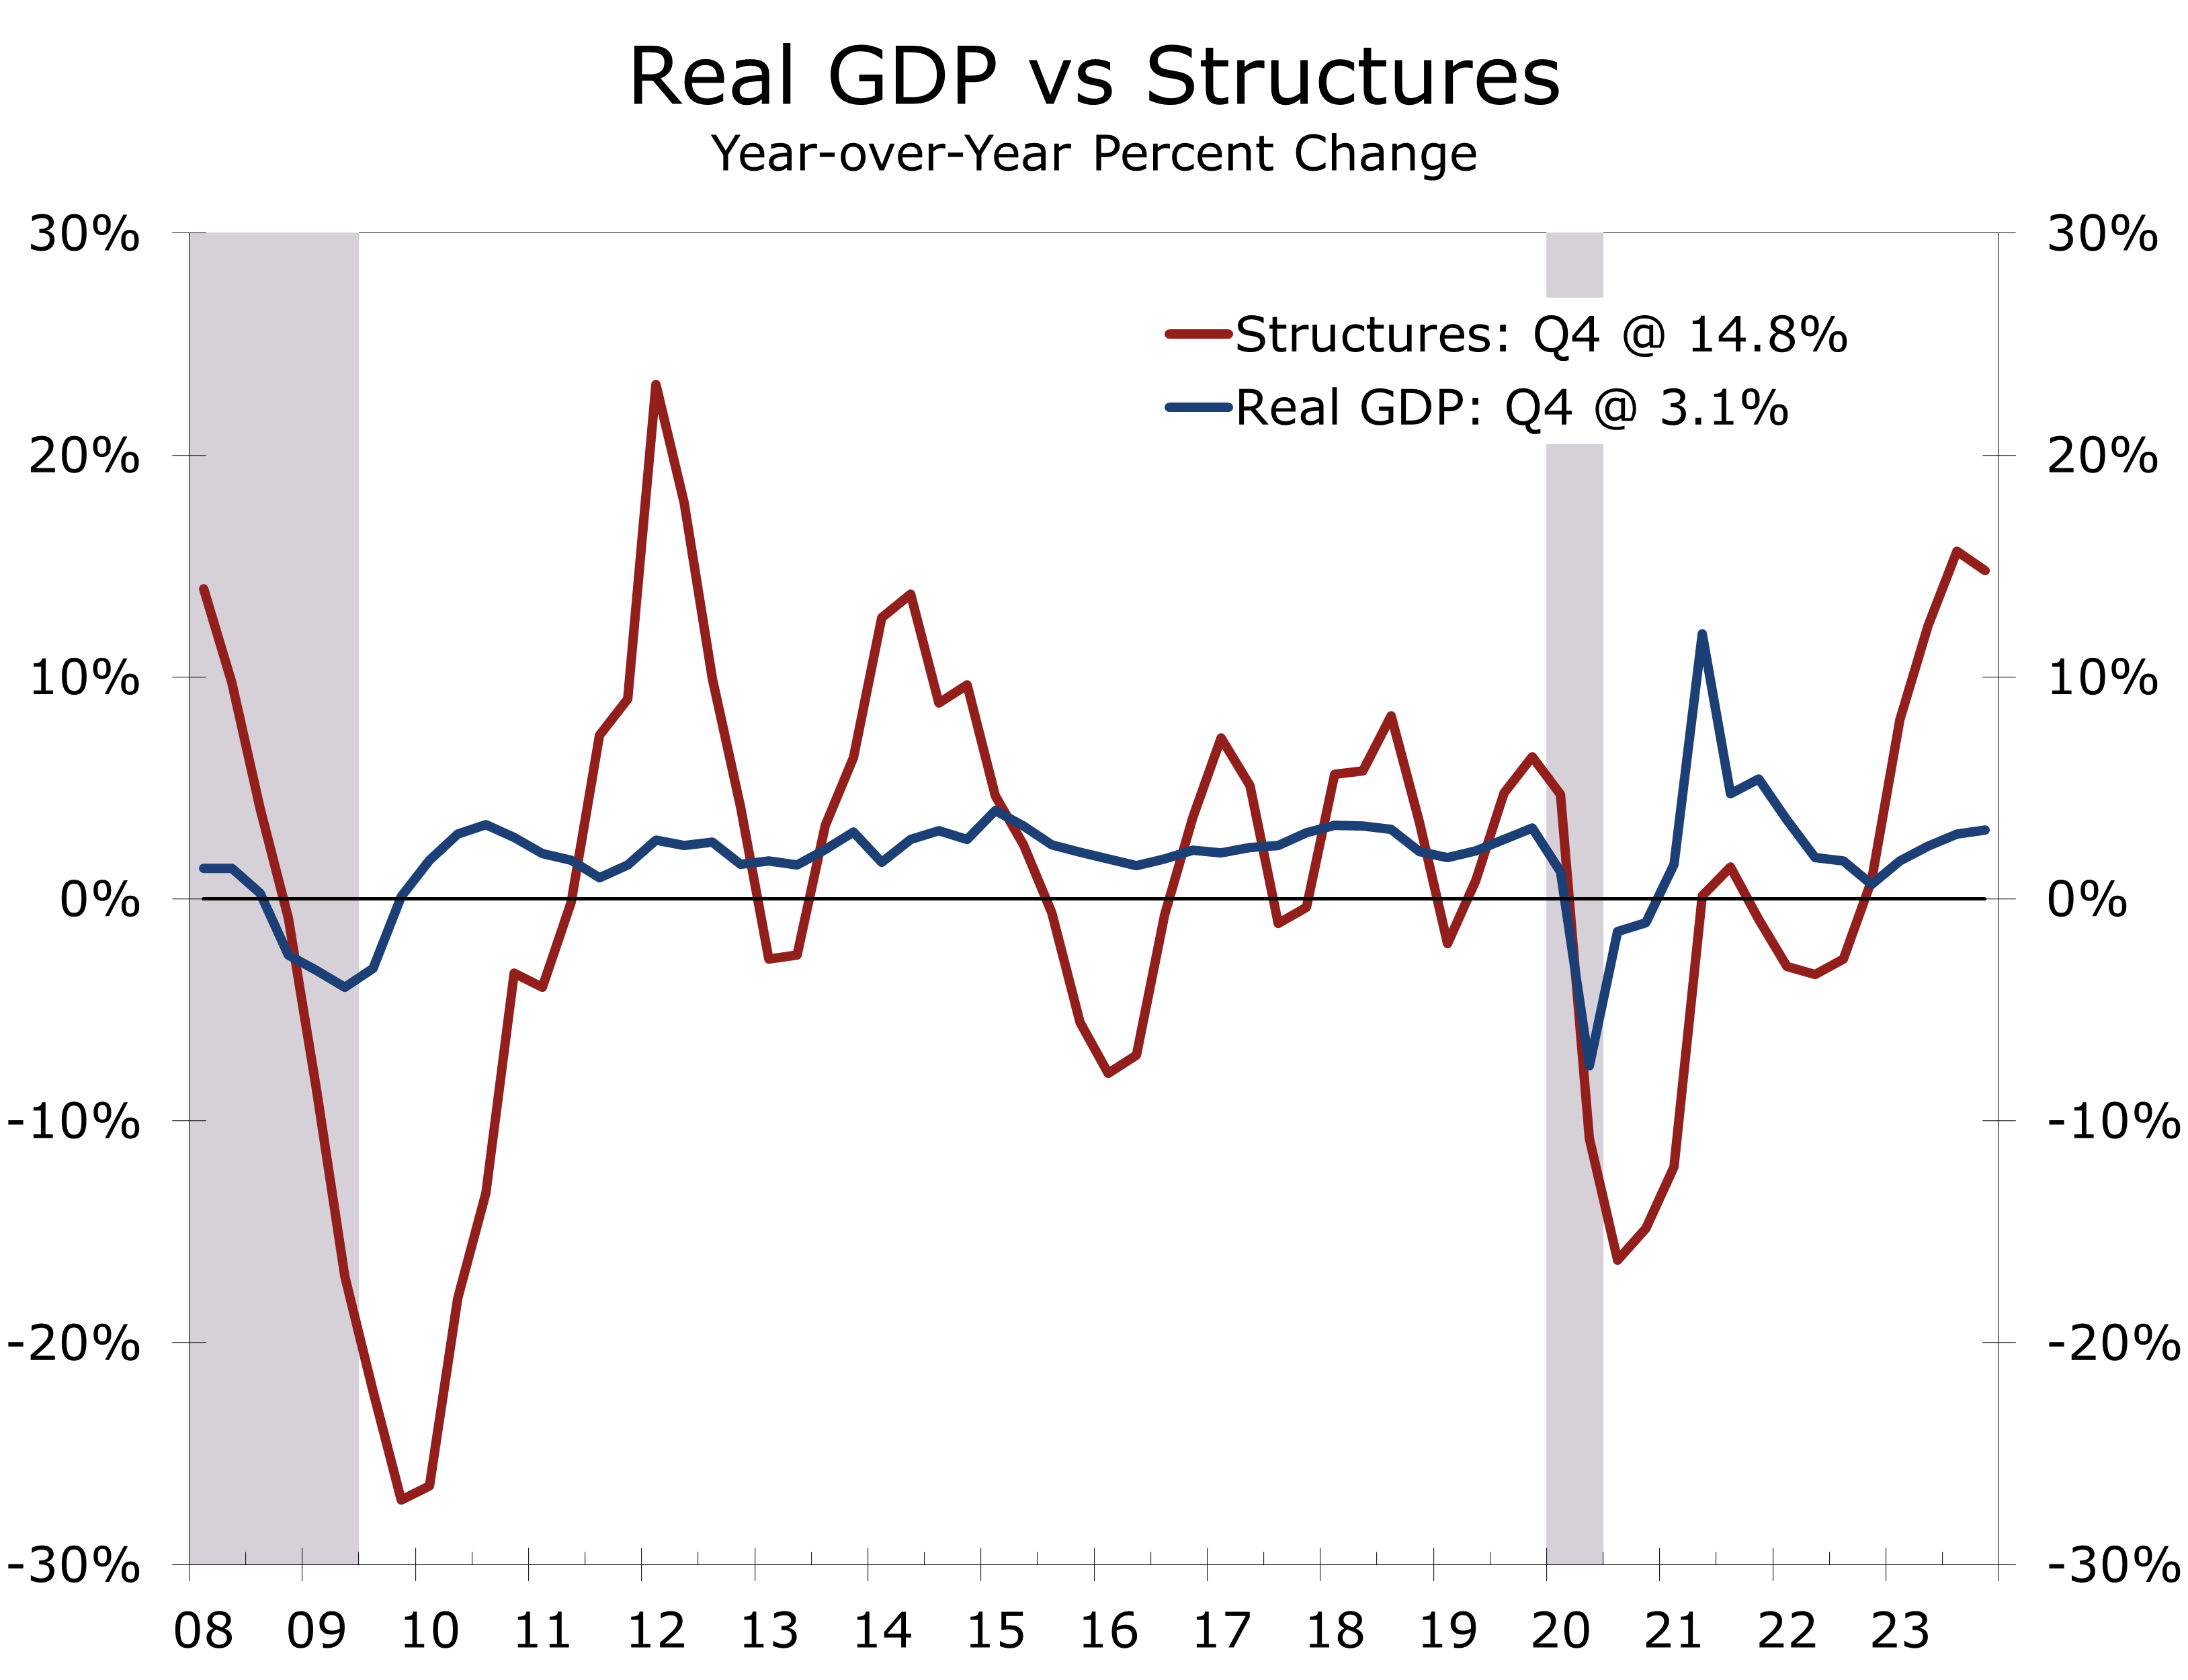
Stimulus is also spurring growth in nonresidential construction, particularly new manufacturing facilities. The Inflation Reduction Act and CHIPS and Science Act are driving construction of EV and microchip plants nationwide, leading to a 14.8% surge in nonresidential structures outlays this past year.
Investment outlays grew at a more modest 1.7% pace in Q4, with the AI boom lifting investment in software and IT equipment. Purchases of transportation equipment were a notable soft spot, reflecting some hangover from the UAW strike as well as last year’s slowdown in transportation and shipping.
International trade and inventories were positive surprises in Q4. The narrower trade gap contributed 0.4 percentage points to growth, fueled by a 6.3% rebound in exports and a 1.9% rise in imports. Given the weakness in global growth, particularly in Europe, Q4 exports might have been bolstered by supply chain issues resulting from the Red Sea shipping disruptions.
Inventories rose slightly in Q4, adding 0.1 percentage point to growth. Inventories were expected to subtract 0.1 percentage point from Q4 growth.
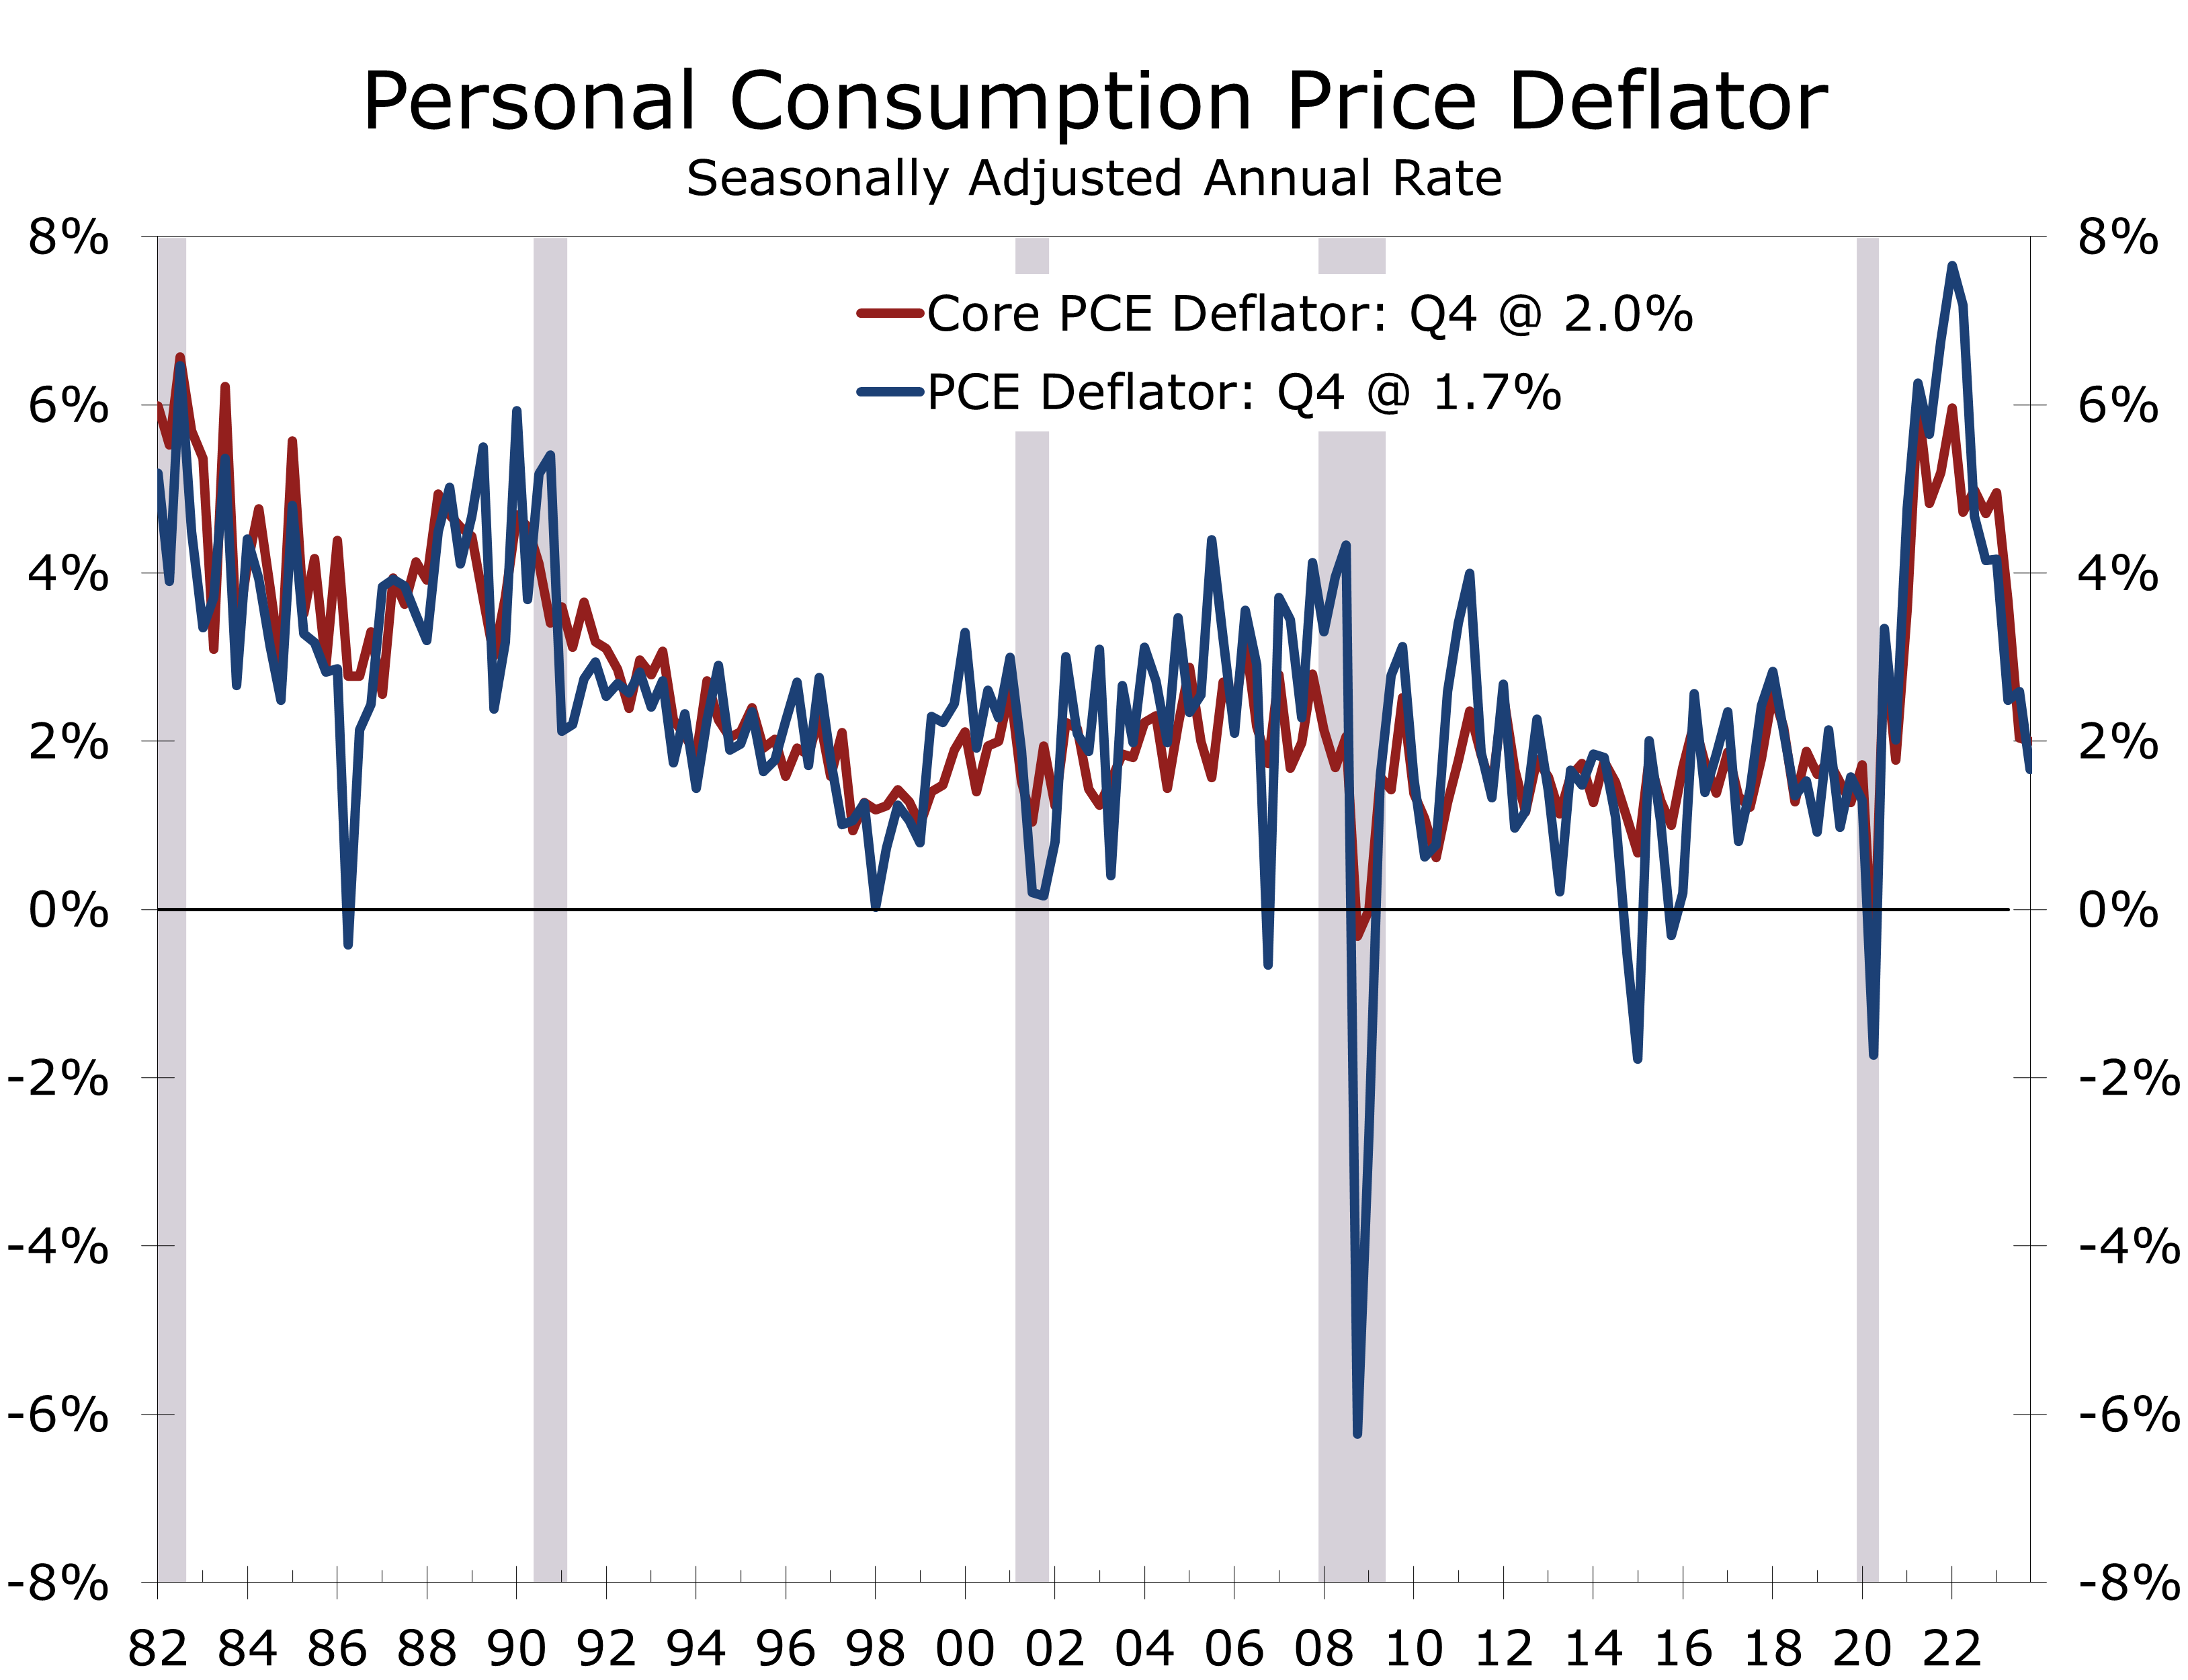
While economic growth exceeded expectations, inflation came in on the low side. The price index for gross domestic purchases rose at a 1.9% annual rate in Q4, down from 2.9% in the prior quarter. The core PCE deflator rose at a 2.0% pace, the same as in Q3. The subdued inflation data more than offset concerns that Q4 economic growth came in ahead of expectations.
Private sales to domestic purchasers, rose at a slightly less robust 2.6% pace in Q4, and rose just 1.8% in 2023, down from 2.3% the prior year. This is the part of the economy monetary policy has the most sway over and the moderation is a big reason inflation cooled off as much as it did this past year.
Disclaimer: This publication has been prepared for informational purposes only and is not intended as a recommendation offer or solicitation with respect to the purchase or sale of any security or other financial product nor does it constitute investment advice.
The Economic Outlook for the Presidential Election Year
The 2024 Election Year Economic Outlook
- Most forecasters now expect the Federal Reserve to pull off a near-perfect soft landing in 2024, with economic growth slowing enough to allow inflation to ease further but not so much as to push unemployment higher. Our outlook remains slightly below the consensus, with economic activity expected to be just a touch softer than a traditional soft landing.
- The primary season is now underway, and the election is on the minds of business leaders, households, and policymakers. Presidential election years are generally thought to be good years for the economy. The record is far from definitive, however, with real GDP just rising 0.1 percentage points faster in presidential election years than its rolling 8-year average. We chose that period as it is roughly equivalent to the prior two presidential terms.
- The economy has had a decisive role in determining who wins or loses presidential elections. Over the past 16 presidential elections, dating back to 1960, the incumbent party has lost 7 of the 8 elections where the economy has grown less than its trailing 8-year average during the year leading up to the election and gone on to win 6 of 8 of the elections where real GDP growth in the year preceding the election was stronger than the previous 8 years. This measure has worked 81.25% of the time
- The current forecast for a soft landing puts the incumbent Biden Administration in a tough spot. If the economy achieves a soft landing, growth will trail its trailing 8-year average, signaling a likely loss. If growth comes in stronger than a soft landing, inflation will likely re-accelerate.
- We continue to look for real GDP growth to be just a touch softer than a soft landing, which should allow inflation to continue to decelerate and give the Fed the green light to cut interest rates. We also examine some traditional election year benchmarks, including the Misery Index, Real After-Tax Income Per Person, and Consumer Confidence.
The primary season is now underway, setting the stage for another critical presidential election year that captures the attention of business leaders, households, and policymakers alike. Traditionally, presidential election years are perceived as pivotal moments for the economy. Upon closer examination, however, the relationship between economic growth and election cycles is more nuanced.
Real GDP, our best measure of aggregate economic growth, has risen a modest increase of just 0.1 percentage points faster in presidential election years compared to its rolling 8-year average dating back to 1960. This marginal difference challenges the commonly held belief that election years are significantly more prosperous for the economy, as incumbents pull out all the stops via tax cuts, increased spending, or promised handouts.
Rather than bolstering economic performance, incumbent presidents and their political parties are likely to be at the mercy of the economy’s most recent performance. Over the past 16 presidential elections, incumbent parties have typically struggled when real GDP grew less than its trailing 8-year average leading up to the election, resulting in losses in 7 out of 8 those instances. Conversely, when election-year economic growth outpaces the previous 8 years, the incumbent party has won 6 out of 8 times. This straightforward measure has been correct 81.25% of the time.
As the presidential election year progresses, the relationship between economic performance and political outcomes will take center stage. The delicate balance between economic growth, inflation, and key economic benchmarks such as the Misery Index, Real After-Tax Income Per Person, and Consumer Confidence will shape the election season’s narrative, influencing voters, business decisions, and policy choices. This issue of the CAVU Compass will briefly review these key concepts in the context of our latest economic forecast.
Real GDP is the most comprehensive measure of aggregate economic well-being. It quantifies the volume of goods and services produced by measuring aggregate purchases of finished goods and services on a net basis, encompassing consumers, businesses, governments, and international purchasers. Real GDP has risen 2.9% over the past year, primarily due to surprisingly strong growth in the third quarter of last year. The first look at Q4 GDP comes on January 25 and is expected to show growth decelerated to a 2.1% pace. We anticipate further
moderation this year, with real GDP rising at a 1.6% pace on a fourth-quarter to fourth-quarter basis.
The current consensus is the U.S. economy will narrowly avoid a recession this year. The latest Wall Street Journal Economic Forecast Survey has real GDP growing just 1% in 2024. Job growth is expected to slow further and the unemployment rate edge higher from its current 3.7% to 4.3%. Inflation is expected to slow to 2.3% by yearend. The Survey calls for the Fed to cut interest rates three or four times beginning sometime in the first half of the year. Thirty-nine percent of economists expect the economy to fall into recession in 2024, down from 48% in October and 61% one year ago.
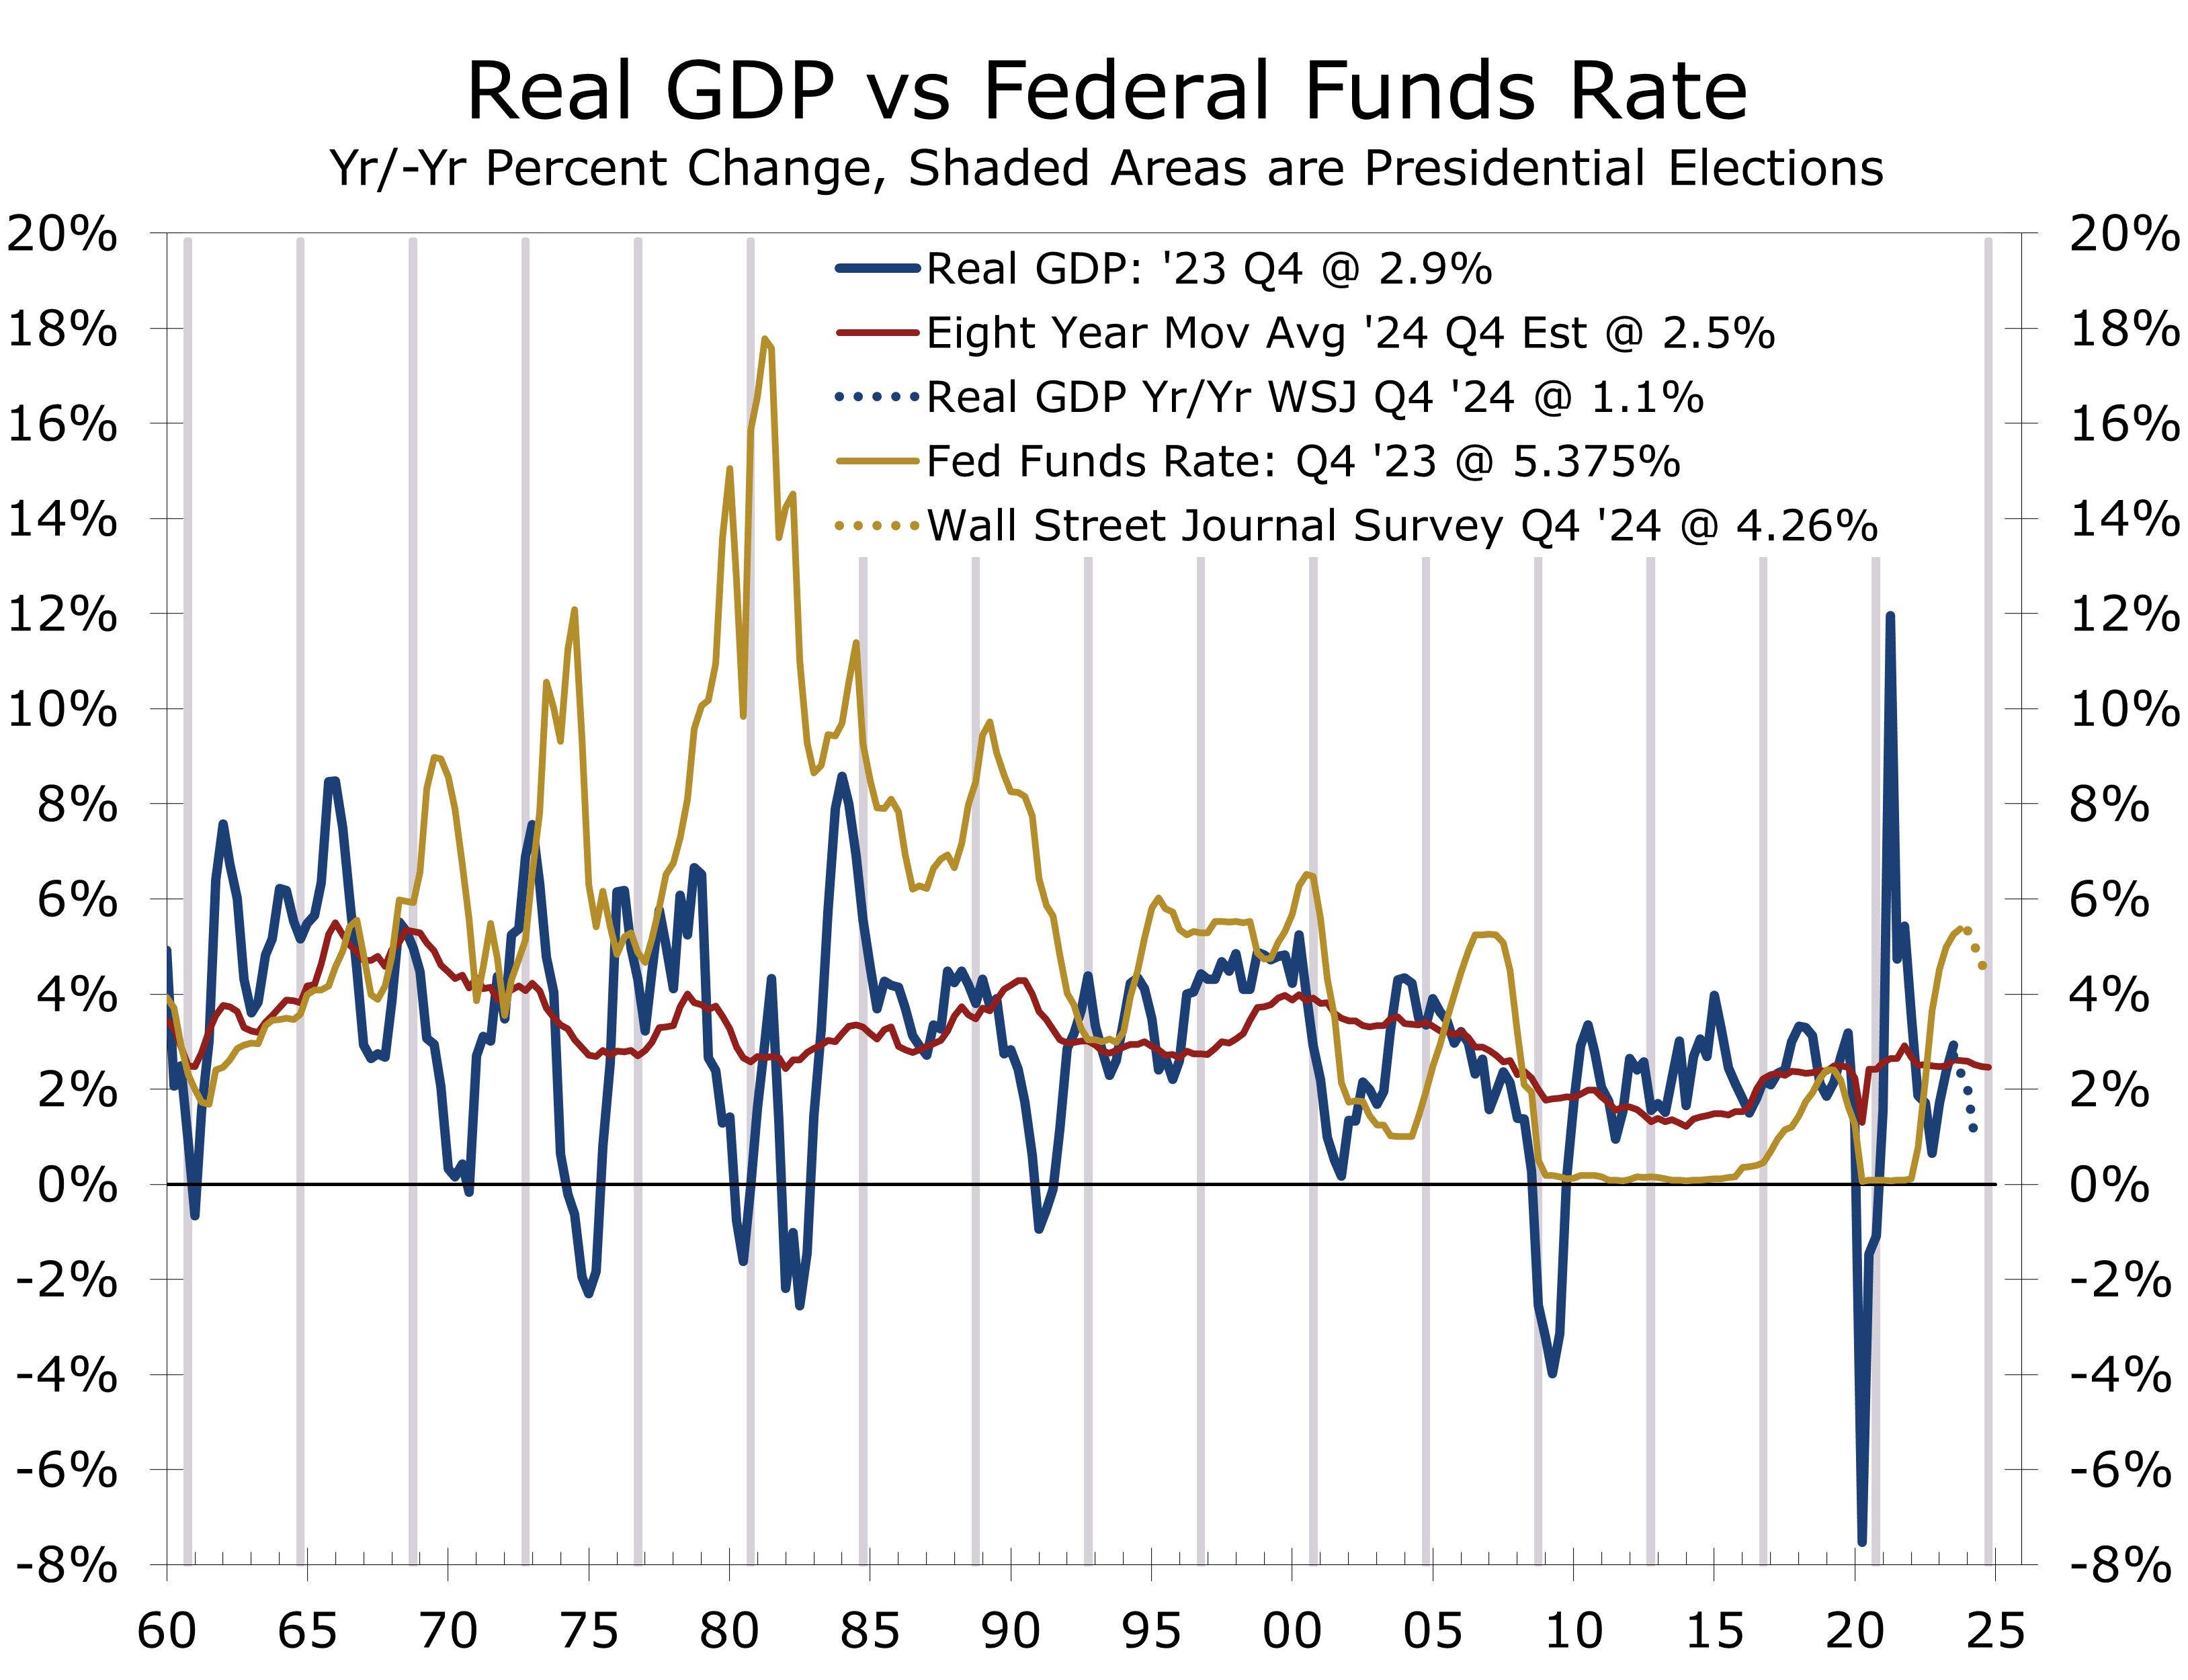
The soft landing scenario envisioned by the majority of economists will likely have an impact on the presidential election. Voters tend to vote with their wallets and incumbents have typically run into trouble when the economy is struggling. The consensus calls for real GDP to rise just 1% during the year leading up to the election. Such a result would yield growth 1.5 percentage points slower than real GDP growth has averaged over the past 8 years. That gap is significantly larger than the 0.9 percentage point gap averaged in the 9 elections since 1960 where incumbent party candidates lost and is one of the largest deviations, excluding recession years.
Our own forecast is a little more optimistic than the Wall Street Journal consensus even though we continue to look for the economy to be just a touch softer than a traditional soft landing. We look for real GDP to rise 1.7 percent from the fourth quarter of 2023 to the fourth quarter of 2024 and look for nonfarm employment growth to decelerate to a pace that produces a net gain of 110,000 jobs per month. Such an outcome would produce a slightly smaller gap (0.8 percentage points weaker) between economic growth in the year leading up to the presidential election than has been averaged in the 9 elections when the incumbent party. By contrast, winning incumbents have on average enjoyed economic growth that was 1.2 percentage points stronger in the year leading up to the presidential election than in the preceding eight years.
Comparing economic growth to its recent average is a bit more complicated today due to the extreme volatility in most measures of economic growth surrounding the pandemic, as well as the burst in economic activity that followed three successive rounds of direct stimulus payments to households and businesses. The economy has a great deal of stimulus in the pipeline, including the Inflation Reduction Act, the Bipartisan Infrastructure Act, the CHIPS and Science Act, and the Rescue and Recovery Act.
Fiscal policy was often used to boost growth ahead of presidential elections. The onslaught of stimulus following the pandemic has bloated the federal budget deficit, however, and will likely make it more difficult to provide additional fiscal stimulus this year. The budget deficit is expected to decline slightly this year, but slower economic growth will likely reduce tax receipts, while increased defense and security needs will pull spending higher. We look for the federal budget deficit to remain around its current 1.8 trillion this fiscal year.

While the persistence of large budget deficits and periodic showdowns over continuing to fund the deficit generate a lot of headlines, the budget deficit itself has historically not been a major driver of election outcomes. The persistence of large budget deficits is not expected to have much of a direct influence on the 2024 election, although it will make it more difficult for policymakers to prime the pump before the election and might also exert some upward pressure on long-term interest rates.
One of the most popular measures of economic well-being during election years is the Misery Index. The Misery Index, created by economist Arthur Okun, is a simple measure that combines the inflation rate and unemployment rate to gauge the overall economic well-being of a country. Okun, who was an economic advisor to President Kennedy, introduced the concept in the 1960s to provide a straightforward assessment of the economic conditions affecting the average citizen. The index is calculated by adding the inflation rate, calculated from the 12-month change in the CPI, to the unemployment rate, providing a quick synopsis of economic conditions that is easy to compare over time.
The trend in the Misery Index has historically been more predictive than the absolute level. The index improved during the Kennedy Administration, which came into office during a time of stagflation, falling from 7.5% when Kennedy was elected in 1960 to 6.1%. Nearly all the improvement came from a reduction in the unemployment rate, which fell from 6.1% to 4.8%. The inflation rate fell from 1.4% to 1.3% during this period.
The Misery Index performance during the Kennedy Administration is instructive on how the inflation-unemployment tradeoff plays out in Democrat and Republican administrations. Successful democratic administrations have mostly focused on reducing unemployment, while republican administrations have seen more success in reducing inflation. The index rose during the Johnson Administration, climbing from 6.1% when Lyndon Johnson was elected to 8.1% in November 1960, when his successor Hubert Humphrey lost to Richard Nixon. All of the increase came from higher inflation. The unemployment rate actually declined.
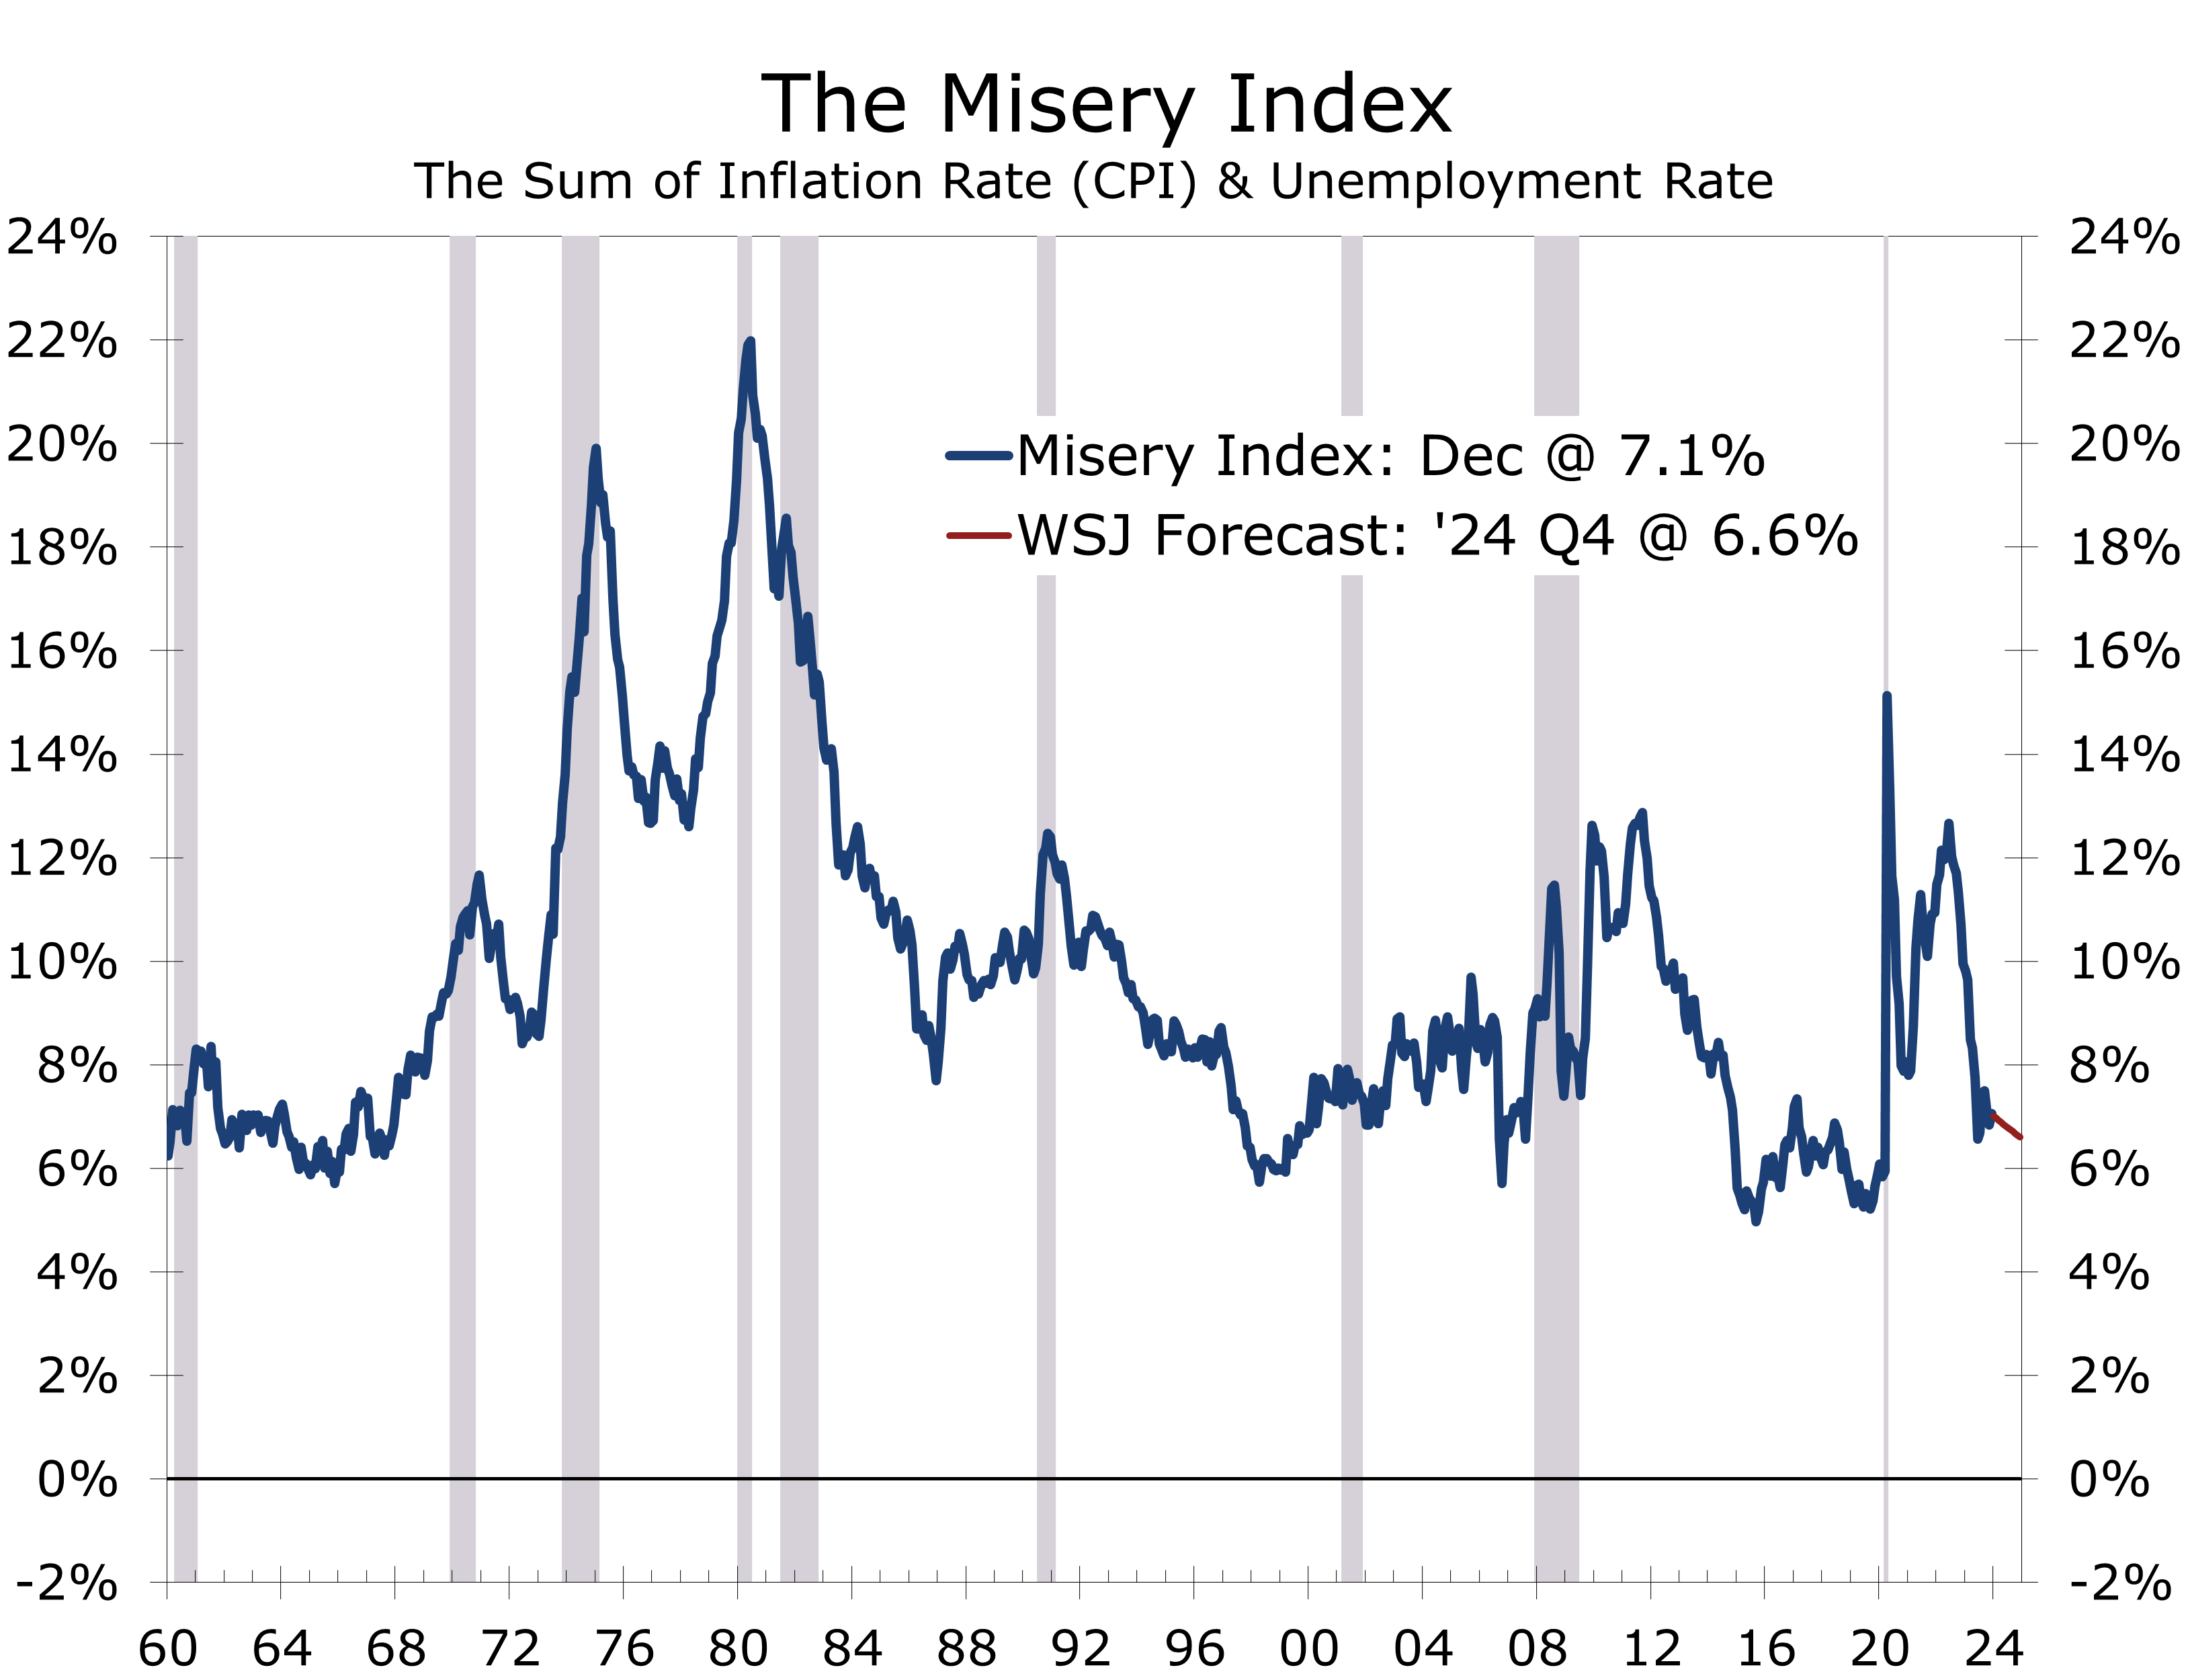
The Misery Index gained prominence in the 1970s when stagflation emerged as a major economic problem. However, the index is far from perfect in predicting a presidential winner. Nixon secured a historic landslide re-election in 1972, despite a 0.9 percentage point rise in the Misery Index, solely attributable to a higher unemployment rate. Inflation slightly decreased during Nixon’s first term.
Gerald Ford assumed the presidency after the Watergate Scandal led to Nixon’s resignation in August 1974. Ford inherited an economy grappling with both rising inflation and increasing unemployment.
Ford placed significant emphasis on combating inflation, introducing a program called Whip Inflation Now (WIN). Although inflation did decrease during his short presidency, the Misery Index still concluded his term 3.7 percentage points higher than when Nixon was re-elected in 1972 and 4.5 points higher than when Nixon was initially elected in 1968.
Jimmy Carter was quick to point out how much the Misery Index had risen in his successful bid for the White House in 1976. Unfortunately, containing inflation proved exceedingly difficult during Carter’s presidency, which saw the inflation rate rise by 7.8 percentage points to 12.6% in November 1980. The unemployment rate actually fell by 0.3 percentage points during Carter’s term but remained high at 7.5% on Election Day 1980. Reagan won the presidency in a historic landslide and famously reminded voters to ask themselves if they were better off now than they were four years ago? The Misery Index improved significantly under Reagan, mostly due to sharply lower inflation, and he was handily re-elected in 1984.
The Misery Index improved further during Reagan’s second term, paving the way for George Bush to win the presidency in 1988. However, the Misery worsened under his presidency, being 3 percentage points higher when he lost his re-election bid to Bill Clinton in 1992, with the entire increase attributed to a higher unemployment rate. The Misery Index improved during Clinton’s first term, leading to his easy re-election. The Index has been less instructive in every presidential election since, however, as a lower Misery Index failed to provide enough of a boost to secure victory for Al Gore against George W. Bush. Additionally, slight improvements or worsening in the Misery Index have incorrectly predicted every election since.
One reason why the Misery Index has lost some of its luster in recent elections is that inflation was consistently low from the mid-1990s to the pandemic, shifting more attention to the unemployment rate and
other issues. Of course, inflation spiked following the pandemic, and while it has been moderating recently, prices for groceries, housing, entertainment, and travel remain well above pre-pandemic levels. This may explain why such a small share of consumers currently rank current economic conditions as good.
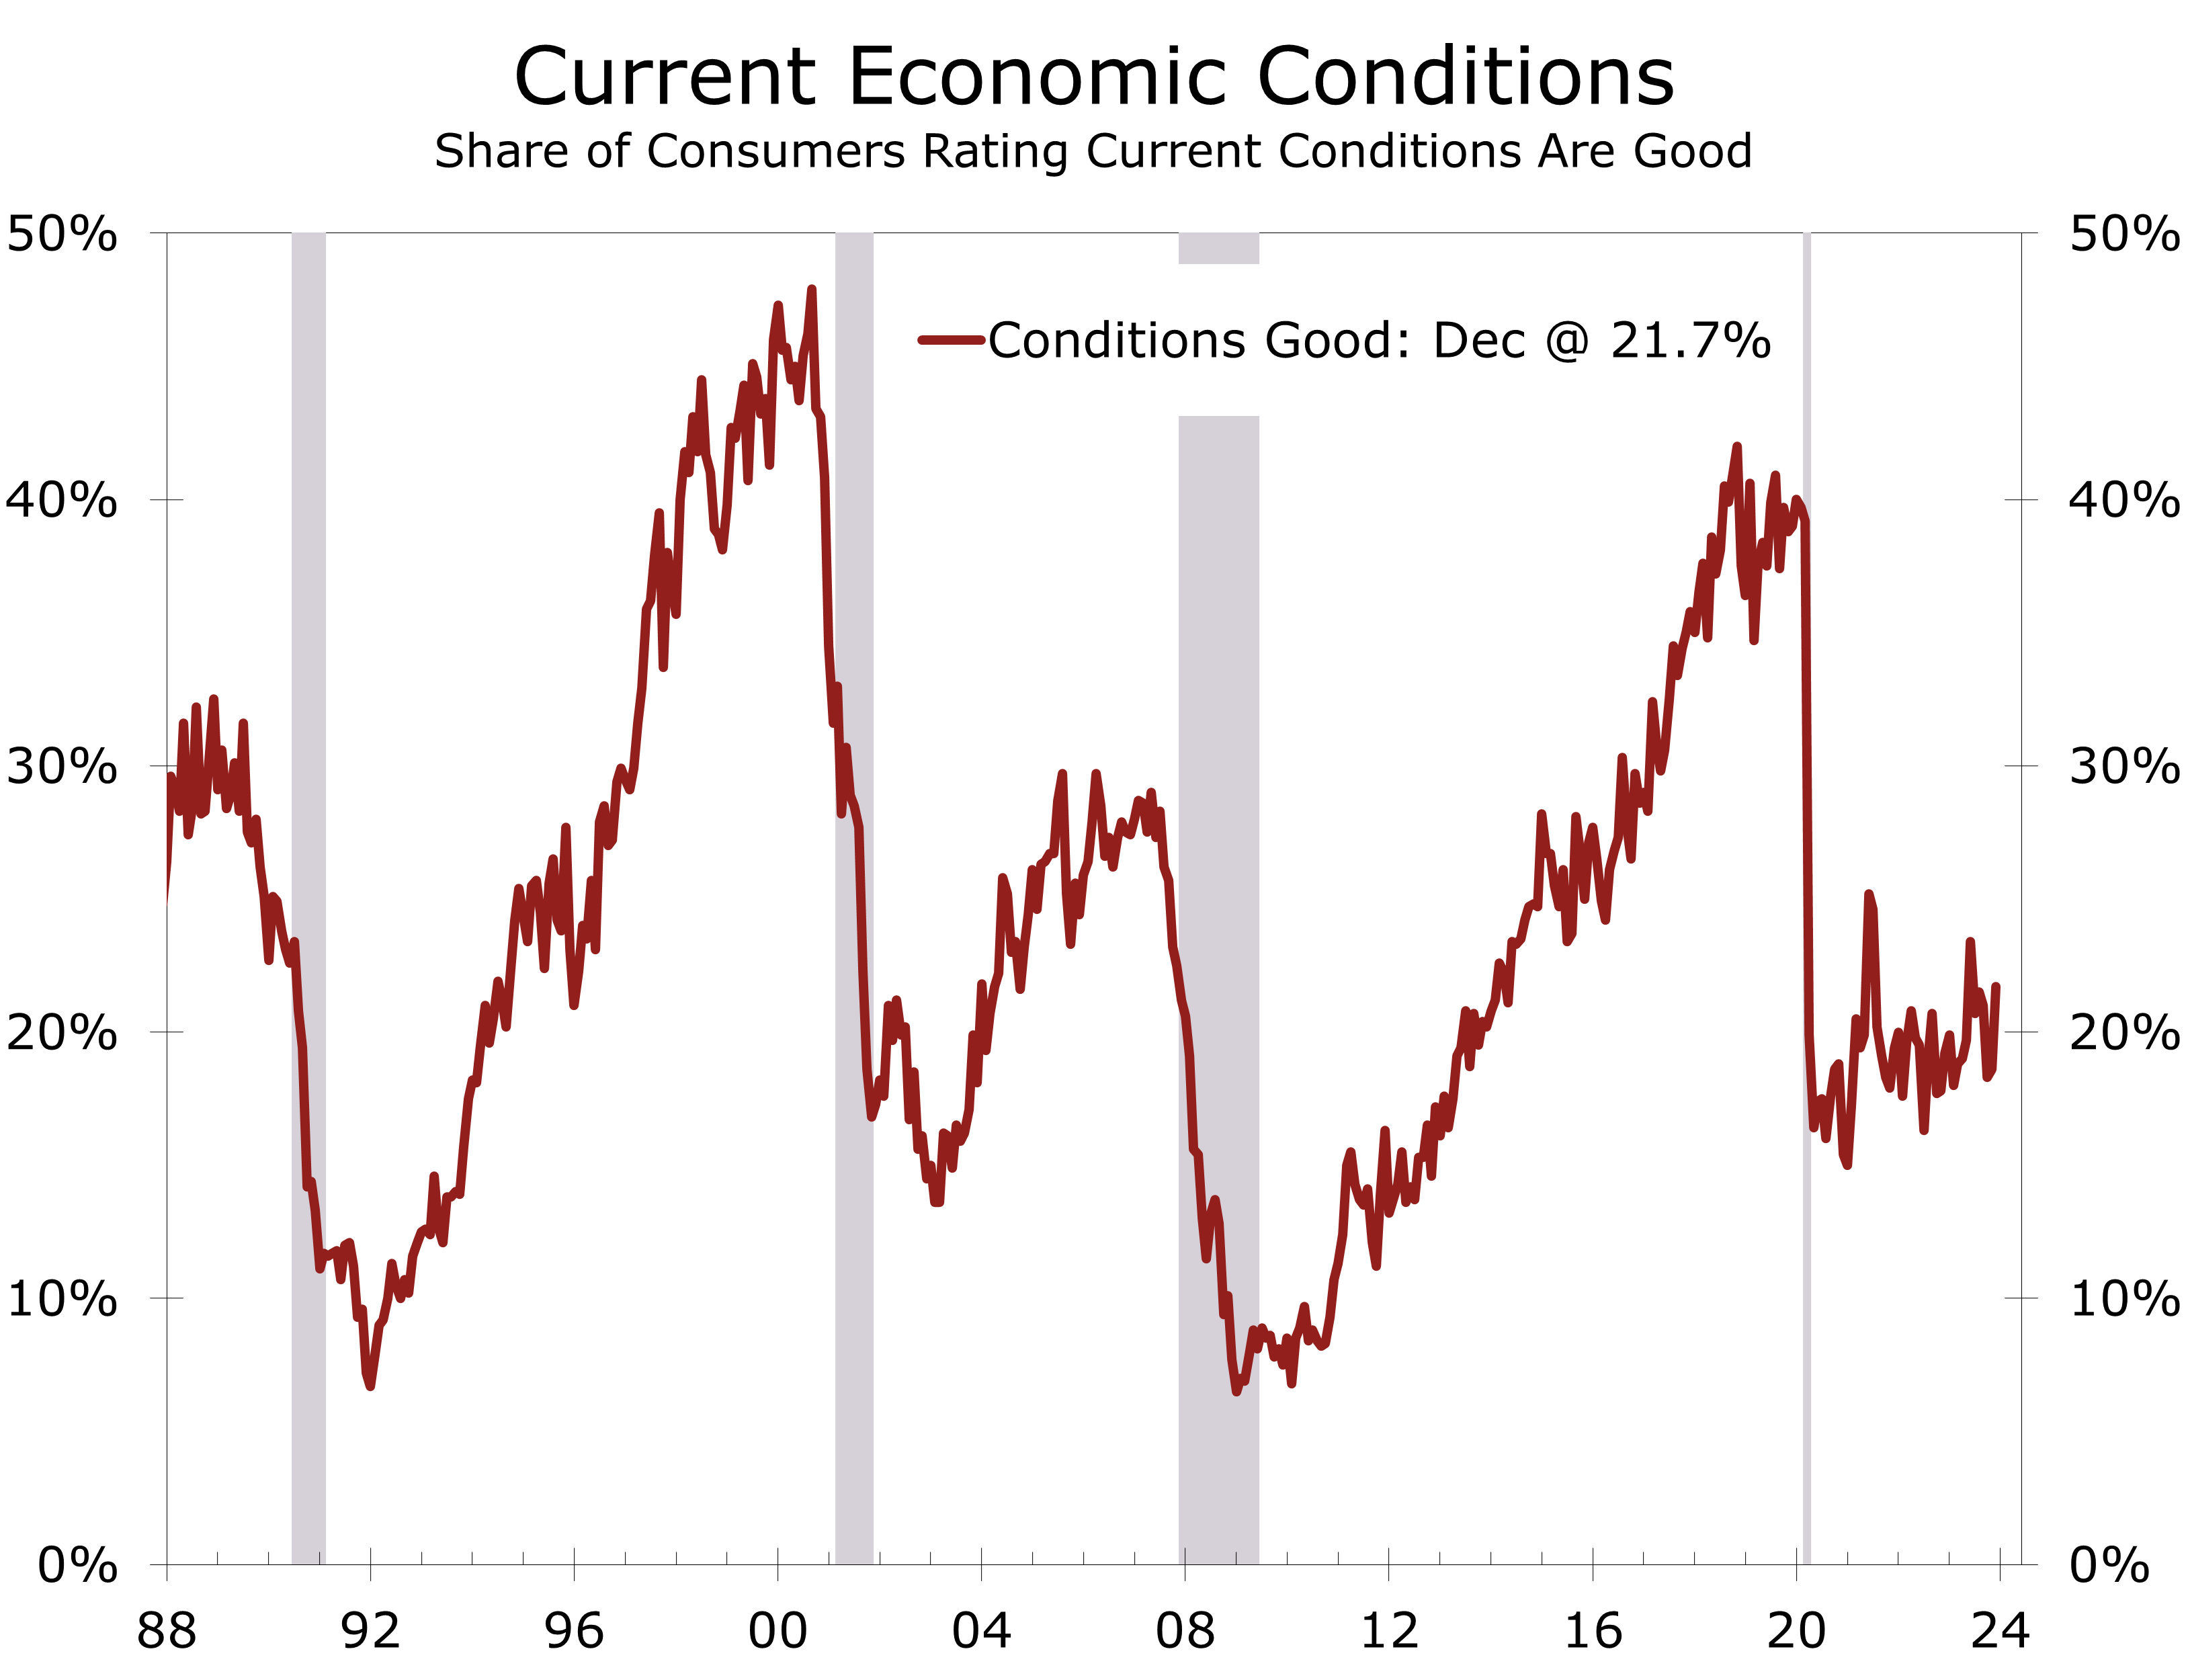
Another reliable measure of economic well-being that has correctly predicted the outcome of 10 of the past 16 presidential elections since 1960 is real after-tax income per person, which is also sometimes referred to as take-home pay minus inflation. The critical level in real per capita disposable income growth is 1.5% in the year preceding the presidential election. When take-home pay per person, minus inflation, rises by 1.5% or more in the year leading up to the presidential election, the incumbent or the person representing the party currently occupying the White House is almost always reelected.
Real after-tax disposable income is better than simply observing the change in the Misery Index and correctly projected Hillary Clinton would lose to Donald Trump in 2016. This measure has had some notable exceptions. Despite a 3.5% growth in real per capita disposable income in the year leading up to the 1968 election, Humphrey lost to Nixon, indicating economic factors alone did not secure victory. Humphrey’s defeat was likely fueled by the nation’s growing frustration with the Vietnam War, underscoring the influence of broader social and political issues on electoral outcomes.
Ford also experienced strong income gains in the year leading up to his 1976 reelection battle, with real take-home pay per capita rising by a solid 2.3%. Despite this economic boost, Ford lost, as simmering anger over the Watergate scandal overwhelmed the modest improvement in the economy. Similarly, Gore’s loss to George W. Bush was likely influenced by some residual anger over the Monica Lewinsky affair and the subsequent impeachment of Bill Clinton. More recently, Trump’s narrow victory over Hillary Clinton in 2016 was likely fueled by lingering angst about the frustratingly slow recovery from the Global Financial Crisis.
The 2020 election miss is beyond the scope of this report. While real take-home pay per person surged by 4.3% in the year preceding the election, the year was marred by the COVID-19 Pandemic and massive relief efforts to contain the resulting economic damage. The income series has been unusually volatile since the pandemic due to repeated stimulus programs. The 3.5% increase over the past year would appear to be good news for Joe Biden, but growth has slowed more recently, with real take-home pay falling at a 0.3% annual rate in the most recent quarter. With economic growth slowing, we expect real take-home pay to rise very close to the 1.5% threshold needed for incumbents to be reelected.
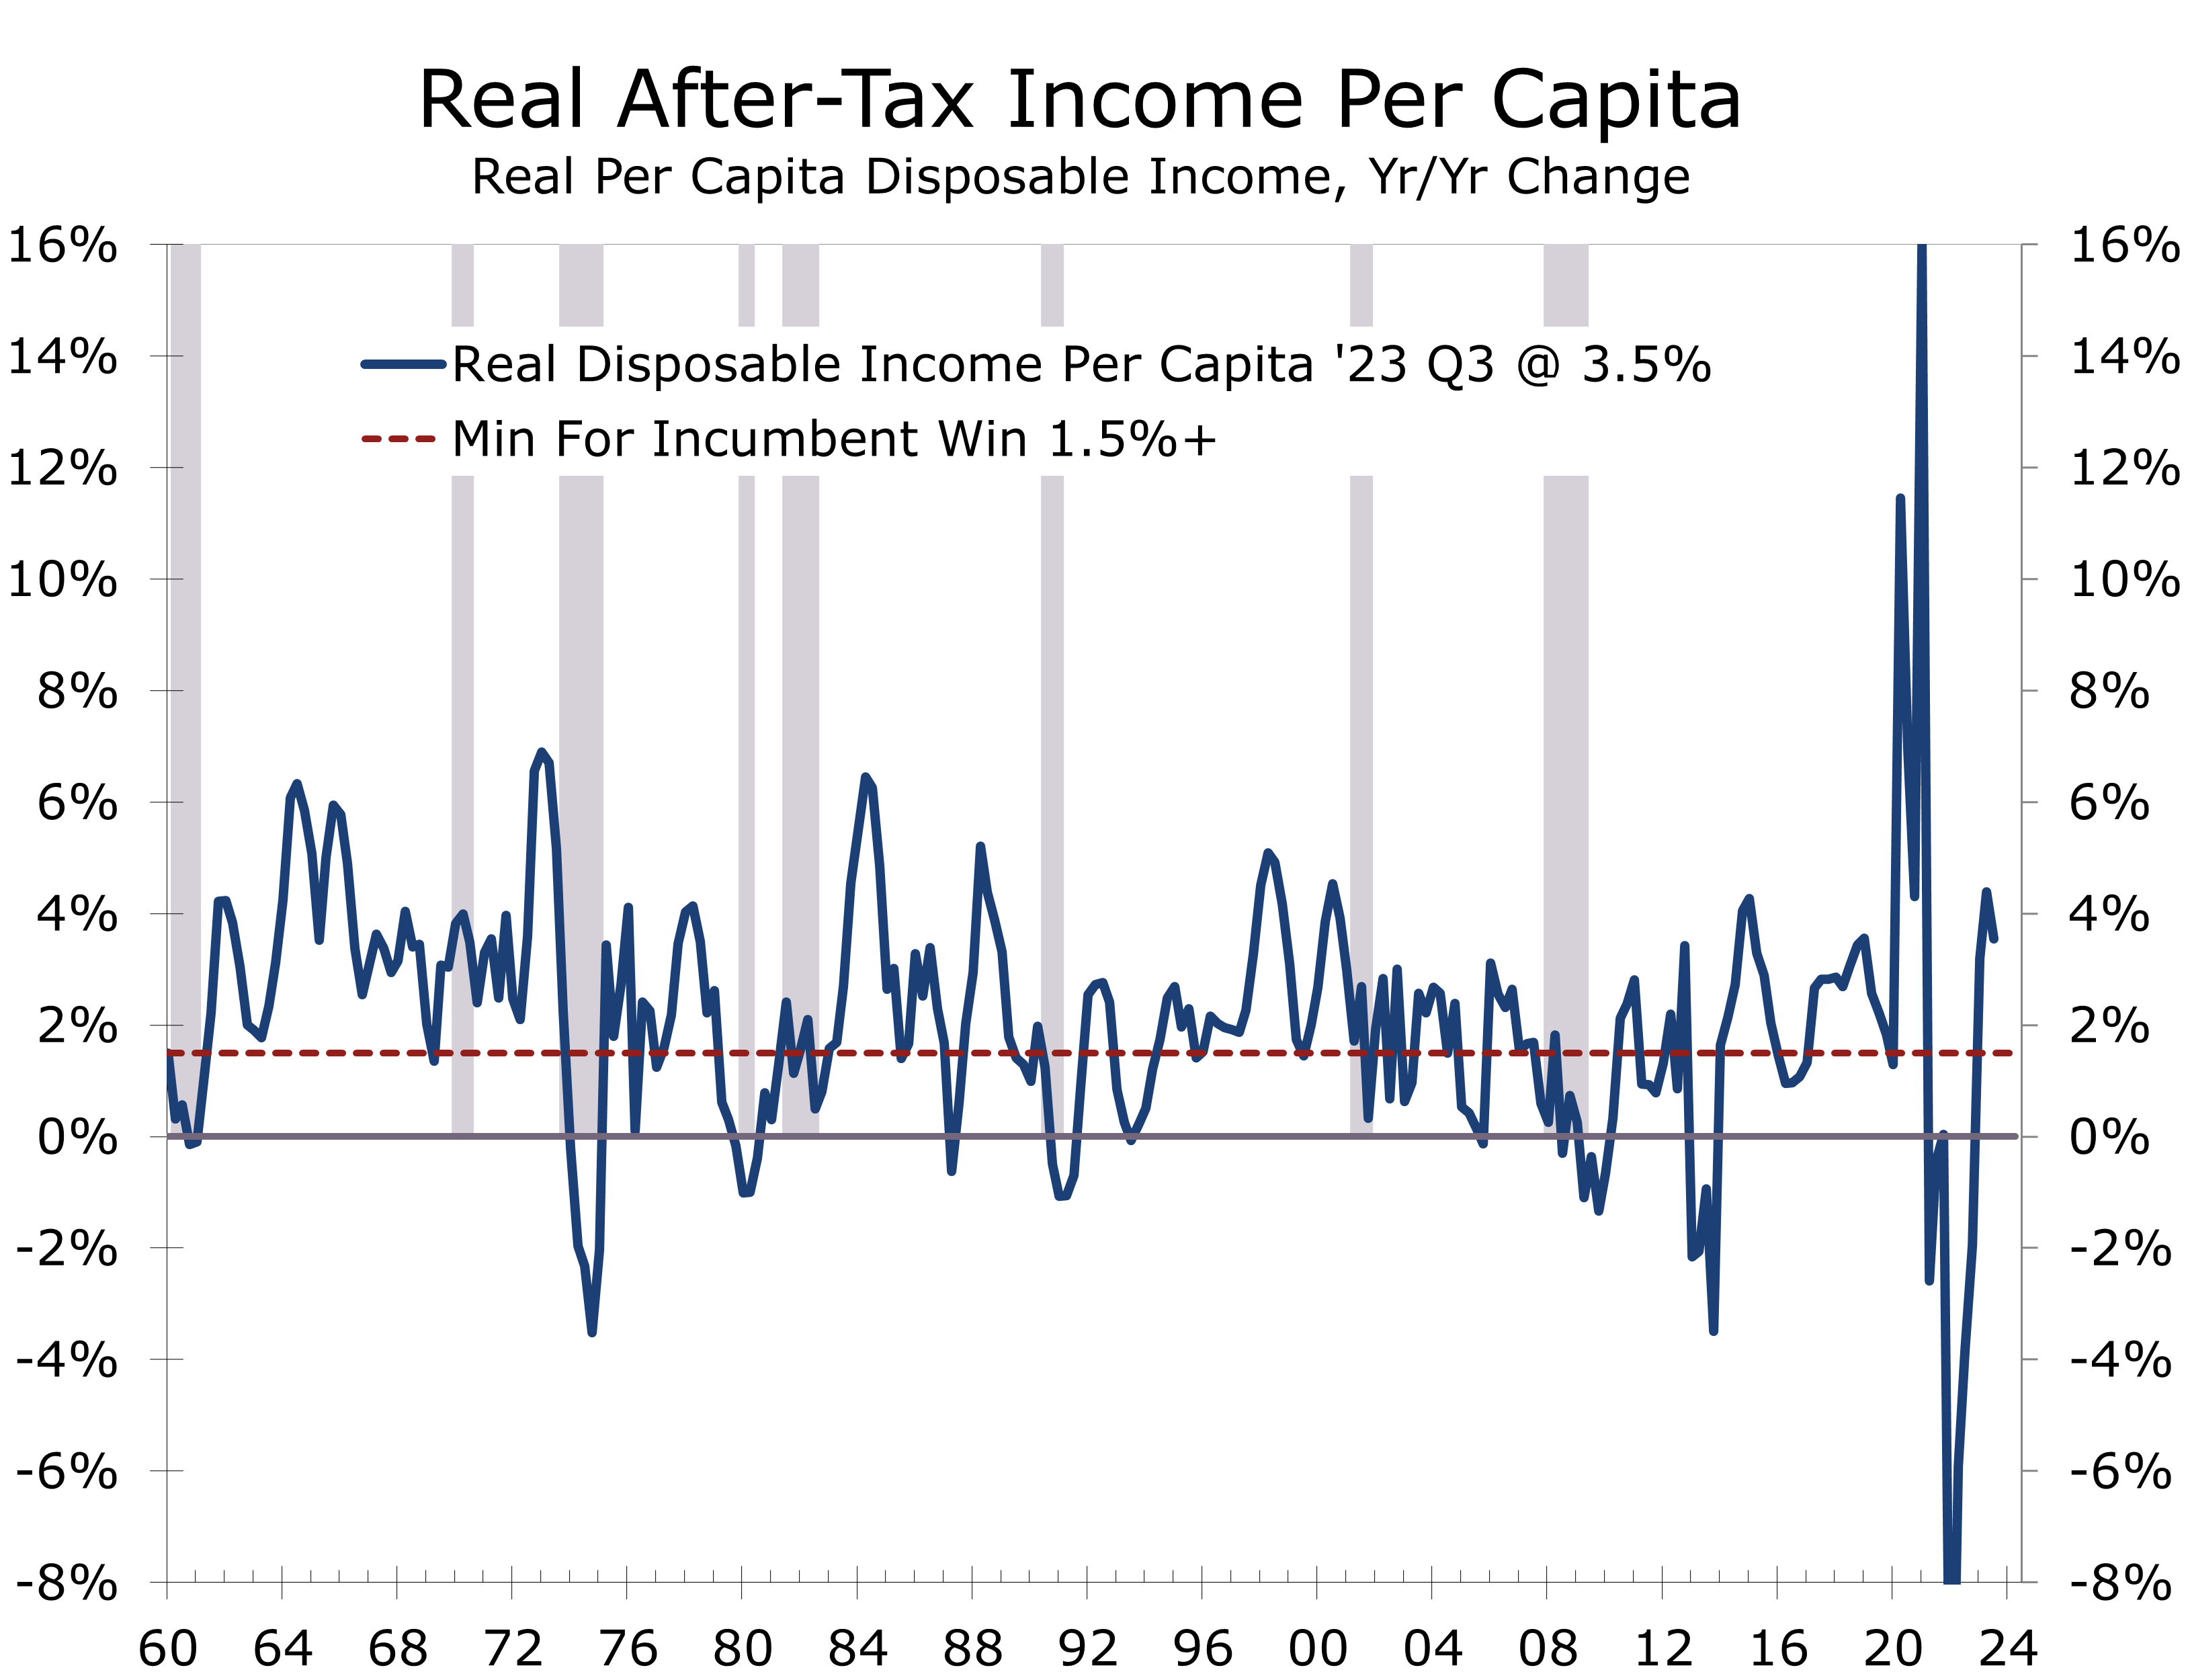
The three benchmarks we introduced suggest this election cycle is likely to be tough for incumbents. Real GDP is expected to grow 0.8 percentage points slower this year than its average for the past 8 years, which has typically signaled a loss for the incumbent party occupying the White House. On the plus side, the Misery Index is projected to be 1.1 percentage points lower than when Biden was elected, with all of the improvement coming from lower unemployment. While inflation is expected to moderate, the CPI should still rise more than twice as much in 2024 as it did in the year preceding the 2020 election, and prices for key necessities are much higher than they were four years ago. Along those lines, real after-tax income per capita is likely to rise by 1.5% at best during the year leading up to the 2024 election. Based on recent experience, incumbents would lose, meaning the leadership of the White House, Senate, and House of Representatives would all likely change parties.
Predicting election outcomes is even more perilous than predicting the economy. A host of non-economic issues could easily overwhelm concerns about the economy, including global affairs, social issues, and the personal attributes of the candidates. The outcome of the election will have significant consequences on everything from geopolitics, global trade, the composition of the Fed and various regulatory agencies, and fiscal policy.
Our economic outlook is slightly more upbeat than it was a month ago. Real GDP in the fourth quarter now looks like it grew at a 2.1% annual rate, thanks to continued strong consumer spending and the continued buildout of a multitude of industrial projects. State and local government spending also looks to have risen solidly, given the continued growth in state and local government payrolls. Inventories are expected to grow more slowly and be a drag on Q4 growth.
We have also raised our 2024 forecast and now see growth just a touch softer than a soft landing, with real GDP expected to rise by 1.7%. Nonfarm employment is anticipated to decelerate, with employers adding only 110,000 jobs per month. The unemployment rate is predicted to increase to 4.1% by the end of the year. We maintain concern regarding traditional warning signals, such as the inverted yield curve and a 21-month decline in the Leading Economic Index. While the risk of a recession remains elevated, the more likely scenario is a continuation of the rolling recessions that have been ongoing for the past year.
Inflation is expected to continue to moderate, allowing the Fed to begin to cut interest rates this spring. Our forecast includes three quarter-point cuts in the federal funds rate, with the first in May or June. Another cut is expected in September and then the Fed will likely hold rates steady through the November election, after which
a final cut is likely. Despite the bond market factoring in five or six quarter-point cuts this year, we do not foresee the economy weakening or inflation moderating enough to justify such extensive cuts. The 10-year Treasury is expected to rise back to 4.20%, which will keep mortgage rates in the 6.50% range through the end of the year.
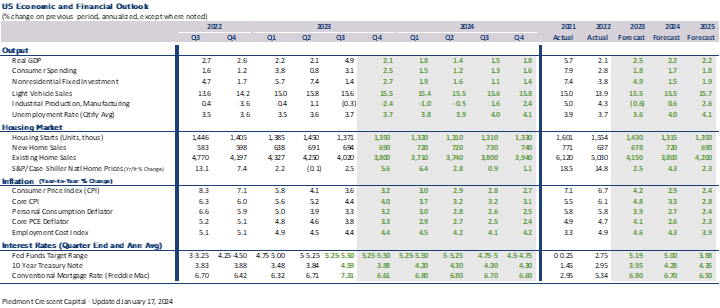
Disclaimer: This publication has been prepared for informational purposes only and is not intended as a recommendation offer or solicitation with respect to the purchase or sale of any security or other financial product nor does it constitute investment advice. Any forward-looking statements or forecasts are not guaranteed and are subject to change at any time. Information from external sources have not been verified but are generally considered reliable.
© 2024 CAVU Securities, LLC
January 24, 2024
mark.vitner@piedmontcrescentcapital.com
Chief Economist (704) 458-4000