
Powell Sees No Sign of a Stag or ‘Flation
The Fed Continues to Look Beyond the Headlines
- The FOMC held the fed funds target range at 5.25%-5.50% at its May meeting and remains cautiously optimistic about inflation.
- The Committee took note of the recent lack of progress toward its 2% inflation objective but still sees the broader economy, labor market, and inflation moving into better balance.
- The Committee also announced a more substantial slowdown in its balance sheet drawdown, or QT, than was expected.
- The winding down of QT is more geared toward maintaining market stability than providing economic relief.
- Powell said it was ‘unlikely’ the Fed would need to raise interest rates, stating that monetary policy is tight enough.
- Powell was also unusually frank and dismissive of any risks of stagflation, pointing to stronger private final domestic demand.
- We are still looking for the Fed to ease this year but now look for just two quarter-point cuts (September and December) followed by two more in early 2025. We expect job growth to slow later this spring and look for inflation to moderate in the second half of this year.
As expected, the Fed held its federal funds target range unchanged at 5.25%-5.50% at its May 1 FOMC meeting. The financial markets were prepared for a more hawkish take on inflation, given the string of disappointing inflation reports during the first quarter. The Fed acknowledged that progress at reducing inflation has slowed but still sees the economy on track for more modest economic growth and lower inflation.
The Fed’s policy statement and Powell’s press conference emphasized that they believe the economy is moving toward better balance. While job growth was clearly stronger than expected in Q1, with employers adding an average of 276,000 jobs a month, Powell sees that strength balanced by rising prime-age labor force participation and increased immigration.
The latest JOLTS numbers add credence to this notion, with job openings and the quit rate both falling notably in March. The narrowing of the jobs-to-workers gap should allow wages to ease further.
There has been a lack of further progress toward the Committee’s 2 percent inflation objective.
The biggest change to the Fed’s statement was the acknowledgement that progress on reducing inflation came up short in the first quarter. Powell seemed remarkably unfazed, noting long-term inflation expectations remain well anchored and reaffirming that monetary policy remains appropriately tight.

We see Powell’s assessment as appropriate. While inflation came in higher than expected in the first quarter, much of the surprise was at the start of the quarter. There has also been a tendency for inflation to surprise to the upside in the first half of the year and then moderate during the second half. This pattern has been even greater in the aftermath of the pandemic.
Jay Powell got a little animated when asked about the prospect of a return of stagflation, noting that he did not see the ‘Stag’ of the ‘-Flation’. The source of much of the stagflation talk appears to have come from the weaker than expected Q1 GDP report, which showed real GDP growth slowing from a 3.4% pace in Q4 2023 to a 1.6% pace. The Fed’s preferred inflation measure, the core PCE deflator, accelerated to a 3.7% annual rate in Q1 from a 2.0% the prior quarter.
I don’t see the ‘stag’ or the ‘-Flation’. Final demand remains strong in the private sector.
Powell downplayed the recent slowdown in GDP growth, attributing it to a decrease in net exports and temporary federal spending cuts. Real Final Sales to Domestic Purchasers, which excludes inventories, government spending, and net exports; grew at a 3.1% pace in Q1, consistent with the second half of last year. This measure provides a better gauge of the parts of the economy most influenced by monetary policy.
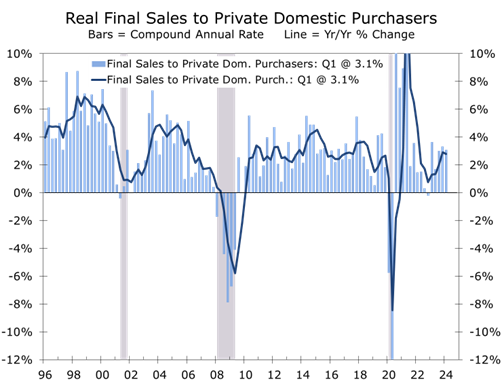
With no ‘stag’, there is even less need to cut interest rates. Powell noted that the recent strength in consumer spending is being supported by improving supply conditions. Part of that supply is a rising tide of less expensive imports.
While inflation is still too high for the Fed to entertain any thoughts of cutting interest rates, we are still looking for two quarter-point rate cuts this year. The first cut should come in September, followed by a second in December. By then, we feel core inflation will have decelerated to around a 2.5% pace, which should be more than enough progress for the Fed to begin to normalize interest rates.
Recent months show no further progress toward the 2 percent inflation objective.
The big surprise was that the Fed announced a more substantial winddown of its balance sheet reduction program, or QT. Beginning in June, the Committee will slow the pace of decline in its securities holdings by reducing monthly redemptions from $60 billion to $25 billion. Redemptions of agency and mortgage-back securities will remain at $35 billion a month. The move is aimed more at maintaining financial market stability than providing interest rate relief.

Disclaimer: This publication has been prepared for informational purposes only and is not intended as a recommendation offer or solicitation with respect to the purchase or sale of any security or other financial product nor does it constitute investment advice.
May 1, 2024
Mark Vitner, Chief Economist
mark.vitner@piedmontcrescentcapital.com
(704) 458-4000

Manufacturing Stalls in April, While Prices Firm
The Manufacturing Revival Stalls
- The ISM Manufacturing Purchasing Managers Index (PMI) fell 1.1 points in April to 49.2.
- Despite the drop, manufacturing shows signs of strengthening, with normalized customer inventories and fewer supply chain issue.
- The underlying details were soft, with new orders and production both weakening. The employment index rose but remained in contractionary territory.
- Supplier deliveries improved, indicating faster delivery times and fewer supply disruptions.
- The inventory index remained steady at 48.2, which means more manufacturers reported inventories declining rather than rising.
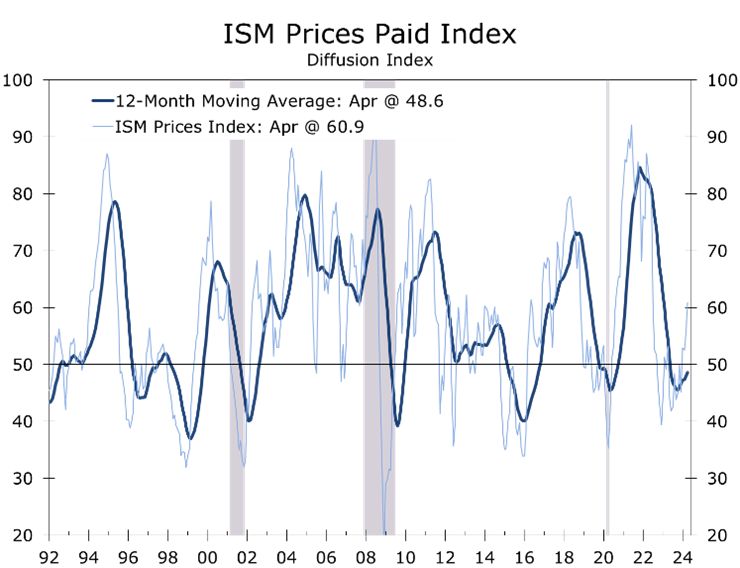
- The Prices Paid index jumped 5.1 points to 60.9, reaching its highest level since June 2022 and adding to fears of stagflation.
- April’s weaker than expected ISM report adds year another piece of evidence to the growing chorus of forecasters project a return of stagflation. We do not expect to see a return of 1970s-style stagflation. Manufacturing activity will likely improve modestly this year, while a stronger recovery overseas pulls commodity prices higher and squeezes manufacturers profit margins.
The ISM manufacturing index slipped back into contractionary territory, with the headline index falling 1.1 points to 49.2. A reading below 50 means more manufacturers report conditions are weakening than report they are strengthening. The overall ISM manufacturing index has been below 50 for 17 of the past 18 months, with the lone expansionary reading coming in March.
Even with April’s drop, manufacturing activity is showing some tentative times of strengthening. Customer inventories have largely normalized, and supply disruptions have largely dissipated. Output is improving slightly faster overseas, however, than it is improving at home, with the stronger dollar lowering the price of imports and making US exports more expensive to overseas buyers.
Manufacturing activity softened a touch in April, while prices paid by manufacturers increased.
April’s 1.1-point drop was worse than had been expected. New orders and production both weakened, while there was a slight uptick in the employment component. The new orders series fell by 2.3 points to 49.1, while the production index fell 3.3 points to 51.3. The employment component edged 1.2 points higher but remained in contractionary territory at 48.6.
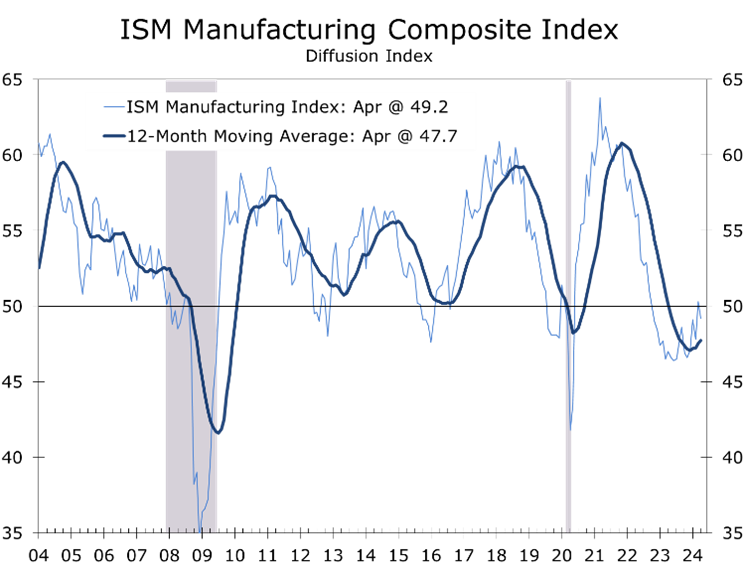
Supplier deliveries declined 1.0 point to 48.9, indicating faster delivery times for a larger proportion of respondents. There are far fewer supply disruptions today and supply chains have largely normalized. The lead time for production materials increased 1 day to an average of 79 days, compared to an average of 67 days in 2019 (prior to the pandemic) and a peak of 100 days in July 2022. The inventory index was unchanged at 48.2, meaning more manufacturers reported inventories declining than rising.
Prices paid by manufacturers jumped 5.1 points in April to 60.9 on a non-seasonally adjusted basis. The increase is yet another data point hinting at the return of some sort of stagflation. We believe there is more to the story, however, and see the recent uptick in the prices paid series reflecting rising manufacturing output overseas, particularly in China.
A global manufacturing rebound is pulling industrial commodity prices higher.
In April, 31% of companies said they paid higher prices (up from 24% in March), with only 9% reporting paying lower prices (down from 12%). Several key commodity prices have increased, including crude oil, aluminum, steel, and plastics. The recent spike in crude oil has eased somewhat, as Iran/Israel tensions have subsided. The rise in industrial commodity prices aligns with the recent strengthening in output overseas.
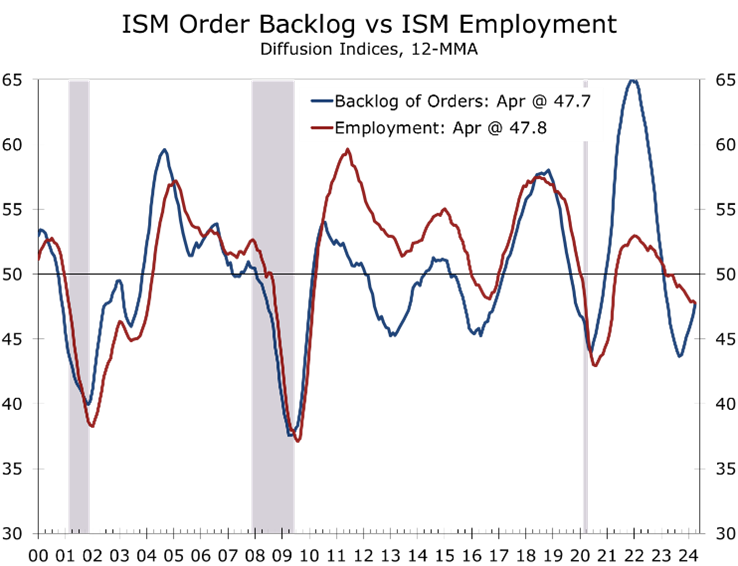
The ISM employment index rose 1.2 points to 48.6 in April, indicating a slight narrowing of the contraction in manufacturing payrolls. April marks the 7th consecutive month of contraction, however, meaning more reductions in manufacturing employment than new hires. An Employment Index above 50.3 percent typically corresponds to a rise in the BLS monthly payroll manufacturing measure.
Separately, the BLS reported job openings declined in March, falling from 8.8 million openings to just under 8.5 million. Job openings in manufacturing also declined, falling from 587,000 to 570,000 openings. Only 4 of 18 industries in the ISM survey — transportation equipment, computers and electronic equipment, textiles, and nonmetallic mineral products – added jobs in April, while 7 cut staff and 7 others reported no change.
We continue to expect the manufacturing sector to modestly strengthen this year, with orders rising amidst solid final demand and normal/low inventories. Manufacturing employment will take longer to recover, however. Manufacturers tend to hold off adding staff until order backlogs rise and that still appears to be a few months off.
Disclaimer: This publication has been prepared for informational purposes only and is not intended as a recommendation offer or solicitation with respect to the purchase or sale of any security or other financial product nor does it constitute investment advice.
May 1, 2024
mark.vitner@piedmontcrescentcapital.com
Chief Economist (704) 458-4000
A Not So Soft Landing
What a Difference a Month Makes
-
- First-quarter Real GDP growth was weaker than expected, increasing by only a 1.6% annual rate. This was due to a significant slowdown in exports, a slowdown in inventory building, and reduced federal spending. Additionally, consumer spending on goods inexplicably declined. Private final domestic demand (core GDP) grew at a healthier 3.1% annual rate, consistent with the previous two quarters. Core GDP is a better indicator of the economy's underlying strength.
- While slower headline GDP growth is consistent with a soft landing, the financial markets are focused more intently on the continuing inflation The GDP deflator rose at a 3.1% pace in the first quarter, up from a 1.9% pace in the prior quarter. The PCE deflator rose at a 3.4% pace, while the core PCE deflator rose at a3.7% pace, up from 1.8% and 2.0% in Q4, respectively.
- The higher inflation evident in the GDP report amplifies concerns raised by the recent string of hotter-than-expected rises in the Consumer Price Index. Both the core and headline CPI rose 4% in March and climbed at a 3.8% and 4.2% pace, respectively in Q1. Persistently higher inflation has reversed all the optimism about lower rates that followed the December FOMC meeting. A growing number of forecasters now call for no cuts in the federal funds rate this year.
- Heightened geopolitical risks were the other major complicating event this past month, with Iran’s massive drone and missile barrage against Israel successfully being thwarted by Israel, the U.S., Saudi Arabia, Jordan and France. Israel responded with a limited, precise attack on a key radar facility, which has subsequently reduced tensions. In the wake of these events, congress passed a $95-billion military aid package for Ukraine, Israel, and Taiwan.
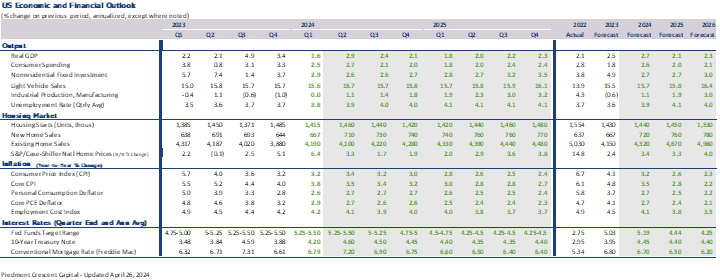
- We have made significant adjustments to the We now see economic growth remaining more resilient over the next couple of years and inflation proving slightly more persistent. We are still looking for the Fed to ease this year but now look for just two quarter-point cuts (September and December) followed by two more in early 2025. Long-term rates are expected to remain higher over the forecast period, although they should ease slightly this summer on softer economic data and slightly lighter Treasury issuance, thanks to stronger tax receipts.
Views on the economy have changed considerably over the past month. Economic growth has proven stronger than expected, while inflation remains too high and has proven more persistent. Attitudes hardened following a larger than expected increase in the Consumer Price Index for March, which saw both the headline and core CPI rise 0.4% and marked the third consecutive higher-than-expected CPI report. Many forecasters either pushed out the timing when they believed the Fed would begin to cut interest rates or removed any cuts from this year entirely. We still believe the Fed will cut the federal funds rate twice this year, with the first quarter-point cut coming in September and a second coming at the December FOMC meeting.
Most key economic reports continue to show the economy growing solidly. Nonfarm employment posted another outsized gain, with employers adding 303,000 jobs in March and job growth for the prior two months being revised slightly higher. The household employment data were also strong, with hours worked and average hourly earnings slightly topping expectations. The unemployment rate fell 0.1 point to 3.8%. Employers have added an average of 276,000 jobs a month over the past three months, which is well above the 244,000 jobs added per month over the past year.
Strong employment numbers are becoming routine. Increased immigration and an easing in work-permit restrictions are boosting hiring in occupations that have faced difficulty restaffing since the pandemic. Hiring continues to be skewed toward less skilled positions in health care, leisure and hospitality and state and local government. The strength in payrolls has bolstered personal income growth. Wages and salaries rose 0.7% in March and climbed at a 6.4% annual rate during the first quarter, fueling strong gains in consumer spending.
Within the GDP report, consumer spending rose a bit differently. Expectations for Q1 GDP growth jumped following a much stronger than expected retail sales report, which showed core retail sales surging 1.1% in March and rising at a 3% pace in the first quarter.
The apparent strength in consumer spending had pulled estimates for Q1 GDP growth to around 3% and the widely followed Atlanta Fed GDPNow projection was at 2.7% prior to the advance release of first quarter real GDP growth. Reports on industrial production and new home sales also boosted expectations, with manufacturing output rising amidst higher light vehicle assembles.
With everyone geared up for another red-hot report, first quarter GDP turned out to be a dud. Real GDP rose at just 1.6% annual rate, the slowest pace since the second quarter of 2022 when economic growth temporarily throttled back after surging when following the re-opening of the economy. The Q1 shortfall was mostly due to a widening in the nation’s trade deficit, which sliced 0.9 percentage points off growth. Export growth slowed, while imports ramped up. Business inventories also grew more slowly, slicing 0.4 percentage points off growth, and federal government spending fell, reflecting the lull in military aid to Ukraine. Consumer spending rose at a solid 2.5% pace, with all the growth in services. Goods spending declined at a 0.4% pace.
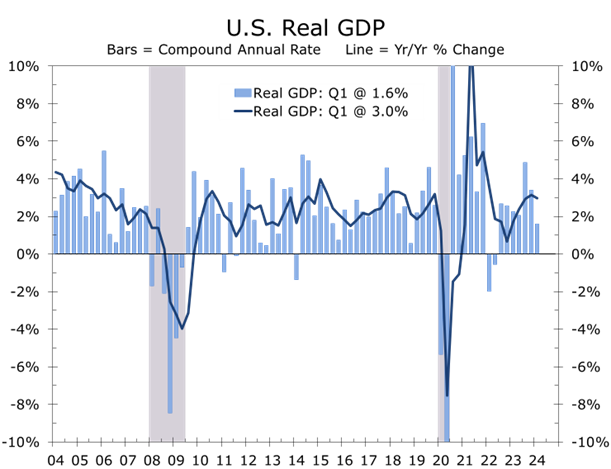
The financial markets reacted harshly to the GDP release, with bond yields surging and the stock market selling off. The markets were fixated on the combination of weaker headline GDP growth and higher inflation. The GDP deflator rose at a 3.1% pace in the first quarter, up from a 1.9% pace in the prior quarter. The PCE deflator rose at a 3.4% pace, while the core PCE deflator – the Fed’s preferred price measure — rose at a 3.7% pace, up from 1.8% and 2.0%, respectively, in Q4. A handful of analysts even raised the prospect of stagflation.
Surprises in quarterly GDP growth are not unusual. International trade and inventories, which account for the bulk of the shortfall in Q1 growth, are two of the hardest variables to estimate, particularly for the Advanced report. The widening in the trade deficit makes intuitive sense, as the stronger dollar reduces the price of imports to domestic buyers and makes US exports more expensive to overseas buyers. Trade will add little to growth over the balance of this year but should not be a significant additional drag either. Moreover, a stronger dollar should hold down import prices and help restrain inflation.
The continued slowdown of inventory building also makes sense, as goods consumption has been soft for the past year and half, leading to a decline in orders and output. Most of the first quarter’s weakness occurred at the start of the quarter, with spending on durables tumbling 2.7% in January and spending on nondurables declining in both January and February. In contrast, spending on durable goods rose solidly in February (1.4%) and March (0.9%) and spending on nondurables jumped 1.3% in March. Overall spending on goods rose 1.1% in March, matching the rise in core retail sales. The rebound in goods spending suggests orders and output will rise a bit more rapidly in the coming quarters. Inventories, which have subtracted from GDP growth the past two quarters, should add to growth later this year.
As far as fears about stagflation are concerned, we have often noted that final sales to private domestic purchasers, or core GDP, is the best way to measure the economy’s underlying momentum. This measure is the sum of consumer spending, business fixed investment and home building. Not only does this measure exclude the volatile trade and inventories component but, by focusing on the private sector, zeroes in on the part of the economy where monetary policy has the most influence. Core GDP grew at a 3.1% annual rate during the first quarter and has risen 2.8% over the past year. Moreover, core GDP has risen at better than a 3% pace in four of the past five quarters, indicating the economy still has strong momentum.
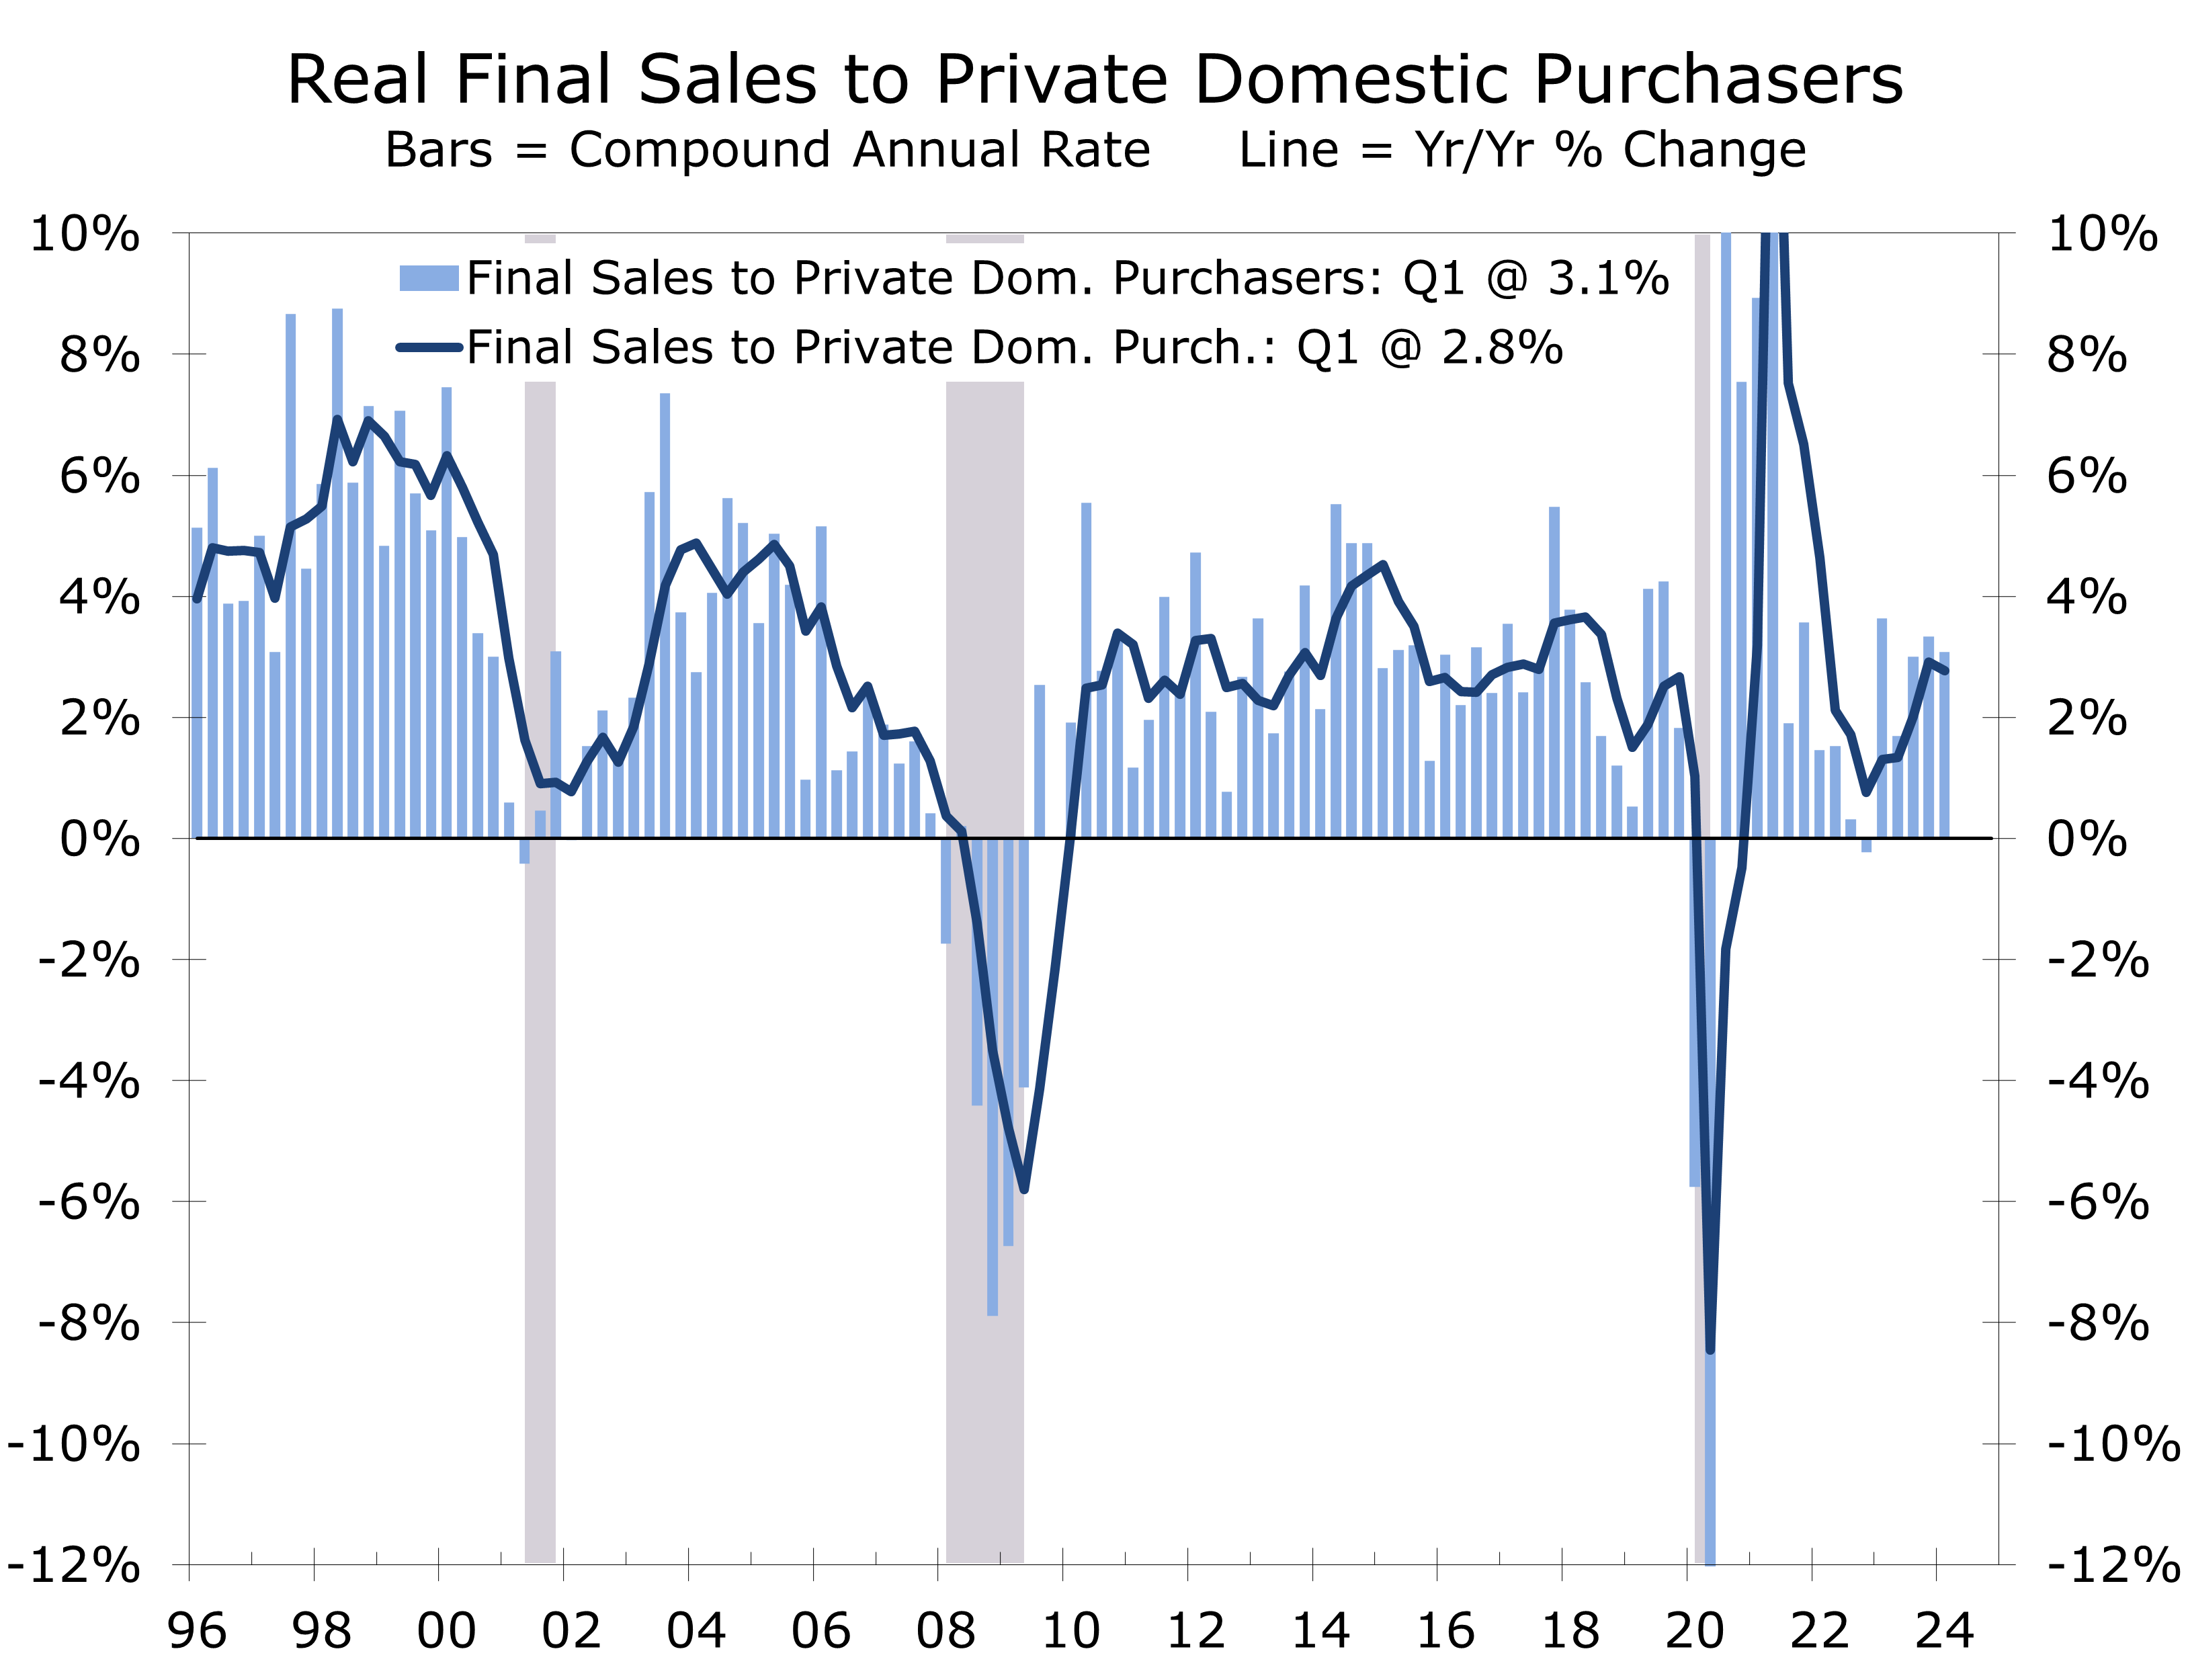
Rather than stagnate, we see economic activity accelerating in the current quarter and remaining strong through the end of the year. Overall personal consumption ended the first quarter on a high note and will grow at better than a 2% pace, even if consumer spending is unchanged in April, May, and June. Early Nowcasts estimates for second quarter GDP, peg growth at well over 3%. We raised our estimated for Q2 GDP growth to 2.9%.
Not only have we raised our estimate for second quarter GDP growth, but we see meaningful upside risks to subsequent quarters. The long drawdown in inventories has brought inventories back in line with their historic norms and led to a modest rise in orders for consumer goods and business equipment. One area where this is becoming apparent is light vehicle assemblies, which are ramping up. Moreover, the Q1 lull in military aid to Ukraine that restrained federal spending will reverse in the current quarter. Federal pump priming may add to growth in other ways, as money is finally flowing from the CHIPS and Science act, which will bolster construction spending and equipment purchases.
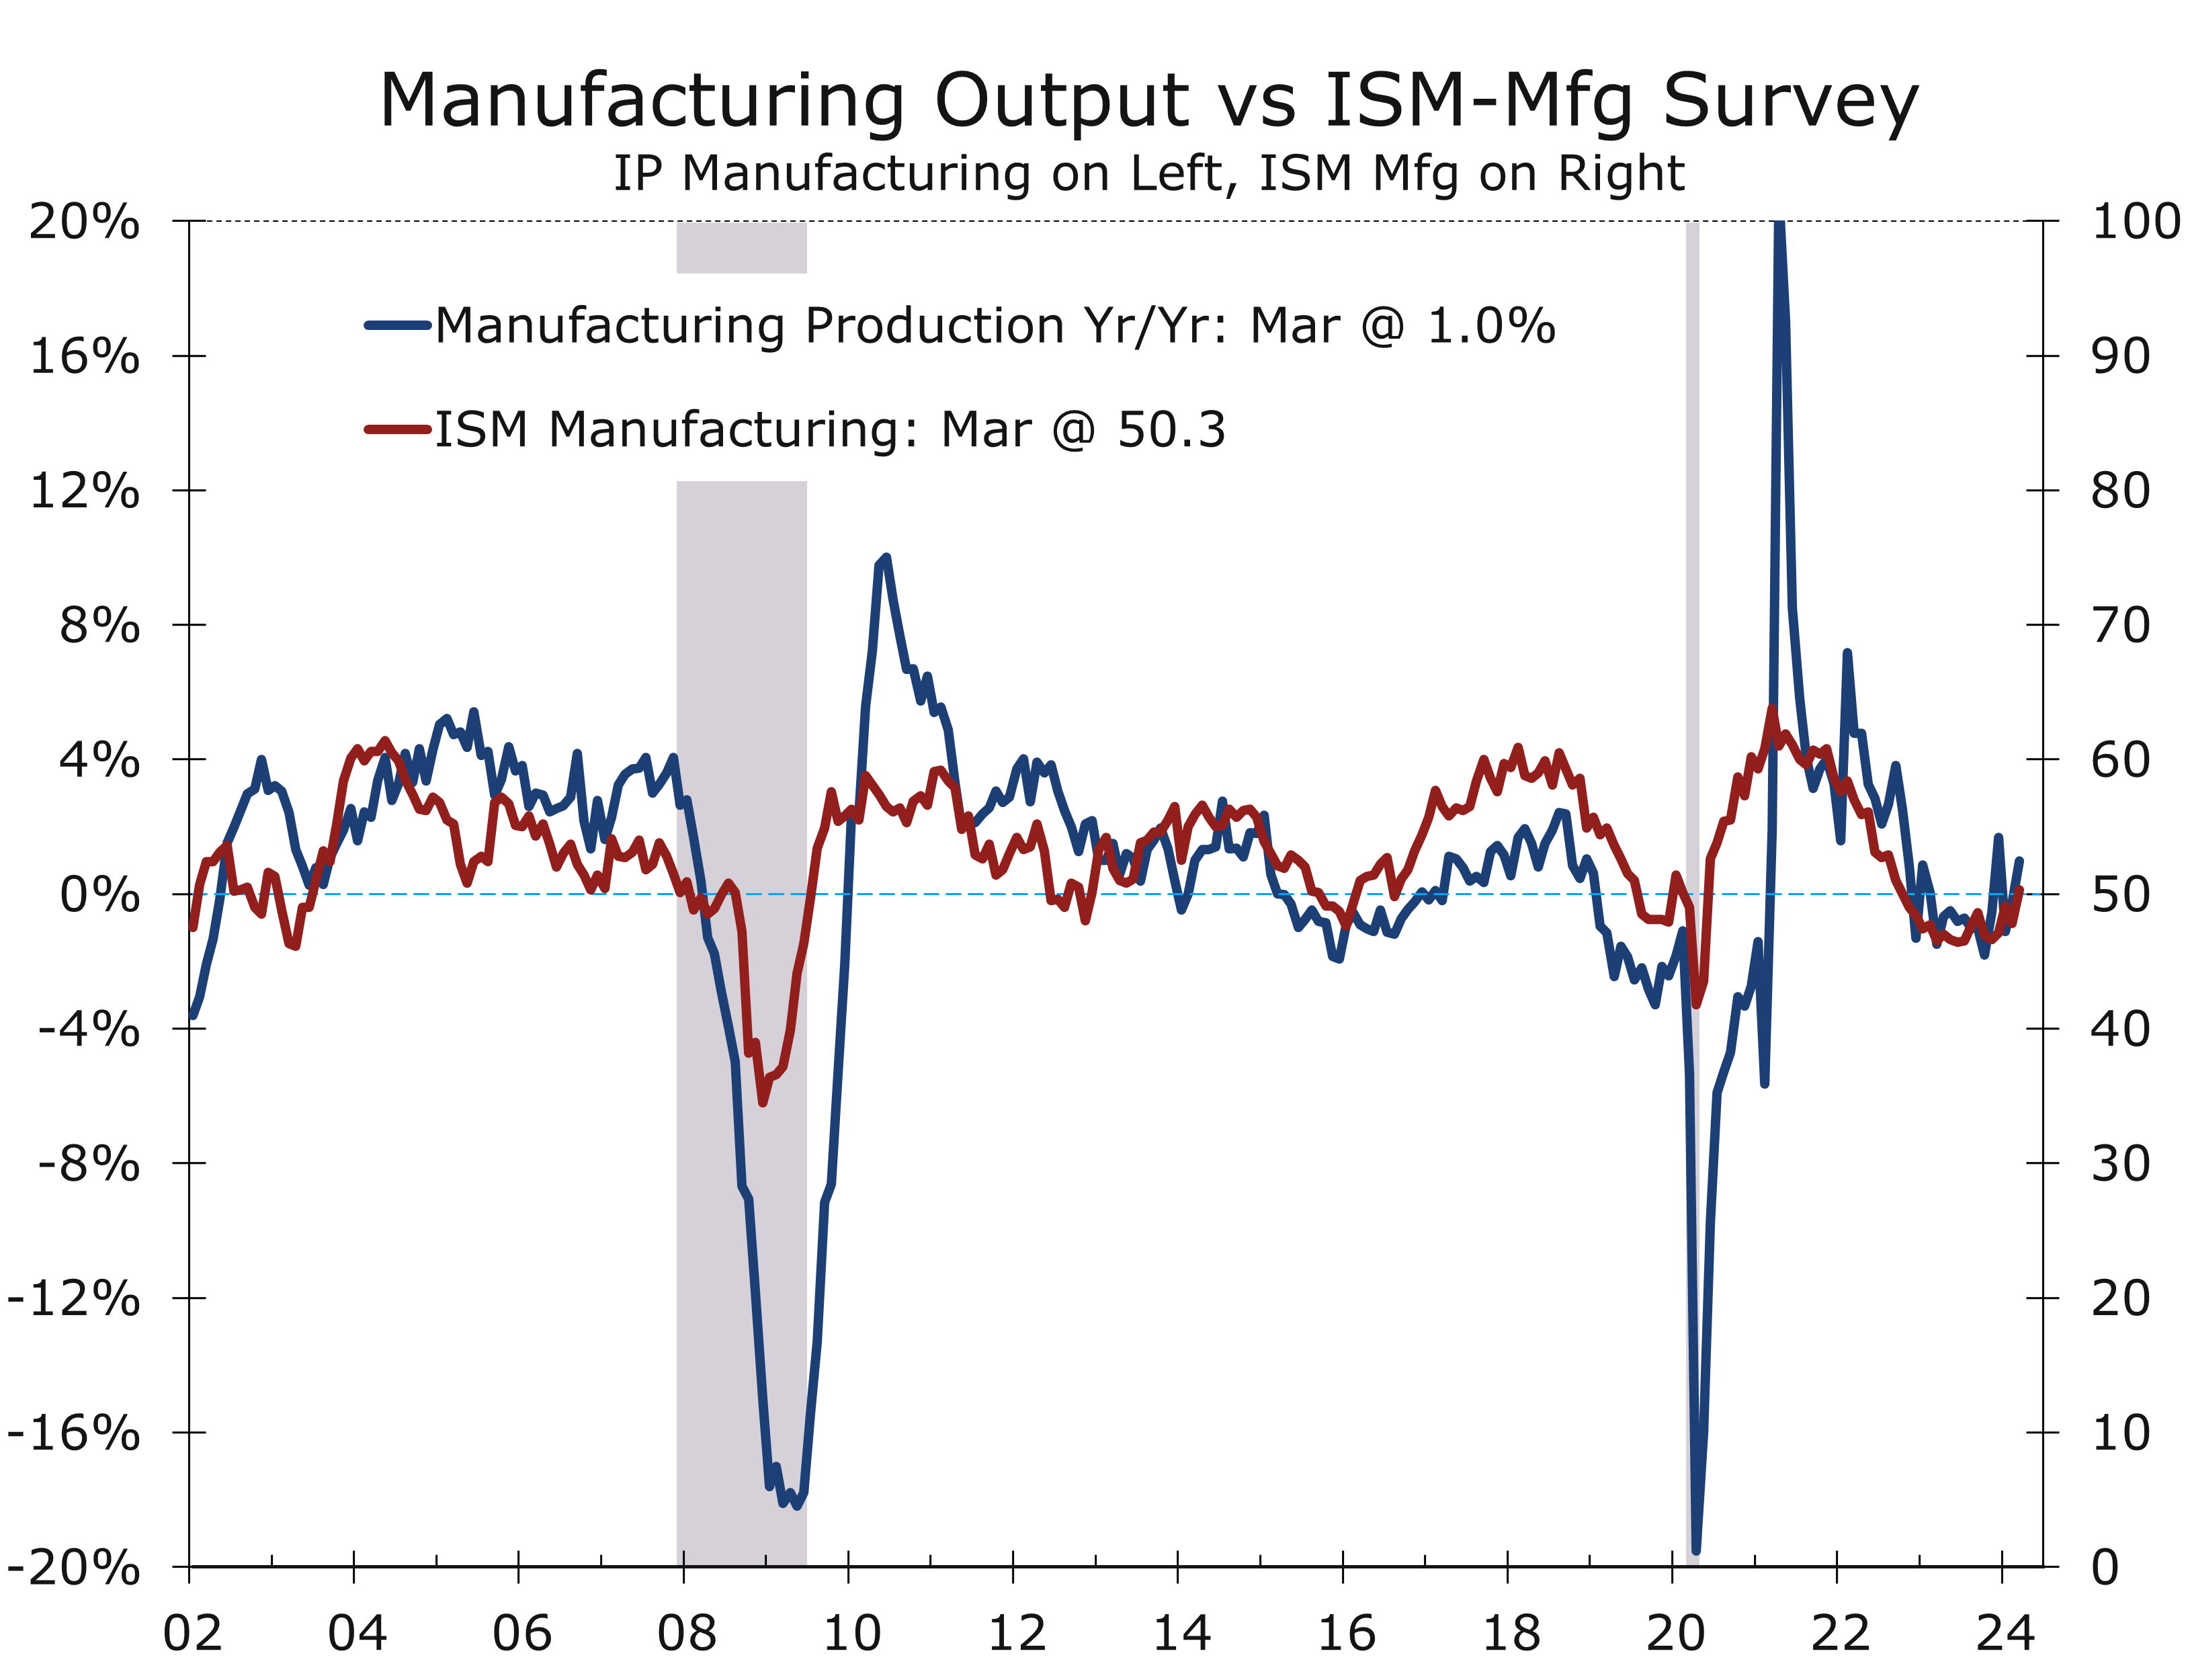
We may be on the verge of a resurgence in manufacturing along the line we saw in the latter part of the last decade. The ISM-Manufacturing Index, which tracks the breadth of the strength or weakness in the factory sector, rose back to 50.3 in March, marking its first reading above the key 50 break-even level since September 2022. The recent improvement in the ISM index was driven by increases in production and new orders. Customer inventories are also reported to be low, which means orders and output will likely rise further. Manufacturing employment, however, will take longer to improve.
While manufacturing accounts for a smaller share of economic activity, it still provides the cyclical impulse to the broader economy. An improvement in manufacturing activity leads to a larger increase in overall activity. Manufacturing output rose 0.5% in March following a 1.2% rise the prior month and is now 1% higher than it was a year ago. We expect output to strengthen further in coming months, driven primarily by rising motor vehicle assemblies, and increased output of other assorted consumer goods, tech hardware and defense and aerospace products. The one downside to an improving manufacturing sector is that past rebounds have tended to be associated with higher inflation. The Fed has tended to hike interest rates following past mid-cycle manufacturing rebounds (the second half of the 1980s, 1990s and this past decade).
While it has been a momentous month, we do not believe the inflation picture has changed all that much. The upside surprises to the CPI and PCE deflator were less than a tenth of a percentage point and may have been augmented by seasonal factors. There has been a tendency for price indices to register larger gains in the first half of the year than in the second half and this anomaly has intensified since the pandemic.
We have long noted it would be difficult to bring inflation down to 2% on a sustained basis without enduring a recession. The post-pandemic economy has been difficult to read, as massive supply-chain disruptions have gradually eased but massive fiscal stimulus aimed at boosting the economy from the pandemic has steadily intensified. While fiscal stimulus has many goals, including reducing the threat of climate change, providing resilience for critical global chains and promoting national defense, one overriding goal is to avoid a repeat of the slow recovery from the Global Financial Crisis, which was in-part due to constraints on federal spending.
The amount of fiscal stimulus in the pipeline – American Rescue Plan, CHIPS and Science Act, Infrastructure Act, Inflation Reduction Act — is enormous and is the primary reason economic growth has mostly surprised to the upside in recent years. The arrival of so much fiscal stimulus late in the business cycle, when the economy was already at full employment, is also why inflation has proven so persistent and will continue to do so. Moreover, massive fiscal intervention in the economy always breeds malinvestment and inefficiency that will weigh on productivity growth for years to come and will be difficult to reverse. This is why we have long felt that, without a recession, inflation will not likely return to the Fed’s 2% goal on a sustained basis until 2026.
While 2% inflation may be a way off, the Fed should still be able to lower interest rates. The core PCE deflator – the Fed’s preferred price measure — topped out two years ago at 5.5% and has risen just 2.9% over the past year. As we have pointed out previously, however, the core prices measures, which exclude only food and energy prices, provide an exaggerated view on how fast inflation has come down due to the enormous swings in prices for a handful of items, including new and used light vehicles, health care, and residential rent. This is why we prefer measures such as the Cleveland Fed median CPI or trimmed mean CPI, which provide a better indication of how inflation is moderating in an overall sense. The direction and timing is roughly the same, but the magnitude of improvement has been much less by these more accurate measures.
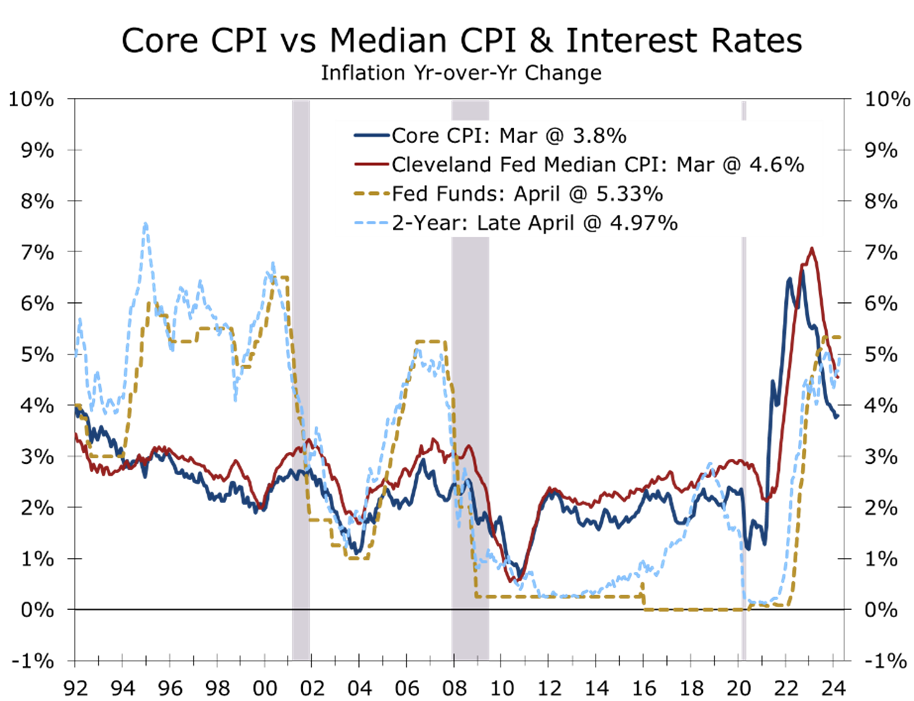
The 2% handle on the core CPE deflator and expected continuing deceleration should provide the Fed enough confidence to begin reducing the federal funds rate by September. By then, the core PCE deflator should be nearing 2.5%, and economic growth should be slightly slower. We expect nonfarm employment growth to slow to around 160,000 per month leading up to the September FOMC meeting, and the BLS should provide an early estimate of annual benchmark revisions in line with recent QCEW data trends.
Lowering interest rates in an election year always sparks concerns about Fed independence. Delaying rate cuts when they are necessary, however, also puts the Fed’s independence into question. Monetary policy operates with a long lag, so the Fed must be preemptive. We now expect just four quarter point cuts over the next year and expect the Fed to adopt neutral bias after that – meaning their next move could be up or down.
We have also raised our forecast for long-term rates over the forecast horizon, reflecting slightly stronger economic growth and continued massive funding needs for the US Treasury. Those funding needs may ease a bit this spring, allowing the yield on the 10-Year Treasury Note to fall back to 4.50%. We look for long-term rates to remain around 4.50% throughout the forecast period. This merely brings long-term rates back into the range they have averaged since 1990, a period in which inflation was lower than what is currently projected.
The economy should adjust reasonably well to the higher interest rate environment. While the rate-lock effect on the existing home market will take a little longer to unwind, the new home market will continue to benefit as more buyers opt for a new home. The spread between mortgage rates and the 10-Year Treasury is also expected to narrow over the forecast horizon, gradually returning to its long-term norm by the end of next year.
Disclaimer: This publication has been prepared for informational purposes only and is not intended as a recommendation offer or solicitation with respect to the purchase or sale of any security or other financial product nor does it constitute investment advice. Any forward-looking statements or forecasts are not guaranteed and are subject to change at any time. Information from external sources have not been verified but are generally considered reliable.
© 2024 CAVU Securities, LLC
May 1, 2024
mark.vitner@piedmontcrescentcapital.com
Chief Economist (704) 458-4000
Higher Inflation Weighs on Consumer Confidence
Consumer Confidence Slipped in April
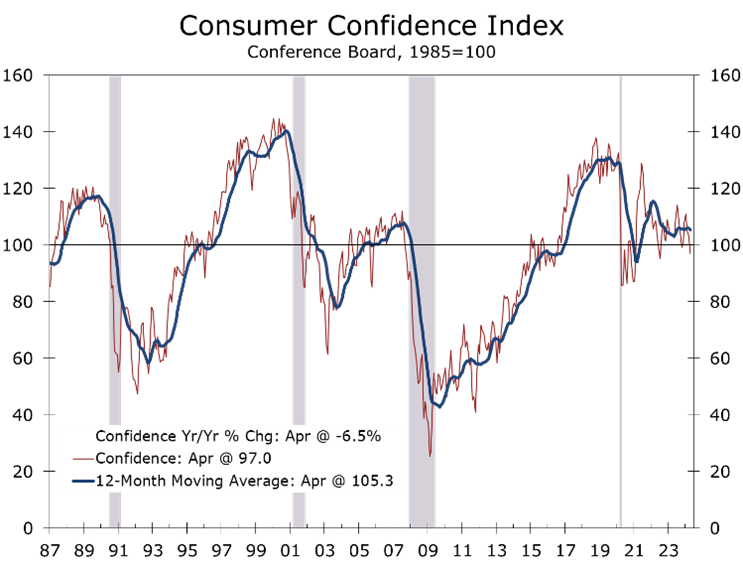
- Consumer Confidence fell a large than expected 6.1 points to 97.0 in April, marking the weakest reading since July 2022.
- The Present Situation Index fell 3.9 points to 142.9, while the Expectations Index fell 7.6 points to 66.4, reflecting less optimism about the current labor market and growing caution about future business conditions, job availability, and income growth.
- Confidence declined across all age groups and most income brackets and geographies.
- Higher prices, particularly for gasoline and food, remain a top concern, leading many households to curb discretionary spending to offset increased spending on necessities.
- Buying plans for homes and light vehicles continued to weaken.
- April’s weaker Consumer Confidence report adds to the growing discussion of stagflation. Consumer do not appear to be fearing a repeat of the 1970s, however. We may see a low altitude stagflation. Job and income growth will moderate, while inflation remains persistently high. This backdrop will make it difficult for the Fed to lower rates this year.
In April, The Conference Board’s Consumer Confidence Index plummeted by 6.1 points to 97.0, reaching its lowest point since July 2022. This marks the third consecutive monthly decline, with March’s data also being revised downward. Falling below the 100 mark is significant and historically indicates challenges for incumbent presidents seeking re-election.
Consumer Confidence have tumbled 13.9 points over the past three months. The period has been marked by a gradual reversal of the optimism that dominated the markets following the December FOMC meeting, when the Fed strongly hinted that they were finished raising interest rates and would likely cut the federal funds rate in 2024. Hopes for a rate cut have faded as job growth has come in much stronger than expected and wages and inflation have proven more resilient.
Consumer Confidence dipped below 100 for only the fourth time in the past three years.
With the latest drop, consumer confidence is now at the lower end of the range that it has maintain over the past two years. Falling below the 100 benchmark level is psychologically significant. Incumbent presidents have generally lost their re-election bids if Consumer Confidence was below 100 on election day. Confidence appears to be weighed down by lingering frustration about higher inflation.
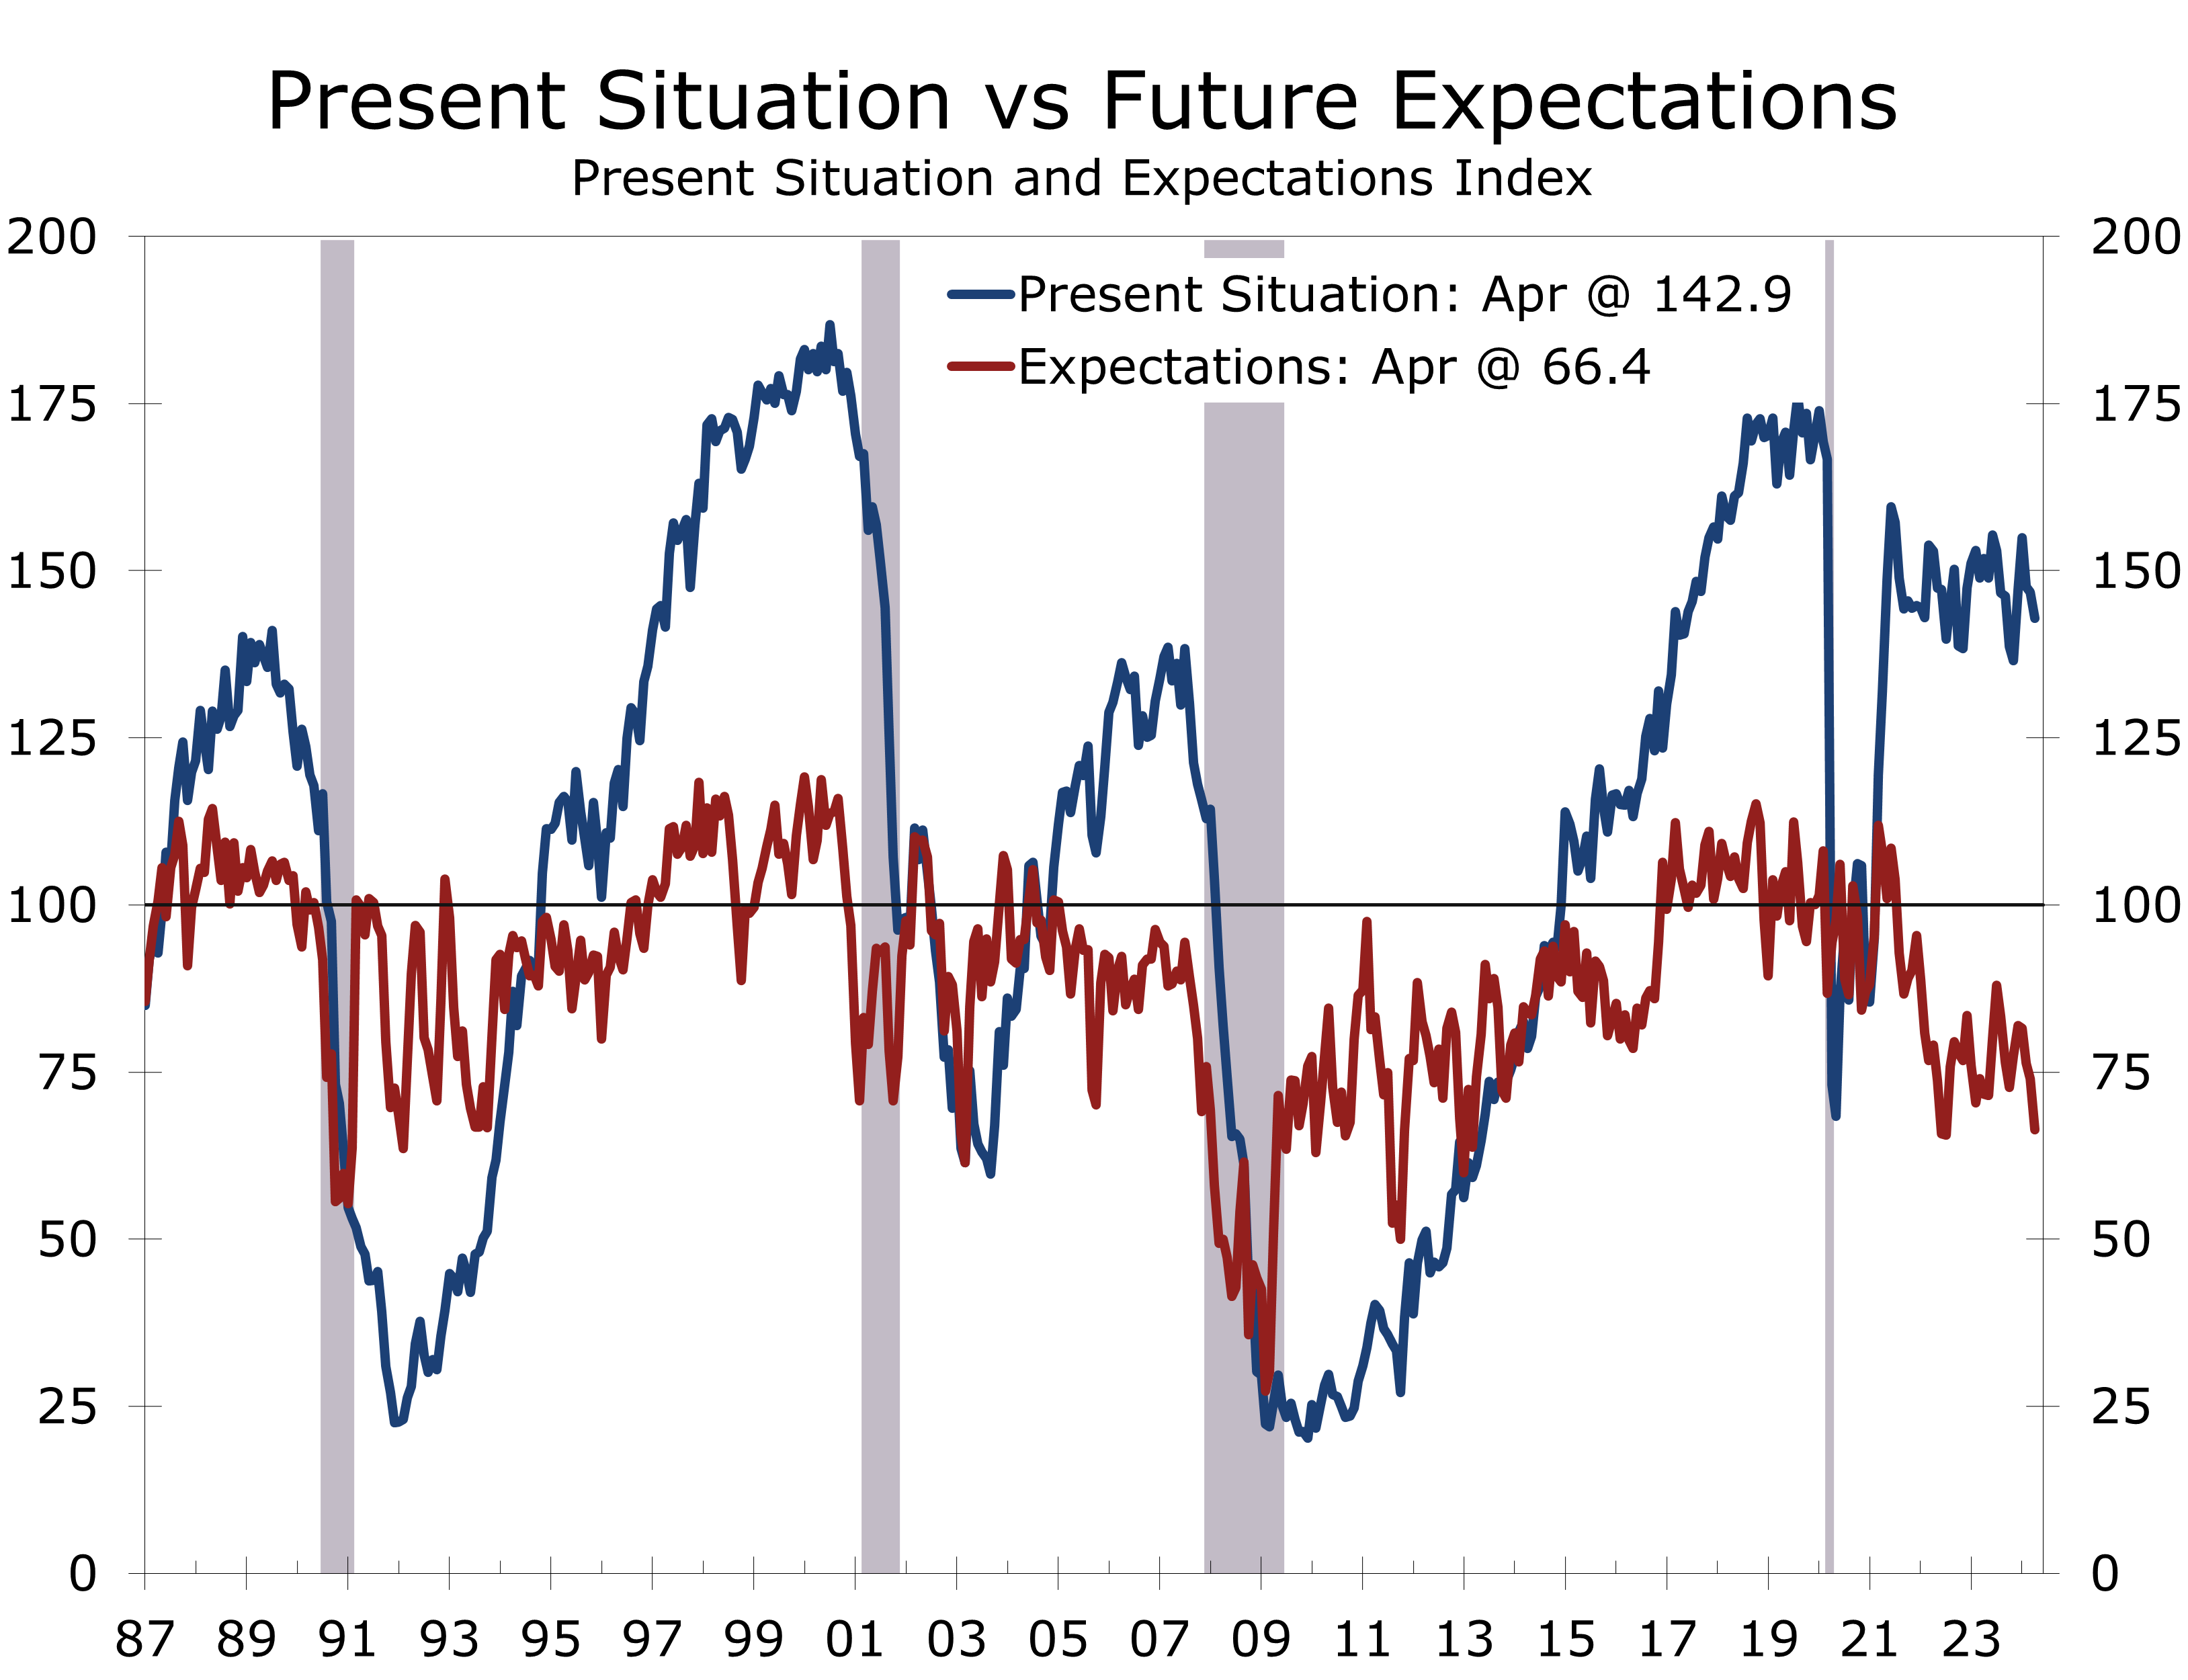
Consumers’ assessment of the present economic situation fell 3.9 points in April to a still robust 142.9. This strong assessment makes sense give the recent strength in retail sales and job growth. The present situation index consists of two questions: how do you rate current business conditions and are jobs plentiful or hard to get? Business conditions improved slightly, with the share of consumers rating conditions as ‘good’ rising 1.4 points to 20.6, and the share rating conditions as bad falling 0.2 points to 17.4.
Views on the labor market were decidedly less upbeat. The share stating ‘jobs were plentiful’ fell 1.5 points to 40.2 and follows a 1.2-point drop in March. The share stating jobs were ‘hard to get’ rose 2.7 points to 14.9. The labor market differential, the difference between the two, fell 4.2 points to 25.3. This drop may tamp down expectations for Friday’s employment report.
Expectations have weakened decisively, reflecting concerns about persistent inflation.
The expectations series fell decisively, tumbling 7.6 points to 66.4 in April. The share of consumers expecting business conditions to improve over the next six months fell 1.5 points to 12.8, while the share looking for conditions to worsen rose 1.4 points to 19.9. The share expecting more jobs to be created over the next six months and share expecting their incomes to increase both declined meaningfully as well.
The Conference Board’s tally of write-in responses noted ‘elevated price levels, especially for food and gas’ dominated consumers’ concerns. Politics and global conflicts were ‘distant runners up’. Consumers assessment of their family’s current and future financial situation both deteriorated in April.
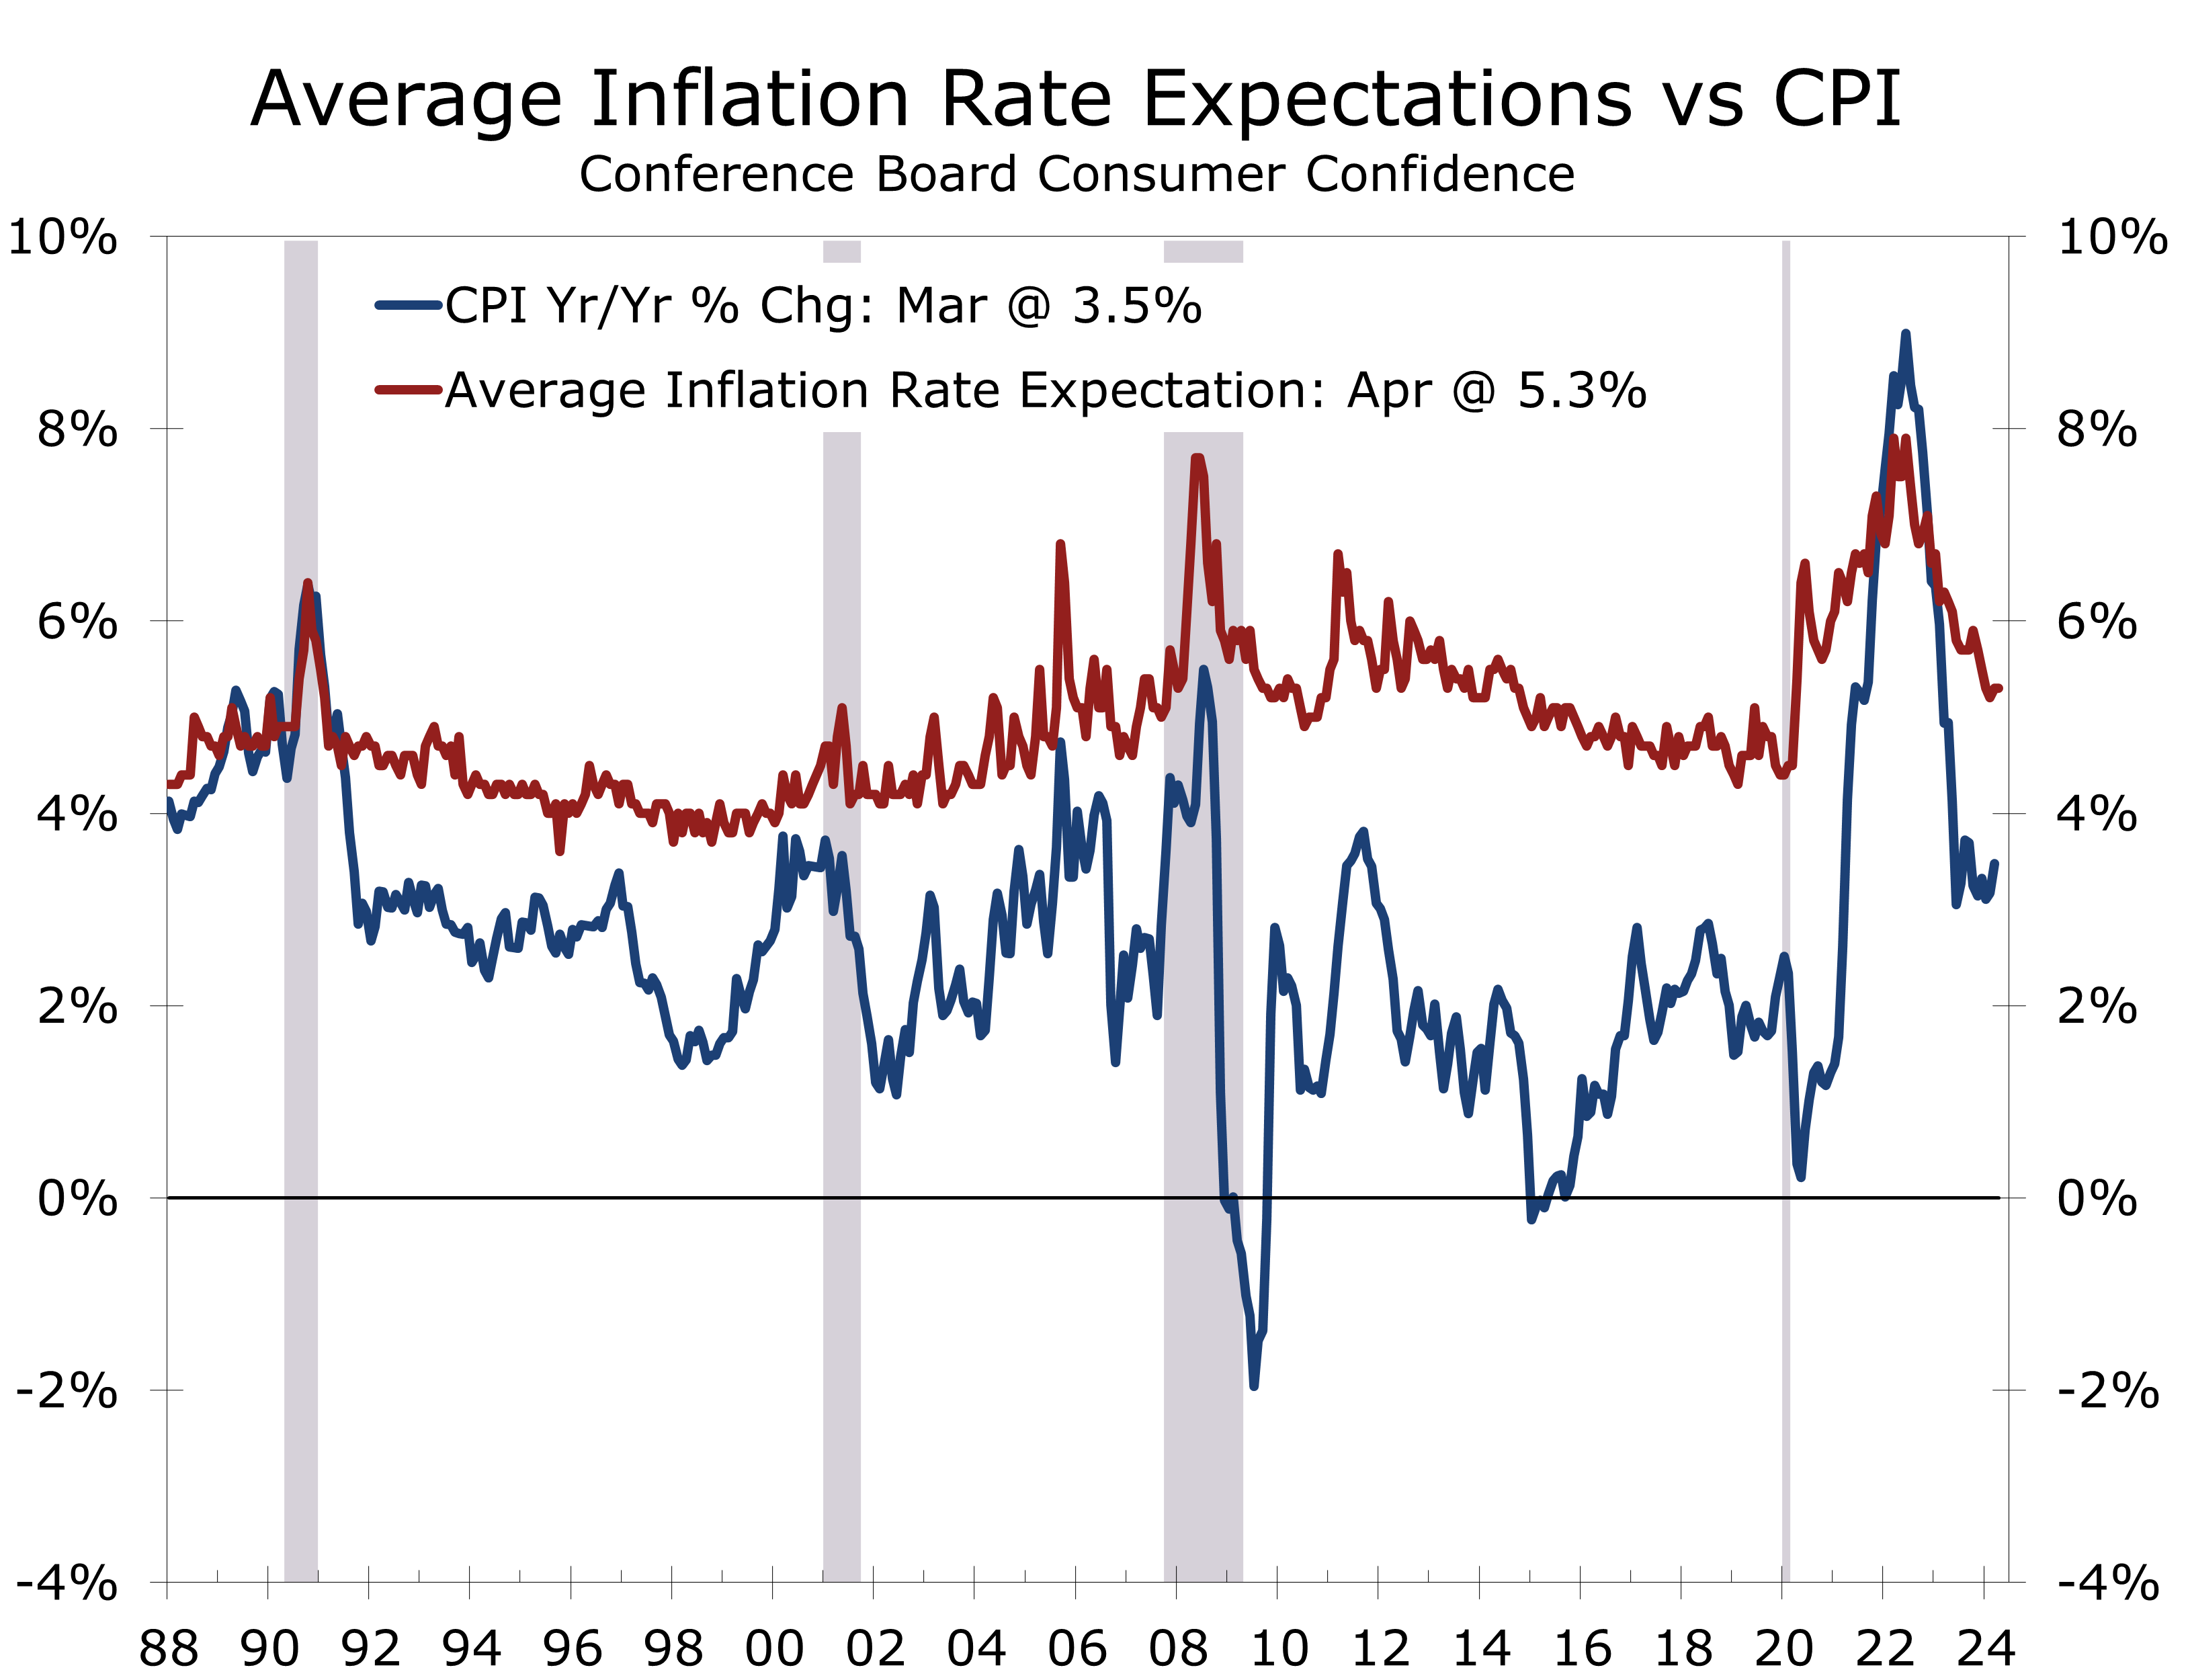
Expectations for inflation over the next 12 months were unchanged at 5.3%. Moreover, the proportion of consumers expecting interest rates to increase over the next year edged higher to 53.8, while the share expect the stock market to rise over the next year fell 1.5 points to 12.8, sliding to its lowest share since March 2009. The cutoff date for the survey was August 24.
Pinched household finances are causing consumers to pull back on interest-rate sensitive purchases. The proportion of consumers planning to buy a home in the next six months fell 1.5 points to 2.5, while the share expecting to purchase a light vehicle fell 0.5 points to 2.2. Consumers also plan to reduce spending for discretionary goods and services, such as dining out (44.8%), clothing (31.5%), entertainment away from home (30.7%), and vacations (23.3%), according to a special survey question ask by the Conference Board.
Disclaimer: This publication has been prepared for informational purposes only and is not intended as a recommendation offer or solicitation with respect to the purchase or sale of any security or other financial product nor does it constitute investment advice.
April 30, 2024
Mark P. Vitner, Chief Economist
mark.vitner@piedmontcrescentcapital.com
Chief Economist (704) 458-4000
Israel Responds with a Precise, Limited Strike
Israel Responds with a Precise, Limited Strike
- Israel retaliated to Iran’s April 13 attack with simultaneous airstrikes on an airbase in Isfahan, Iran, and Iranian proxies in Syria and Iraq.
- The April 19 response was limited in nature and scope.
- Reports indicate missiles were launched at the Artesh airbase in Esfahan, damaging a Russian-made S-300PMU2 surface-to-air missile battery's radar.
- Iran downplayed the Israeli response, claiming, without evidence, that the projectiles were all shot down.
- Satellite images show damage to the S-300 surface-to-air battery's mobile radar.
- While the military target was a radar installation at an airbase guarding Iran’s key nuclear facility, the political target was Iran’s leadership. Israel demonstrated the IDF can hit Iran’s most sensitive installations with pinpoint precession and with little warning.
Israel delivered its response to Iran’s earlier (April 13) missile and drone barrage by launching targeted simultaneous airstrikes an airbase in Isfahan, Iran as well as Iranian proxies in Syria and Iraq. The April 19 Israeli response was limited in nature and scope.
Israel typically refrains from officially acknowledging actions by its military. However, credible reports indicate at least three missiles were launched from outside Iranian airspace, targeting the Artesh airbase in Esfahan, Iran. This airbase provides protection for the Natanz Nuclear Complex, Iran’s main uranium enrichment facility. The target of the strike appears to have been a Russian-made S-300PMU2 surface-to-air missile battery position, and the strike is believed to have damaged the battery’s target engagement radar. Both the International Atomic Energy Agency and various Western and Iranian media outlets have confirmed that Israel did not cause any damage to Iran’s nuclear facilities. Israel also hit Iranian proxy positions in Syria and Iraq, with either missiles or drones.
The IDF successfully sent a meaningful message of deterrence without escalating tensions.
The Israeli Defense Force (IDF) had to walk a fine line of sending a message that Israel has the capabilities and the willingness to respond to an attack on its territory without further escalating the conflict into a full-scale war. This attack appears to have been successful in this regard.
Iran heavily downplayed the Israeli response, claiming that all projectiles were shot down and any explosions were the result of falling debris. The Islamic Republic also downplayed the role of Israel itself and ruled out a retaliatory strike. Iran appears to have given itself an out after weeks of escalation and will likely revert to its prior strategy of conducting its shadow war with Israel through proxies.
Private satellite-based radar pictures from Umbra Space show what appears be damage to the mobile radar of the S-300 surface-to-air battery.[1] Israel is believed to have fired a supersonic Rampage missile at the battery from some point outside of Iranian airspace, and likely fired the missile from an F-35.
The distinction between Iran and Israel’s attacks is striking. In Iran’s previous attack, Israel and its allies had ample time to prepare for the relatively slow-moving drones traversing Jordan, Syria, Iraq, and Saudi Arabia. These drones were accompanied by 120 fast-moving ballistic missiles, synchronized to enter Israeli airspace simultaneously with the drones. In contrast, Israel’s strikes on Isfahan were only revealed after they had been executed. This demonstrates Israel’s capability for stealthy and precise strikes against Iran, contrasting with the Islamic Republic’s more overt approach that was designed as much to garner media attention as it was to sow terror.
Iran’s intended military target was to terrify Israeli citizens and its political target was mollify hard-liner Islamic leaders in and outside Iran.
The difference in how the two nations chose to strike one another is their respective military capabilities and political priorities. Iran military aim was to terrify the Israeli public and cause Israel and its allies to use their relatively expensive defensive systems to counter relatively inexpensive drones and missiles.
Iran’s key political objective was to mollify hard-liner Islamic groups within Iran and its Middle East surrogates. The Iranian attack failed on the former and only partially succeeded on the latter. Iranians were shown pictures and video of fires in Texas and Chile and told that it was Israel.
Israel’s attack was primarily driven by political considerations. They could not let Iran’s drone and missile barrage go unanswered, as it would lead to more intense future attacks. The intended political target for the Israeli strikes was Iran’s leadership, which now knows the IDF can stealthily hit their most sensitive installations with pinpoint precession.
Israel is not the first country to directly strike Iran this year. In January, Pakistan launched airstrikes against targets in western Iran as a response to an Iranian missile strike on its territory. After this tit-for-tat exchange, the two countries made amends and no further hostilities followed.
Tensions between Iran and Israel will obviously remain hostile for the foreseeable future, but their recent exchange bears some similarities to the January Iran-Pakistan clashes in that the strikes caused few casualties and were clearly designed to showcase capabilities rather than instigate a broader conflict.
Passover may bring calm to the region but there is still plenty of potential for a re-escalation.
While Iran and Israel have de-escalated over the past few days, broader war is not out of the picture entirely. Israel’s anticipated Rafah offensive still looms, as does the potential for an Israeli move on southern Lebanon to confront Iranian-proxy Hezbollah. Iran could use either as justification for more attacks. Iran pulled most of its key military advisors out of Syria and Lebanon so that they would not be targeted by Israel. The return of those advisors would raise the possibility of additional strikes against those Iranian forces, particularly if they are engaging in planning or executing attacks on Israel.
This week marks the beginning of Passover, which might bring a period of relative calm in the conflict. Large and disruptive protests at Columbia University and other universities also raise the political stakes in the United States. These protests appear to be amplified by outside interests, which may account some of bellicose rhetoric. Israel has been cautioned about how it should proceed with a final push against Hamas forces in Rafah, and an attack resulting in a large number of civilian casualties would likely raise the decibel level of those protests and spark some political backlash.
The long delayed $17 billion military aid package to Israel passed the House over the weekend and looks certain to pass the Senate. The program will allow Israel to replenish and enhance their Iron Dome missile defense system and other critical air defense systems, as well as fund purchases of weapons, defense systems and other needed supplies. The measure also includes $9 billion of aid to Gaza and other war-torn areas around the world.
Disclaimer: This publication has been prepared for informational purposes only and is not intended as a recommendation offer or solicitation with respect to the purchase or sale of any security or other financial product nor does it constitute investment advice.
April 23, 2024
mark.vitner@piedmontcrescentcapital.com
Chief Economist (704) 458-4000
saul.vitner@piedmontcrescentcapital.com
Policy Analyst (704) 458-8570
Housing Starts Pull Back in March
Surprising Weakness in Both Starts and Permits
- Housing starts plunged 14.7% to a 1.321 million unit annual pace in March.
- Single-family starts fell 12.4% to a still solid 1.022 million unit pace, while starts of multi-family homes tumbled 21.7% to a 299,000-unit pace, the slowest pace since the pandemic low hit in April 2020.
- Building permits fell less dramatically, with single-family falling 5.7% and multi-family falling 1.2%.
- Home builder confidence was unchanged in April at 51, but expectations for home sales over the next six months weakened slightly.
- We suspect that seasonal issues are behind much of the pullback in housing starts. Milder than usual weather had allowed builders to begin work on more homes than usual during January and February, particularly in the Northeast and Midwest. As a result, there was a smaller than usual pickup in activity in March, resulting in a large seasonally adjusted drop. On a year-to-date basis through March, single-family starts are up a whopping 27.1% from the first three months on last year.
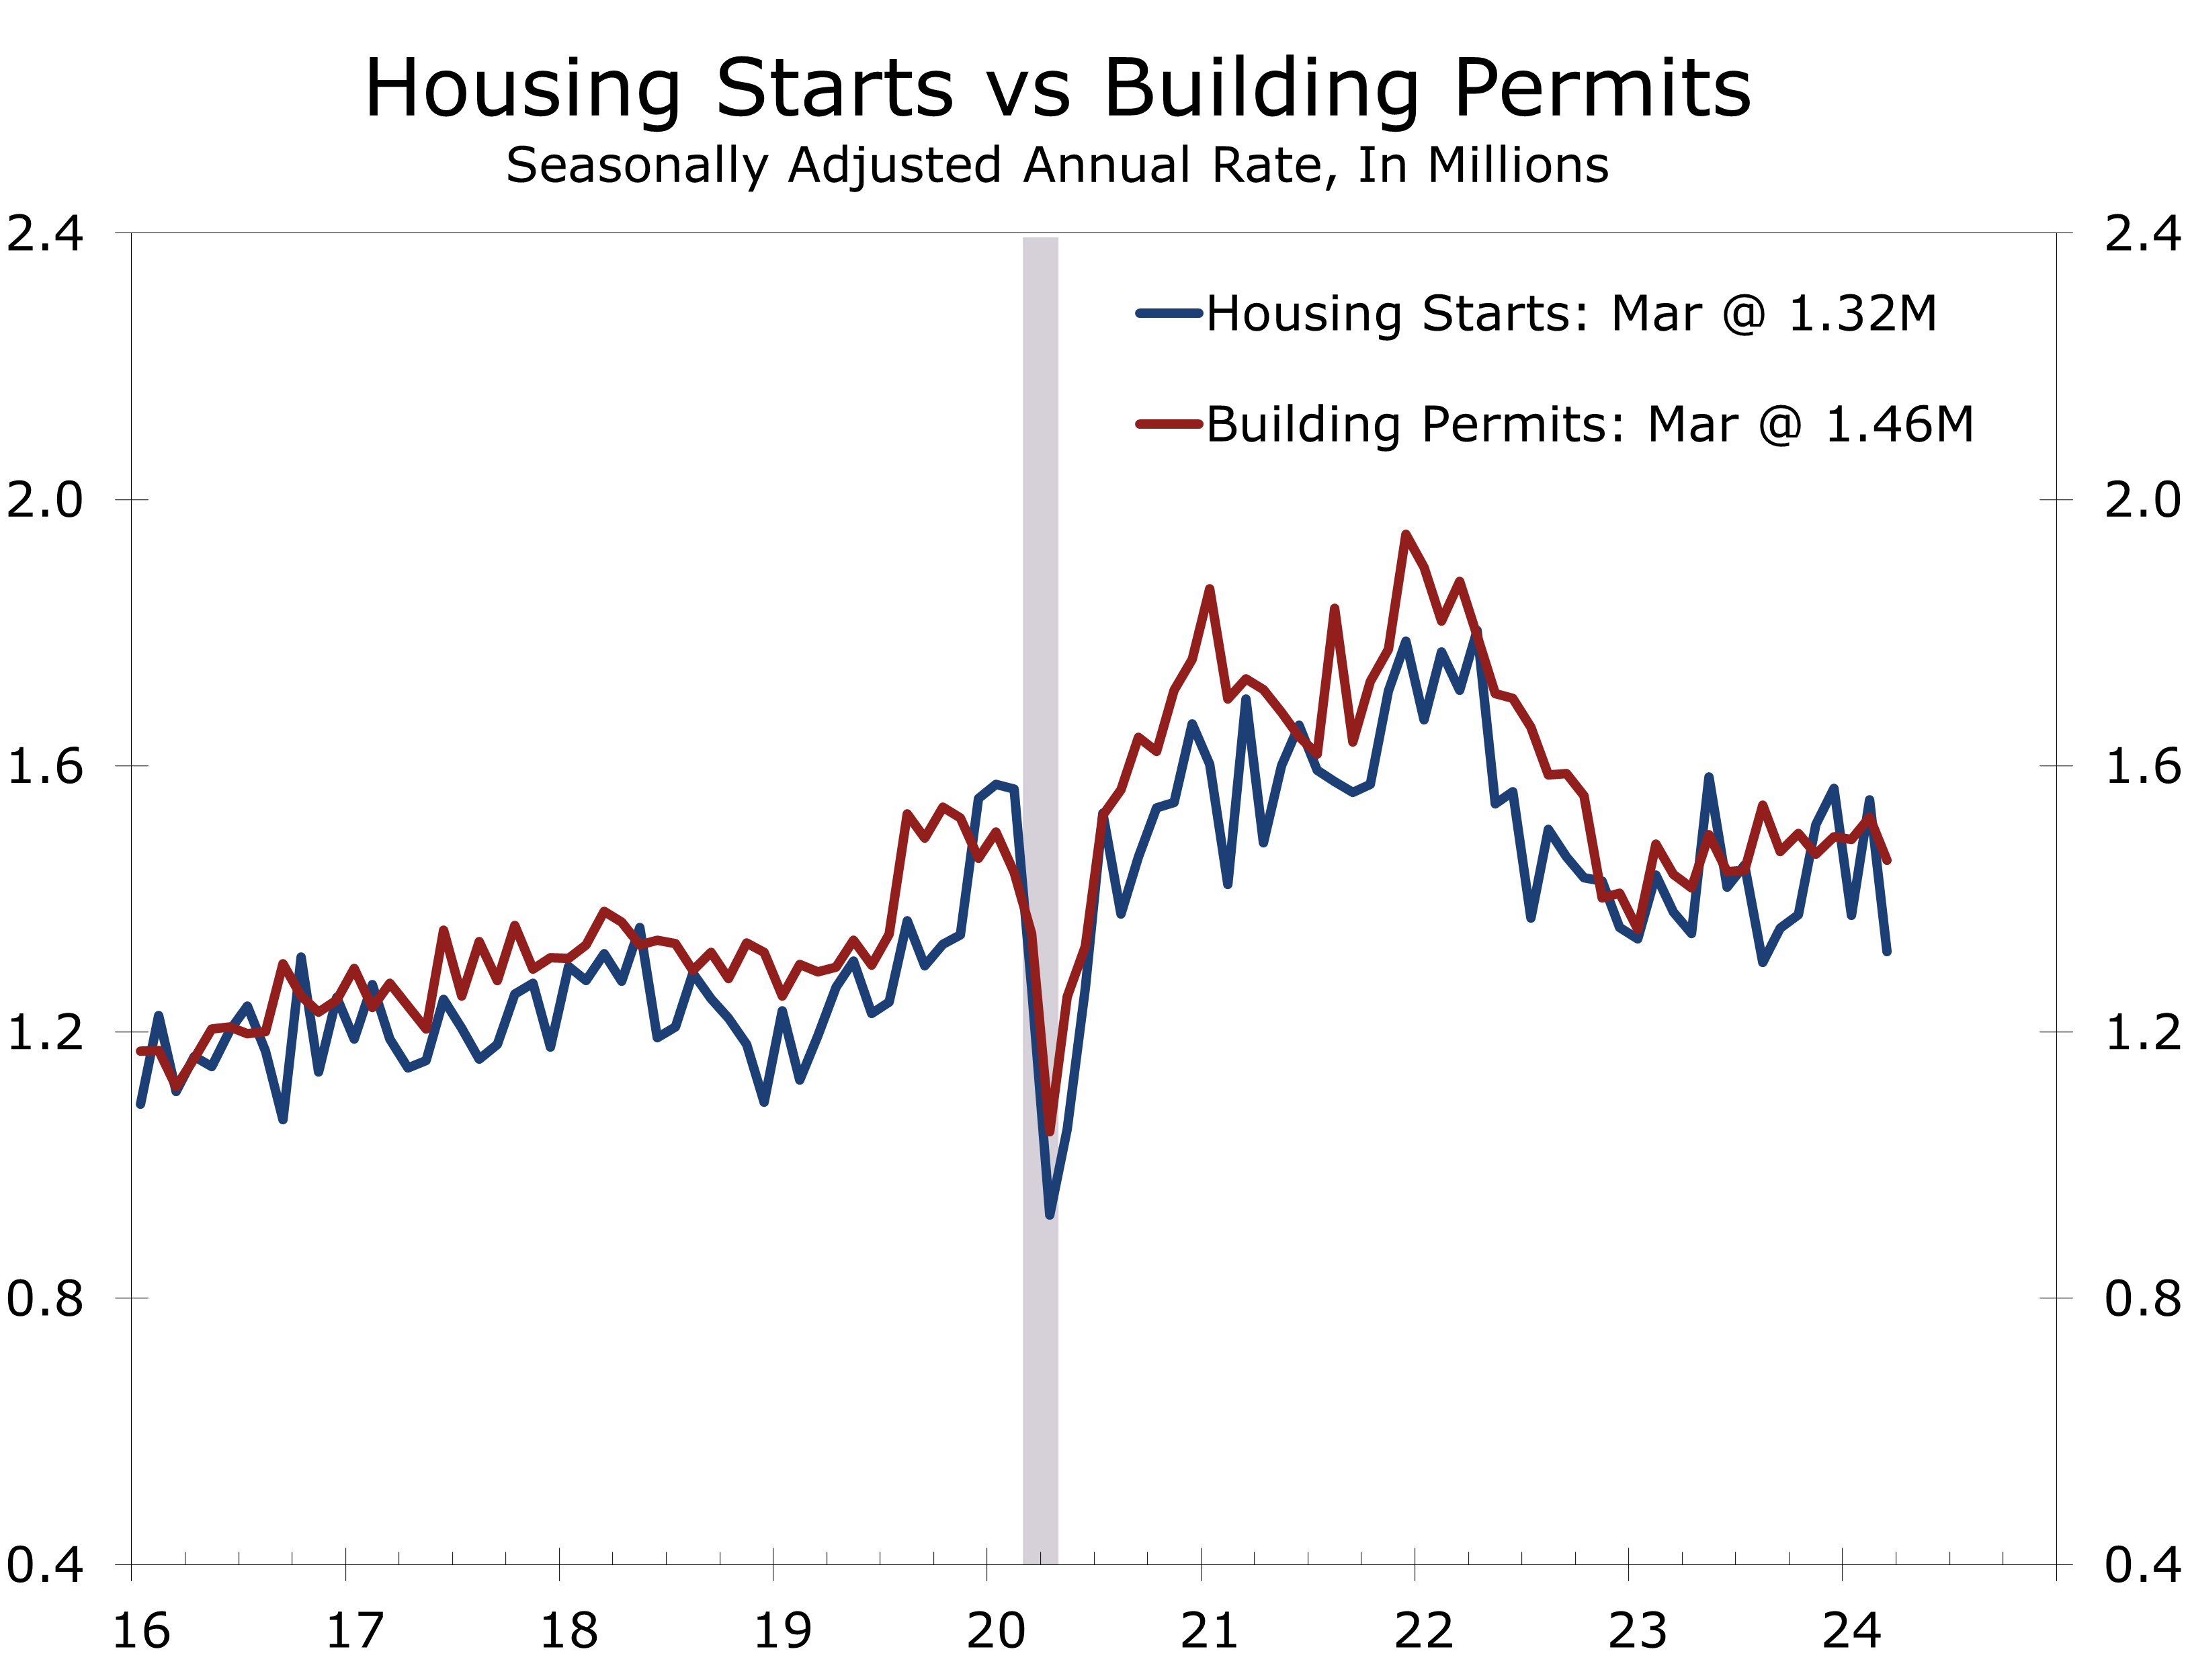
After months of predominantly upside economic surprises, housing starts plunged 14.7% to a 1.321 million unit annual rate, which was well below market expectations. Both single-family and multi-family starts fell sharply during the month, with the latter falling to its lowest level since its pandemic low, hit in April 2020.
Building permits fell less drastically, with overall permits falling 4.3% to a 1.458-million unit pace. Single-family permits fell 5.7% to a 973,000-unit pace, while multi-family permits fell 1.2% to 485,000 units.
While the drop in starts comes at a time that mortgage rates have spiked, the most recent spike in rates occurred well after the period covered by the March starts. We suspect the culprit was more innocuous. Milder weather allowed builders to begin work on more homes during the normally seasonally slow January and February period, which meant activity picked up less than usual in March, resulting in a large seasonally adjusted decline.
Seasonal factors likely exaggerated the slide in housing starts. Permits provide a better guide.
Permits are less volatile and provide a better indication of the underlying trend in home building. We expect starts to rebound, with single-family starts rising to around a 1.1 million unit pace later this spring and summer. Multi-family starts also appear poised for a rebound, with March’s 299,000 pace substantially below the most recent level for multi-family permits.
Higher mortgage rates will clearly impact the housing outlook. Rates spiked following the release of the March CPI, on April 10, and have remained high ever since. That news clearly came too late to impact March housing starts but also appears to have come too late to impact the April NAHB/Well Fargo Home Builders Index (HMI), which was unchanged at 51 in April.
The components of the HMI were mixed in April, with builders’ assessment of present sales rising 1 point to 57 and traffic of prospective buyers rising 1 point to 35. Expectations for sales over the next six months fell 2 points to 60, however, likely reflecting growing concerns about higher interest rates.
Higher interest rates puts hopes for revival in home building at risk.
So far, home builders have adapted to higher interest rates remarkably well. Builders have shifted incentive budgets to rate buy downs, which has helped reduce the sting from higher mortgage rates, particularly for first-time buyers. Unfortunately, interest rates now look like they will remain higher for even longer. A string of hotter than expected inflation reports and stronger than expected job growth and consumer spending has likely pushed the prospect of rate hikes into either late this summer or even this fall. We now expect the Fed to reduce rates only 2 times this year, with cuts coming in September and December.
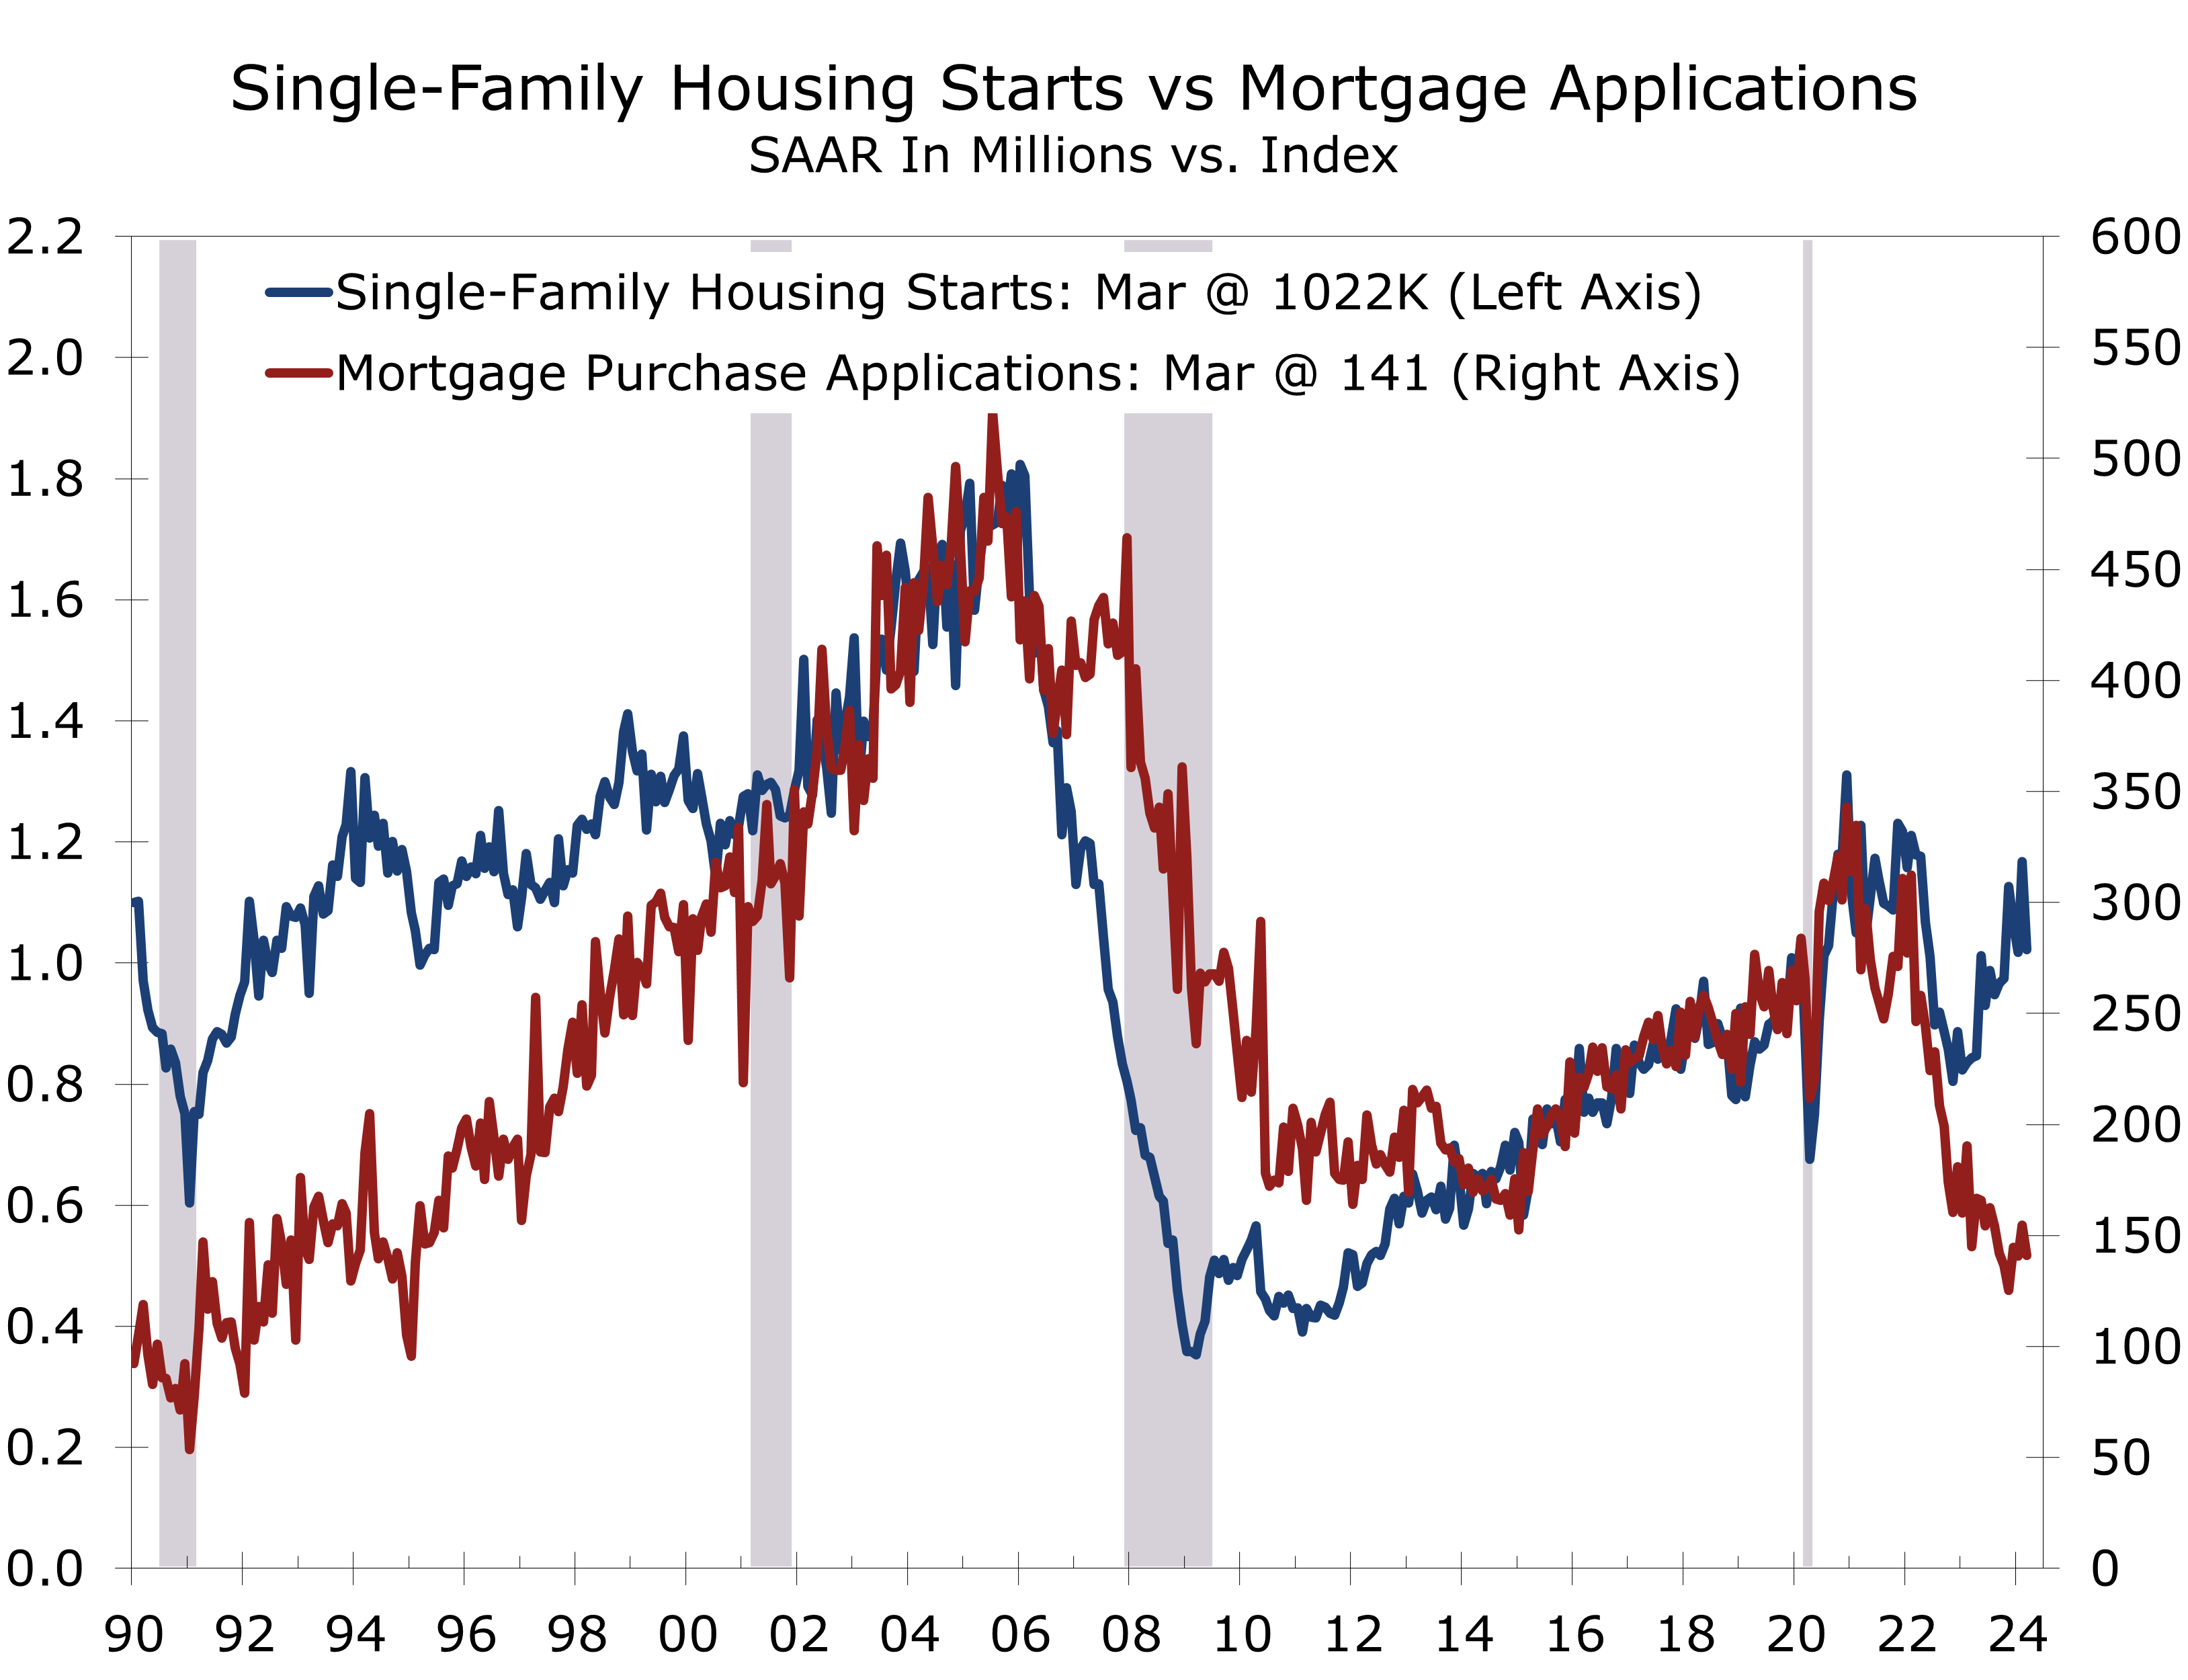
Even our more cautious rate outlook looks like a stretch today, with the financial markets currently pricing in just 1 quarter-point cut in the federal funds rate over the next year. Housing starts may have gotten a little ahead of themselves, anticipating a continued buyer shift away from existing homes. A wide gap has opened up between single-family starts and mortgage purchase applications from its normally tight relationship.
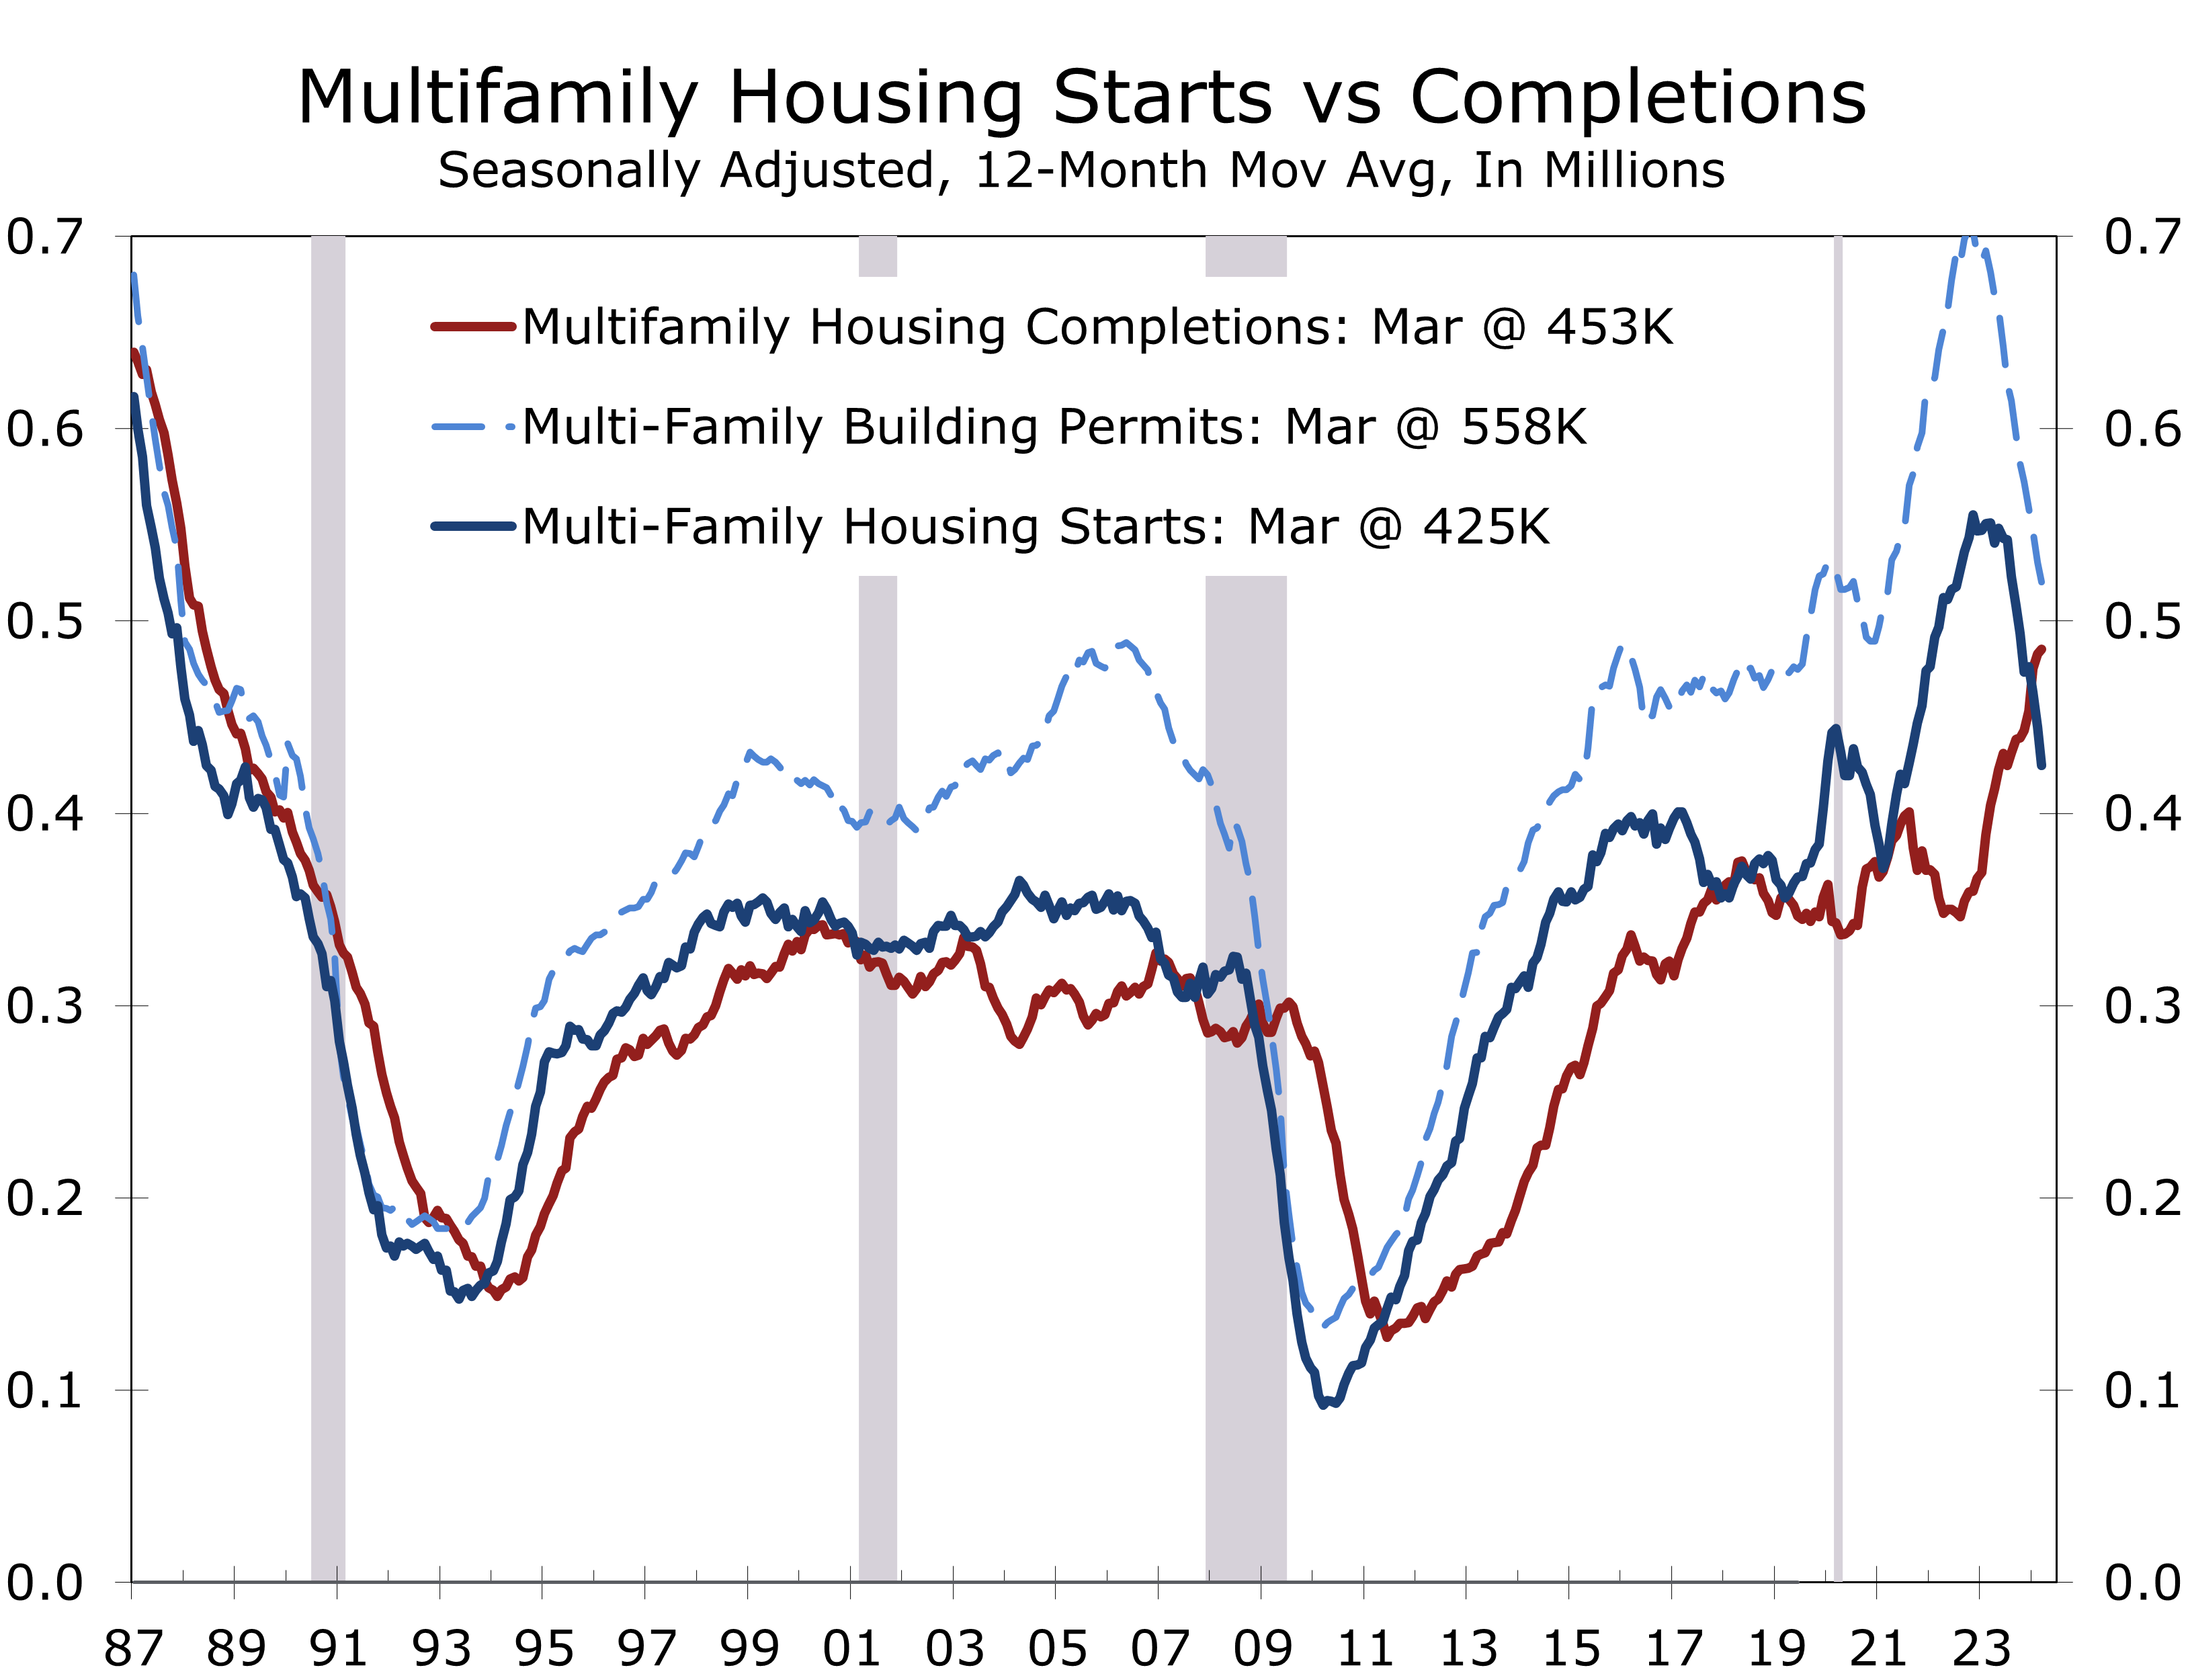
A 21.7% plunge in multifamily starts accounted for much of the pullback in overall housing starts during March. At just a 299,000-unit pace, multifamily starts are now substantially below permits, which came in at a 485,000 unit pace. We expect the gap between starts and permits to narrow next month.
Longer term, apartment construction is undergoing a multi-year correction as projects started over the past few years are increasingly being completed. That surge in completions is pulling vacancy rates higher and reducing rents. Securing credit for new apartment projects is becoming more challenging, which will weigh on apartment starts. Our latest forecast has single-family starts rising to just under 1.1 million units this year, while multifamily starts fall to 350,000 units.
Disclaimer: This publication has been prepared for informational purposes only and is not intended as a recommendation offer or solicitation with respect to the purchase or sale of any security or other financial product nor does it constitute investment advice.
April 16, 2024
Mark P. Vitner, Chief Economist
mark.vitner@piedmontcrescentcapital.com
Chief Economist (704) 458-4000
Iran’s Attack on Israel: A Strategic Setback
Iran’s Attack on Israel: A Strategic Setback
- Iran launched a significant retaliatory attack against Israel following an earlier Israeli strike that killed two Iranian generals believed to have been key figures behind the planning, training, and arming of Hamas for the October 7 attacks on Israel.
- Israel successfully intercepted over 99% of the drones and missiles that entered is airspace, while Jordan, Saudi Arabia and the U.S. helped thin the onslaught by downing many drones and missiles over Jordan, Iraq, Saudi Arabia, and Syria.
- Jordanian and Saudi coordination with Israel indicates a lack of sympathy for Iran in the region.
- Iran’s leaders have stated they now feel the matter is closed, which raises the stakes for Israel if they were to respond with a counterattack.
- We put the odds of Israel overtly attacking Iran at just slightly better than 50%, as covert means have historically been extraordinarily successful for Israel and diplomatically more palatable to its allies. An attack that goes unanswered, however, invites additional attacks that are likely to grow even more ferocious and destabilizing
Early Sunday morning (Saturday night in the U.S.), Iran launched hundreds of missiles and drones against Israel from its own territory in conjunction with its proxies in Lebanon and Yemen. The attack was a much-anticipated response to the Israeli strike on what Iran claims to had been a facility connected to its consulate in Damascus on April 1. That strike killed several top Iranian military officials, including Mohammed Reza Zahedi, a senior commander in Iran’s Islamic Revolutionary Guard Corps and Brigadier General Mohammad Hadi Haj Rahmi. Iran vowed swift retribution for the strike, and both American and Israeli intelligence believed such an attack was imminent days before it occurred.
Some feared a strong Iranian response would overwhelm Israel’s Iron Dome missile defense network. Israel successfully intercepted over 99% of the drones that entered its airspace. Minor damage was reported to one Israeli air base while two citizens were critically injured. Iran declared its response a success despite the minimal level of damage it wrought. The bar for success is low, however, with the goal being to appease hardline supporters of the regime within Iran and preserve the confidence of its key proxies (Hamas, Hezbollah, and the Houthis).
Most drones and missiles were intercepted before they entered Israeli airspace. Unconfirmed reports also note that a sizable proportion of Iranian missiles and drones either failed to launch or crashed to the ground on their own accord shortly after being launched. The attack was expected to include around 500 drones and missiles, from Iran and its proxies, but only around 300 are believed to have transited Syrian, Jordanian, Saudi, and Israeli airspace.
American, British, Jordanian, and Saudi militaries collaborated in shooting down Iranian drones as they flew over Jordan, Syria, and Iraq. The inclusion and effectiveness of Jordan and Saudi Arabia in this coalition impedes the narrative that Israel has been abandoned entirely by the Arab world. Saudi Arabia and Jordan have obviously planned and trained for such a contingency and the professionalism of their military leadership and skills of their fighter pilots and air defense systems is one of the more notable positive surprises from this confrontation.
Despite what Tehran and Israel say, it is difficult to see the events of April 13-14 as anything but a victory for Israel. Damage inflicted to Israeli bases was minimal. The Wall Street Journal reported that as many as half of Iran’s missiles either failed to launch or crashed prematurely. While fears about Iran’s military arsenal were amplified by the media, that arsenal ultimately proved impotent once it was compelled to act. We cannot see how an unanswered attack on Israel would ever be considered a victory by Israel.
That said, the geopolitical implications are more damning for Iran. Jordanian and Saudi coordination with Israel reveals the lack of sympathy Iran would receive should a regional war break out. Jordan has come under much internal pressure to adopt a more pro-Palestinian position, although its monarchy continues to have positive relations with Israel. Saudi Arabia still has no formal ties with Israel. The two countries were in the process of normalization prior to the October 7 attack. Disrupting normalization was a goal of Iran and its proxies in provoking the war in Gaza. The path to normalizing relations now looks as though it was merely delayed.
Israel has now vowed to respond to Iran’s attack, possibly with a direct strike on Iran. There is much Israel needs to consider before taking such an action. For one, the Biden administration has pledged not to assist an Israeli offensive action against Iran. President Biden has advised Benjamin Netanyahu to “take the win.” For its part, Israel does not consider the successful thwarting of Iran’s attack as a victory. The attack marks a notable escalation in how Iran will respond to attacks on its proxies or direct support of them. Those proxies are working to destroy Israel and the conflict with them will continue until Iran ends its support for them.
America and its Arab allies could be less receptive to assisting Israel in the event of an Iranian response to an Israeli counterattack. A targeted attack on a military or naval facility would be more palatable but would provide little long-term benefit to Israel or deterrent. A more likely target would be to increase attacks on Iranian proxies. Israel has already significantly downgraded the military threat from Hamas, effectively removing one of Iran’s chess pieces from the board. An effective strike on Hezbollah coupled with some sort of covert action against key Iranian defense infrastructure would seem to be a more effective way for Israel to counter Iran’s escalation, without jeopardizing the sudden upsurge in support Israel has received from the U.S., Britain, and its Arab neighbors.
The financial markets rallied at the open Monday morning and oil prices have stabilized around recent levels. The financial markets will likely remain on edge for the next few weeks. Passover begins next week but holy days have provided little protection from conflicts of late. The greatest threat to Israel is now Hezbollah, which has thousands of rockets positioned just across Israel’s northern border. Congressional approval of a modest aid package to Israel would have a strong psychological impact on Israel and its adversaries. Its odds of passage have increased following this weekend’s events.
Disclaimer: This publication has been prepared for informational purposes only and is not intended as a recommendation offer or solicitation with respect to the purchase or sale of any security or other financial product nor does it constitute investment advice.
April 15, 2024
mark.vitner@piedmontcrescentcapital.com
Chief Economist (704) 458-4000
saul.vitner@piedmontcrescentcapital.com
Policy Analyst (704) 458-8570
Consumer Prices Top Expectations Once Again
Inflation Continues to Run Hot
- Both the headline and core CPI rose 0.4% in March, matching gains for the prior month and besting the consensus by 0.1 percentage point. The overall CPI is now up 3.5% over the past year, while the core CPI is up 3.8%.
- We have continuously warned our readers the inflation data would come in hot during the first few months of 2024, reflecting higher labor costs, some catchup in insurance costs, and ongoing seasonal adjustment issues.
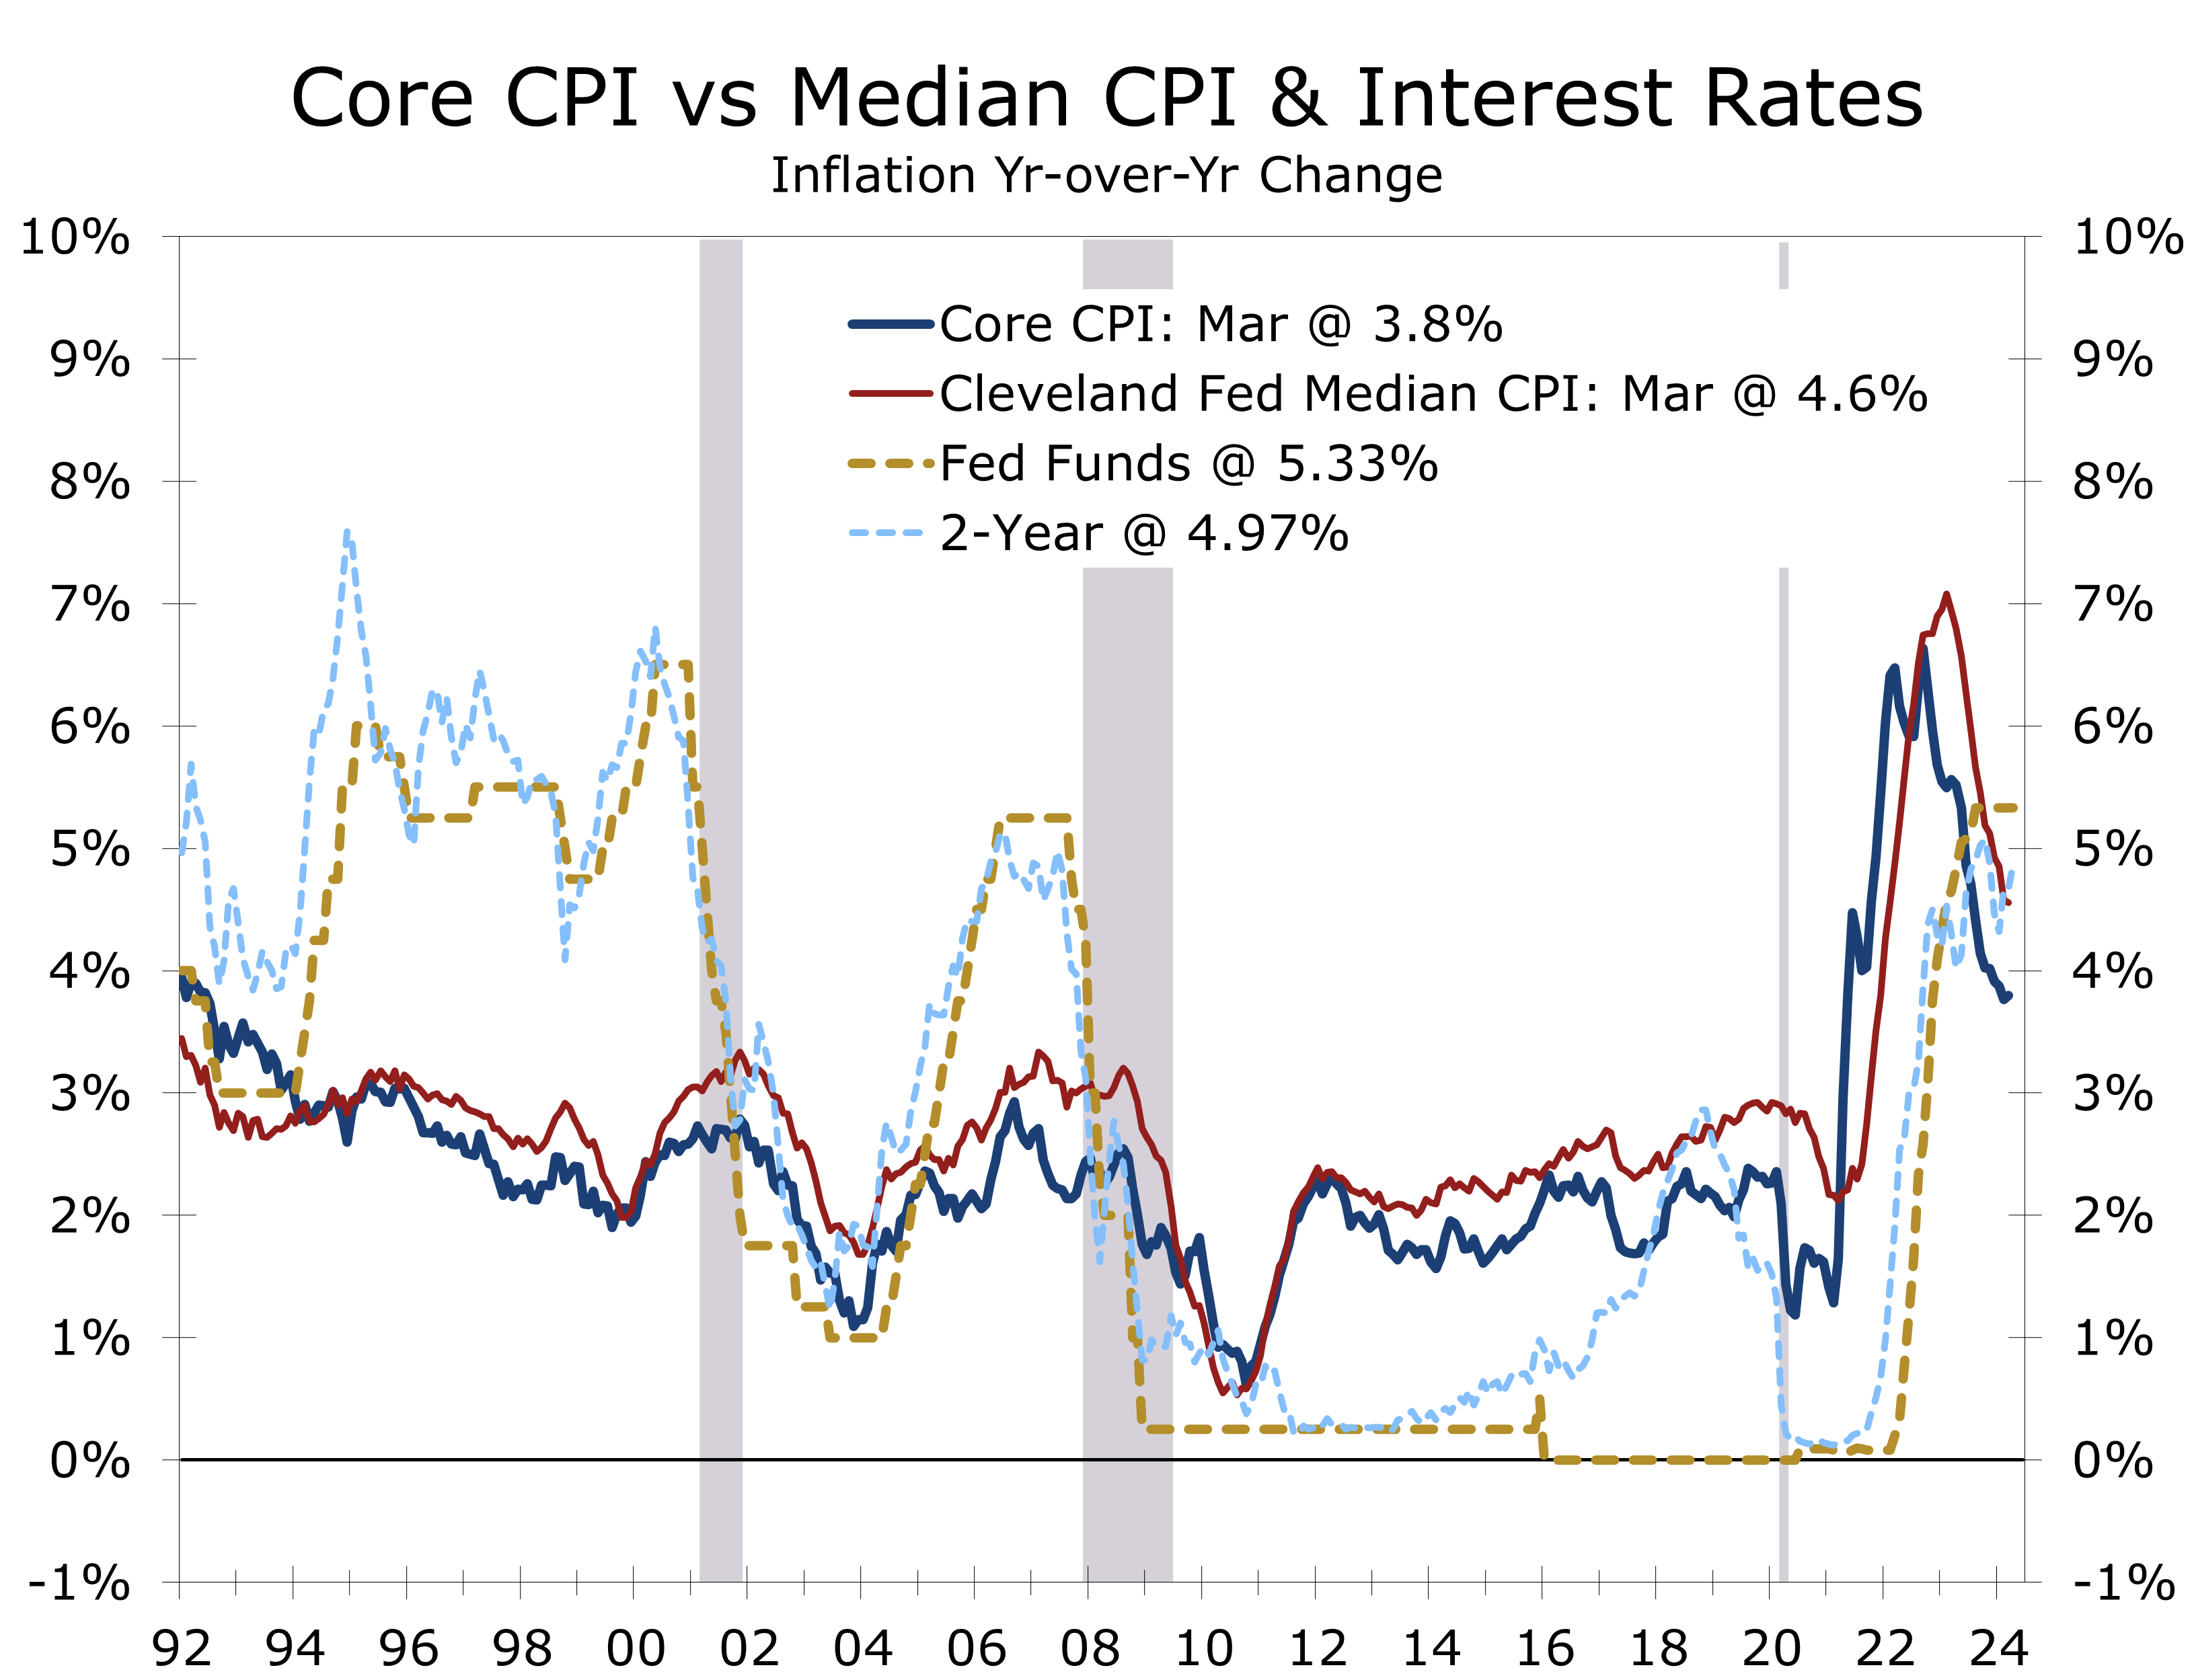
- While a handful of items, including motor vehicle insurance, auto reports and health care posted outsized gains in March, price increases continue to be fairly broad based. The median CPI rose 0.4% and is up 4.6% over the past year, while the trimmed mean rose 0.3% and is up 3.6% year-to-year.
- Energy prices rose 1.1% in March, with gasoline prices jumping 1.7% and electricity prices rising 0.9%. Food prices were tame, with grocery store prices unchanged for the second month in a row.
- Higher inflation will make it tougher for the Fed to cut interest rates. We expect the data to improve this summer, however, and look for job growth to moderate. Two cuts are now more appropriate than three, with the first in July, followed by another in September.
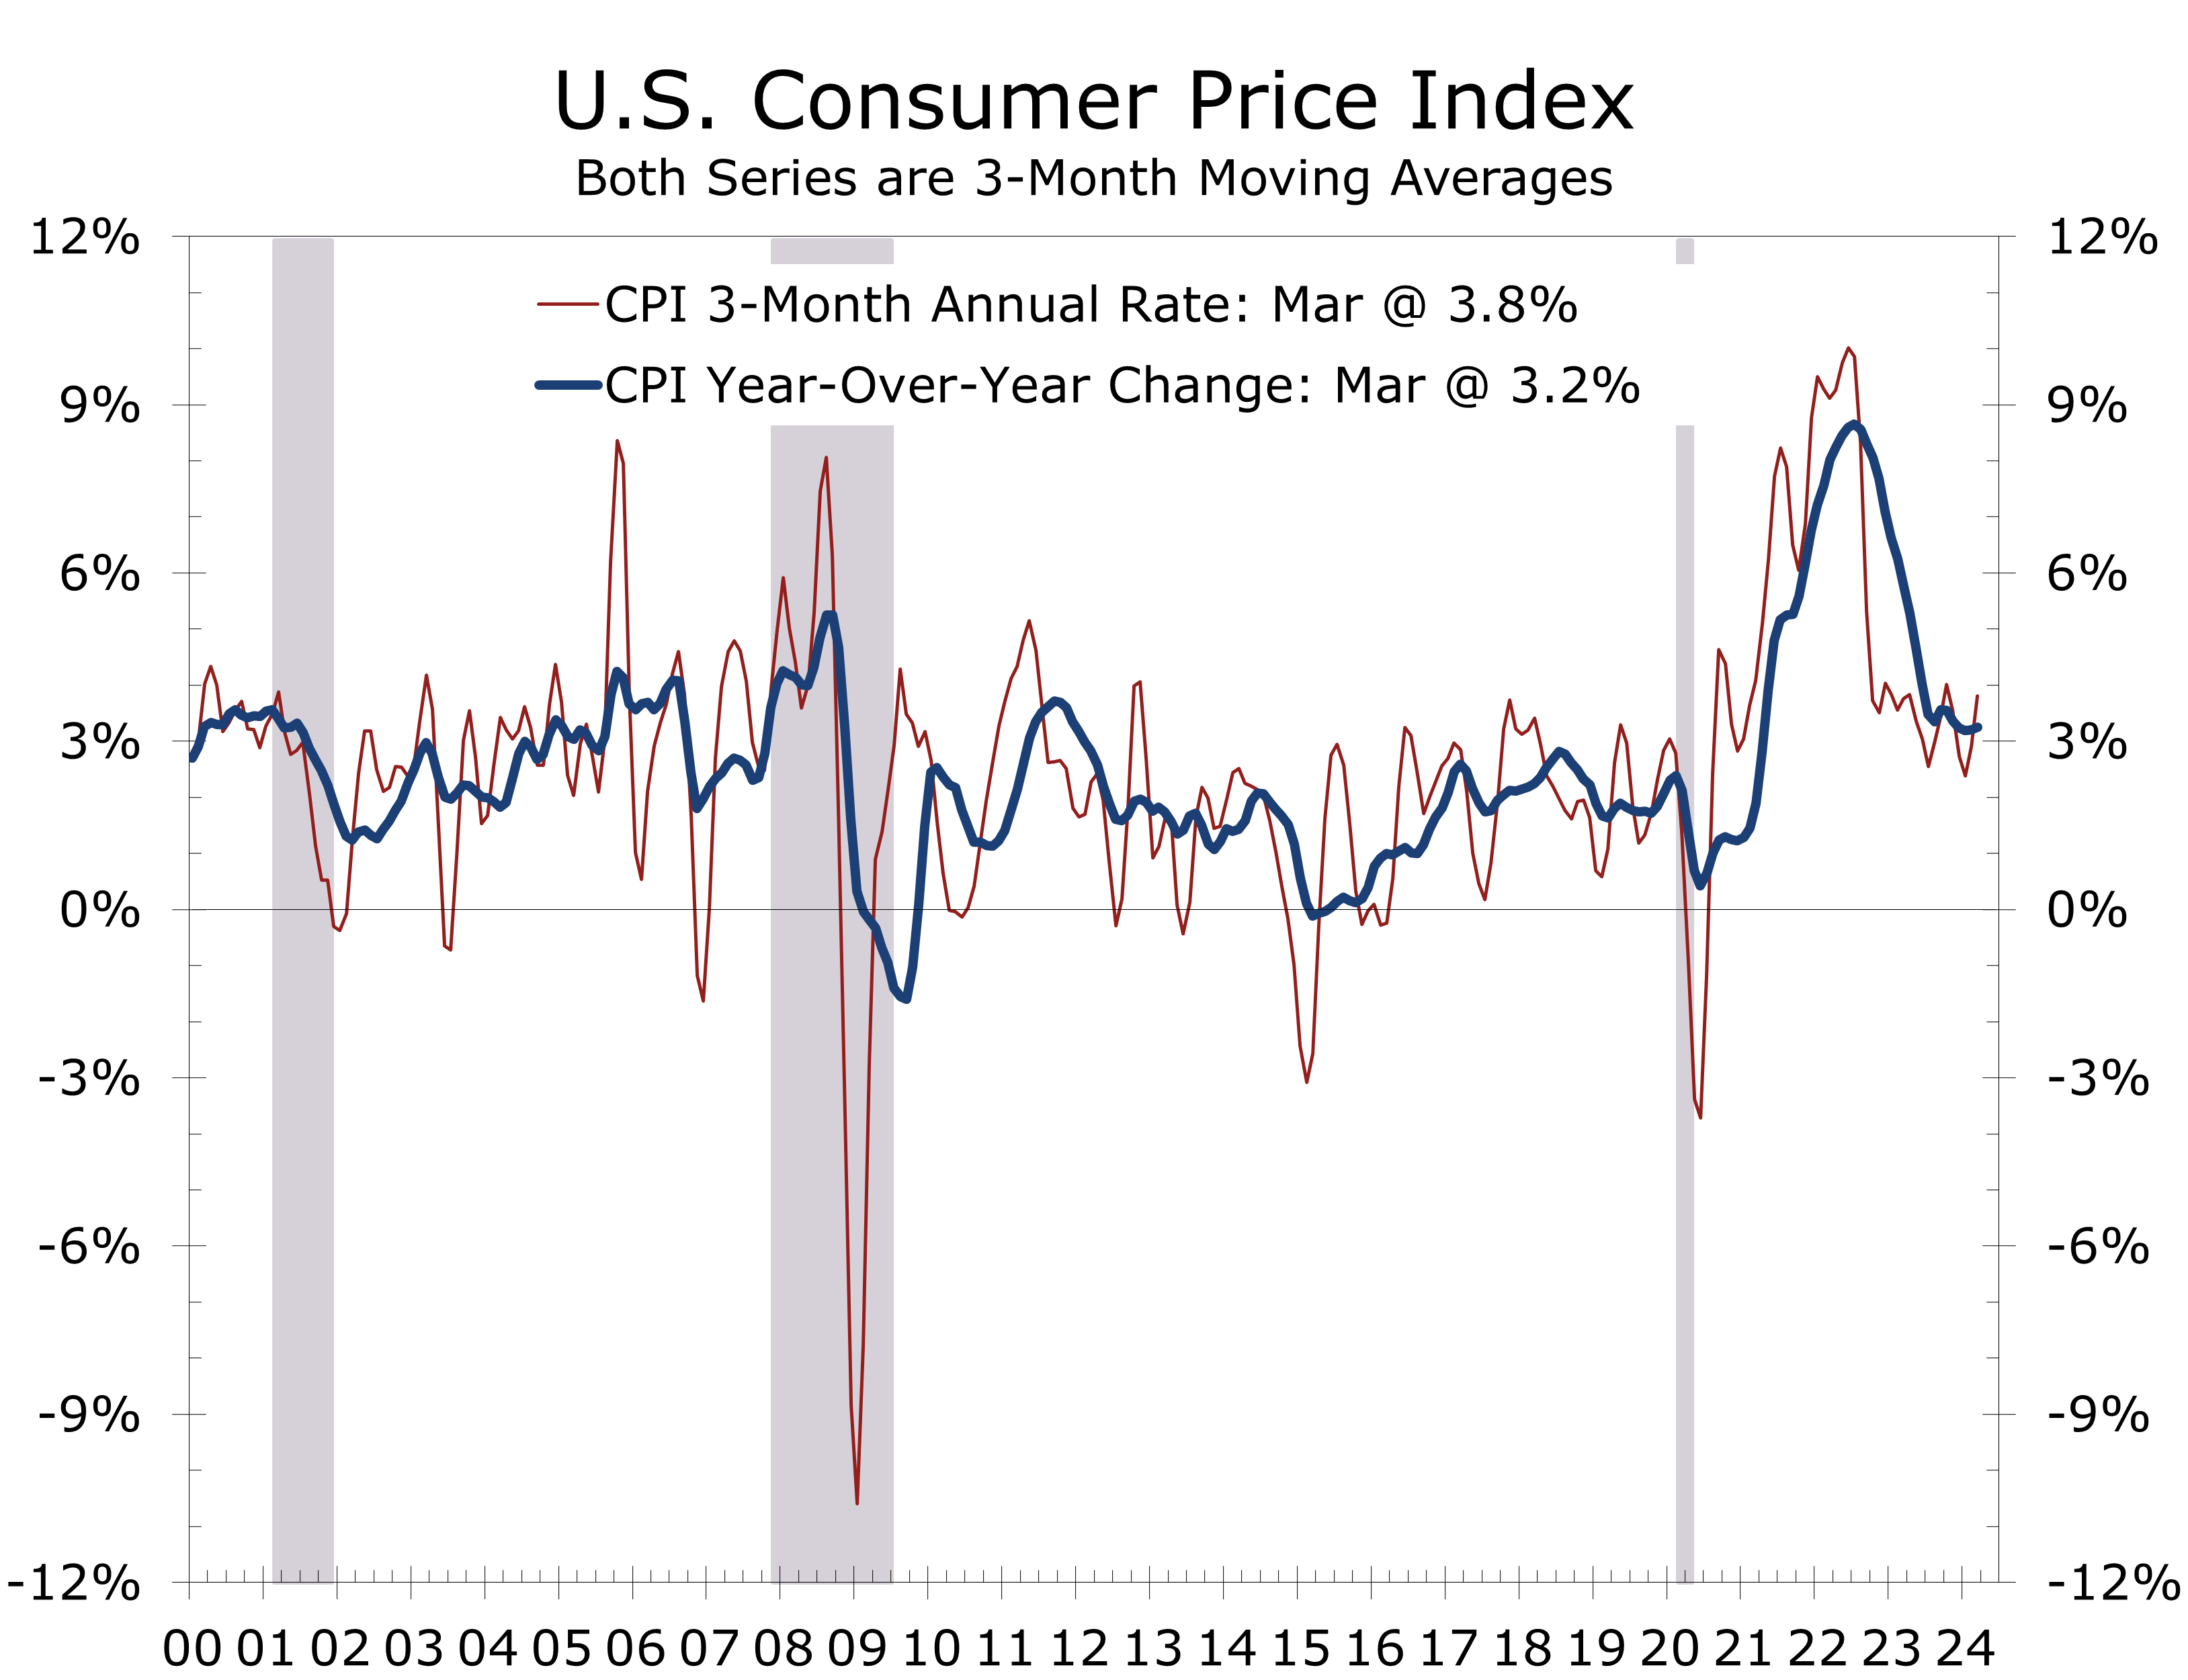
The latest inflation data surprised the financial markets, revealing that the higher-than-expected inflation reported earlier this year persisted into March. The Consumer Price Index (CPI) increased by 0.4% in March, matching the gains of the previous month. Prices excluding food and energy items, the so-called core CPI, also rose 0.4%, marking the third consecutive month the core CPI rose by that amount.
This uptick in inflation represents a bit of a reversal. The headline CPI surged at a 3.8% annual rate in the first three months of this year, bouncing back from a brief dip below 3% a few months ago.
The higher inflation figures for the past few months cast doubt on the sharp deceleration posted this past year. That earlier drop was mostly due to lower energy prices, which reversed late last year. Prices for other goods and services have also moderated.
The sharp moderation in the CPI since mid-2022 appears to have pivoted to a slower trajectory.
We look for inflation to moderate further this year but much less dramatically than it did from mid-2022 to late last year. Prices for labor-intensive services remain one of the greatest challenges, as do housing costs. Geopolitical risks could also slow progress by elevating oil prices and shipping costs.
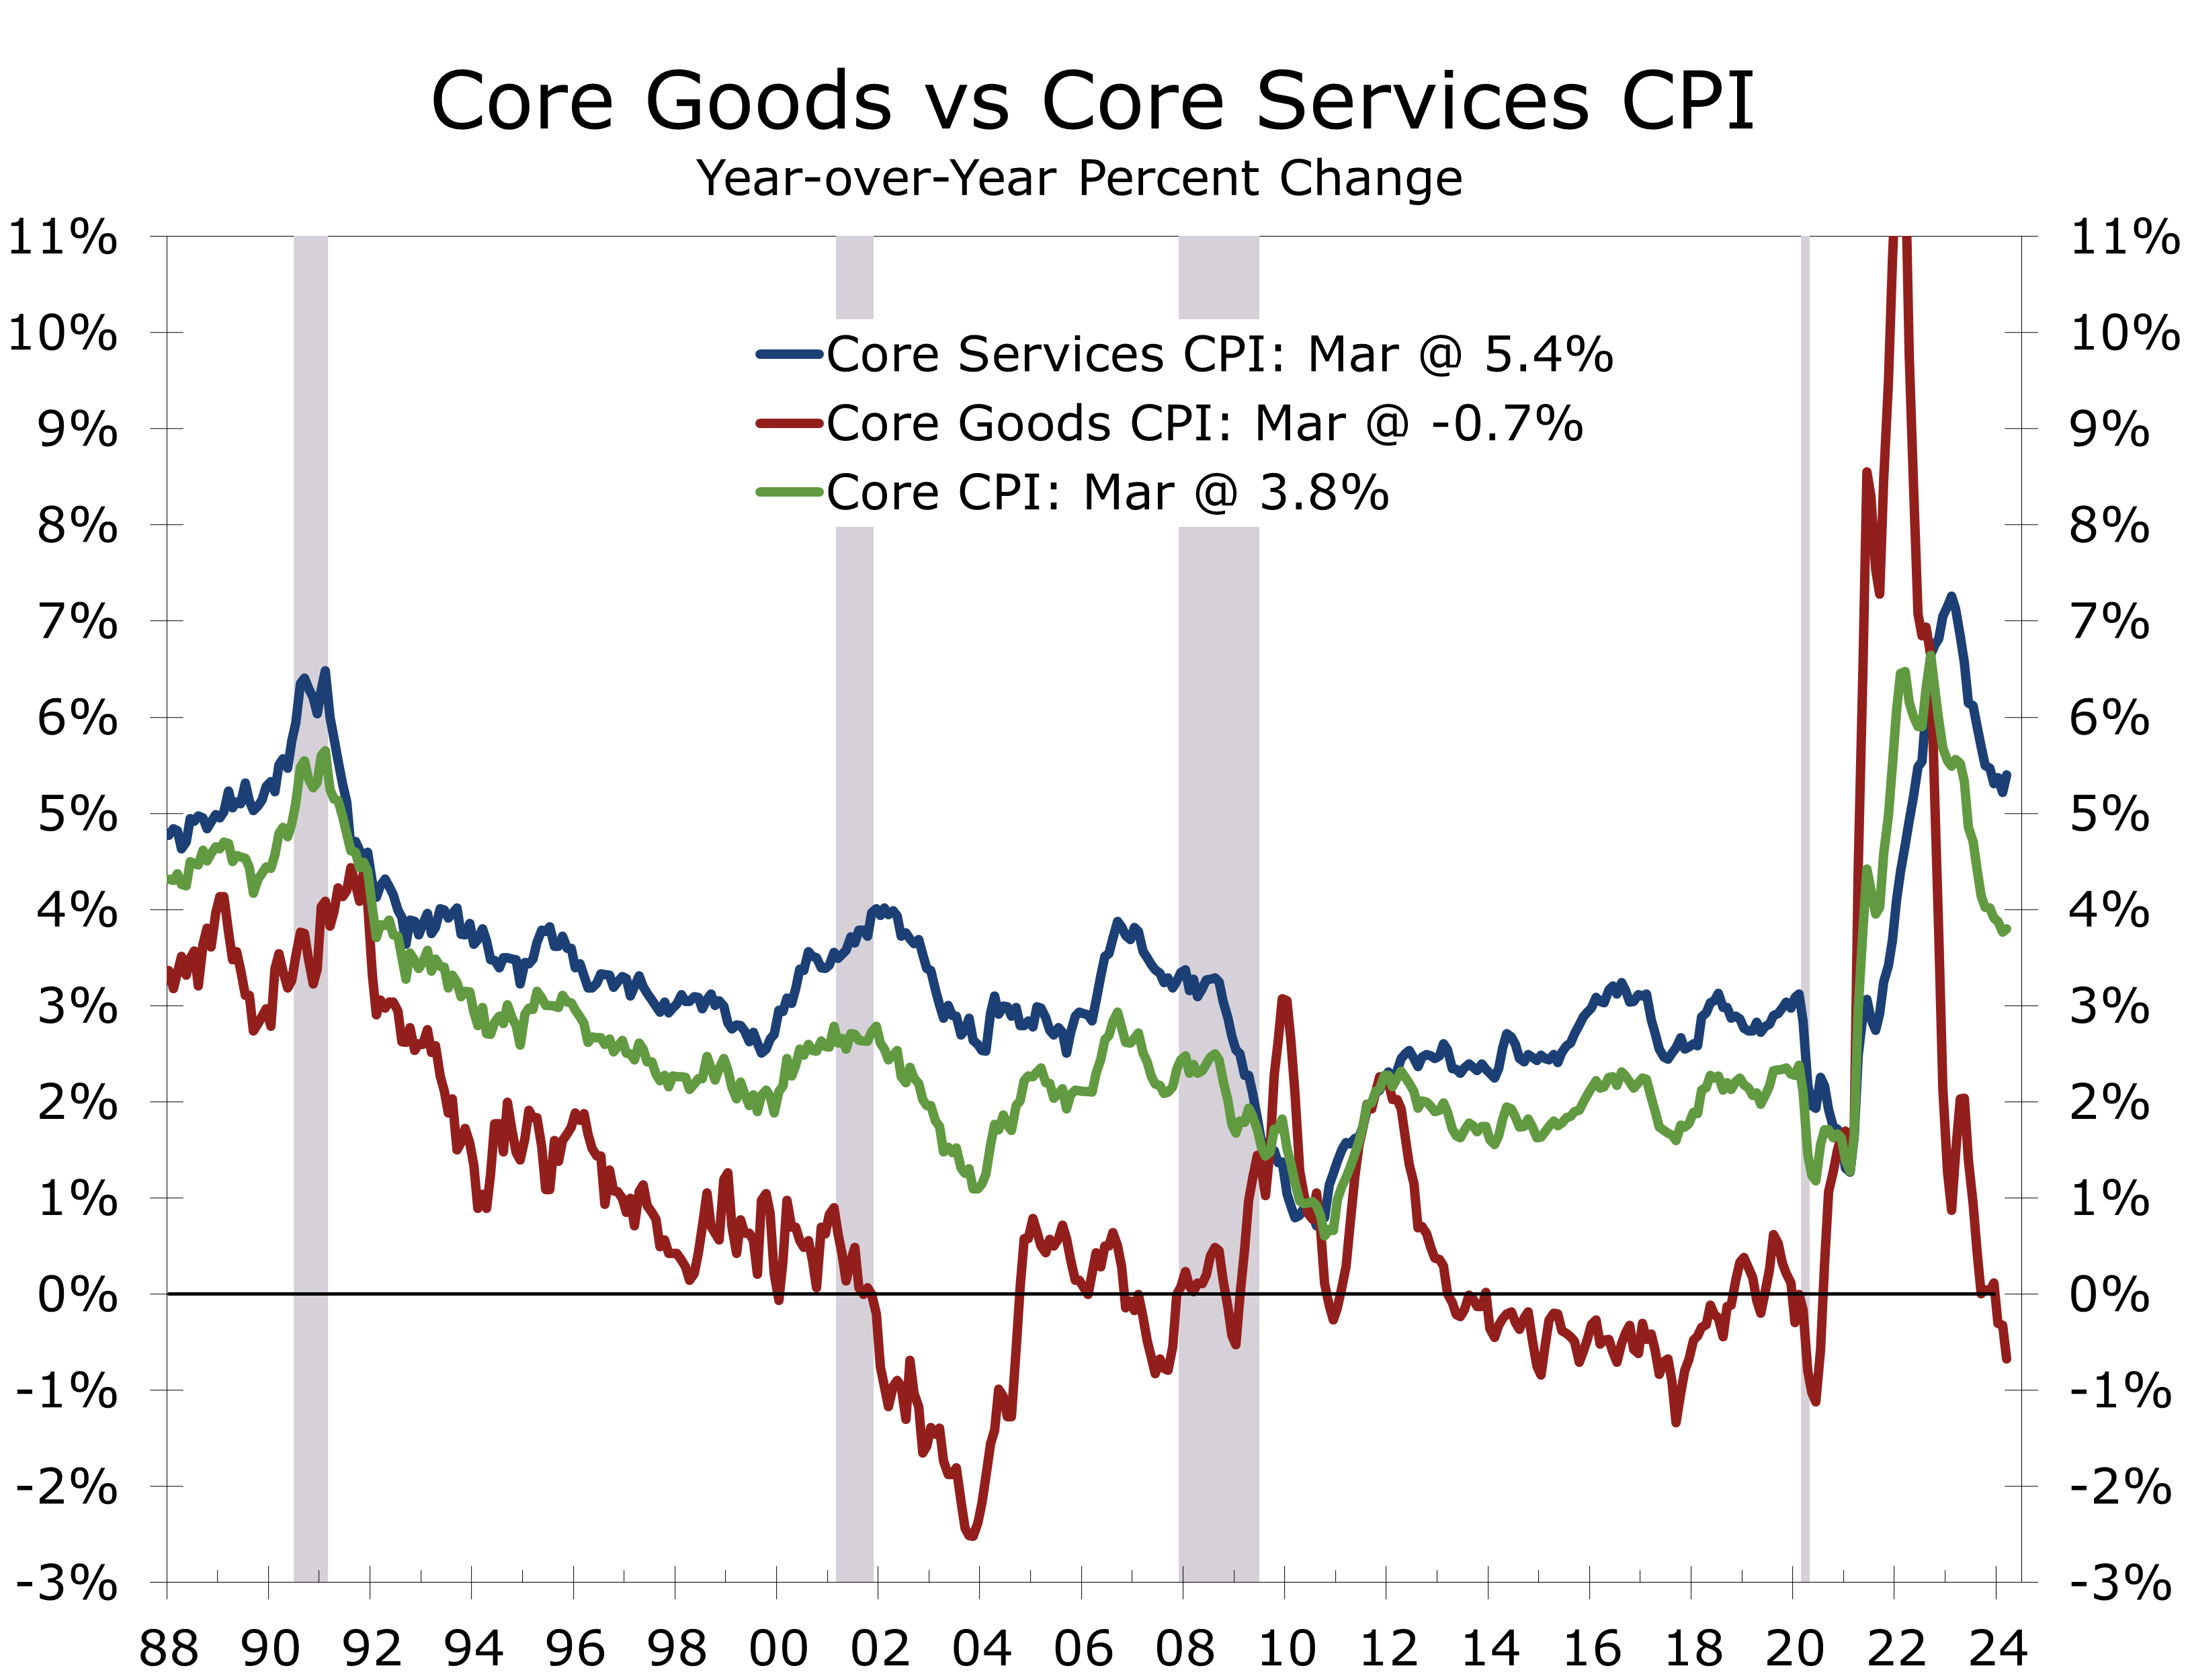
The Fed pays more attention to core inflation, with the Core PCE deflator being their preferred measure. The Core CPI and core PCE deflator do not match up perfectly but tend to move together over time. Core inflation has moderated less than the headline has. The primary impediment has been stubborn core services prices. Core goods prices have actually fallen 0.7% over the past year, reflecting large year-to-year drops in a variety of products, including used cars (-2.2%), furniture and bedding (-3.8%), major household appliances (-6.3%) and sporting goods (-2.2%).
Prices for motor vehicles and major household items have fallen this past year.
The drop in core goods prices followed a spike in the aftermath of the pandemic when consumers spent freely for discretionary goods, pulling prices higher. Goods prices have eased more recently, as spending has shifted to services, supply shortages have abated, and China has ramped up exports to the U.S.
Core services prices have moderated more slowly, having peaked at 7.3% year-to-year back in February 2023. Prices have gradually ebbed lower over the past year, although they picked up this past month following huge increases in motor vehicle insurance (+2.6%) and motor vehicle repairs (+1.7%). On a year-to-year basis insurance costs is up a whopping 22.2%, while vehicle repair costs are up 8.2%.
Shelter costs are another problem area. While asking rents for new apartments have come down recently, renewal rates have continued to increase. Rents for single-family homes are also proving more resilient. Owners’ equivalent rent and rent of primary residence both rose 0.4% in March and remain up 5.9% and 5.7% year-to-year, respectively.
We continue to see inflation moderating this year. Residual seasonality has bolstered prices in the first half of recent years and this trend appears to have been accentuated by the pandemic. Prices increases have tended to be smaller in the second half of the year – a pattern we expect to be repeated this year.
Residual seasonality has tended to bolster prices during the first half of recent years.
We expect inflation to moderate slightly this spring and look for the pace of disinflation to accelerate this summer and fall. We doubt we will see enough progress at reducing inflation in order for the Fed to reduce rates in June and are pushing out our first rate cut to July. We are now looking for just two quarter point cuts this year and look for the Fed to ultimately cut the federal funds rate to around 4.50% in this cycle.
Disclaimer: This publication has been prepared for informational purposes only and is not intended as a recommendation offer or solicitation with respect to the purchase or sale of any security or other financial product nor does it constitute investment advice.
Mark Vitner, Chief Economist
Piedmont Crescent Capital
704-458-4000
The Long and Winding Road Back to Normal
Plotting a Course Back to the New Normal
- Attention remains keenly focused on the Federal Reserve’s plans to begin to reverse the tightening they put in place a couple of years ago after they realized inflation would prove more persistent. The financial markets now look for the Fed to begin cutting the federal funds rate no sooner than June and look for a total of three quarter-point cuts this year – a view the Fed affirmed at its March 20 FOMC meeting.
- The slower consensus view on rate cuts follows a series of stronger monthly employment reports and hotter inflation reports. Job growth is simply too strong, and inflation is too high to allow rate cuts any earlier than June. Most other economic reports paint a softer economic portrait, with retail sales and industrial production remaining weak, consumer confidence remaining guarded, and survey of consumers and businesses continuing to show inflation and wages moderating.
- The Federal Reserve is currently tracking multiple objectives. The principal target is long-term price stability, which means returning core inflation measures back to a 2% pace. The second is maintaining full employment, which means keeping the unemployment rate around 4% and maintaining high levels of labor force participation. A third objective is to avoid surprises and policy missteps, particularly ones that would lead to financial volatility. The Fed’s final objective is to accomplish all of this without becoming a political issue in this year’s election.
- While the Fed’s objectives are straightforward their timetable remains fluid and is ongoing. The recent obsession with the latest employment and inflation numbers misses this point, as the Fed is looking more at where the economy is headed rather than where it has been or currently is. Monetary policy works with a long and variable lag, so the Fed’s moves must be taken before employment slows too much and well before inflation has returned to target.
- We have made some slight adjustments to our forecast and see economic growth moderating this spring and summer. The Fed is expected to cut the federal funds rate by a quarter percentage point in June and follow that with cuts in September and December. We expect additional cuts in 2024 but do not believe the Fed is in any hurry to bring the federal funds rate back to neutral.
The March Federal Open Market Committee (FOMC) meeting marked a seminal event for many forecasters and market participants. While the Fed was widely expected to leave the federal funds rate unchanged, attention was keenly focused on any adjustments made to the forecast for economic growth, inflation, and interest rates. Back-to-back strong employment reports raised expectations for growth this year, while the first two rounds of inflation reports showed inflation would likely prove sticky this year and take long to return to the Fed’s 2% long range target. Most other economic data have been mixed, with retail sales beginning the year on a weak note and industrial production and most survey data suggesting economic growth is slowing.
For its part the Fed raised its estimate for economic and now expects real GDP to rise 2.4% from the end of 2023 to the end of 2024, versus 1.4% previously, and to rise 2% in both 2025 and 2026. The unemployment rate is expected to remain close to 4%, while inflation, as measured by the core PCE deflator, is expected to gradually decelerate to 2.6% this year and 2.4% in 2025, before finally returning to the Fed’s long-run target of 2% in 2026. The Fed continues to expect three quarter-point rate cuts in 2024, following by three more in both 2025 and 2026, bringing the federal funds rate down a cumulative 225 basis points to 3.125% by the end of 2026.
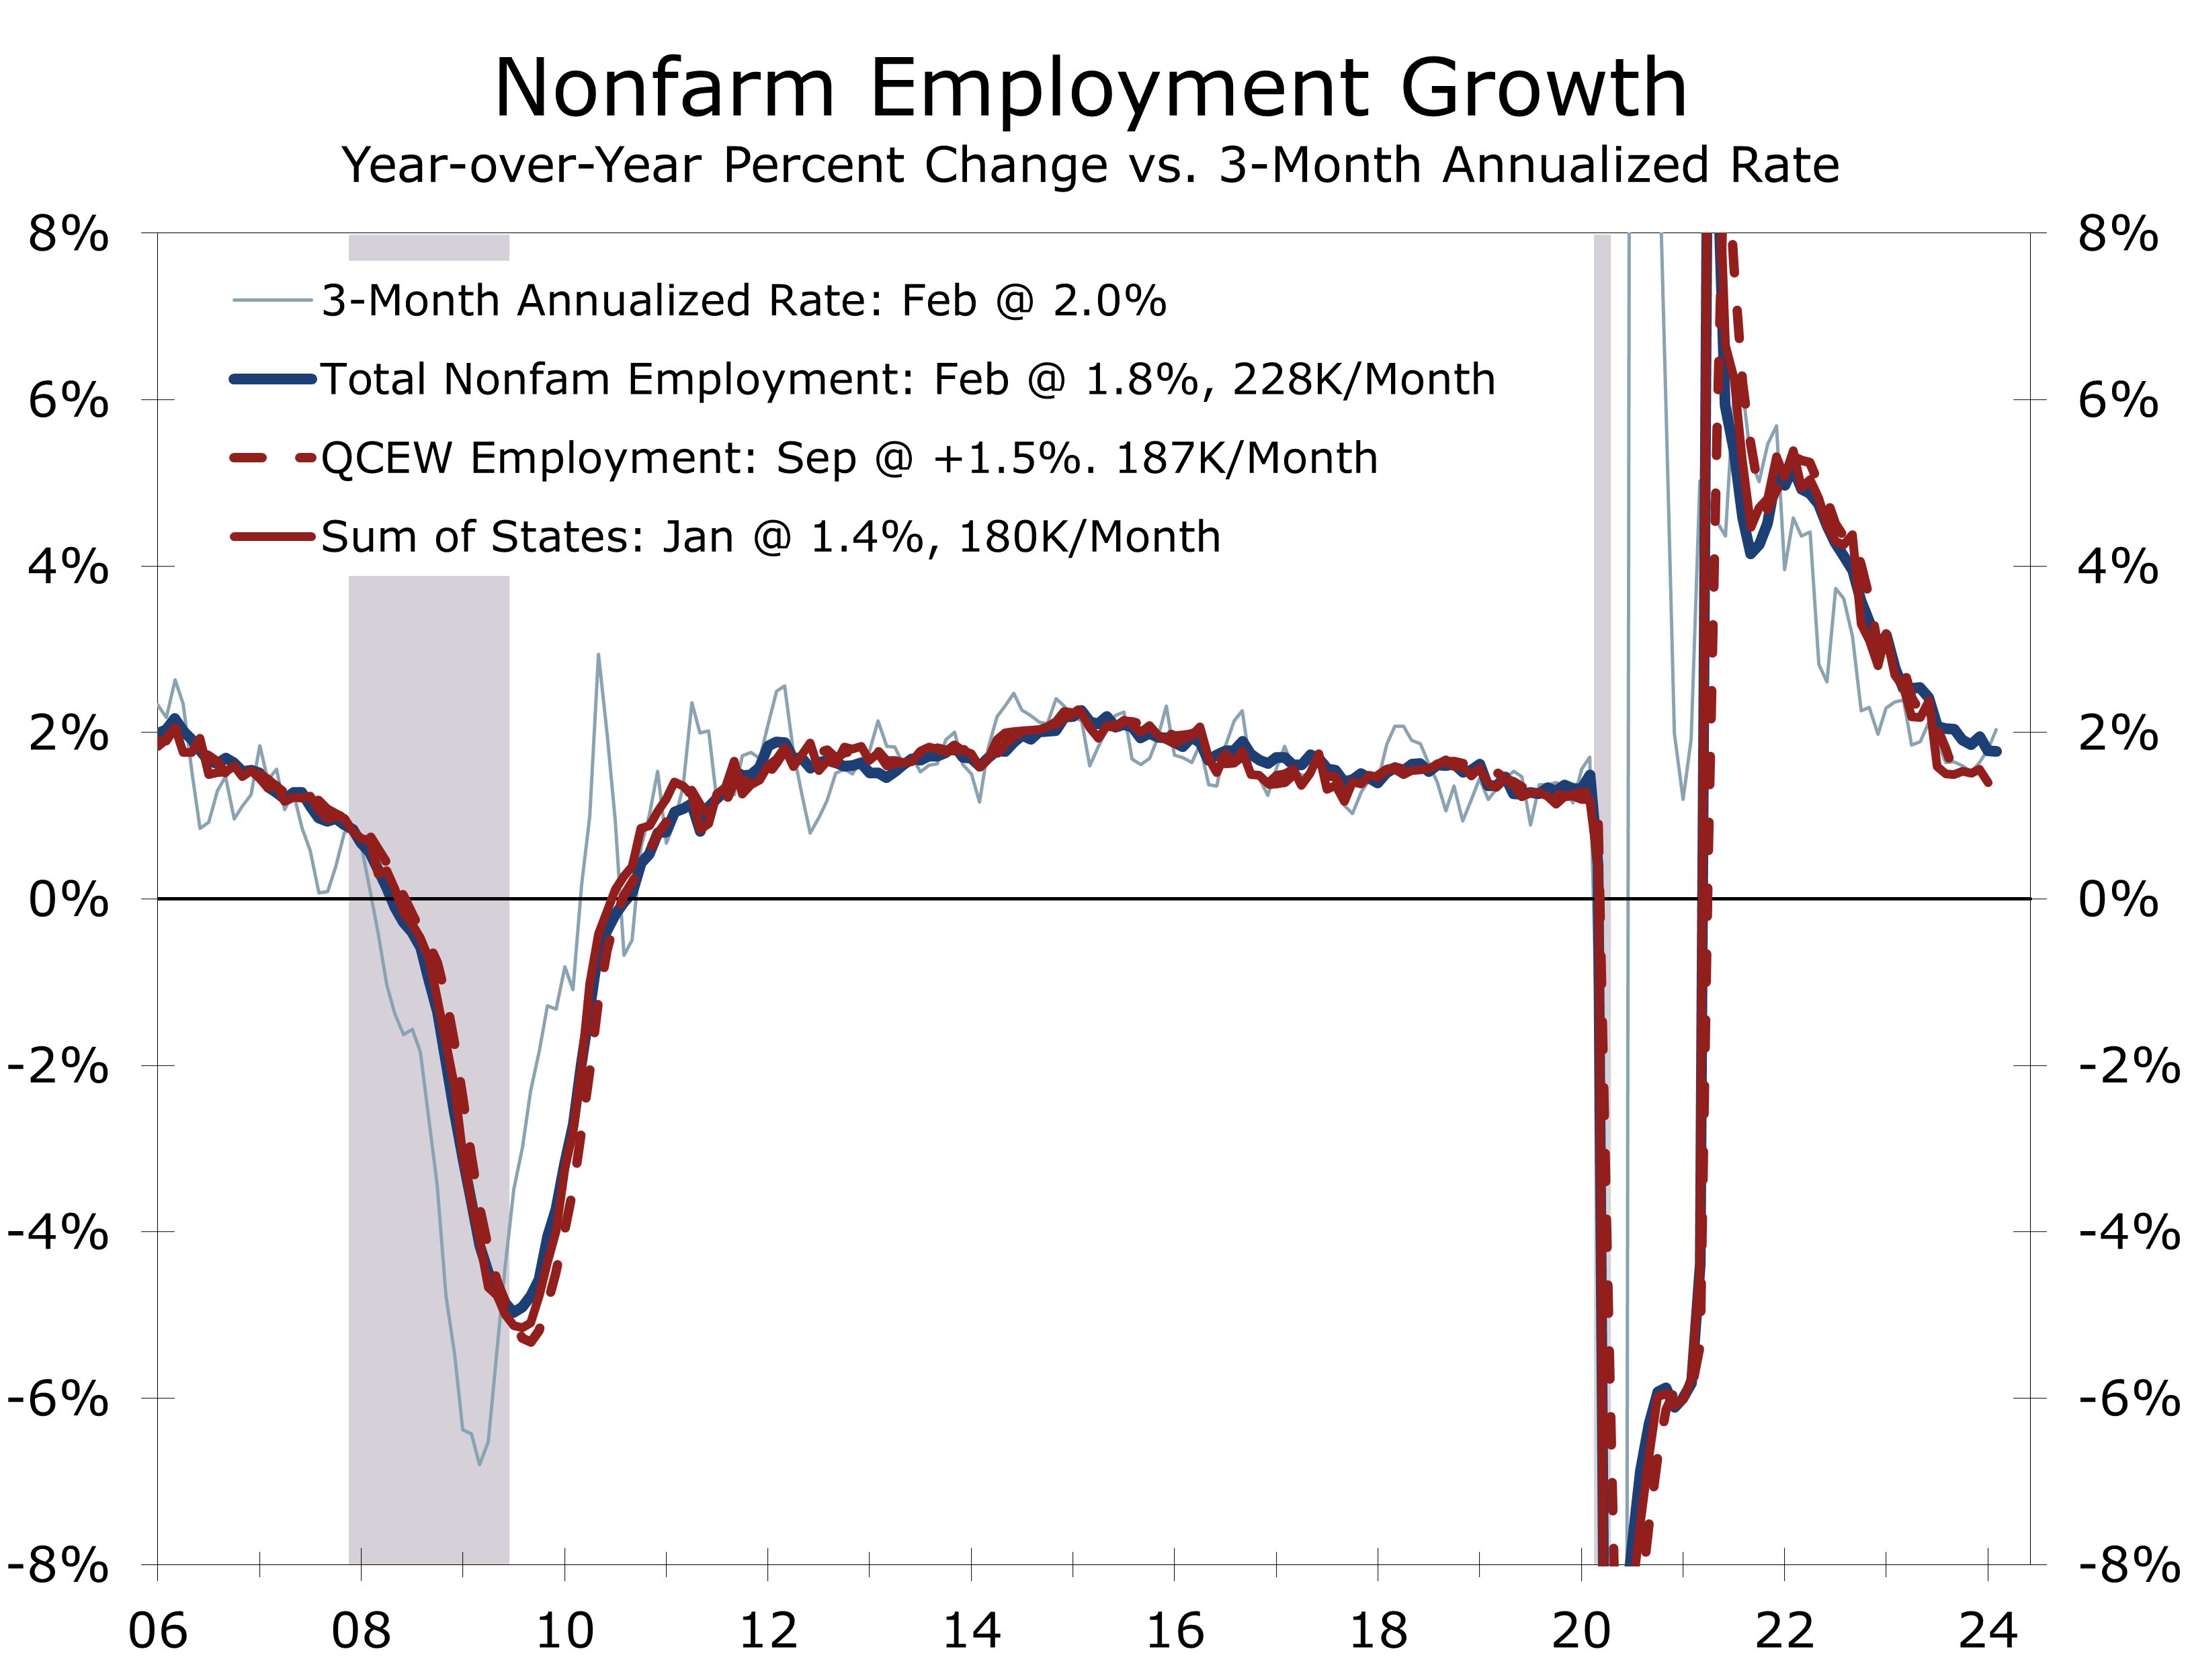
To paraphrase Yogi Berra, it’s tough to make predictions, especially about the future – even if you are the Federal Reserve. The Fed’s stronger economic forecast is consistent with the stronger employment data reported for the past three months. Private and public employers have added an average of 265,000 jobs a month for the past three months and an average of 229,000 per month over the past year. Our research suggest the currently reported employment data overstate nonfarm employment by approximately 800,000 jobs, however, and peg monthly job growth over the past year at just 175,000 jobs per month. We expect to see a moderation in reported job growth this spring, aligning more closely with the recently released Quarterly Census of Employment and Wages, as well as the revised state and local employment data.
Slower job growth would make the Fed’s job easier, particularly if the inflation data continue to come in hotter than expected over the next few months. The one change in the Fed’s policy statement following the March FOMC meeting was to acknowledge the strong job growth reported over the past three months, noting that “job gains had remained strong”. This is a slight upgrade from prior meetings. While the Fed sees job growth remaining strong, they also see the labor market moving back into balance, with job openings and the quit rate both declining, which is a precursor to a further moderation in wage gains.
If job growth slows along the lines we expect, the Fed will more easily be able to justify cutting interest rates, even if inflation continues to prove resilient. Seasonal adjustment issues likely understated core inflation during the second half of 2023 and the payback for that is now boosting it. The Fed left themselves a little more room on this front by slightly lifting their expectation for core PCE inflation to 2.6% this year from 2.4%.
The Fed’s stronger economic outlook and more cautious view on inflation not only match up well with recent economic reports but also provide them with a great deal of flexibility, which they very well may need. The Fed operates with multiple objectives, primarily centered on achieving long-term price stability with a 2% inflation target, while simultaneously striving to maintain full employment, defined by a roughly 4% unemployment rate. The primary tool used to accomplish the Fed’s goals is raising or lowering the federal funds rate, which they strive to do in a way that avoids policy missteps, prevents financial volatility, and remains apolitical, particularly during election cycles.
The Fed’s strategy and tactics change over time, reflecting both short-term cyclical and long-run structural influences. The Fed aggressively slashed interest rates at the onset of the pandemic, reduced interest rates to zero and substantially expanded its balance sheet to bolster liquidity to the broader economy and financial markets and to also accommodate the surge in federal spending. This extraordinarily accommodative stance persisted until early 2022, when mounting inflation pressures emerged due to the economy’s reopening amid widespread supply chain disruptions and bottlenecks.
After recognizing the threat from inflation was considerably more extensive than just shortages and bottlenecks the Fed ramped up the pace and magnitude of their rate hikes, including hiking the federal funds rate by 75 basis at four successive meetings back in summer and fall of 2022 before tamping down the pace of rate hikes this past year. At the December FOMC meeting, the Fed said that it had likely finished hiking interest rates for this cycle, which turned attention to the prospect of rate cuts in 2024. At first, market expectations had priced in six rate cuts for this year. Expectations for rate cuts have been scaled back more recently, following back-to-back stronger than expected employment reports and hotter than expected inflation reports.
While inflation has remained more persistent than expected, it has slowed considerably since the Fed became more aggressive about hiking interest rates. The year-to-year change in the Consumer Price Index peaked out at 9.1% in June 2022 to just 3.2% in February of this year. Most of that improvement came from falling energy prices. Prices for used cars and SUVs also reversed much of the spike seen during the pandemic and food prices, which had risen sharply in 2021 and 2022, rose less rapidly this past year. Core services prices, which account for the bulk of consumer outlays, have moderated much less and now account for the bulk of overall inflation.
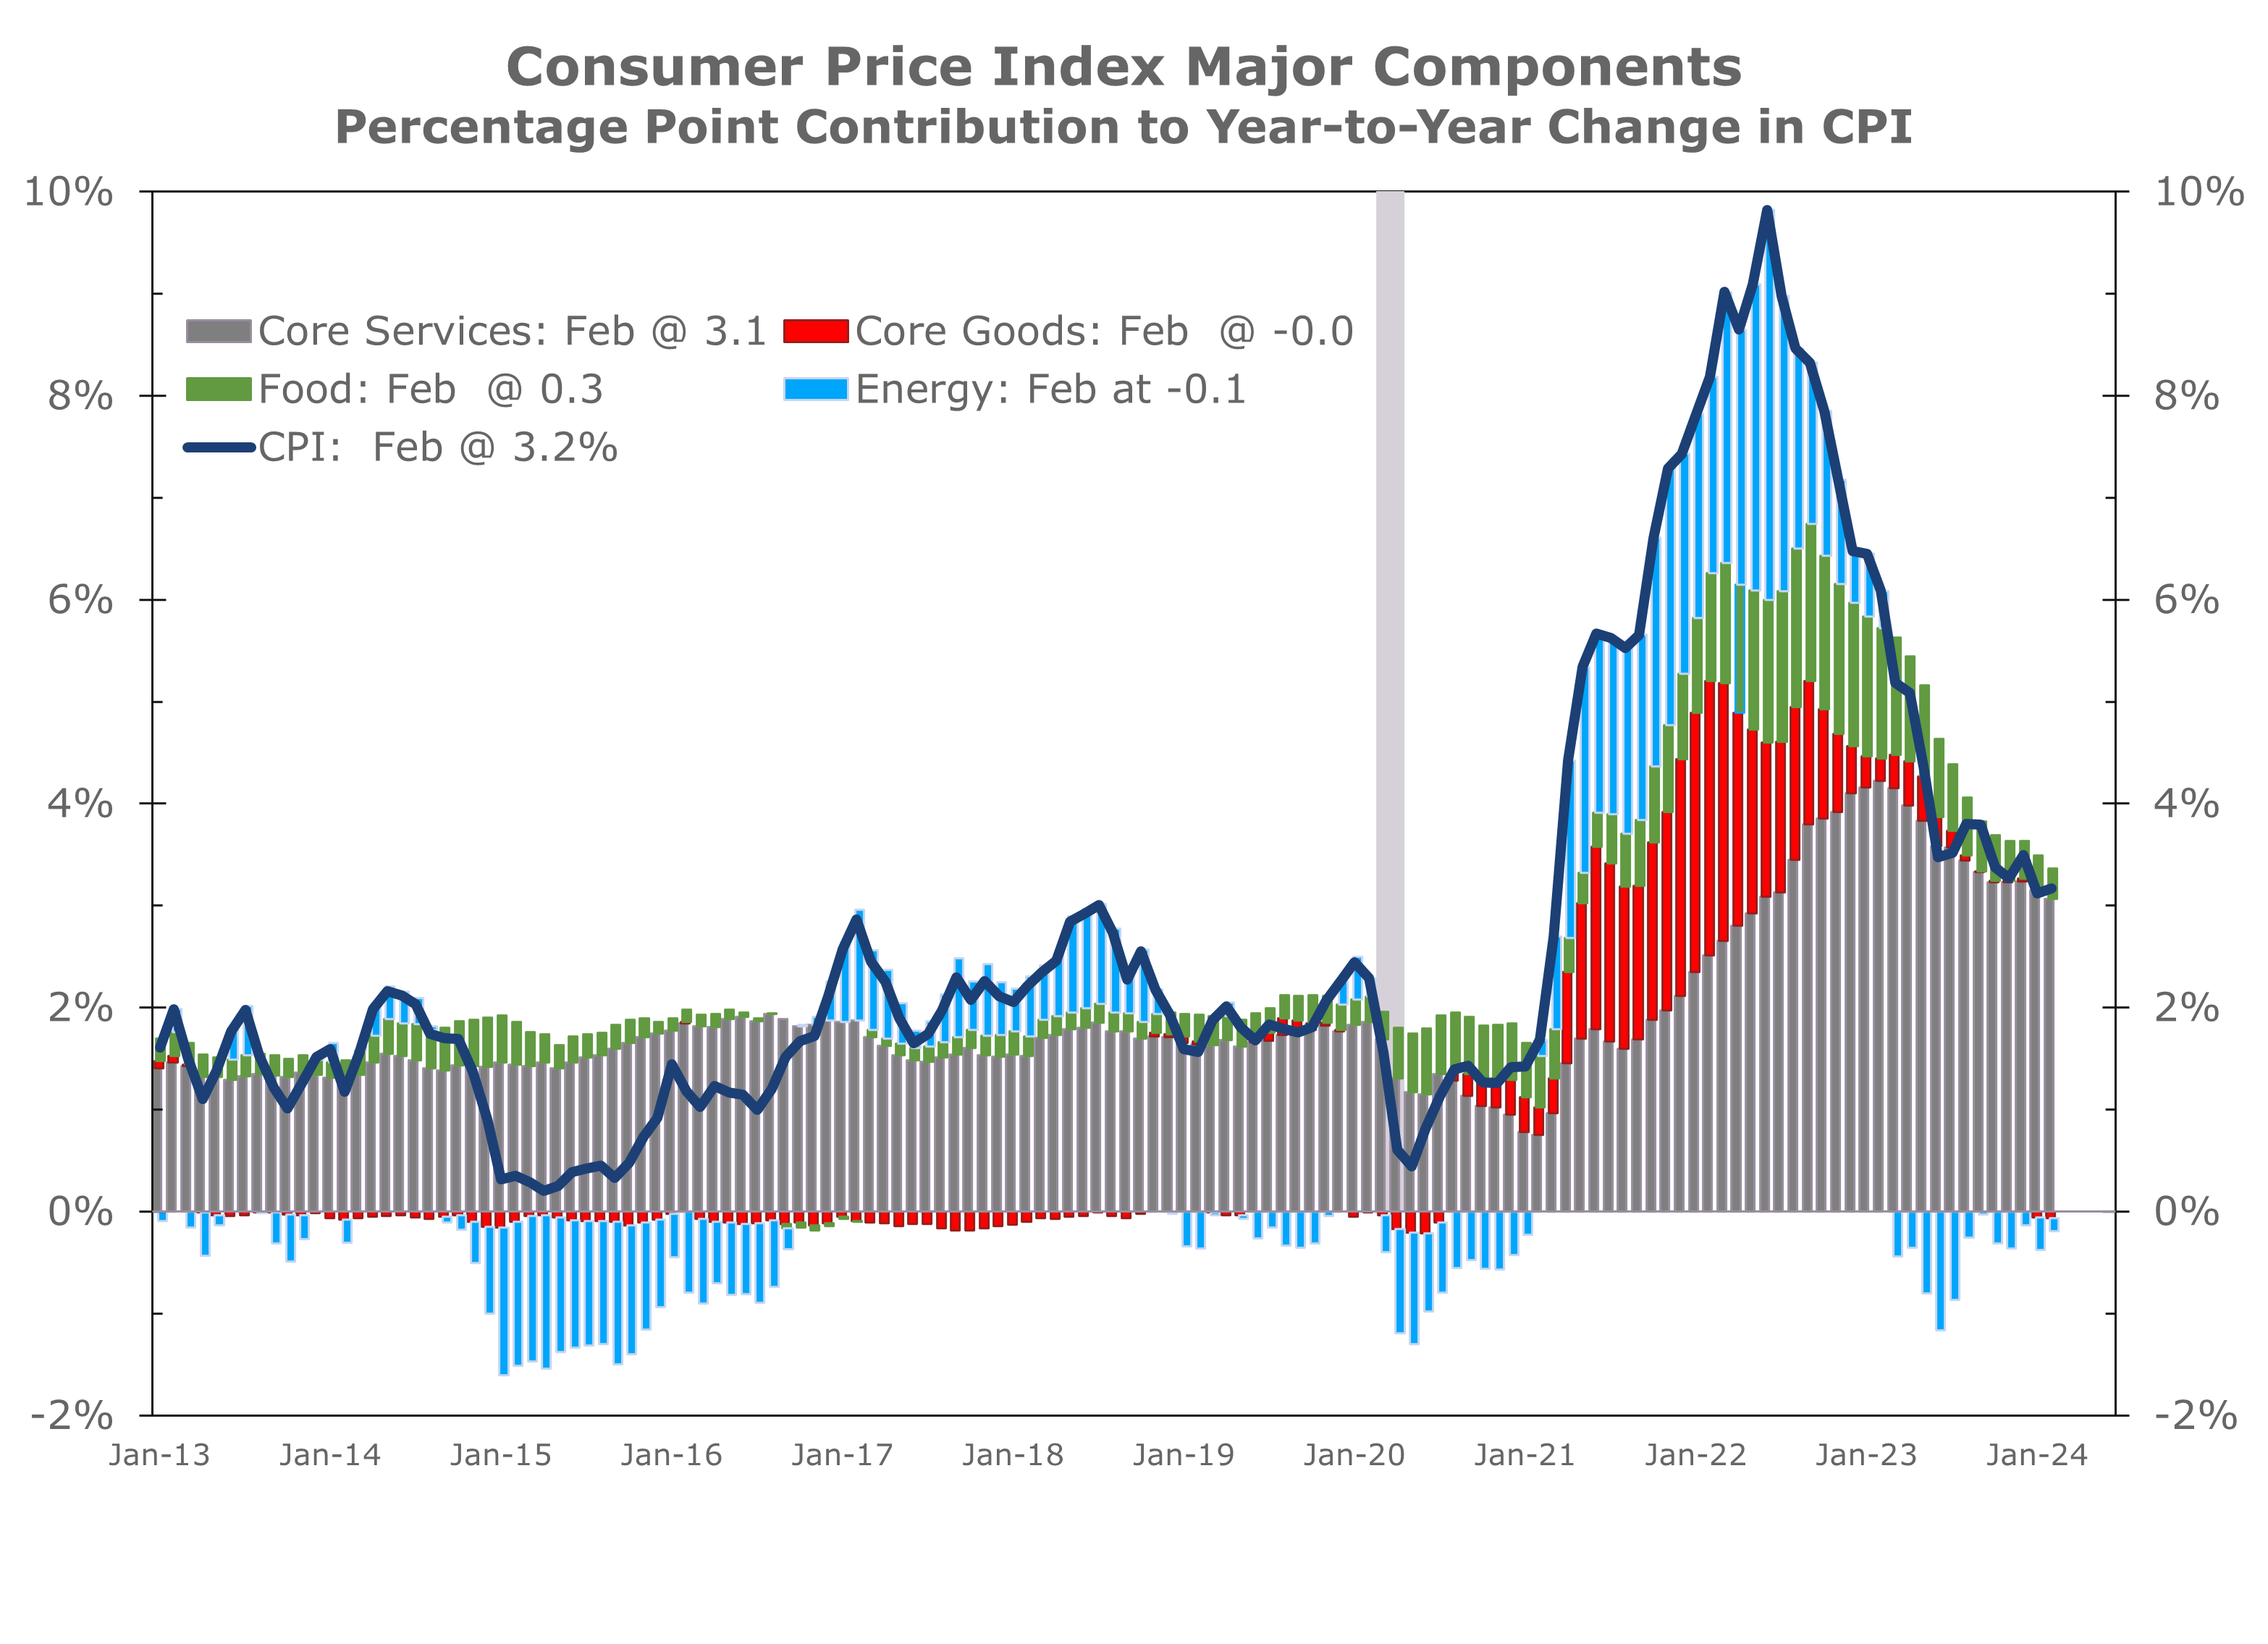
We remain cautious regarding inflation, especially given the pandemic’s impact on price fluctuations. Certain sectors such as used cars, health care services, and apartments experienced significant price swings, which likely distorted seasonal adjustments and led to underestimated inflation, particularly in the latter half of last year despite a general moderation in overall price increases. Looking ahead, we anticipate inflation to remain elevated until the middle of this year, particularly as prices for health care services rebound from their previously understated levels towards the end of last year. Additionally, energy prices are on the rise once again, with crude oil recently surpassing $80 a barrel and national retail gasoline prices recently topping $3.50 per gallon, according to AAA.
Core services prices continue to pose the primary challenge to reducing overall inflation. Excluding energy, services prices increased by 5.2% over the past year, with core services inflation reaching a peak of 7.2% in February 2023 and decelerating less than overall core inflation since then. Housing costs, particularly owner’s equivalent rent and residential rent, have been significant areas of concern, as they have slowed less compared to many widely followed private rent indices. These indices predominantly sample asking rates on professionally managed apartments and single-family rental homes, whereas rents for lease renewals have shown greater resilience. With 450,000 new rental apartments expected to enter the market this year, residential rents will likely moderate further and this moderation should show up more clearly in the government inflation data.
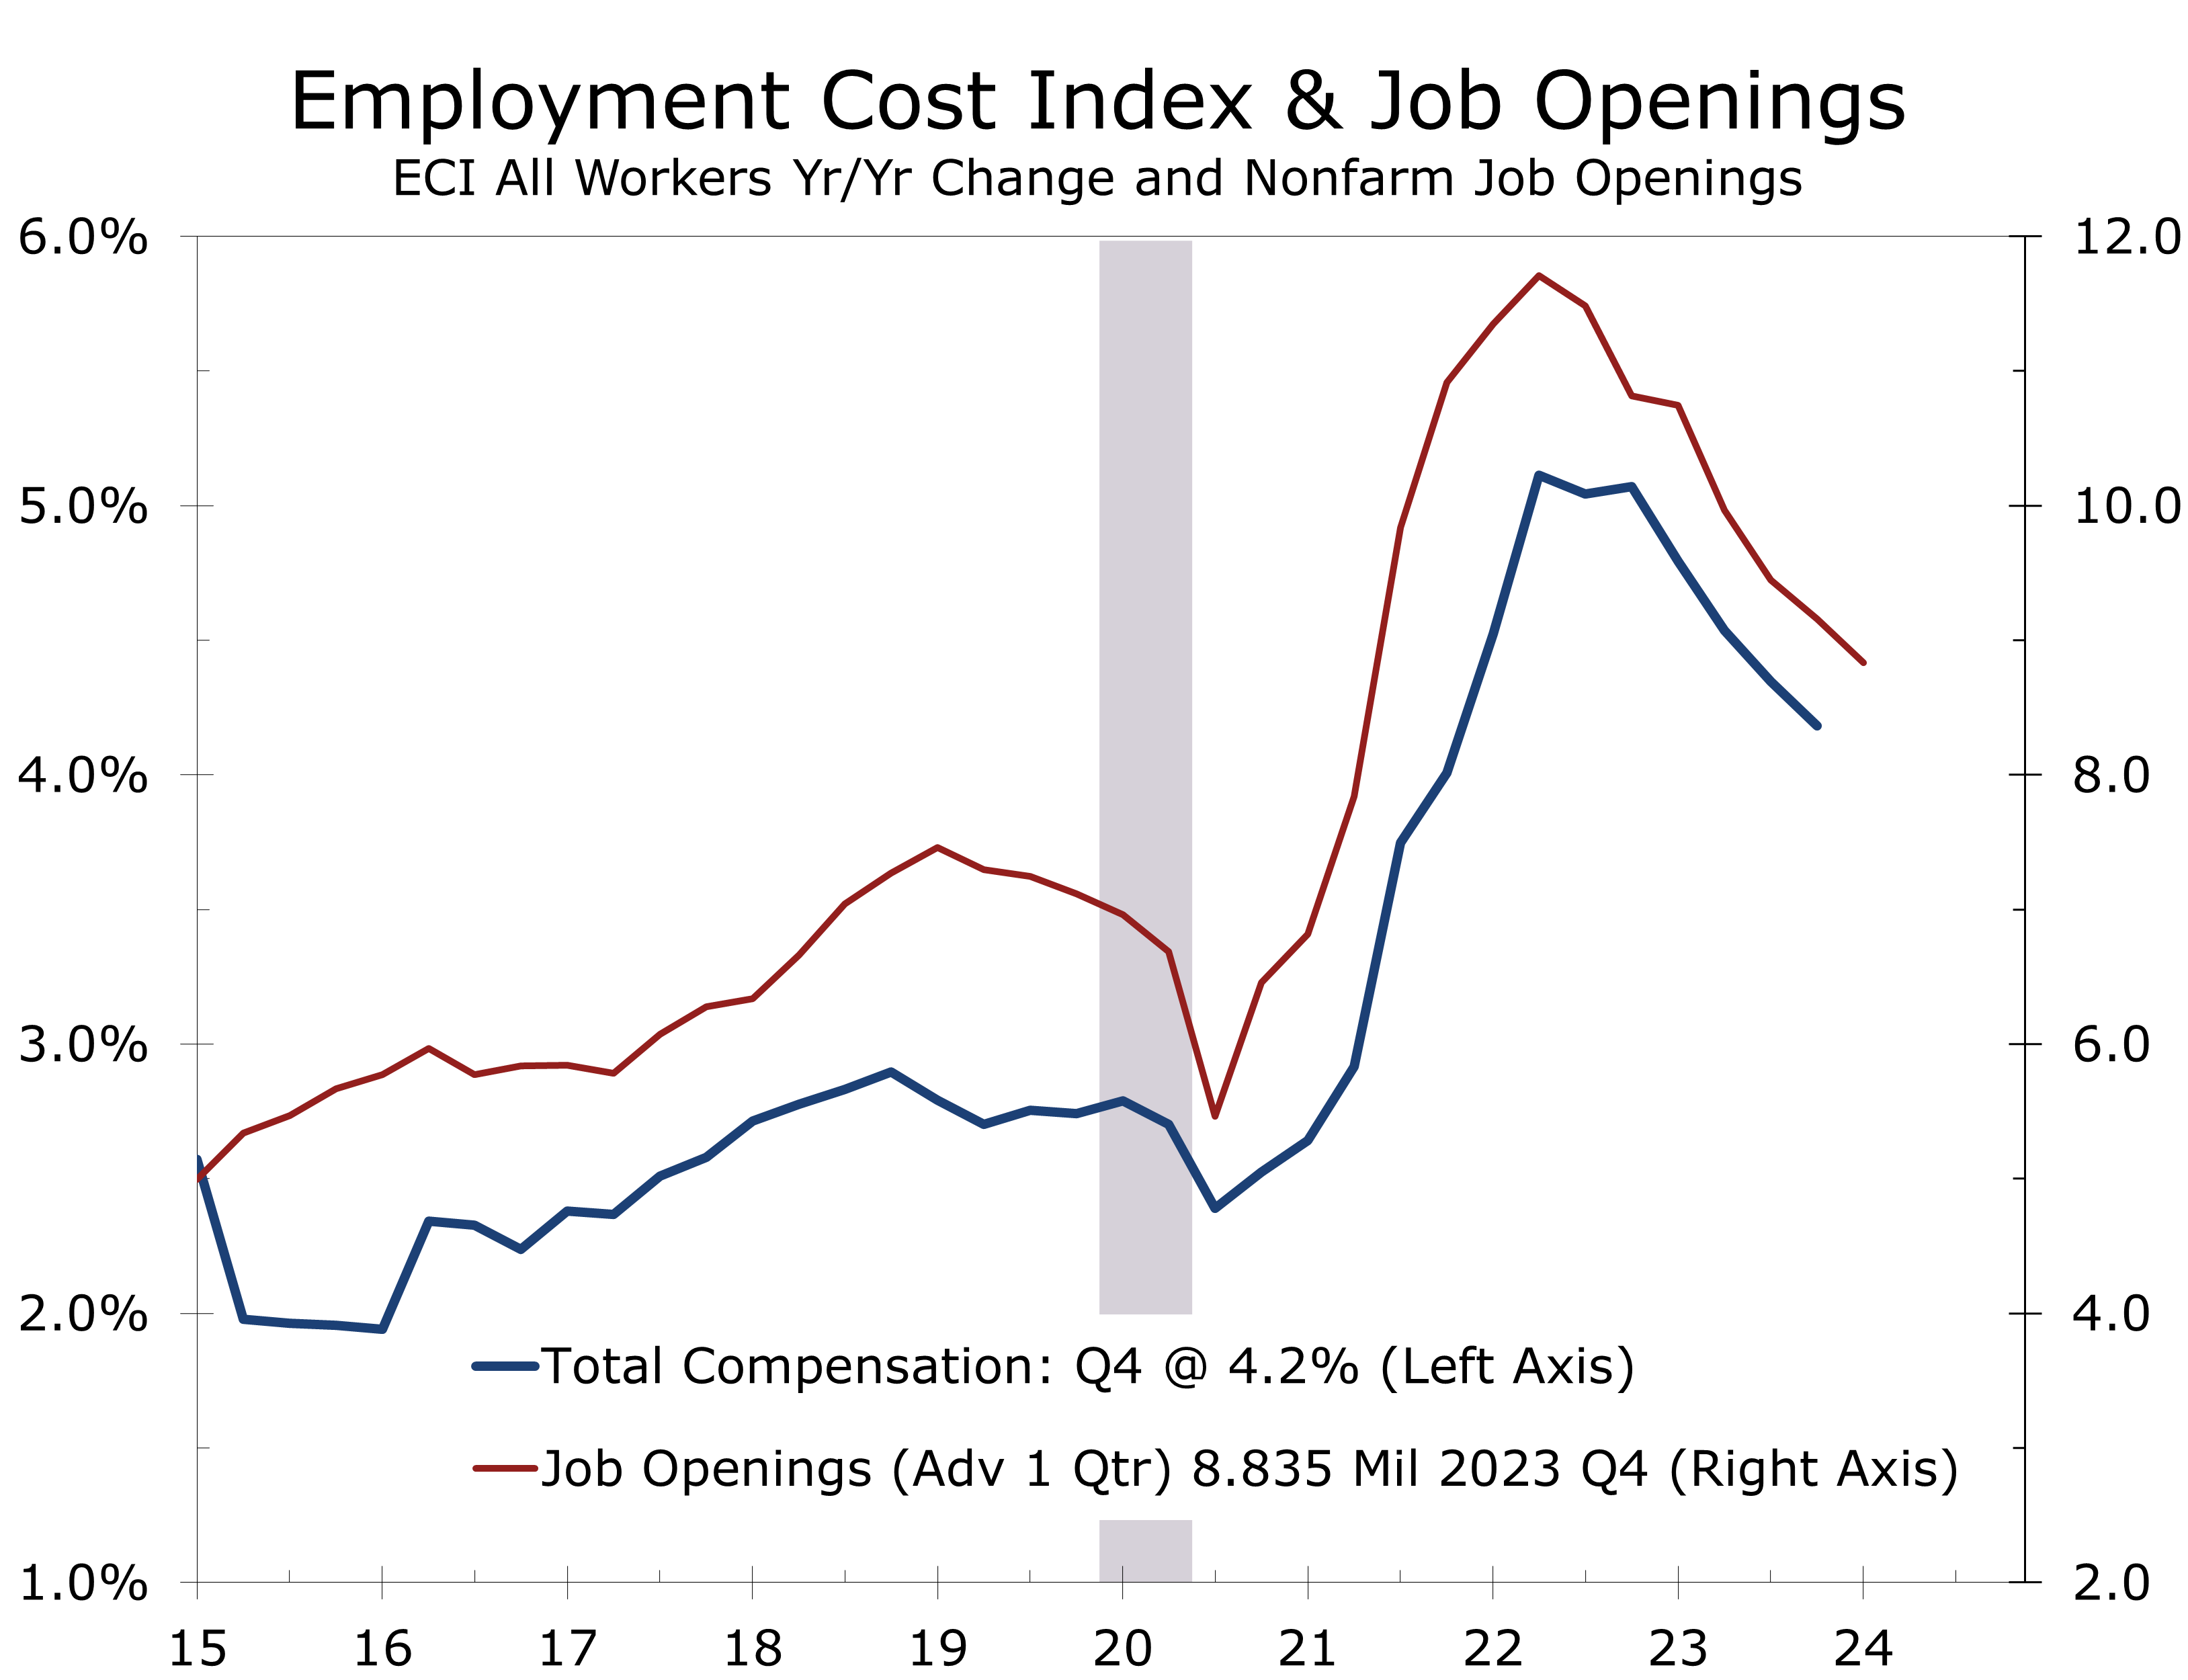
Core services inflation, excluding housing, remains problematic, surging 0.9% in January and rising 0.5% in February. Auto insurance and car repair have been a major part of the problem, but prices are up sharply in almost every industry where labor makes up a large proportion of costs. The focus on core services prices brings attention back to the labor market, where the number of job openings has cooled off considerably over the past 18 months. There is a pretty tight relationship between job openings and the Employment Cost Index (ECI), which is a broader measure of labor costs that includes benefits. We expect job openings to recede further this year, although the rate of deceleration is expected to slow somewhat. Much of the recent strength in job growth has been at state and local governments, health care, and the leisure hospitality sector, which are all striving to bring hiring back in line with their pre-pandemic trend.
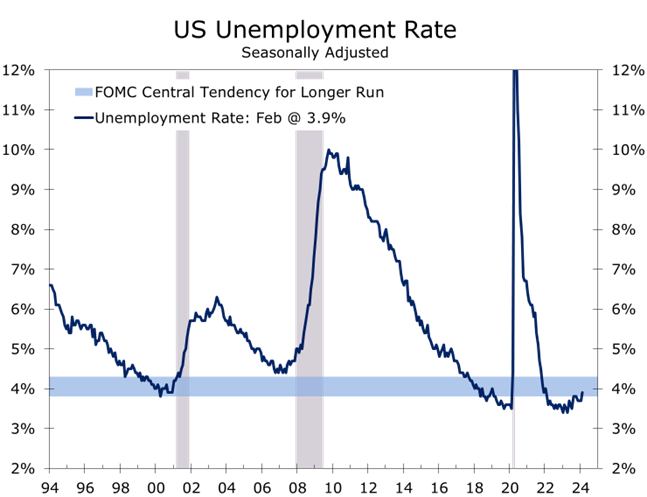
Another sign that the labor is moving back into balance is that the unemployment rate has edged higher in recent months, climbing to 3.9% in February. With the latest rise, the unemployment rate is back within the Fed’s long-run target range of between 3.8% and 4.3%. The rise in the unemployment results from slower household employment and slightly stronger labor force growth. The household employment measure is notoriously volatile around the turn of each year when there is significant movement into and out of the labor force and the Labor Department also makes their annual population adjustment.
How much should be made of the recent uptick in the unemployment rate remains to be seen. An increase in the unemployment rate of half a percentage point or more has typically marked the start of a recession. The jobless rate is now up 0.5 percentage points from its low hit in April of last year and is 0.2 pp above its average for the past year. Why this rule would hold any more sway in the post-pandemic environment than the inverted yield curve or nearly two-year slide in the Leading Economic Index is certainly a key point to consider. A better counterpoint, however, is weekly unemployment claims remain at 50-year lows and there are still more job openings than there are unemployed. Consumer surveys also show relatively little concern about job security.
We suspect the rise in the unemployment rate reflects a host of factors. Part of the increase is purely cyclical. Manufacturing has endured a slowdown this past year, which has seen industrial production decline 0.8% over the past year and manufacturing employment has been essentially flat for the past year. Hiring has also slowed in construction, reflecting a winding down of some commercial projects and some slowing in industrial projects. Much of the strength in hiring has been in government, health care and the leisure and hospitality sector.
Structural factors may also be pushing the unemployment rate higher. There was a surge of immigration in 2023, which likely pushed labor force growth higher and resulted in a slightly higher unemployment rate when hiring slowed during the second half of last year. We look for the unemployment rate to continue to edge higher this year, eventually rising to 4.2%, where we expect it to remain through much of next year. From a longer-term perspective the jobless rate should remain relatively low, as a growing number of Baby Boomers continue to retire and exit the workforce. The last Baby Boomer will turn 65 in 2029.
Stronger immigration is one of the reasons the Federal Reserve raised their forecast for economic growth this year. The Congressional Budget Office estimates immigration, including undocumented individuals, surged to 3.3 million in 2023, which is well above its pre-pandemic pace and roughly 2.3 million ahead of the CBO’s projection for 2023 made back in 2019. While political factors will likely slow immigration this year, we still expect a net gain of at least 2.3 million residents, which will bolster labor growth and potential GDP.
Domestic factors will also bolster economic growth, with household formation and live births both expected to increase this year. The increase in household formations continues to be driven by younger households, which is one reason apartment demand has remained so strong. Apartment vacancy rates are expected to increase this year, however, as just over 450,000 apartments are expected to be completed, primarily in the South and Mountain West. Millennials are also increasingly forming families and having children, which is driving demand for starter homes.
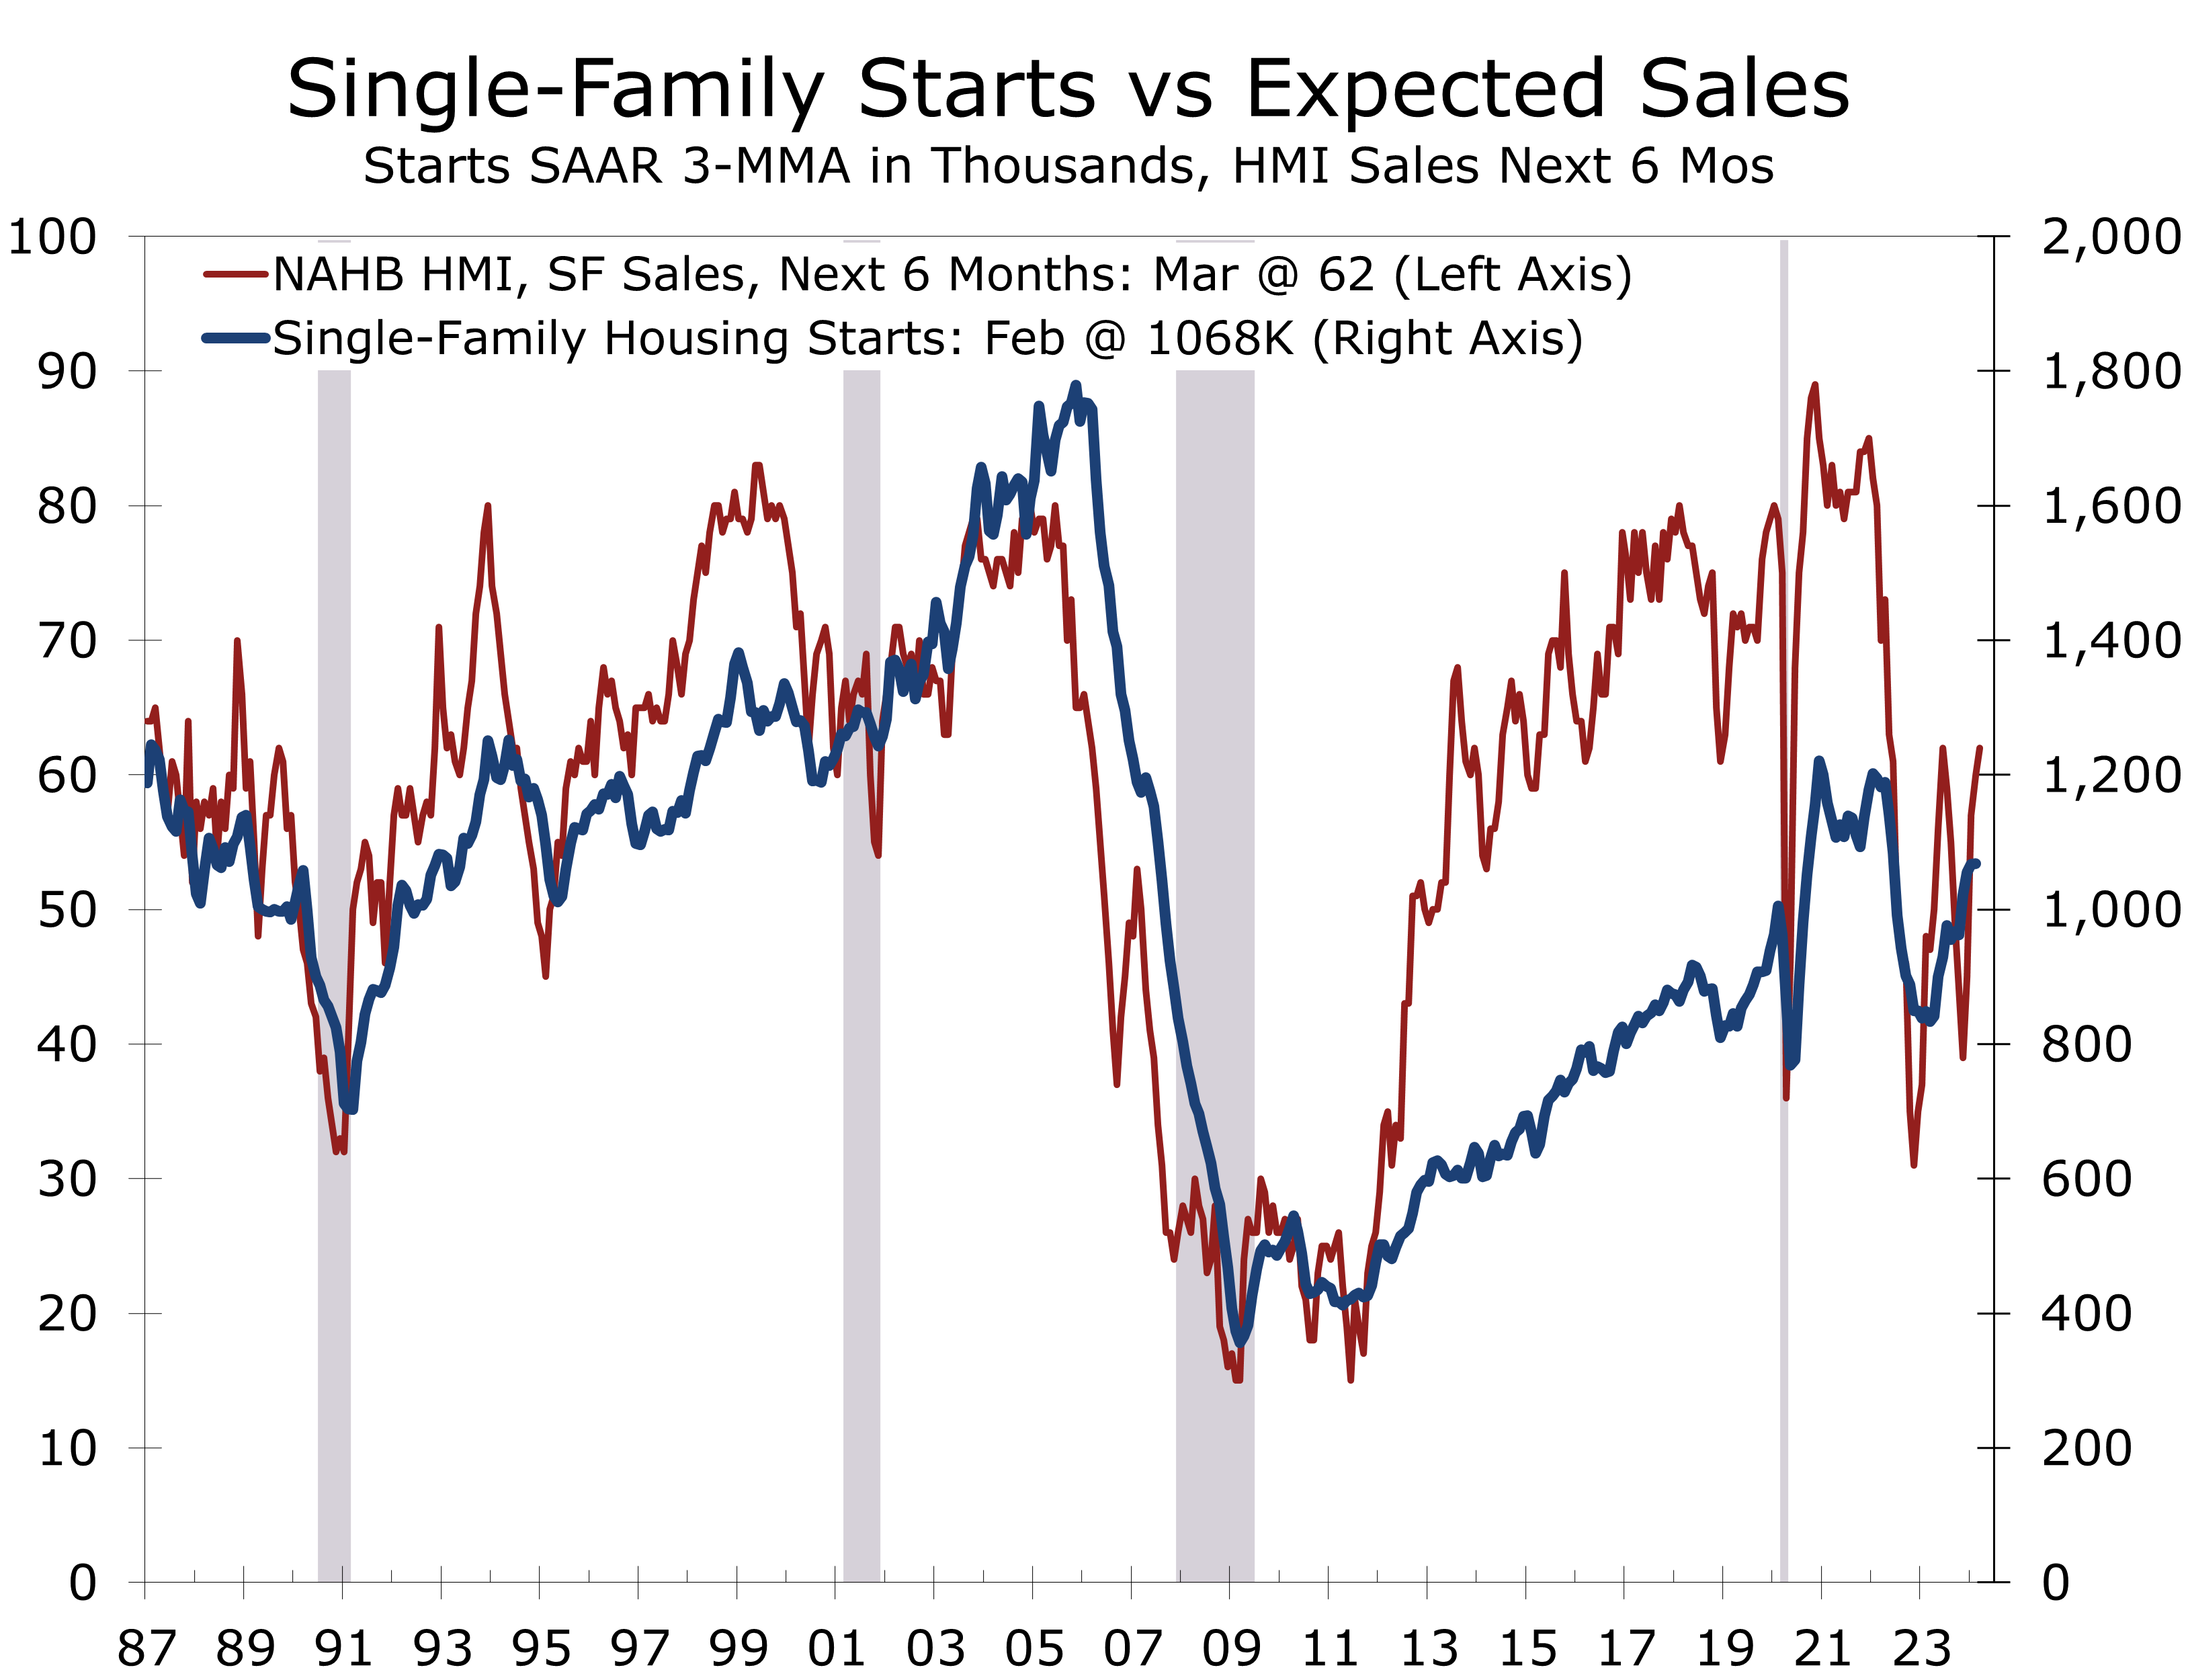
Home building is expected to be a significant driver of economic growth this year. Mortgage rates are projected to decline, with the rate for a 30-year conventional mortgage expect to fall to 6.50% by the end of the year. Home builders are extensively utilizing mortgage rate buydowns, resulting in a steady rise in buyer traffic. The NAHB/Wells Fargo National Housing Market Index (HMI) climbed 3 points in March to 51, marking its fourth consecutive increase and reaching its highest level since July of last year. Builder expectations for sales over the next 6 months also rose by 2 points to 62, matching their highest level in 21 months.
The rise in home builder optimism is apparent in the latest housing starts, which surged by 10.7% to a pace of 1.52 million units in February. Single-family starts rose by 11.6% to a 1.13 million unit pace, are up 35.3% from last February. Multifamily starts, primarily rental apartments, rebounded by 8.3% in February to a 392,000 unit pace, following a 27.9% decline the previous month. Despite this rebound, multifamily starts remain 35% below their year ago pace. The rise in single-family starts is expected to have positive ripple effects, as an increasing number of new home sales are from first-time buyers who will require financing, insurance, and furnishings for their homes. This will boost financial services and the production and sales of furniture, household appliances, home furnishings, and building materials used in home construction.
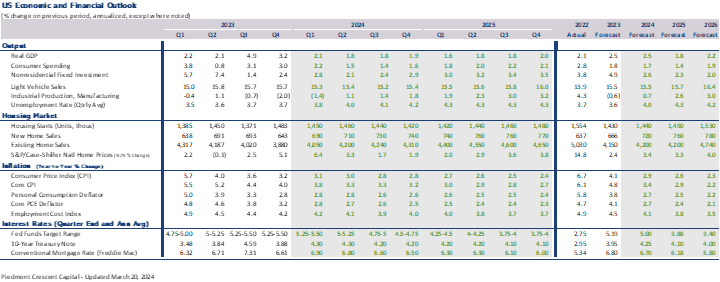
We have extended our forecast out through 2025 on a quarterly basis and 2026 on an annual basis. Current quarter real GDP growth is estimated at 2.1%, fueled by strong growth in consumer spending and stronger sales of both new and existing homes. Business fixed investment also looks solid, although we are seeing a growing number of Electric Vehicle-related projects postponed. Growth is expected to moderate this spring and summer to just under a 2% annual rate. Our forecast for the year calls for real GDP to rise at a 2.5% annual rate on an annual basis and 1.9% pace on a Q4-to-Q4 basis, slightly below the Fed’s 2.1% projection.
There has been a great deal of discussion following the March FOMC meeting regarding the decision to raise both the growth and core inflation forecast but keep plans for a June rate cut in place. The return to the Fed’s 2% target is more likely to reflect a long and winding road rather than straightway. Chair Powell acknowledged as much in his press conference. We expect to see this debate heat up following what we believe will be disappointing inflation numbers next month. The inflation data should look better later this spring, however, and we feel confident they will cut in June and September and then wait until after the presidential election to cut a third time. Inflation is not expected to return to a 2% pace on a sustained basis until 2026.
We see some upside risks to our forecast. The most cyclical parts of the economy appear to be regaining momentum. Early reads on manufacturing activity in March show an improvement in orders, output, and shipments. Construction activity also appears to be ramping up, with single-family starts up 35% from their year ago levels. New home sales are expected to rise 8% this year and existing home sales are expected to rise at least 1% to a 4.2 million unit pace. The risk is to the high side, however, as a growing number of homeowners are putting their homes on the market. The resulting knock-on effects will lift economic growth more broadly.
Disclaimer: This publication has been prepared for informational purposes only and is not intended as a recommendation offer or solicitation with respect to the purchase or sale of any security or other financial product nor does it constitute investment advice.
Mark Vitner, Chief Economist
Piedmont Crescent Capital
April 1, 2024
Weaker Job Growth Across Much of the Country
MSA Jobs Data Show Hiring Losing Momentum
- The latest MSA jobs data reveal a much weaker recovery across much of the country.
- The latest data include benchmark revisions to data prior to April 2023 and show a much slower trajectory since that date.
- The greater New York City area is a notable exception, with only minor revisions evident.
- Job growth is significantly slower in manufacturing-intensive metros. Detroit now shows a slight year-to-year job decline, as do Chicago and Milwaukee, instead of the solid job gains reported in the preliminary data.
- Portland, Oregon is another notable weak spot. Nonfarm payrolls plunged 1.9% over the past year, as employers cut 23,600 jobs.
- Job growth was also notably weaker in the South, with Atlanta, Charlotte, Nashville, and Raleigh adding about half as many jobs as the preliminary data had reported.
- We feel the latest MSA jobs data provide a more accurate assessment of the labor market, which is cooling significantly faster than the monthly national payroll data suggest. The latest QCEW data through September suggest job growth nationally is overstated by at least 800,000 jobs, which means the nation is currently adding just 174,000 jobs per month rather than the now widely assumed 228,000 jobs per month pace.
This morning release of the MSA employment data for January 2024 bolster the case that the widely followed monthly national Nonfarm employment data are significantly overstated. The latest state and local employment data include benchmark revisions to data prior to April 2023 and show a much slower trajectory since that date that closely mirror the most recent QCEW data, which are the source data for the annual revisions.
State & Metro Area employment data show job growth slowed significantly across the country.
The Sum of the States data shows nonfarm employment growth slowing to just a 1.4% pace and closely match the QCEW data reported through September. The CES data which are reported the first Friday of the month show job growth averaging a stronger 1.9% pace. The difference is roughly 800,000 jobs and would reduce job growth to an average of 174,000 job per month over the past year, compared to the currently report 228,000 jobs per month.
Differences between national and local economic data are not unusual. What we see peculiar today is the unusual timing of the split and consistency of the divergence between the two series.

From a timing perspective, the national Current Employment Statistics (CES) data, the series published the first Friday of each month, were just revised in January to the March 2023 benchmark. That benchmark was largely based on the Quarterly Census of Employment and Wages (QCEW) data through March of last year. At the time of the revision, data were also available through June and the CES data math up closely with those data, rising 2.41% year-to-year compared to a 2.39% in the QCEW series.
We suspect the national nonfarm payroll growth are now significantly overstated.
Just two weeks after the January employment report, however, QCEW data were released through September, which diverged significantly from the CES figures. While the monthly CES showed 2.1% year-to-year job growth from June to September, QCEW data indicated only 1.5% growth. We noted the unusual divergence from the benchmark revision’s direction in our January and February employment commentaries. National nonfarm job growth through March 2023 were revised lower by 0.2 percentage points but were revised higher for the second half of last year.
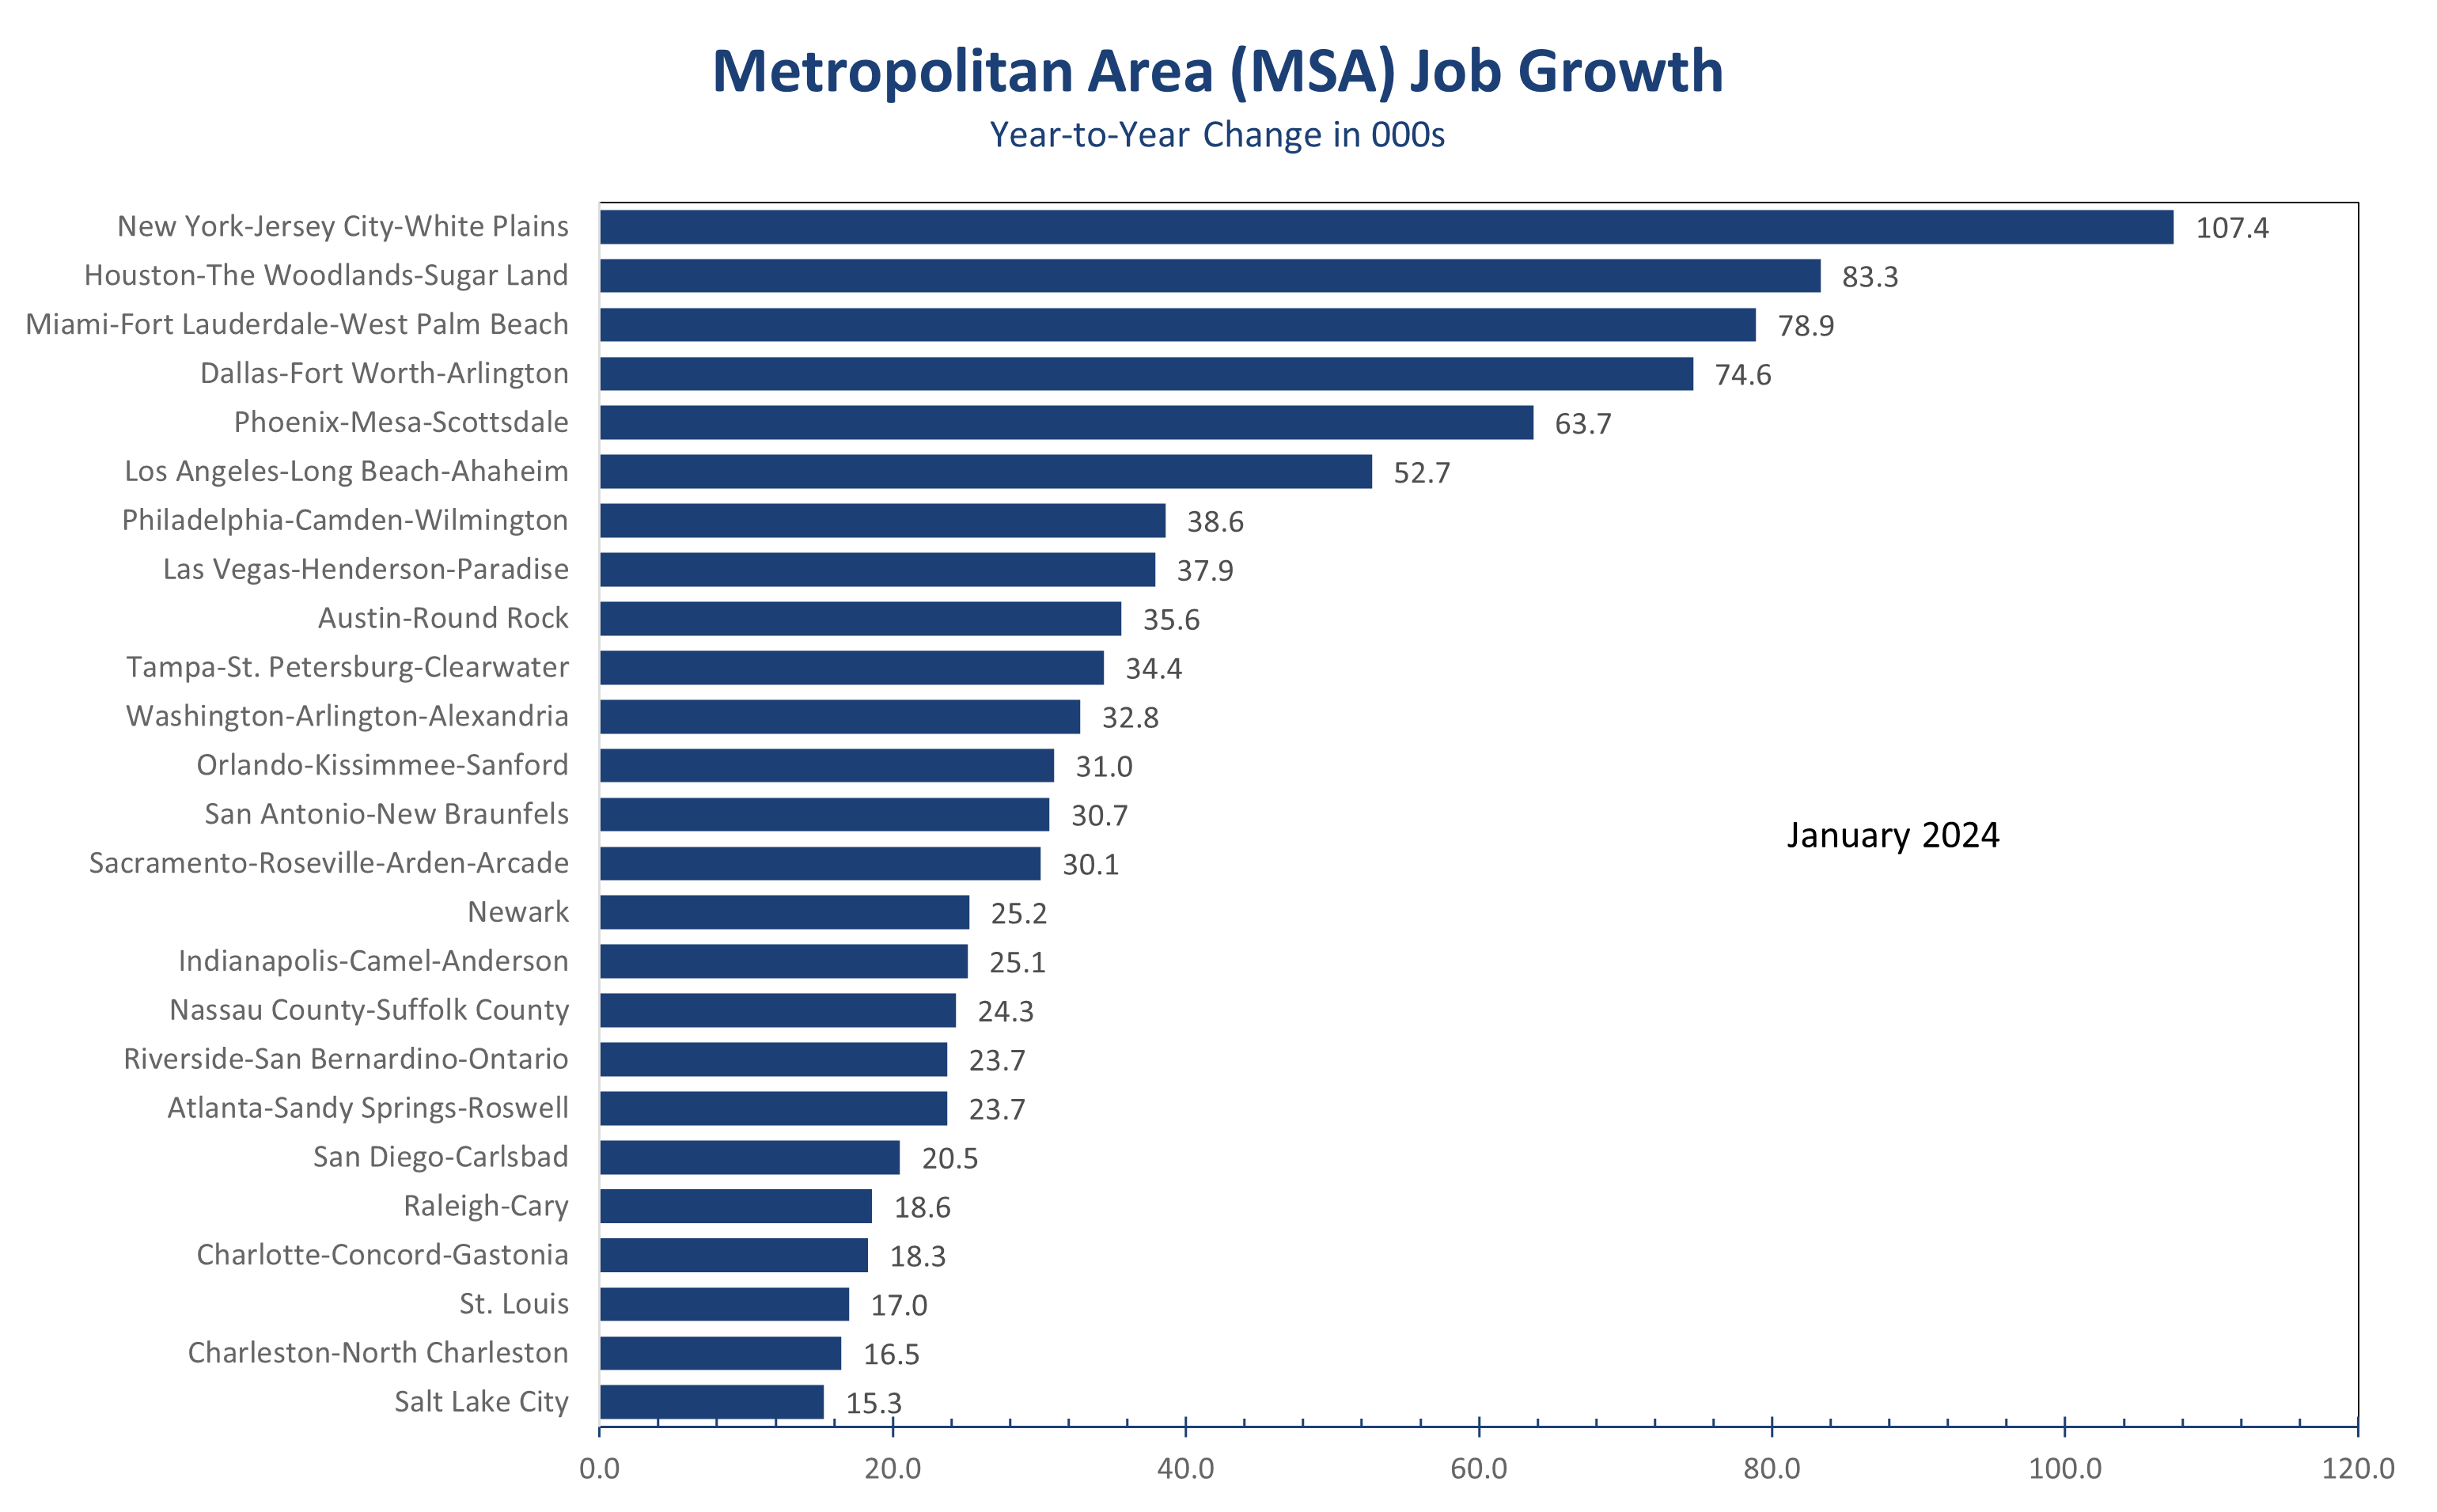
The AI-driven stock market rebound hinted the economy might be on the verge of a rebound in hiring, lending some support to the stronger second half jobs numbers. The recent metro area jobs data, however, cast doubt on this theory. San Francisco and Silicon Valley saw sharp downward revisions to job growth, with San Jose/Silicon Valley now showing a 0.1% year-to-year employment decline.
Many manufacturing-intensive metro areas, including Detroit, Chicago, and Milwaukee along with several smaller Midwest metros like Elkhart-Goshen, Kokomo, and Columbus, Indiana, experienced substantial job declines, aligning with soft ISM manufacturing data.
On the plus side, New York City, the Texas major metros, and Florida’s largest MSAs all remain bright spots. New York City added 160,100 jobs, while Houston added 83,300, and 78,900 jobs were added in South Florida.
Job growth was revised lower in many fast-growing metro areas, particularly in the Southeast, with hiring now up roughly half as much as initially reported in Atlanta, Nashville, Charlotte, Raleigh, and Jacksonville.
The weaker state and local jobs data suggests a soft landing remains in play, albeit with slightly higher-than-expected inflation. We anticipate a further slowing in job growth in coming months, with payroll growth decelerating to around 130,000 jobs per month by mid-year. This should pave the way for a rate cut at the late June FOMC meeting.
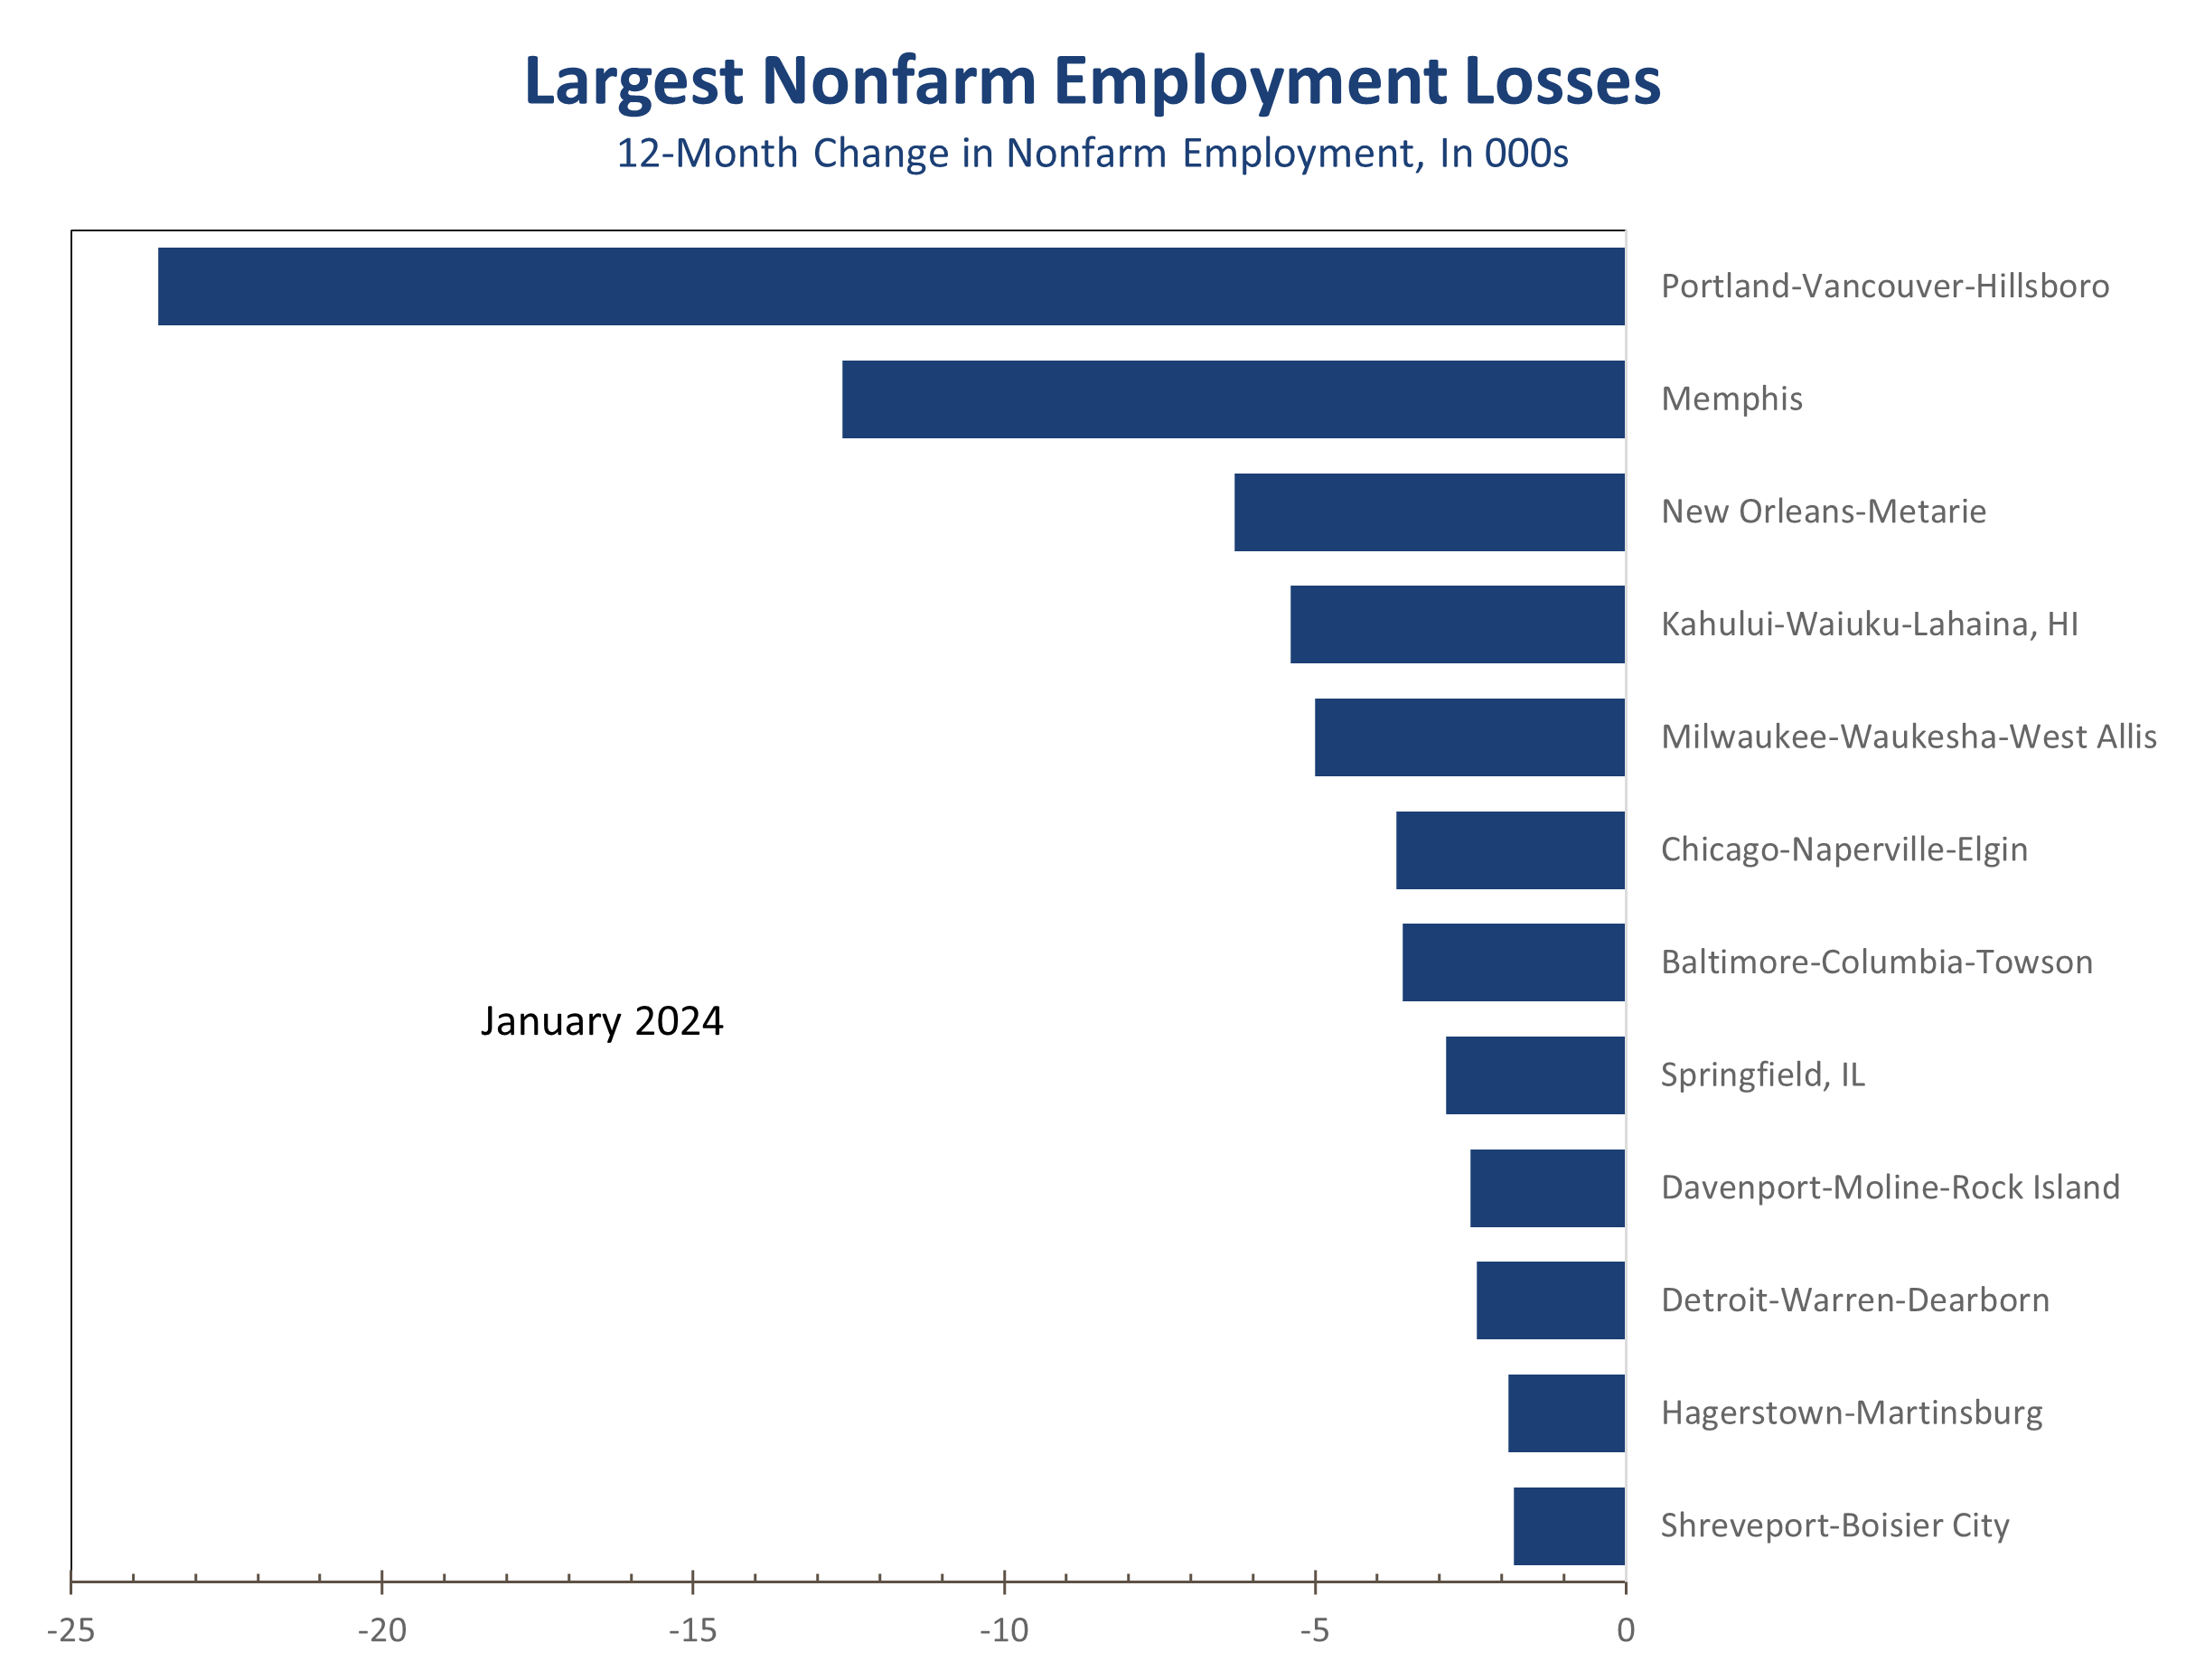
Disclaimer: This publication has been prepared for informational purposes only and is not intended as a recommendation offer or solicitation with respect to the purchase or sale of any security or other financial product nor does it constitute investment advice.
Mark Vitner, Chief Economist
Piedmont Crescent Capital
(704) 458-4000