The Resurgence in New Home Sales May Be Ending
New Home Sales Rise in July, But Mortgage Applications Plummet as Mortgage Rates Rise
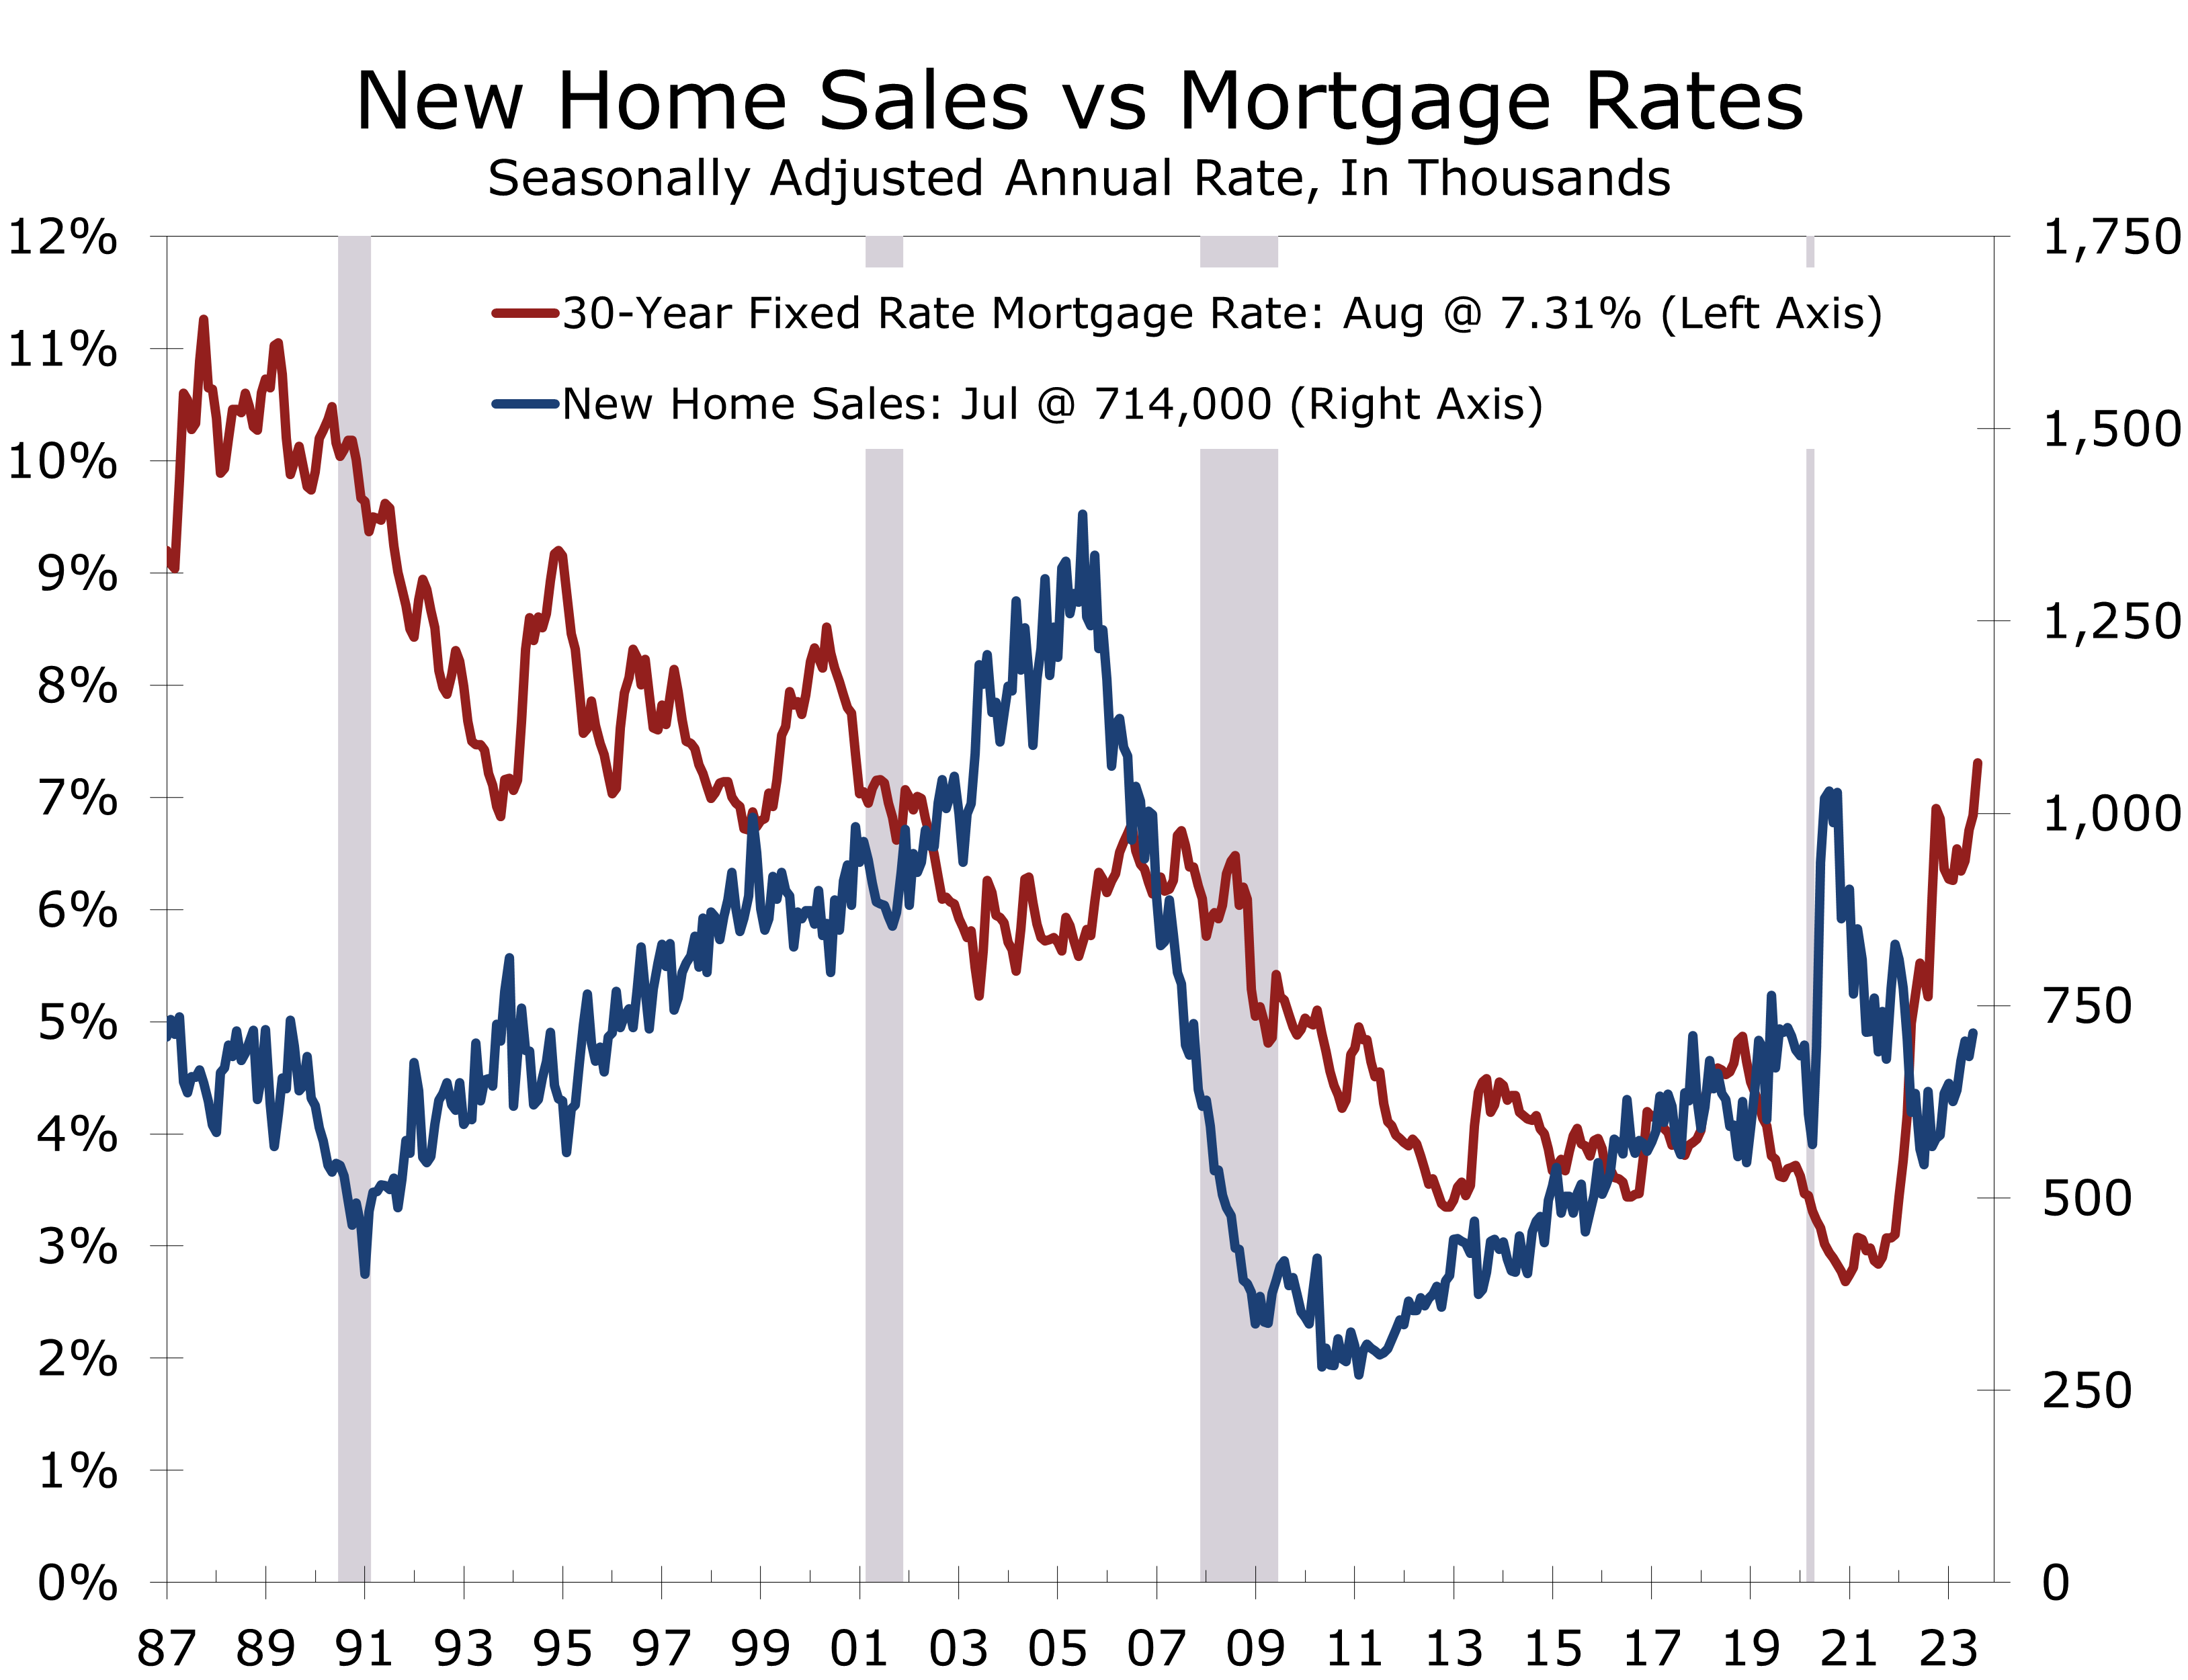
- New home sales rose 4.4% in July to a 714,000-unit annual rate, the highest level since February of last year.
- Sales for the prior two months were revised slightly lower. On a year-to-date basis, new home sales are now running 0.4% ahead of their year-ago pace.
- July’s increase was driven by large gains in the West (+32K) and Midwest (+27K). Sales fell in the South (-28K) and Northeast (-1K).
- The number of new homes available for sale rose 2.1% to 437,000 units. The rise in sales, however, reduced the more closely watched months’ supply figure to 7.3-months.
- The median price of a new home rose 4.8% from the prior month to $436,700. The median home price for July, however, is 8.7% below its year-ago level.
- July may prove to be a high water mark for new home sales. Mortgage rates have spiked in recent weeks and mortgage applications for the purchase of a home have plummeted to their lowest level since May 1995. Builders have also reported a drop in buyer traffic.
New home sales rose modestly in July, climbing 4.4% to a 714,000-unit pace. While the increase topped market expectations, sales for the prior two months were revised slightly lower. Moreover, the Mortgage Bankers Association reported mortgage applications for home purchases fell 5% in mid-August and are now at their lowest level since May 1995.
With July’s gain, new home sales are now at their highest level in 17 months. On the surface, demand for new homes appears to be defying gravity, as sales are 23.7% higher than they were in October of last year, which is when mortgage rates broke above 7% for the first time this cycle.
We suspect July will be the high water mark for new home sales. Home builder confidence dipped notably in August, with the Wells Fargo/NAHB Housing Market Index falling 5 points to 50. A reading above 50 means more builders rate current market conditions as good rather than as poor.
Builders are cutting prices and using incentives to bolster new home sales.
All three subcomponents of the index weakened in August, with present sales falling 5 points to 57, future sales falling 4 points to 55 and prospective buyer traffic falling 6 points to 34. The share of builders reducing prices to bolster sales rose for the first time in 5 months, climbing 3 percentage points to 25%.
Builders are also increasingly using incentives to support sales. Typical incentives are mortgage rate buydowns, which help reduce the sting from higher interest rates. The share of builders using incentives to bolster sales rose 3 percentage points in August to 55%. There is a good chance the share of builders offering incentives will soon top December’s mark, when the share rose to 62%.
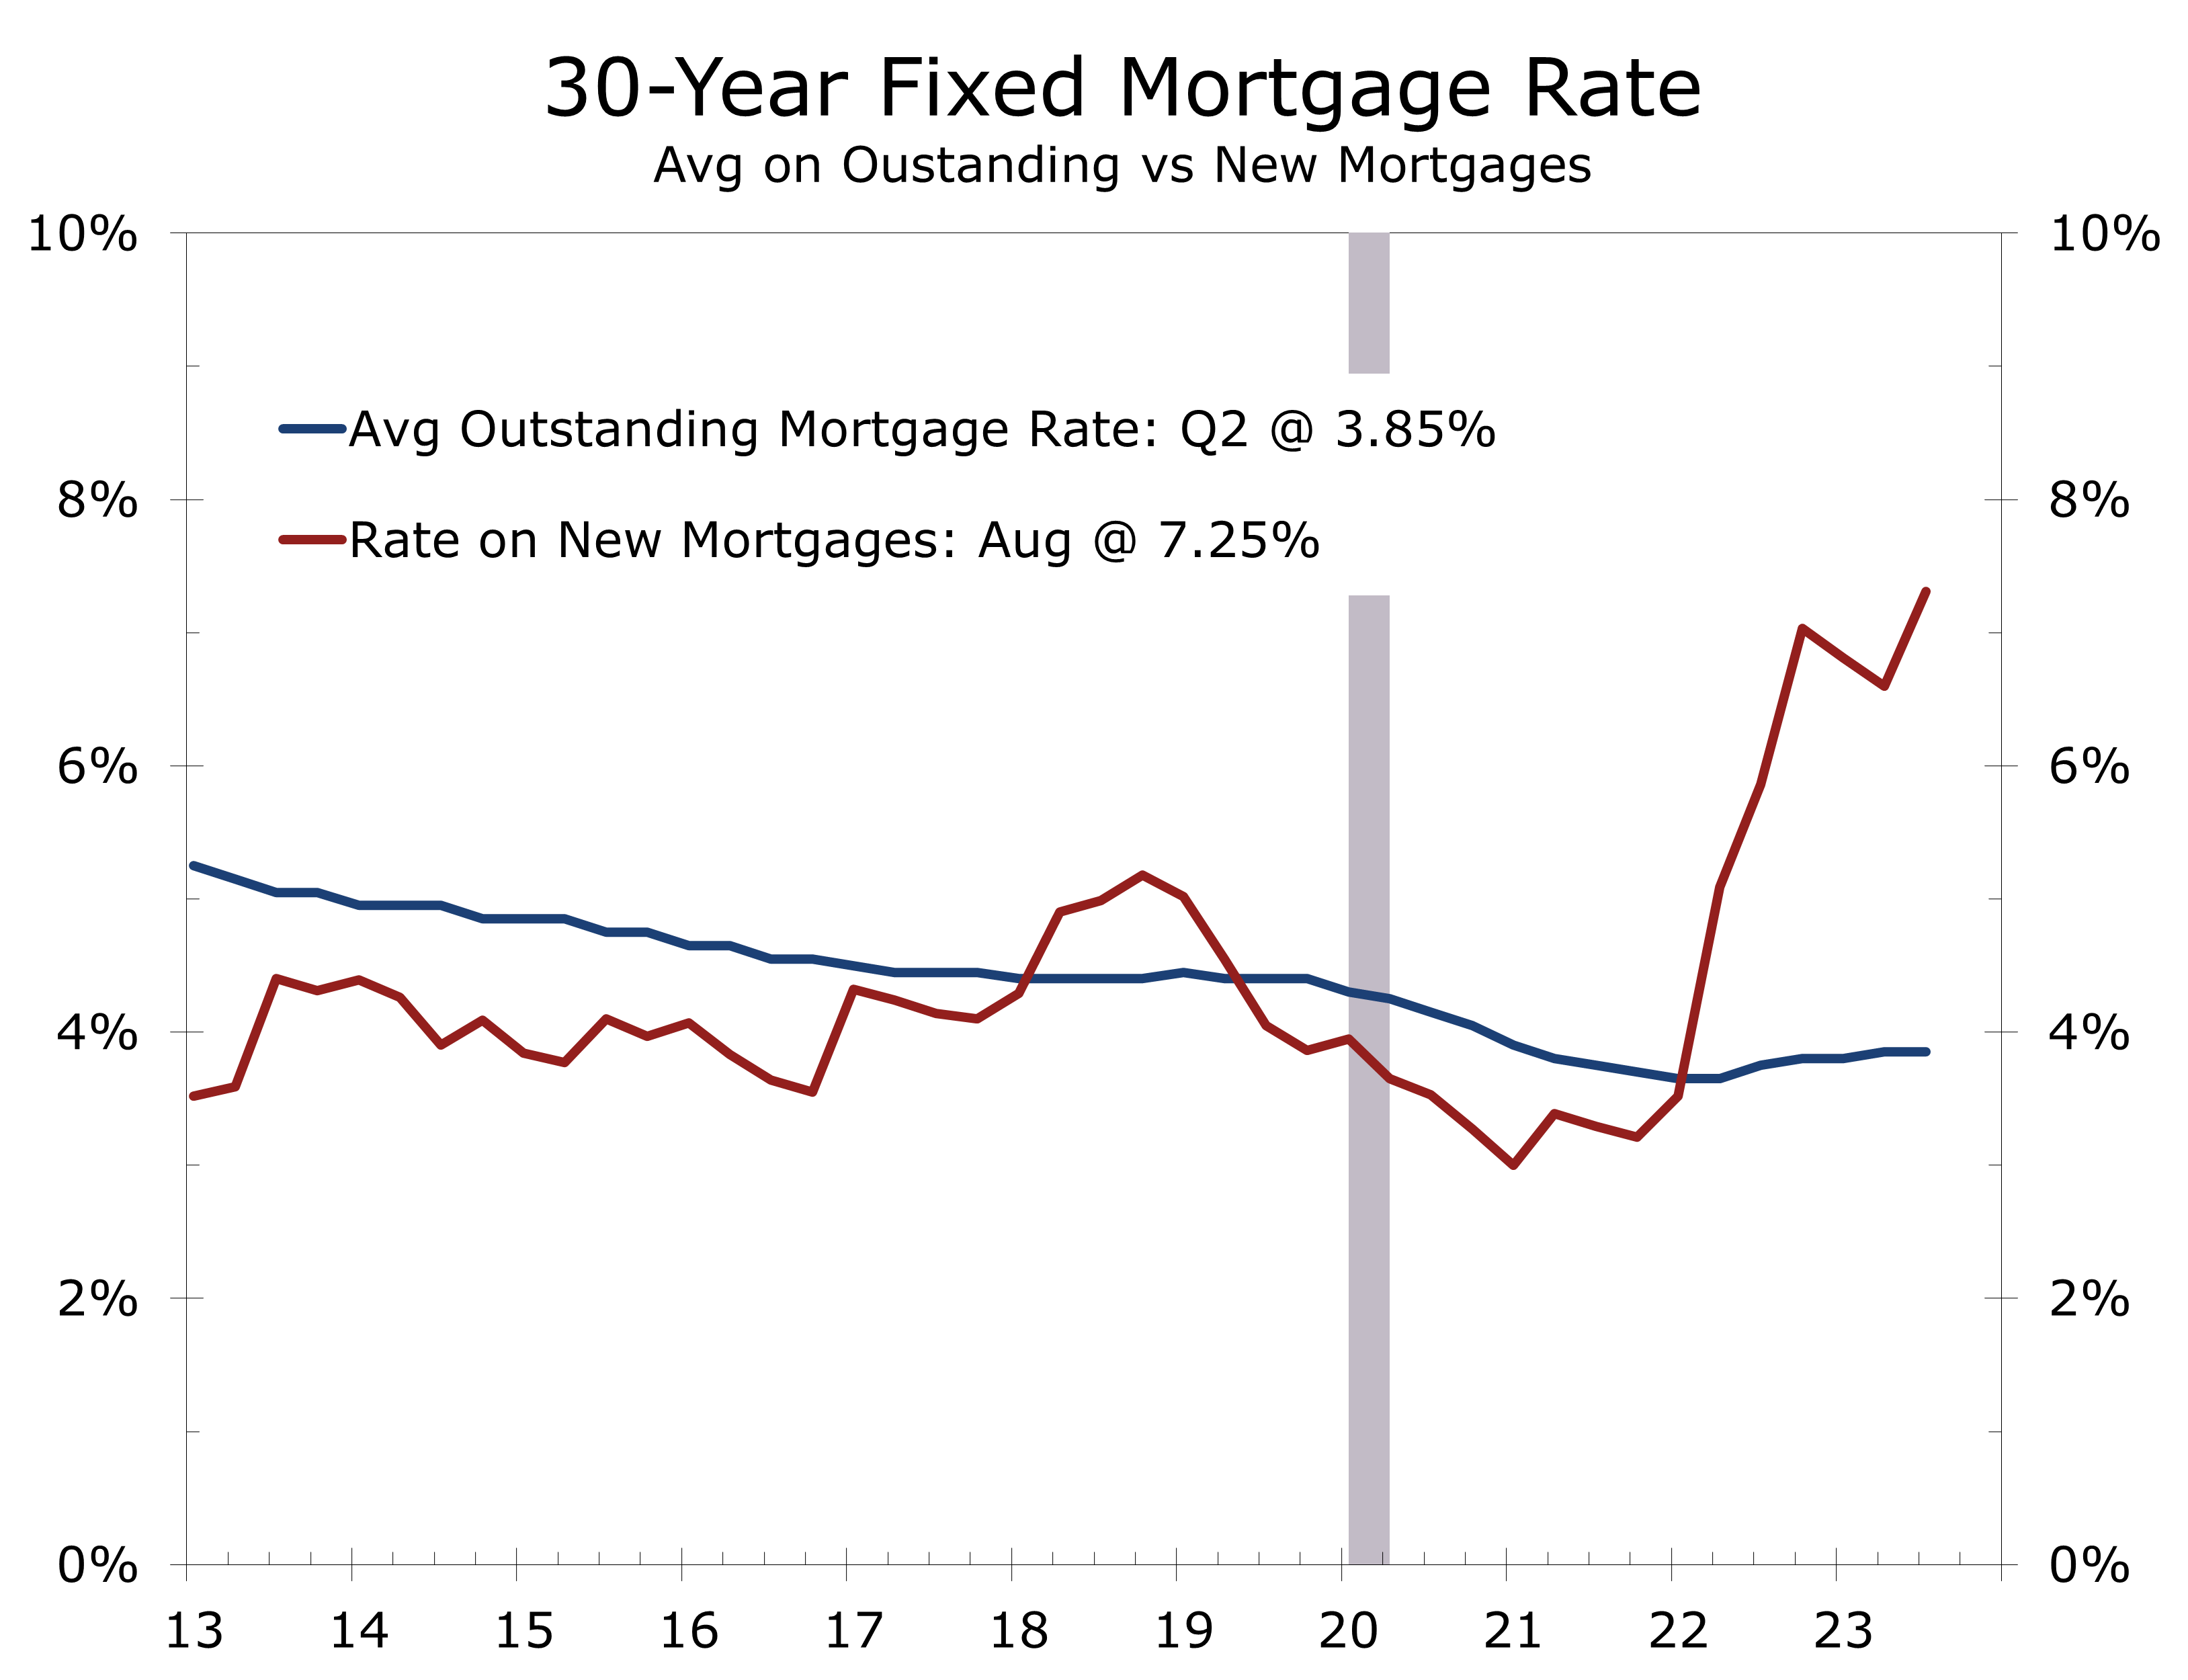
July’s rise in new home sales confirms that demand remains strong despite higher mortgage rates. Demand for new homes is being bolstered by buyers shifting away from the existing home market, where inventories remain scarce. Fewer homeowners are willing to sell today because they do not want to lose their current low-rate mortgage. Eighty percent of existing mortgages have an interest rate below 4%.
Mortgage rates are just part of the equation, new home prices have fallen in recent months, and are 8.7% below their year ago level. Affordability remains a formidable hurdle for many would-be buyers. One way around affordability hurdles is to sell a home in a higher priced market and buy a home where prices are lower. This arbitrage works best for folks relocating from the West Coast and Northeast to the South and Midwest. Home buyers are also pushing out to the furthest reaches of rapidly growing metro areas, where land costs are lower.
The boost to home sales from the affordability migration appears to be losing momentum. With more businesses requiring workers to be back in the office full-time, commuting long distances begins to look less appealing. Moreover, the massive in-migration into Florida and parts of the Southeast has driven prices up to the point that many native buyers have been priced out of the market.
The Midwest was responsible for the bulk of July’s rise in new home sales, with sales surging 47.4% from the prior month to an 84,000-unit annual rate. Sales also jumped 21.5% in the West but fell 6.3% in the South, which is the largest region for new home sales, and fell 2.9% in the Northeast.
We expect new home sales to decline by about 10% over the next six to nine months.
We expect new home sales to decline at least 10% by yearend. The huge spike in the Midwest will almost certainly be reversed next month and rising mortgage rates and diminishing affordability will push more would-be buyers to the sidelines. We look for new home sales to slide to under a 650,000-unit pace late this year. Prices will fall somewhat, and more builders will offer incentives to help counter the slide in sales.

Disclaimer: This publication has been prepared for informational purposes only and is not intended as a recommendation offer or solicitation with respect to the purchase or sale of any security or other financial product nor does it constitute investment advice.
Rising Mortgage Rates, Higher Prices & Lean Inventories Weigh on Existing Home Sales in July
Existing Home Sales Decline in July
- Existing home sales fell 2.2% in July to a 4.07 million-unit pace.
- Sales of single-family homes fell 1.9% to a 3.65-million-unit pace, while sales of condo and co-ops fell 4.5% to a 420,000 unit pace.
- Sales weakened across the country, with sales falling 5.9% in the Northeast, 3.0% in the Midwest and 2.6% in the South. Sales rose 2.7% in the West.
- Inventories of existing homes rose 3.7% in June to 1.11 million units but remain 14.6% below their year ago level.
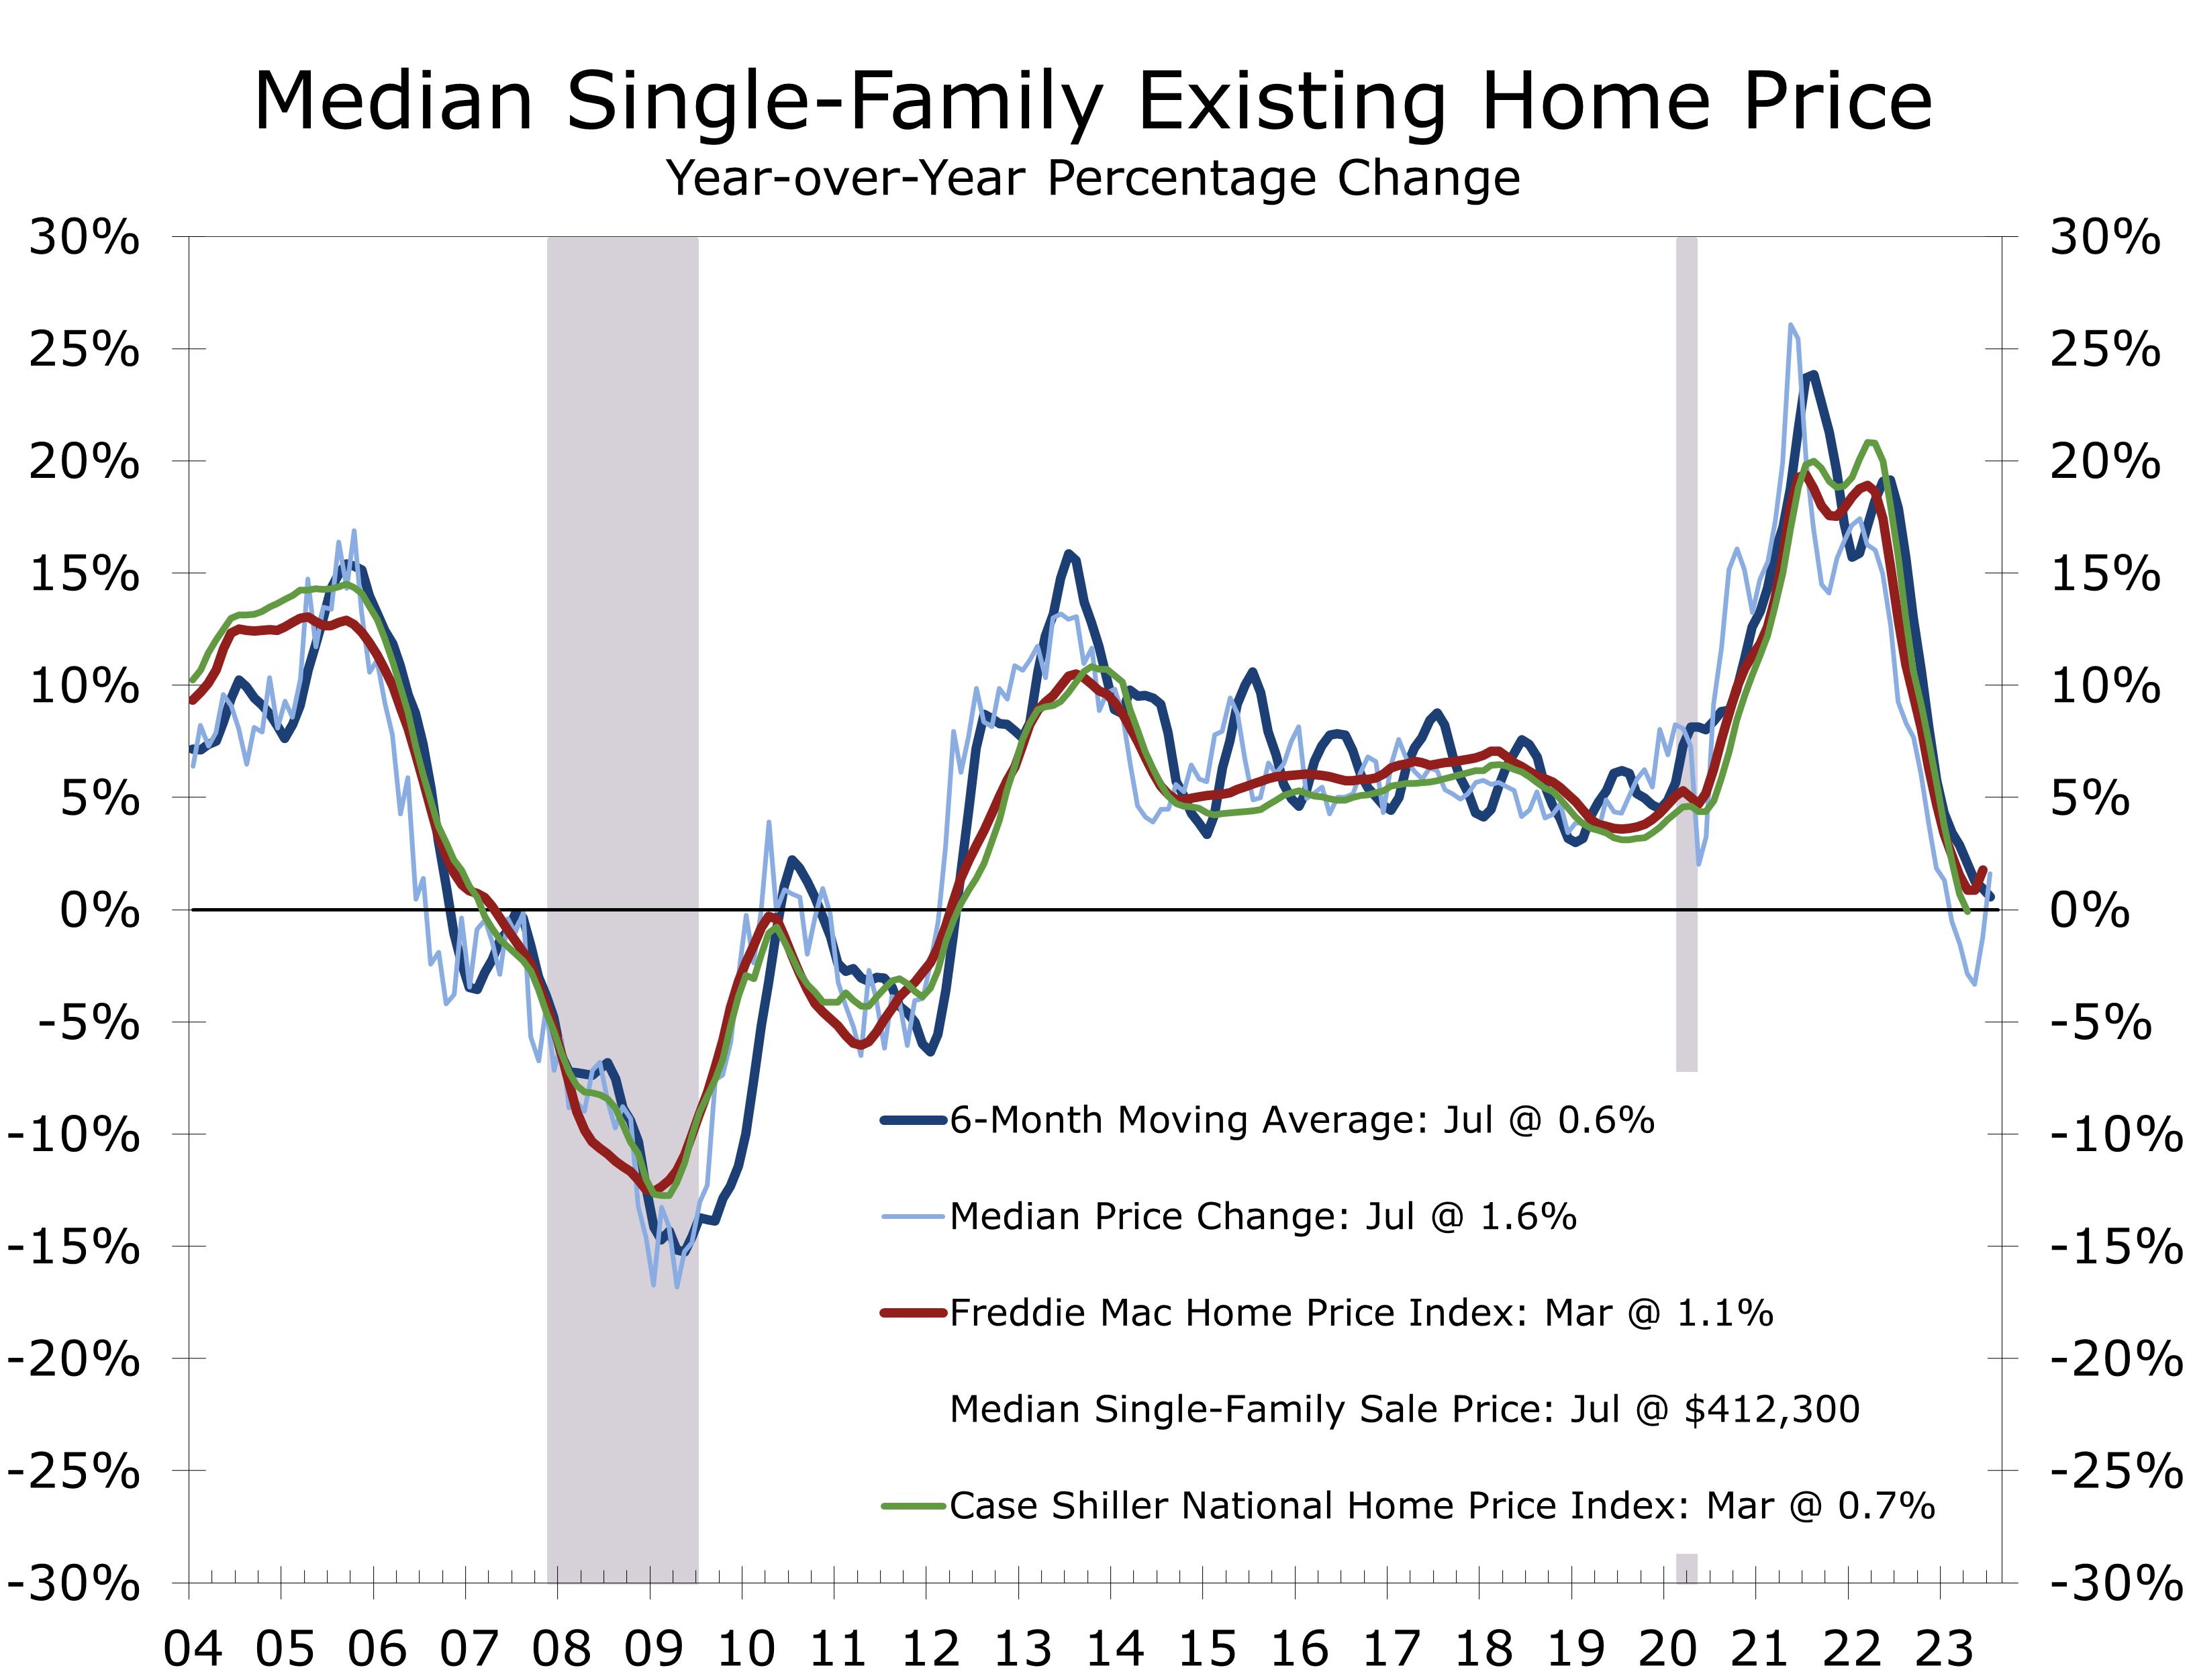
- The median price of an existing home was $406,700, up 1.9% from a year ago. Home prices are up year-to-year for the first time in 6 months.
- July also marks only the fourth time the median price has been above $400,000.
- The typical home remained on the market for 20 days in July, which is up from 18 days in June and just 14 days in July 2022.
- Existing home sales continue to trend lower, as exceptionally lean inventories continue to favor sellers. Affordability has fallen to record lows, which should continue to pull sales lower in coming months.
Existing home sales fell once again in July, as would-be buyers continue to be thwarted by rising interest rates, higher home prices and the general lack of inventory. Sales fell 2.2% in July to a 4.07-million-unit pace. Sales of single-family homes fell 1.9%, and sales of condo and co-ops fell 4.5%.
While the decline in sales was in line with our expectations, the consensus had called for a slightly stronger pace. Sales have fallen in 16 of the past 18 months and have closely tracked pending home sales. The link between the two is strong. Pending home sales reflect signed purchase contracts for existing homes, while sales reflect actual closings. Pending home sales edged higher in June, raising hopes existing sales would hold steady or even edge higher in July.
A record low share of consumers feel that now is a good time to buy a home.
The nascent improvement in pending home sales may just need a bit more time. The lag between purchase contracts and closings is between 6 and 8 weeks, so sales may hold near their current level in August.
We would not be surprised, however, if sales continued to trend lower. Despite rising slightly in July to 66.8, the latest Fannie Mae Home Purchase Sentiment Index reported the share of consumers that feel now is a ‘good time to buy a home’ fell 4 points to 18 in July, the lowest level on record.
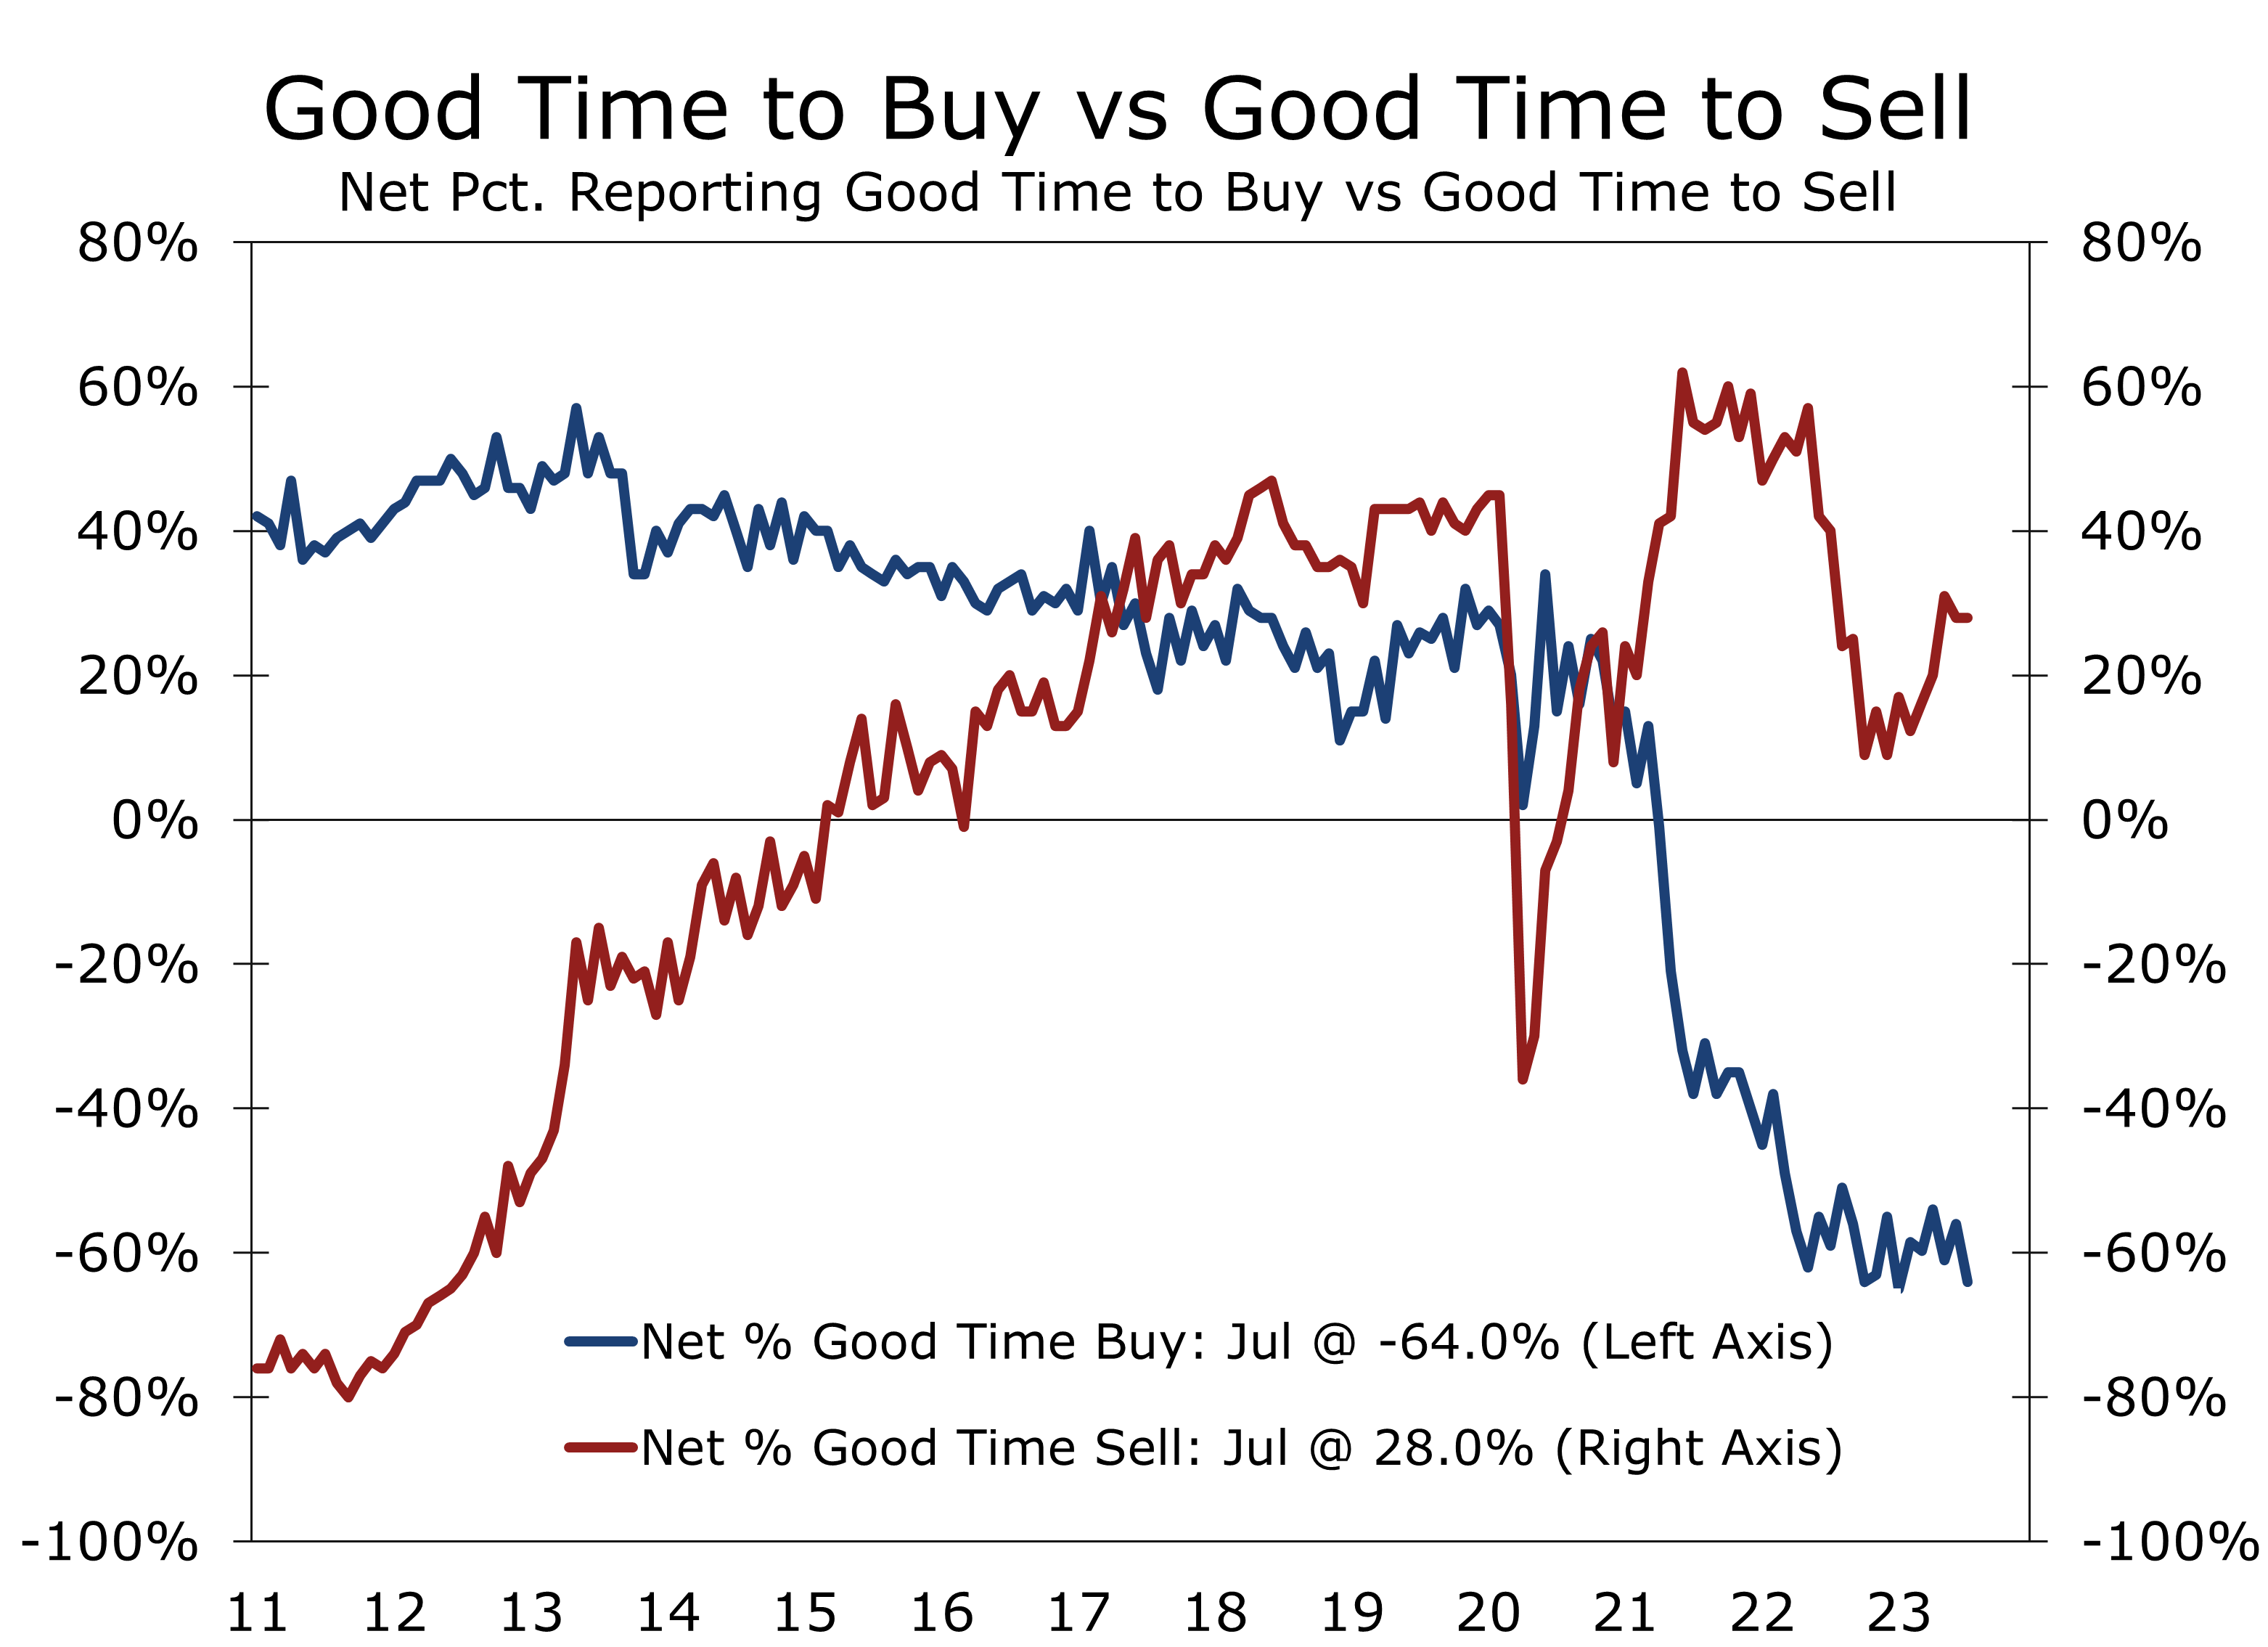
The share of respondents stating that now was a bad time to buy a home rose 4 points, climbing to 82%. The net share of respondents that feel now is a good time to buy fell 8 points to -64%, which is just 1 point shy of its all-time low.
On the flip side, the share of households that feel now is a good time to sell remained unchanged at 64%. The remaining 36% felt it was a bad time to sell. The difference between the two, or net share that feels now is a good time to sell a home, has been trending higher for the past 7 months, which closely tracks the nascent rebound in existing home inventory.
The inventory of existing homes rose 3.7% in July to 1.11 million homes. The number of existing homes available for sale hit an all-time low of 960,000 homes in December of last year and has risen 14.6% over the past 7 months. The number of homes available for sale at the end of July, however, still remains 14.6% below their year ago level.
By all accounts, we are still in a sellers’ market. At the current sales pace, the 1.11 million homes available for sale equates to a 3.3-month supply, which is up from 2.6 months in February and March. Homes are also selling quickly, with the typical home remaining on the market for just 20 days. A more normal market would have close to a 4.5-month supply and homes would remain on the market for around 30 days.

With inventories so lean, there is still intense competition for homes and prices have been pulled higher. The median price of an existing single-family home was $412,300 in July, which is 1.6% above its year ago level. The increase ends a string of 5 months of year-to-year declines.
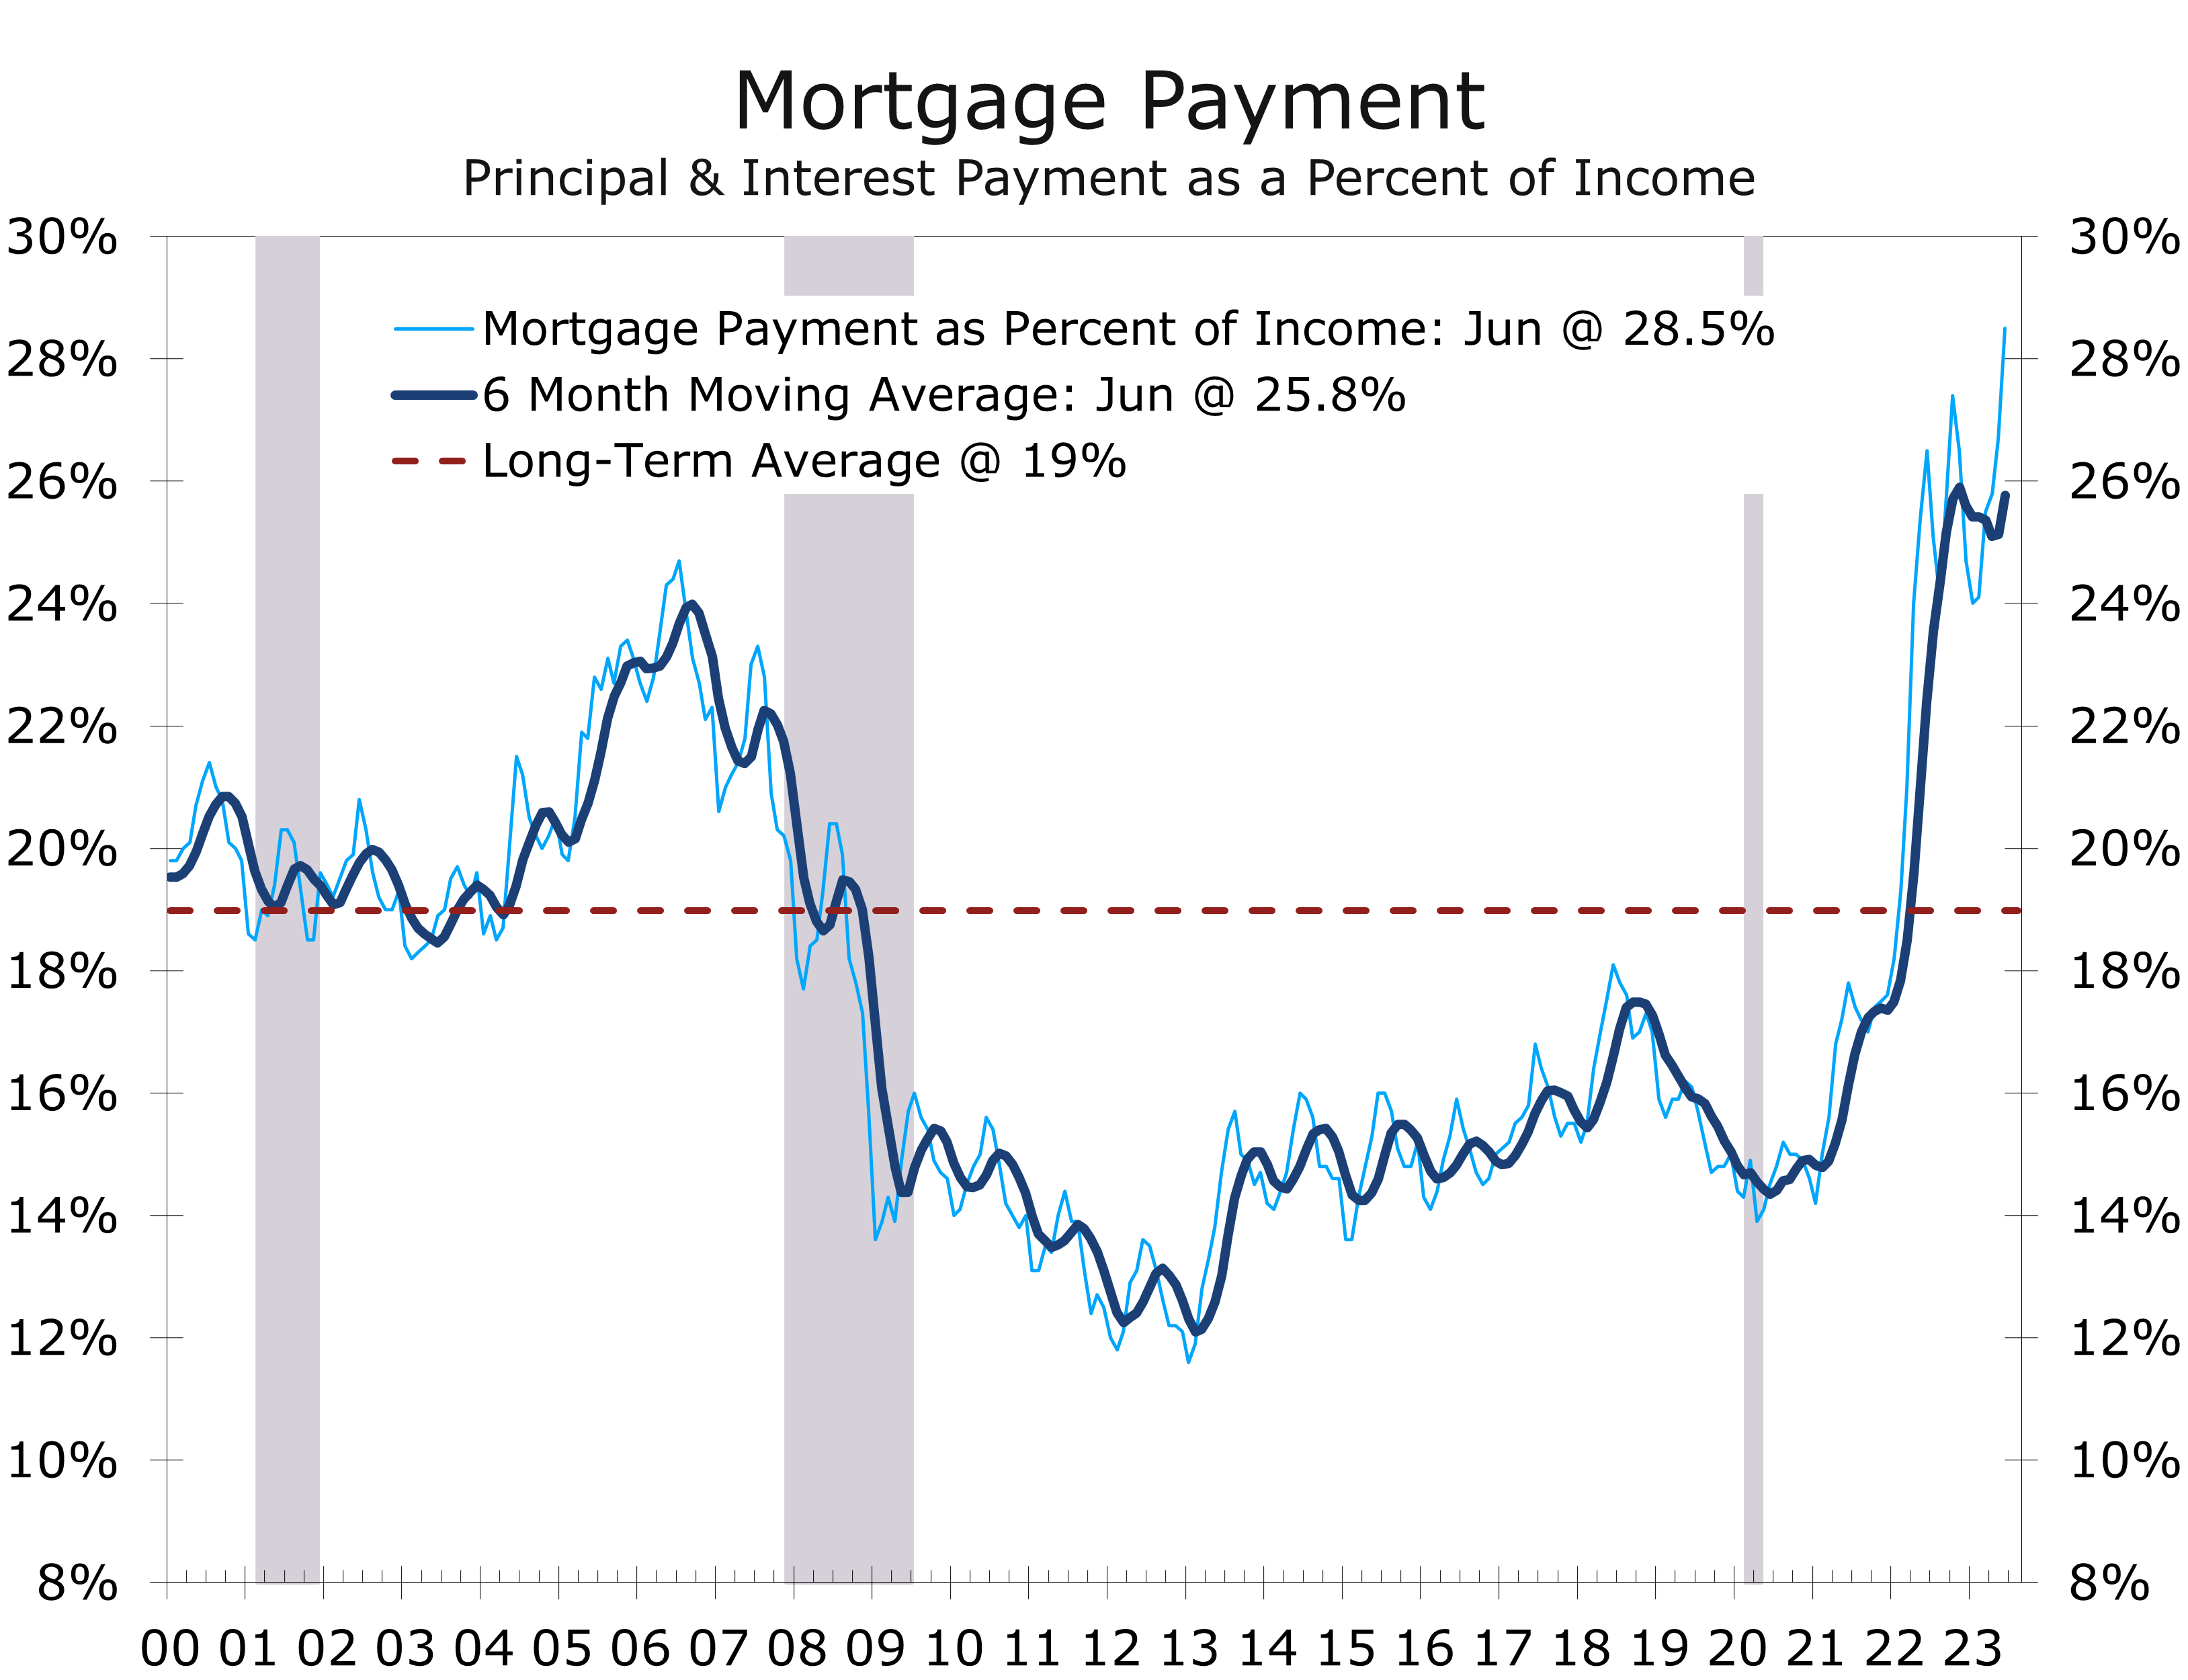
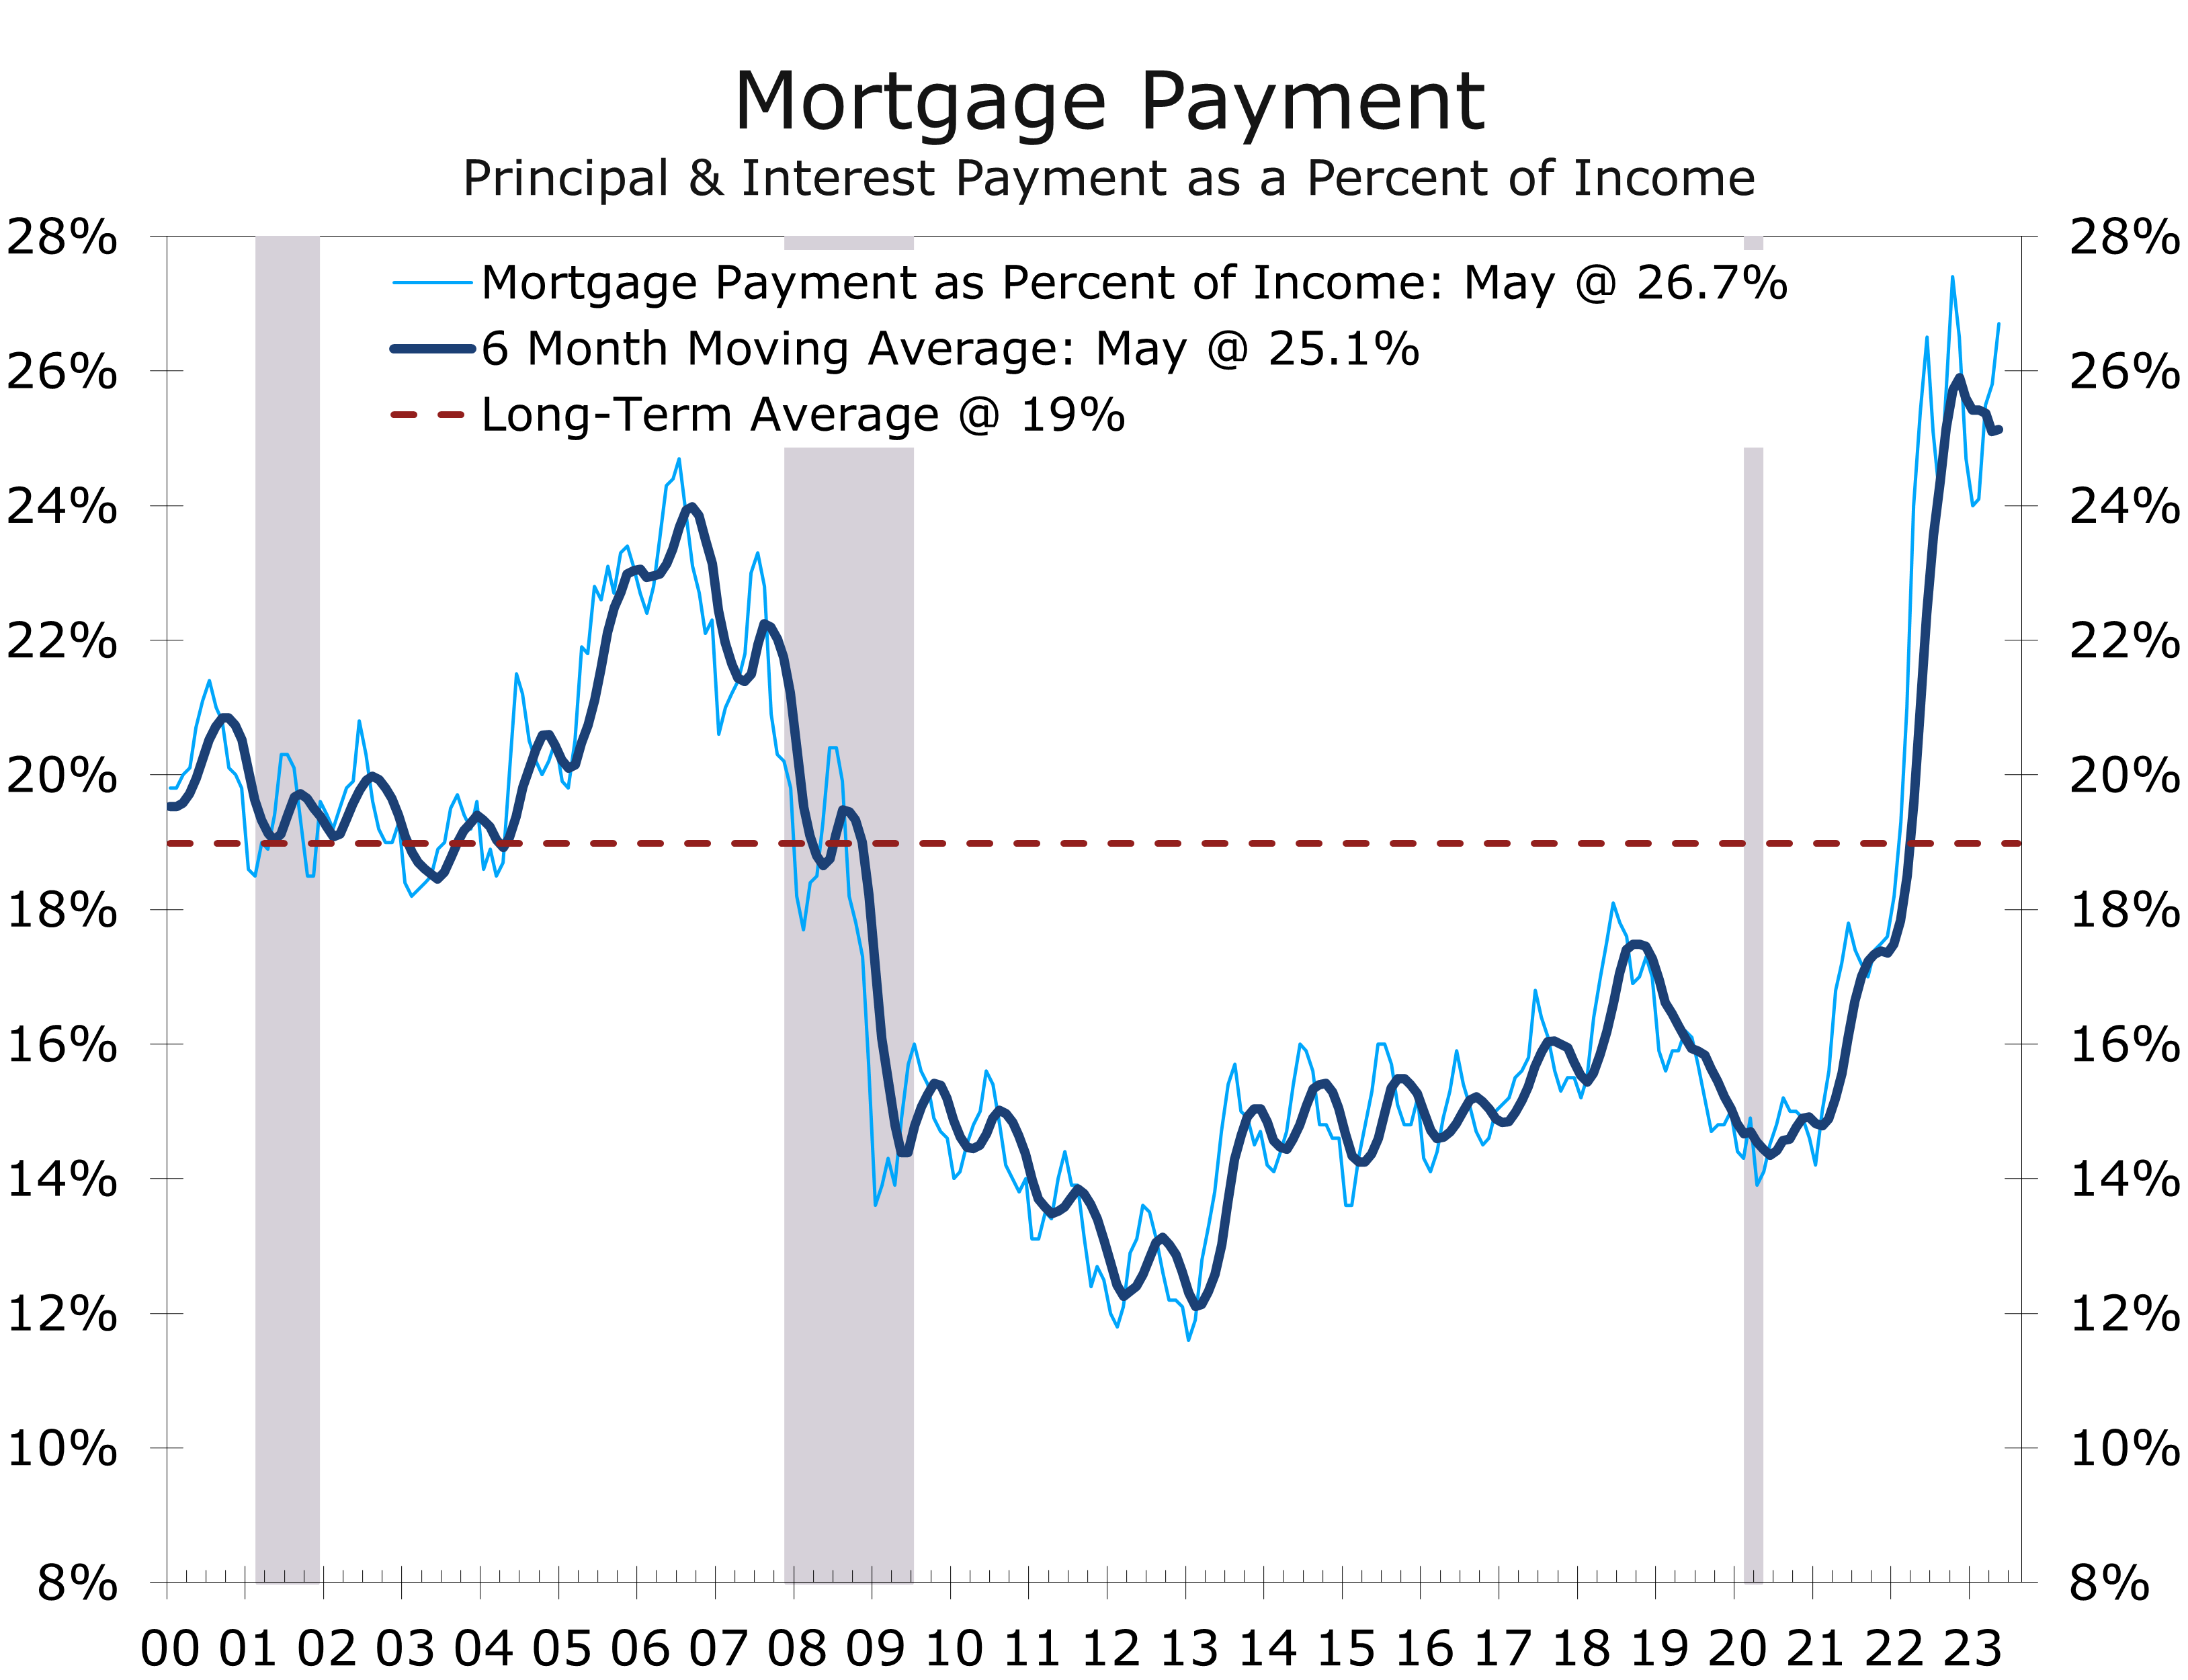
Home buying remains constrained by lean inventories, rising mortgage rates and higher home prices. The latest affordability data from the National Association of Realtors show a home buyer purchasing a home at the median price, with a 20% down payment, would need to devote a record 28.5% of their household income to principal and interest payments. The $2,167 monthly payment has spiked 74.7% since July 2021.
Existing home sales flow through to GDP via realtors’ commissions and upgrades and repairs that occur to a home before it is put up for sale and after it is purchased. Higher home prices have bolstered commission income. The intense competition for homes, however, has meant sellers need to make fewer repairs. Some of this is being made up for by more repair work by buyers. The persistent weakness in existing home sales has contributed to the recent pullback in renovation and repair spending.
Disclaimer: This publication has been prepared for informational purposes only and is not intended as a recommendation offer or solicitation with respect to the purchase or sale of any security or other financial product nor does it constitute investment advice.
The Surprisingly Softish Landing
Will the Fed Pull Off a Surprisingly Soft Landing?

- Positive economic surprises outnumbered negative ones during the first half of 2023, giving rise to hopes the Fed might just pull of a softish landing after all.
- Real GDP growth rose at a solid 2.4% annual rate during the second quarter, and employers continued to add workers at a healthy clip. The stronger pace of growth means the economy should be better able to withstand the impact of higher interest rates.
- First half growth was bolstered by the surprising resilience of the housing market. Demand rebounded earlier this year but there were relatively few existing homes available for sale. The mismatch pulled prices higher and very quickly reversed the declines registered in the second half of last year. Builder confidence also rebounded, as buyer traffic and new home sales improved.
- The rapid uptake of major stimulus programs such as the Inflation Reduction Act and CHIPS and Science Act has led to a surge in construction of new EV plants and semiconductor facilities.
- We believe the economy’s run of good luck may be ending. Fitch’s downgrade of the US credit rating provides a needed wakeup call that the nation’s precarious fiscal position might trigger some financial market volatility later this summer and fall. The Treasury stretched its finances in the months leading up to the debt ceiling deal and will need to replenish their coffers by issuing close to $2 trillion in securities over the next 6 months.
- We are looking for a ‘softish landing’, with real GDP growth averaging a 0.7% pace over the next six quarters, including back-to-back negative quarters at the end of this year and in early 2024.
The Surprisingly ‘Softish Landing’
This past month’s more moderate economic data have bolstered expectations that Jay Powell might just be successful after all in pulling off the ever-illusive soft landing. After stronger than expected real GDP growth in the second quarter, even more forecasters pulled back their calls for a recession. While economic growth was stronger than expected, inflation has become less menacing and there is a growing consensus that the Federal Reserve has either finished raising interest rates or will hike the funds rate just one more time. While the odds of a soft landing have increased, we continue to believe a recession, or continuation of the rolling recessions experienced this past year, is the most likely course for the economy during the second half of this year and 2024.
A ‘soft landing’ is a planned slowdown in economic growth, typically orchestrated by Federal Reserve interest rate hikes, that follows a period of strong growth. The idea is to bring economic growth back below its potential growth rate, which is currently somewhere between 1.5% and 2%, so that the economy builds back a little slack and allows inflationary pressures to subside. If done successfully, a soft landing extends the business cycle and is sometimes referred to as ‘the pause that refreshes.’
Soft landings are relatively rare, difficult to pull off and even harder to sustain. Prior to the current rate hike cycle, the Fed had initiated 12 tightening cycles since 1954, where they gradually raised interest rates to break the economy’s momentum and slow or reverse a rise in inflation. In 8 of these previous cycles, the economy wound up succumbing to a recession, or a hard landing. In 4 of 12, the Fed achieved a soft landing, where economic growth slowed, the unemployment rate edged higher, and inflationary pressure eased.
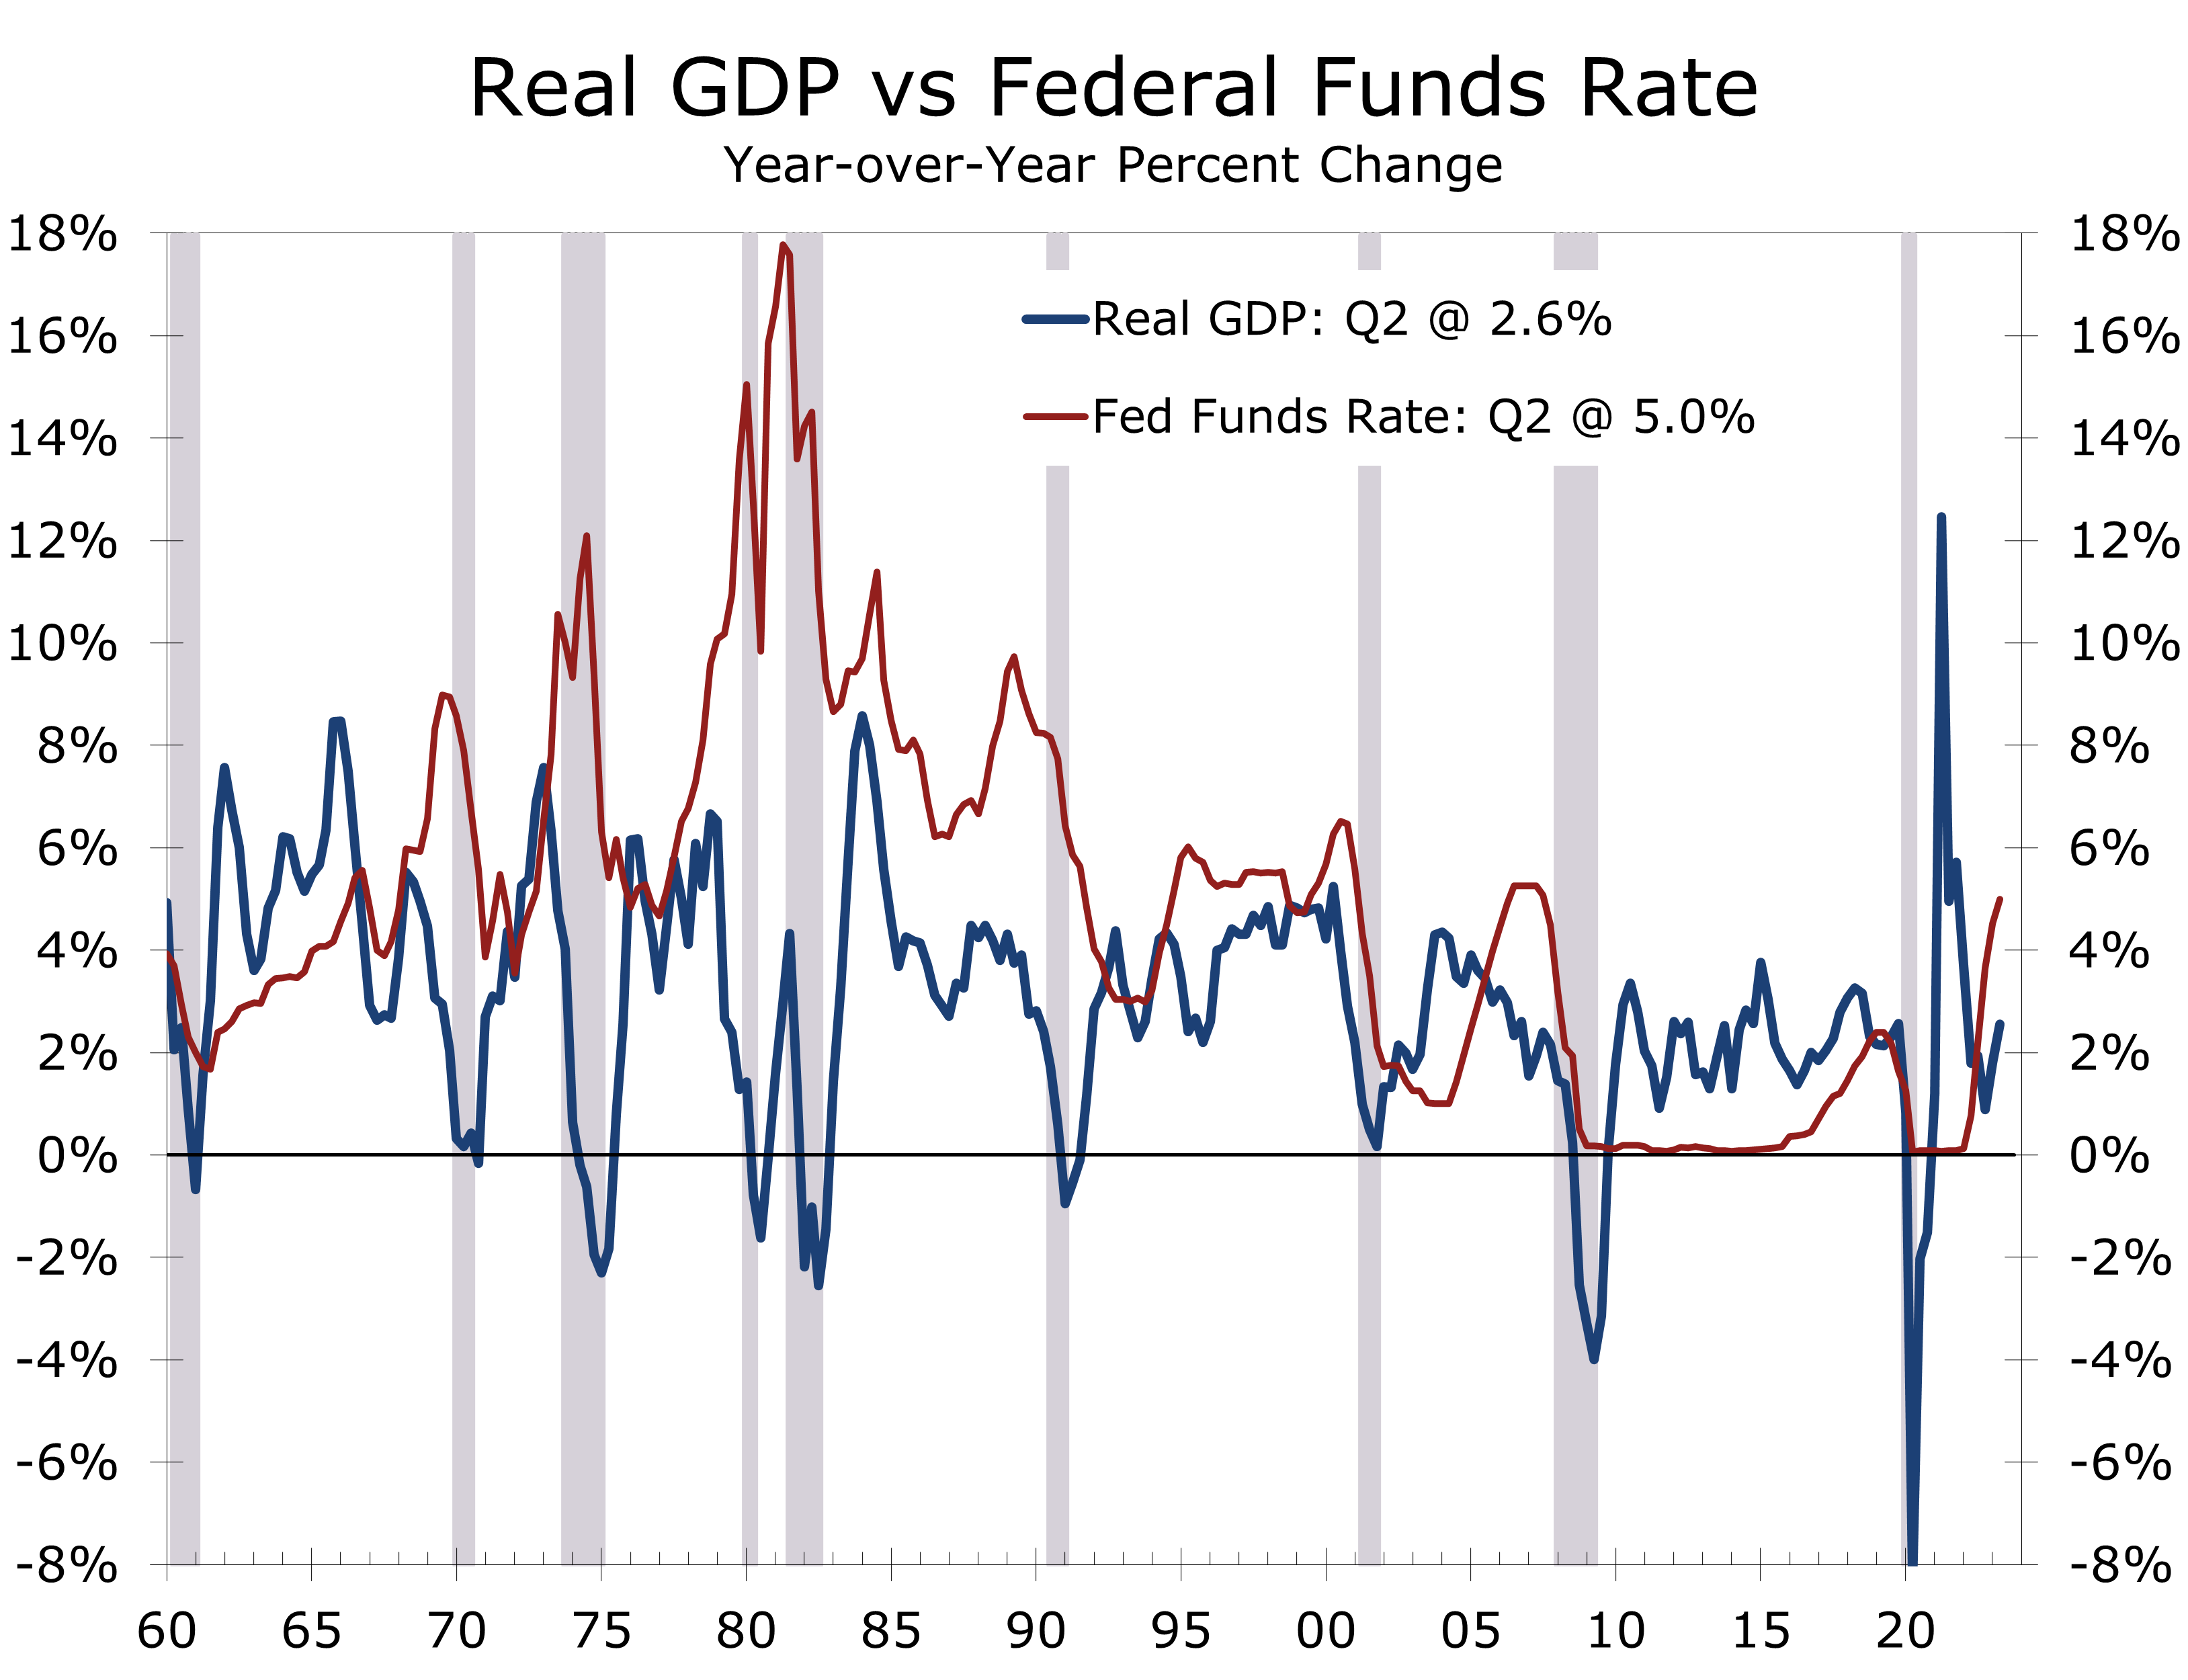
Three of the prior soft landings resulted in substantially longer economic expansions. The first was in the 1960s, when the Fed raised the federal funds rate from 3.50% in November 1964 to around 5.70% in November 1966. The rate hikes worked, with real GDP growth slowing and inflationary pressures subsiding. The Fed was able to subsequently pull rates back below 4% in May 1967. The expansion continued for another 4 years, although inflation flared back up and the Fed had to hike interest rates even higher in the late 1960s, helping send the economy into recession in 1970.
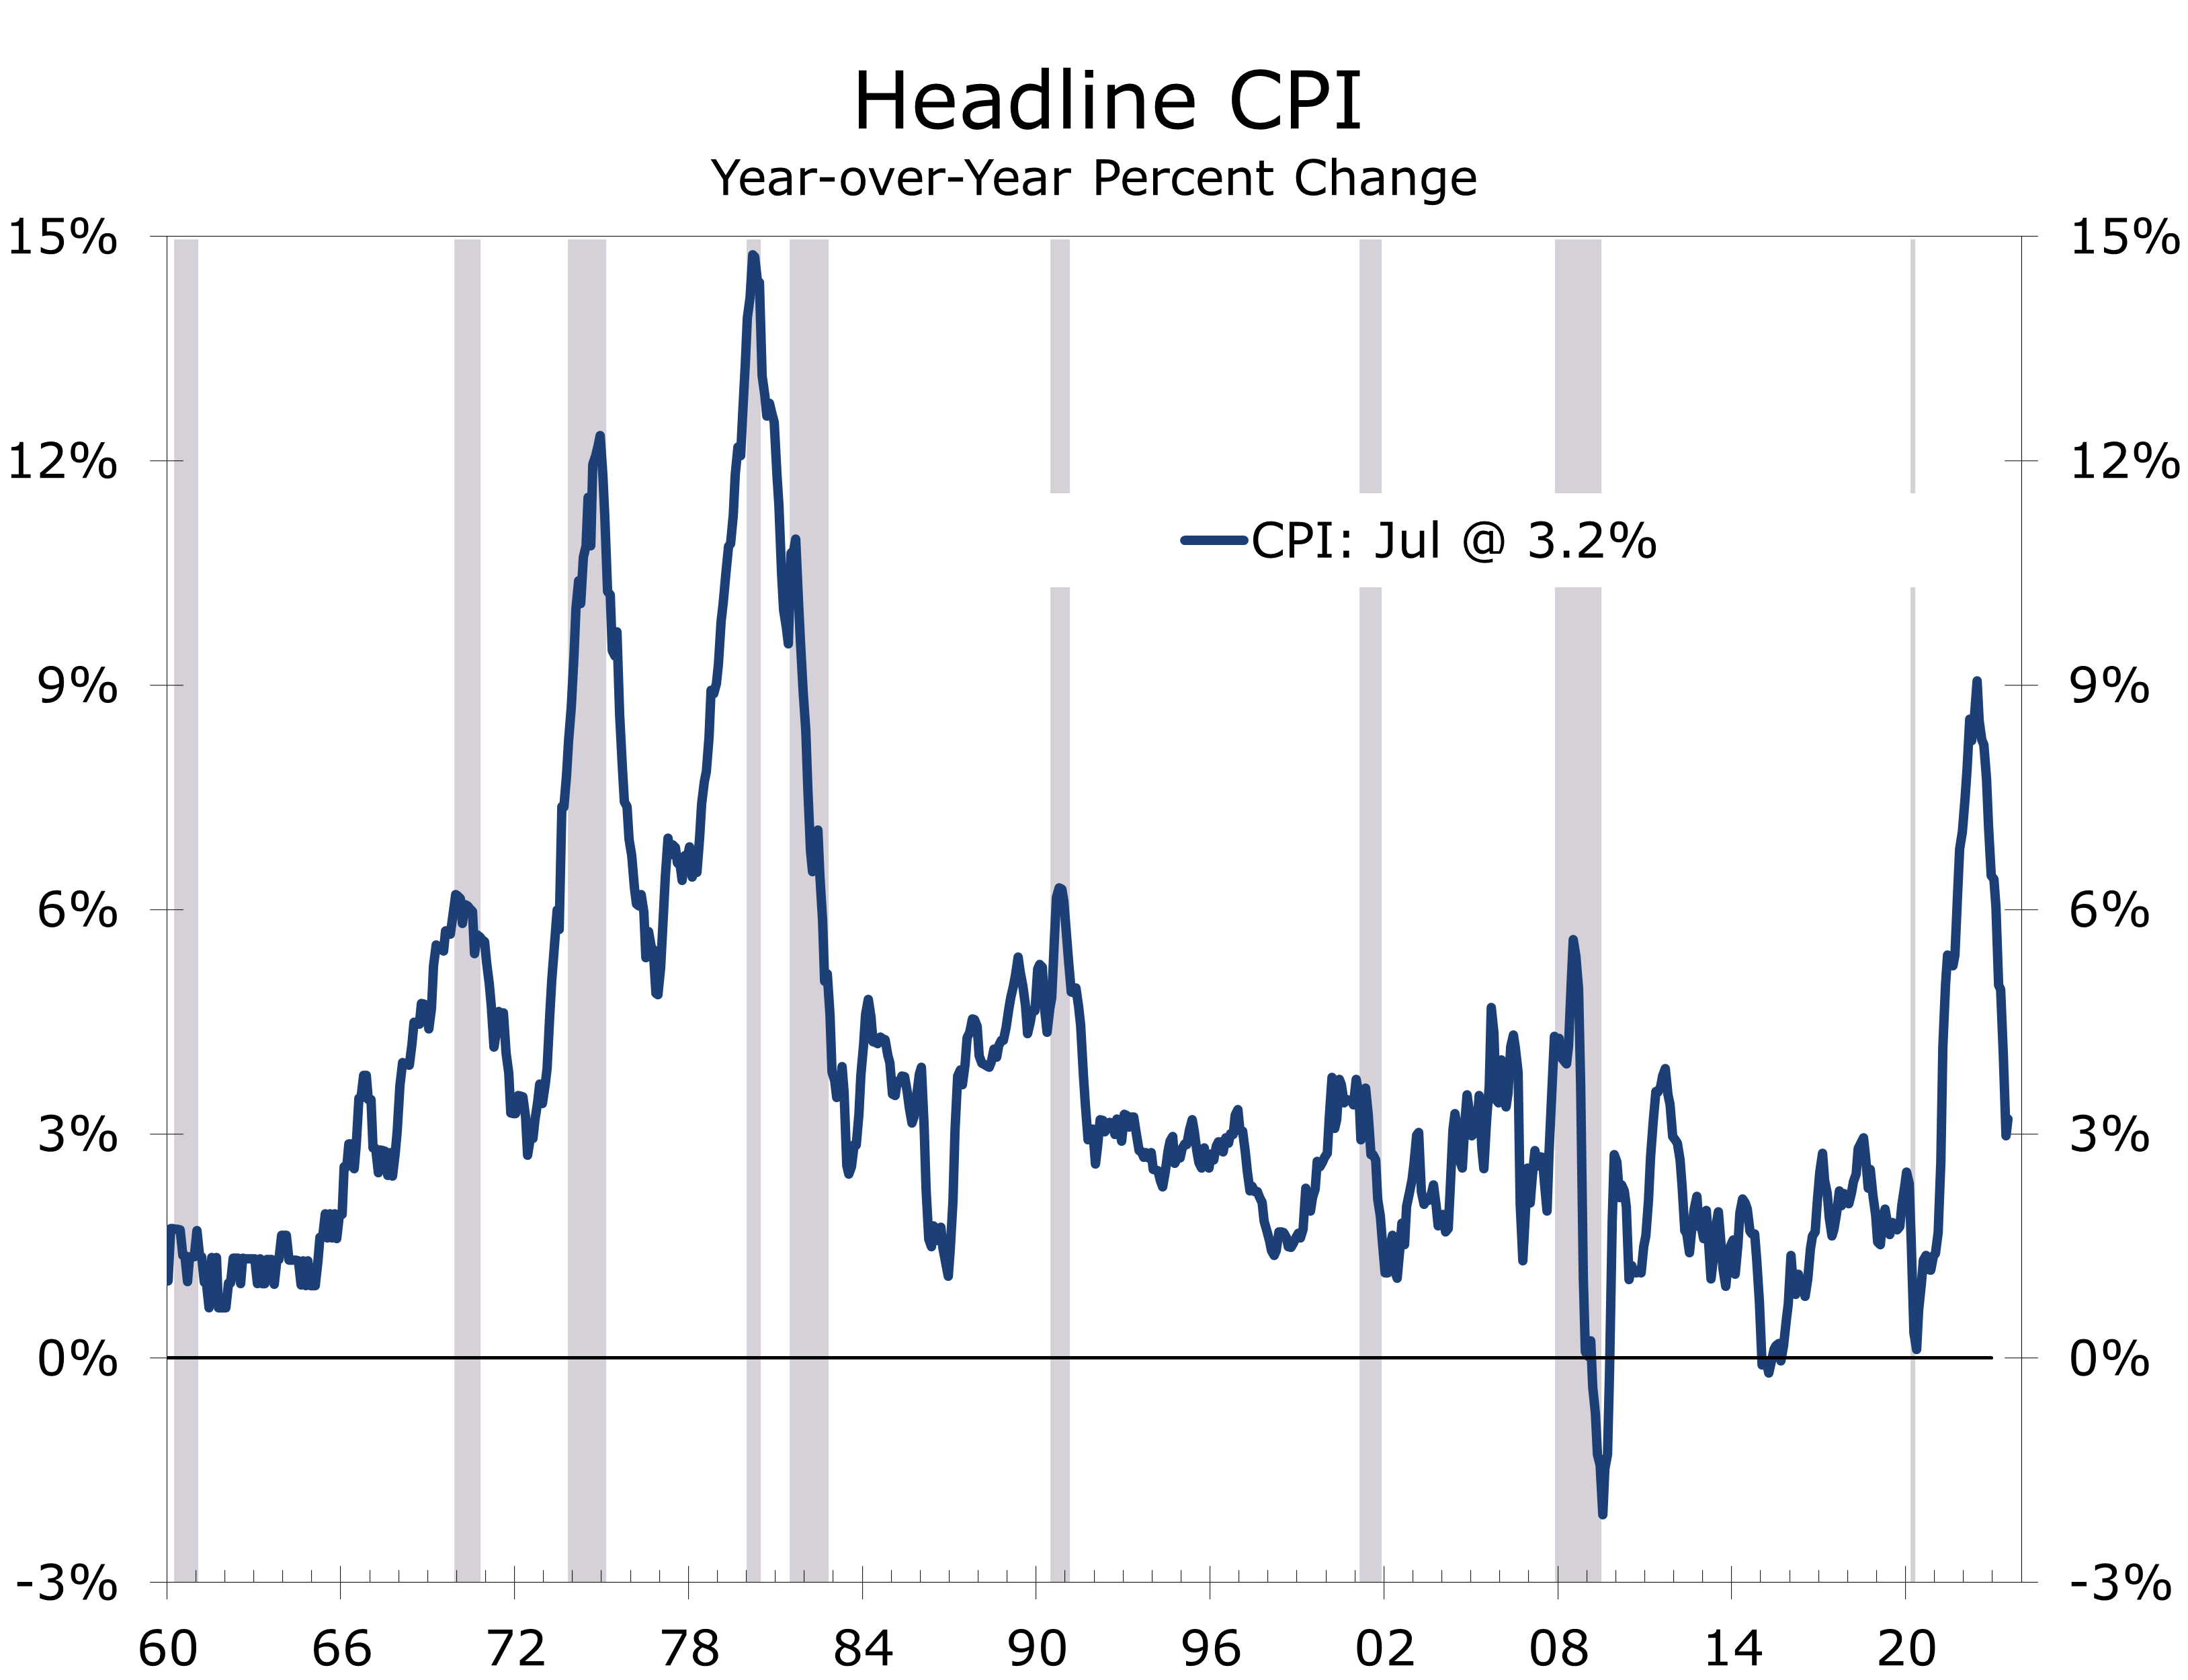
The next most notable success occurred in the mid-1980s when the economy came roaring back from the deep 1981-82 recession. That recession broke the back of the hyperinflation of the late 1970s and early 1980s, seeing the year-to-year change in the headline Consumer Price Index fall from 14.8% in March 1980 to just 2.5% by the middle of 1983. After real GDP came roaring back at a torrid 7.9% pace in 1983, the Federal Reserve initiated a series of interest rate hikes that took the federal funds rate to 11.6% in August 1984.
The Fed’s tough medicine worked, and economic growth slowed to just a 3.7% pace in the second half of 1984 and first half of 1985. That soft landing gave the expansion some breathing room, and growth continued into what became known then as the longest peacetime economic expansion on record.
The long 1980s economic expansion came to abrupt end shortly after Saddam Hussein invaded Kuwait and oil prices doubled overnight. The surprise invasion of Kuwait upended what looked like another successful Fed operation, which saw the Fed raise the federal funds rate from around 6.5% in early 1988 to 9.8% in May 1989. The Fed was gradually cutting interest rates in the year and a half prior to the Kuwait crisis, as it appeared the economy was in the early stages of soft landing.
The 1990 experience reveals one of the most obvious shortcomings of soft landings. When the economy slows below its potential growth rate, there is less ability to absorb an unforeseen shock. The business cycle is never going to be repealed, however. Recessions are ultimately caused by the buildup of imbalances during the economic expansion. There were plenty of imbalances present prior to the 1990 downturn, including a vastly overbuilt commercial real estate sector and weakened financial sector, which was reeling from the collapse of the Savings & Loan industry and a handful of large bank failures.
Despite the near miss in 1990, the Fed was successful at achieving another soft landing in the mid-1990s, taking the federal funds rate from 3% to 6% between February 1994 and March 1995. The rapid increase in interest rates was not without incident, as it triggered a financial crisis in Orange County, California – whose finances were unprepared for a sudden spike in interest rates. Problems also surfaced in Mexico, which saw its currency plummet as it had problems servicing its debt. The economy was strong enough to withstand those exogenous events, however, and growth continued for another five years.
As in the decade before, the Fed appeared to have engineered another soft landing in the year 2000, only to see unforeseen events subsequently pull the economy into recession. The Fed was raising interest rates at the end of the decade, as the economy was enjoying a strong burst of growth from business investment in IT infrastructure ahead of possible Y2K disruptions, as well as a surging stock market. The economy made it through Y2K without incident and was even weathering the selloff in the stock market reasonably well through much of 2021 before the September 11 attacks on the World Trade Center and Pentagon pulled the economy into recession.
The last time the Fed was able to pull off a soft landing was in the period just prior to the Pandemic, and whether this period qualifies as a soft landing is debatable. The Fed began to raise interest rates back in July 2017, lifting the federal funds rate from 1% to 2.4% in July 2019. The rate hikes successfully slowed the economy, and the fed began cutting rates later that year, pulling the federal funds rate back to 1.75% in February 2020. The COVID-19 Pandemic shut down the economy in March 2020, prompting the Fed to immediately cut the federal funds rate to zero. Without the pandemic, the Fed would have likely continued to gradually cut interest rates in 2020 and the expansion would have likely continued.
What does history tell us is likely to happen today? The Fed’s interest rate hikes over the past 18 months have been among the most aggressive ever, with the Fed raising interest rates from just 0.10% in March 2022 to around 5.40% currently. The 530-basis-point rise in the federal funds rate is the fastest since 1973, although the first 165 basis points essentially reverses the emergency measures put in place at the start of the pandemic – a point that is often overlooked but has played a critical role in extending the time that it has taken for higher interest rates to impact the broader economy.
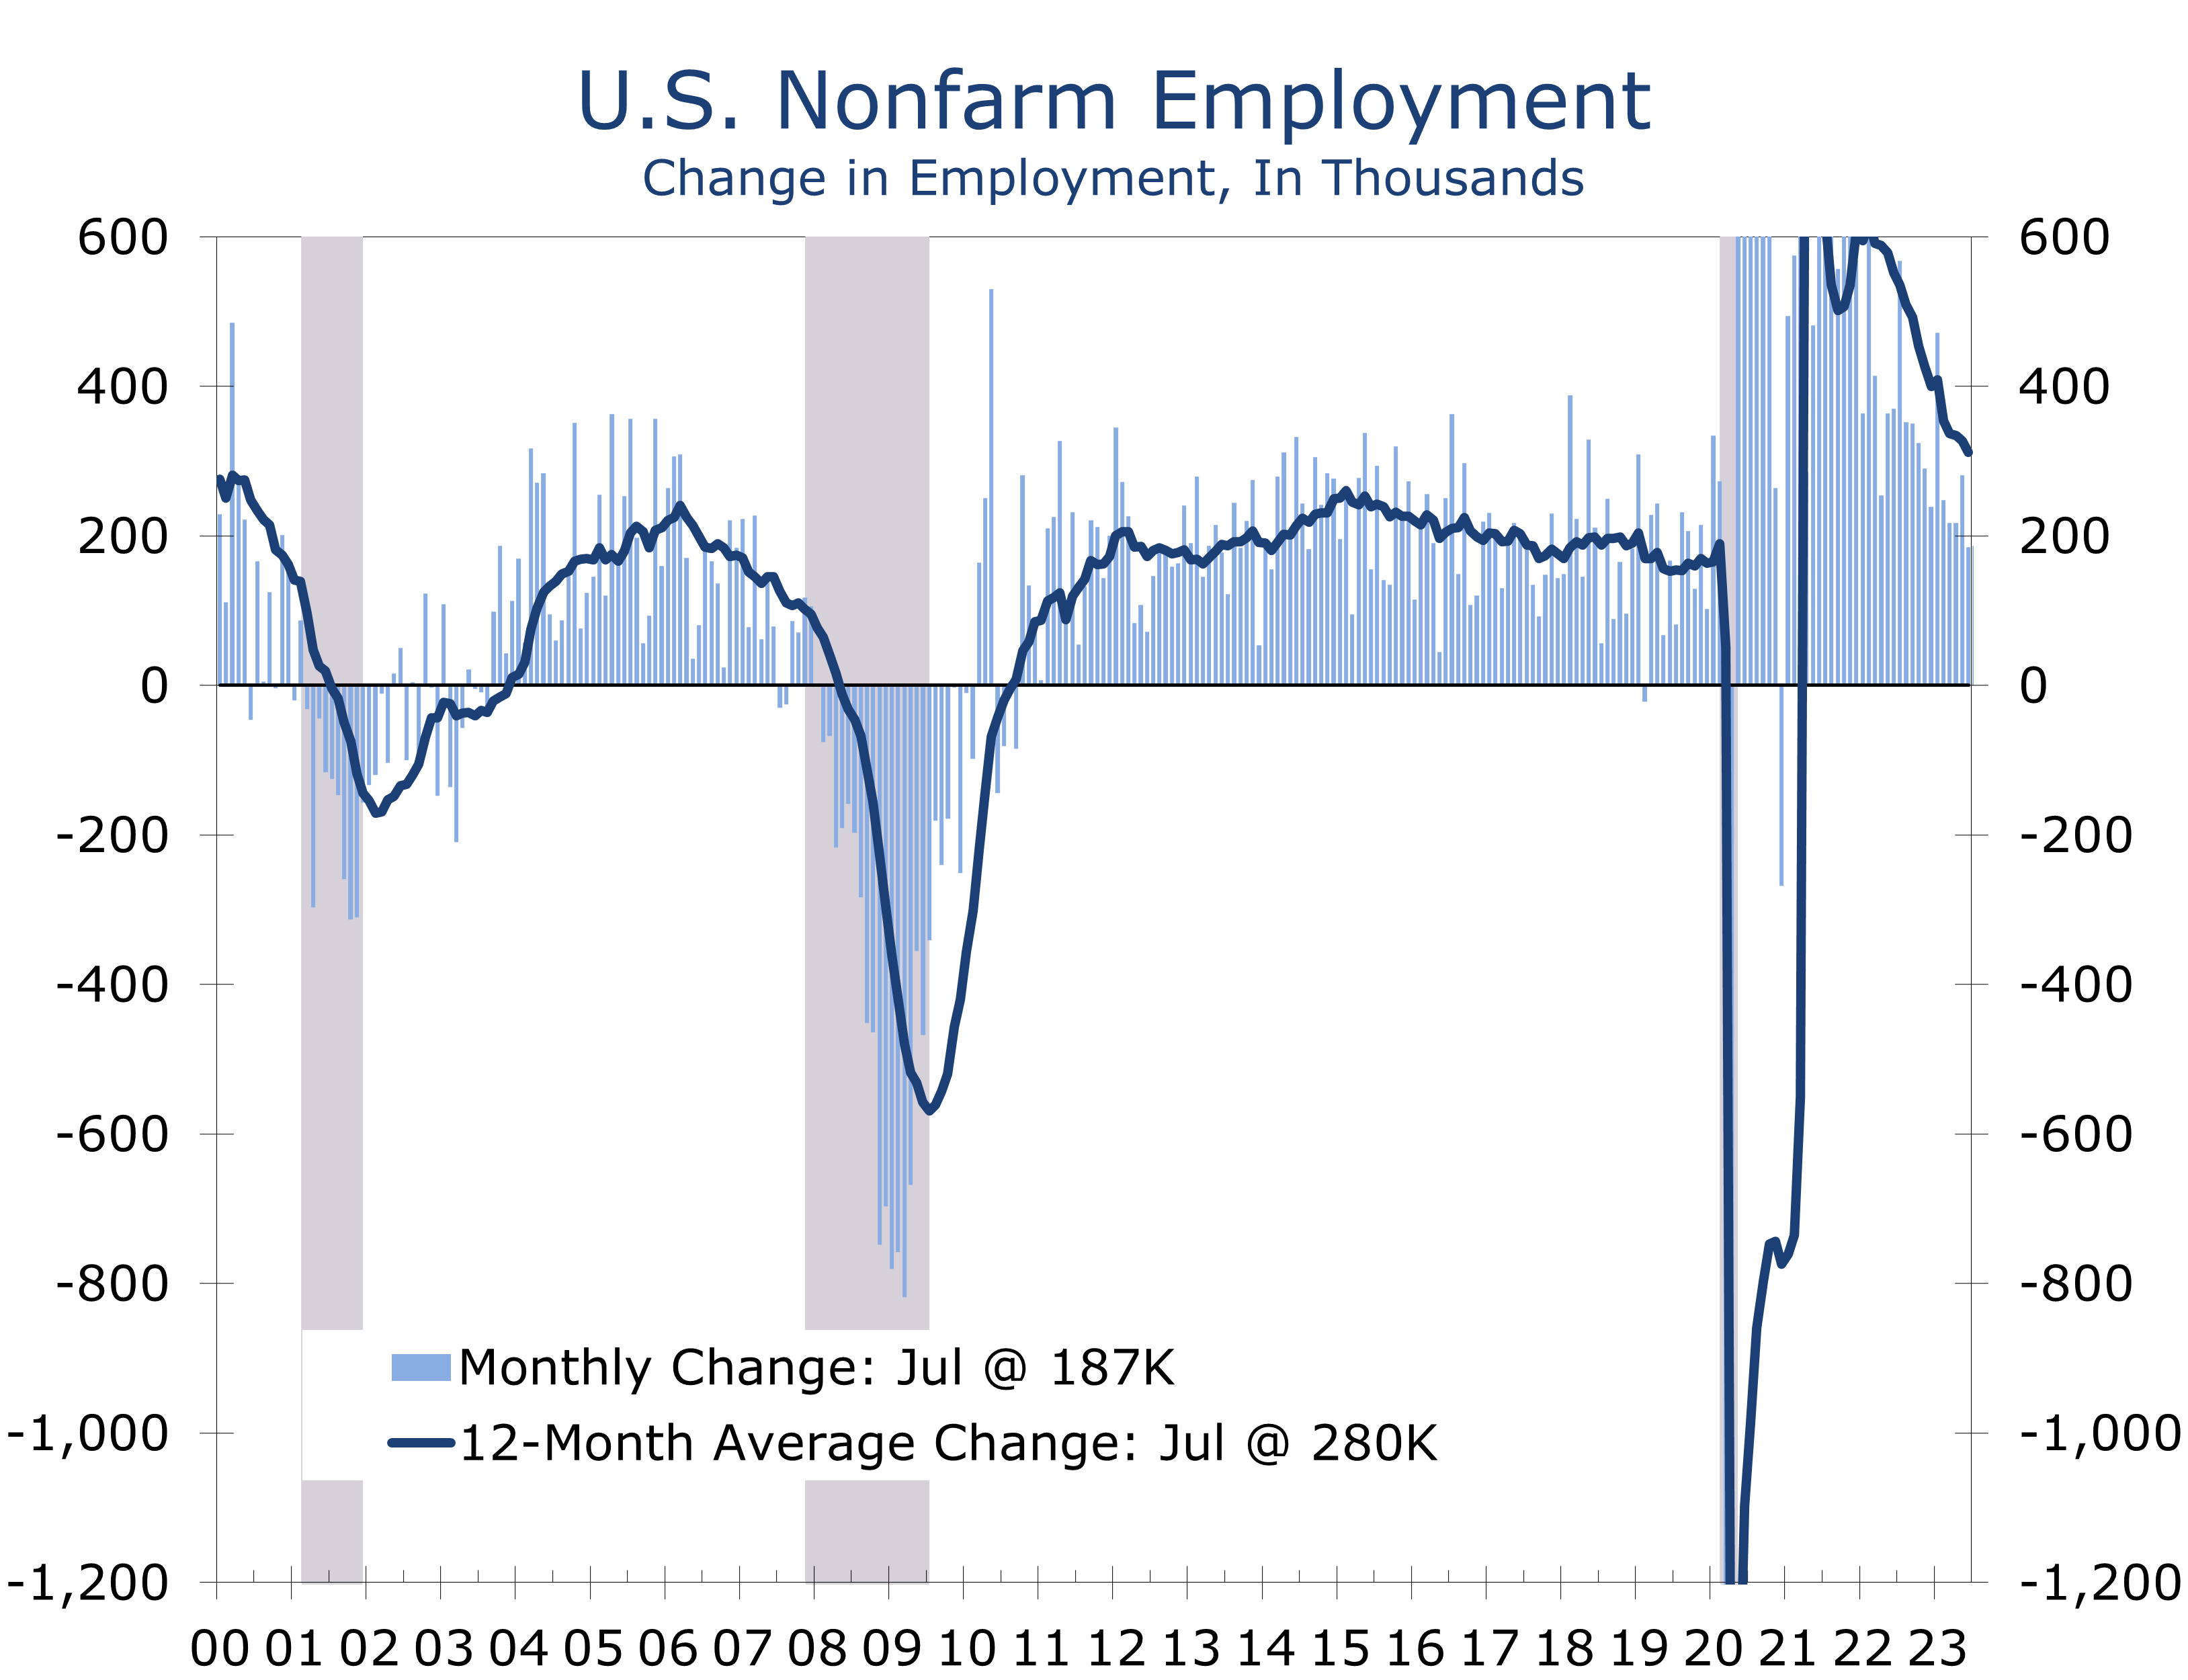
As in the 1990s, the unexpectedly rapid interest rate hikes this past year did not occur without incident, contributing to the collapse of Silicon Valley Bank and to a general pullback in bank lending. Despite these setbacks, positive surprises outnumbered negatives surprises during the first half of this year, which has bolstered hopes the economy is on the verge of a soft landing. The latest data point to support that notion has been the continued moderation in employment growth, with the latest data showing employers added a more modest 187,000 jobs in July.
We continue to believe talk of a soft landing is premature. The economy benefited from a remarkable string of positive surprises during the first half of the year that likely will not be repeated during the second half and may even be reversed. Among the more consequential surprises was that inflation eased much more quickly than expected, with the year-to-year change in the headline CPI falling from 9.1% in June 2022 to just 3.2% in July 2023.
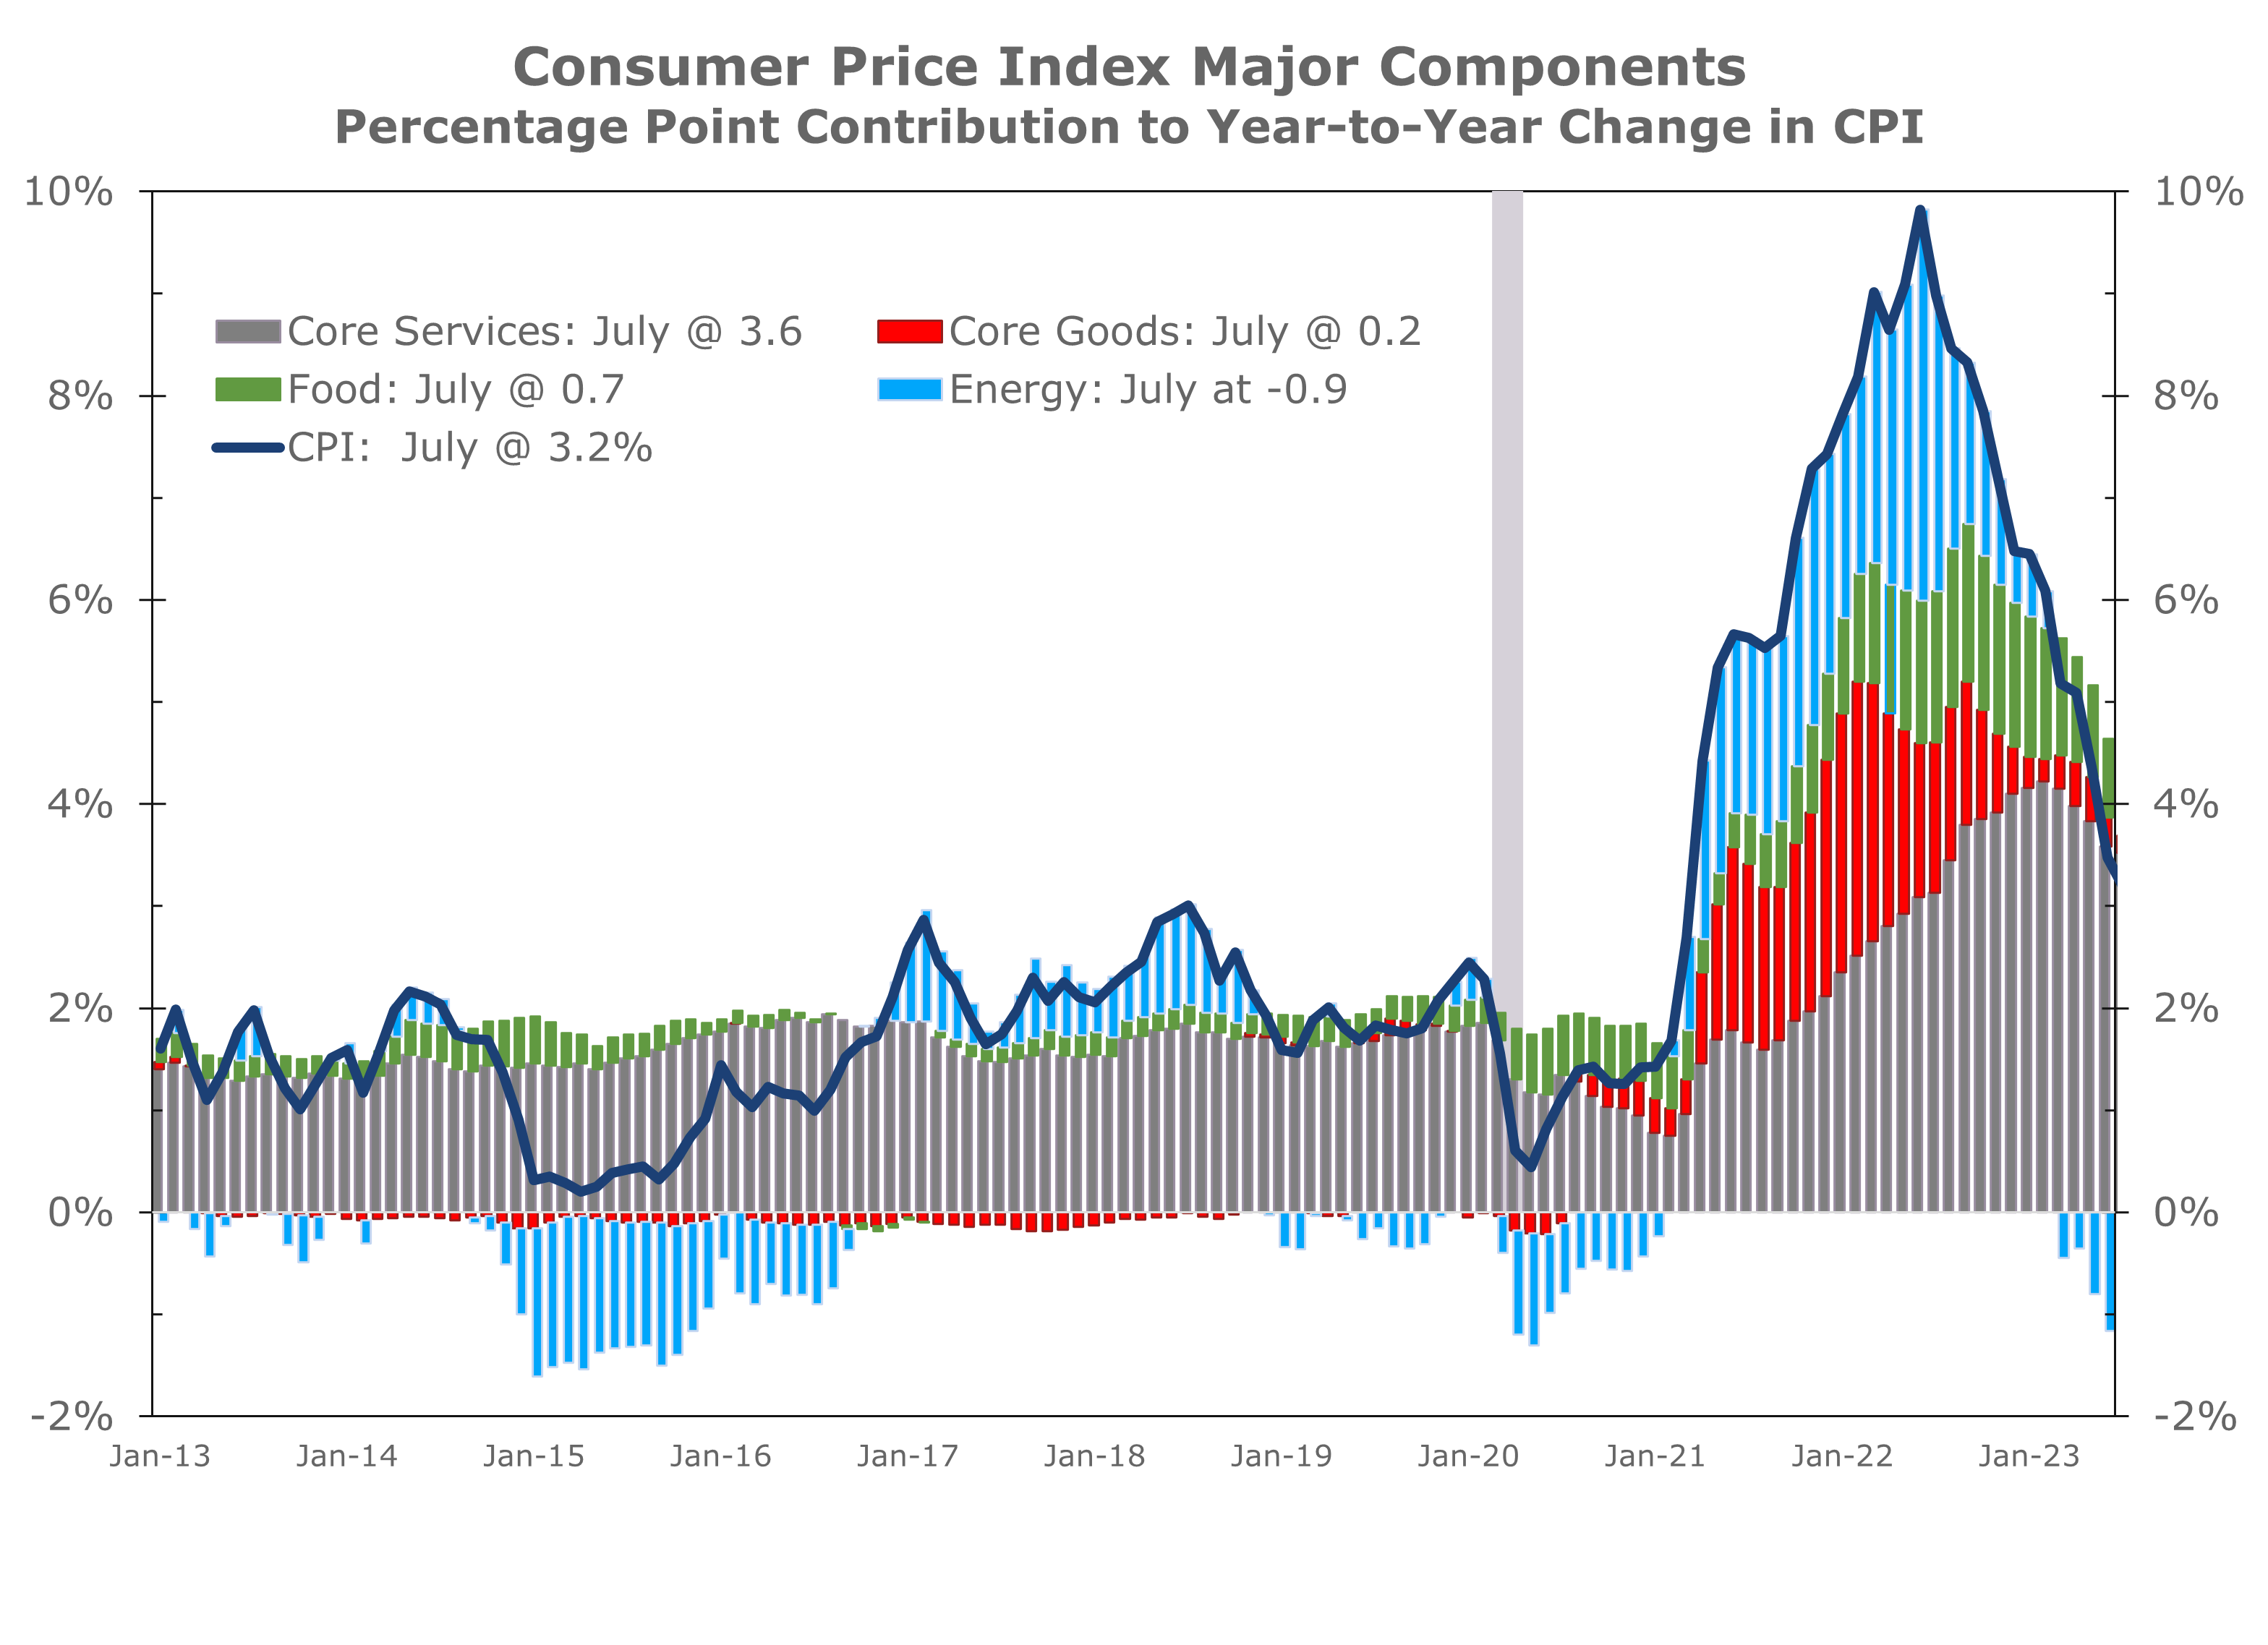
Most of the decline in the headline CPI this past year has come from a rapid decline in energy prices, which was largely brought about by President Biden’s decision to significantly draw down the Strategic Petroleum Reserve. Gasoline prices have fallen 20% over the past year. Falling energy prices are responsible for the bulk of the 5.9-point drop in the year-to-year change in the headline CPI over the past year. The drop in energy prices has also played a major role in slowing the pace of price increases at the grocery store, as transportation costs account for a large proportion of food prices.
Unfortunately, falling energy prices have likely provided all the relief that they can. The Strategic Reserve has largely been emptied, removing that backstop. Oil prices have recently rebounded back above $80 a barrel and gasoline and diesel prices have been edging higher. Grocery store prices are also likely headed higher, as persistent drought across the U.S. and other important agricultural producing nations push prices higher. In addition, the loss of shipments from Ukraine is tightening grain inventories and sending prices of several key products produced in the region notably higher.
There are other areas where the moderation in inflation should prove more enduring. Used car prices – another persistent problem area since the pandemic – have fallen back in recent months, as supplies of new cars have increased, and consumer demand has leveled off. Price increases for other goods have also moderated, as supply shortages have largely been alleviated. The most problematic area of inflation has been core services, which includes residential rent and owner equivalent rent. Rents are clearly moderating and will continue to slow the pace of core services prices.
Prices for services where labor makes up a large proportion of costs remain problematic, however. Wages are still rising around 4.5%, and with productivity stuck at around 1.5% or less, that pushes prices up at least 3%. Moreover, contentious labor negotiations between the United Auto Workers and major motor vehicle producers could set the stage for large pay increases in general, making it much more difficult to bring inflation back down to 2%.
The second biggest surprise of the first half of 2023 was that housing proved remarkably resilient. After mortgage rates spiked above 7% in November of last year, builders and realtors dealt with a spike in contract cancellations that pulled home sales substantially lower at the end of last year. Mortgage rates fell back to 6% in January, however, which brought many buyers back into the market, lifting new home sales in January and existing home sales in February.
The rebound in existing home sales proved short-lived. With roughly 80% of outstanding first lien mortgages fixed at 5% or less, and 60% at 4% or less, relatively few homeowners with a mortgage have been interested in selling their home and buying another with a mortgage around 7%. As a result, inventories of existing homes have remained exceptionally tight, which has completely reversed the moderation in home prices during the second half of last year.
The lack of existing homes for sale has been good news for home builders, which have seen increased buyer traffic and are enjoying stronger sales. The existing home market is more than 5 times larger than the new home market, however, which means residential investment is still a net drag on overall growth. Existing home sales provide commission income to realtors and fee income to mortgage lenders, as well as drive home improvement outlays and purchases of furniture and household appliances, all of which have been lagging.
The second half of the year looks to be even more challenging for the housing market. The combination of higher mortgage rates and rising home prices has made housing even less affordable. The latest data show that a family earning the median family income purchasing the median priced home, with a 20% down payment, will have to commit a record 28.5% of their income to principal and interest payments. That share almost certainly rose higher in July when both mortgage rates and housing prices rose further. Moreover, property taxes and the cost of home insurance have spiked in the past year, reflecting higher home values and higher replacement costs.
Another surprise is that higher interest rates did not take a heavier toll on household and corporate balance. Debt service costs remain relatively low for households and businesses, which has freed up more income for spending and investment. Stronger balance sheets are a holdover from the pandemic era, when record low interest rates and easier credit allowed households and businesses to refinance their debt at lower rates.
Higher interest rates are beginning to bite, however. Interest rates on car loans have risen substantially over the past year, which has slowed new and used light vehicle sales. Businesses are also having a harder time rolling over maturing debt at affordable interest rates and terms, leading to an uptick in bankruptcies and most likely some pullback in business fixed investment and staffing during the second half of this year and in 2024.
The unexpected Artificial Intelligence boom that followed the release of ChatGPT was another huge positive for the economy in the first half of 2023. The AI boom helped send stock prices higher and even led to a modest uptick in office leasing in Silicon Valley. What started as an incredibly narrow rise in share prices has broadened, which has revived consumer confidence. The AI boom has also bolstered IT equipment spending and employment. As with other booms, the initial uptake probably has a bit of hype tied to it and we expect the boost to investment and employment to fade somewhat during the second half of this year.
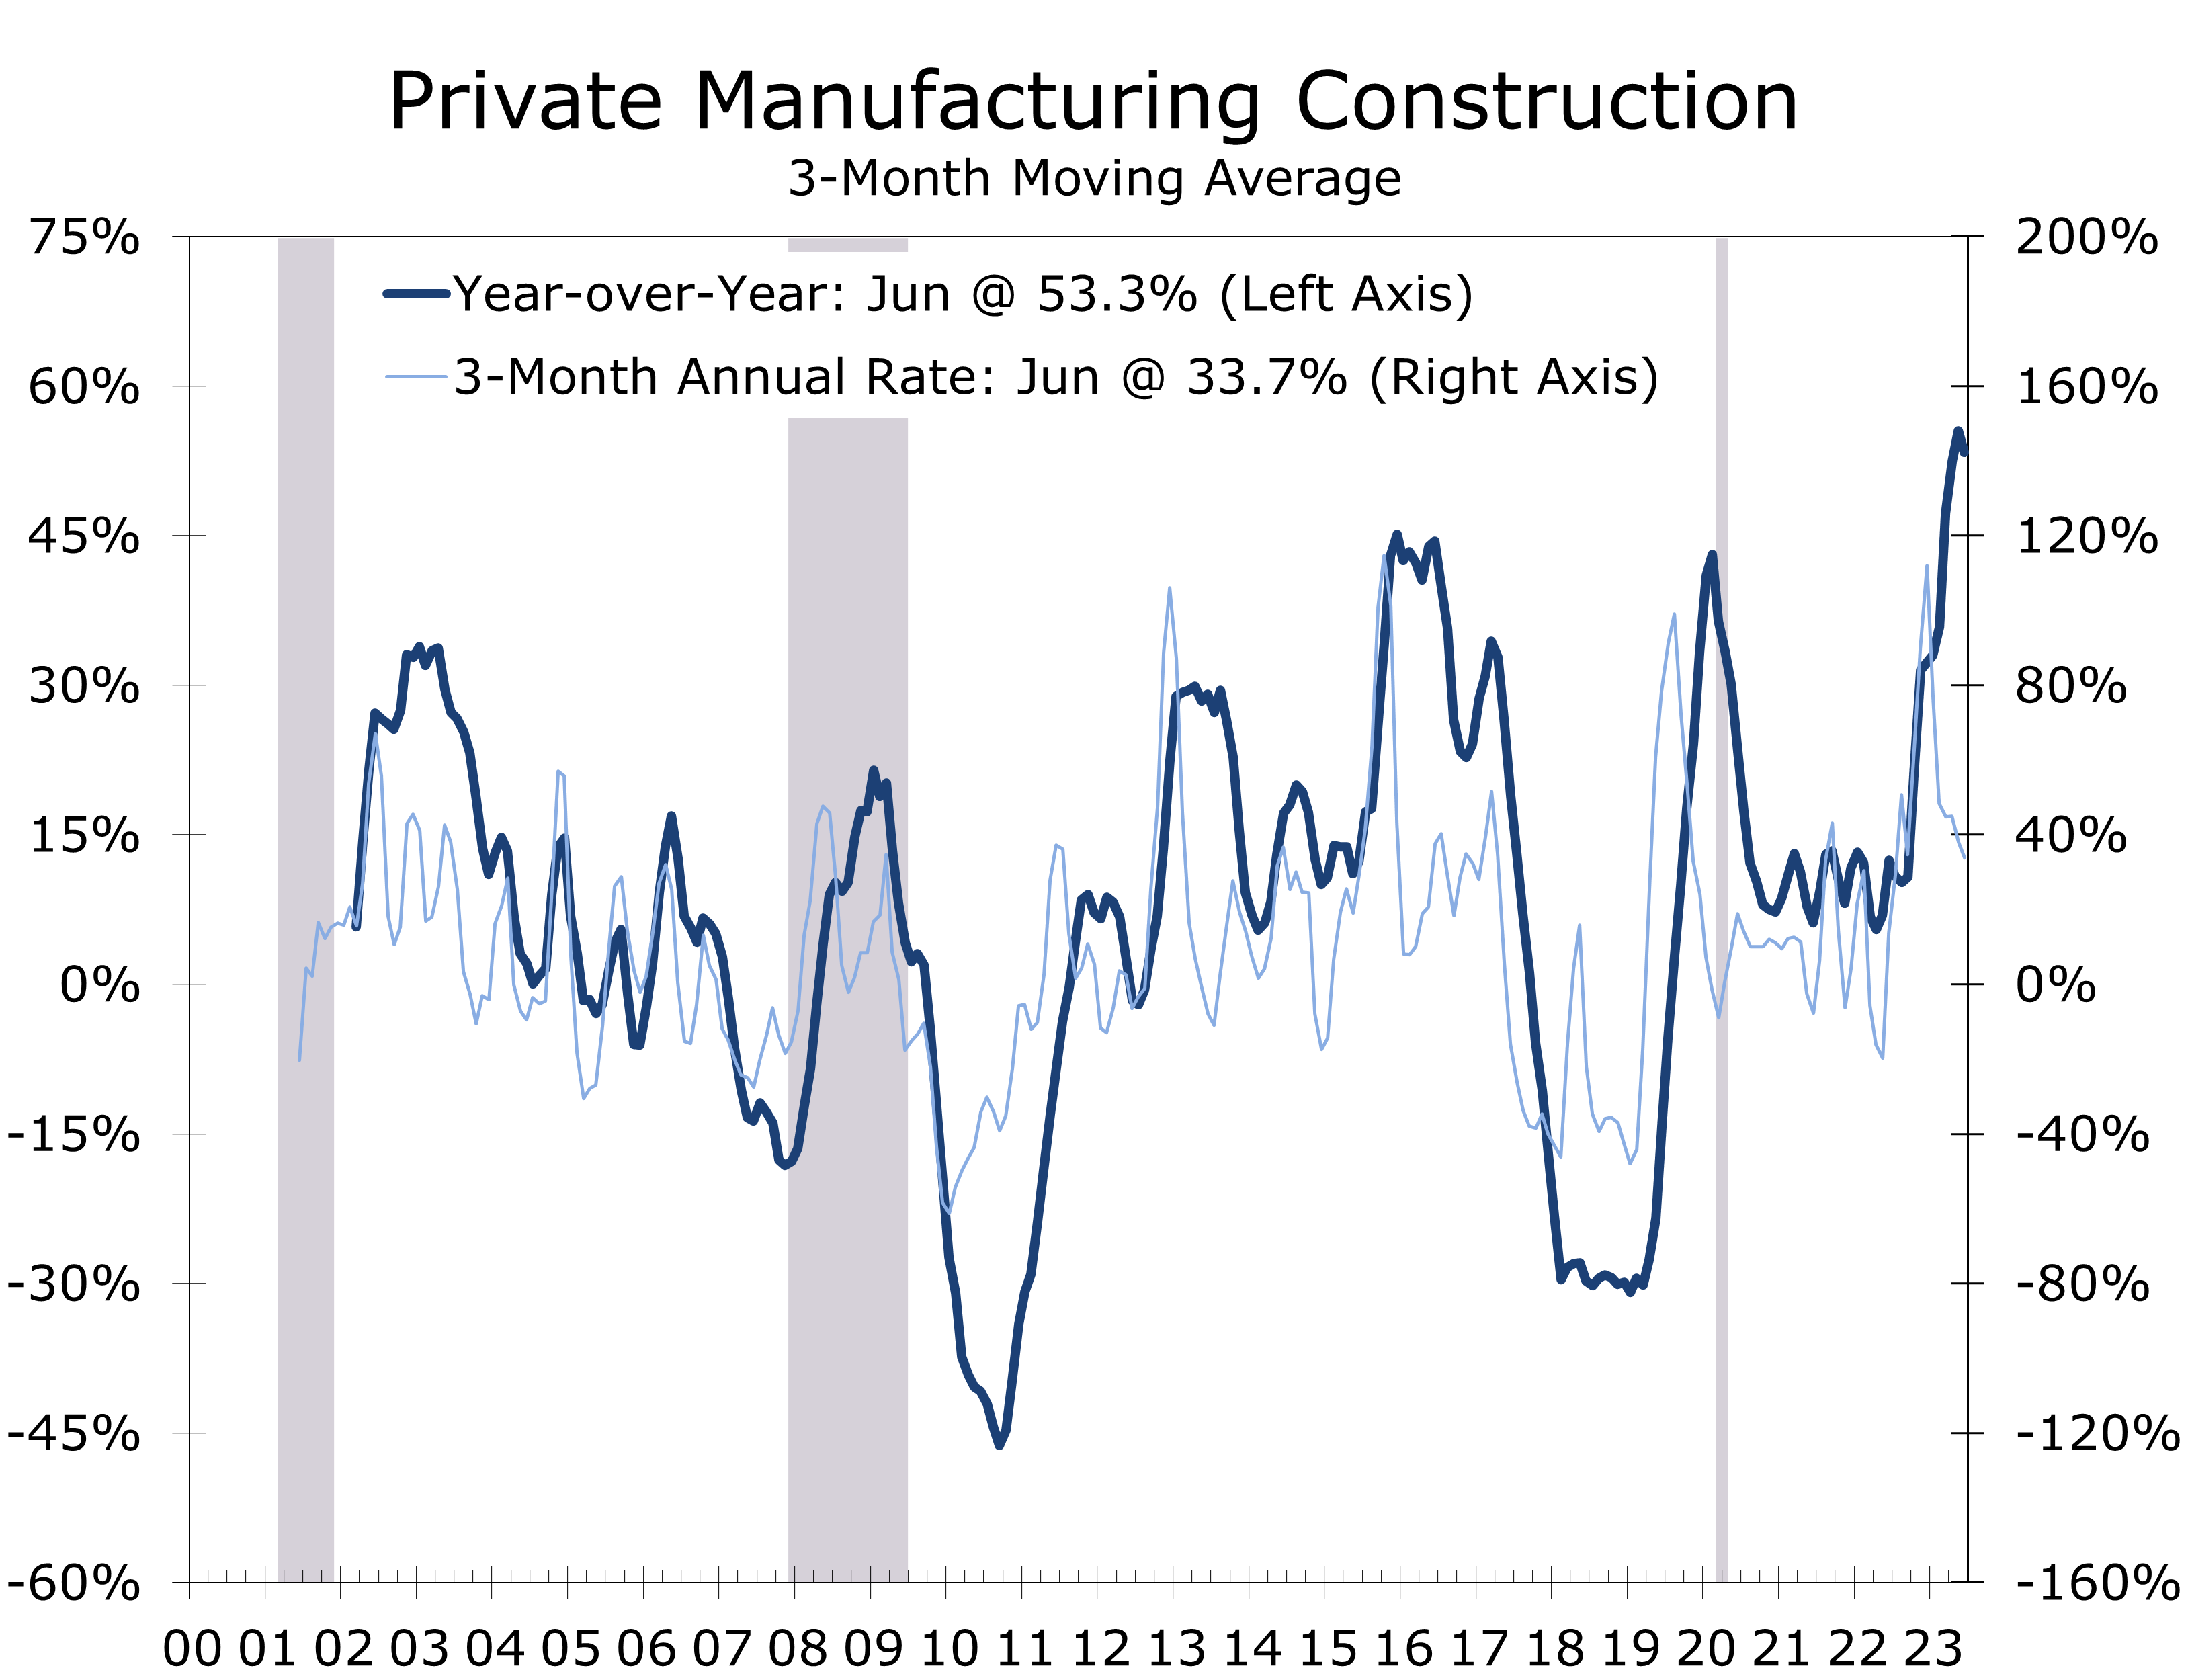
The last major surprise of the first half was the rapid uptake in major fiscal initiatives, particularly the Inflation Reduction Act, which is helping fuel a boom in Electric Vehicle-related infrastructure, such as EV battery plants, EV assembly plants and the production of related parts and charging stations. The CHIPS and Science Act has similarly led to a surge in semiconductor plant construction around the country. When combined with the pre-existing trend of reshoring, manufacturing construction has surged, with the latest data showing construction spending for private manufacturing facilities through the first 6 months of 2023 running a stunning 74.3% ahead of the same period 1 year ago.
We see the momentum giving way during the second half of the year. Customer demand for EVs has been underwhelming, which will likely lead to some slowing in EV investment. Semiconductor plant construction is also likely to moderate a bit, as credit becomes dearer and more costly.
Given the boost from fiscal stimulus it is surprising that interest rates were another area where the economy caught an unexpected break during the first half of the year. While the Federal Reserve hiked rates in line with expectations, Treasury yields were actually a little lower than expected, as the showdown over the debt ceiling meant the Treasury had to stretch their available funds a bit further than usual. The drawdown in the Treasury’s General Account meant there was less Treasury issuance during the first half of the year. The Treasury will now have to rebuild their General Account, which means issuance is set to increase. Moreover, tax revenues have been coming in lower than expected while spending is rising faster than expected. The net result is the Treasury will have to raise close to $2 trillion during the second half of this year, which will likely put some added pressure on long-term rates.
We Are Looking for a Softish Landing
While the odds of a soft landing have clearly increased, we remain more cautious. We believe a remarkably fortuitous run of economic and geopolitical events during the first half of the year have made the prospect of a soft landing appear to be closer than it actually is. Many of the positive surprises, such as the surprising strength in home sales, have largely run their course. Others, such as the short-lived break in long-term interest rates the economy enjoyed in the run-up to debt-ceiling deal, now appear set to reverse as the Treasury refills its coffers. The Fitch downgrade of the U.S. credit rating may mark a turning point, where the economic news turns less positive.
The bulk of the improvement in the inflation data also appears to be behind us. Oil prices have recently rebounded back above $80 a barrel, which will result in higher gasoline and diesel fuel prices. Food prices will also likely prove more problematic given the prolonged drought across much of the U.S. and renewed disruptions to shipments of key products out of Ukraine.
Recessions are ultimately caused by the buildup of imbalances in the economy and there are a few notable ones to keep an eye on. Commercial real estate is the most obvious trouble spot, with uncertainty about the demand for office space leading to a spike in office vacancy rates for class B and class C properties and a substantial drop in property prices. Other areas of commercial real estate are less troubled, but higher interest rates and higher operating costs are weighing on returns and prices.
The problems in Commercial Real Estate are weighing on the banking sector, where Moody’s recently downgraded 10 regional banks and appears poised to downgrade more in coming weeks. The inverted yield curve has made bank lending less profitable at a time when many banks are now having to boost rates on money market accounts and CDs to stem the slide in deposits.
Housing affordability is another imbalance. In addition to the near record share of income needed to service principal and interest payments, property taxes and insurance costs have surged this past year. Prices will eventually have to correct, and our forecast has this correction occurring via slower price appreciation, lower interest rates, and continued moderate income growth.
One of the more glaring imbalances is the nation’s persistent trillion-dollar budget deficits. Debt relative to GDP has approached levels last hit in World War II. Interest on the national debt is increasing rapidly. Deficits are like high cholesterol. Everyone knows they are bad and increase the risk of a traumatic event, but it gets a bit murkier when you try to pinpoint just when such an event will occur. Treasury issuance is set to spike during the second half of this year, which introduces an element of risk into an economy where inflation will likely prove surprisingly persistent, and banks will also likely be scrambling to raise capital.
We are looking for a softish landing for the economy over the next few quarters, with real GDP growing at just a 0.7% annual rate between the middle of this year to the end of 2024. We also see two consecutive quarters of declining real GDP late this year and early next year, which we expect the NBER to declare as a recession.
Interest rates are expected to remain near current levels. We believe the Fed has finished with their rate hikes and that slower economic growth will limit the rise in long-term rates.
Disclaimer: This publication has been prepared for informational purposes only and is not intended as a recommendation offer or solicitation with respect to the purchase or sale of any security or other financial product nor does it constitute investment advice. Any forward looking statements or forecasts are not guaranteed and are subject to change at any time. Information from external sources have not been verified but are generally considered reliable.
© 2023 CAVU Securities, LLC
Questions? Email: CompassReport@cavusecurities.com
Housing Starts Edged Higher in July
Single-Family Starts Rose Solidly in July
- Housing starts rose 3.9% to a 1.452-million-unit pace in July. Sales in June were revised lower, while sales in May were revised slightly higher. On net, starts are roughly 1.3% ahead of where they were initially reported to be for June.
- Permits rose just 0.1% and are running slightly below starts at 1.442 million units.
- Starts rose in every region except the South. Starts jumped 14% in the West, with all the gain coming in single-family homes.
- Housing completions fell 11.8%, with a huge 38.8% plunge in completions of projects with 5 or more units (mostly apartments).
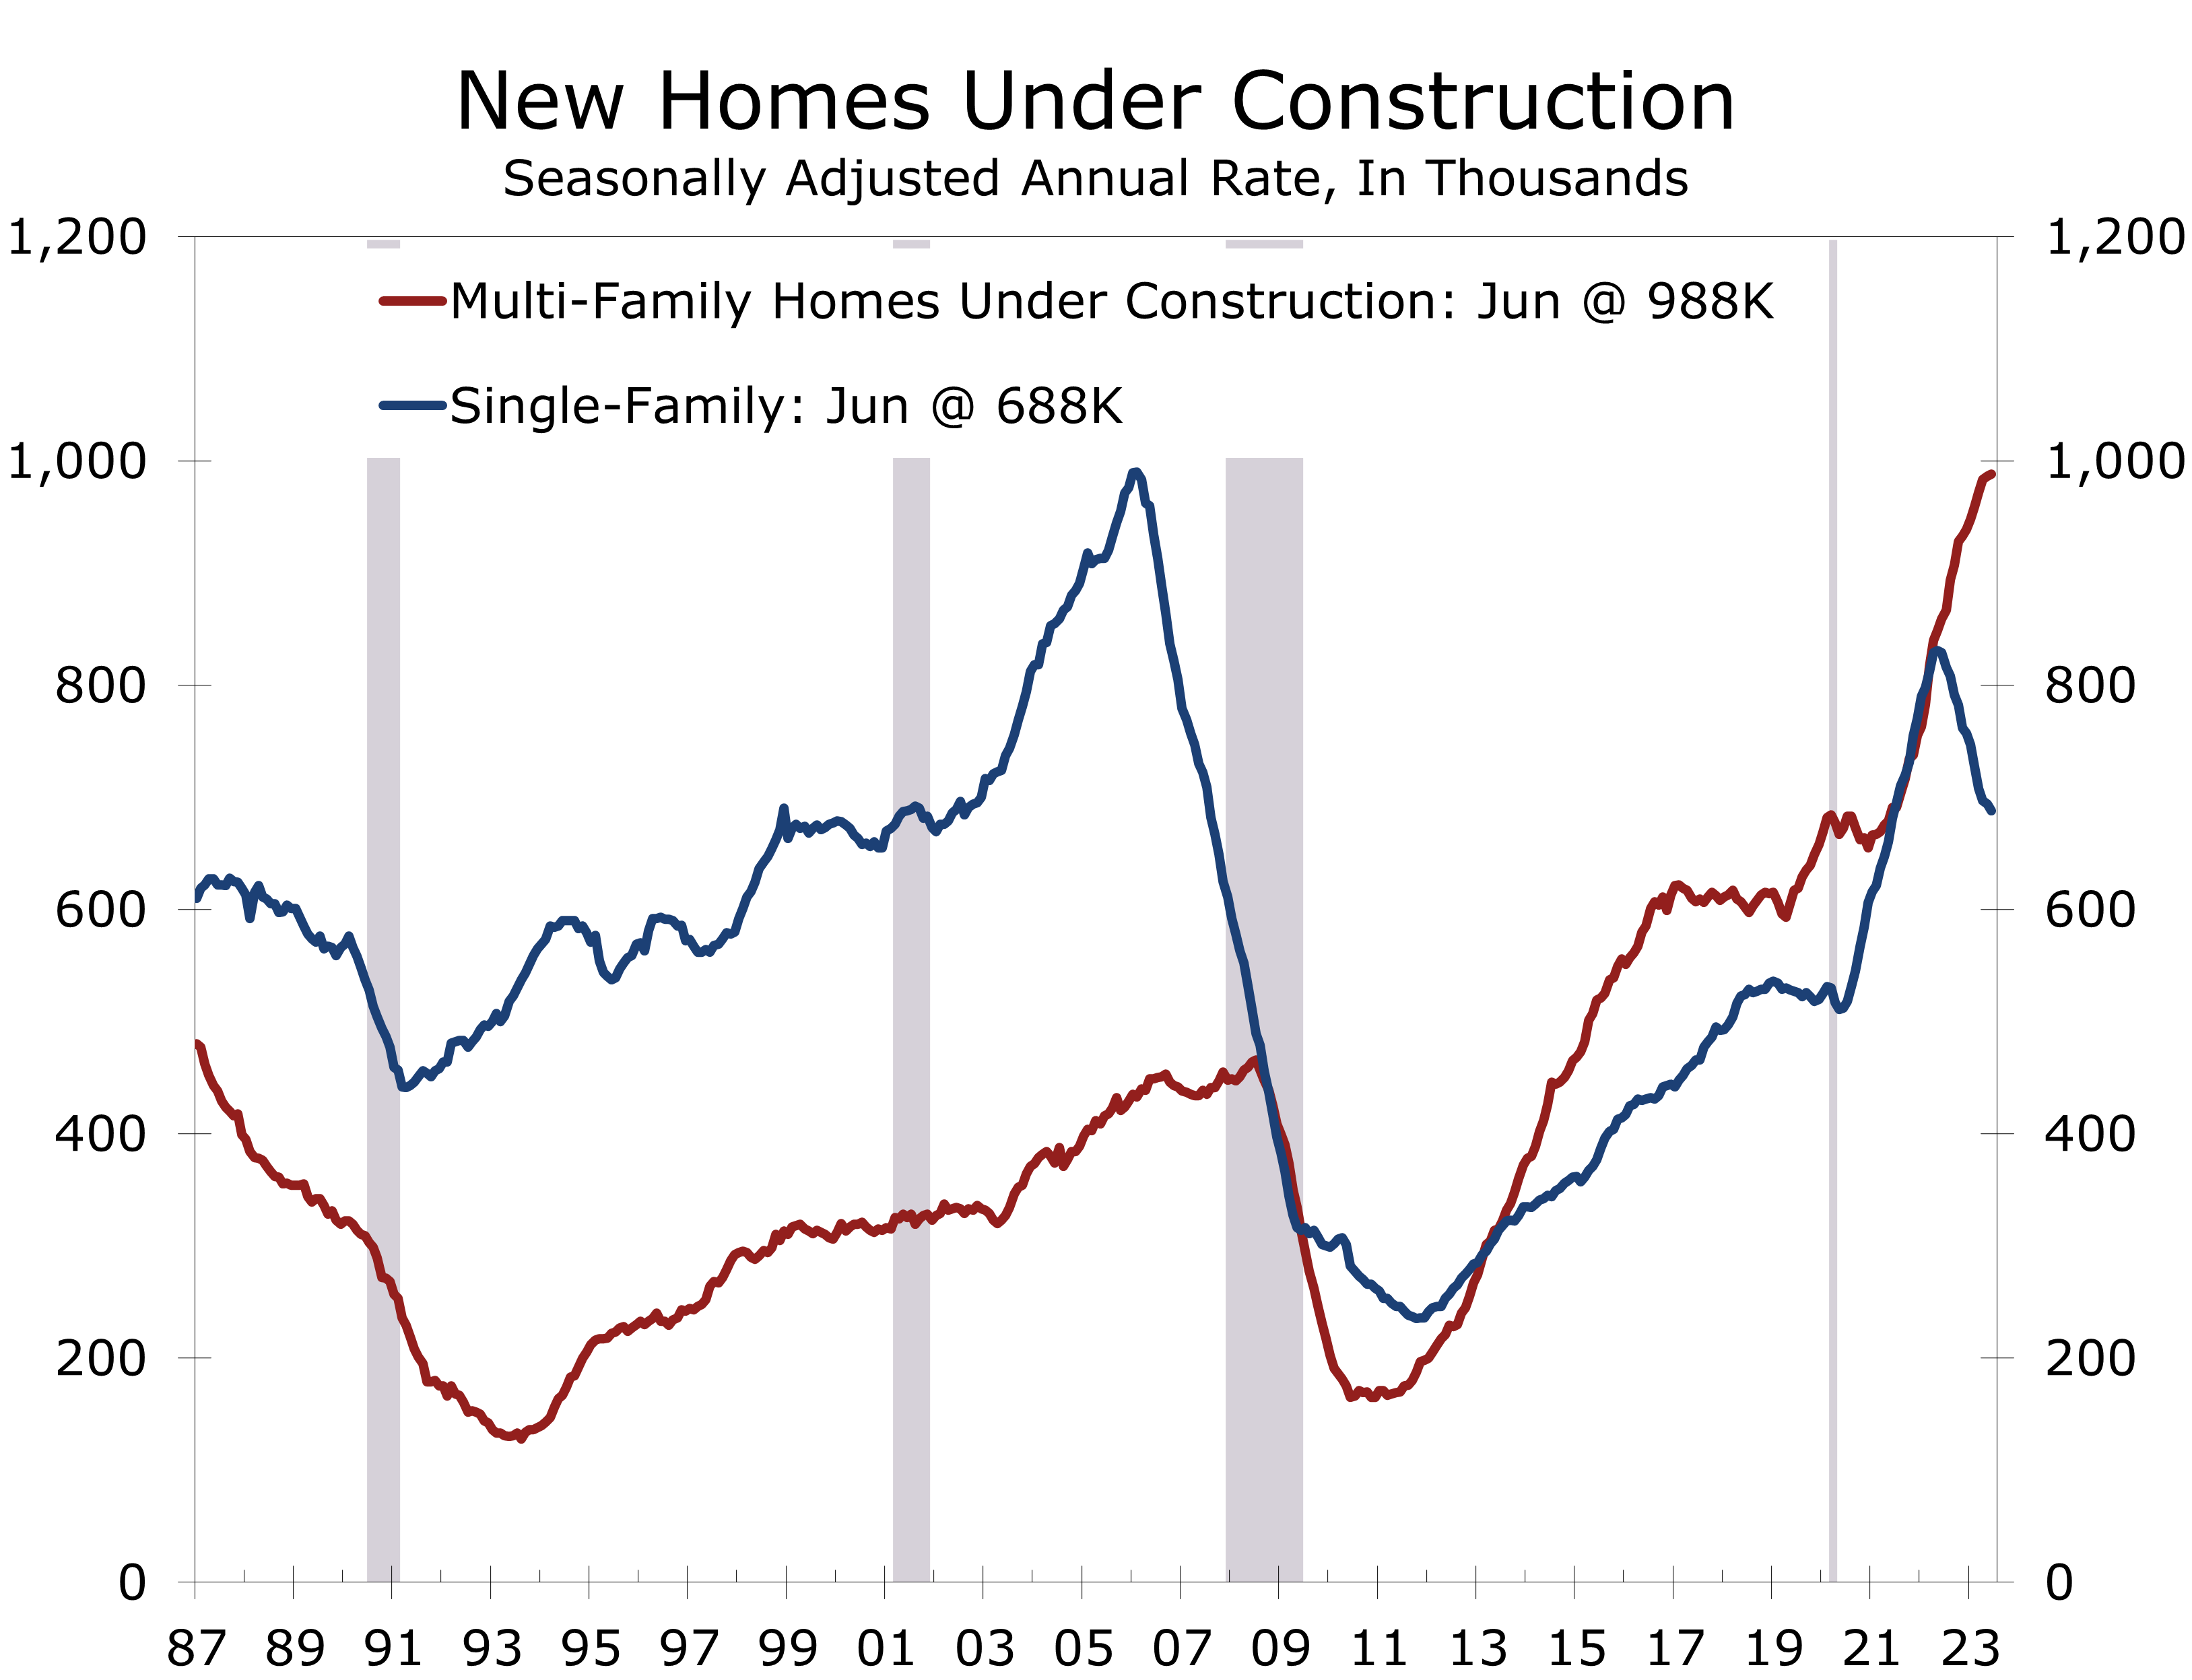
- The backlog of apartment projects increased further, however, while the number of single-family homes under construction continued to edge lower.
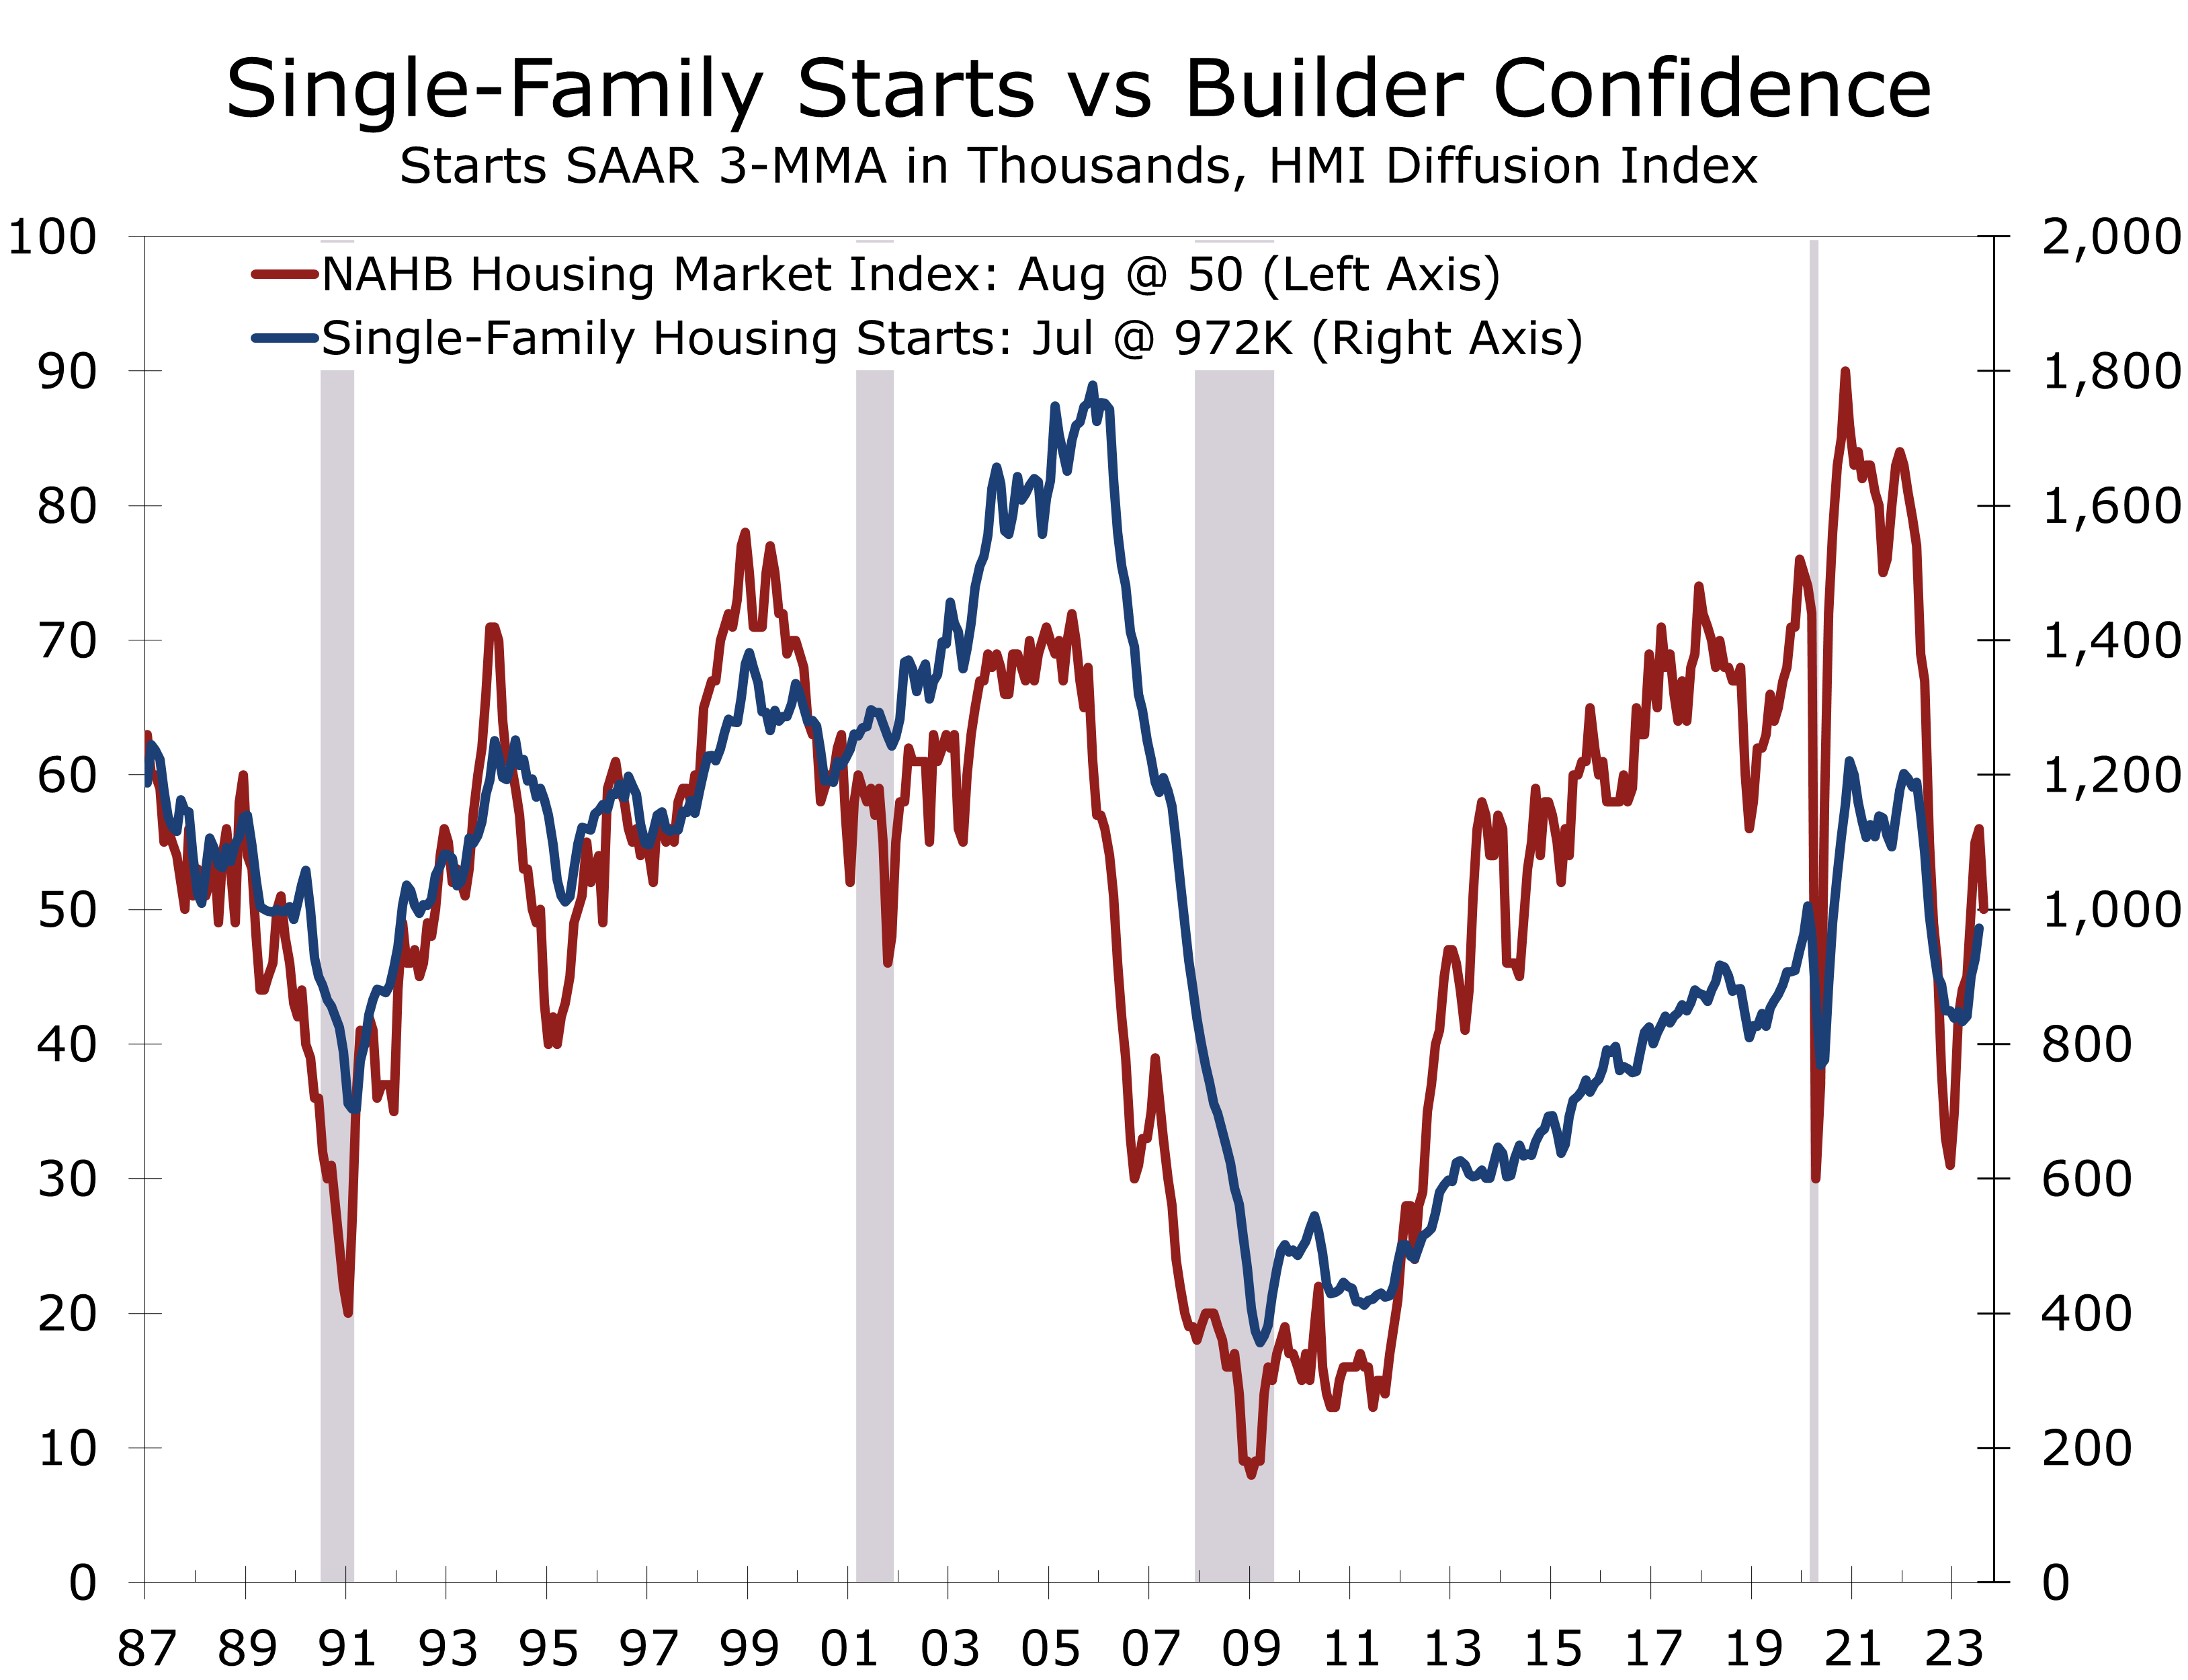
- Homebuilder confidence declined 6 points in August to 50, with both current sales (-5 pts) and expected sales (4 pts) falling decisively.
- Housing appears to be at an inflection point. Rising vacancy rates, weaker rent growth and tightening credit are slowing multifamily starts, while higher interest rates are restraining demand for single-family homes.
Housing starts rose 3.9% to a 1.452-million-unit pace in July, which was close to market expectations. Starts for June were revised down 36,000 units to 1.398-million-unit pace, while starts for May were revised up 24,000 units to 1.583-million unit pace. Overall housing starts were slightly lower than initially thought during the second quarter, which means current quarter starts are on a fairly strong footing.
Residential investment has been a net drag of real GDP for the past 9 quarters. Much of that weakness has come from declines in existing home sales, which have cut into commission income for realtors and home improvement spending. Sales of new single-family homes also weakened late last year but have revived more recently, as the paucity of existing homes for sale has sent more buyers into the new home market.
Housing affordability is currently stretched to historic levels relative to income.
The migration of buyers from the existing home market to the new home market is not a one-for-one tradeoff. Housing affordability is currently stretched to historic levels relative to income. Mortgage rates have also spiked back to levels briefly hit last November, which is prompting more builders to offer incentives.
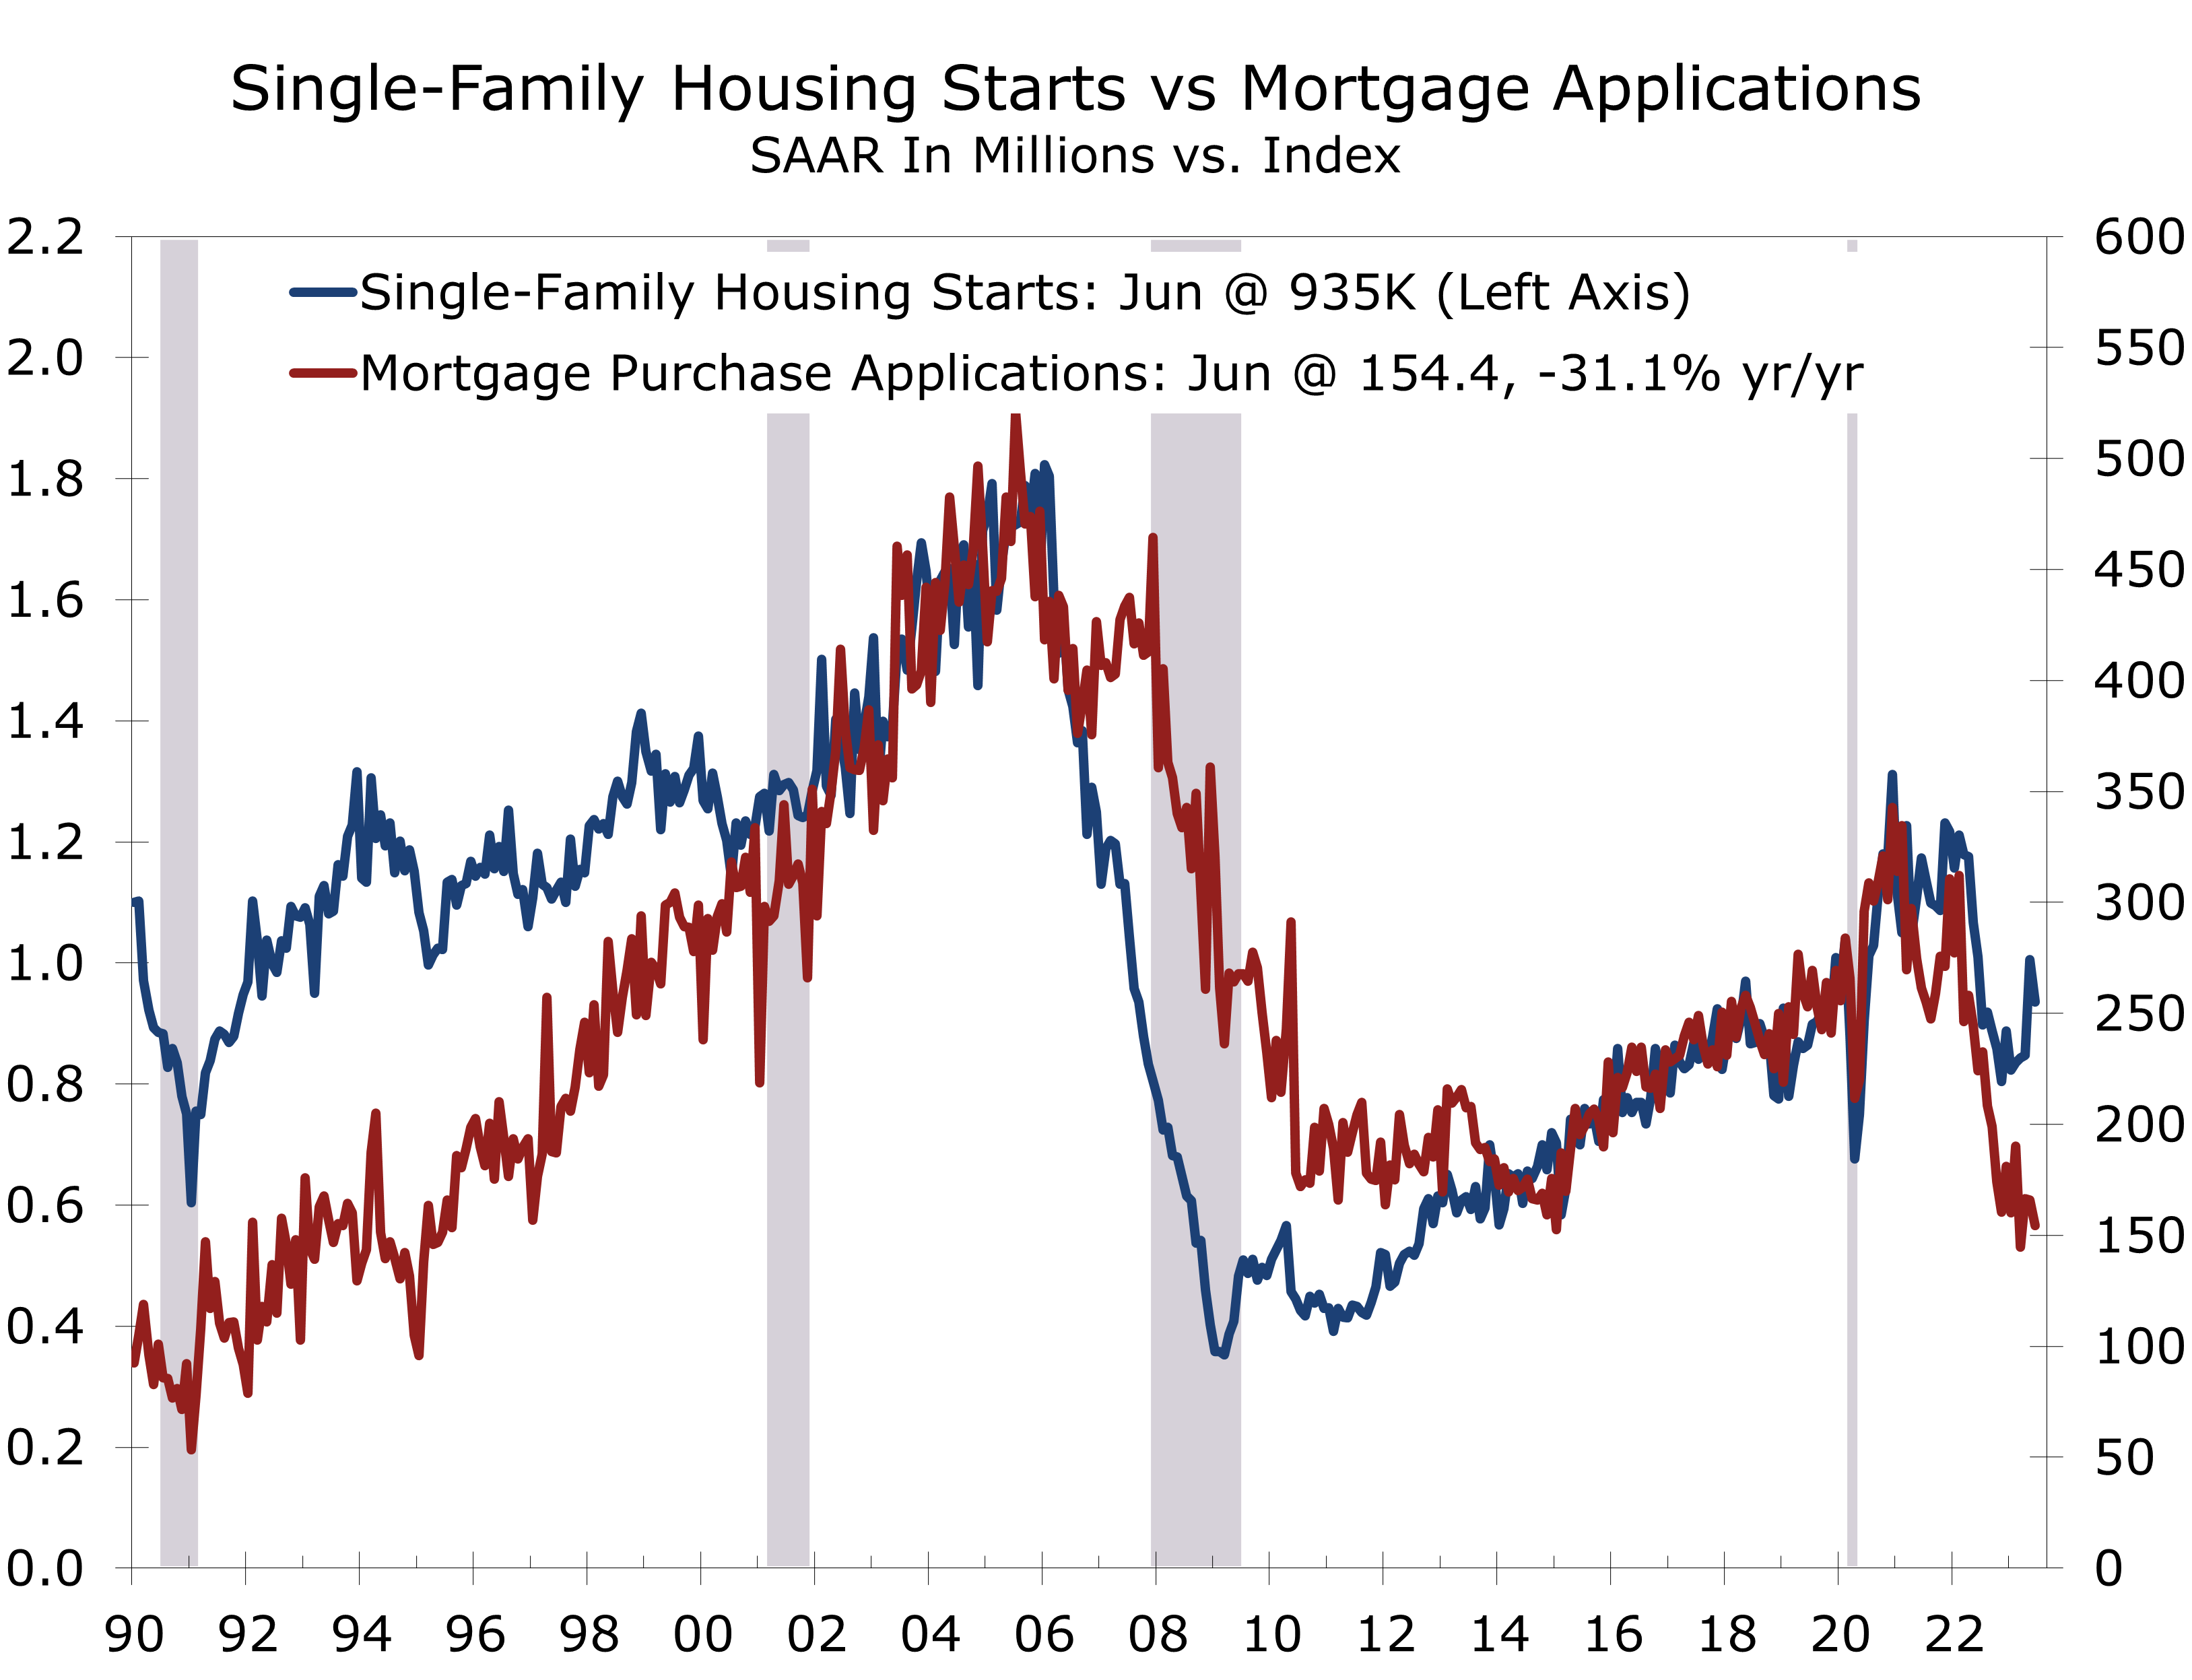
Cash buyers are also helping prop up the single-family market. Many buyers relocating from the Northeast and West Coast to the South and Midwest are able to pay cash for homes, which is one reason single-family starts have diverged from mortgage applications.
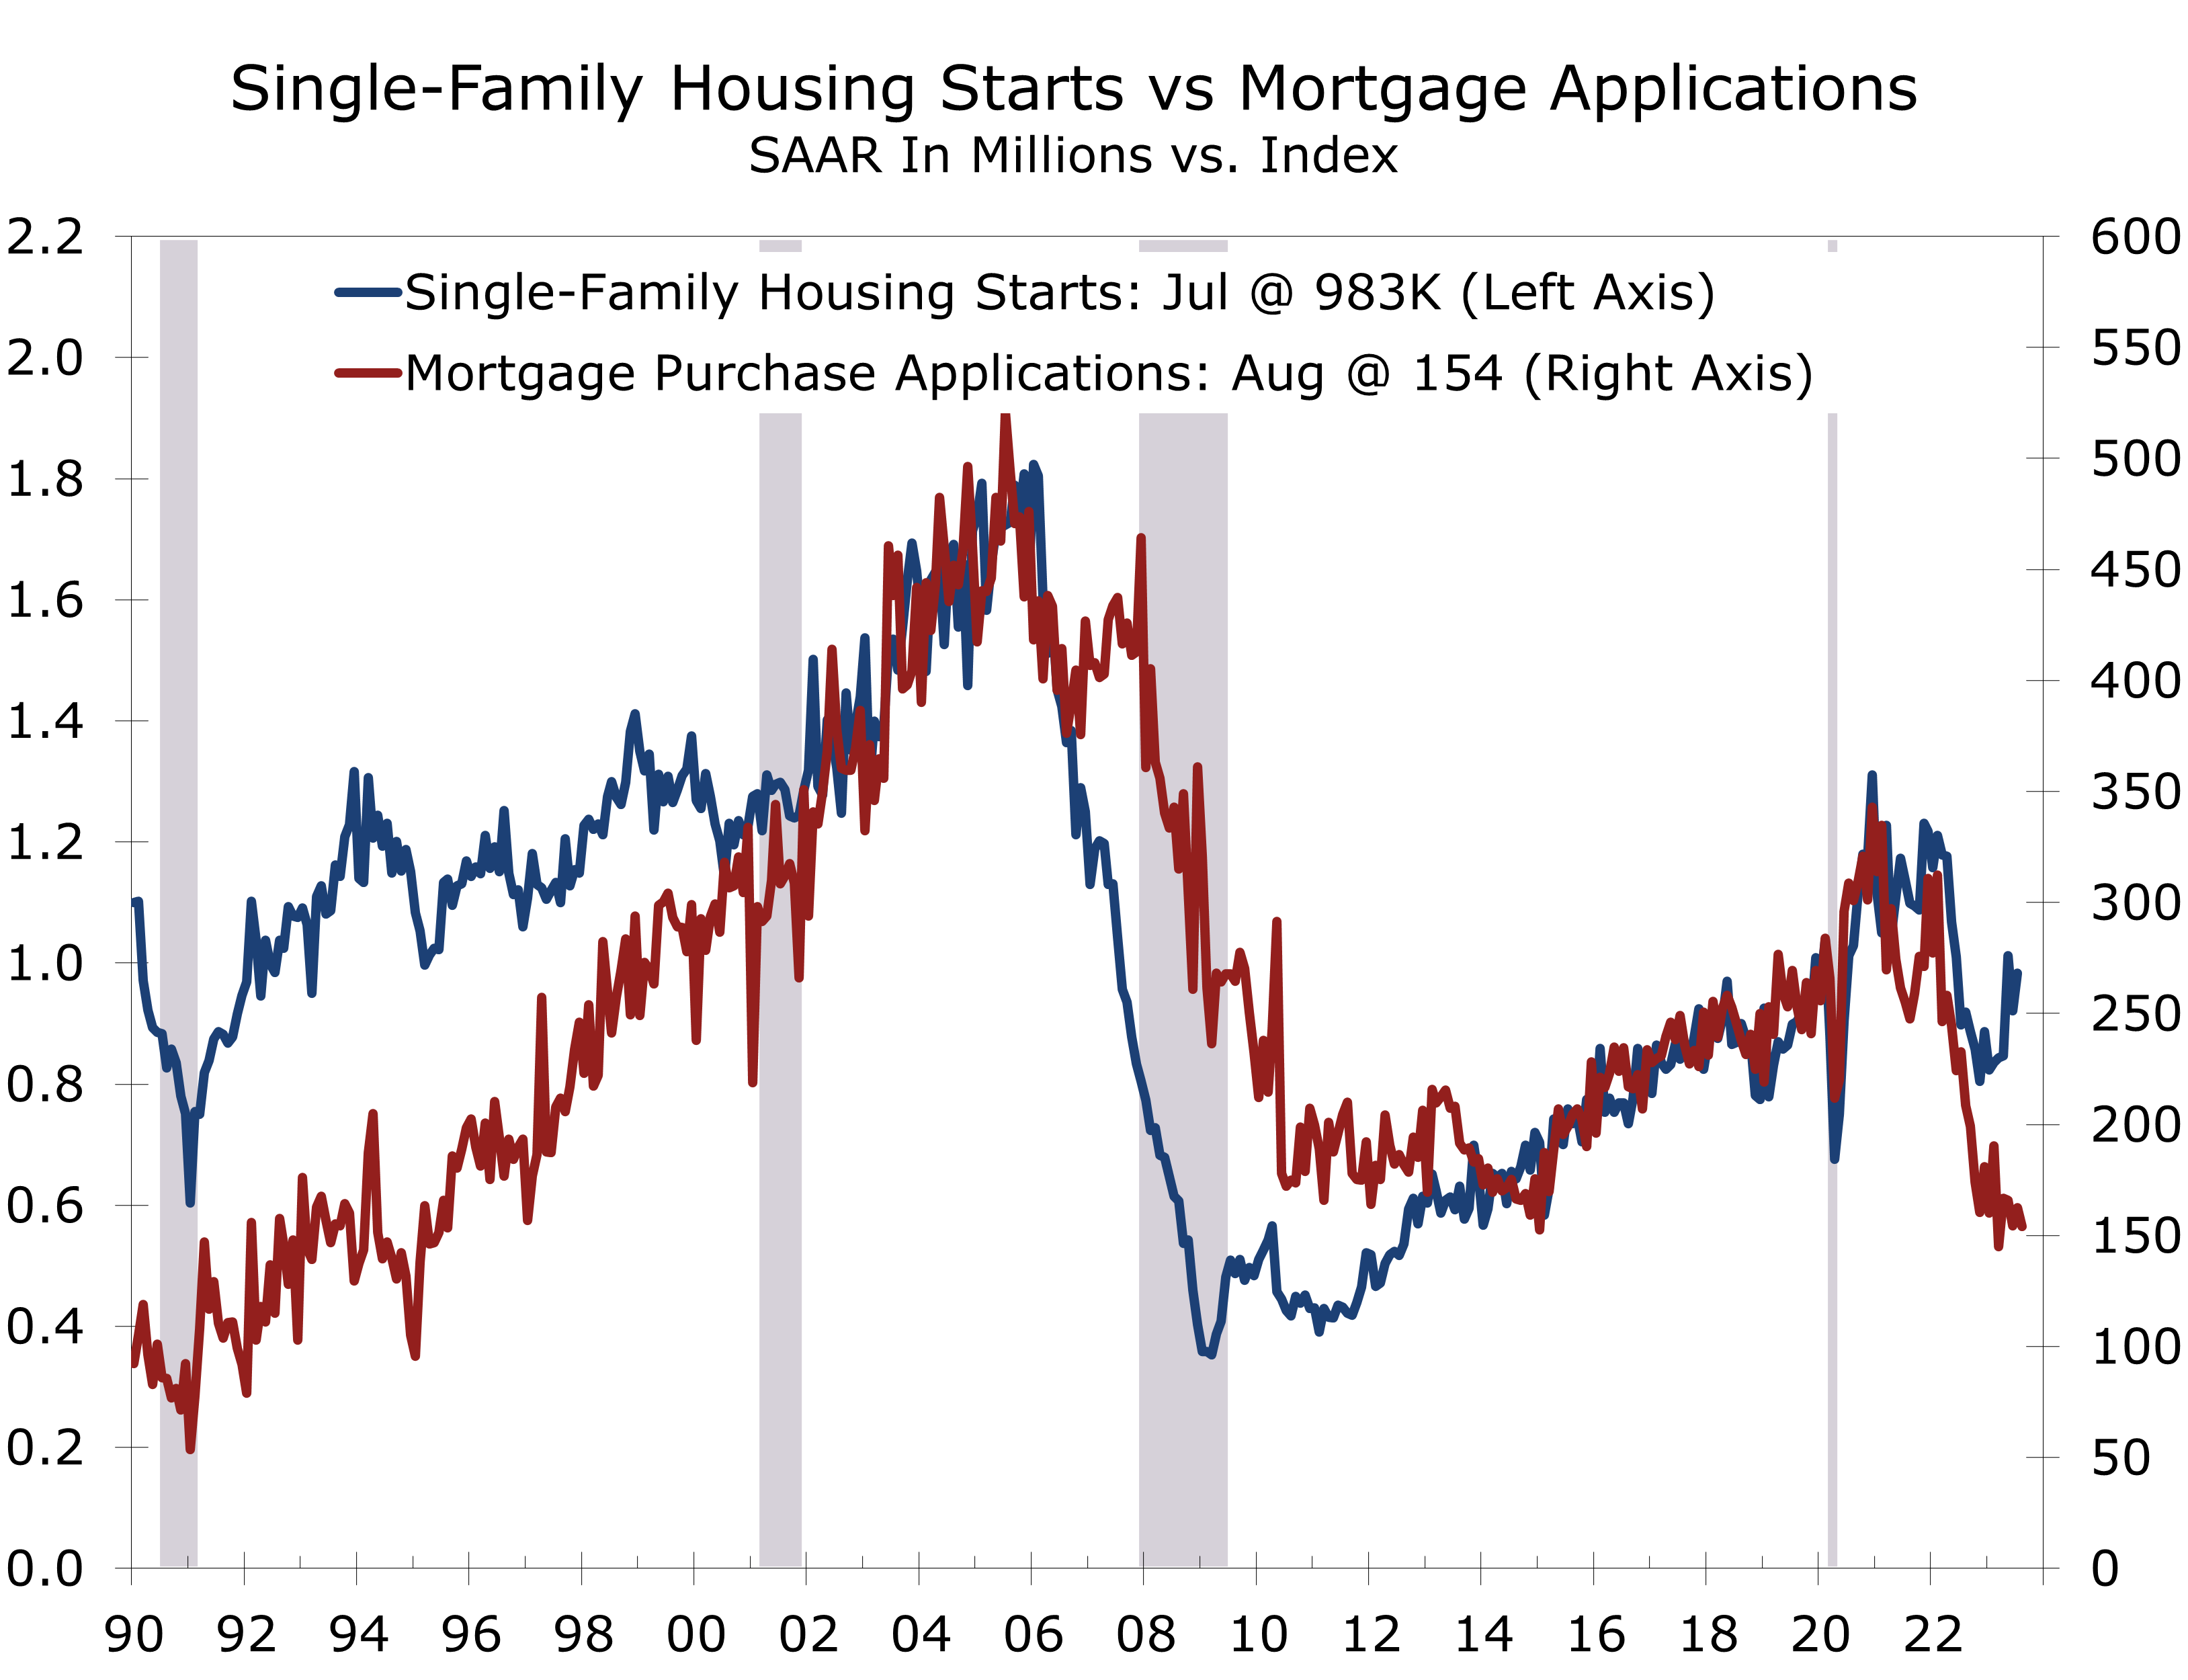
Single-family starts rose 6.7% in July to a 983,000-unit pace. The West accounted for the bulk of the increase in single-family starts, with starts jumping 26.5% to a 257,000-unit pace. Single-family starts also rose in the Midwest (+12.5%) but fell in the North (-3.4%) and the South (-1.3%), which is by far the largest region for single-family construction.
The large increase in the West looks suspect and will likely be reversed in the coming months. Single-family permits are less volatile than starts and rose just 0.6% in July. The South and Midwest both posted modest gains, while single-family permits fell 10.5% in the Northeast and were unchanged in the West.
Cash buyers can only support the housing market for a short time. Most home buyers finance their purchase and with mortgage rates currently near 7.25%, we suspect the housing market has reached a key pivot point. The inverted yield curve means there is relatively little savings from choosing an adjustable rate mortgage and underwriting remains still tight.
We look for single-family starts to decline modestly during the second half of this year. The earlier pullback in home sales and single-family starts, however, means most of the correction in the single-family market has already occurred. We see starts falling around 5% from their second quarter average by yearend.
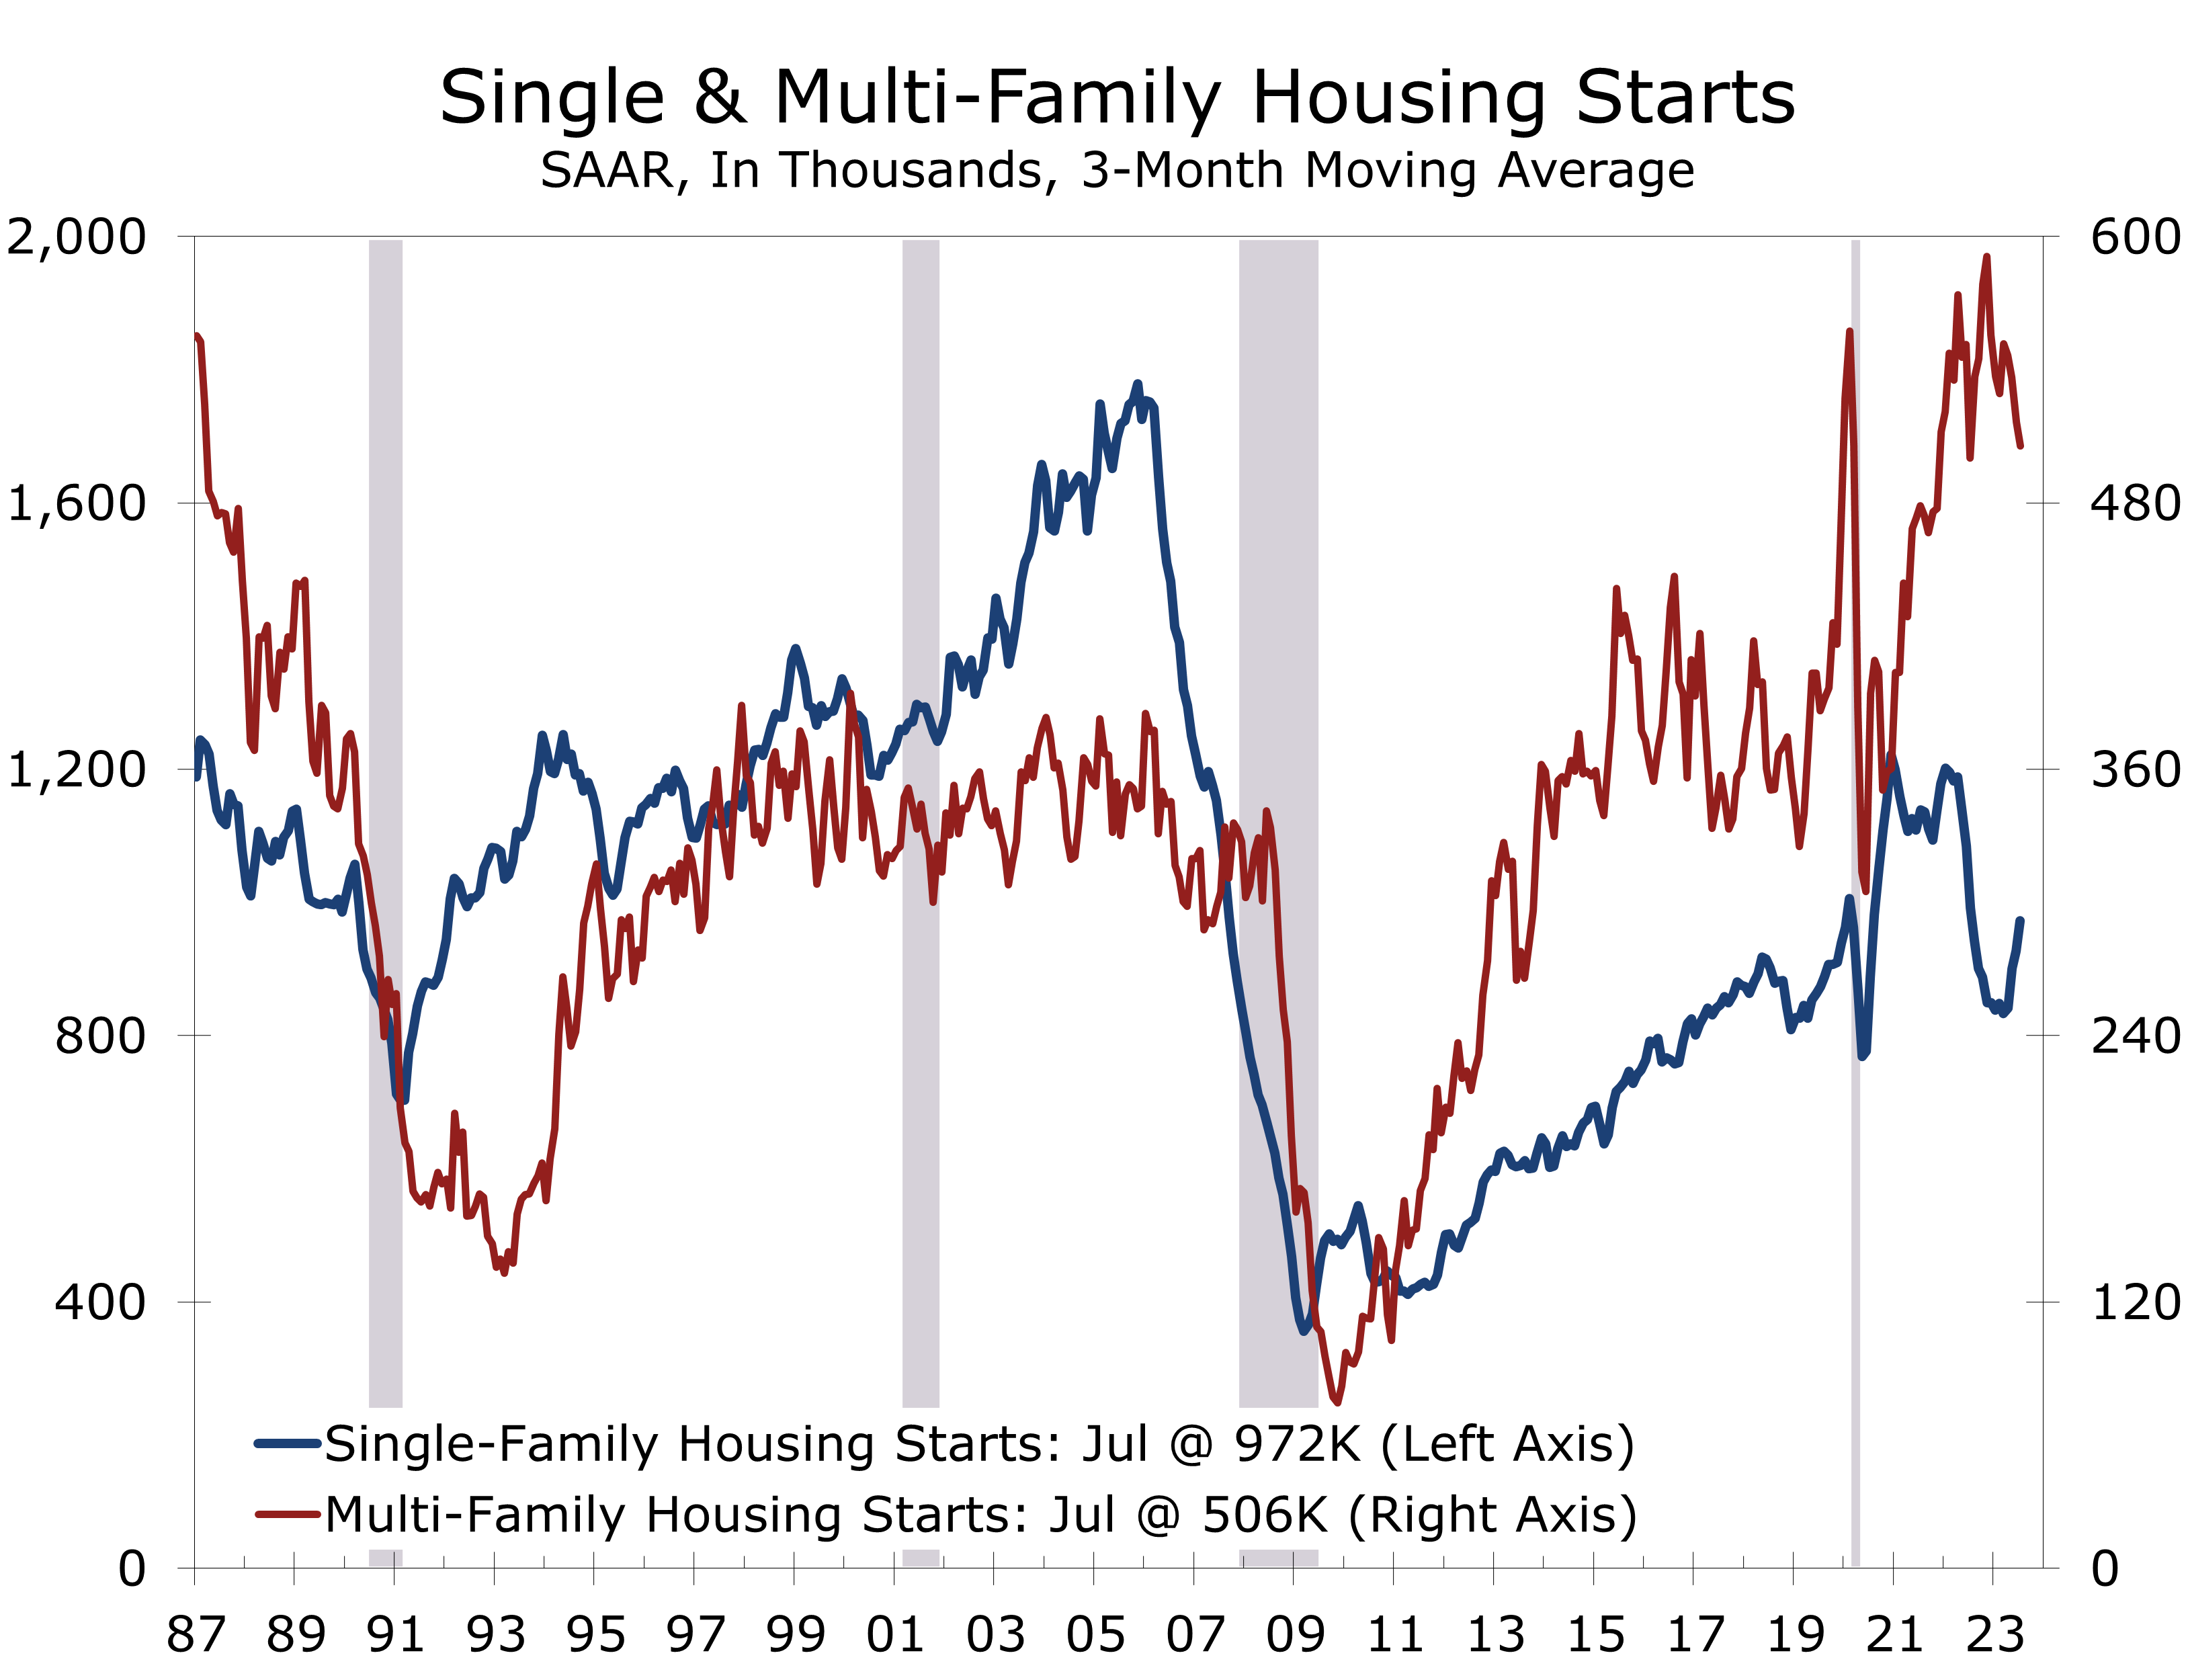
The correction in multi-family construction is only beginning. Multi-family starts fell 1.7% in July to a 469,000-unit pace, after tumbling 16.5% the prior month. Multi-family starts are currently at their lowest level since September 2021. Permits fell slightly less, however, and are still running well ahead of starts.
The hurdles for financing new apartment projects have risen substantially.
The hurdles for financing new apartment projects have risen substantially, as is evident in recent surveys from the National Multifamily Housing Council. With nearly 1 million apartments under construction, there is a wave of supply set to come to market as vacancy rates are rising and student loan repayments begin to cut into disposable income. Multi-family starts will likely decline 11% from their Q2 pace by yearend.
The NAHB/Wells Fargo Housing Market Index fell 6 points in August to 50. Builders are increasingly having to offer discounts to counter the impact of rising rates. The drop ends a string of 7 consecutive increases and brings the HMI back in line with single-family starts. Builders will continue to focus on reducing their still high work-in-process inventory.
Disclaimer: This publication has been prepared for informational purposes only and is not intended as a recommendation offer or solicitation with respect to the purchase or sale of any security or other financial product nor does it constitute investment advice.
Retail Sales Rise Solidly in July
Retail Sales Get Q3 Off to a Strong Start
- Overall retail sales rose 0.7% in July, with spending up solidly in most key categories.
- Core retail sales - a key input into the GDP calculation - rose 1.0% in July and gains for the prior 2 months were revised higher.
- Retail sales were bolstered by Amazon Prime Day. Non-store retail sales surged 1.9% during July and are up 10.3% over the past year.
- Brick and mortar stores also did well. Sales at sporting goods stores rose 1.5%, while sales at clothing shops rose 1.0% and sales at department stores rose 0.9%.
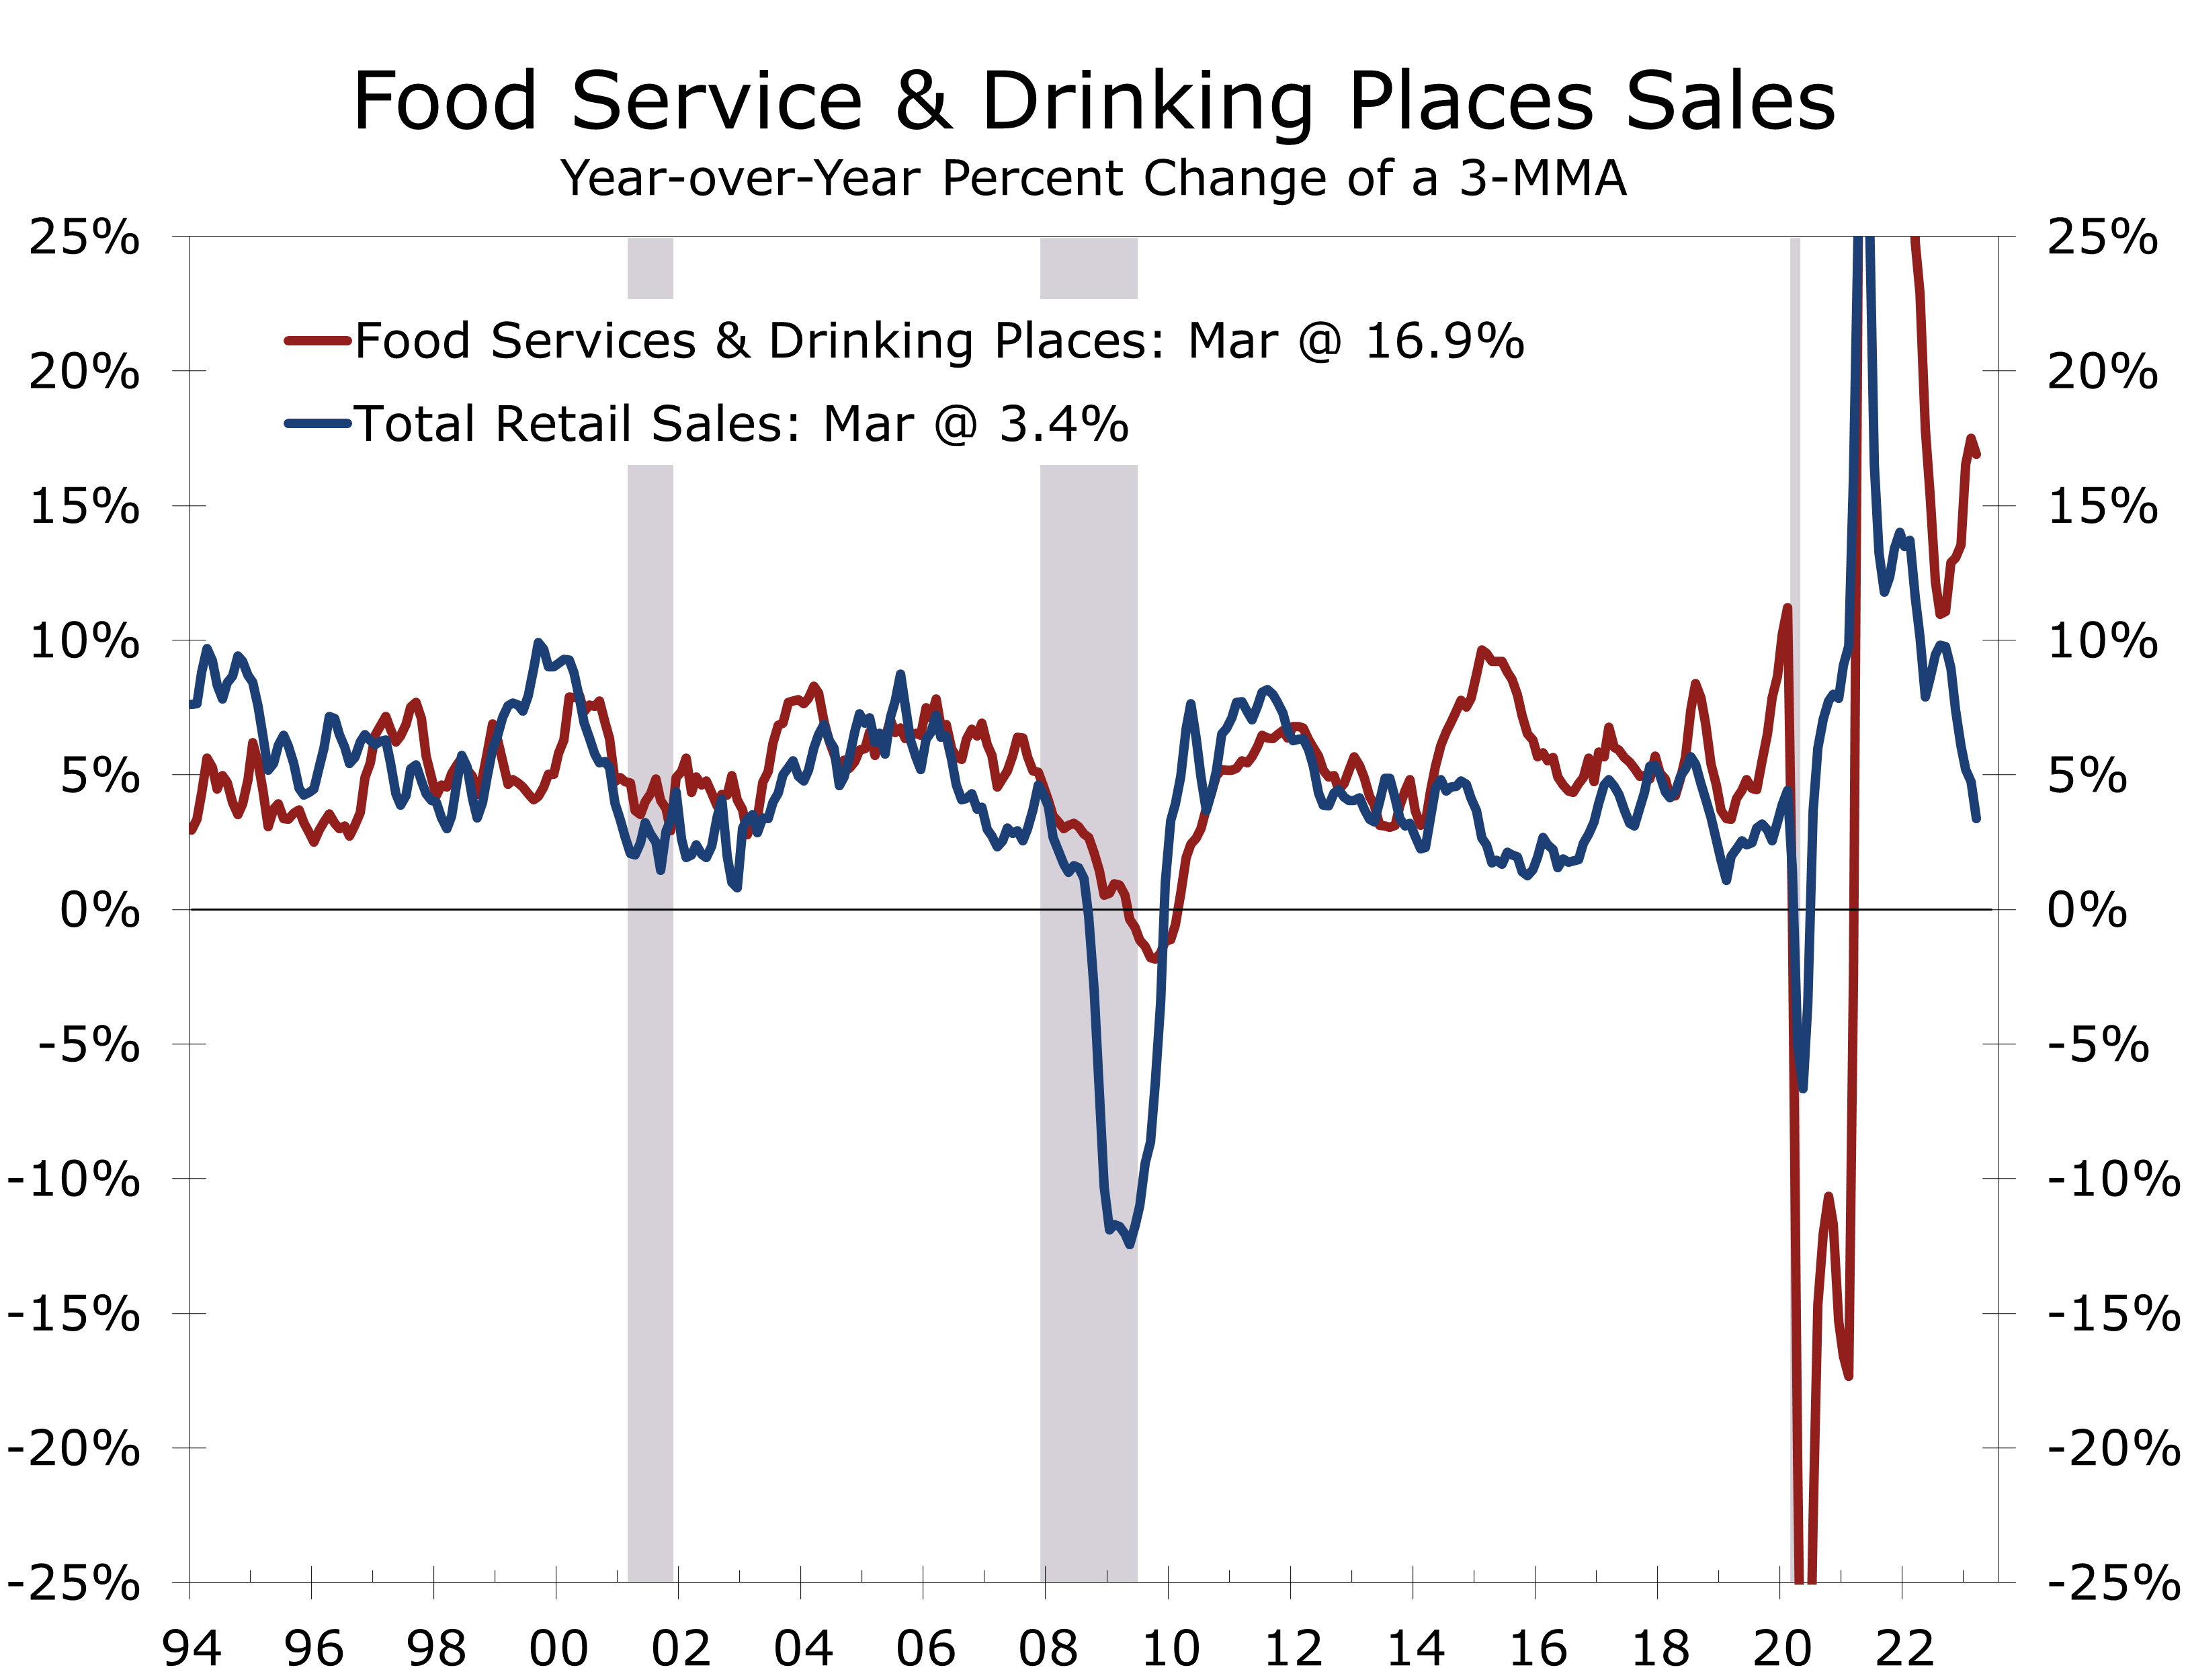
- Restaurants and bars had another blowout month, with sales surging 1.4% in July and 11.9% over the past year.
- Furniture and electronics store sales were notable weak spots, falling 1.8% and 1.3% in July, respectively.
- The robust gains at the start of the quarter and upward revisions to the May and June data enhance the prospects for Q3 growth. Real GDP now looks like it well rise at around a 2.5% in current quarter.
Retail sales showed surprising strength in July. Overall sales rose 0.7% and core retail sales jumped 1.0%. July is a shoulder month, with retailers typically marking down summer items ahead of the back-to-school season. Amazon Prime Day and competing promotions at brick-and-mortar retailers may have pulled some sales forward from August.
Retail sales are notoriously volatile and subject to a wide variety of short-term distortions that can be magnified by seasonal adjustment. That is one of the reasons why economists tend to look at sales excluding motor vehicles and gasoline. While motor vehicle sales have been strong in recent months, gasoline sales have been a drag on overall sales, as falling gasoline prices have depressed reported sales at gasoline stations.
Sales at motor vehicle dealers, parts stores and repair shops fell 0.3% in July but have been exceptionally strong of late. Sales actually breached their all-time high hit just after the economy reopened back in April 2021 in June. Part of the recent strength likely reflects some catch up at repair shops and body shops, which have built up enormous backlogs due to parts shortages, which are abating.
Sales at building materials stores rose 0.7% in July. Sales at home improvement centers have been struggling this past year, falling 3.3% over the past year. Part of that drop is due to the continuing weakness in existing home sales, which usually prompt several trips to home improvement stores by both the seller and buyer. Consumers also appear to be more interested in spending more of their free time traveling or going out rather than fixing up their homes.
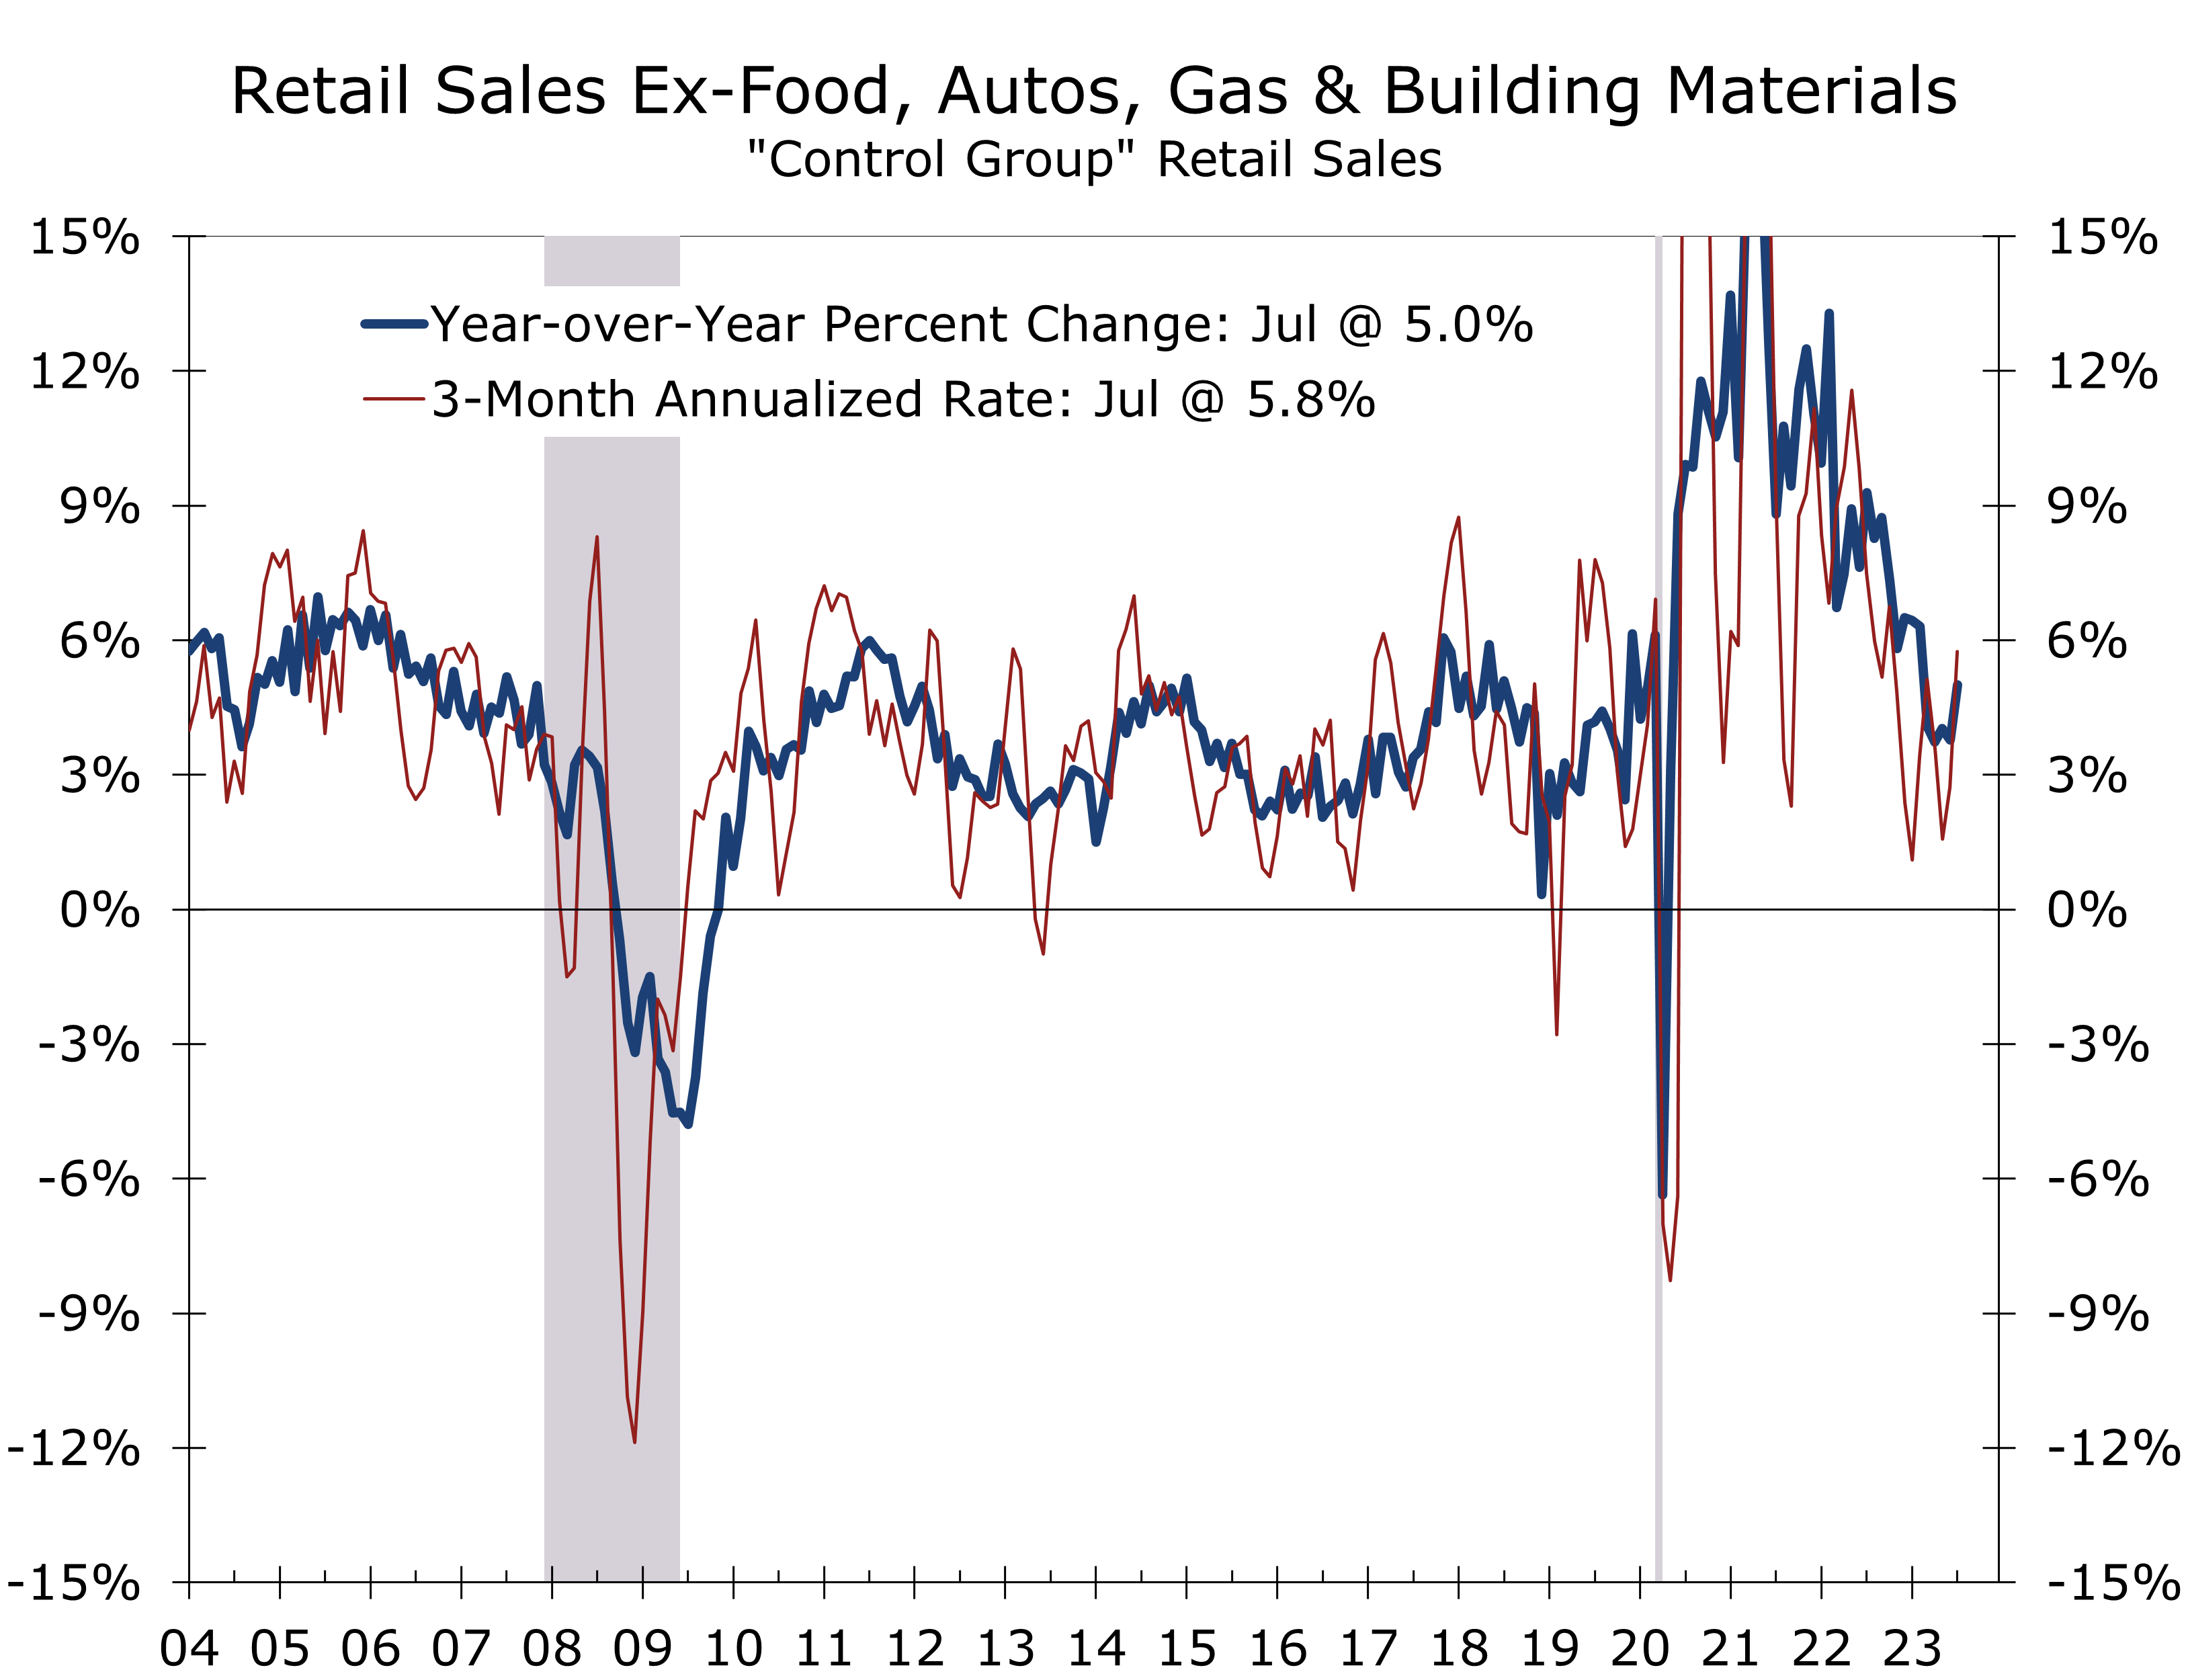
Core retail sales, or retail states excluding motor vehicles, gasoline stations, food and building material stores, are a key input in calculating consumer spending on goods in the quarterly GDP data. The most recent data show core, or ‘control group’, retail sales climbing at a 5.8% pace over the past three months. The recent moderation in the CPI suggests much of the recent rise in core retail sales will flow through to Q3 growth. We had been expecting real GDP to rise at a 1.1% annual rate, growth now looks to be close to a 2.5% pace.
With inflation moderating, much of the rise in core retail sales will flow though to Q3 growth.
Sales rose across nearly every key category in July. Spending at sporting goods stores rose 1.5%, while spending at clothing stores rose 1.0% and sales at department stores rose 0.8%. We suspect that some of this strength reflects promotions by brick-and-mortar retailers to compete with Amazon Prime Day.
Sales at grocery stores and gasoline stations rose 0.8% and 0.4% respectively. Higher prices are likely responsible for much of those gains, however. Gasoline prices had plummeted for much of the past year, which has pulled sales at gasoline stations down 20.8% over the past year. Gasoline prices have rebounded more recently, which will cut discretionary spending in August and September.
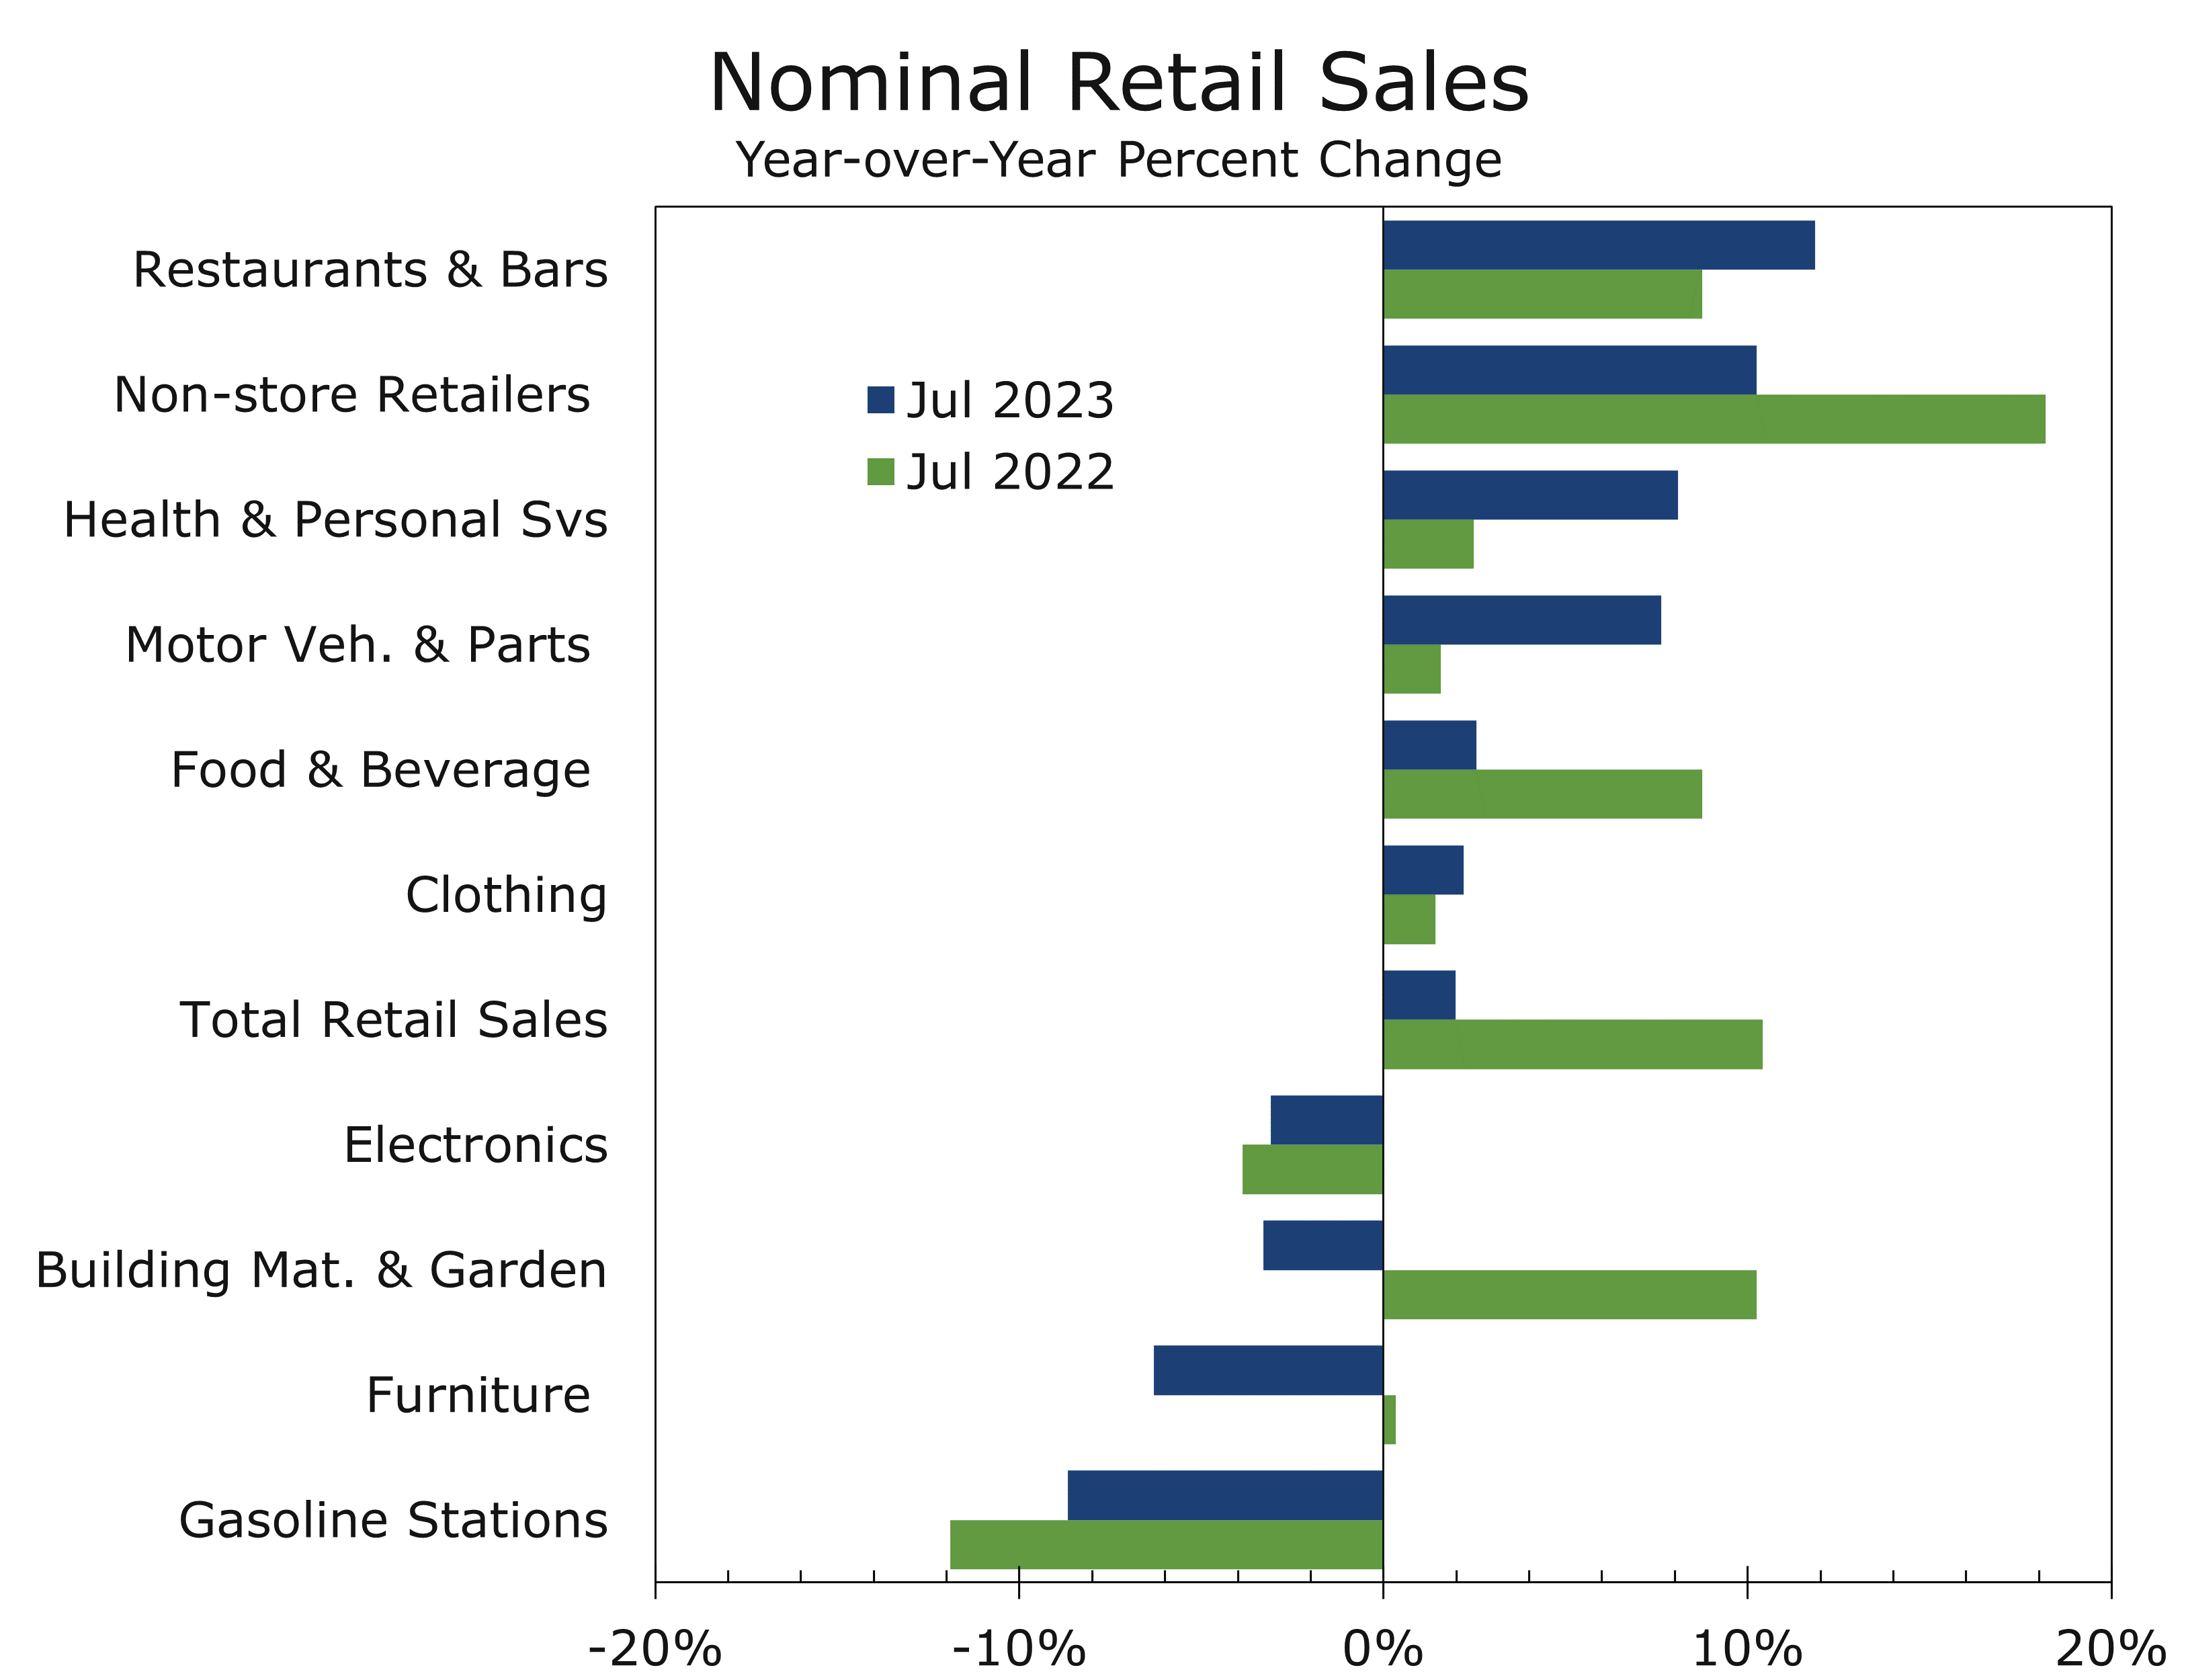
Consumers have been cutting back on some larger discretionary purchases for some time. Spending at furniture stores fell 1.8% in July and are down 6.3% over the past year. The persistent weakness in furniture sales reflects some payback from the pandemic when consumers purchased furniture to accommodate remote work and remote learning. The weakness in furniture sales is falling back on manufacturers, leading to plant closures and bankruptcies.
The payback from the pandemic is also likely weighing on sales at electronics stores. Sales fell 1.3% in July and have fallen 3.1% over the past year.
Another reason consumers are spending less on furniture and electronics is they spending more time away from home. Spending at restaurants surged 1.4% in July and is up a whopping 11.9% over the past year. While higher prices account for part of that rise, much of it is increased volume.
July’s stronger retail sales report has brought back talk of a ‘no landing’ scenario, which sent Treasury yields higher on concerns the Fed has more work to do. We suspect the strength in Q3 consumer spending will likely prove to be frontloaded and look for some payback in August and September.
Disclaimer: This publication has been prepared for informational purposes only and is not intended as a recommendation offer or solicitation with respect to the purchase or sale of any security or other financial product nor does it constitute investment advice.
Existing Home Sales Fell 3.3% in June
Higher Interest Rates Sideline Buyers and Sellers
- Existing home sales fell 3.3% in June to a 4.16 million-unit pace. Sales are down 18.9% from last June and have fallen on a year-to-year basis for the past 23 months.
- Inventories of existing homes remain exceptionally lean at just 1.08 million units, which translates into a 3.1-month supply.
- The median price of an existing home rose 3.6% NSA to $410,200 from May, the second highest price on record. The record high is $413,800, which was hit last June.
- Homes are selling quickly, with homes remaining on the market for just 18 days in June, which was the same as in May.
- Sales fell 5.4% in the South and 5.1% in the West but were unchanged in the Midwest and rose 2% in the Northeast.
- Existing home sales continue to be limited by exceptionally low inventories and reduced affordability. With supplies so tight, prices are being bid higher, which is pricing out first time buyers and also sending more would-be buyers into the new home market.
Existing home sales fell 3.3% in June to a 4.16-million-unit annual pace. Sales continue to be limited by exceptionally low inventories of homes for sale and diminished affordability. There were just 1.08 million existing homes for sale at the end of June, which was the same as the prior month, but 13.6% less than it was a year ago.
Lean inventories have led to intense competition among buyers, which has pulled prices higher. The median price of an existing home rose 3.6% in June on a non-seasonally adjusted basis, to $410,200, which is the second highest level on record. The highest was hit last June at $413,800. Home prices had generally fallen from the middle of last year until early this year. Prices have been rising since February and have nearly regained their previous highs.
Higher prices combined with higher mortgage rates have further eroded housing affordability. The proportion of median household income needed to make principal and interest payments on a median priced home rose to 26.7% in May, which is the second highest share on record. That number is likely to rise even further, as mortgage rates rose further in June and have remained higher.
Existing home sales are being restrained lean inventories and reduced affordability.
Existing home sales have been under pressure for quite some time. After rebounding 13.8% off its recent low in February, existing home sales have fallen in 3 of the past 4 months and have fallen the past 23 months on a year-to-year basis.

Sales of single-family homes fell 3.4% in June to a 3.72 million-unit pace, while sales of condominiums and co-ops fell 2.2% to a 440,000-unit pace.
The inventory of existing single-family homes rose slightly in June to 960,000 homes, which equates to a 3.1-month supply at the current sales pace. Inventories have improved slight this year, after bottoming out at 850,000 homes in December. Even with the improvement, however, the number of homes available for sale is 13.5% below its year ago level.
The lack of homes available for sale is largely due to the sharp rise in mortgage rates over the past 18 months, climbing from 3.10% in December 2021 to nearly 7% today. Sixty percent of homeowners with a mortgage have a mortgage rate below 4% and 80% of first-lien mortgages carry a rate of 5% or less. Homeowners with mortgages at those low levels would be hard pressed to find a home where their principal and interest payments would not be significantly higher than they are today, so most homeowners are staying put.
Higher mortgage rates are encouraging many current homeowners to stay put.
Higher home prices are pushing many would-be buyers to the sidelines. First-time buyers accounted for just 27% of sales in June, down from 28% in May and 30% in June of last year.

Sales fell in the South (-5.4%) and West (5.1%), were unchanged in the Midwest and rose 2.0% in the Northeast. Sales are down sharply on a year-to-year basis in all four regions.
The South and Midwest both continue to benefit from an affordability migration from other parts of the country. The median home price in the South remains 10.6% below the national median and a whopping 40% lower than prices in the West. The price break is even greater for buyers migrating to the Midwest. The South is accounting for the bulk of state-to-state migration, however, with the bulk of new arrivals settling in Texas, Florida, the Carolinas, Georgia, and Tennessee.
The influx of home buyers into the South and Midwest is one reason why sales of homes priced above $750,000 are holding up better in those regions than they are elsewhere. Many of these buyers are paying cash for their purchases, as they had substantial equity in the homes they sold out West or in the Northeast.
We expect existing home sales to weaken further, as affordability worsens. In addition to high principal and interest payments, insurance costs have also risen substantially, particularly in Florida and along the coast in the South, where many new residents are settling.
Disclaimer: This publication has been prepared for informational purposes only and is not intended as a recommendation offer or solicitation with respect to the purchase or sale of any security or other financial product nor does it constitute investment advice.
Whatever Happened to the Recession?
What Happened to the Recession?
- Economic growth appears to have averaged close to 2% in the first half of 2023, easing fears of an imminent recession.
- Moreover, the most cyclical parts of the economy- homes sales, light vehicle sales, and capital spending- all topped expectations in the first half of the year.
- Job growth has also proved resilient, although the pace has moderated, and the breadth of job gains has narrowed.
- Headline inflation has decelerated considerably, and core inflation is showing increasing signs of moderating, allowing the Fed to wind down their rate hikes.
- A majority of economists, including us, still see a mild recession as more likely than not later this year or in early 2024.
- The Fed is expected to hike the federal funds rate at least one more time and hold rates higher for longer. The yield curve is expected to remain inverted through 2024.
Economic growth topped expectations during the first half of 2023, with real GDP likely averaging around a 2% pace and employers adding 1.67 million jobs during the first six months of the year. The stronger-than-expected showing has led some forecasters to pull back their calls for a recession, although more than 60% of professional forecasters, including us, still call for the economy to slip into a modest recession later this year or in early 2024.
Expectations for a recession increased substantially about a year ago, once it became apparent reducing inflation would likely be more problematic and require a much more aggressive monetary policy response. After hiking the federal funds rate a quarter percentage point (25 bp) at its March 2022 meeting, the Fed followed with hikes of 50 bp at its May meeting and 75 bp hikes at each of the next 4 meetings. The Fed dialed back to a 50 bp hike in December and raised rates by 25 bp at its first 3 meetings this year before leaving its federal funds rate target unchanged at its June meeting. We expect the Fed to boost the funds rate another 25 bp at its July 26 meeting, which may mark the last hike of this cycle.
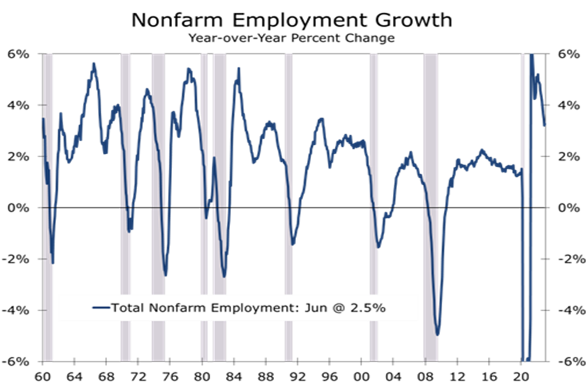
So far, the economy has handled the Fed’s rate hikes remarkably well. The unemployment rate, which is currently 3.6%, is 0.2 percentage points lower than it was when the Fed began to raise interest rates in March 2023. The labor market has loosened up, however, with the number of job openings falling modestly and the pace of nonfarm employment growth decelerating from 561 jobs per month in the first quarter of 2022 to just 244 jobs per month over the past three months. The breadth of job gains has also narrowed, as parts of the economy have been more significantly impacted by rising interest rates.

The labor market’s resilience is a big reason why so much doubt has arisen about a recession. The employment data have historically been the most timely and accurate indicator the National Bureau of Economic Research (NBER) utilizes to help decide when a recession begins. Nonfarm payrolls have been highly correlated with the onset of a recession, often falling in the first month of a downturn. The unemployment rate has typically risen slightly ahead of a recession and an increase of 0.4 percentage points or more has nearly always marked the onset of an economic downturn.
The NBER defines a recession as a significant decline in economic activity spread across the economy that lasts more than a few months. The NBER weighs three criteria – depth, diffusion, and duration – to determine whether a decline in economic activity has been ‘significant’. The weight of these criteria depends on the circumstances. The recession triggered by the pandemic was unusually short, lasting just 2 months, but was extremely deep and broad-based.
The U.S. has endured 11 recessions since 1950. If you exclude the short pandemic downturn, recessions have lasted for an average of 11 months and have seen real GDP decline 2.1% from peak to trough. The 2007-2009 recession resulting from the Global Financial Crisis was the longest, lasting 18 months.
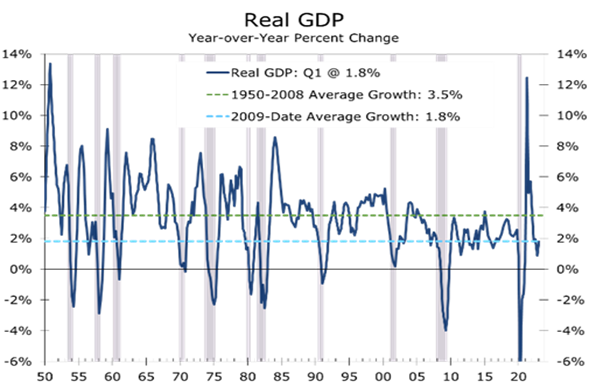
The NBER analyzes a variety of economy-wide measures of economic activity to identify business cycle peaks, including real personal income less transfer payments, nonfarm payrolls, real personal consumption expenditures, wholesale and retail sales adjusted for price changes, and industrial production.
Both nonfarm payrolls and the household measure of employment continue to grow solidly. Most other key indicators the NBER follows have either slowed or contracted slightly. Real personal income and transfers have come close to stalling this past year but have improved in recent months, while inflation-adjusted retail sales have fallen 2.4% over the past year. Inflation-adjusted sales of manufacturers and wholesalers have fallen for the past 3 months and have risen just 0.3% over the past year. And industrial production is up just 0.2% over the past year.
There are plenty of other warning signs. The Conference Board’s Leading Economic Index (LEI) has declined for 14 months in a row and is currently down 8% year-to-year. The LEI is designed to predict the Coincident Indicator Index, which includes four of the NBER’s six series. As such, the LEI has a good track record of predicting recessions, particularly when it has declined this persistently and by such a large magnitude – duration and depth. The decline has also been broad-based – meeting the dispersion test.
.

The LEI is designed to predict economic conditions six months out and the most recent string of declines would be consistent with the economy falling into recession during the second half of this year.
Measures of both real economic activity and financial conditions have contributed to the pullback in the LEI, with the ISM-Manufacturing new orders index and consumer sentiment both falling sharply. The spread between the 10-Year Treasury Note and the 3-Month T- Bill, which has been negative for the past 8 months, is another major contributor, as is the Conference Board’s measure of tightening credit conditions.
An alternative and more widely followed measure of the yield spread is the spread between the 10-Year Treasury Bond and 2-Year Treasury Note. That spread turned negative 13 months ago and has remained negative longer and fallen lower than any time since the early 1980s. Negative yield curves have been a reliable harbinger of recessions, with a negative yield curve preceding every recession since the 1970s.
.
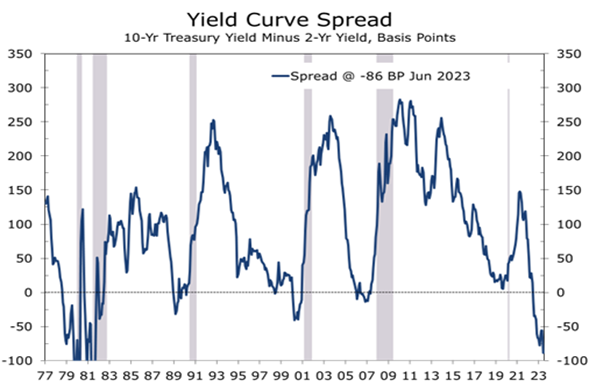
The lag between when the yield curve inverts and when a recession begins has been between 6 months to 2 years. The average length is about 16 months, which would put the onset of a recession in the third or fourth quarter of this year. One important sidenote, the extent to which the yield curve is inverted has tended to narrow before a recession began.
The Federal Reserve Bank of New York produces a recession prediction model based off the slope of the yield curve. The most recent data show the risks of recession are already well above levels reached prior to the past three downturns, reaching an eye-popping 67% in June 2024.
The reason an inverted yield curve is such a good predictor of recessions is widely debated. One obvious explanation is an inverted yield curve reflects a rise in risk aversion about the business cycle, leading to less capital spending, lower inventories, and less hiring. A second and related explanation is that an inverted yield makes bank lending less profitable, which leads to tighter credit conditions and fewer loans.
The Leading Economic Index, inverted yield curve, and New York Fed’s recession probability model based off the yield curve make a compelling case that a recession is more likely than not by the middle of next year. That remains our forecast and the forecast for about 60% of professional forecasters that regularly submit economic forecasts to publicly reported media.

While we see a moderate recession as more likely than not, we continue to emphasize it is a close call. Predicting recessions is difficult. The natural tendency of the economy is to grow. Recessions are quite rare. Since 1950, the economy has endured only 113 months of recession. Conversely, the economy grew the other 769 months, or 87% of the time.
There is still a clear path to a soft landing and that case has been getting stronger. Most notably, the inflation data are showing clear signs of moderating, which means the Fed is likely nearly finished hiking interest rates. Moreover, traditional measures of recession risk may be overstating the risk of recession.
The post-pandemic economy has been unusually difficult to read as there have been huge swings in employment, income, consumer spending, and capital investment that have occurred independently of one another. As a result, the economy is currently out of sync relative to most previous business cycles.
Consumer spending, which accounts for two-thirds of real GDP, is a good place to start. Pandemic relief payments enabled consumer spending to rocket back above its pre-pandemic levels just one month after the nationwide lockdown ended. Most of that initial spending burst was on goods. More recently, spending has shifted to services, and spending on goods has slowed or even fallen slightly.
The weakness in goods purchases has led to inventory drawdowns and cut new orders, which are one of the reasons ISM new orders and the LEI have been weak. In fact, the goods sector has been so weak that it has resulted in a ‘freight recession’, with falling shipping volumes and declining shipping rates. Travel and leisure outlays, which are booming by all accounts, do not figure into the LEI nearly as much as goods do.

The emphasis on the goods sector is understandable. Most of the swing in real GDP during economic cycles comes from the goods sector. Spending for consumer durable goods, housing, and business fixed investment typically accounts for most of the decline in real GDP.
While the goods sector has seen some wild swings, the outlook for goods spending does not appear to be anywhere near as dire as the yield curve or LEI suggests.
For starters, light vehicle production is just rising back above its pre-pandemic levels and the supply of new and used cars has improved to the point that sales are rising. There is still substantial pent-up demand for cars and light trucks, although affordability will likely keep a relatively low ceiling on sales. There is also a huge backlog for automotive repairs that will keep body shops busy for months to come.
Home building is another area that is out of sync. The long period of ultra-low interest rates and pandemic-era housing boom resulted in many homeowners locking in generationally low mortgage rates. Sixty percent of outstanding first-lien mortgages are currently below 4%, with 80% below 5%. With such low rates, few homeowners are willing to put their homes on the market, bolstering demand for new homes. With inflation cooling off and the Fed nearly finished raising rates, there is a good chance single-family home building has already seen its lows for this cycle.
We remain concerned about the apartment market. There are more apartments under construction today than at any time since the early 1970s. Apartment starts will likely decline significantly as credit tightens. That will pull overall starts lower. Strength in single-family starts will offset much of this drag, however. The knock-on effects from single-family construction are huge, fueling demand for building products, financial services, furniture, appliances, security systems, lawn care, and all sorts of assorted other items.
There are also reasons to be optimistic about business investment. Demand for capital goods has been surprisingly strong, particularly electrical equipment, commercial aircraft, and heavy trucks. The AI revolution also appears to be kicking off another cycle in IT spending, while the CHIPS Act and Inflation Reduction Act are driving outlays for massive semiconductors plants, EV factories, and battery plants. Construction spending for new manufacturing facilities is running 72% ahead of its year-ago pace.
State and local government is another bright spot that is often overlooked. Pandemic relief to state and local governments helped bolster balance sheets and revenues recovered sooner than expected, leaving many states flush with cash. There has been a recent flurry of water projects around the country. The new infrastructure act will provide a further boost, although public works projects tend to evolve slowly.
While the path to a soft landing appears a little clearer, a recession later this year or early next year is still more likely than not. All the arguments for stronger economic growth are also arguments that inflation will
prove more persistent. Much of the improvement in inflation has come from lower energy prices and fewer shortages in the auto sector. Inflation remains sticky in labor-intensive parts of the service sector.
Wage pressures may intensify further as the tight labor market emboldens workers to demand larger pay gains. The expanding Hollywood writers’ strike might foreshadow more challenging labor negotiations at UPS and the United Auto Workers this fall, setting a more inflationary undertone to wages in general.
Disclaimer: This publication has been prepared for informational purposes only and is not intended as a recommendation offer or solicitation with respect to the purchase or sale of any security or other financial product nor does it constitute investment advice. Any forward looking statements or forecasts are not guaranteed and are subject to change at any time. Information from external sources have not been verified but are generally considered reliable.
© 2023 CAVU Securities, LLC
Questions? Email: CompassReport@cavusecurities.com
Housing Starts Fall Back in June
A Humbler Take of the Housing Rebound
-
- Housing starts fell 8% to a 1.434-million-unit pace in June. Sales for May were revised substantially lower, with most of the cut coming from multifamily starts.
- Permits fell less and show less volatility.
- Starts fell in all four regions, with the Midwest seeing an outsized 33.1% drop.
- Housing completions fell 3.3%, and the number of homes under construction edged 0.1% higher to 1.682 million units.
- Most of the backlog is large apartment projects, where cycle times have lengthened.
- Homebuilder confidence rose 1 point to 56 in July, marking the 7th straight month of improvement. Present sales rose 2 points to 62, while expected sales fell 2 points to 60.
- June’s data confirm home building cannot defy gravity. Higher mortgage rates and higher prices have severely reduced affordability. While the scarcity of existing homes is sending more buyers to new homes, fewer of those would-be buyers can afford to pay the higher premium for a new home.
Housing starts fell 8% in June to 1.434-million-unit pace and the previously reported spike in starts for May was revised sharply lower. The June data provide a more realistic assessment of the housing market, which provided a modest upside surprise in the first half of this year. Demand for new homes has been bolstered by the lack of existing homes for sale.
Much has been made of the shift of buyers from existing homes to new homes. The influx of buyers has bolstered builder confidence and allowed them to scale back the aggressive incentives they were offering at the start of the year. Even with aggressive incentives, however, new homes are typically more expensive than existing homes, which means fewer would-be existing home buyers can afford to make the switch to a new home.
Affordability likely took a further hit in June, when mortgage rates rose past 7%. Higher mortgage rates are likely giving some builders pause. Single-family starts fell 7% in June to a still robust 935,000-unit pace.
Softening demand and tighter lending conditions are weighing on multifamily starts.
Multifamily projects accounted for most of June’s drop in housing starts and accounted for the bulk of the downward revision to the May data. Apartment developers are facing softening demand, slower rent growth and tightening lending conditions. The National Multifamily Housing Council quarterly survey noted that 57% of its respondents reported loosening conditions over the past 3 months. Debt and equity financing was also reported to be harder to secure.
The apartment market also faces an avalanche of new supply, mostly in larger markets. The length of time that it takes to complete apartment buildings has been elevated for quite some time. While shortages are responsible for much of the delay, a larger proportion of apartment projects in recent years have been in urban markets, where it is often more difficult to build. Projects have also been midrise or high-rise projects, which typically take longer to complete.
The backlog of apartment projects grew longer in June, with the number of units under construction rising 0.7% to 977,000 units. This marks the largest backlog for multifamily projects stretching all the way back to 1973. While that stat might raise the heartbeat of folks who remember past apartment busts, vacancy rates are considerably lower today than they were back then and housing in general is in short supply. The rub is much of the current backlog is in luxury and lifestyle units. Demand for those units may weaken later this year, as student loan payments resume.
Demand for luxury/lifestyle apartments will likely weaken as student payments resume.
The number of single-family homes under construction fell 0.9% in June to 688,000 units and has fallen 17% since last June. Higher short-term rates add to the sense of urgency to reduce work-in-process inventory.
The June data provide some much-needed improved perception of the state home building. Recent weeks have seen a rash of reports noting that housing had adjusted to higher interest rates. While that is true, housing starts have settled at a much lower level. Overall housing starts through the first six months of this year are down 15% from the first six months of 2022, with single-family starts through June running 21.1% below their year-ago pace. Starts of duplexes, triplexes and quadplexes are down by a similar amount. Starts of projects with 5 units or more are running just 2.1% below their year ago pace.
While single-family starts are down sharply for the first half of this year, they rose sequentially in the second quarter, averaging 929,000 units versus 834,000 in Q1, and will provide a slide boost to second quarter real GDP growth. Moreover, a larger share of home sales in May were for homes not yet started, so the recent pace may have some staying power.
The most recent NAHB/Wells Fargo Housing Market survey shows builders enjoying solid demand. The index rose 1 point to 56 in July and has risen every month this year. Confidence is being bolstered by stronger buyer traffic and less need to offer incentives.

Disclaimer: This publication has been prepared for informational purposes only and is not intended as a recommendation offer or solicitation with respect to the purchase or sale of any security or other financial product nor does it constitute investment advice.
June Employment Data Point to a Soft Landing
Job Growth is Not So Hot After All
- June nonfarm payrolls rose 209,000 and job growth for the prior two months was revised lower by a total of 110,000 jobs.
- The softer employment print largely alleviates fears stoked by yesterday’s hyper-strong ADP report that hiring had accelerated.
- Job growth remains broad based but continues to be led by industries that have struggled to replace pandemic job losses.
- Government added 60,000 jobs in June, with all the gain coming at local governments (32K) and state governments (27K).
- Health care and social assistance (65.5K) is another area still striving to get back to their pre-pandemic trend.
- Manufacturers added 7,000 jobs in June, mostly in the automotive sector. Construction payrolls (23K) also rose solidly, led by continued strength in home building.
- The modest rise in June nonfarm payrolls helps reduce fears hiring had reaccelerated to the point the Fed would have to tighten even more aggressively.
June’s employment report poured cold water on the notion the job market was overheating. Nonfarm payrolls rose by just 209,000 in June and job growth for May and April were revised lower by a combined 110,000 jobs. Hiring remains broad based but shows some signs of softening in the goods sector.
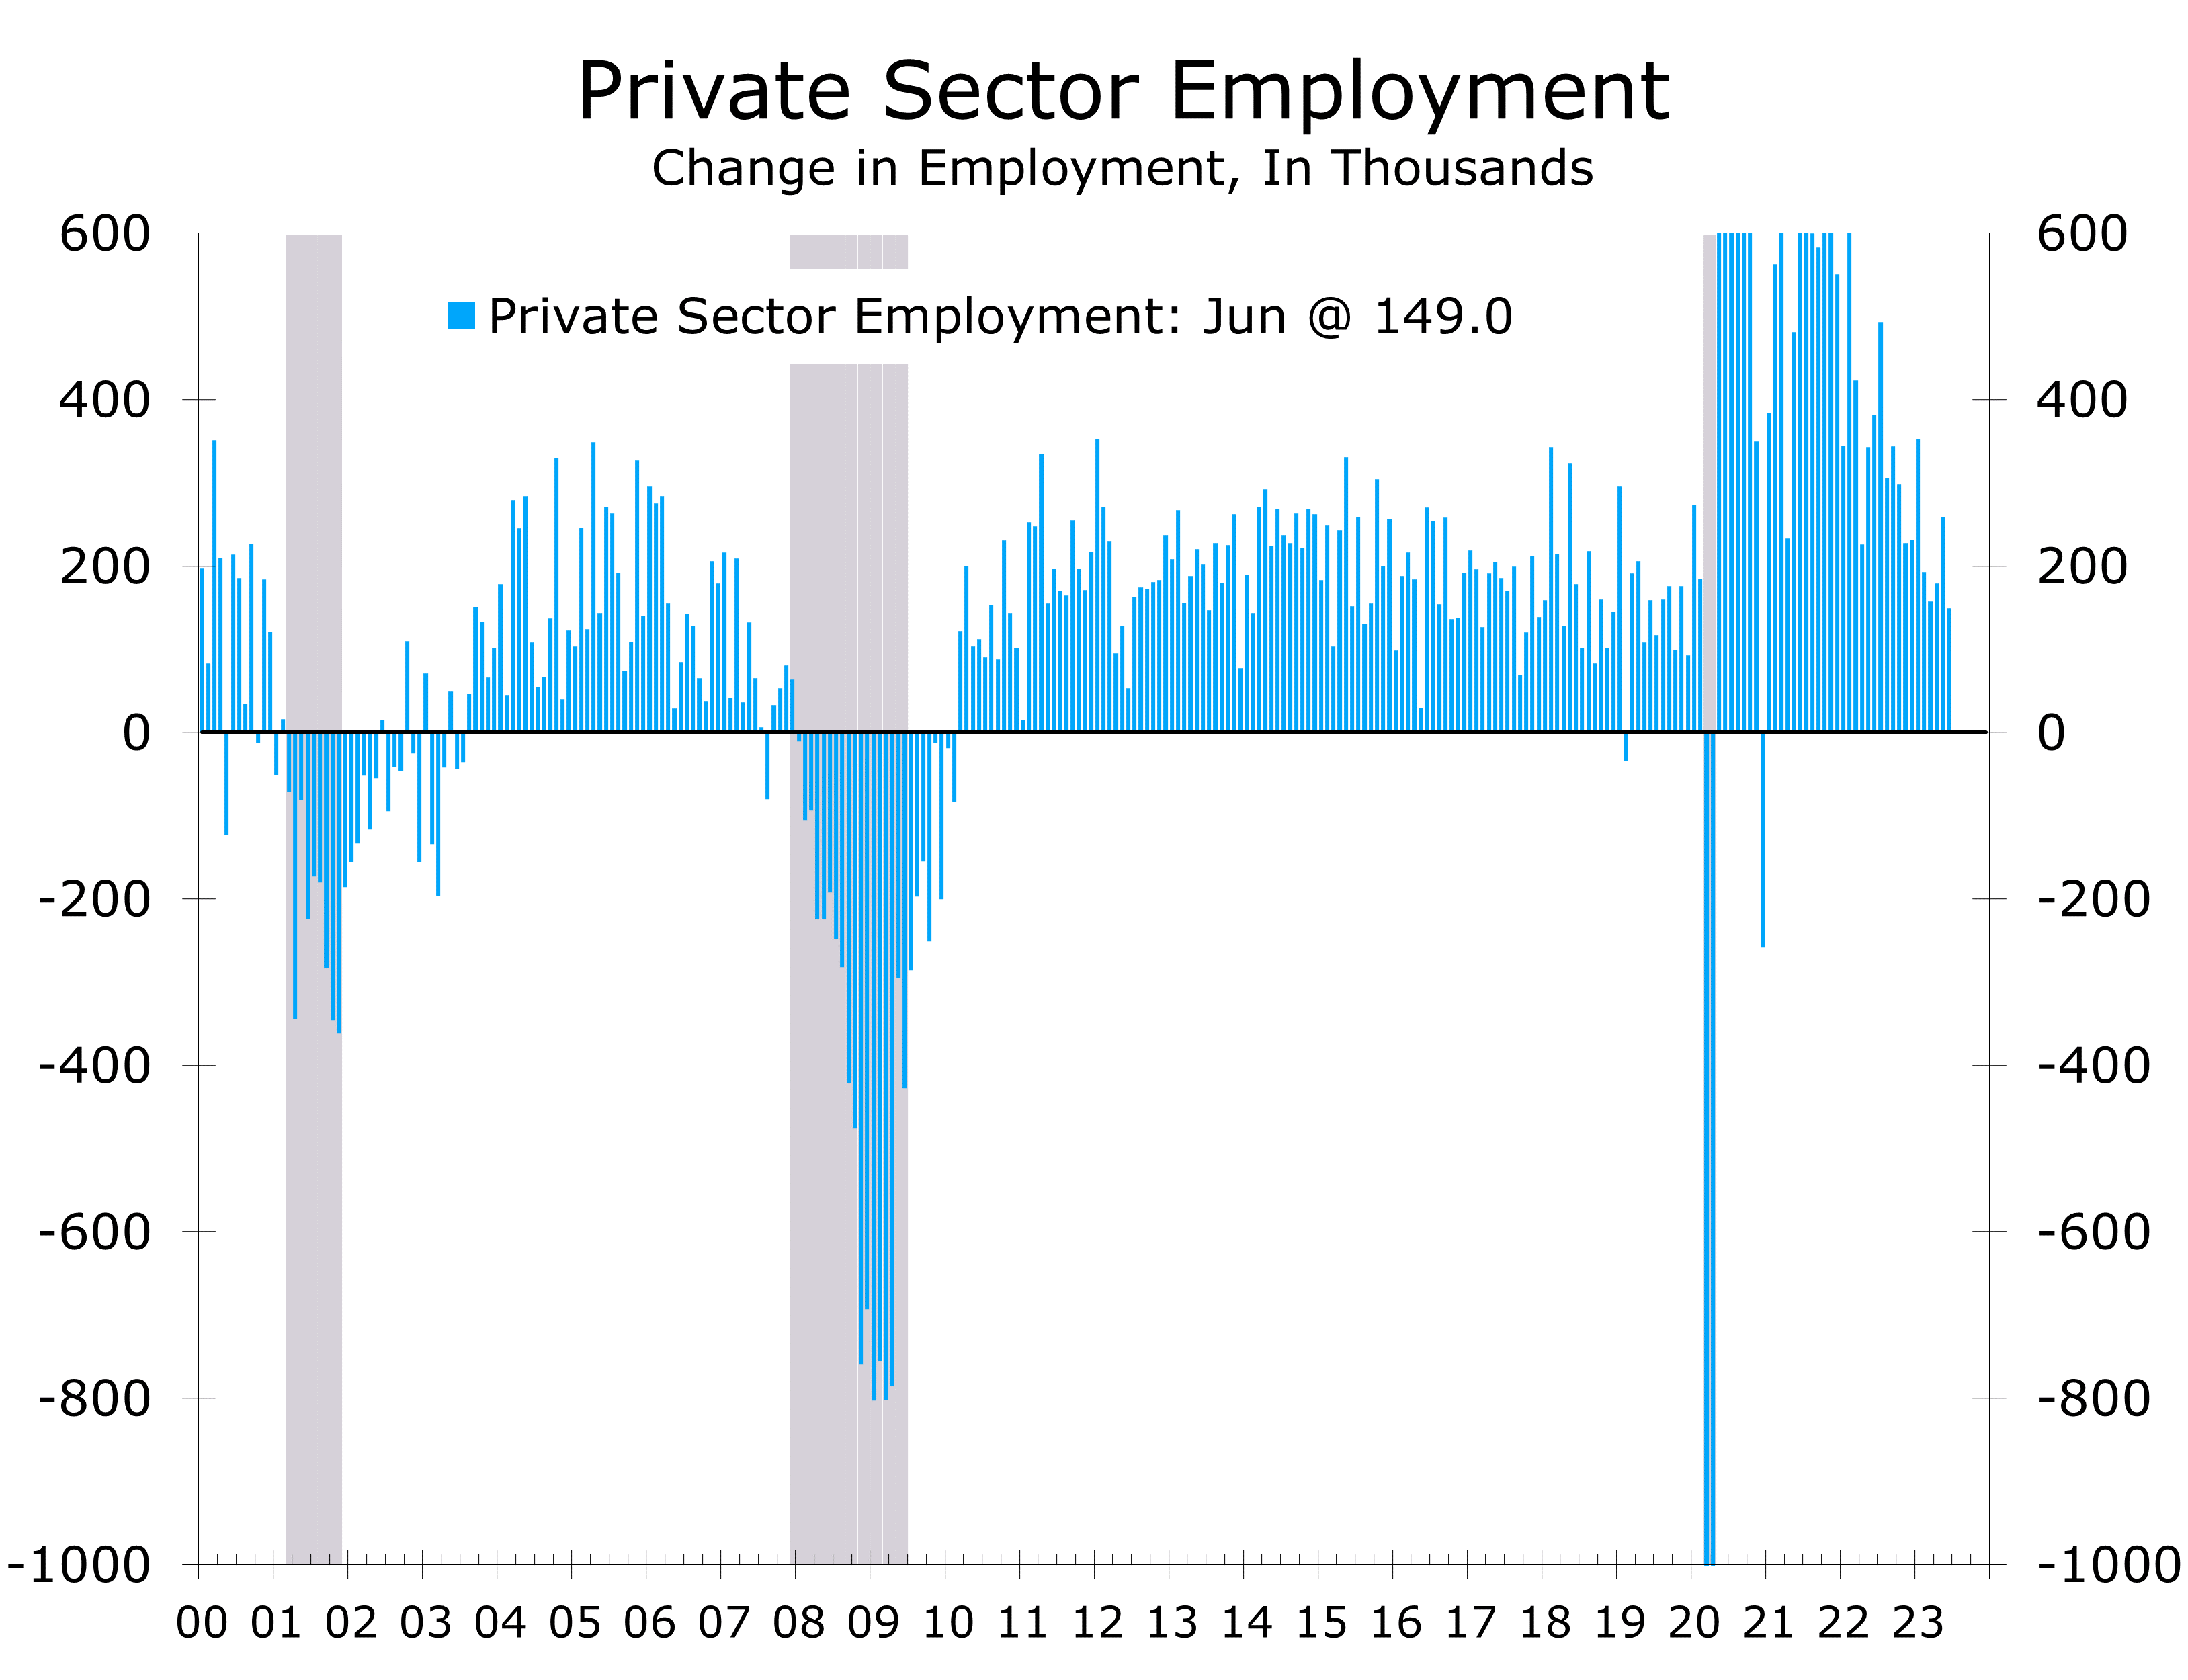
Market expectations had been stoked by yesterday’s blowout ADP employment report, which reported the private sector added 497,000 jobs in June. The ADP report is reasonably accurate over time but often deviates significantly on a month-to-month basis. Private payrolls in today’ BLS report rose by a much more modest 149,000 in June and have decelerated to a 1.8% annual rate over the past three months.
Job growth is now clearly decelerating. Overall payrolls have risen an average of 278,000 per month so far this year, down from 399,000 per month in 2022. Private payrolls have added just 215,000 jobs per month over the past six months (196.5K over the past three months), down from 376,500 in 2022. Moreover, the bulk of job gains continue to come from industries striving to rehire workers lost during the pandemic, particularly state and local governments, leisure and hospitality, and health care and social services.
Governments added 60,000 jobs in June, with the bulk of that gain occurring at state (27K) and local governments (32K). June’s gain was in line with recent months. Governments have added an average of 63,000 jobs a month so far this year, which is more than twice the 23,000 per month added in 2022. Government employment remains 161,000 jobs, or 0.7%, below its February 2020 pre-pandemic level.
Leisure and hospitality added 21,000 jobs in June. This marks the third month of diminished job growth in this sector, where hiring remains 369,000 jobs, or 2.2%, below its pre-pandemic level. Employment in retail trade (-11K), wholesale trade (-4K) and transportation and warehousing (-7K) was also noticeably soft. The weakness likely reflects less than usual summer hiring and some weakness in nondurable goods spending.
Manufacturing and construction employment held up reasonably well in June.
Manufacturing and construction employment, which is typically the most cyclical part of nonfarm employment, held up reasonably well in June. Manufacturers added 7,000 jobs and the factory workweek was unchanged at 40.1 hours. Durable goods producers added 15,000 jobs, with producers of transportation equipment accounting for nearly half of that gain. Nondurable goods producers cut 8 jobs.
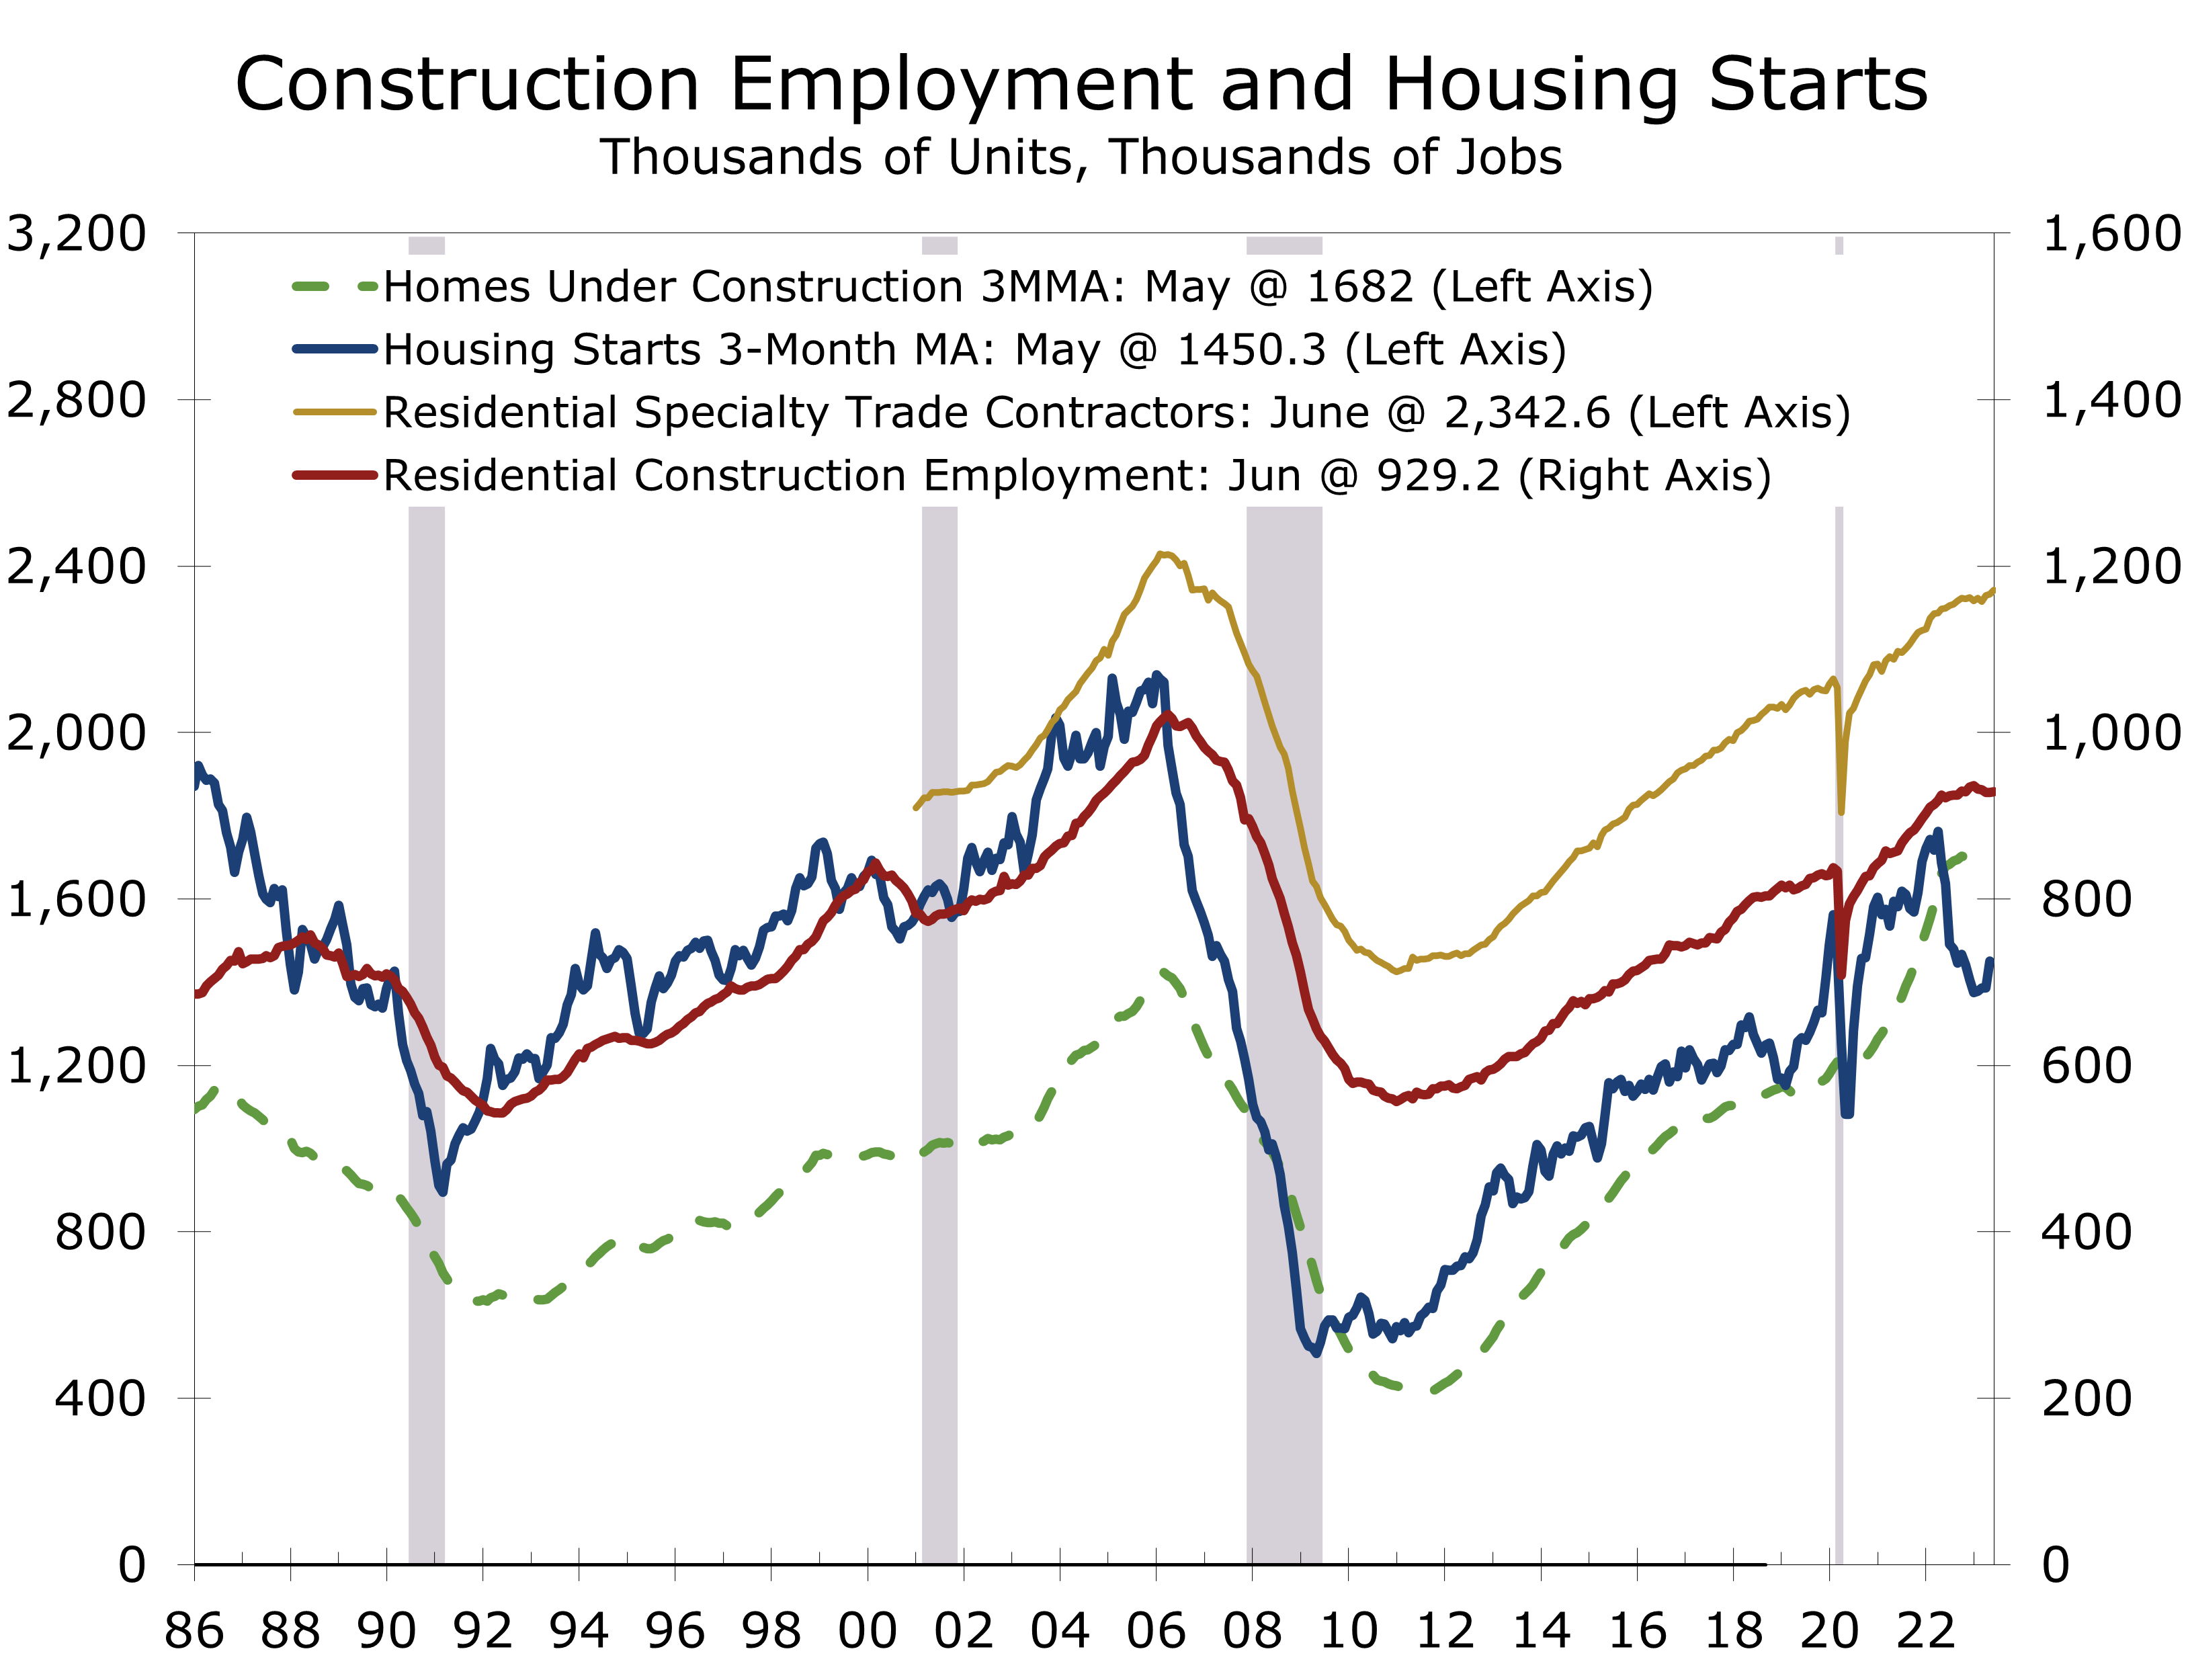
Construction firms added 23,000 jobs in June. Much of that strength was in home building, with residential specialty trade contractors adding 10,000 jobs. The strength in specialty trade contractors is likely due to the unusually large number of homes that remain under construction. Housing starts have pulled back in recent months and are beginning to slow hiring in residential building construction.
Average hourly earnings for all employees on private payrolls rose 0.4% to $33.58. Average hourly earnings are up 4.4% over the past 12 months. Our income proxy shows wages and salaries rising a solid 0.55% in June and at a 4.4% annual rate in the second quarter.
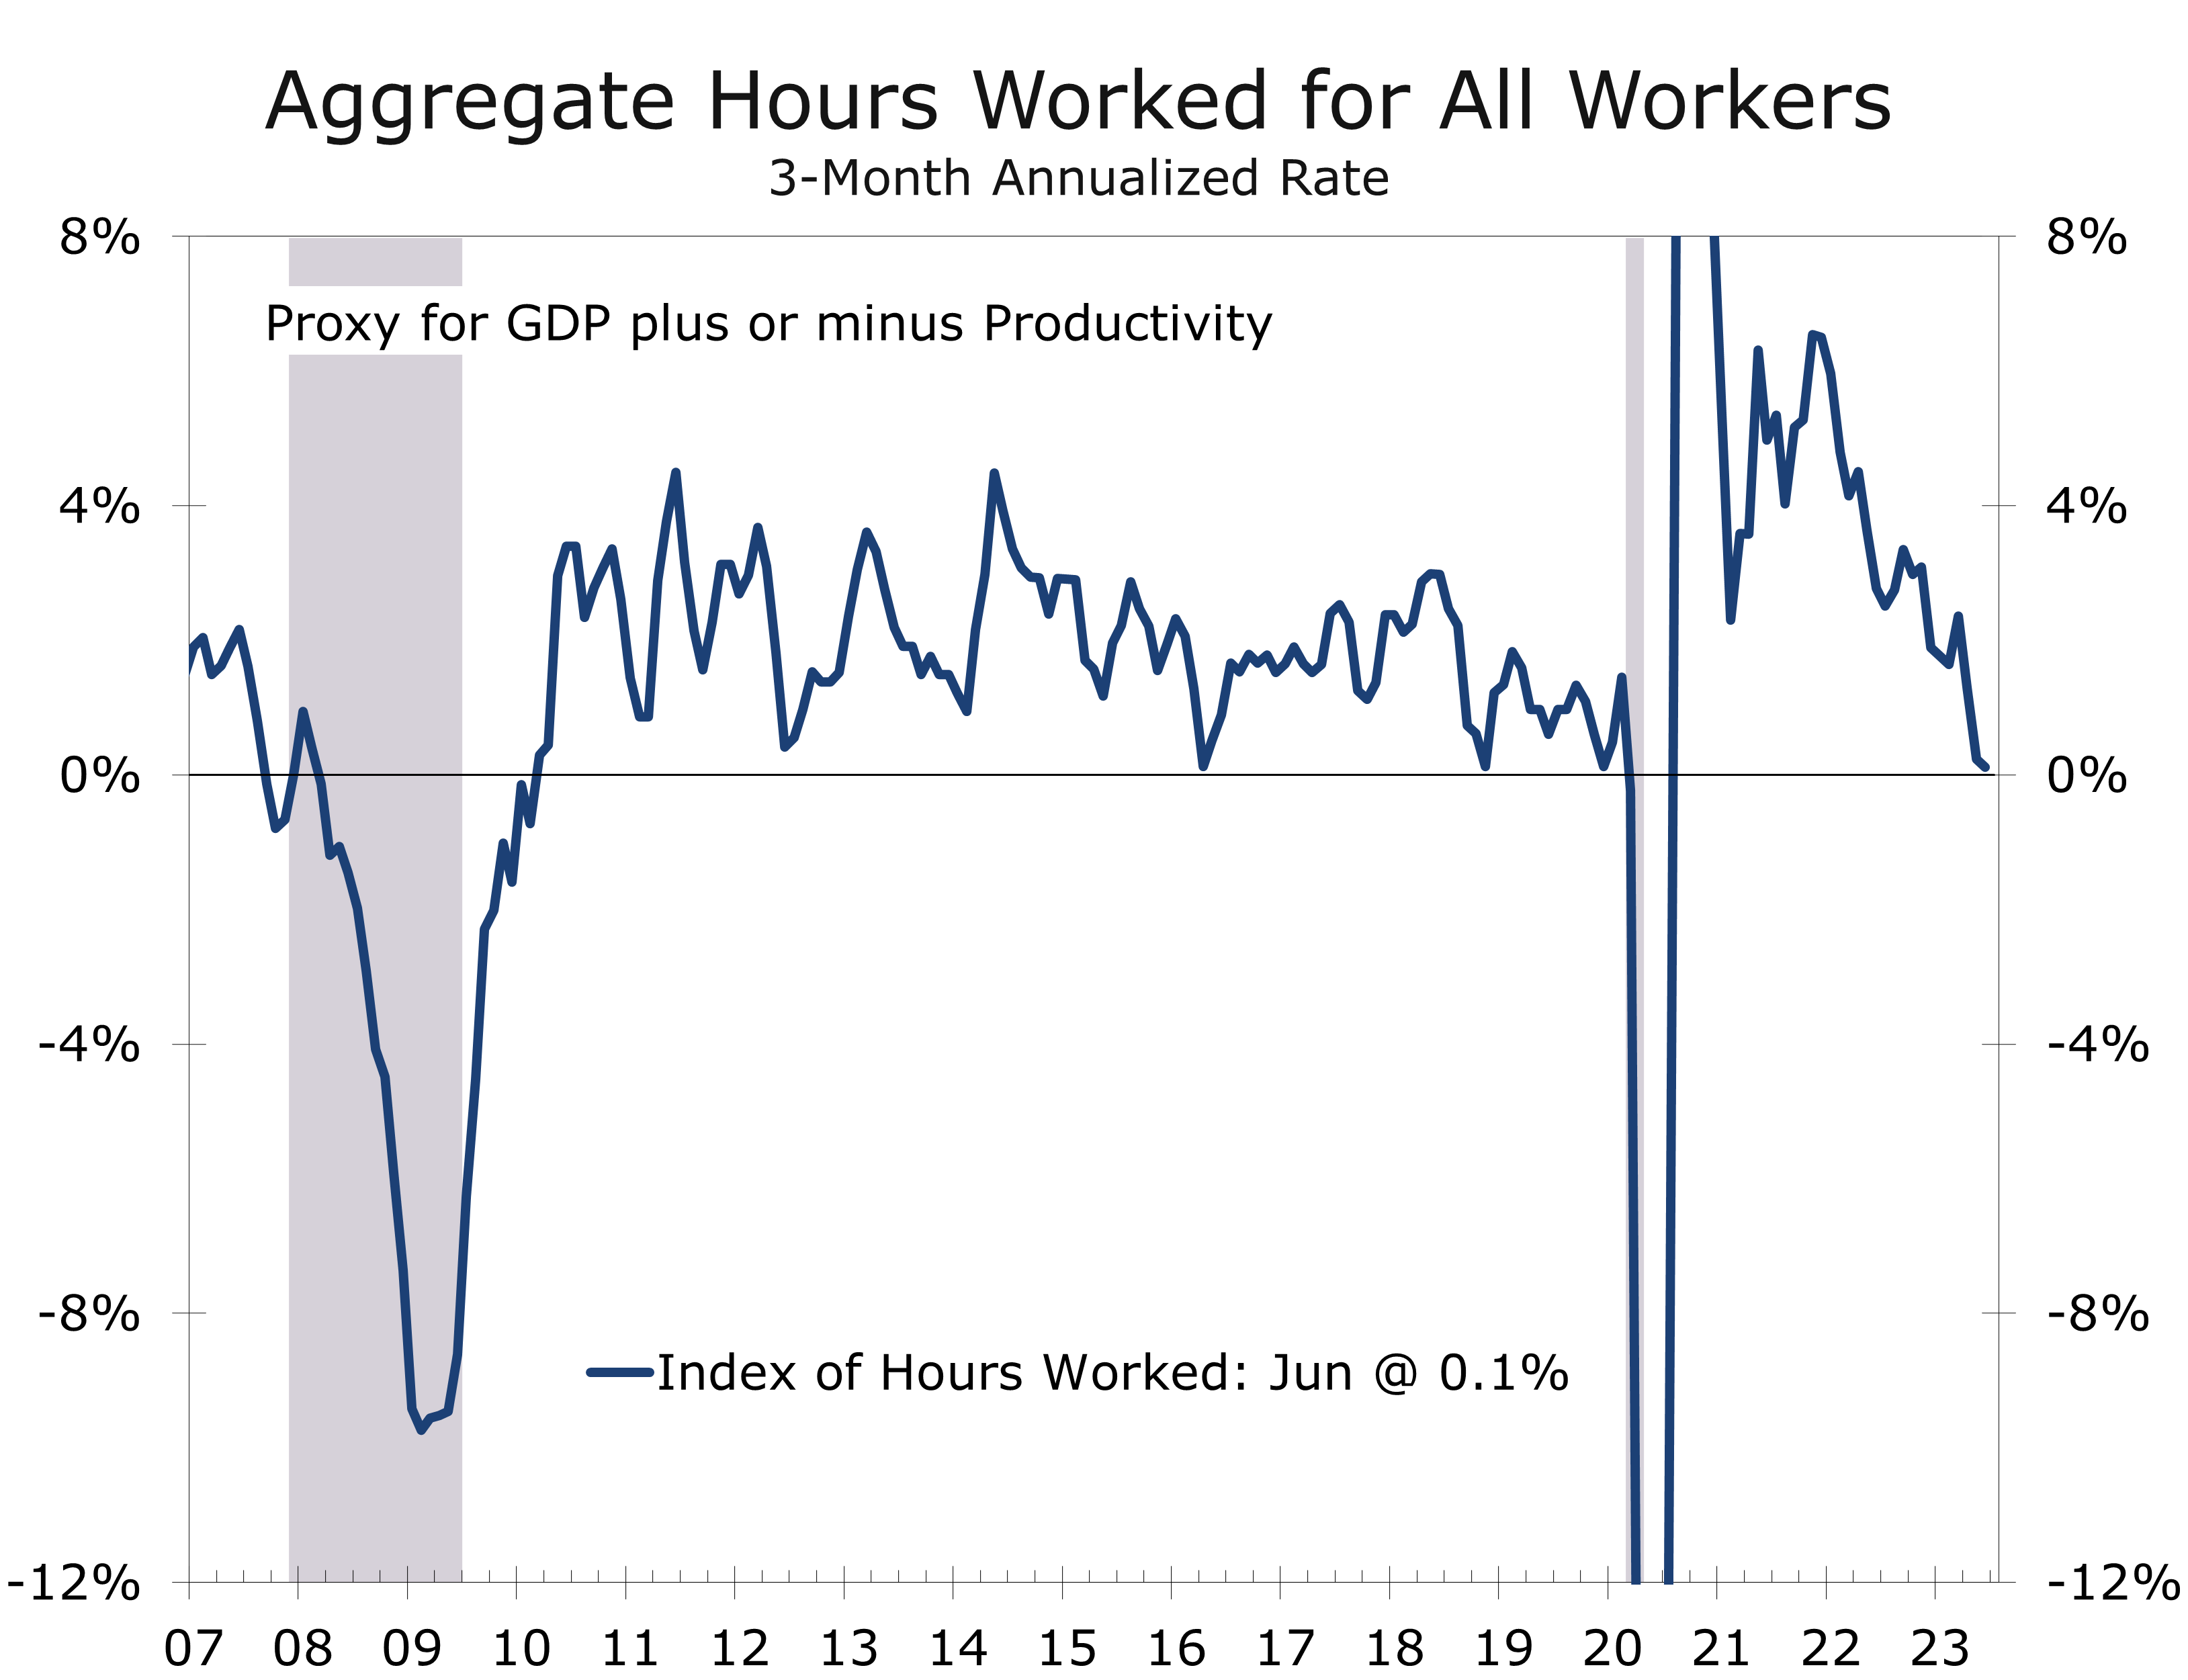
Hours worked improved substantially in June, with the average workweek for all employees edging 0.1 higher to 34.4 hours. Aggregate hours worked, which combines job growth and average weekly hours and is a good proxy for GDP growth, rebounded 0.4% in June, following a 0.1% drop the prior month. For the second quarter, however, aggregate hours worked rose at just a 0.1% annual rate. This means Q2 real GDP likely grew at the lower end of expectations (around 1.5% to 2%).
The unemployment rate inched 0.1 percentage point lower to 3.6%, as a rebound in self-employment helped lift household employment by 273,000, easily outpacing a 133,000 rise in the civilian labor force.
The June employment data are consistent with the Fed hiking its federal funds rate target by a quarter point at the July 26 FOMC meeting. Fears the Fed would have to do much more than that were overblown and will likely diminish further following next week’s CPI report. We look for the Fed to be on hold after July.
Disclaimer: This publication has been prepared for informational purposes only and is not intended as a recommendation offer or solicitation with respect to the purchase or sale of any security or other financial product nor does it constitute investment advice.
Manufacturing Continues to Weaken
Manufacturing Activity Falls Again in June
- The ISM Manufacturing Index fell 0.9 percentage points to 46.0 in June, marking the 8th consecutive month of ‘contraction’.
- New orders were one of the few bright spots in June, rising 3 points to 45.6.
- Weakness in the factory sector appears to be broadening, however, with the 12-month moving average for every component now below the key 50 breakeven level.
- Supply chains continue to normalize, with more manufacturers reporting quicker deliveries and fewer reporting shortages.
- Demand appears to be flagging, however, particularly overseas. The new export orders index fell 2.7 points to 47.3.
- The ongoing normalization of supply chains has likely exaggerated the slowdown in the ISM manufacturing index. Supplier deliveries have swung back from extreme highs, which has weighed on the overall index. With fewer shortages, production and employment have been bolstered.
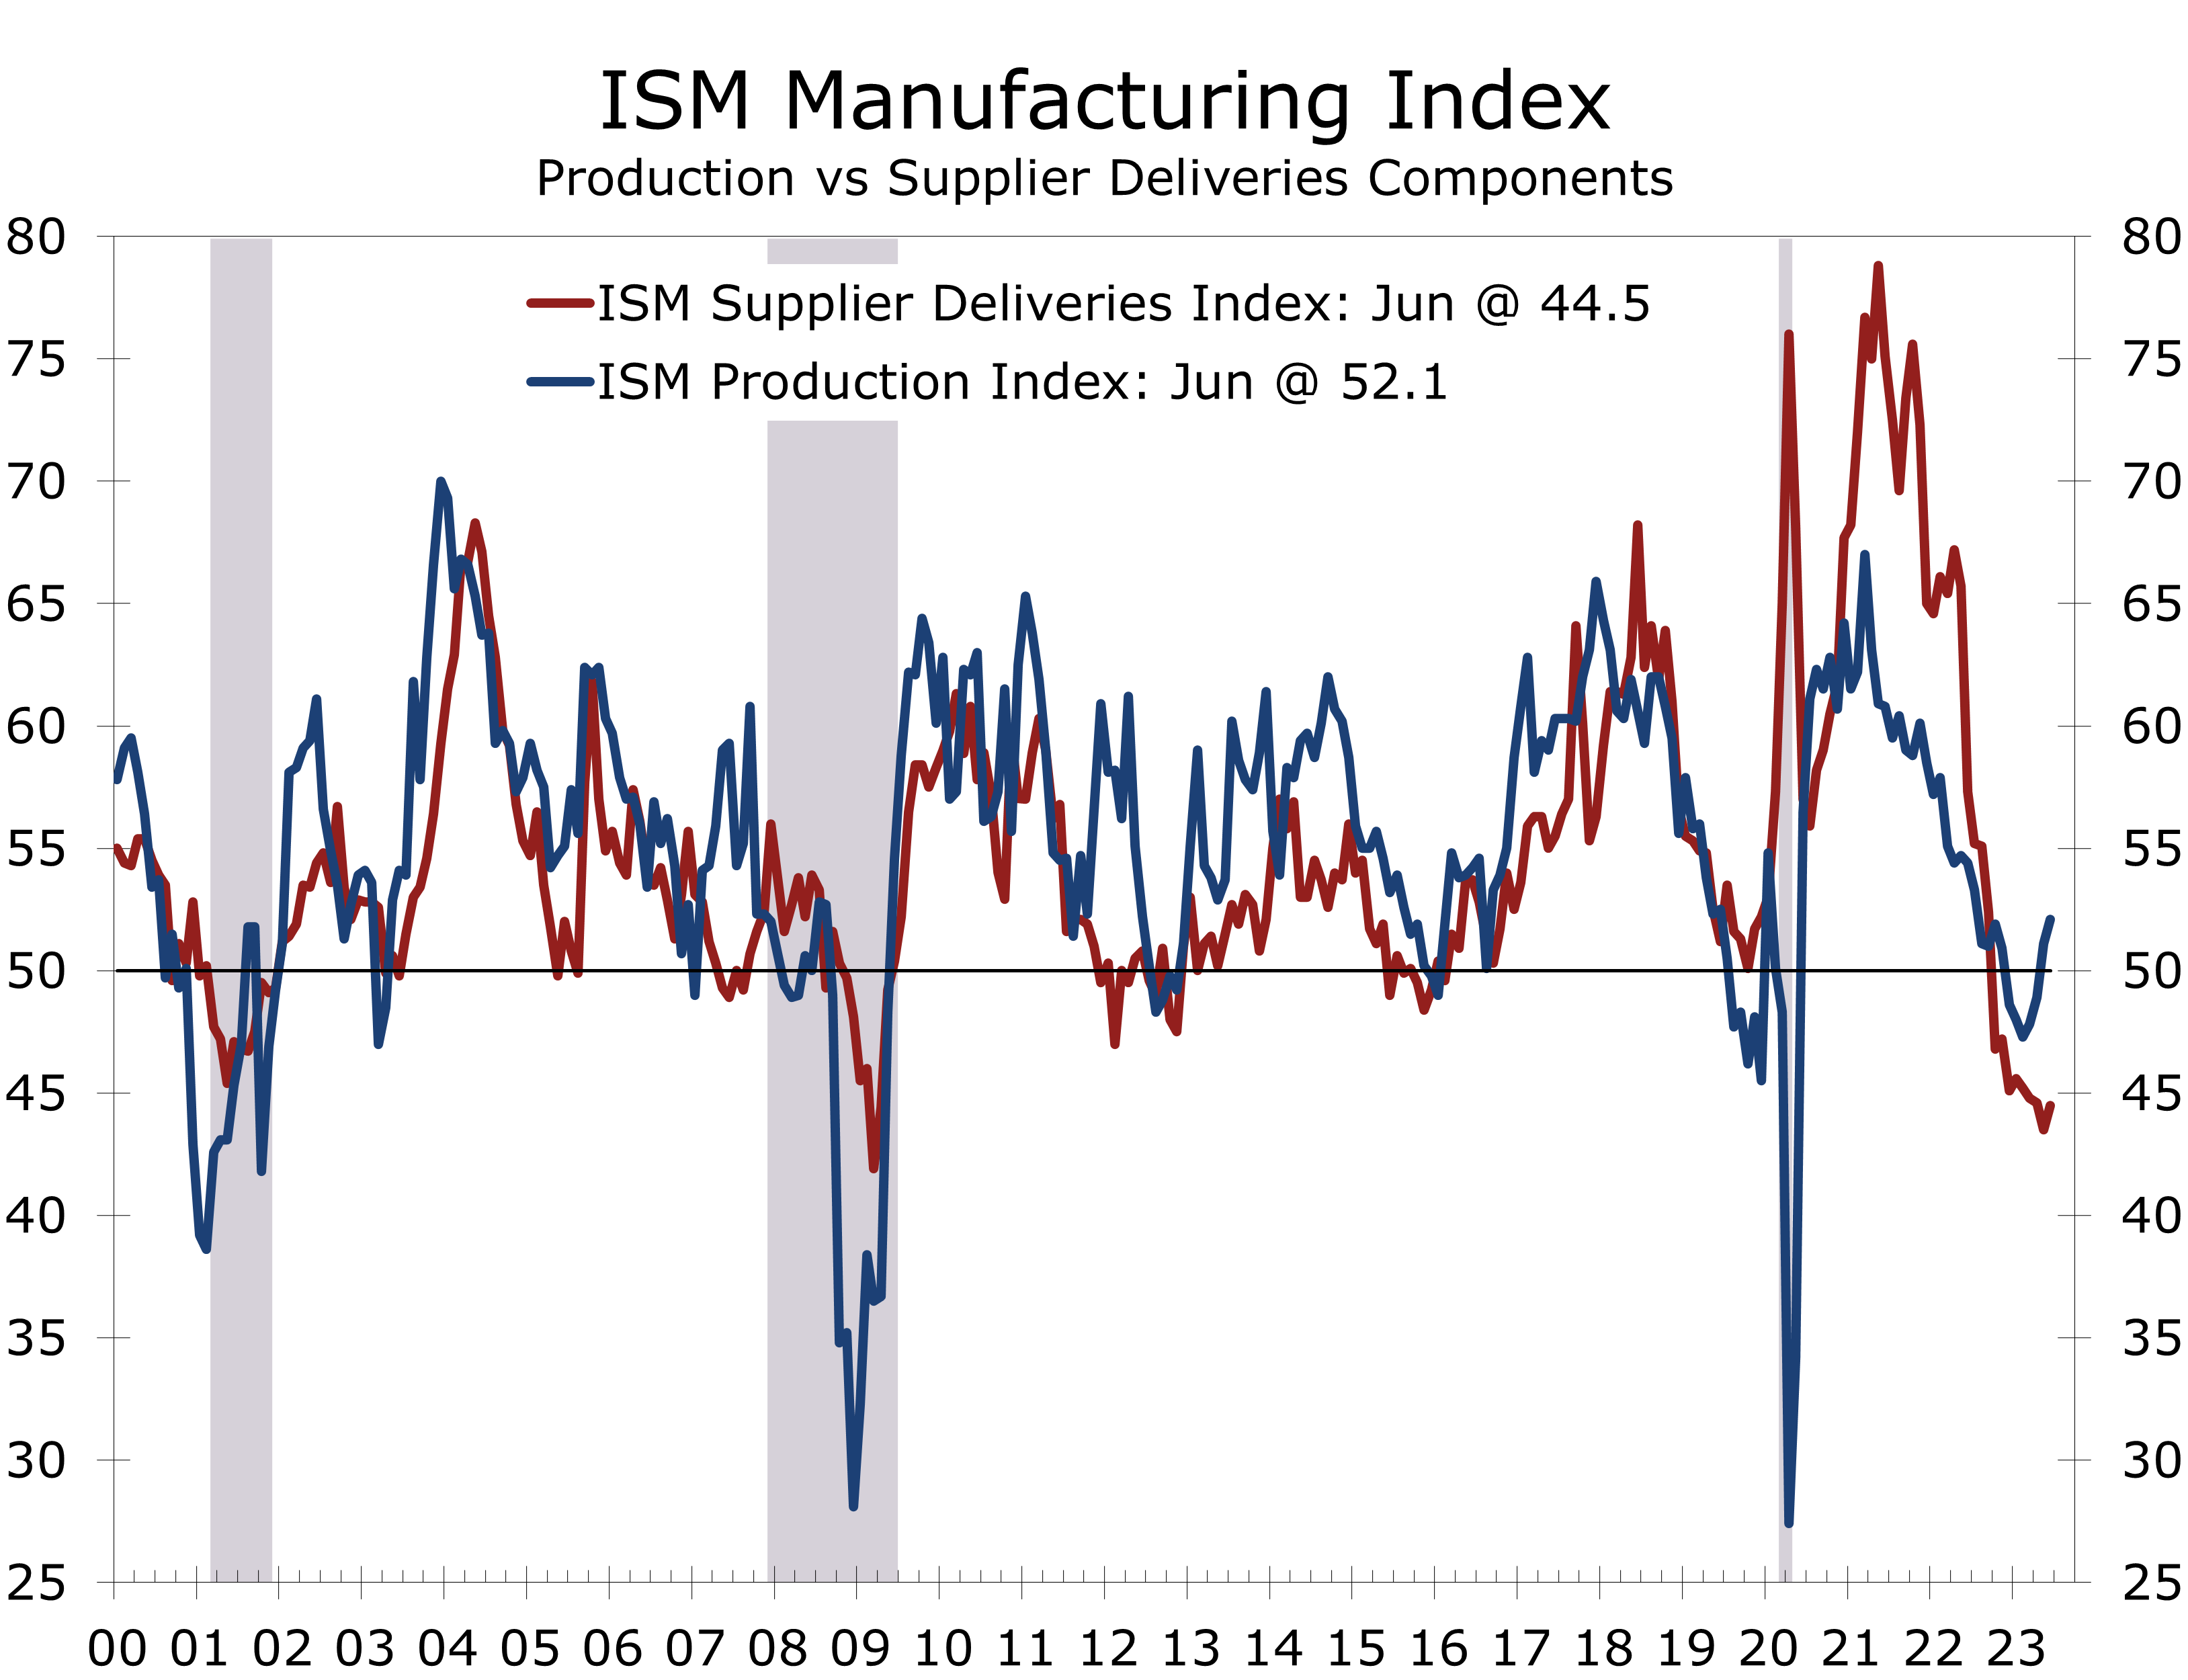
The Institute for Supply Management (ISM) manufacturing index fell 0.9 points to 46.0 in June. The underlying composition was mixed, with new orders rising 3.0 points to 45.6, but the production index falling 4.4 points to 46.7. The employment index also fell sharply, declining 3.3 points to 48.1.
The ISM report is a diffusion index that reports on the breadth of the strength or weakness in the factory sector. A reading below 50 means more manufacturers report deteriorating conditions as opposed to improving conditions. The June reading marks the 8th consecutive month the overall index has been below the key 50 breakeven level, signaling contraction.
All 5 of the subindices that directly factor into the ISM Manufacturing index are now in contraction territory and many have been for quite some time. The latest 12-month moving average for the overall index is now at 48.8, marking its second month below 50. The 12-month moving average for the new orders index, which is the most leading element of the report, has been below 50 for the past 5 months, although it did rise 3 points in June to 45.6. The 12-month moving average for the backlog of unfilled orders series has also been below 50 for the past 5 months, while the 12-month moving average for the employment index has been below 50 for the past 4 months.
While manufacturing represents a smaller portion of the economy today, the factory sector still provides the bulk of the cyclical impulse to the broader economy and largely drives the ups and downs of the business cycle. According to the ISM, June’s 46.0 level is consistent with a 1.0% decline in real GDP.

The demarcation line between recession and growth is more complicated today due to the ongoing return to pre-pandemic norms. Supply shortages, most notably for microchips, slowed production of light vehicles and certain other durables as the economy reopened.
The return to pre-pandemic norm supply chains has exaggerated the swing in the ISM index.
Shortages have greatly diminished this past year, as can be seen by the long slide in the supplier delivery component. With fewer shortages, production has been surprisingly resilient. The June data show a bit of a reversal from that trend, with the production index tumbling 4.4 points after rising 2.2 points in May. With the drop, the 12-month moving average for the production index dipped into contraction territory for the first time since September 2020.
Supply chains are still normalizing. The supplier delivery index rose slightly in June, climbing 2.2 points to 45.7. While the index rose, more manufacturers are still reporting faster delivery times, which suggests there are fewer shortages and supply-chain bottlenecks. The lead time for production materials edged lower by 1 day in June to 83 days. That is still relatively high, however. The lead time for production materials averaged 64 days just prior to the pandemic and just 51 days back to the series start in 1988.
The normalization of supply chains should help curb inflation. The ISM prices paid index fell 2.4 points in June to 41.8, indicating more firms report paying lower prices for key inputs. Lower prices for oil and natural gas are playing a big role in delivering price relief, both directly through lower fuel costs and indirectly through lower prices for plastics, resins, and shipping.
The closely watched ISM employment index fell 3.3 points in June to 48.1, returning to contraction territory after two months of being above 50. Only 6 of the 18 manufacturing industries surveyed boosted hiring in June, led by printing, furniture, fabricated metals, and transportation equipment.
The ISM noted employer sentiment has shifted such that layoffs are now more prominent. That shift is apparent in the data. The 12-month moving average for the employment index has dipped to 49.9, which is consistent with a decline in manufacturing payrolls.
We expect the factory sector to lose momentum in the second half of this year. Production of transportation equipment and building materials will provide some much needed buoyancy, however, as demand for other consumer goods and exports sags a bit further.

Disclaimer: This publication has been prepared for informational purposes only and is not intended as a recommendation offer or solicitation with respect to the purchase or sale of any security or other financial product nor does it constitute investment advice.