
A View from the Piedmont — Our Weekly Commentary on Money, Credit, Exchange Rates & Geopolitics
The Long End Does the Tightening
Thirty-four sessions with the 30-year Treasury at or above 5 percent, gross federal debt topping $40 trillion and Brent back above $93 moved the binding constraint on this expansion from the funds rate to the yield curve.
Market Dashboard
| Indicator | Level | This Week | Indicator | Level | This Week |
|---|---|---|---|---|---|
| Fed funds target range | 3.50 to 3.75% | Unchanged | Nasdaq Composite | 26,180.46 | -2.1% |
| 2-year Treasury | 4.19% | +2 bp | MOVE index, rate vol | 73.4 | +6.0% on week |
| 10-year Treasury | 4.69% | +1 bp | VIX, equity vol | 14.25 | 2026 low |
| 30-year Treasury | 5.23% | -2 bp | Brent crude, October contract | $93.40 | Second weekly gain |
| 2s-30s spread | 104 bp | -4 bp | Gold | $4,680.10 | +2.4% |
| 10-year term premium | 0.84% | +2 bp since Jun 30 | Gross federal debt | $40.0 trillion | Crossed Wednesday |
| 5-year TIPS breakeven | 2.34% | +10 bp | Initial jobless claims, week ended Aug. 15 | 206,000 | -6,000 |
| 10-year TIPS breakeven | 2.34% | +7 bp | Core CPI, 12-month | 2.47% | July print |
| 30-year fixed mortgage | 6.65% | -2 bp | Our HP filter trend, core CPI | 2.51% | -4 bp from June |
| S&P 500 | 7,674.31 | -1.4% | Nonfarm payrolls, July | -23,000 | July print |
| Dow Jones Industrial Average | 53,276.81 | -0.9% | S&P Global composite PMI, flash | 56.0 | 52-month high |
Treasury constant maturity yields and the mortgage rate are Federal Reserve H.15 and Freddie Mac readings through Thursday, August 20. Equity, energy and metals levels are Friday, August 21 closes. The purchasing managers' index is the August flash reading published Friday. Weekly changes are measured against the comparable prior reading. The term premium is the Federal Reserve Board's three-factor estimate for August 14. The MOVE and VIX levels are Friday closes.
Summary
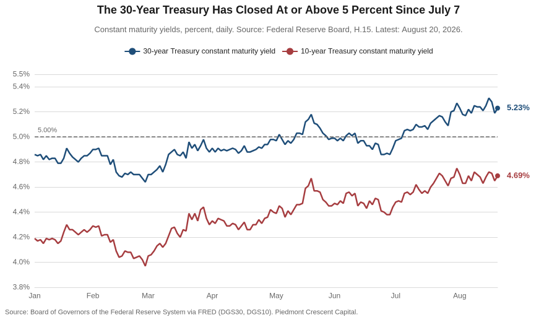
- The week's price action happened at the long end of the curve while the front end sat still. The 30-year Treasury touched 5.34 percent intraday on Tuesday, its highest since June 2007, and closed Thursday at 5.23 percent. It has now closed at or above 5 percent for thirty-four consecutive sessions, the longest such run since the summer of 2007.
- Gross federal debt crossed $40 trillion on Wednesday, the same day Treasury doubled its long-end buybacks. Secretary Bessent raised the size of operations in the 10- to 20-year and 20- to 30-year sectors from $2 billion to at least $4 billion, effective September 9 through November 4. Yields fell on the announcement and gave the move back within a day.
- Our HP filter trend for core CPI slipped to 2.51 percent in July from 2.55 percent in June. Core CPI rose 0.2 percent on the month and 2.47 percent over the year, and the three-month annualized rate ran 1.64 percent. Underlying inflation is moderating even as the energy shock builds behind it.
- The August flash composite PMI came in at 56.0 against a 54.0 consensus, a 52-month high, with employment at its second-best level in four years. Services led at 56.8. Input costs rose at their slowest pace since February and selling prices at their slowest since last November, which is a hot output print with cooling prices in the same month Brent went back to the nineties. Friday's front-end selloff was this number.
- Trade talks with Canada collapsed Friday night and 50 percent tariffs took effect Saturday morning under Section 338, the first use of that authority in the statute's history, covering roughly $20 billion of goods with energy and potash exempt. Canada retaliates dollar for dollar on September 8.
- Chair Warsh gives his first Jackson Hole address on Friday, and the annual payroll benchmark revision lands the same morning. We expect the Committee to hold. The condition that would change that is an energy pass-through into core goods, and July's core goods detail does not yet show one.
Our Central Thesis
For most of this expansion the critical question about monetary policy has been what the Committee would do with the funds rate. That question has largely settled. The funds rate has sat in a 3.50 to 3.75 percent range all year, the market prices no change at the September meeting, and our own call has been unchanged since June. We expect no cut in 2026, with the next move a hike in the first half of 2027. The more interesting question now sits thirty years out. The 30-year Treasury has closed at or above 5 percent for thirty-four consecutive sessions and touched 5.34 percent intraday on Tuesday, and German and Japanese long yields made multi-year or record highs in the same stretch. A global duration selloff is doing work the Committee has not had to do.
Three separate arguments are pushing on the same maturity, and it is worth separating them. The first is fiscal. Gross federal debt crossed $40 trillion on Wednesday, interest already absorbs roughly a fifth of federal tax receipts and the service cost has climbed sharply this year. The second is energy. Brent has run from $68.53 on July 2 to the low nineties, and the 5-year TIPS breakeven added 10 basis points on the week while the nominal 30-year fell 2 basis points, which is the market marking up expected inflation with the term premium roughly unchanged. The third is private credit demand tied to the artificial intelligence buildout. Investment-grade corporate issuance has passed $1.5 trillion this year, up 36 percent from the same period in 2025, and borrowing by the largest technology companies has run at roughly a quarter of net Treasury note and bond issuance. A second Treasury is standing in the same queue, competing for the same long-dated savings. Only the first of those is a story about Washington, and Treasury's response addressed only the first.
The practical consequence is that financial conditions are tightening in the part of the curve that prices capital spending, mortgages and corporate refinancing, while the part the Committee controls sits still. The economy is absorbing that tightening, and it argues for patience at the September meeting. We are staying cautious on duration, and we would rather own the belly than reach for the long bond at these levels. The condition that would change our positioning is a credible fiscal consolidation that the market believes, which Secretary Bessent has said the administration will detail in the coming days, or an energy resolution that takes the inflation-compensation bid out of the long end.
This Week's Argument
The long-end selloff was global, ruling out most of the U.S. aimed explanations for it
The same week the 30-year Treasury touched 5.34 percent, the 30-year Japanese government bond climbed to 4.1 percent, the 30-year bund reached 3.7 percent and the 30-year gilt reached 5.8 percent. The Japanese level sits near a record. The German level is the highest since the euro-area debt crisis in 2011 and the British level is close to the highest since 1998. Four sovereigns with four fiscal positions, four central banks and four inflation histories sold off in the same maturity in the same week. Whatever is repricing is not the American deficit alone, and it is not the September FOMC.
Figure 1 shows how one-directional this year has been in the American case. The 30-year began 2026 at 4.86 percent, spent February and March in the high fours, first closed above 5 percent on May 4, and has not closed below it since July 7.
Treasury's response tested the supply-composition explanation and the test failed. Secretary Bessent announced on Wednesday that buyback operations in the 10- to 20-year and 20- to 30-year sectors would double from $2 billion to at least $4 billion, running from September 9 through November 4, and said the move reflected a view that yields do not reflect underlying fundamentals. The 30-year fell to 5.19 percent on Thursday and was back to 5.23 percent by the close, and the whole announcement was worth about a day.
We expect the long end to stay in a 5.00 to 5.40 percent range through the September meeting. The conditions that would break that range are a fiscal package the market finds credible or a squeeze in that speculative short on the downside, or a Hormuz escalation that pushes Brent through $110 on the upside.
Hormuz is open and rationed, and the insurance market is the binding constraint
The strait is not physically closed and it is not functioning. Before the war, roughly one-fifth of seaborne oil and a large share of global LNG moved through Hormuz, and more than 100 vessels a day made the transit. Commodity transits this week have been running around nine a day. Over the first nineteen days of August, tracking services counted 236 ships of all types, on the order of one-tenth of the peacetime pace. The working description as of Friday morning is open but severely restricted, with extreme risk. A projectile strike on August 18 produced another seafarer casualty, and the United Arab Emirates subsequently suspended financial and economic transactions with Iran after missile attacks on affiliated vessels.
War-risk insurance is what keeps most hulls out of the strait. Premia that used to run near 0.25 percent of hull value have been quoted in recent months at several percent and as high as 7.5 to 10 percent. On a VLCC that turns a single transit into a multi-million-dollar insurance bill before a barrel is sold, which is why owners stay away even when a vessel could physically pass and even when the Navy says the water is open. Market commentary keeps underweighting that. The binding constraint sits in the London underwriting market, and it will loosen on the underwriters' timetable rather than on the diplomats'.
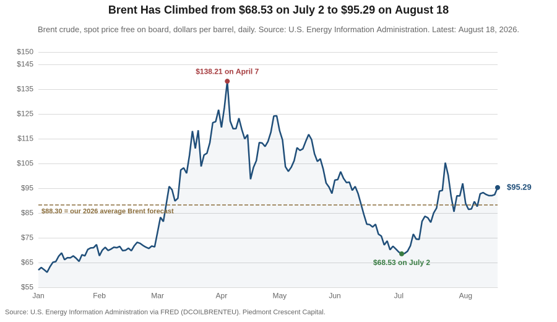
Figure 2 is the reason a treasurer should care about a shipping lane. Brent peaked at $138.21 on April 7, fell all the way to $68.53 on July 2 as the market decided the war would stay contained, and has climbed back to the low nineties as the rationing hardened. That round trip is a 100 percent range inside seven months on the input that sits underneath freight, plastics, fertilizer and roughly a third of the CPI's month-to-month volatility. We raised our 2026 average forecast to $88.30 a barrel on August 18, with the third quarter marked up to $92.00, and the spot price still sits above it.
The consumer is trading down without falling over
July retail sales fell 0.6 percent, the largest monthly decline since May 2025, after a 0.2 percent June gain. That print, which was largely driven by a big seasonally adjusted drop in online sales after an earlier than usual Prime Day, set up this week's earnings as a live read on the household, and the earnings came back more nuanced than the headline. Home Depot reported sales of $47.9 billion, up 5.7 percent, with comparable sales up 1.7 percent and U.S. comparable sales up 1.3 percent, and management described broad demand for smaller projects and continued strength among professional customers while reaffirming full-year guidance. Lowe's sales rose to $26.0 billion with comparable sales up only 0.2 percent, a fifth consecutive quarterly gain carried by Pro, home services and a 15.7 percent rise in online sales. Discretionary do-it-yourself demand was soft at both. Owners are repairing and upgrading. They are not financing the rate-sensitive renovation, which is exactly what a 6.65 percent mortgage and a locked-in existing loan would predict.
Walmart is the print that moved the tape, and the composition is more interesting than the miss. Second-quarter revenue rose 5.9 percent to $187.9 billion and adjusted earnings of $0.81 beat the Street, but U.S. comparable sales excluding fuel rose only 2.6 percent against expectations near 3.7 percent, the slowest pace in more than six years. Pharmacy price regulation subtracted about 80 to 125 basis points, which leaves an underlying 3.4 percent. The number that says the most about the household, however, is average ticket, up 1.1 percent against 3.1 percent a year earlier. E-commerce rose about 23 to 24 percent, and the company said it would apply $2.9 billion in tariff refunds to holding prices down even while flagging roughly $2 billion in additional fuel-related costs. The 9 percent drop in the stock was the market's way of saying the consumer is still spending, just more carefully and more often at the value end.
Behind the Numbers
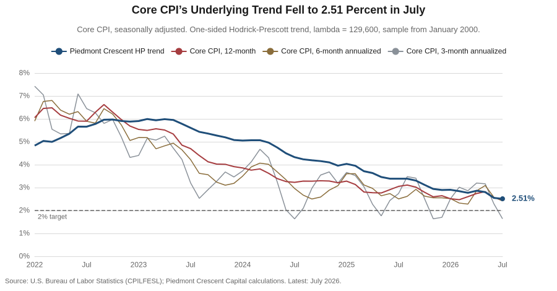
Underlying inflation slipped again in July, to 2.51 percent from 2.55 percent in June on our HP filter gauge. The measure is a one-sided Hodrick-Prescott trend on monthly annualized core CPI with lambda set at 129,600 and the sample starting in January 2000, so the published estimate uses only data available at the time and never revises. It has now fallen for six consecutive months, from 2.89 percent last December. Figure 3 plots it against core CPI compounded over trailing three, six and twelve months, and the convergence is the strongest defense the measure has. Twelve-month core ran 2.47 percent in July, six-month 2.42 percent and the trend 2.51 percent. Three-month core ran 1.64 percent, well below the others, which is the one reading that argues underlying inflation is lower still.
The energy pass-through question turns on core goods, and July's detail is at most a first hint. Core commodities excluding food and energy rose 0.2 percent in July after declining in May and June, and are up 0.8 percent over the year. Core services excluding energy rose 0.23 percent and 3.0 percent over the year. Energy itself fell 1.5 percent in July, which is why the headline came in at 0.1 percent and 3.4 percent over the year. July's index, however, was collected before Brent made most of its move back toward the nineties. The August and September prints are the ones that will show whether $93 crude is reaching the goods basket, and the August print arrives on September 11. Two pieces of evidence point in opposite directions ahead of it. Nonfuel import prices rose firmly in July with the pressure concentrated in sectors exposed to the artificial intelligence buildout, even as the headline import price index fell on oil. Against that, the August flash PMI has input costs rising at their slowest pace since February and selling prices at their slowest since last November. The survey is more current than the index.
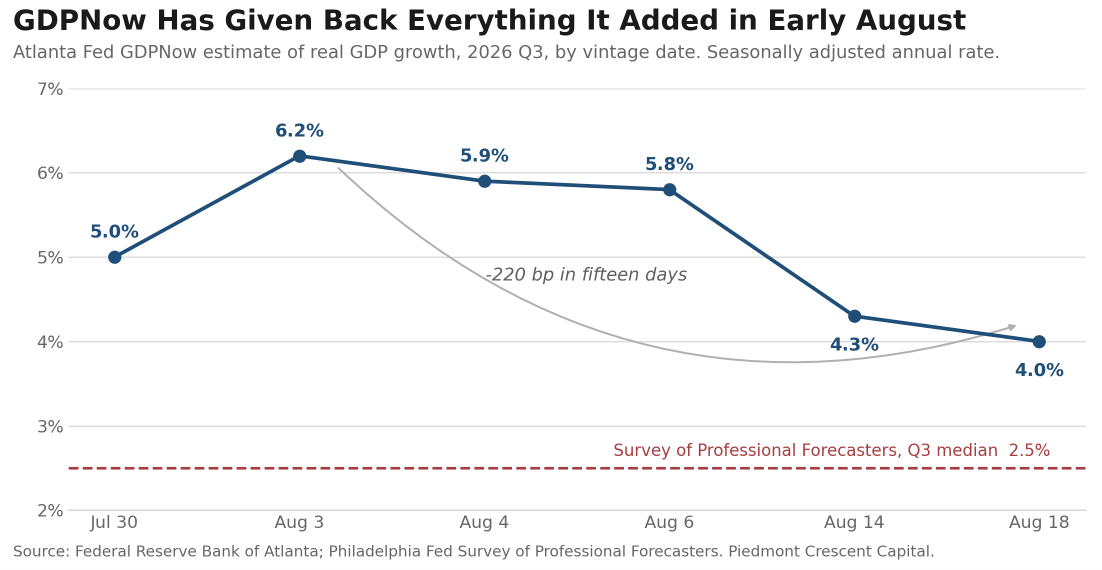
GDPNow has given back everything it added in early August, and the path is more instructive than the level. The Atlanta Fed's estimate for the third quarter opened at 5.0 percent on July 30, jumped to 6.2 percent on August 3 on the Census and ISM releases, and has fallen in four consecutive updates to 4.0 percent on August 18. Figure 4 plots the six vintages. The decisive move was August 14, when the consumption nowcast was cut from 4.1 percent to 2.5 percent, and the August 18 revision took gross private domestic investment from 15.2 percent to 13.7. Two things are worth holding onto. The first is that the underlying demand signal never printed anything like 6 percent. Real private domestic final purchases, which strips inventories and net trade, sits at 2.7 percent against a headline of 4.0, so roughly 1.3 points of the current estimate is in the two components that mean revert. That 2.7 percent is close to the 2.5 percent median in the Philadelphia Fed's third-quarter survey, and it is close to our own view. The second is that the model's root mean squared error since 2011 is 1.17 percentage points, which puts a one-standard-error band around today's reading of roughly 2.8 to 5.2 percent. The Atlanta Fed says in its own documentation that the accuracy metrics “do not give compelling evidence that the model is more accurate than professional forecasters.” A nowcast that has traveled 220 basis points in fifteen days is measuring the arrival of data, not a change in the economy. The next update lands Wednesday alongside the second estimate of second quarter GDP and the July personal income report.
The Canada postponement did not hold. Talks collapsed Friday night and the 50 percent tariffs took effect at 12:01 Saturday morning. Prime Minister Carney suspended negotiations and recalled his team, saying late changes to the American terms were “unfair, uneconomic, and called into question the reliability of any deal.” The measures cover roughly $20 billion of Canadian goods, about 5 percent of Canada's exports to the United States, with energy, potash and critical minerals exempt.
Canada will retaliate dollar for dollar effective September 8, after Labour Day, on steel, dairy, appliances, agricultural equipment, pulp and paper and electronics. The authority is the part that matters for anyone modeling tariff risk: this is the first use of Section 338 of the Tariff Act of 1930 in the statute's history. An untested authority invoked six months after the Supreme Court voided the IEEPA tariffs is a litigation risk carrying a refund liability, and the market has one precedent for how that ends. The direct price effect is small, roughly two-tenths of a point on the overall effective rate, and it lands in the September and October goods prints rather than in August.
Bottom Line
The FOMC does not need to act, because the curve is acting for it. A 5.23 percent 30-year, a 6.65 percent mortgage and a 2s-30s spread near 104 basis points are tightening financial conditions in exactly the maturities that price capital spending and housing, and they are doing it without the Committee spending any of its credibility. Underlying inflation is moving the right way, with our HP filter trend at 2.51 percent and six-month core at 2.42 percent, and the labor market is soft in hiring while separations stay low. We expect a hold on September 16, no cut in 2026 and a first hike in the first half of 2027. We are the only house we know of carrying that hike, and nothing this week moved us off it.
We stay cautious on duration and we would rather own the belly than the long bond. The three arguments pushing on thirty-year paper are fiscal, energy and the private credit demand behind the artificial intelligence buildout, and a buyback program addresses none of them. This is still a capital-led, employment-light expansion, protein rather than carbohydrates, and the week's events did not change that characterization so much as raise the price of financing it.
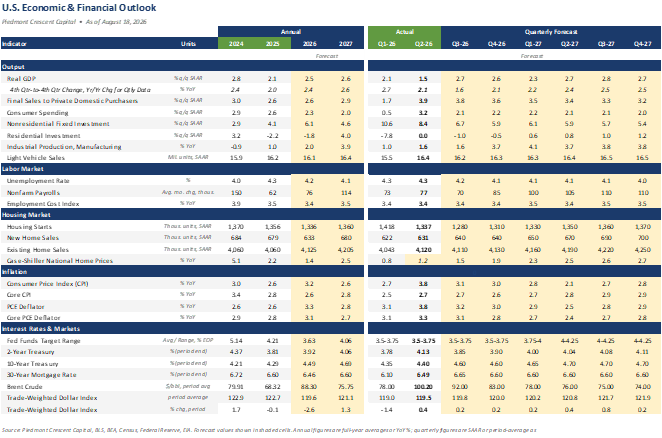
Three calls, put down in a form that can be scored. We expect the 30-year to trade between 5.00 and 5.40 percent through the September 16 meeting. We expect Brent to average between $85 and $100 a barrel through year end, against the $92.00 third quarter and $83.00 fourth quarter in our own table. And we expect either the August or the September payroll print to come in above 125,000 on the calendar artifact we described in July, which is the same view the table carries. A 70,000 monthly average for the third quarter, after July's decline of 23,000, requires roughly 116,000 a month across August and September. Friday's flash purchasing managers' survey put employment at its second-best reading in four years in the August period, the first real-time evidence for that third call. We add a fourth this week: we expect the MOVE index to hold above 70 through the September 16 meeting. That is the cleanest available test of whether the missing reaction function is costing the Treasury market anything, and it is a cheaper test than waiting to see it in the 30-year. Check us on all four the week of October 5.
CFO and Treasurers Corner
The buyback window is a liquidity window, and it has dates. Treasury operations in the 10- to 20-year and 20- to 30-year sectors run at a minimum of $4 billion apiece from September 9 through November 4. Off-the-run long paper should trade with a better bid across those two months. If you hold seasoned long Treasuries you were planning to sell, that window is the better half of the quarter to do it in.
Cash and reinvestment still pay well and the bill is doing the work. With the funds rate at 3.50 to 3.75 percent and the 2-year at 4.19 percent, the reinvestment decision is nearly free of duration risk for the first time in this cycle. We would not extend the operating portfolio past two years to pick up the 50 basis points the long end is offering, because the volatility that comes with it is the same volatility that moved the 30-year 12 basis points in three sessions this week.
Piedmont Perspective
The Shock That Already Happened
Abridged from the standalone essay of the same title, published August 21. The full version carries the three figures, the axis arithmetic, the literature and the sources, and it is the version to send anyone who wants to argue with the conclusion.
A chart has been circulating that shows the corporate profit share of national income at a postwar high and the compensation share near a postwar low. It sits behind a great deal of what candidates in both parties now say about wages, and behind the assumption that the gain to capital came out of the paycheck. Our position is that the shift is real, the drawing overstates it, and the mechanism that caused it has already run its course.
Two of the three problems are in the drawing. The circulating version puts profits on a left axis spanning ten points and compensation on a right axis spanning twelve across the same vertical distance, so the profit swings are drawn about a fifth taller than the compensation swings. Roughly 16 percent of the profits in the numerator are earned abroad while all of the compensation is paid domestically. Put both series on one scale starting at zero and the decline is still real but smaller and slower than advertised: compensation from 67.1 percent of national income in 1980 to 61.7 percent in 2025, against a profit share up from 8.1 percent in 1982 to 16.5 percent.
The third problem is the seesaw itself, because factor shares do not sum to two. National income has six claimants, and net interest is the line nobody discusses. It fell from 9.8 percent of national income in 1982 to 0.6 percent in 2025 while the profit share rose 8.4 points. Profits and net interest together peaked in 2006 at 20.2 percent and now sit at 17.1 percent, below where they were in 1982. Capital's total claim on national income is not at a record. The large reallocation of the past forty years ran from creditors to owners, and disinflation did most of it.
What did move labor's share was a labor supply shock in the textbook sense, and the timing is the evidence. Essentially the entire decline happened between 2000 and 2010, from 65.9 percent to 61.9 percent, and China acceded to the World Trade Organization in December 2001. The global supply curve for labor moved out and to the right while demand for labor rose by much less. In the fifteen years since 2010 the compensation share has gone nowhere, ending 2025 at 61.7 percent. A shock that explains a decade of decline and then stops is a shock that finished.
The paycheck complaint is not imaginary, and it is a different complaint than the chart shows. Wages and salaries alone fell from 58.8 percent of national income in 1970 to 50.8 percent in 2025 while supplements rose from 7.7 percent to 10.9 percent. About half of what left the paycheck between 1970 and 2010 went into benefits rather than into profits, which is why a worker can be told the compensation share barely moved and still be right that the check feels smaller. Housing costs, long-term unemployment and the skills mismatch are the parts of the grievance that map onto the real economy.
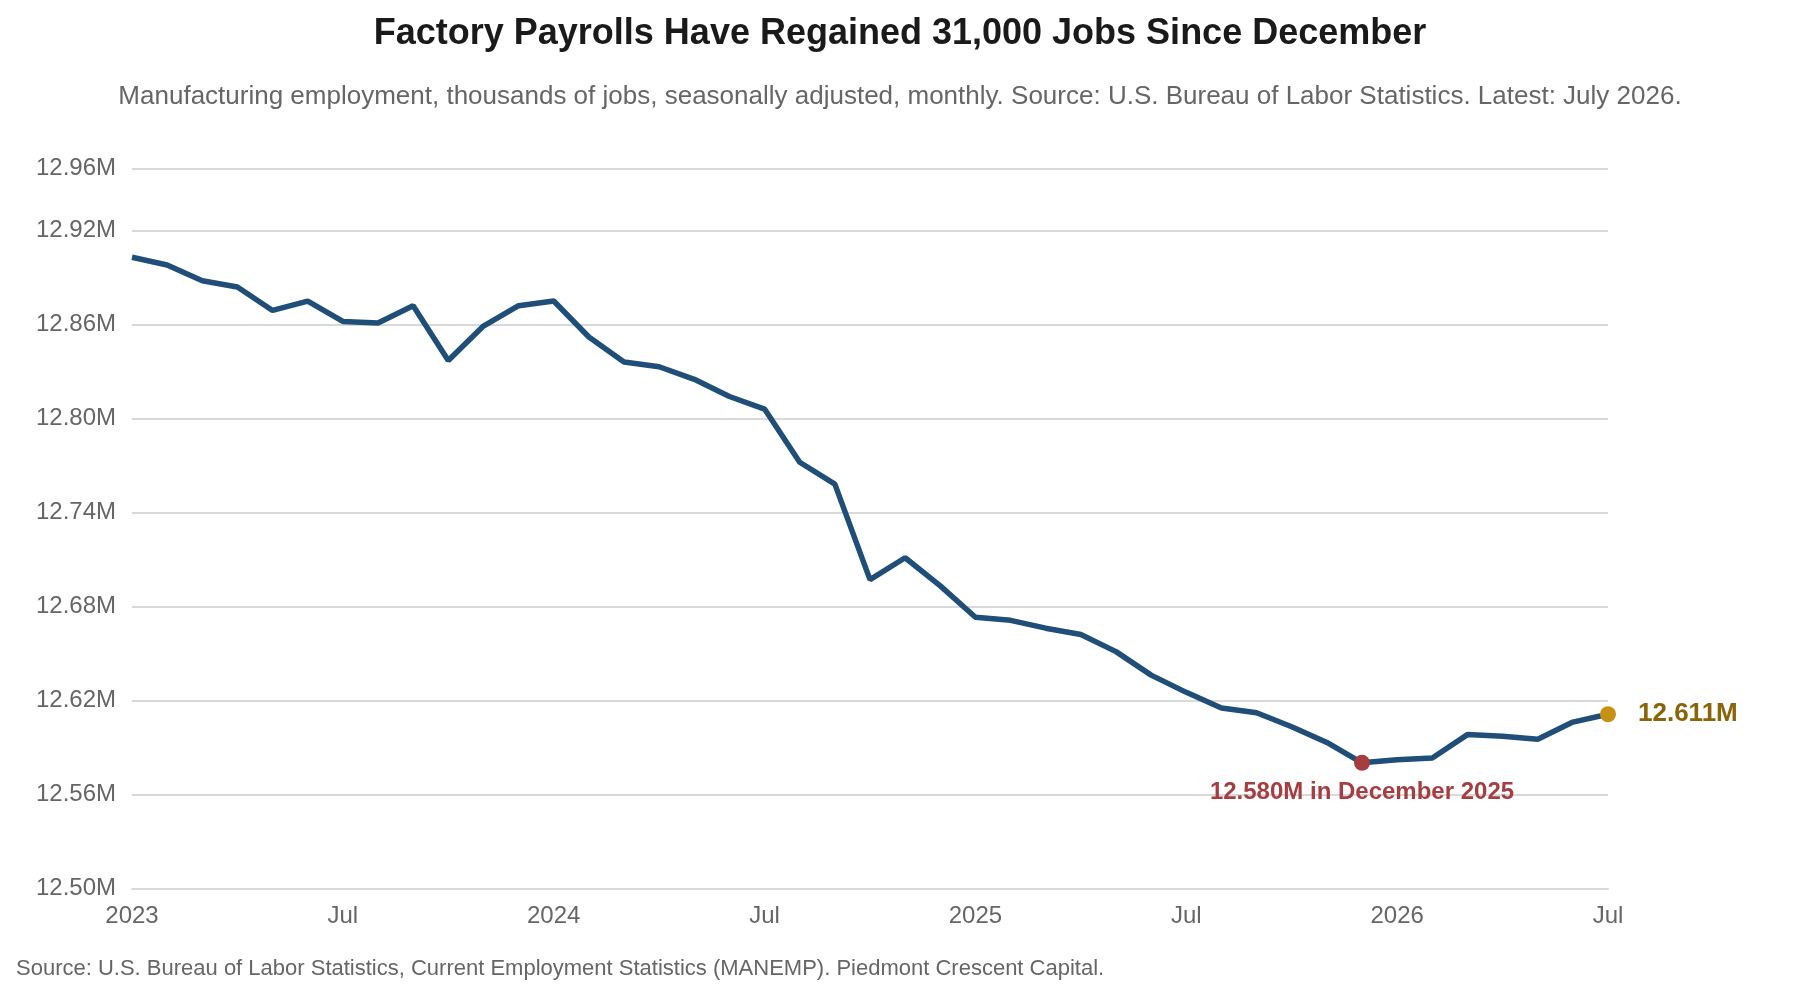
Figure 5 speaks to the worry underneath the policy response, which is that artificial intelligence is the next labor supply shock. Manufacturing employment bottomed in December 2025 and has added 31,000 jobs since, hiring intentions have broadened, and the cost of physical capital and long-term finance has risen rather than fallen. None of that is what the early stage of a labor-displacing shock looks like. Labor is now the scarce factor, the labor force is barely growing, and the only durable path to higher wages in that setting is more output per worker, which is precisely what a moratorium on the buildout would ration.
The call, with its check date and its breaking condition. We expect the compensation share of national income to be higher in 2027 than the 61.7 percent recorded for 2025, and the place to check is the annual national accounts revision each September. We are wrong if artificial intelligence turns out to be the next labor supply shock rather than a complement to scarce workers, or if the capital spending cycle breaks before the labor market tightens further. The second has started to become observable, and credit is where to watch it before the equity of the same companies. Investment-grade spreads widened to 81 basis points from 79 this week and high yield to 273 from 266, led from the bottom, with CCC weakness concentrated in bonds tied to the artificial intelligence buildout. That is the thread tying this essay to the long-end selloff described earlier in the issue.
The Week Ahead
Three of the entries below could move our call. We have marked them, along with what specifically would do the moving.
Monday, August 24. One to watch. No scheduled federal release, but Secretary Bessent holds a press conference at the Treasury Department in the afternoon covering the Iran sanctions package and the long-end yield strategy, and it is the likeliest venue for the fiscal consolidation he promised for “the end of this week, beginning of next week.” A specific package with numbers attached is the one thing that could take term premium out of the long end without help from oil. What would move us: a credible multi-year consolidation would pull our 30-year range lower and would be the first argument this year for extending duration. A press conference that announces a process rather than a number leaves the long end where it is, and we would read a second buyback increase in the absence of a fiscal number as confirmation that Treasury has nothing else to bring. Markets also open to the collapse of the Canada talks and 50 percent Section 338 tariffs in force since Saturday.
Friday, August 28. Chair Warsh at Jackson Hole, and one to watch. He delivers his first Jackson Hole keynote as Chair, expected mid-morning Eastern, on a program devoted to financial innovation and payments. What we would listen for, and what would move us, is set out in the special report published alongside this issue. In short: an explicit framing of the long-end selloff as a monetary problem rather than a fiscal one would be a change in the reaction function and would raise the odds of an earlier hike than our first-half 2027 call.
Friday, August 28. The payroll benchmark revision, and one to watch. The Bureau of Labor Statistics publishes its preliminary benchmark revision to the national Current Employment Statistics at 10:00 a.m., restating the level of payroll employment through March 2026 against unemployment insurance tax records. Consensus expects something small and positive, which would leave the labor market narrative where it is. What would move us: a large downward revision would mean this expansion has been even more employment-light than the establishment survey has shown, which strengthens the capital-led characterization. A large upward revision is the version that would give us trouble.
The rest of the calendar. Tuesday brings August consumer confidence. Wednesday is the heavy one: the second estimate of second-quarter GDP with corporate profits, the July personal income report with the core PCE deflator the Committee actually targets, and advance durable goods, all at 8:30. Consensus looks for something close to 0.1 percent on core PCE, and a print above 0.3 percent would be the first real evidence of energy pass-through. Thursday brings the Jackson Hole opening and weekly claims; Saturday, Week Zero. Then ISM and construction spending September 1, revised productivity September 3, the August employment report September 4, producer and consumer prices September 10 and 11, and the FOMC decision with a Summary of Economic Projections on September 16.
Special Report, Published Today
Also published this morning: The Speech and the Curve, a special outlook ahead of Jackson Hole. Chair Warsh delivers his first symposium keynote as Chair on Friday, nineteen days before the September meeting, and the report sets out what we think he is trying to accomplish, what the missing reaction function has cost so far in rate volatility and forecast dispersion, and the five things we would listen for. It also carries the Cleveland Fed decomposition showing that this year's rise in the 10-year is almost entirely a real-rate story with essentially no contribution from expected inflation, and it closes with what we would do about it in a funding calendar and a portfolio.
U.S. Economic & Financial Outlook
Sources and Notes
Sources. Bureau of Labor Statistics for consumer prices, payroll employment, average hourly earnings and initial claims; Census Bureau for advance retail sales and new residential construction; Federal Reserve Board H.15 for Treasury yields; Freddie Mac for the mortgage rate; U.S. Energy Information Administration for Brent; U.S. Department of the Treasury for the August 19 buyback announcement and debt totals; Home Depot, Lowe's, Walmart, TJX, Target and Ross Stores second-quarter releases; Kpler, Reuters and maritime risk monitors for Hormuz transits and war-risk premia; Federal Reserve Bank of Atlanta for GDPNow and Federal Reserve Bank of Philadelphia for the Survey of Professional Forecasters; Office of the U.S. Trade Representative and the Prime Minister of Canada for the August 22 Section 338 action.
Notes. Treasury yields and the mortgage rate are readings through Thursday, August 20; equity, energy and metals levels are Friday, August 21 closes. Our underlying inflation trend is a one-sided recursive Hodrick-Prescott filter on monthly annualized core CPI with the smoothing parameter set at 129,600 and the sample beginning in January 2000, so each published estimate uses only the data available at the time and never revises. Comparable sales figures are as reported by each company and are not adjusted to a common definition. The six GDPNow vintages plotted are the ones published for the third quarter, verified against the chain of dated commentaries; the model's root mean squared error since 2011 is 1.17 percentage points. All figures are subject to revision. This commentary is for informational purposes only and does not constitute investment advice.
Mark P. Vitner
President & Chief Economist, Piedmont Crescent Capital
mark.vitner@piedmontcrescentcapital.com · 704-458-4000
A View from the Piedmont is published weekly by Piedmont Crescent Capital for informational purposes only and does not constitute investment, legal, or tax advice. Views expressed are those of the author as of the date of publication and are subject to change.