
A View from the Piedmont — Previewing Warsh’s Jackson Hole Speech
The Speech and the Curve
A special outlook ahead of Jackson Hole. Chair Warsh has removed the Committee's guidance on purpose and Secretary Bessent has stepped into the long end on purpose, and Friday is the first chance anyone has had to hear what the first of those two is for.
Chair Warsh delivers his first Jackson Hole keynote on Friday morning, nineteen days before the September meeting, and he does it into a bond market that has stopped being sure what he is for. He took office on May 22. The market has three months of votes, one press conference and one round of testimony to read him by, and in that time the 30-year has closed at or above 5 percent for thirty-four consecutive sessions and touched 5.34 percent on Tuesday, a level last seen in June 2007. This report sets out what we think he is trying to accomplish, what the evidence says it has cost so far, and the five things we will listen for on Friday. The companion weekly published this morning carries the week's data, the latest on the strait, the consumer and the market dashboard.
Also published today: The Long End Does the Tightening, this week's View from the Piedmont, which carries the week's data, the latest on the strait, the consumer and the market dashboard.
What the Chair Is Trying to Accomplish
Our read on Chair Warsh's objectives is that he wants to move policy off the crisis footing it has held since 2008. The Federal Reserve has spent eighteen years running a policy built for emergencies, first the financial crisis and then the pandemic, and the balance sheet still carries $6.75 trillion of the evidence. If policy takes on a more normal tenor, rates settle higher than anything markets have been accustomed to since 2007. The 30-year touching 5.34 percent on Tuesday, a level last seen in June of that year, is what that transition looks like from the inside. The Warsh Fed appears set on exorcising the ghosts of two once-in-a-century events, and policymakers would do well to remember that the restless spirits are in the here and now, around sovereign debt in the western democracies and in Japan. How do you end crisis-driven monetary policy without triggering the next crisis?
There are now two principals acting on the long end and they hold opposite theories of how a bond market should form prices, which is a new fact and an underrated one. Chair Warsh has withdrawn forward guidance deliberately. He declined to submit a dot in the June projections, having encouraged his colleagues to submit theirs, cut the June statement to 130 words from 341 in April, and told the July press conference that market participants are “learning to play the ball, not the referee,” and that by not “spoon-feeding markets, by not previewing our decisions, by not sort of giving nudges and leans,” the Committee gets the market’s own judgment back instead of an echo of its own forecast. Secretary Bessent has moved the other way. He doubled long-end buybacks on Wednesday, said the next day the number “could be more than the $4 billion per issue,” and framed the purpose as signaling: “We believe that the yields don't reflect the underlying fundamentals.” He describes his own role as being “the nation's top bond salesman” and Treasury yields as “a strong barometer for measuring success.” One official is trying to take his own footprints out of the price. The other is trying to put his in. Investors are pricing a curve on which both are true.
What It Has Cost So Far
Mark Zandi made the sharpest version of the first half of this argument on August 2, and we think he is right about the mechanism and early on the evidence. His post held that the risk to the economy is not the level of the funds rate but the Committee's unwillingness to provide “even a modicum of forward guidance — or a broad sense of their reaction function,” that most meetings will therefore be live and investors “left guessing and repeatedly wrong-footed,” and that this “means more volatility in bond and stock markets, which is likely already reflected in a larger term premium, rising long-term interest rates, and a wobbly equity market.” The mechanism is sound. The evidence, when we go and get it, says something more specific and more useful.
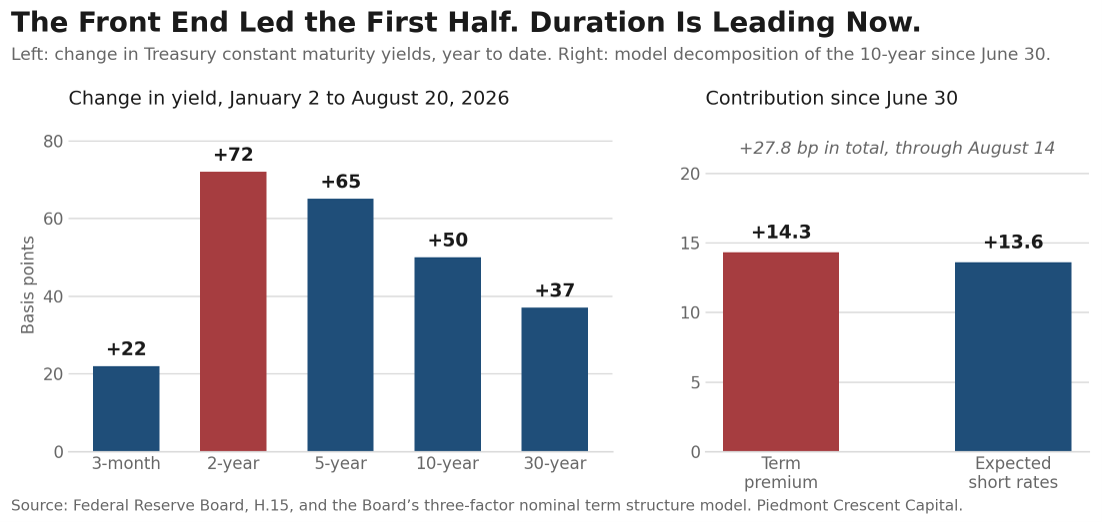
Start with the term premium, because it did not do the work he assigns it, at least not until midsummer. On the Federal Reserve Board's own three-factor model, the 10-year term premium was 0.84 percent on August 14. That is positive and it is not extreme; the series has ranged from negative 0.66 percent in 2020 to 2.52 percent in 1992. More to the point, the first half of this year was a front-end story rather than a duration story. The 2-year rose 72 basis points against 37 at the 30-year, which is a market taking out any further rate cuts and repricing the odds of a hike, not one demanding compensation for term. It is only since June 30 that the split changes: of the 28 basis points the 10-year has added since then, the model attributes roughly half to term premium and half to expected short rates. Zandi's channel is opening. It is not what moved the market in the first half, and dating it correctly matters, because the cure for a policy-expectations problem and the cure for a term-premium problem are not the same. Figure 1 shows both halves of that, and the shift between them is the whole of the argument about what the missing reaction function has cost.
Now take the volatility claim, which is where the received story is wrong and where the correction is more interesting than the claim. The MOVE index, which prices implied volatility in Treasuries, closed the week near 73. Its typical range in a normal decade is 90 to 110, and it ran above 150 through 2022 and 2023. By level, the Treasury market is calm. But it is the only cross-asset volatility gauge higher on the year, up roughly 15 percent, and it rose 6 percent this week. The VIX made a 2026 low at 14.25 in the same stretch, with the S&P 500 up 12 percent for the year. Equity volatility is falling while rate volatility is rising. That is not “a wobbly equity market.” It is a bond market that has become less sure of itself while the equity market has become more so, and the divergence is the cleanest evidence available that the uncertainty in question is specifically about policy and specifically about the curve.
The better test of disagreement is not volatility at all, it is dispersion, and there the evidence is stronger than anyone has made it. Reuters polled 22 bond strategists between August 6 and 11. The median had the 10-year at 4.50 percent in three months, which is 19 basis points below where it currently sits. Eighteen of the twenty-two said the risk to their own number was to the upside. That is not a distribution of views. That is a profession that does not believe its own consensus, and it is what you would expect from forecasters asked to predict a Committee that has stopped describing how it decides crucial policy debates. Mark Cabana of Bank of America put the cost in one line: “There is literally a price to be paid for the lack of guidance — higher interest rates and a higher cost to taxpayer.”
Why Long Rates Have Risen
The decomposition on the week points to inflation compensation rather than term premium. The 5-year TIPS breakeven rose 10 basis points to 2.34 percent and the 10-year rose 7 basis points to the same level, while the nominal 30-year fell 2 basis points and the 2s-30s spread narrowed 4 basis points. Read those together and the marginal investor spent the week marking up expected inflation, mostly on oil and to an even greater extent diesel and jet fuel staying higher for longer, and taking a little back out of the real term premium after the buyback news.
Take the year rather than the week, however, and the answer inverts, and it is the single most useful fact we can put in front of a client right now. The Federal Reserve Bank of Cleveland publishes a decomposition of the nominal Treasury curve into an expected inflation component and a real interest rate, estimated from yields, inflation swaps and surveys. Figure 2 plots it for the 10-year through August. The expected inflation piece has gone from 2.33 percent in January to 2.49 percent in August, a gain of 16 basis points. The real interest rate has gone from 1.67 percent to 2.20 percent, a gain of 53. The market decomposition says the same thing without a model: the 10-year TIPS real yield has risen 44 basis points this year while the 10-year breakeven has fallen 6. Cleveland's inflation risk premium is unchanged on the year at 44 basis points. This year's rise in long-term interest rates has essentially nothing to do with expected inflation. The Committee's own minutes said so twice, in June and again in July, when the staff reported that higher nominal yields “reflected higher real rates” while longer-term inflation compensation “remained stable and consistent with the Committee's 2 percent longer-run inflation objective.”
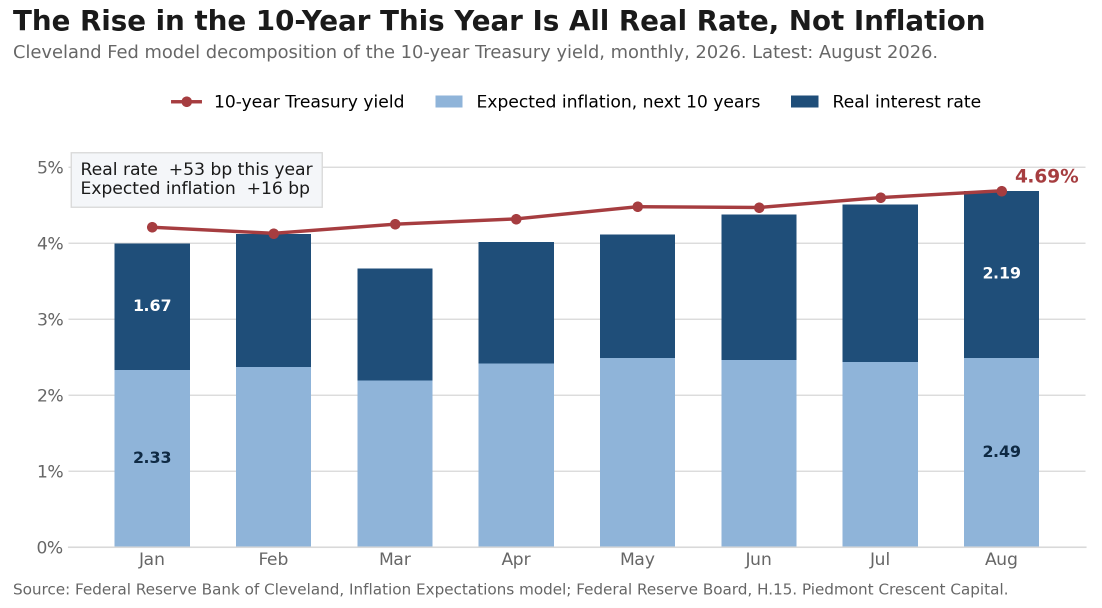
That reframes the question from what people expect prices to do to what they demand for lending long, and those are separate arguments with separate cures. An inflation-compensation problem is a central bank problem and the Committee has a tool for it. A real-rate problem is a supply-of-savings problem, and the three claimants on that supply are the ones we listed at the top: a federal government borrowing $2 trillion a year, an energy shock that raises the real cost of everything that moves, and a capital program in artificial intelligence that has issued $220 billion of hyperscaler debt through August 10 against $12.5 billion in the same period last year. Neither the funds rate nor a buyback operation is a tool for that. We would put it plainly: the long end is not asking the Federal Reserve for anything. It is asking to be paid more for term, and it is asking three separate borrowers at once.
The Collision Nobody Has Priced
And there is a collision coming that neither institution has acknowledged. One of Chair Warsh's five task forces is examining the ample-reserves regime and the composition of the portfolio, and a Fed moving toward a shorter, more market-neutral balance sheet would push duration out of the central bank and into private hands. That is Operation Twist run backwards, and it steepens the curve and raises the term premium. Treasury, at the same moment, is buying long duration back in through the buyback window. The two arms of the government would be trading against each other in the same maturity, the Federal Reserve supplying duration and Treasury retiring it. We do not think this is deliberate on either side and we do not think it is priced. If Chair Warsh says anything on Friday about the maturity composition of the portfolio, that is the sentence to read twice.
So we would restate the proposition in a form that can be scored. A missing reaction function raises the price of duration, and the evidence should appear first in rate volatility and forecast dispersion, then in the term premium, and only last in the level of long-term yields. On that ordering we are one stage further along than the commentary assumes: dispersion is extreme, rate volatility is rising against falling equity volatility, and the term premium has been contributing about half the move since June 30 after contributing essentially none before it. The number to watch is not the 30-year. It is the MOVE index, and our marker is that it holds above 70 through the September meeting. If Chair Warsh uses Friday to describe how the Committee decides rather than what it will decide, that number falls and the long end gets a bid without anyone having to buy a bond.
Five Things to Listen For on Friday
One. Any description of the reaction function, as distinct from forward guidance. These are not the same thing and the distinction is the whole argument. Forward guidance tells the market what the Committee will do. A reaction function tells the market how it decides, which is what allows anyone to price the next meeting without being told the answer. Governor Waller has drawn that line publicly. If the Chair draws it too, and names the two or three series he weighs most heavily, that is the single most consequential sentence available to him, and it is worth more to the long end than another buyback announcement.
Two. The maturity composition of the portfolio, not just its size. One of the Chair's five task forces is examining the ample-reserves regime and the composition of the balance sheet. The New York Fed's survey of market expectations now has the median participant looking for a $7.1 trillion balance sheet at the end of 2028 against $6.75 trillion today, down from $7.3 trillion expected in April. A Fed that shortens its own portfolio pushes duration into private hands, which steepens the curve and raises the term premium. That would be Operation Twist run backwards, and it would run directly against what Treasury is doing at the same moment.
Three. Whether he characterizes the long-end selloff as a monetary problem or a fiscal one. He has already said that nominal and real yields are materially higher across the curve and that some of the increases are among the most significant in two decades. The question is whose problem he says that is. If he frames it as a monetary problem, the reaction function has changed and the odds of a hike earlier than our first-half 2027 call go up.
Four. The meeting calendar. There is a live discussion of moving from eight scheduled meetings a year to six beginning next year, on the argument that more information accumulates between meetings and policymakers get more time on strategy. Six meetings instead of eight would change how this Committee is read more than anything in the September statement, because it lengthens the interval over which the market has to price policy with no official input at all.
Five. Anything on the inflation target itself, or on how inflation is measured. Inflation has run above 2 percent for more than five years. The Chair said in July that some in financial markets had formed a misimpression that central bankers were tolerant of a somewhat higher target. A task force is examining the data the Committee relies on. We would not expect a framework announcement at a symposium devoted to payments, but a sentence on measurement would travel a long way.
What We Would Do
For borrowers with a capital program, fund the tranche you are sure about before Friday and leave the optional tranche until after September 16. Thirty-year paper at 5.23 percent against a 2-year at 4.19 puts 104 basis points of pickup on the table for the last twenty-eight years of a curve that has repriced in one direction all year. The case for waiting rests on a fiscal package the administration has promised and not delivered and on a speech nobody has read. Neither is a financing plan.
For portfolios, we would stay cautious on duration and own the belly rather than the long bond. The three arguments pushing on thirty-year paper are fiscal, energy and the private credit demand behind the artificial intelligence buildout, and none of the three is waiting on the Committee. We would not extend an operating portfolio past two years to pick up the fifty basis points the long end is offering, because the volatility that comes with it is the same volatility that moved the 30-year 12 basis points in three sessions this week.
For anyone whose plan depends on lower mortgage or corporate borrowing costs in 2027, build the plan without them. Our outlook has the 10-year at 4.70 percent and the 30-year fixed mortgage holding 6.60 percent through 2027, with the funds rate moving up rather than down. A 2027 budget built on a cut is a budget built on a forecast we do not hold, and the long end is the part of the curve that prices the borrowing, not the part the Committee controls.
And for reading Friday itself, watch the rates market rather than the equity market. Equity volatility is at a 2026 low and equity investors have largely stopped pricing policy risk. Rate volatility is the only cross-asset gauge higher on the year. If the speech clarifies the reaction function, the first evidence will be in implied volatility and in the dispersion of strategist forecasts, and only later in the level of the 30-year.
Our call, put down in a form that can be scored. We expect a hold on September 16, no cut in 2026 and a first hike in the first half of 2027, and we expect the 30-year to trade between 5.00 and 5.40 percent through the September meeting. We expect the MOVE index to hold above 70 through that meeting, which is the cleanest available test of whether the missing reaction function is costing the Treasury market anything. What would move us: an explicit framing of the long-end selloff as a monetary problem rather than a fiscal one, or a credible multi-year fiscal consolidation the market believes. Check us on all of it the week of October 5.
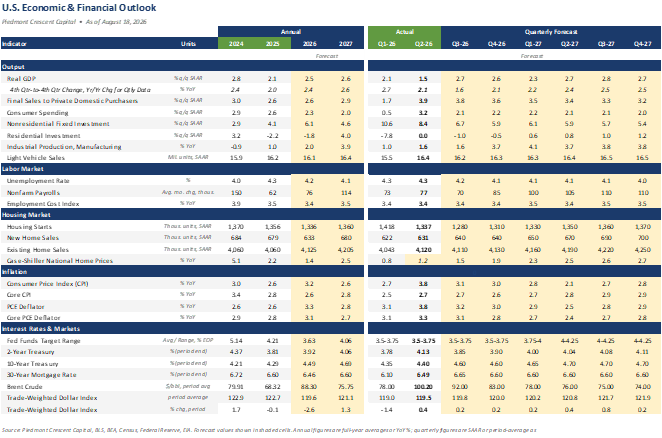
U.S. Economic & Financial Outlook
Sources and Notes
Sources and notes. Federal Reserve Board H.15 for Treasury yields and the three-factor term premium; Federal Reserve Bank of Cleveland Inflation Expectations model for the decomposition in Figure 2; the July 29 FOMC press conference transcript and the June and July minutes; Chair Warsh's July 14 testimony; the New York Fed Survey of Market Expectations; Federal Reserve Bank of Kansas City for the symposium program; ICE BofA MOVE index and Cboe for volatility; Reuters poll of bond strategists conducted August 6 to 11; U.S. Department of the Treasury for the August 19 buyback announcement; Mark Zandi, post of August 2, 2026, as carried by Benzinga, Yahoo Finance and Business Insider. The Cleveland Fed decomposition is a model estimate and its components do not sum exactly to the nominal yield; in August the sum lands within a basis point of the 10-year and in March it was 58 basis points below, and we cross-check the conclusion against TIPS, which are exactly additive and say the same thing. Term premium estimates differ materially by model and we have not mixed them. All figures are subject to revision. This report is for informational purposes only and does not constitute investment advice.
Mark P. Vitner
President & Chief Economist, Piedmont Crescent Capital
mark.vitner@piedmontcrescentcapital.com · 704-458-4000
Piedmont Special Reports are published by Piedmont Crescent Capital for informational purposes only and do not constitute investment, legal, or tax advice. Views expressed are those of the author as of the date of publication and are subject to change.