
The Shock That Already Happened
The Piedmont Perspective
The Argument in Brief
- The chart making the rounds is directionally right and analytically loose. The shift in factor shares is real, but the drawing exaggerates it and the two shares plotted do not sum to one.
- National income has six claimants, not two. In 2025, compensation took 61.7% and corporate profits 16.5%. The remaining 21.8% went to proprietors’ income, rental income, net interest and production taxes.
- The largest reallocation of the past forty years ran from lenders to owners. The profit share rose 8.4 percentage points between 1982 and 2025 while the net interest share fell 9.2 points, from 9.8% of national income to 0.6%. Capital’s combined claim is below where it stood in 1982.
- The timing is the strongest evidence for a labor supply shock. Essentially the whole decline in the labor share happened between 2000 and 2010, from 65.9% to 61.9%, bracketing China’s WTO accession in December 2001. The share has gone nowhere in the fifteen years since.
- The shock is reversing. China’s working-age population has fallen by roughly 60 million since 2015 and the U.S. labor force has contracted by roughly a million people over the past twelve months, against business fixed investment growing at a double-digit pace.
- The call, with a check date. We expect the compensation share of national income to be higher in 2027 than the 61.7% recorded for 2025, and we will check it against the annual national accounts revision each September.
A chart has been making the rounds showing the corporate profit share of national income at a postwar high and the compensation share near a postwar low. The two lines cross in the middle of the last decade and separate afterward, and the caption asks whether we should celebrate the triumph of capitalism or be fearful. Our answer is neither. The shift is real, the best explanation for it is a labor supply shock that has already run its course, and the chart being passed around is drawn in a way that makes the shift look larger and tidier than it is.
Start with the drawing, because everything after it depends on reading the chart correctly. The two lines sit on two different vertical axes. Corporate profits are measured on the left scale and employee compensation on the right, and neither line can be read against the other’s numbers. In the circulating version, the left axis runs from 8% to 18% and the right axis from 60% to 72%. Those are spans of ten and twelve percentage points across the same vertical distance, so a one-point move in the profit share is drawn about a fifth taller than a one-point move in the wage share. The apparent mirror image is partly a choice about where to put the tick marks. Figure 1 redraws the same series with both axes set to an identical twelve-point span, which is the right way to build a two-axis chart. The mirror image survives, which is why the chart deserves to be taken seriously, but its implications are a good deal less dramatic.
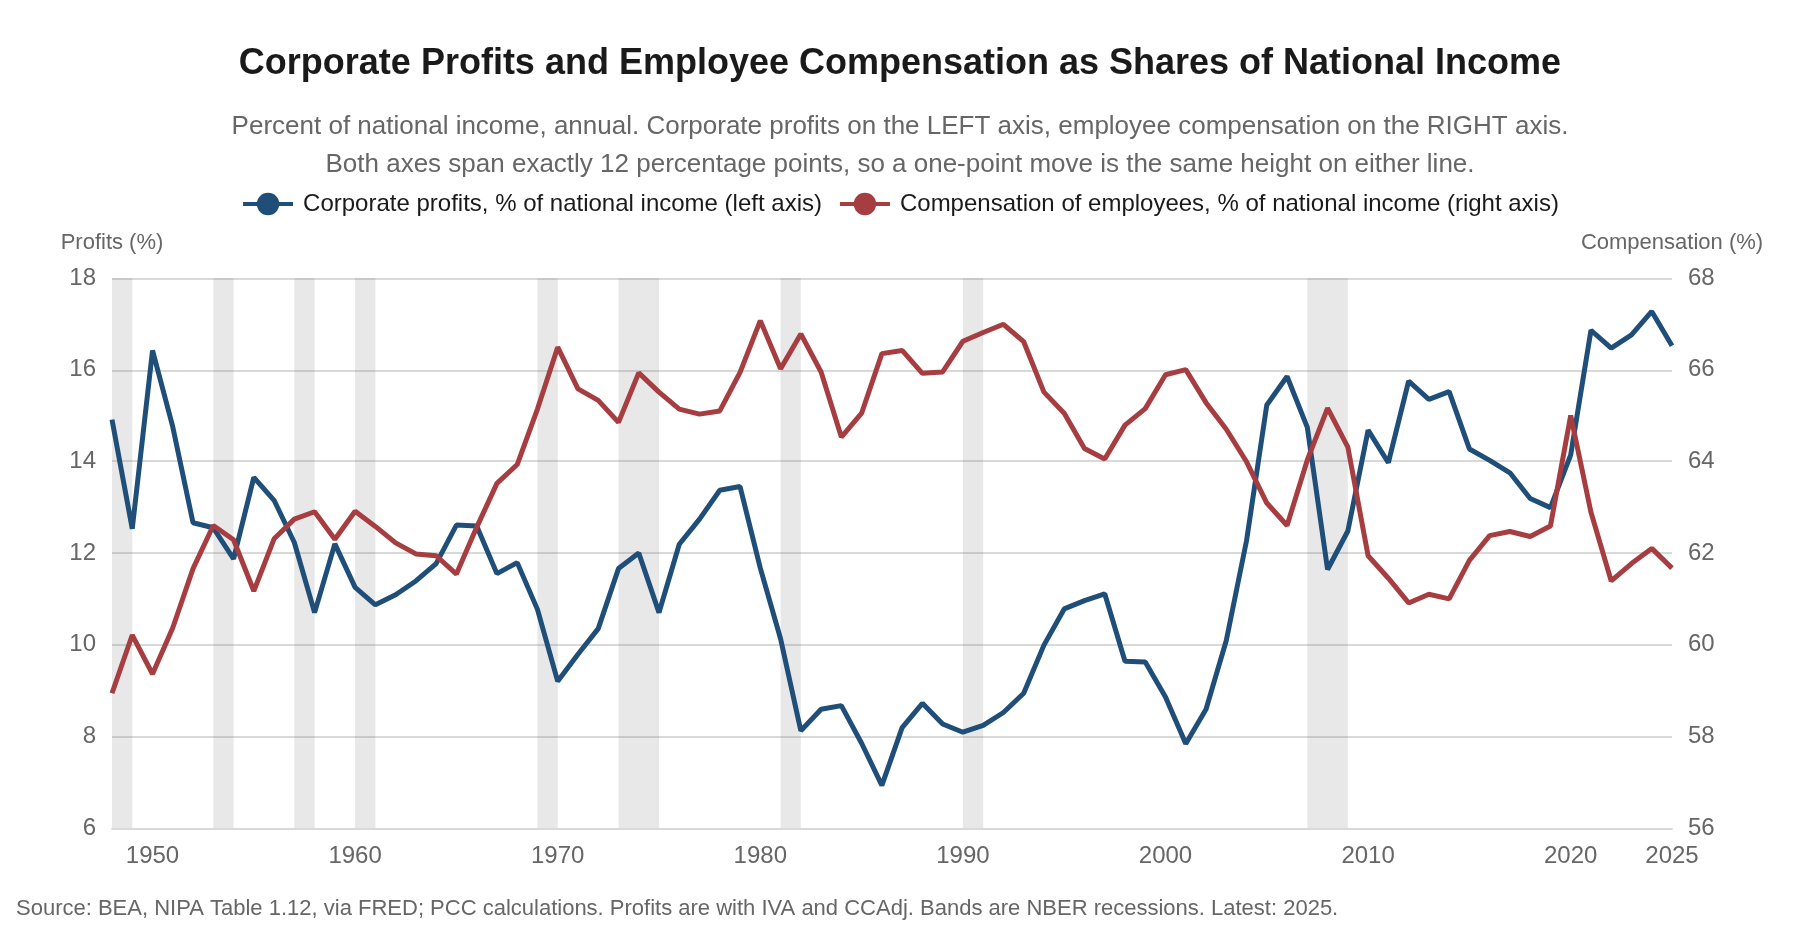
Figure 2 puts both series on a single scale starting at zero, and this is the version we show clients. The compensation share fell from 67.1% in 1980 to 61.7% in 2025. The corporate profit share rose from 8.1% in 1982 to 16.5% in 2025, and reached a postwar annual high of 17.3% in 2024. Through the first quarter of 2026, the most recent quarter for which the Bureau of Economic Analysis publishes profits, the two stood at 61.0% and 18.0%. Those are large moves, but they are not the near-perfect seesaw the two-axis version suggests.
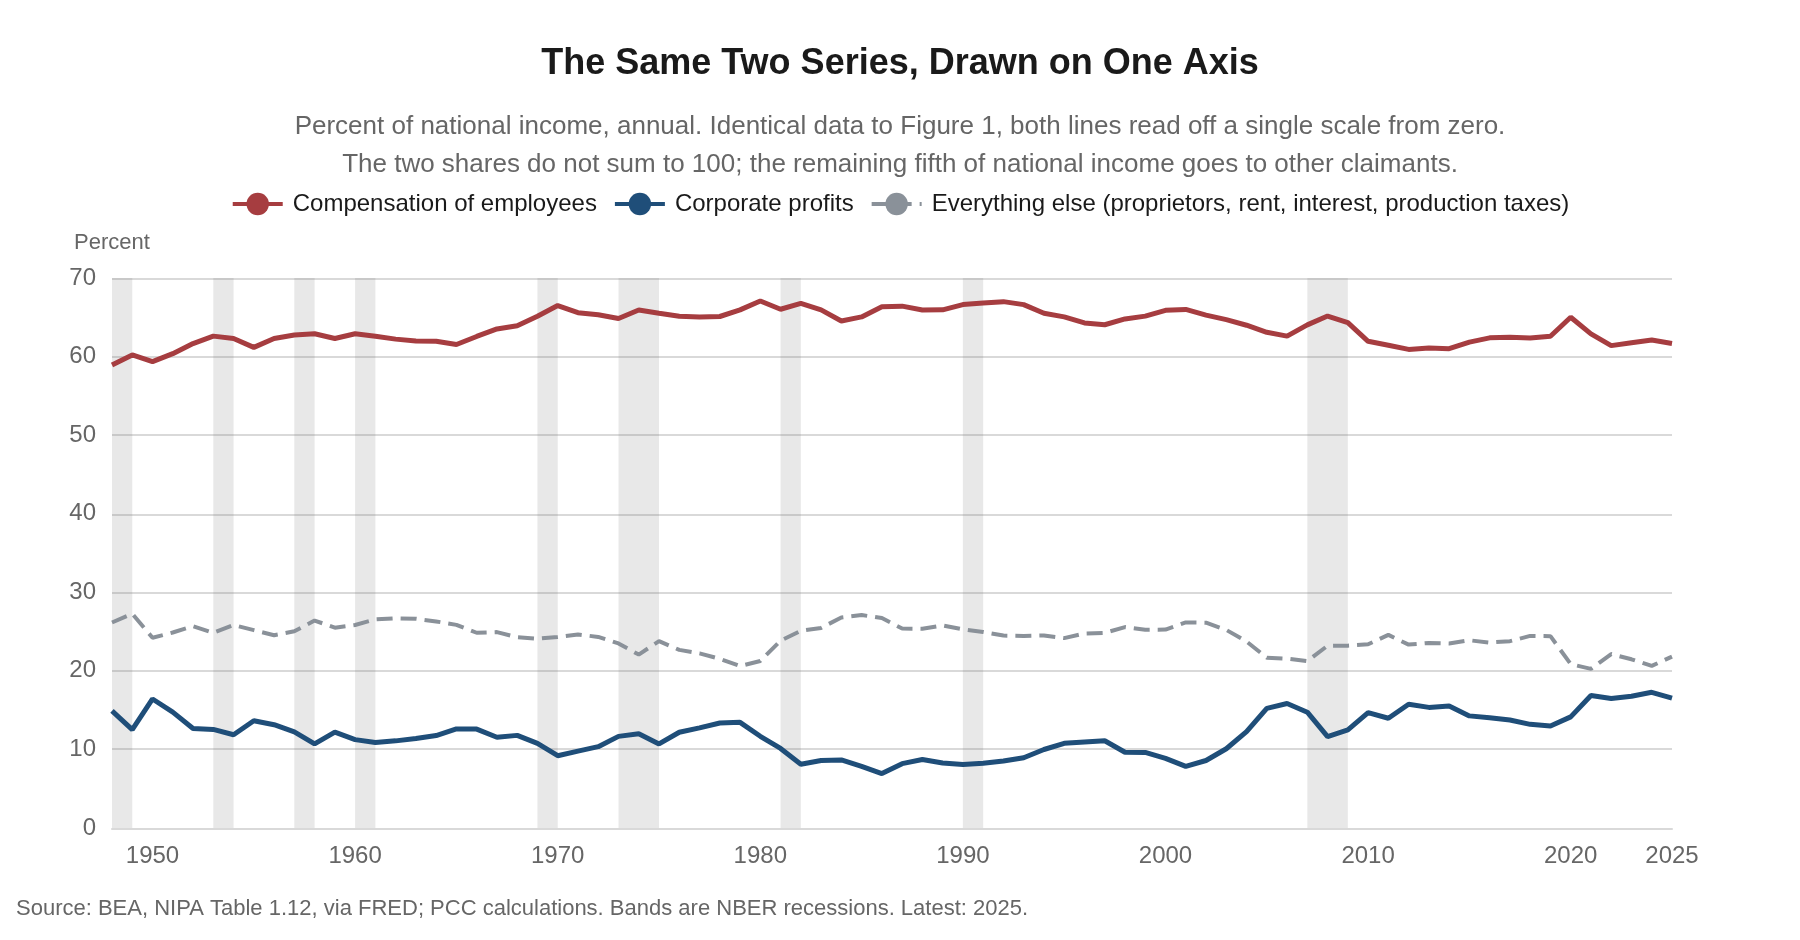
The seesaw framing also invites an accounting error that we have made ourselves. Factor shares do sum to one, but there are more than two factors. National income has six claimants, not two. In 2025, compensation of employees took 61.7% and corporate profits took 16.5%. The remaining 21.8% went to proprietors’ income at 8.3%, rental income of persons at 4.4%, net interest at 0.6%, and taxes on production and imports less subsidies, business transfer payments and the surplus of government enterprises at 8.6% combined. A falling labor share does not mechanically become a rising profit share, and the difference has to go somewhere.
Most of it went to a reshuffling inside capital income rather than a transfer from workers to shareholders. Corporate profits and net interest are the two lines in the accounts that provide returns to capital, one to owners and one to lenders. Their sum was 17.9% of national income in 1982, peaked at 20.2% in 2006, and was 17.1% in 2025. Capital’s combined claim is below where it stood forty-three years ago and well below its 2006 peak. What changed is the split. The profit share rose 8.4 percentage points between 1982 and 2025, and the net interest share fell 9.2 points over the same stretch, from 9.8% of national income to 0.6%. The entire increase in what accrues to owners is more than accounted for by the decline in what business pays its lenders.
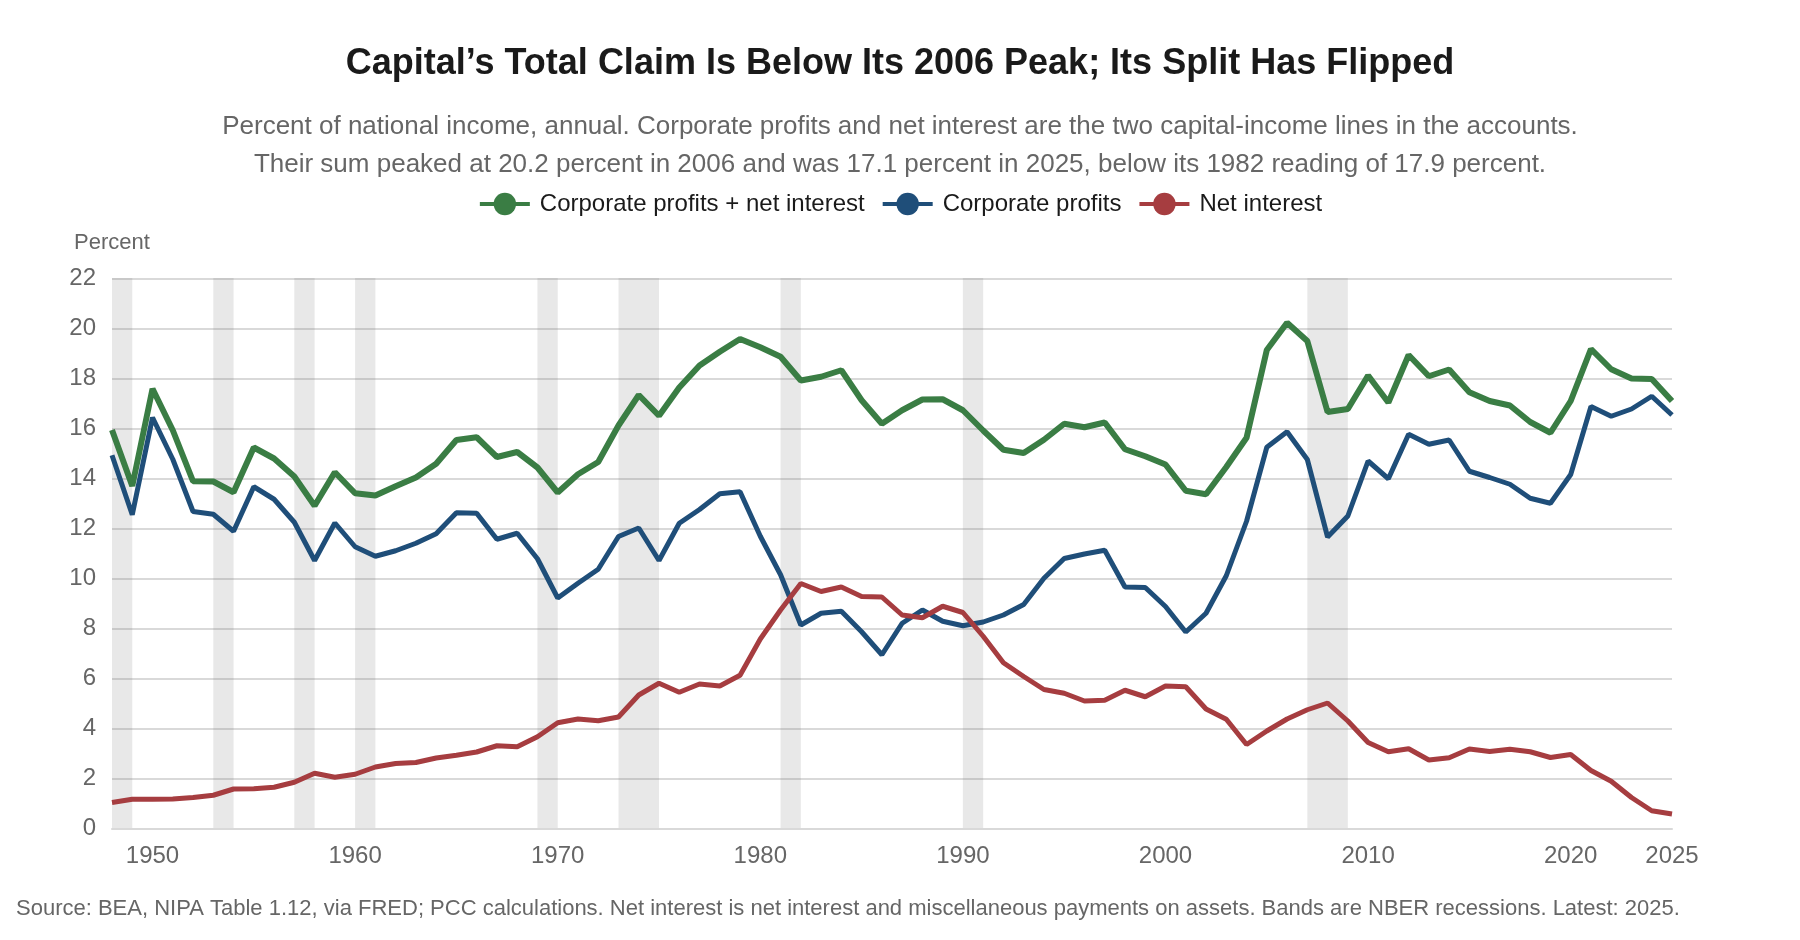
Nothing in that owes anything to a bargaining story about workers. Disinflation stripped the inflation premium out of nominal interest rates, and the 1982 figure reflects an interest bill priced off double-digit yields. Corporate balance sheets reduced leverage through the 1990s and again after 2009. Since 2022, high short rates have made the corporate sector a large receiver of interest income on its own cash, which nets against what it pays out. Whatever the mix, the dollars that used to leave the firm as interest now stay inside it as profit. That is a transfer from creditors to owners, and the household that owns a bond fund is on the losing end of it.
Rental income of persons is the other mover, up from 0.6% of national income in 1990 to 4.4% in 2025. Most of that line is imputed rent on owner-occupied housing, which is the accounts’ estimate of what homeowners would pay themselves in rent. Matthew Rognlie made this point in 2015 in a Brookings paper answering Piketty, finding that the rise in the net capital share was concentrated almost entirely in housing. That income accrues to roughly two-thirds of American households, not to a shareholder class.
What triggered the decline in the returns to labor was a labor supply shock in the textbook sense. The rise of China and, to a lesser extent, the other industrializing economies pushed the global supply curve for labor out and to the right while raising demand for labor by much less. Returns to labor fell across the developed world as a result, including in the U.S. Output is a function of capital and labor, and when the effective global supply of labor roughly doubles while the capital stock does not, the marginal product of labor falls relative to the marginal product of capital, and the split of income follows the marginal products.
The timing is the strongest evidence for it. Essentially the entire decline in the labor share happened between 2000 and 2010, from 65.9% to 61.9%. China joined the World Trade Organization in December 2001. In the fifteen years since 2010 the compensation share has gone nowhere, ending 2025 at 61.7%, a quarter of a point below where it started the decade. Whatever caused the fall stopped causing it around the time the import surge matured.
The academic literature is mixed on this point. Autor, Dorn, Katz, Patterson and Van Reenen, in the 2020 Quarterly Journal of Economics paper that gave us the superstar-firms hypothesis, included a China-shock variable in their industry regressions and found that Chinese import exposure had little explanatory power for the cross-industry variation in the fall of the labor share within manufacturing. If anything the coefficient ran the other way, with more exposure predicting a slightly higher labor share, though usually short of significance. Grossman and Oberfield, surveying the whole field for the Annual Review of Economics, concluded that after more than 12,000 research projects the profession still does not have a firm grip on why the labor share fell, and that the candidate explanations, taken together, account for several times the decline that actually occurred.
We do not think the null result refutes the mechanism, for the reason Grossman and Oberfield themselves raise against the cross-sectional literature. A regression across industries asks whether the industries hit hardest by imports lost more labor share than the industries hit least. That test holds the economy-wide wage fixed. A labor supply shock does not work that way. It works through the wage itself, which is set in a national labor market and falls, relative to the return on capital, in every industry at once. Differencing across industries subtracts out precisely the effect you are trying to measure. The industries with the lowest returns to labor were likely the least productive and the ones most exposed to China’s emergence. The industries that survived produced higher returns to labor, but for a much smaller workforce. The literature’s failure to find the China shock in the cross section is close to what the general equilibrium story predicts.
The aggregate figure is also a poor guide to any individual’s experience. Labor is not a homogeneous input. It combines physical effort and human capital, and the workers whose skills sit where the United States retains a comparative advantage have done well. The line to draw is not skilled against unskilled. It runs between work that can be performed somewhere else and work that cannot. A radiologist’s reading can cross a border and a lineman’s splice cannot, and the capital-led buildout now underway is bidding hard for electricians, pipefitters and substation crews who are in fixed supply. The aggregate share describes an average that fewer and fewer workers actually experience.
Part of the gap between the statistic and the paycheck is measurement, and it cuts the other way from what people assume. The compensation line on the chart includes employer contributions for health insurance, pensions and social insurance. Wages and salaries alone fell from 58.8% of national income in 1970 to 50.8% in 2025, a drop nearly twice as large as the one in total compensation, because supplements rose from 7.7% to 10.9% over the same period. About half of what left the paycheck between 1970 and 2010 went into benefits rather than out of labor’s hands. It is labor income in the accounts and it does not feel like income on payday, which is a fair description of an employer-paid health premium.
How the statisticians split proprietors’ income between labor and capital accounts for about a third of the apparent aggregate decline, by the estimate of Elsby, Hobijn and Sahin. The geography of the two lines differs as well, since 15.7% of the corporate profits in the numerator of that first line were earned outside the United States in 2025 while essentially all of the compensation in the second was paid inside it. The two lines are not measuring the same economy, which is one more reason not to read them as a zero-sum split.
If a labor supply shock caused the fall, then the mechanism should run in reverse when the supply shock reverses, and it is reversing now. China’s working-age population peaked in 2015 on the standard 15 to 64 measure and has fallen by roughly 60 million since. Here, the labor force has contracted by roughly a million people over the past twelve months, and Federal Reserve staff research puts trend labor force growth below 10,000 a month. Set that against business fixed investment growing at a double-digit pace and an economy at full employment, and the configuration is the mirror image of 2001. Capital is abundant and being deployed at scale, and labor is the scarce factor. When one input is scarce relative to the other, its return rises. That is the ordinary implication of a production function rather than a claim about fairness, since the marginal product of the scarce factor increases relative to the abundant one and the split of income follows. Firms that need electricians, process engineers and plant technicians are already bidding for them. The same arithmetic that pressed labor’s share down when global supply surged is the arithmetic that should press it back up as that supply tightens.
We expect the compensation share of national income to be higher in 2027 than the 61.7% recorded for 2025, and we will check it against the annual national accounts revision each September. We would be wrong if artificial intelligence turns out to be the next labor supply shock rather than a complement to scarce workers, which is the risk to this view we watch most closely. The more recent evidence does not yet support that reading. The ISM manufacturing employment index moved back into expansion in July for the first time in 33 months, and 60% of panelists reported that their companies are hiring against 40% still managing head counts. At the same time the cost of physical capital and of long-term finance has risen. Those are the conditions under which the return to scarce labor rises. We would also be wrong if the capital spending cycle breaks before the labor market tightens further, which is the mechanism by which a 30-year real yield near 3% eventually rations projects.
As to whether we should celebrate or be fearful, the question assumes a scoreboard. Factor shares are an accounting split of a growing pie, and a rising profit share funds the capital spending that raises output per worker, which is the only durable source of higher real wages. What is worth worrying about is whether the investment that a rising profit share finances actually shows up in productivity, because the alternative to a capital-led expansion, at a moment when the labor force is not growing at all, is no expansion.
The bottom line is that the chart is directionally right and analytically loose. Two axes with different spans exaggerate a real move, the two shares plotted do not sum to one, and the largest single reallocation over the past forty years ran from lenders to owners rather than from workers to owners. The labor supply shock explanation holds up better than the cross-sectional literature suggests, for reasons that literature acknowledges about itself. And it has already happened. The next decade poses the opposite problem, and businesses building capacity into a shrinking labor force should be planning for the factor shares to move back toward labor, not further away from it.
Mark P. Vitner
President & Chief Economist, Piedmont Crescent Capital
mark.vitner@piedmontcrescentcapital.com · 704-458-4000
Sources: U.S. Bureau of Economic Analysis, National Income and Product Accounts Table 1.12, retrieved from FRED; U.S. Bureau of Labor Statistics; Federal Reserve Bank of New York, “The Post-COVID Decline in the Labor Share,” June 2026; David Autor, David Dorn, Lawrence Katz, Christina Patterson and John Van Reenen, “The Fall of the Labor Share and the Rise of Superstar Firms,” Quarterly Journal of Economics, 2020; Gene Grossman and Ezra Oberfield, “The Elusive Explanation for the Declining Labor Share,” Annual Review of Economics; Michael Elsby, Bart Hobijn and Ayşegül Şahin, “The Decline of the U.S. Labor Share,” Brookings Papers on Economic Activity, 2013; Matthew Rognlie, “Deciphering the Fall and Rise in the Net Capital Share,” Brookings Papers on Economic Activity, 2015; and Piedmont Crescent Capital calculations. Shares are each component of national income divided by national income, annual data through 2025 and quarterly data through the first quarter of 2026. Corporate profits are stated with inventory valuation and capital consumption adjustments. This commentary is published by Piedmont Crescent Capital for informational purposes only and does not constitute investment, legal, or tax advice. Views expressed are those of the author as of the date of publication and are subject to change.