
ECONOMIC INDICATOR REPORT · COUNTY EMPLOYMENT AND WAGES, FIRST QUARTER 2026
A Small Revision, a Big Reallocation
The Preliminary Benchmark Revision to Payrolls Is Only 79,000 Jobs, a Fraction of Last Year's. The County Data Underneath It Show a Labor Market That Barely Grew, Growth Pushing to the Metro Edge, and the Federal Payroll as the Nation's Largest Local Drag
EARLY SIGNAL
- The preliminary benchmark revision to March 2026 nonfarm payrolls is -79,000 jobs, or -0.1%. The revision equals 0.05% of the March payroll level, against preliminary estimates of -911,000 last year, -818,000 in 2024 and -306,000 in 2023, and against an average absolute annual revision of 0.2% over the prior decade. In our July employment report we wrote that the date that mattered was August 28 and that we wanted to see this revision before changing our second half forecast. We are not changing it.
- The composition of the revision is the story, not the total. Transportation and warehousing was revised up 135,100, government up 99,000, information up 87,000, financial activities up 85,000 and construction up 62,000. Retail trade was revised down 154,600, private education and health services down 96,000 and wholesale trade down 86,200. The level was close. The map was not, and the mix is healthier and more heavily weighted toward higher value-added industries.
- The county data behind the benchmark describe a labor market that barely grew. National covered employment rose 0.1% over the year through March, to 154.8 million, and only 151 of the 376 largest counties, two in five, added jobs at all.
- Apply the benchmark to the payroll data and the underlying pace of hiring is somewhere between 11,000 and 16,000 jobs a month. The unadjusted universe count that BLS benchmarks against added about 132,000 jobs between March 2025 and March 2026, or 11,000 a month; carrying the revision through the seasonally adjusted series puts the figure near 194,000, or 16,000 a month. Over those same twelve months the unemployment rate rose a single tenth, to 4.3%, and it has since fallen to 4.1%. The breakeven rate of job growth is far below the 50,000 to 75,000 we have been carrying.
- Education and health services added roughly twice the entire private sector's net job gain. Covered employment in the sector rose 2.0% over the year while private employment overall rose 0.2%. Only construction, at 0.9%, and leisure & hospitality, at 0.3%, added anything at all besides. Manufacturing fell 1.4%, trade, transportation and utilities fell 0.9% and government fell 0.7%.
- Five of the twelve fastest-growing large counties in the country are in North Carolina. New Hanover was up 2.4%, Cabarrus and Wake 2.3% each, and Buncombe and Union 2.1% each. This is the employment counterpart to the population story we told in Beyond the Beltlines in August, and it is a stronger claim, because population is counted where people sleep and these data count where they work.
- The federal payroll is the largest single local drag in the country. Washington, D.C. and Arlington County each shed 4.5% of their covered employment, the steepest declines among the 376 largest counties. Within Washington, combined government, which in the District is overwhelmingly federal, lost 25,704 jobs, down 11.0%. Maryland lost 1.7% of its covered employment, the worst of any state.
- Wages rose almost everywhere jobs did not, and first-quarter wage data need a caveat. The national average weekly wage rose 3.9% to $1,654, against a 3.4% gain in average hourly earnings over the same twelve months. QCEW wages include bonuses and exercised stock options, and those land in the first quarter.
THE NUMBER WE SAID TO WAIT FOR
The preliminary benchmark revision to total nonfarm employment for March 2026 is -79,000 jobs, or -0.1%. Private employment was revised down 178,000, also -0.1%, and government was revised up 99,000. Each year the Bureau of Labor Statistics compares its sample-based payroll survey against a near-universe count built mostly from state unemployment insurance tax records, which is the same Quarterly Census of Employment and Wages that produced this morning's county data. The two releases landed within the same hour, which is why we are treating them as one report.
This is a small number by any standard, and it follows two very large ones. The preliminary estimate a year ago was -911,000 jobs and the year before that -818,000. Over the prior ten years the annual benchmark revision has averaged 0.2% of total nonfarm employment in absolute terms. This year's revision works out to 0.05% of the March payroll level, a quarter of that average and less than a tenth of last year's estimate. The last comparable reading was the 2023 benchmark.
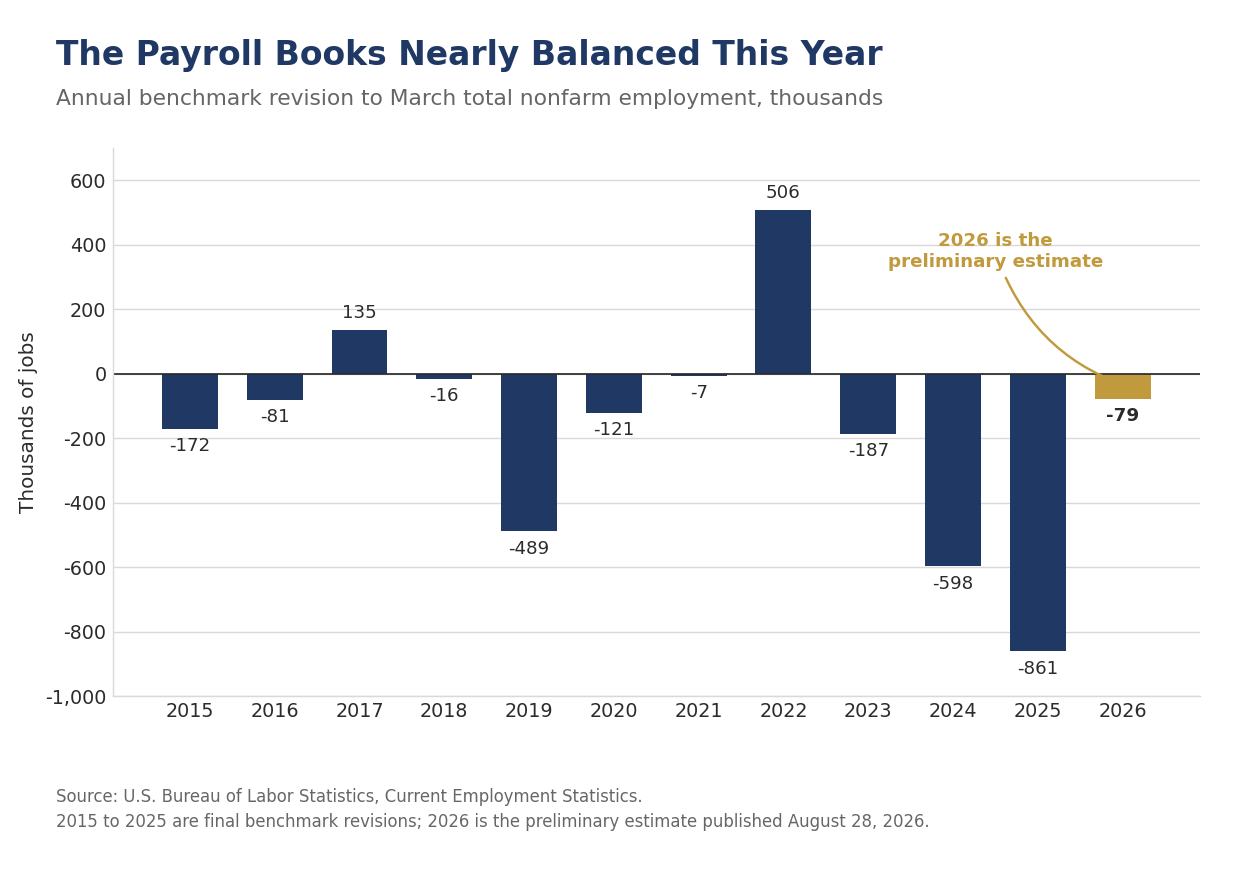
The right explanation is arithmetic rather than a sudden improvement in the survey. A benchmark revision measures the gap between two independently estimated counts, and the gap has room to open only when the estimate is moving. The establishment survey's net birth-death model adds jobs for firms too new to have entered the sample, and when business formation runs well below what the model assumes, those additions accumulate into a large annual correction. Payrolls as published have grown about 23,000 a month over the past year. There is very little room in a number that small for the model to be wrong by very much. The revisions of 2024 and 2025 were the correction of an era of rapid post-pandemic churn; this one is the arithmetic of a slow year.
Two cautions belong with the number. First, it is preliminary, and the final revision will be incorporated into the official estimates with the January 2027 Employment Situation report next February, and in each of the last two years the final came in smaller in absolute terms than the preliminary, -598,000 against -818,000 in 2024 and -861,000 against -911,000 in 2025. Second, a small revision at the total is not a clean bill of health for the detail. Sampling error grows as the industry detail gets finer, and this year's sector revisions are large against a total that is nearly zero.
THE LEVEL WAS CLOSE, THE MAP WAS NOT
Strip the total away and the revision describes a substantial reallocation of jobs across the economy. Transportation and warehousing was revised up 135,100 jobs, or 2.0%, the largest upward revision of any industry. Information was revised up 87,000, or 3.0%, the largest in percentage terms. Financial activities gained 85,000, construction 62,000 and utilities 8,100. Government was revised up 99,000. On the other side, retail trade was revised down 154,600 jobs, private education and health services 96,000, wholesale trade 86,200, professional and business services 76,000 and manufacturing 67,000.
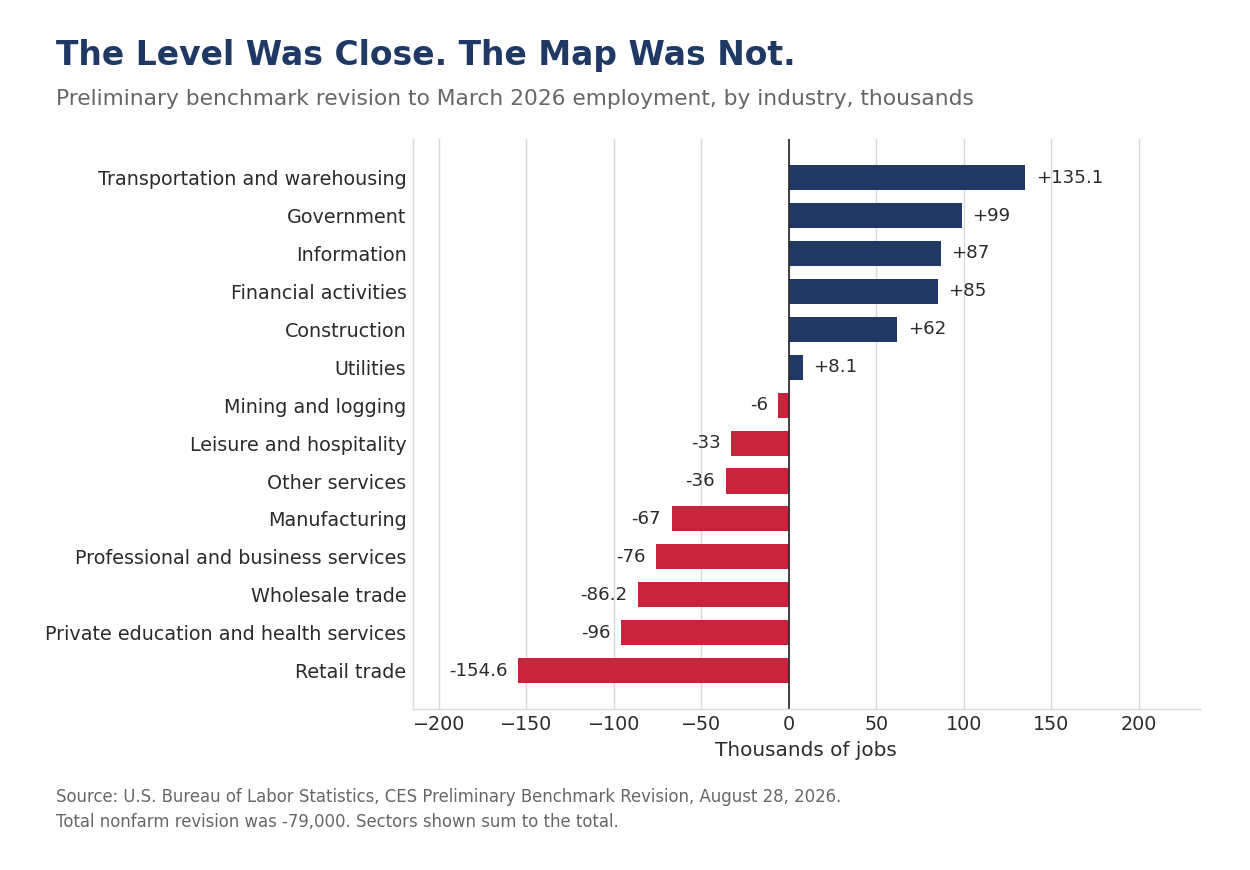
The industries revised up are the ones that build, move and finance things. The industries revised down sell things and staff offices. That pattern is consistent with the capital-led expansion we have described all year, in which business investment in plants, equipment and logistics rather than consumer borrowing is doing the work. We would not lean on a single year of benchmark data to prove a thesis, since these are exactly the cells where sampling error is largest. The direction is worth noting, however, because the survey has been understating the goods-handling side of the economy and overstating the selling side for two years running.
Retail is the revision to sit with. Retail trade was revised down 126,200 jobs last year and 154,600 this year, roughly 1% of the industry in each case. Retail sales have not been weak over that stretch. What has changed is how many people it takes to produce a dollar of sales, as fulfillment moves from the store floor into the warehouse. The 135,100-job upward revision to transportation and warehousing sits directly opposite the 154,600-job downward revision to retail trade, and the two are close enough in size to be worth treating as one movement rather than two.
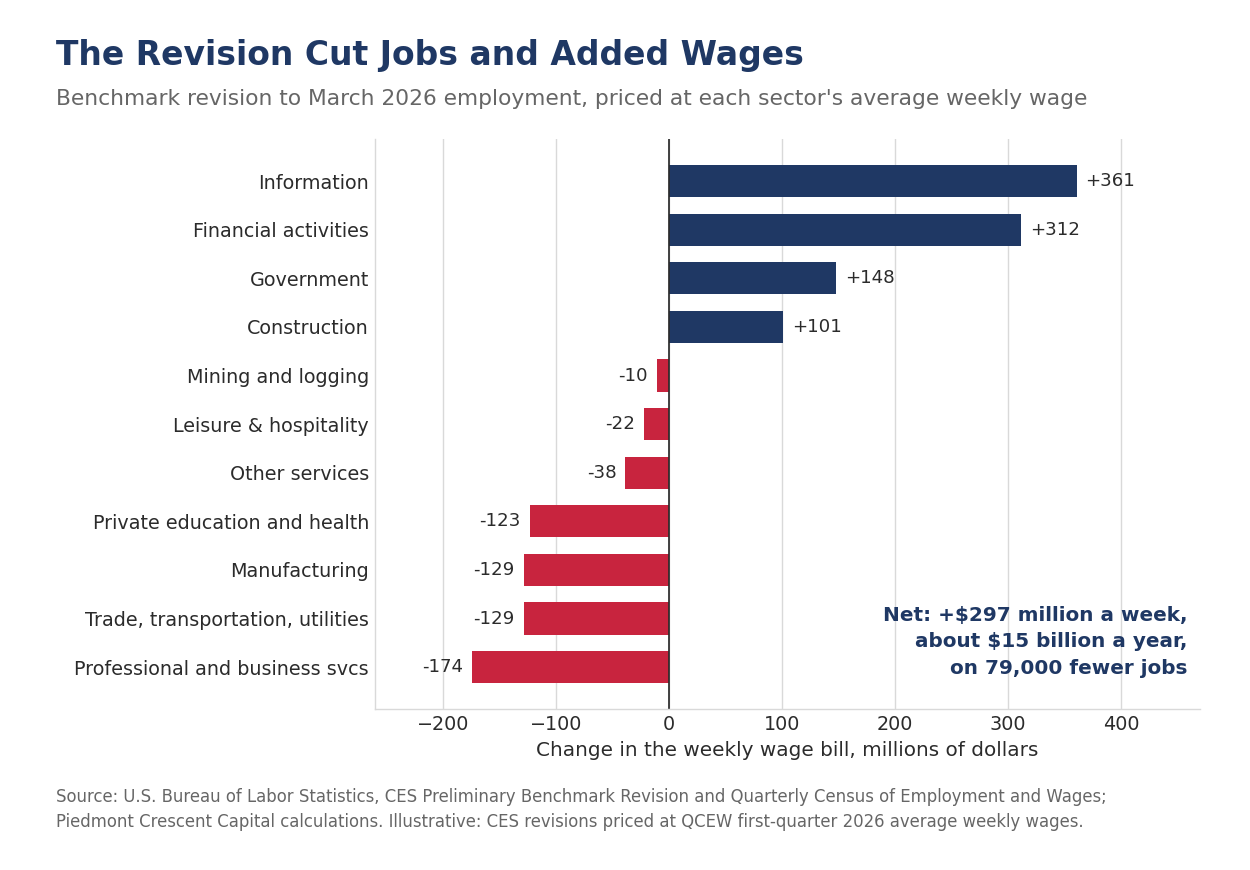
The revision also moved jobs up the wage ladder, which is what makes the mix healthier than the total suggests. Price each sector's revision at its own average weekly wage in the first quarter and the jobs added carried an average of $2,769 a week against $1,518 for the jobs removed, on a national average of $1,654. Information at $4,147 a week and financial activities at $3,668 account for most of the upward revision, while retail trade and private education and health services, the two largest downward revisions, sit near the bottom of the wage table. On that arithmetic the revision subtracted 79,000 jobs and added close to $297 million a week to the estimated national wage bill, or roughly $15 billion a year. The calculation is illustrative rather than official, since it prices CES revisions at QCEW wages, but the direction of it does not depend on the method.
The upward revision to government sits awkwardly beside everything else in this release. Federal payrolls have been falling all year in the monthly employment reports, and the county data show exactly where. The reconciliation is that the benchmark revision is a level correction across all of government, most of which is state and local, while the federal reductions are a flow that ran through the same twelve months. Both can be true. We would watch whether the February revision holds that upward adjustment.
WHAT THE UNIVERSE COUNT SAYS ABOUT THE BREAKEVEN
The two releases together let us estimate the pace of hiring without the survey in the middle. Benchmarking sets the March level of the payroll survey equal to the universe count, so the unadjusted March 2025 payroll figure of 157.540 million is also the universe count for that month. The universe count for March 2026 is the published unadjusted figure of 157.751 million less the 79,000 revision, or about 157.672 million. The universe therefore added roughly 132,000 jobs over the twelve months, close to 11,000 a month. Carrying the same revision through the seasonally adjusted series, which shows 273,000 as published, leaves about 194,000, or 16,000 a month. The two figures bracket the truth, so call the underlying pace 11,000 to 16,000 jobs a month; the argument that follows does not depend on which end of that range you choose.
Fewer than 20,000 jobs a month did not raise the unemployment rate. The rate went from 4.2% in March 2025 to 4.3% in March 2026, a single tenth, and it has fallen since, to 4.1% in July. A labor market that absorbs its entrants at that pace is not a weak labor market. It is a small one. Labor force growth has slowed sharply as the first half of the Baby Boom passes deeper into its seventies and net immigration falls back, and the arithmetic of the breakeven follows labor force growth, not demand.
We are marking our estimate of the breakeven rate of payroll growth down to a range of zero to 40,000 a month, from 50,000 to 75,000. We flagged the old range as probably too high on August 7, when payroll growth over the prior twelve months was running well below anything a 50,000 breakeven could reconcile with a falling unemployment rate. The benchmark now supplies the arithmetic to replace it rather than merely to doubt it. The revision changes our estimate of how many jobs the economy created; it does not change our view of what those jobs mean, because the denominator moved with the numerator.
This is the most consequential thing in either release for policy. If the breakeven sits below 40,000, a run of prints in the 20,000 to 50,000 range is a labor market in balance rather than one deteriorating, and the Federal Reserve should read it that way. It also means the labor market will look weak on the headline for as long as the supply constraint lasts, and there is nothing monetary policy can do about a shrinking labor force. The zero to 40,000 range describes the year through March. We feel the breakeven is now slowly rising, however, as jobs are being created in parts of the economy, manufacturing in particular, where they have been lagging. Covered manufacturing employment fell 1.4% over the year to March, but the establishment survey has added 31,000 factory jobs since December after shedding 56,000 over the second half of last year. The foreign-born labor force is still shrinking, down roughly 550,000 over the year to July with its participation rate off to 65.5% from 66.1%, and we expect workers with valid documentation to return gradually from here as processing normalizes. Neither force is large enough to change the arithmetic this year, and both argue for a higher breakeven by 2027.
THE GROWTH FRONTIER SHOWS UP IN THE PAYROLL DATA
Only 151 of the 376 largest counties added jobs over the year, and where they are is the most useful thing in this release. Licking County, Ohio, immediately east of Columbus and home to Intel's Ohio semiconductor campus and a fast-expanding distribution cluster, led the nation at 3.6%, with trade, transportation and utilities adding 677 jobs, or 3.7%, its largest contribution. Licking is one of five counties added to the publication tables this year on crossing the 75,000-employee threshold, alongside Kenton, Kentucky; Union, North Carolina; Gregg, Texas; and Kenosha, Wisconsin. It topped the list in its first year in the tables.
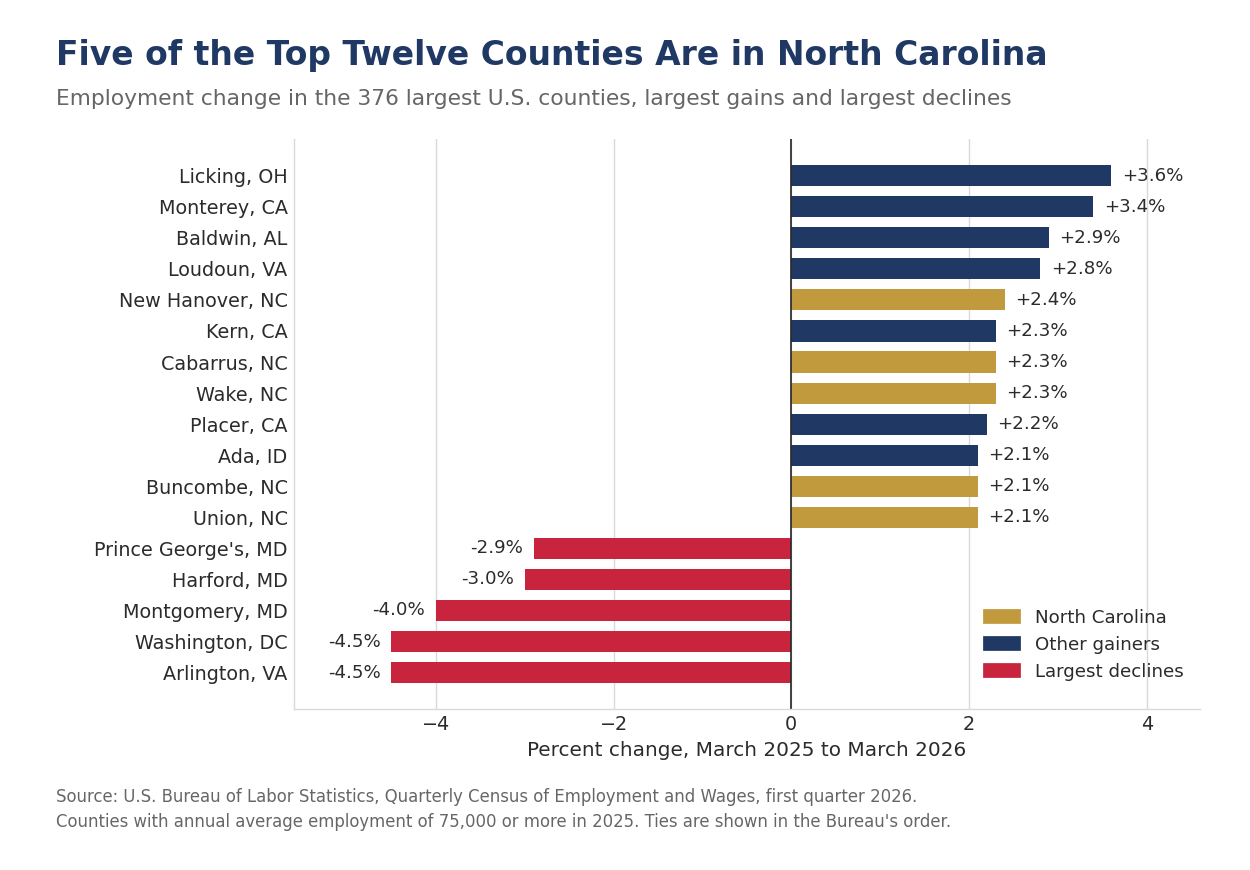
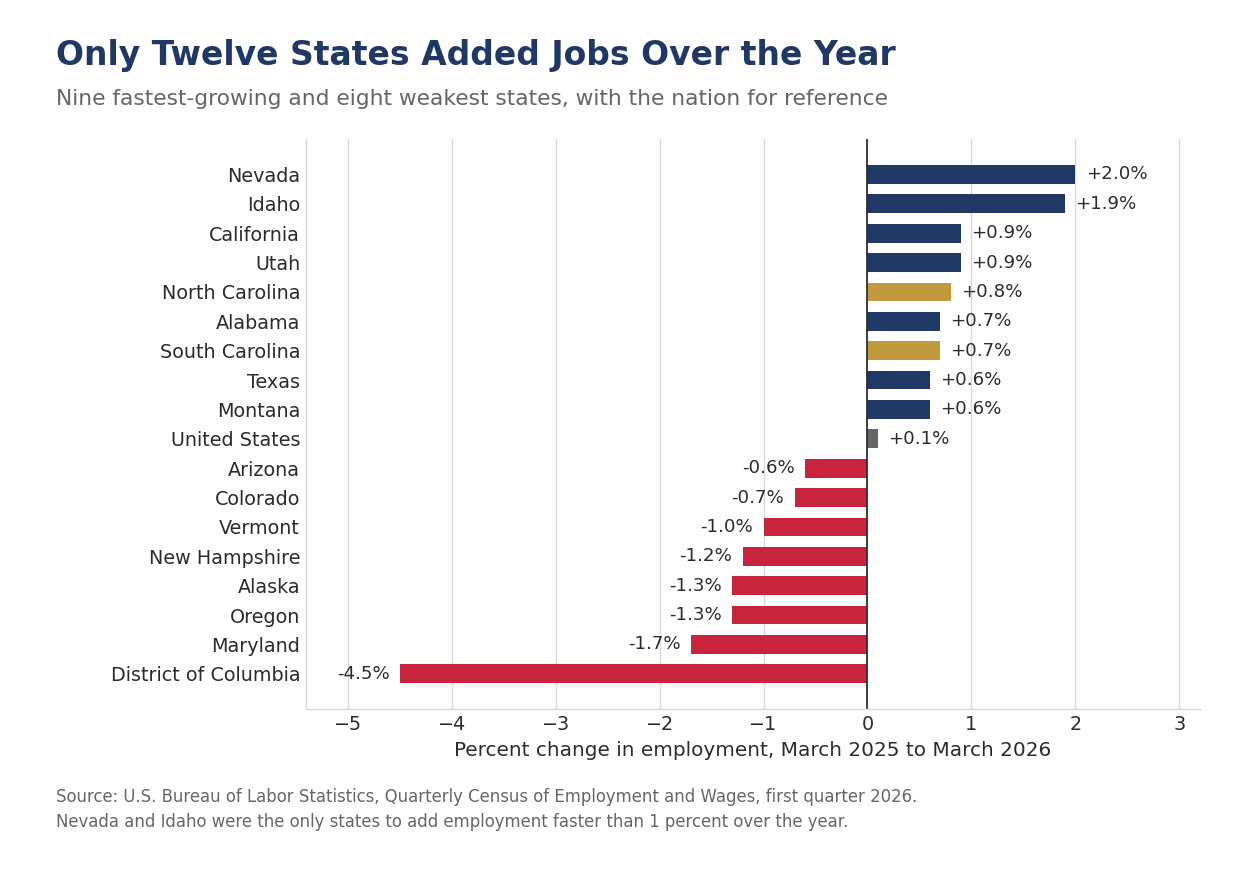
Five of the twelve fastest-growing counties in the country are in North Carolina. New Hanover, which is Wilmington (+2.4%), leads the group, followed by Cabarrus, which is Concord and Kannapolis just northeast of Charlotte, and Wake, which is Raleigh (+2.3% each), then Buncombe, which is Asheville, and Union, which is Monroe just southeast of Charlotte (+2.1% each). California placed three, Monterey, Kern and Placer, and no other state placed more than one. North Carolina's covered employment rose 0.8% statewide and South Carolina's 0.7%, against 0.1% nationally, while Nevada (+2.0%) and Idaho (+1.9%) were the only states to add employment faster than 1%. The Southeast is not one economy in these data either, with Alabama up 0.7%, Georgia and Florida flat, and Tennessee and Virginia each down 0.2%.
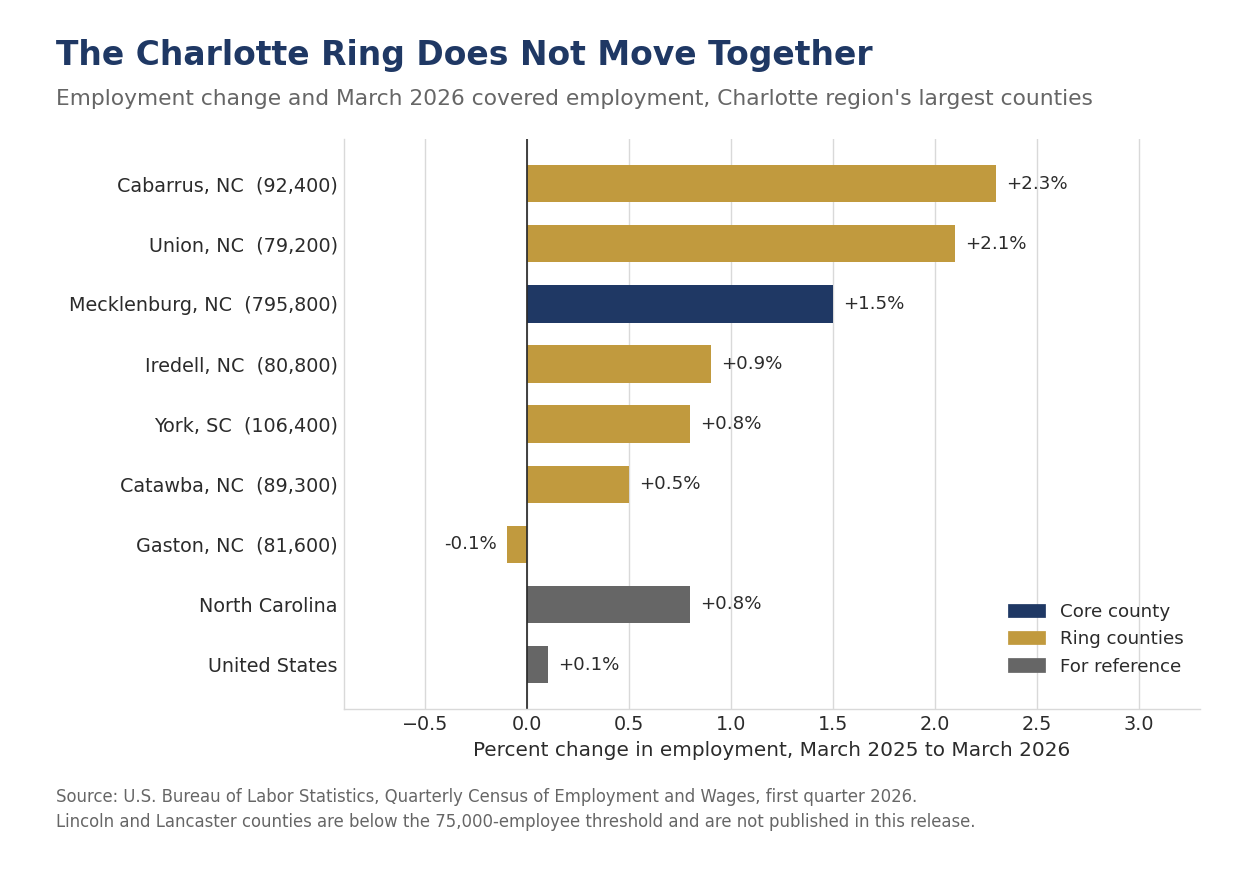
This is the same story we told in Beyond the Beltlines, told with better evidence. That report rested on the Census Bureau's population estimates, which count people where they sleep. These data count them where they work. The distinction matters because the standing objection to the beyond-the-metro thesis has always been that the frontier counties are bedroom communities, absorbing households whose paychecks are still earned downtown. Cabarrus and Union counties are the first ring outside Charlotte and both are now growing employment faster than Mecklenburg, which grew 1.5%. The frontier is producing jobs, not only housing them.
York County, South Carolina, directly south of Charlotte, needs a word of its own. York grew 0.8% over the year, half Mecklenburg's pace, which reads as a laggard set beside Cabarrus and Union. It is not one. York is a large and mature market in its own right, with 106,400 covered jobs in March, more than Cabarrus, Union, Iredell or Catawba, anchored by Rock Hill's long-established manufacturing, health care and services base. Fort Mill, which has expanded nearly 58% since April 2020 and ranks sixth among all American cities and towns over that span, is growing against that base rather than adding to a small one, and the county rate averages the two together. The same arithmetic will run the other way as Octapharma's $1.5 billion critical care plant in Rock Hill, confirmed in July, moves from announcement to payroll.
The ring does not move together, which is the more useful finding for anyone allocating capital across it. Cabarrus (+2.3%) and Union (+2.1%) outran Mecklenburg (+1.5%), while Iredell (+0.9%), York (+0.8%) and Catawba (+0.5%) trailed it and Gaston (-0.1%) lost ground. A spread of 2.4 percentage points inside a single commuting shed is a reminder that the frontier is a set of individual county decisions about land, water, schools and power rather than a wave that lifts everything at a given radius from the core.
Buncombe County is a separate issue. It lost population over the year to July 2025, the only large North Carolina county to do so, as Hurricane Helene displaced households from the Asheville area. Its covered employment rose 2.1% over the year to March 2026 even so. Rebuilding shows up in the payroll data well before it shows up in the population data, and we would expect the population figures to follow.
The wider Sun Belt reads the same way, one ring out from the employment centers. Baldwin County, Alabama, across the bay from Mobile and home to Daphne, Fairhope and Gulf Shores, grew 2.9% and ranked third in the country, followed by Placer County outside Sacramento (+2.2%), Ada County, which is Boise (+2.1%), Hays County between Austin and San Antonio (+2.0%), and Washington County, Utah, which is St. George, and Boone County, Kentucky, outside Cincinnati (+1.9% each). Fort Bend outside Houston, Hamilton outside Indianapolis and Utah County outside Provo each grew 1.8%. Every one of them is either the next ring beyond a larger labor market or a coast that retirees are still choosing.
| County | March 2026 employment (thousands) | Employment, % change | Q1 2026 average weekly wage | Wage, % change |
|---|---|---|---|---|
| Licking, OH | 77.0 | +3.6 | $1,289 | +5.7 |
| Baldwin, AL | 89.5 | +2.9 | $1,033 | +3.6 |
| New Hanover, NC | 132.7 | +2.4 | $1,347 | +4.6 |
| Cabarrus, NC | 92.4 | +2.3 | $1,205 | +3.2 |
| Wake, NC | 666.8 | +2.3 | $1,680 | +3.2 |
| Ada, ID | 295.3 | +2.1 | $1,503 | +7.9 |
| Buncombe, NC | 135.1 | +2.1 | $1,197 | +0.9 |
| Union, NC | 79.2 | +2.1 | $1,340 | +4.4 |
| Hays, TX | 99.4 | +2.0 | $1,089 | +3.5 |
| Mecklenburg, NC | 795.8 | +1.5 | $2,167 | +3.1 |
| Charleston, SC | 285.4 | +1.3 | $1,492 | +5.7 |
| Spartanburg, SC | 160.9 | +1.2 | $1,234 | +4.0 |
| Horry, SC | 145.4 | +1.2 | $974 | +3.4 |
| Orange, FL | 961.0 | +1.2 | $1,432 | +3.2 |
| York, SC | 106.4 | +0.8 | $1,306 | +2.9 |
| Greenville, SC | 302.8 | +0.6 | $1,346 | +4.5 |
| United States | 154,771.9 | +0.1 | $1,654 | +3.9 |
Selected counties among the 376 largest, ranked by employment growth. National leaders with Southeast comparisons. Employment change is March 2025 to March 2026; wage change is first quarter 2025 to first quarter 2026. Source: U.S. Bureau of Labor Statistics, Quarterly Census of Employment and Wages.
One caveat of this release is worth noting. This morning's report covers only the 376 counties with annual average employment of 75,000 or more, which together hold 73.5% of covered workers, and it measures counties rather than towns. The frontier communities at the center of Beyond the Beltlines are buried inside county averages. Fort Mill's growth sits inside York County's 0.8%, Wendell's inside Wake County's 2.3%, and Greer's and Woodruff's inside Greenville's 0.6% and Spartanburg's 1.2%. Only Leland, in Brunswick County, sits in a county too small to appear at all. County averages understate what is happening at the leading edge of the frontier, which is where the Bureau's full county file, covering every county in the country, has to do the work.
WASHINGTON IS THE NATION'S LARGEST LOCAL DRAG
Washington, D.C. and Arlington County, Virginia each lost 4.5% of their covered employment over the year, the steepest declines among the 376 largest counties. Within Washington, combined government, the great majority of which in the District is federal, shed 25,704 jobs, a decline of 11.0%. Montgomery County, Maryland fell 4.0%, Harford County 3.0%, Prince George's County 2.9%, and Alexandria City and Frederick County 2.6% each. Maryland lost 1.7% of its covered employment, the largest decline of any state, and the District lost 4.5%.
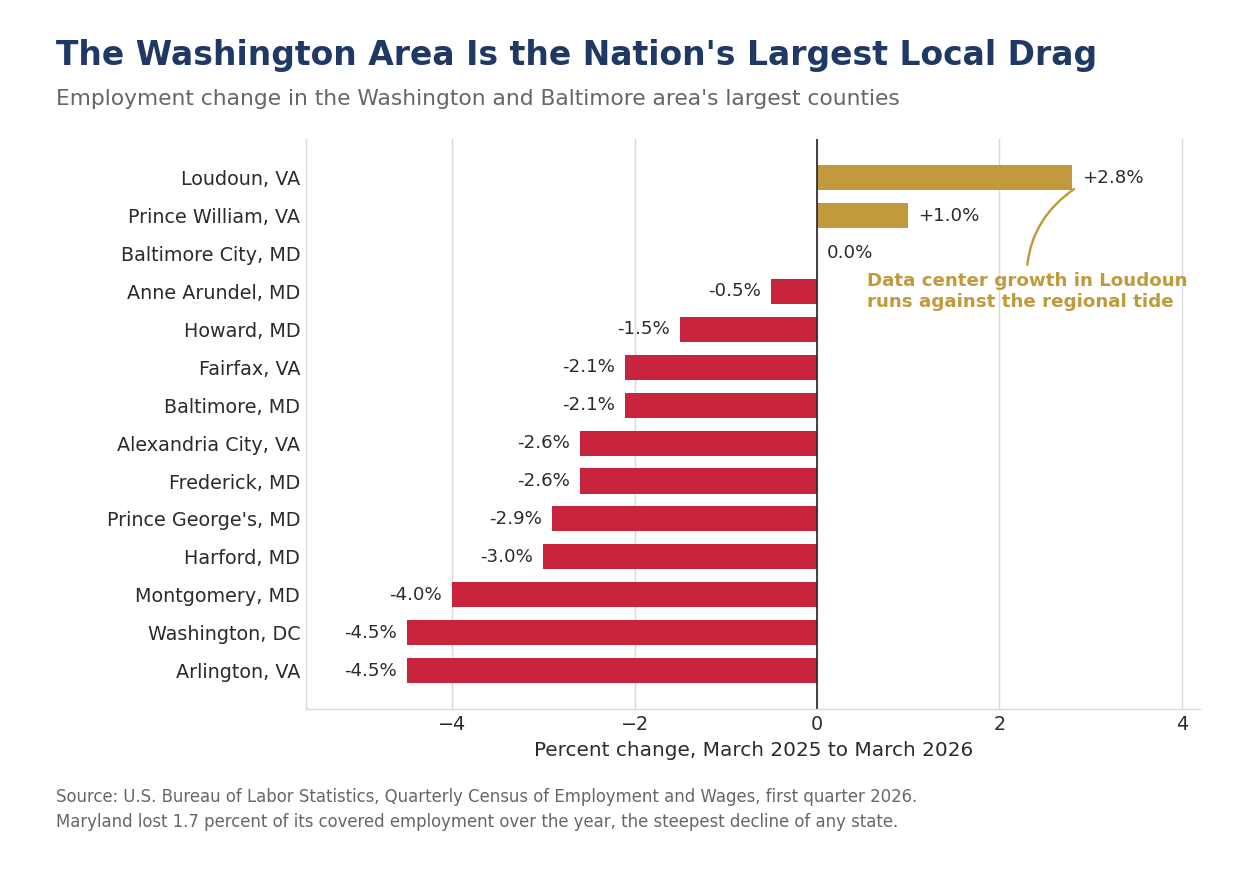
The most important detail is where Arlington's losses landed. The largest decline inside Arlington was not in government at all. It was professional and business services, down 3,563 jobs or 5.6%. That is the contractor channel, and it is the reason a reduction in federal spending shows up in the private payroll data of the surrounding counties rather than staying inside the government line. Anyone forecasting the Washington regional economy off federal headcount alone will understate the effect by a wide margin.
Arlington also supplies this release's cleanest warning about reading wage data. Its average weekly wage rose 8.8% even as its employment fell 4.5%. When a labor market sheds its lower-paid positions first, the average wage of those who remain goes up. Arlington's wage gain is a composition effect and should not be read as evidence of a strong local economy.
Loudoun County runs against the entire regional tide, and the reason is instructive. Loudoun grew 2.8%, fourth fastest in the country, while every neighbor except Prince William contracted. Loudoun sits at the center of the largest data center market in the world. We made the case to the ElectriCities membership in August that large-load development is now a first-order variable in local economic performance, and Loudoun is that argument in a single bar on a chart. It is also a reminder that the employment gain from a data center campus is modest next to its tax base and its load, which is why the tariff question matters more to a municipal system than the job count does. Virginia lost 0.2% of its covered employment statewide, a figure that conceals both ends of this distribution.
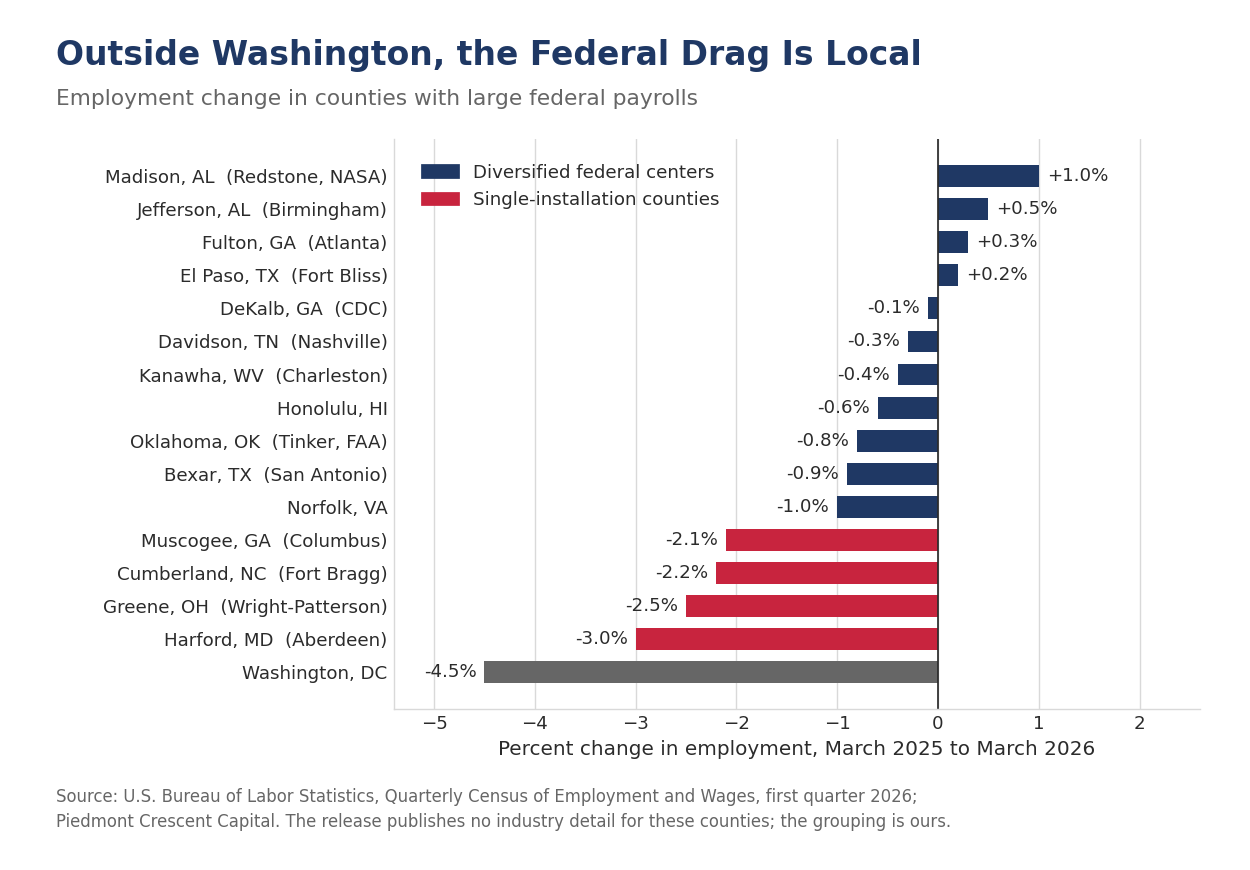
The obvious question is where else a large federal payroll shows up in these data, and the answer is that it mostly does not. DeKalb County, Georgia, home to the Centers for Disease Control and Prevention, was essentially flat (-0.1%) and Fulton County next door grew 0.3%. Jefferson County, Alabama, which is Birmingham, grew 0.5%, and Kanawha County, West Virginia, which is Charleston, slipped 0.4%. Madison County, Alabama, which is Huntsville and holds Redstone Arsenal along with NASA's Marshall Space Flight Center, grew 1.0%. Bexar County, Texas, home to Joint Base San Antonio, fell 0.9%, Honolulu 0.6% and Oklahoma County, which holds Tinker Air Force Base and the FAA's Mike Monroney Aeronautical Center, 0.8%. A federal payroll sitting inside a diversified metropolitan economy is not large enough to set the direction, even where it is large in absolute terms.
The exception is the county built around a single installation. Harford County, Maryland, which contains Aberdeen Proving Ground (-3.0%), Greene County, Ohio, beside Wright-Patterson Air Force Base (-2.5%), Cumberland County, North Carolina, which is Fayetteville and Fort Bragg (-2.2%), and Muscogee County, Georgia, which is Columbus and the Army post beside it (-2.1%), all rank in the bottom thirty counties in the release. The Bureau publishes industry detail only for the extremes and the ten largest counties, so the attribution is ours rather than its own, though the pattern is difficult to read another way. A county whose employment base rests on one federal facility has nothing to diversify into when that facility retrenches, which was the lesson of the base closure rounds and applies again now.
WAGES ROSE ALMOST EVERYWHERE JOBS DID NOT
The national average weekly wage rose 3.9% to $1,654 in the first quarter, and 358 of the 376 largest counties posted increases. Set that against the 151 counties that added jobs and the shape of this labor market is clear enough. Employers are paying more and hiring less. Average hourly earnings from the payroll survey rose 3.4% over the same twelve months, and the half-point difference is mostly bonuses and exercised stock options, which QCEW captures and which land in the first quarter.
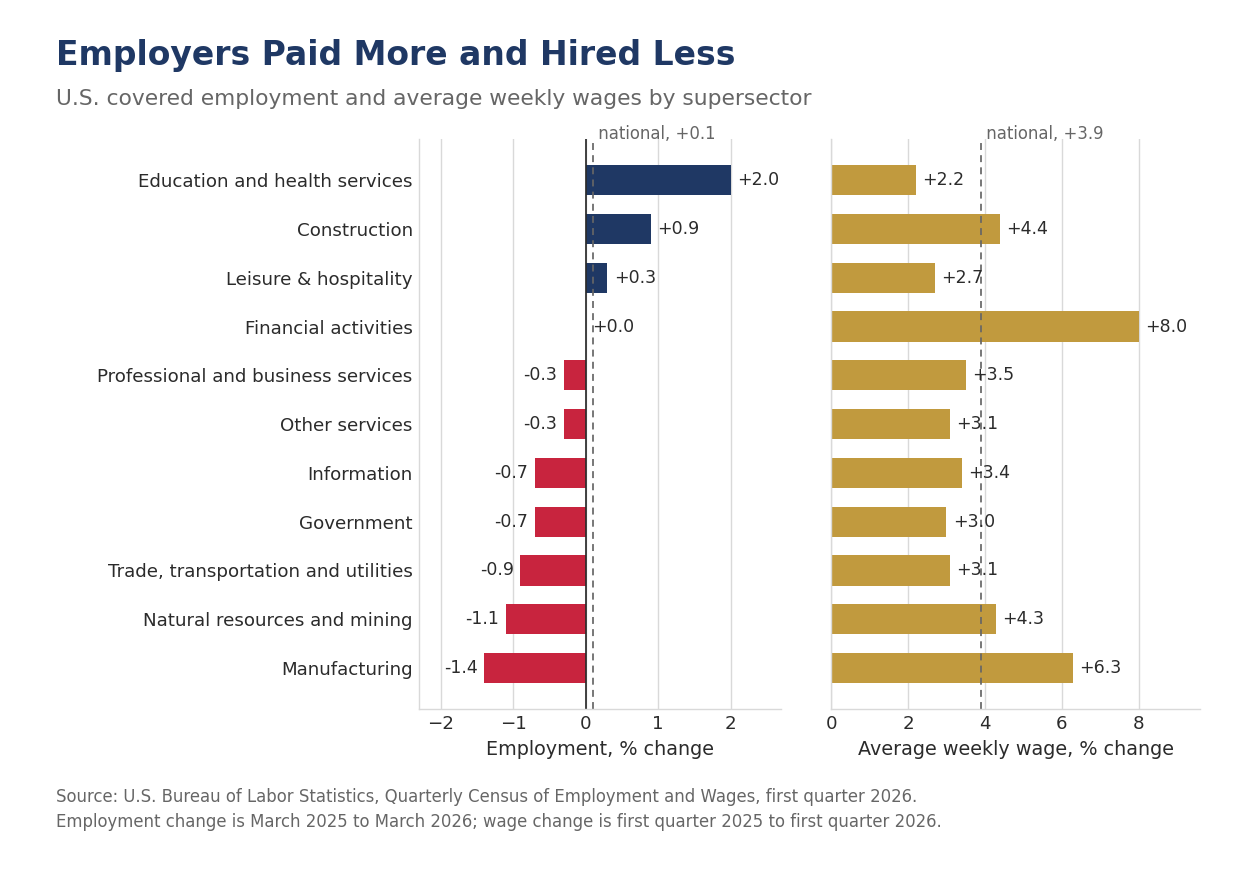
| Industry | March 2026 employment (thousands) | Employment, % change | Q1 2026 average weekly wage | Wage, % change |
|---|---|---|---|---|
| Total, all industries | 154,771.9 | +0.1 | $1,654 | +3.9 |
| Private industry | 132,003.9 | +0.2 | $1,681 | +4.0 |
| Natural resources and mining | 1,669.0 | -1.1 | $1,711 | +4.3 |
| Construction | 8,113.8 | +0.9 | $1,634 | +4.4 |
| Manufacturing | 12,451.2 | -1.4 | $1,918 | +6.3 |
| Trade, transportation and utilities | 28,145.8 | -0.9 | $1,317 | +3.1 |
| Information | 2,853.3 | -0.7 | $4,147 | +3.4 |
| Financial activities | 8,679.5 | 0.0 | $3,668 | +8.0 |
| Professional and business services | 22,065.1 | -0.3 | $2,295 | +3.5 |
| Education and health services | 26,618.7 | +2.0 | $1,282 | +2.2 |
| Leisure and hospitality | 16,453.0 | +0.3 | $655 | +2.7 |
| Other services | 4,625.3 | -0.3 | $1,067 | +3.1 |
| Government | 22,768.0 | -0.7 | $1,496 | +3.0 |
U.S. covered employment and wages by supersector. Employment change is March 2025 to March 2026; wage change is first quarter 2025 to first quarter 2026. Source: U.S. Bureau of Labor Statistics, Quarterly Census of Employment and Wages.
Two county wage figures should be read as accounting events rather than labor market signals. St. Tammany Parish, Louisiana posted the largest wage gain in the country at 23.4%, driven by an increase of $29,561 in the average weekly wage in natural resources and mining, a rise of 771.8%. A single high-compensation event in one small industry can move a whole parish's average. At the other end, San Francisco recorded the largest decline at 9.6%, on a drop of $2,092, or 27.9%, in professional and business services, even as San Francisco employment rose 2.0% and ranked thirteenth in the country. That is equity compensation normalizing against an extraordinary first quarter of 2025, not a labor market weakening.
The largest counties tell the compensation story most plainly. All ten of the largest counties recorded wage increases and only three added jobs. New York County led on wages at 7.9%, to $4,902 a week, with financial activities up $1,477, or 11.1%, to $14,770. Orange County, California posted the largest employment gain among the ten at 0.7%, on the strength of education and health services, which added 10,753 jobs, or 4.0%. Every state in the Southeast remains below the $1,654 national average weekly wage except Virginia, from $1,296 in South Carolina and $1,515 in North Carolina to $1,539 in Georgia and $1,518 in Florida. Texas at $1,646 sits just under it, and Virginia's $1,665 is a Northern Virginia number attached to a Southern state. That gap is the frontier's recruiting argument and, over time, its ceiling.
OUR CALL
The Trend Was Right. Mark the Breakeven Down.
The revision we said to wait for came in at -79,000 jobs, and it does not change our forecast for the second half of the year. The payroll survey has tracked the universe count more closely over the past twelve months than in either of the two years before it, and the argument that the labor market has been falling apart behind a flattering survey does not survive this release.
What does survive is the level. Stacking the benchmark on the county data puts underlying job growth between 11,000 and 16,000 a month over the year through March, against an unemployment rate that rose one tenth and has since fallen to 4.1%. We are therefore reducing our estimate of the breakeven rate of payroll growth to a range of zero to 40,000 a month from 50,000 to 75,000, and that change matters more for policy than the revision does. A labor market that holds its unemployment rate steady on that little hiring is resilient, not weak, and the binding constraint is a shrinking labor force against which monetary policy has nothing to offer. We now see a greater chance that the Fed will hike the federal funds rate in December and firmly believe they will hold off moving before the midterm elections. That pulls the first hike forward from the first quarter of 2027 in our August 18 forecast. We still carry one more in 2027, so the path ends where it did, at 4.00% to 4.25%.
The next near-term test is the August employment report on September 4, where the latest possible Labor Day should hold summer staff on payrolls through the survey week and produce a stronger print than the past three months have delivered. The later test is falsifiable and we will report it either way: the final benchmark revision, published with the January 2027 Employment Situation next February, will be less negative than -79,000 jobs. In each of the last two years the final came in smaller in absolute terms than the preliminary, and this year's starting point already sits inside the noise.
Mark P. Vitner
Chief Economist, Piedmont Crescent Capital
mark.vitner@piedmontcrescentcapital.com
Sources: U.S. Bureau of Labor Statistics, County Employment and Wages, First Quarter 2026, and CES Preliminary Benchmark Revision, both August 28, 2026; U.S. Bureau of Labor Statistics, The Employment Situation, July 2026, Current Employment Statistics benchmark article and Current Population Survey; U.S. Census Bureau, Vintage 2025 Population Estimates; Piedmont Crescent Capital and Southeast Economic Advisors calculations.
This report is for informational purposes only and does not constitute investment advice. Views expressed are those of Piedmont Crescent Capital as of the date of publication and are subject to change without notice.