Consumer Confidence Rises Solidly in December
Still No Sign of the Big Bad Wolf
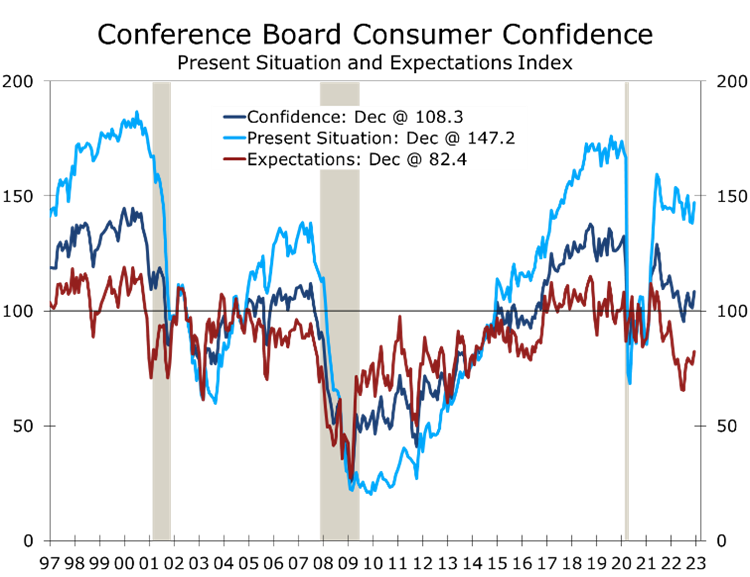
- Consumer Confidence rebounded 6.9 points in December to 108.3, pushing back on any notion the economy is on the precipice of recession, at least at the end of 2022.
- Consumers’ assessment of current economic conditions rose 8.9 points in December to 147.2, likely benefitting from falling gasoline prices.
- Expectations for business conditions 6 months from now rose 5.7 points to 82.4, a level historically consistent with a mild recession but still well above prior lows.
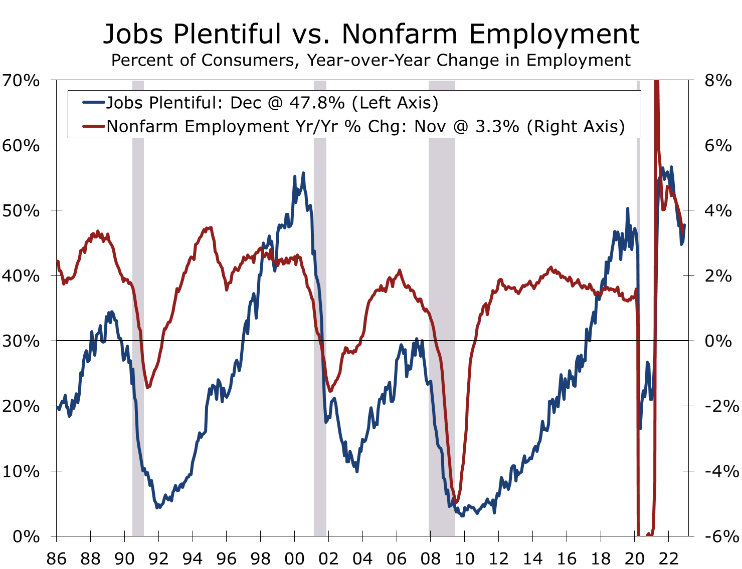
- The share of consumers stating jobs were plentiful in December rose 2.6 points to 47.8, while the share that felt jobs were hard to get fell 1.7 points to 12.
- Inflation expectations for the coming year also declined but remain historically high at 6.7%. Inflation expectations had been around 4.5% prior to the pandemic.
The Consumer Confidence Index rebounded 6.9 points to 108.3 in December, as falling gasoline prices and the continuing abundance of job openings offset concerns about rising interest rates and a wobbly stock market. Consumers assessment of the present economic situation rose 8.9 points to a lofty 147.2, while expectations for future economic conditions rose 5.7 points to a less ominous 82.4 in December.
The stronger consumer confidence numbers downplay the risk a recession is now imminent. While most economists, business leaders and policymakers still see a recession as more likely than not, many forecasters are pushing out the timing of when a downturn would begin or diminishing the odds that one will occur at all. We put the odds of recession in 2023 at around 60%. That is far from a slam dunk but far from more cautious than usual. The next most likely outcome would be a series of rolling recessions in the tech sector, housing, and commercial real estate, which would combine to keep real GDP growing at 1% pace or less. This scenario would be a on the soft side of soft landings.
The split between consumers’ assessment of present economic conditions and expectations for future conditions is not unusual in the latter part of the business cycle. The present situation is being supported by the red-hot job market. With help-wanted signs visible nearly everywhere, the share of consumers reporting jobs were plentiful rose 2.6 points to 47.8%, while just 12% of consumers felt jobs were hard to get, down 1.7 points from November.
The share of consumers rating current business conditions as ‘good’ rose by a more modest 1.2 points to 19%, while the share of consumers rating current business conditions as bad fell 2.5 points to 20.1%. It is highly unusual to have a larger number of consumers rate current business conditions as ‘bad’ than ‘good’ and still rate jobs as extremely plentiful.
The net share of consumers reporting jobs are plentiful remains consistent with strong overall job growth and is another piece of data hinting that job growth remained strong in December. The mix of jobs is likely not as strong as the overall number being added, however, with a large share of current job growth coming from restaurants and lower paying occupations in health care, education, and other services.
The split between consumers’ positive attitudes about the availability of jobs and their less sanguine view on expectations for the overall economy likely reflects concerns about lack of availability of higher paying jobs. The overall expectations series rose 5.7 points in December, with the share of consumers expecting business conditions to improve rising 0.6 points to 20.4% and narrowly edged out the share expecting business conditions to worsen (20.3%).
Expectations for job growth remain positive. The share of consumers expecting more jobs to be created over the next 6 months rose 1 point to 19.5%, while the share expecting fewer jobs to be created fell 1.9 points to 18.3%. While that is positive, it is far less upbeat than consumers’ assessment of current employment conditions. Expectations for job growth have likely been scaled back by the growing list of marquee employers announcing cutbacks in the tech sector and elsewhere. Those layoffs have not yet shown up in the weekly unemployment claims or monthly employment data.
Expectations for income growth were mixed, with the share expecting their incomes to rise falling 0.4 percentage points to 16.7%, and the share expecting their income to fall sliding 2.5 points to 13.3%. The mixed response likely reflects the challenges facing some higher paying sectors (tech, housing, and commercial real estate) amidst the continued rebound in lower-paying sectors hit hardest by the lockdowns at the start of the pandemic (restaurants, physician’s offices, nursing homes and day care).
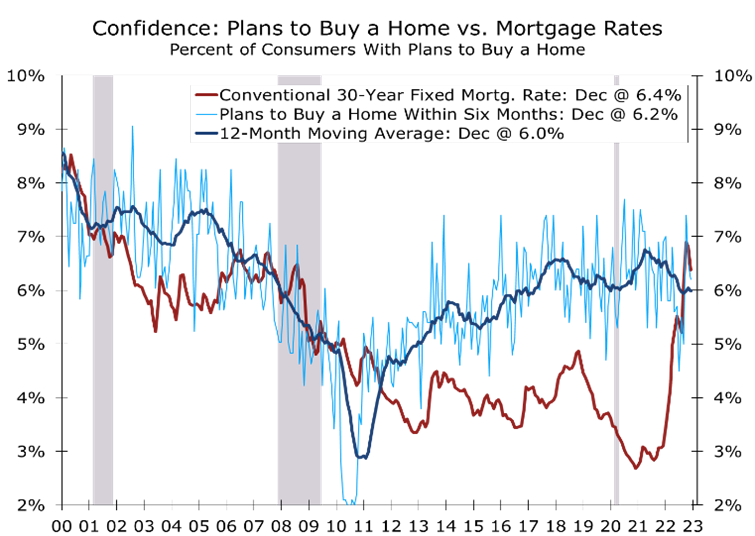
Buying plans were also mixed. Plans to take vacations increased but plans to purchase automobiles, major appliances and homes fell. The Conference Board’s measure of plans to buy a home has held up much better than alternative measures from the University of Michigan and Fannie Mae and has been above its 12-month moving average the past two months. The modest rebound may signal some let up in this past year’s slide in new and existing home sales.
Disclaimer: This publication has been prepared for informational purposes only and is not intended as a recommendation offer or solicitation with respect to the purchase or sale of any security or other financial product nor does it constitute investment advice.
Higher Interest Rates Shackle Home Building
Higher Rates and Tighter Lending Reign
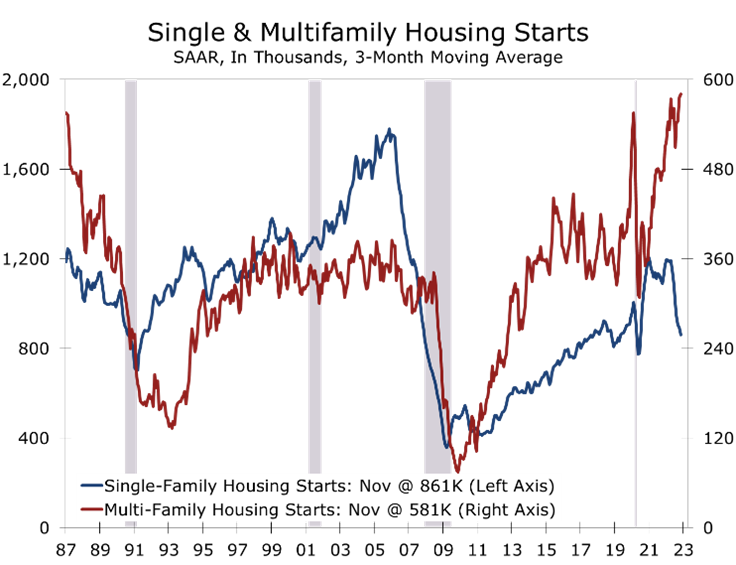
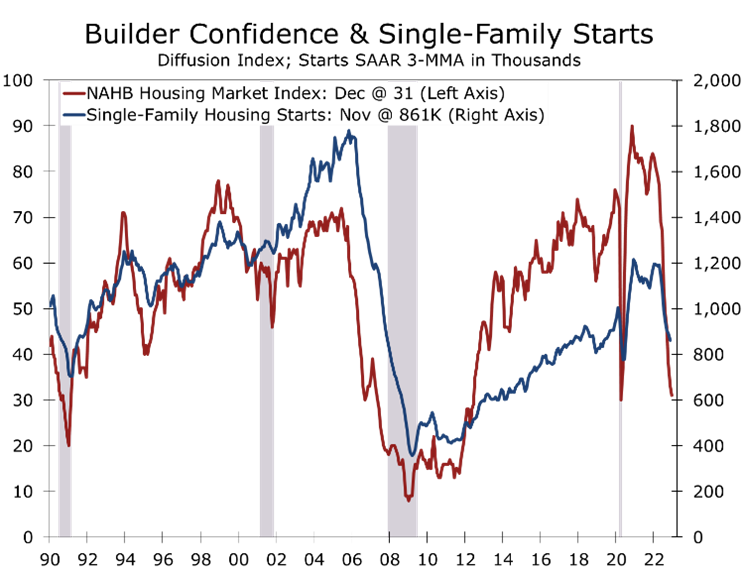
- Housing starts fell 0.5% in November to a still respectable 1.427-million-unit pace, with single-family starts tumbling 4.1% and multi-family starts rising 4.9%.
- Higher mortgage rates continue to weigh on single-family construction, while the threat of tighter lending conditions continues to fuel a rush of apartment starts.
- Housing permits fell a much larger 11.2% to a 1.342-million-unit pace. Single-family permits fell 7.1%, while multifamily tumbled 16.4% Permits fell sharply in every region except the Northeast.
- Completions jumped 10.8% in November to a 1.49-million-unit pace, rebounding from storm-related distortions that sharply reduced completions the prior month.
- Builders continue to work down their backlog of single-family projects, while the mountain of apartment projects under construction continues to increase.
Housing starts declined only marginally in November, with declines in single-family starts offset by continued gains in apartment construction. Overall starts fell 0.5% in November to a 1.427-million-unit pace. Single-family starts fell 4.1% to an 828,000-unit pace, while multi-family starts rose 4.9% to a 599,000 unit-pace. The latter was driven mostly by apartment starts, where developers are likely trying to keep a step ahead of rising interest rates and tightening credit.
Permits, which tend to provide a more consistent read on the housing market, fell 11.2% in November, with single-family permits falling 7.1% and multi-family permits tumbling 16.4%. Permits fell in every region except the Northeast in November, where they rose 1.8%. Permits fell 16.4% in the West, 12.2% in the South and 6.2% in the Midwest.
While there were few surprises in November housing starts, the underlying details provide a good idea of how far along the housing correction is. Overall starts are down 16.4% from last November, with single-family starts down a whopping 32.1% and multi-family starts remaining 23.2% higher than their year ago level.
Single-family and multi-family starts are clearly in different places today. Potential single-family buyers face some of the greatest affordability hurdles ever, with rising interest rates compounding the challenge from the previous run-up in home prices. Builders have reported a sharp falloff in prospective buyer traffic, with the NAHB/Wells Fargo Home Market Index (HMI) falling 2 points to 31 in December. A reading below 50 means more builders rate the housing market as bad than rate it as good. The HMI has fallen every month this year, although the pace of decline has moderated somewhat in recent months.
While the single-family starts are clearly under pressure, apartment developers appear to be in a race to get projects started before interest rates rise even higher or the credit window closes. Apartment demand has slowed the past few months, with absorption cooling off, following a surge in demand when the economy reopened from the pandemic and workers began to return to the office.
Multi-family starts rose 4.9% in November to a 599,000-unit pace. Nearly all that increase was in projects with 5 or more units, which is mostly apartments. The strength in multi-family starts adds to the extensive backlog of apartments currently under construction. There are currently 932,000 multi-family units under construction, which is the more than any other time since 1974. Part of the backlog reflects continuing problems sourcing labor and key materials, but part also reflects a surge in starts this past year, which now appear a bit overdone in some markets.
The backlog of single-family homes is beginning to come down, although it remains considerable at 777,000 homes. Single-family starts have tumbled 32.1% over the past year, which was from a pace close to peak for this cycle. Builders really began to slash starts once the Fed ramped up the pace of rate hikes around the middle of the year. Supply shortages are also less problematic than they were a year ago.

While home builders have made some progress reducing their backlogs, the environment remains challenging. There was huge spike in cancelations for new home purchases when conventional mortgage rates spiked above 7%. The rate has since moderated to under 6.5%, but many buyers remain on the sidelines. Prospective buyer traffic remains stuck at its lowest level since December 2011 and home builder confidence is back at the low hit at the onset of the pandemic. Builders have responded by cutting prices and buying down mortgage rates.
Housing permits provide some indication of where the market is headed. Single-family permits fell 7.1% in November to a 781,000-unit pace. Multi-family permits tumbled 16.4% in November. Multi-family permits are volatile, however, and it is too soon to tell if they have peaked just yet. Single-family permits are down 10.8% on a year-to-date basis, while multi-family starts are up 14.4%.
The huge backlog of homes under construction will keep builders busy through at the least the first half of 2023. Housing starts are headed much lower, however, and we suspect apartment construction has either peaked or is very close to peaking for the cycle.
Disclaimer: This publication has been prepared for informational purposes only and is not intended as a recommendation offer or solicitation with respect to the purchase or sale of any security or other financial product nor does it constitute investment advice.
November CPI: Inflation Eases in November
Better Than Expected Inflation Headlines
- The Consumer Price Index rose just 0.1% in November, bringing the year-to-year change down to 7.1%.
- Prices excluding food and energy items rose 0.2%, following a 0.3% rise the prior month. The core CPI is up 6.0% over the past year.
- Falling gasoline prices (-2%) and used car prices (-2.9%) were two of November’s largest moderating influences.
- Services prices less energy, rose 0.4%, with higher housing costs and labor-intensive services accounting for the increase. Prices for hotels and medical care services fell.
- While inflation is moving in the right direction, persistent wage gains will make it difficult to bring down services prices.
Better-Than-Expected Inflation Arrives Right on Cue
The Consumer Price Index rose less than expected in November, removing one of the last pieces of uncertainty ahead of today’s FOMC meeting. The Fed now has a green light to slow the pace of its rate hikes. We continue to expect the FOMC to raise the federal funds rate half a percentage point, which would put the new range at between 4.25-4.50%.
The overall CPI rose just 0.1% in November, while the core CPI rose 0.2%. Market expectations had called for a 0.3% gain in both. While November’s data were better than expected, inflation remains 7.1% higher than it was a year ago. Moreover, some of the factors pulling inflation lower the past few months, most notably the slide in health insurance cost, are reconciliations and will prove temporary.
Even if part of the improvement is temporary, there is no getting around the idea that inflation is moderating. We have seen the peak in the CPI. A growing number of the most problematic areas of the CPI have improved. Gasoline and used car prices are the most notable, but other areas where prices have fallen include airfares and rental cars.
Health insurance costs eased further in November, falling 4.3% following a 4.0% drop the prior month. The drop in health insurance costs reflects a reconciliation of the way insurance costs are calculated, which is based on the earnings of health care providers. Even after the most recent declines, health insurance costs remain up 13.5% year-to-year.

The modest improvement in the CPI is evident from the year-to-year data. The overall CPI peaked in June at 9.1% and has decelerated in each of the past 5 months, most of which has come from lower gasoline prices. The core CPI appears to have peaked in September at 6.6%, with declines in used car prices accounting for a large share of the improvement. Medical care costs also slowed, with hospital costs falling 0.3% and physician services flat. While welcome, the moderation here seems suspect.
There is a raging debate as to how much weight the Fed should give to the more modest improvement in the core CPI, given the heavy sway housing costs, which show up with a lag, have on the core CPI. Residential rent and owners’ equivalent rent account for just 40% of the core CPI. Both continue to increase at an elevate pace, mostly reflecting past increases. Market measures of current rents show rents are now declining in much of the country and moderating virtually everywhere else. Home prices are also falling.
While we have some sympathy for this argument, the Fed is almost certainly keeping an eye on market rents and fully understands the lags in the CPI’s housing components. That said, tenants renewing leases today are seeing their rents increase, often dramatically. Owners’ equivalent rent is also moderating far less than market measures of home prices, as only a fraction of homeowners purchase a home each year.
In short, the housing measures in the CPI are performing the way they are supposed to.
Inflation is most problematic in areas where wages account for the bulk of costs.
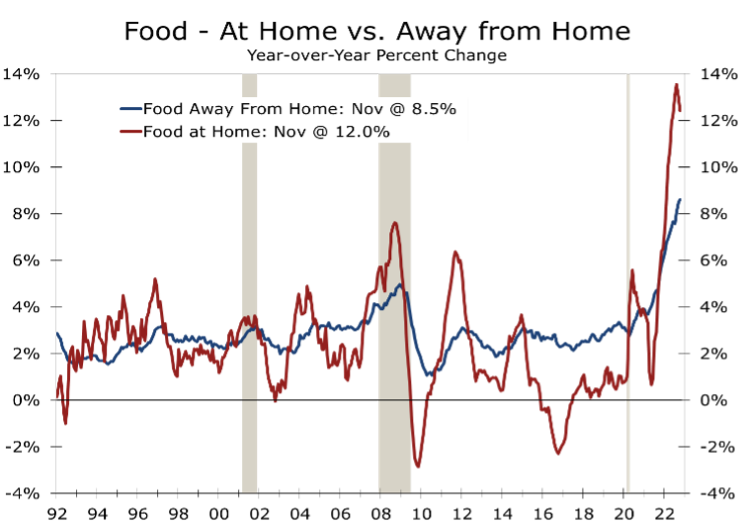
The Fed is more concerned about the persistence of inflation in labor-intensive sectors. Prices for personal care services rose 1.4% in November. Motor vehicle maintenance and repair (1.3%), recreational services (1.1%), professional services (0.9%) and restaurants (0.5%) all posted outsized price gains as well. Moreover, prices at full-service restaurants are up 9% year-to-year, while prices at less labor-intensive limited-service restaurants rose a more modest 6.7%.
The cost of dining at home has risen even faster, with prices climbing 12% over the past year. Prices have moderated somewhat more recently but still posted a 0.5% increase in November. Prices rose the fastest for cereals and bakery products, which climbed 1.1% and are now up 16.4% over the past year. By contrast, prices for beef (-5.2%) and pork (+1.2%) have fallen this past year. By contrast, poultry prices fell in November but remain up an astounding 13.1% over the past year. The split highlights a cruel irony at grocery stores, where prices for lower cost proteins have risen dramatically. Prices for lunchmeats are up 18.4% over the past year, while the price of frankfurters has risen 13.4%. The price of eggs is truly in a league of its own, however, having soared 49.1% over the past year.
The subcomponent that best captures today’s inflationary pressures is the CPI, excluding food, energy, and shelter. The trend here is moderating as well and closely follows the share of businesses raising prices. The latter is being driven by soaring labor costs.

Disclaimer: This publication has been prepared for informational purposes only and is not intended as a recommendation offer or solicitation with respect to the purchase or sale of any security or other financial product nor does it constitute investment advice.
Small Business Owners Note Modest Improvement
Slower Growth but No Recession, At Least Yet
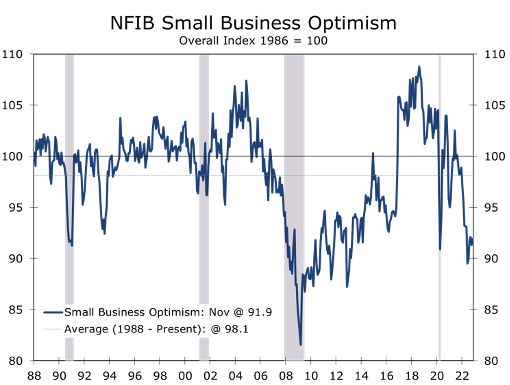
- The Small Business Optimism Index rose 0.6 points to 91.9 in November, as a growing number of business owners noted modest improvement in the business environment.
- Despite November’s slight increase, small business optimism remains below the average for its 49-year history and is also at levels consistent with past recessions.
- Six of the index’s 10 components improved in November, led by earnings, which rose by 8 points. The share of firms expecting real sales to increase also improved.
- Inflation and labor issues rank as the top concerns for businesses, although trends on both now show clear improvement.
- The NFIB report is another data point suggesting it is too soon to give up on the Fed pulling off a soft landing.
Small Business Optimism was one of the first indicators to reflect the impact of the Fed’s abrupt shift in its policy to contain inflation. The Small Business Optimism Index fell sharply as the Fed ramped up the pace of interest rate hikes and has remained below its historic average of 98 all year. While the level of small business optimism remains consistent with a recession, the index has inched higher since the middle of the year.
While we still see a recession as the most likely scenario for 2023, it is not preordained. Many of the hurdles facing business owners appear to have come down slightly over the past few months, most notably supply chain disruptions, which have been reduced significantly. Labor remains in tight supply and there is still considerable upward pressure on wages. Even here, however, there has been some improvement.
The risks to the economy remain stacked to the downside. While it rose 0.6 points in November, Small Business Optimism had tumbled 13.5 points from the June 2021 to June 2022. Declines of this magnitude have nearly always been associated with recessions. The economy clearly slowed during this period, particularly in the first part of this year, with real GDP declining in both the first and second quarters of 2022.
The improved tone of the Small Business Optimism survey continues a recent string of reports hinting a soft landing may still be possible. Consumer sentiment, retail sales and factory orders have all improved in recent months. One key determinant of whether the economy will be able to avoid a recession is whether the labor market cools off enough so the Fed will be able to raise rates less aggressively. Right now, that still looks like a distant prospect, as wages continue to rise at a pace that is inconsistent with inflation returning to the Fed’s long-run target.
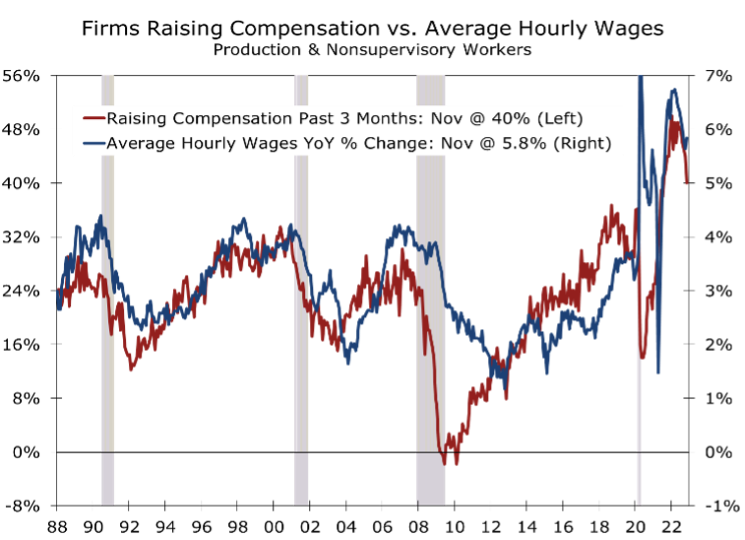
The latest data on average hourly earnings show wages up 5.8% (3-Month Moving Average basis) over the past year. While that is down from a peak of 6.8% in March, the pace is still well above what businesses can offset with productivity gains, leaving inflation well above the Fed’s 2% target.
The link between wages and inflation has become more apparent as the headline inflation data have moderated. Price increases have moderated the most for items tied to energy or supply chain bottlenecks. Prices for services that require a great deal of labor content have cooled off much less. The greater sway rising wages are playing is evident in the small business survey, which still shows an elevated 40% of firms reporting they had raised compensation during the past 3 months, which is down from 44% the prior month and a peak of 50% at the start of this year.
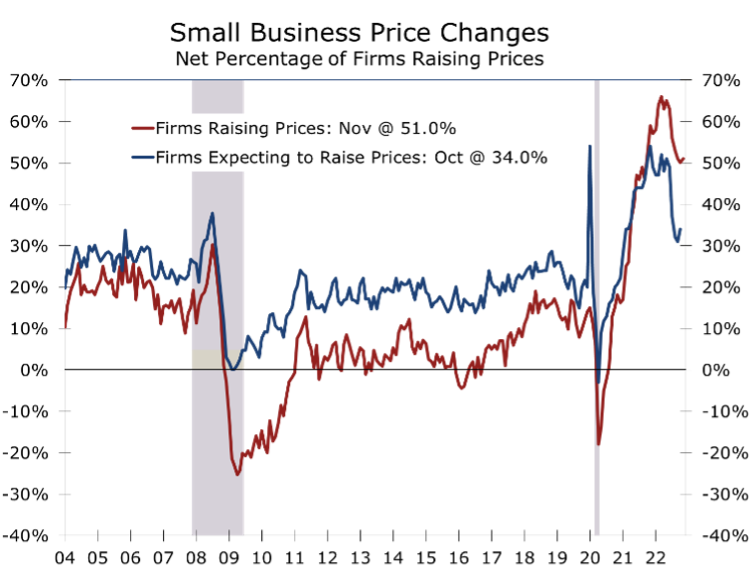
The net share of business owners reporting they raised prices over the past three months rose 1 point to 51% in November. Despite the setback, the share of businesses raising prices appears to have peaked earlier this year, hitting an all-time high of 66% in March. Even with the recent improvement, the share raising prices is still higher than it was in during the high inflation periods of the 1970s and early 1980s.
More than half of all business owners report they raised prices during the past three months.
Price increases are extraordinarily broad based. Price hikes were most prevalent in wholesale trade, with 73% of wholesalers raising prices during the past three months and zero reporting they lowered them. Other sectors where prices are rising broadly include retail trade (69% raising prices against 7% reducing prices), construction (66% raising and 5% reducing), and manufacturing (63% raising and 5% reducing). The prevalence of price gains, particularly in industries where labor costs account for a large proportion of final costs, suggests the Fed will continue to hike rates, albeit by smaller increments, until wage gains have definitively subsided.
Disclaimer: This publication has been prepared for informational purposes only and is not intended as a recommendation offer or solicitation with respect to the purchase or sale of any security or other financial product nor does it constitute investment advice.
Furniture Today: Noted economist sets expectations for 2023 recession
By Sheila Long O’Mara // Executive Editor, Furniture Today
ORLANDO, Fla. — Are we? Or aren’t we? Will we? Or won’t we? If so, when will it happen?
Those are among the top questions business leaders and most everyone else is asking in regard to whether or not the U.S. economy is in a recession or heading into one in 2023. Mark Vitner, CEO of Vitner Consulting and former managing director and senior economist with Wells Fargo, weighed in on the economy at the Furniture Today Leadership Conference here and predicted that it’s 60-40 that we’ll see a recession next year.
In a wide-ranging, on-stage interview with Bill McLoughlin, Furniture Today editor in chief, Vitner summed up the economy best by saying “it’s complicated.”
“It’s more complicated than it has been for some time,” Vitner said. “During the pandemic, the stimulus checks created a false boost. The supply chain bottlenecks have gotten better by some metrics and worse by others. It’s a very confusing time.”
This article was originally published in FurnitureToday. Read the complete article here.
Online Athens: UGA economist sees a 2023 recession ahead for Georgia, nation
By Dave Williams, Capitol Beat
ATLANTA − Georgia’s economy will enter a mild, short recession early next year that should only persist for about six months, the dean of the University of Georgia’s Terry College of Business said Friday.
The downturn will be prompted by the series of interest rate hikes the Federal Reserve board has ordered this year to curb inflation, rising energy prices brought on by the war in Ukraine and hits to personal wealth including a down stock market, Ben Ayers told a luncheon audience at the Georgia Aquarium in downtown Atlanta.
Georgia, however, is better positioned than other states to weather the recession because of its strong labor market and several major economic development projects that will pour investment into the state and create jobs, Ayers said.
....
Nationally, low- and middle-income families will be hit hardest by the recession, said Mark Vitner, founder and chief economist at North Carolina-based Piedmont Crescent Capital. Those income groups will have a particularly difficult time coping with higher food, energy, and rent costs, Vitner said.
“For half of the country, the inflation rate is essentially doubled, 18% to 20%,” he said. “Real purchasing power has been wiped out.”
While Vitner held out hope the U.S. economy will experience a soft landing from the coming recession, he said it’s more likely there will be a series of “rolling recessions” such as persisted during the 1980s.
Vitner said the only solution to the recession lies in getting inflation down. Still, he agreed with Ayers that the coming downturn won’t be as steep as the Great Recession. He said the approaching recession likely will be followed by slow growth during the next two to three years.
This article was originally published in Online Athens. Read the full article here.
Payrolls Once Again Top Expectations
One of the things you can almost always count on with the monthly employment report is plenty of surprises. The November report did not let us down on that front. Nonfarm payrolls rose by a much hotter than expected 263,000 jobs in November, versus a consensus estimate of around 190,000 jobs. Expectations had been whittled away all week, with weaker reports from many of the high-frequency series, the monthly ADP report and employment components in both the consumer confidence and ISM manufacturing surveys.
The Labor Market is Proving Resilient
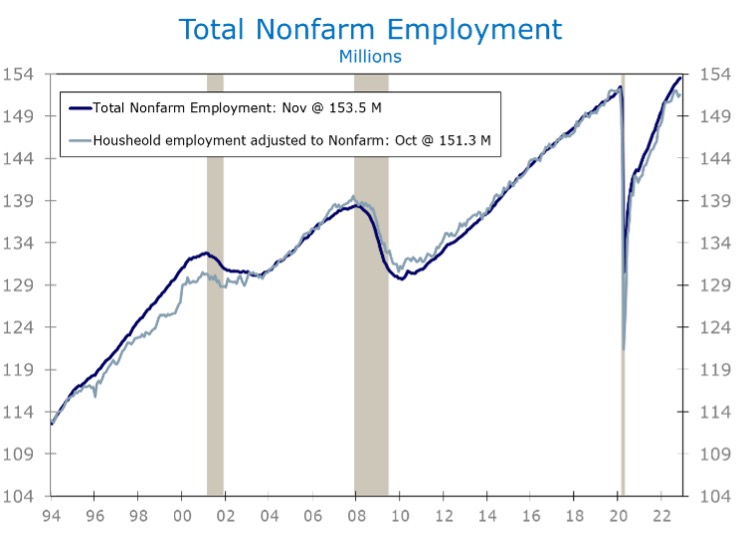
- Nonfarm employment easily topped expectations in November, with employers adding 263,000 jobs.
- Hiring continues to be led by industries that suffered the largest losses during the pandemic and reopened slowly. Leisure and hospitality, health care and government all posted outsized job gains this past month.
- November’s 263,000-job gain is only modestly below the 282,000 jobs added on average during the prior 3 months. Employers have added an average of 392,000 jobs a month this year, down from 562,000 a month in 2021.
- The unemployment rate was unchanged at 3.7%. Both the labor force participation rate and employment-population ratio fell 0.1 percentage point.
- Average hourly earnings jumped 0.6% in November, nearly twice what was expected, and is now up 5.1% year-to-year.
The key initial takeaway from November’s stronger job gain is the Fed has more work to do. While that is certainly understandable, we would be remiss not to caution folks of the oft repeated maxim that monetary policy works with a long and variable lag. Moreover, labor market conditions are a lagging economic indicator and have become even more so in recent years, as employment in the most cyclical parts of the economy has become a smaller part of the employment base. We still see plenty of evidence that employment conditions are losing momentum, particularly in the more cyclical parts of the economy.
Household employment typically tops out before nonfarm employment. While this series is more volatile, the BLS has made it somewhat easier to compare it to the more widely followed nonfarm series. On a nonfarm employment adjusted basis, household employment rose by 228,000 in November, after tumbling by 761,000 the prior month. While it is too early to call a top, the household series looks like what we saw at previous cyclical peaks.
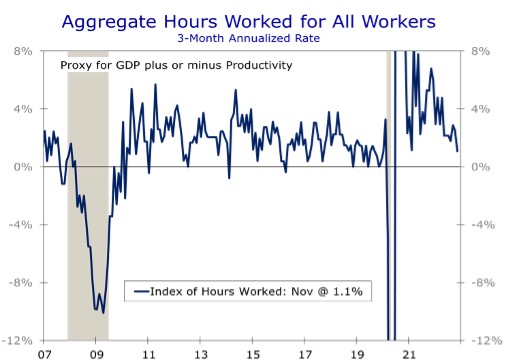
Another series we follow closely is aggregate hours worked, which is a good proxy for real GDP growth. Aggregate hours worked fell 0.2% in November and have risen at just a 1.1% over the past three months. That pace is still consistent with positive real GDP growth, but at a notably slower pace. Aggregate hours worked rose at 2.9% annual rate during the three months ended in September, when real GDP subsequently grew at a 2.9% pace.
There are several other aspects of the employment report pointing toward slower growth. Hiring at temporary staffing companies, a reliable leading indicator for future job growth, declined by 17,200 jobs in November, following a 6,100-job loss the prior month. There was also far less hiring at retailers and of warehouse and delivery workers than usual this time of year, leading to seasonally adjusted job losses.
The key takeaway from November’s stronger job gain is the Fed has more work to do.
Even after taking all the weaker aspects of November’s employment report into account, a recession now appears to be a more distant prospect than it was a month ago. That is good news for the Fed, which has made it clear they need to push short-term interest rates higher to bring inflation back down to their 2% target. We expect a half point hike in December and look for another half point hike in early February, followed by quarter-point hikes at the next few meetings after that.
While a recession is further off, economic growth will slow further. We still see a better than even chance of a downturn beginning around the middle of 2023. Soft landings are hard to pull off and even harder to maintain.
The bulk of November’s job growth came from parts of the economy where employment was hit particularly hard during the pandemic and hiring has been slow to recover. Leisure and hospitality added 88,000 jobs in November, 62,000 of which were at restaurants and bars. Employment in the sector remains 980,000 jobs below its pre-pandemic peak.
Hospitals, doctors’ offices, and dentists’ offices all suffered huge job losses at the start of the pandemic, as did nursing homes, day care centers and social service providers. All have been slow to rehire but have seen hiring pick up more recently. Health care providers added 45,000 jobs in November and have added an average of 47,000 jobs a month in 2022. The sector added an average of just 9,000 jobs a month in 2021. Employment in social services increased by 23,000 in November and has added an average of 18,000 jobs a month this year.
Considerable attention has been focused on the surge of layoffs at well-known tech firms. So far, those cutbacks have not shown up in the official data. Professional and technical services added 27,900 jobs in November and another 19,000 jobs were added in the information sector. The cutbacks are real, however, and we expect them to become apparent in coming months. We are already seeing spillover into other parts of the economy in many tech-centric areas.
November’s data may prove to be a harbinger of what we will see in coming months. Industries that were slower to add back staff following the pandemic still have a great deal of hiring to do before they are fully staffed. A visit to just about any restaurant will attest to this. At the same time, the pain in the tech and housing sectors is just beginning and those cutbacks will eventually flow through to the monthly jobs data.
Disclaimer: This publication has been prepared for informational purposes only and is not intended as a recommendation offer or solicitation with respect to the purchase or sale of any security or other financial product nor does it constitute investment advice.
Third Quarter GDP Growth Comes In Stronger
The BEA’s second look at third quarter real GDP growth revealed the economy grew at a slightly stronger pace, with real GDP climbing at a 2.9% annual rate. The increase follows two consecutive quarterly declines during the first half of the year and pushes back on some of the talk that a recession is imminent. Upward revisions to consumer spending and business investment offset a downward revision to inventory building. Imports were also revised lower.
Underlying Momentum Remains Soft
- Real GDP growth was revised up 0.3 pp to a 2.9% annual rate for the third quarter.
- Stronger growth during the third quarter now slightly offsets the declines during the two prior quarters, leaving real GDP 0.1% higher than it ended 2021.
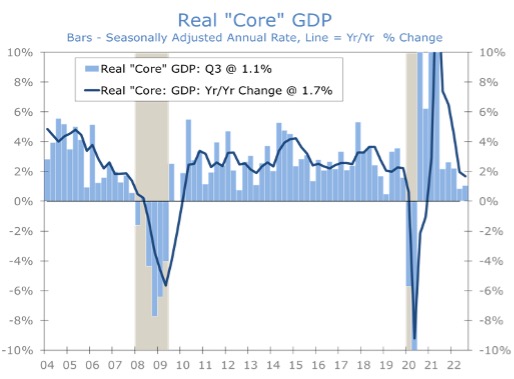
- The headline number once again creates a misperception about the economy’s underlying momentum. Real final sales to private domestic purchasers, our preferred output measure, rose at just a 0.5% annual rate for the second quarter in a row.
- Gross Domestic Income was also surprisingly weak, rising at just a 0.3% annual rate after falling at an 0.8% pace in the prior quarter.
- Inflation rose slightly faster than first reported. The core PCE price index rose at a 4.6% annual rate, up from a previous 4.5%.
- Corporate profits declined by $31.6 billion in Q3, and profit margins narrowed to 11.6% of GDP, down from 12.1% a year ago.
Even taken at face value, the third quarter rebound in real GDP merely brings output a smidgen above where it began the year. Moreover, the underlying details still show the economy losing momentum, particularly in the more interest-rate sensitive sectors, such as housing and business fixed investment.

Consumer spending also remains under pressure, with higher prices for food, energy and housing causing consumers to cut back on discretionary spending. Spending on goods fell at a 0.2% annual rate, marking the third consecutive quarterly drop. The latest drop was led by declines in outlays for motor vehicles and food and beverages. The latter partly reflects an outlet bias, with consumers’ grocery purchases shifting toward less expensive food items at less expensive outlets, including wholesale clubs, discount stores and farmers markets. Overall consumer outlays rose at a 1.7% pace, with services accounting for the entire gain.
Housing was clearly the weak spot in Q3. Residential investment plummeted at a 26.8% annual rate, marking the steepest drop since the onset of the pandemic. Nearly all the drop has been in single-family home building and lower commissions on the sale of existing homes. Apartment construction is still going strong, although leasing has slowed, and vacancy rates are now trending higher.
Business fixed investment rose at a 5.1% annual rate during the third quarter, with increased spending on equipment and intellectual property offsetting a 6.9% SAAR drop in nonresidential structures. Most of that was in commercial construction. Oil and gas exploration increased during the quarter.
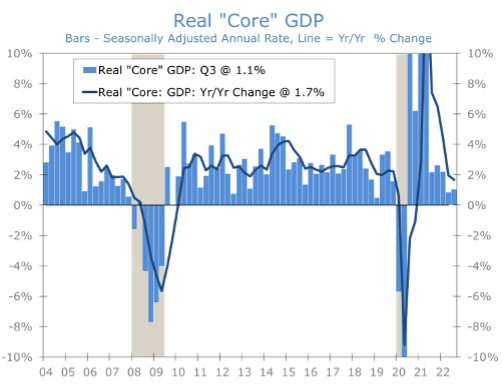
Taken together, consumer spending, housing and business fixed investment constitute what we like to call core GDP. This is the part of the economy that is most directly influenced by monetary policy. Core GDP has averaged just a 1% pace over the past two quarters and is now up 1.7% over the past year. That looks and awful lot like a soft landing. Unfortunately, conditions also look like they are getting even softer.
While growth will likely slow further, the economy is not yet on the cusp of recession. The revised GDP data suggest a recession is a little further out than previously thought. The fourth quarter should be solidly positive, with output expanding at around 1.5% annual rate. Consumer spending got off to a solid start in October and early reports suggest the holiday shopping season is off to a strong start.
Housing will clearly continue to lose momentum. While October’s new home sales came in higher than expected, the data omit cancelations, which have surged over the past three months. Pending home sales, which tend to lead existing home sales by 1-2 months, tumbled a further 4.6% in October. That drop combined with lower home prices, means broker commissions will fall ever further in Q4.
While housing appears set to be a drag on economic growth over the next few quarters, the economy should get a modest boost from inventory building. Inventory building during Q3 was revised lower, subtracting a full percentage point from economic growth. Farm inventories fell sharply again, while nonfarm inventories rose by $66.4 billion, down from $123.6 billion in the prior quarter. We suspect the slowdown in nonfarm inventories is due to container traffic being rerouted to the East Coast ahead of possible port disruptions and look for a rebound in Q4.
The revised GDP data suggest a recession is a little further out than previously thought.
The GDP report also provided the first look at corporate profits, which are proving unexpectedly resilient. While profits fell by $31.6 billion, all the drop was in the financial sector, with Federal Reserve Banks booking all the loss there. Nonfinancial profits edged 0.3% higher. Stronger profits should aid capital spending and reduce the need for job cuts.
Disclaimer: This publication has been prepared for informational purposes only and is not intended as a recommendation offer or solicitation with respect to the purchase or sale of any security or other financial product nor does it constitute investment advice.
New Home Sales Rise Unexpectedly in October
New home sales came in well above expectations in October, with sales climbing 7.5% to a 632,000-unit annual rate. The increase is at odds with what builders are saying. Most builders have reported a dearth of buyer traffic this fall and have been discounting prices to move inventory. Moreover, many builders have reported a spike in cancelations, which explains a large part of the sharp rise in inventories of completed homes over the past three months.
Notably Weaker Beyond the Headline
- New home sales rose 7.5% in October to a 632,000-unit pace.
- Sales for August and September were revised lower by a combined 31,000. On a year-to-date basis, new home sales are now running 14.2% below their year-ago pace.
- Even that decline understates the extent of the slowdown, however, as Census new home sales do not include cancelations, which have spiked the past few months.
- The South accounted for much of October’s gain, with sales rising 16%. Sales also rose in Northeast but fell in the Midwest and West.
- Sales of higher priced homes are holding up relatively well, which is a big reason why the median price rose 8.2% to $493,000.
- Home builders have grown increasingly cautious and are discounting more aggressively to work down inventories.
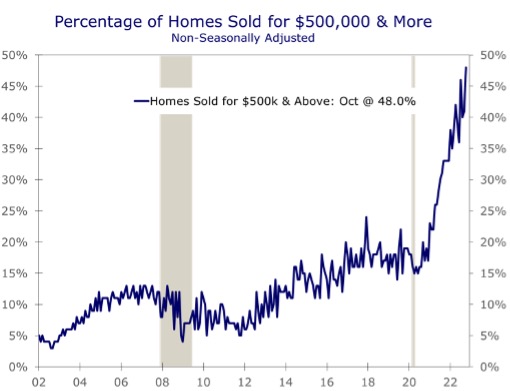
While October’s rise in new home sales overstates the strength in the housing market, the report still contains some valuable insights. For starters, discounts are bringing buyers back into the market, particularly at higher price points. Sales of homes priced above $500,000 rose 15% in October (NSA) and accounted for a record-high 48% of all new home sales. Buyers at these price points tend to be less adversely impacted by higher inflation. Many also sold homes in higher priced parts of the country and relocated to metro areas where homes are more modestly priced, particularly the South, which offsets some of the sting from higher mortgage rates.
Home builders also have considerably more room to discount prices at the upper end of the market and those discounts likely brought out more buyers in October. Profit margins had widened considerably during the boom that followed the lockdown at the start of the pandemic, as demand surged, and shortages of key building products and skilled workers restrained home construction. Supply constraints have eased considerably in recent months, and lumber prices and prices of other materials have fallen sharply.
One of the reasons those discounts have not shown up in a lower median or average price, is that sales have been much weaker at the lower end of the market. Sales of homes priced between $400,000 and $499,999 accounted for 21% of sales, which is down from the prior month but roughly equal with its average from the prior 6 months. By contrast, the share of homes sold for between $300,000 and $399,999 tumbled 9 percentage points in October to 18%, marking the smallest share for this price segment in more than 5 years.
The middle and lower end of the housing market are clearly more challenged today. Buyers for homes priced at or below the median price have been disproportionately impacted by soaring inflation and higher interest rates. Many would-be home buyers are having more difficulty qualifying for a mortgage and the higher monthly payments are harder to handle with costs of other essentials already taking a larger bite out of household budgets. Given these constraints, it is hardly as surprise that entry level buyers account for the bulk of contract cancelations.
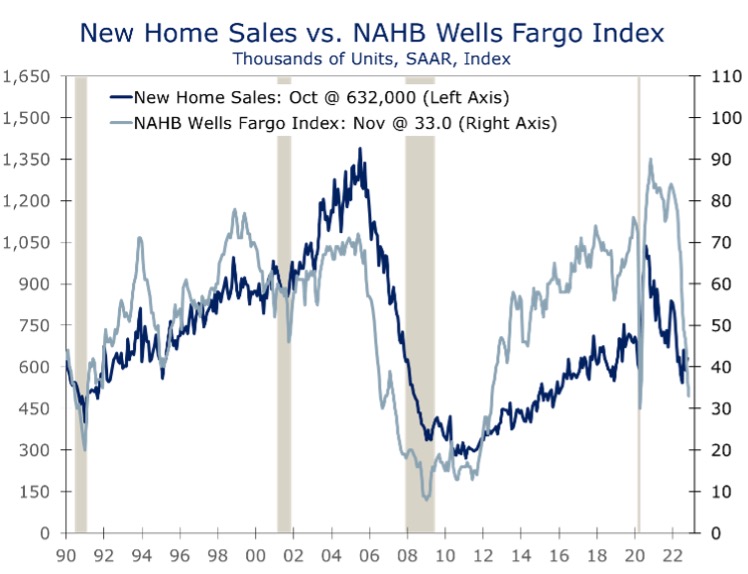
The problems around the middle and lower end of the housing market are why home builder confidence has plummeted as much as it has. The NAHB/Wells Fargo Home Housing Market Index fell to 33 in November and is a whopping 51 points below where it began the year. Nearly two-thirds of that drop has occurred since May. Home builder confidence is now at its lowest level since June 2012. Builders are undoubtedly concerned about the recent surge in contract cancelations and protracted slowdown in buyer traffic.
Unfortunately, there is little builders can do in the short run to shore up traffic or curb cancelations. There is simply less room to discount homes at the middle of the market and at lower price points. The net result is inventories of unsold homes are rising.
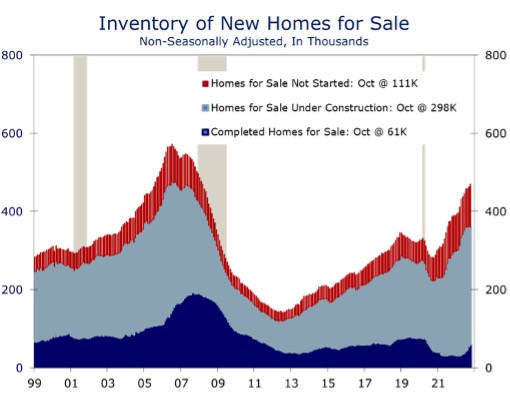
New home inventory is broken out into three categories: homes not started, under construction and completed. The latter was at record lows through most of 2021 but has nearly doubled since the start of this year. Inventories of homes under construction have fallen slightly but still account for an outsized 63% of new home inventories. Builders are holding off starting new homes until cancelations slow and homes under construction decline further.
Homebuilders are not nearly as optimistic about the housing market as October’s surprising rise in new home sales would suggest.
High inventories of homes under construction and the rising number of completed homes for sale has put builders on the defensive. Builders are holding off on starting new projects and trimming costs where possible, including reducing staff.
Disclaimer: This publication has been prepared for informational purposes only and is not intended as a recommendation offer or solicitation with respect to the purchase or sale of any security or other financial product nor does it constitute investment advice.
Charlotte Economist Mark Vitner Retires from Wells Fargo
Mark Vitner, a senior economist at Wells Fargo Securities, is retiring after working nearly three decades with the bank in Charlotte.
From the Charlotte Observer. Read the full article here.