Manufacturing Shows Some Unexpected Resilience
Sounder Footing on a Weakening Foundation
- The ISM Manufacturing Index rose 1.4 points in September to 49.0, marking the 11th consecutive month in contraction territory.
- Employment (+2.7 points), Production (+2.5) and New Orders (+2.4) all rose solidly in September, while Supplier Deliveries (-2.2) and Prices Paid (-4.6) fell sharply.
- With this past month’s increases, the Employment (51.2) and Production (52.5) series moved back into expansion territory.
- The sharp decline in the Prices paid index is surprising given the recent spike in oil prices and suggests inflationary pressures in goods are moderating.
- Customer inventories fell 1.6 points to 47.1, which is relatively low and might provide a near-term boost to orders and output.
- Export orders rose 0.9 points higher to 47.4, while Import orders crept 0.2 points higher to 48.2.
- September’s strong ISM report likely overstates the strength in the factory sector. While the manufacturing PMI rose, it remained below the 50 break-even level, which means the slowdown in the factory sector merely moderated, it did not reverse.
The ISM Manufacturing report is one of the key pieces of economic data released each month because it provides insight into the breadth of strength or weakness in the most cyclical part of the economy. The latest reading suggests the economy continues to expand, despite growing headwinds from rising interest rates, higher inflation, and labor unrest.
The Manufacturing PMI is derived from a survey of manufacturing purchasing and logistics managers that ask them about the state of their business. The index is derived from the net difference in the number of responses stating key aspects of their business are improving or weaking. A reading above 50 means more managers see conditions improving than seeing them weakening.
The Manufacturing PMI rose 1.4 points in September to 49.0, marking the 11th consecutive month the PMI has been below the key 50 breakeven level, signaling another month of contraction in the factory sector. This past month’s rise in the index means the pace at which manufacturing activity contracted at moderated in September.
September’s rise in the PMI means the contraction in manufacturing moderated.
With the latest increase, the monthly PMI is now back above its trailing 12-month average, which has typically signaled a turning point for the factory sector. The 12-month average peaked 22 months ago, as the economy came roaring back after the pandemic.
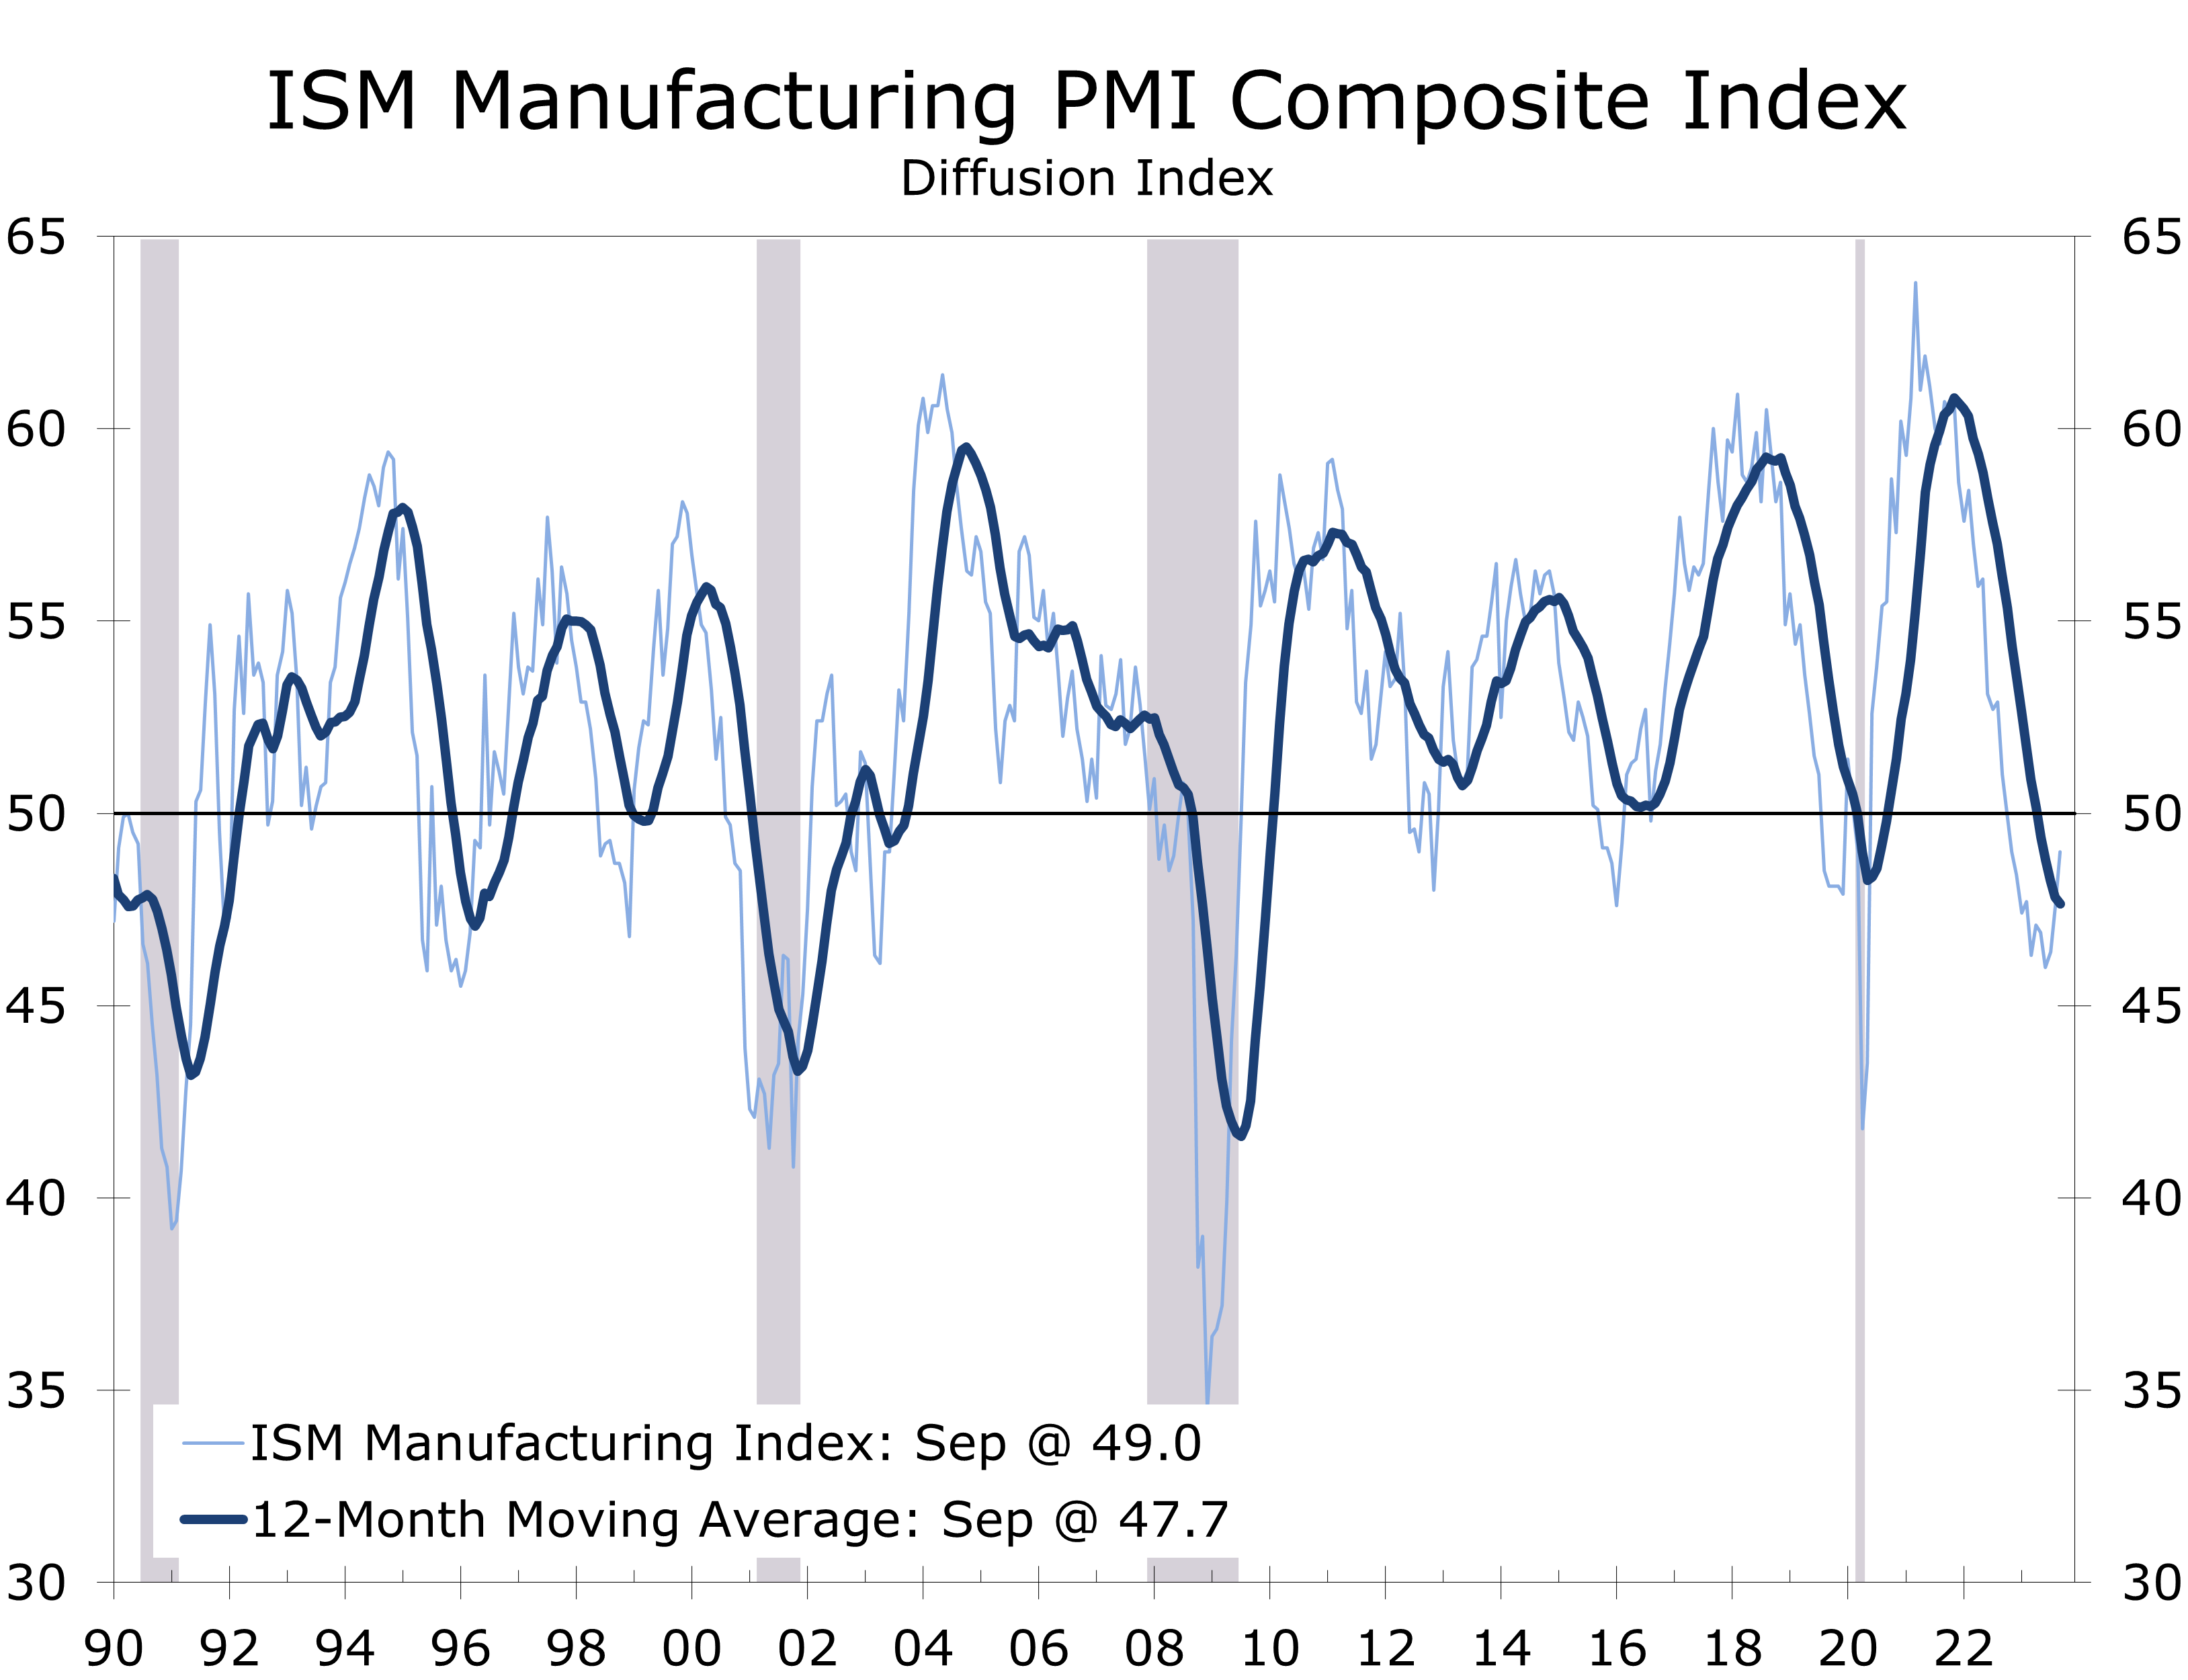
On the surface, the September ISM report is encouraging. Four of the 5 components that directly factor into computing the PMI improved in September, and two components rose back into positive territory. The Employment index rose 2.7 points to 51.2, reaching its highest level since May, while the Production index rose 2.5 points to 52.5.
The New Orders index rose 2.4 points but remained in contraction territory at 49.2, while the Inventories index rose 1.8 points to 45.8. The Supplier Deliveries index fell 2.2 points to 46.4. Taken together, these data suggest businesses have reduced inventories in order to conserve cash, which is what typically happens when short-term interest rates increase. The rise in orders also suggests output might see some additional improvement.
Businesses have reduced inventories in order to conserve cash as interest rates have risen.
We doubt September marks a major turn for the factory sector, however, as the improvement still remains fairly narrowly based. Only 5 industries reported improving conditions in September (Nonmetallic Mineral Products; Food, Beverage & Tobacco Products; Textile Mills; Primary Metals; and Petroleum and Coal Products), while 11 industries reported conditions continued to deteriorate.
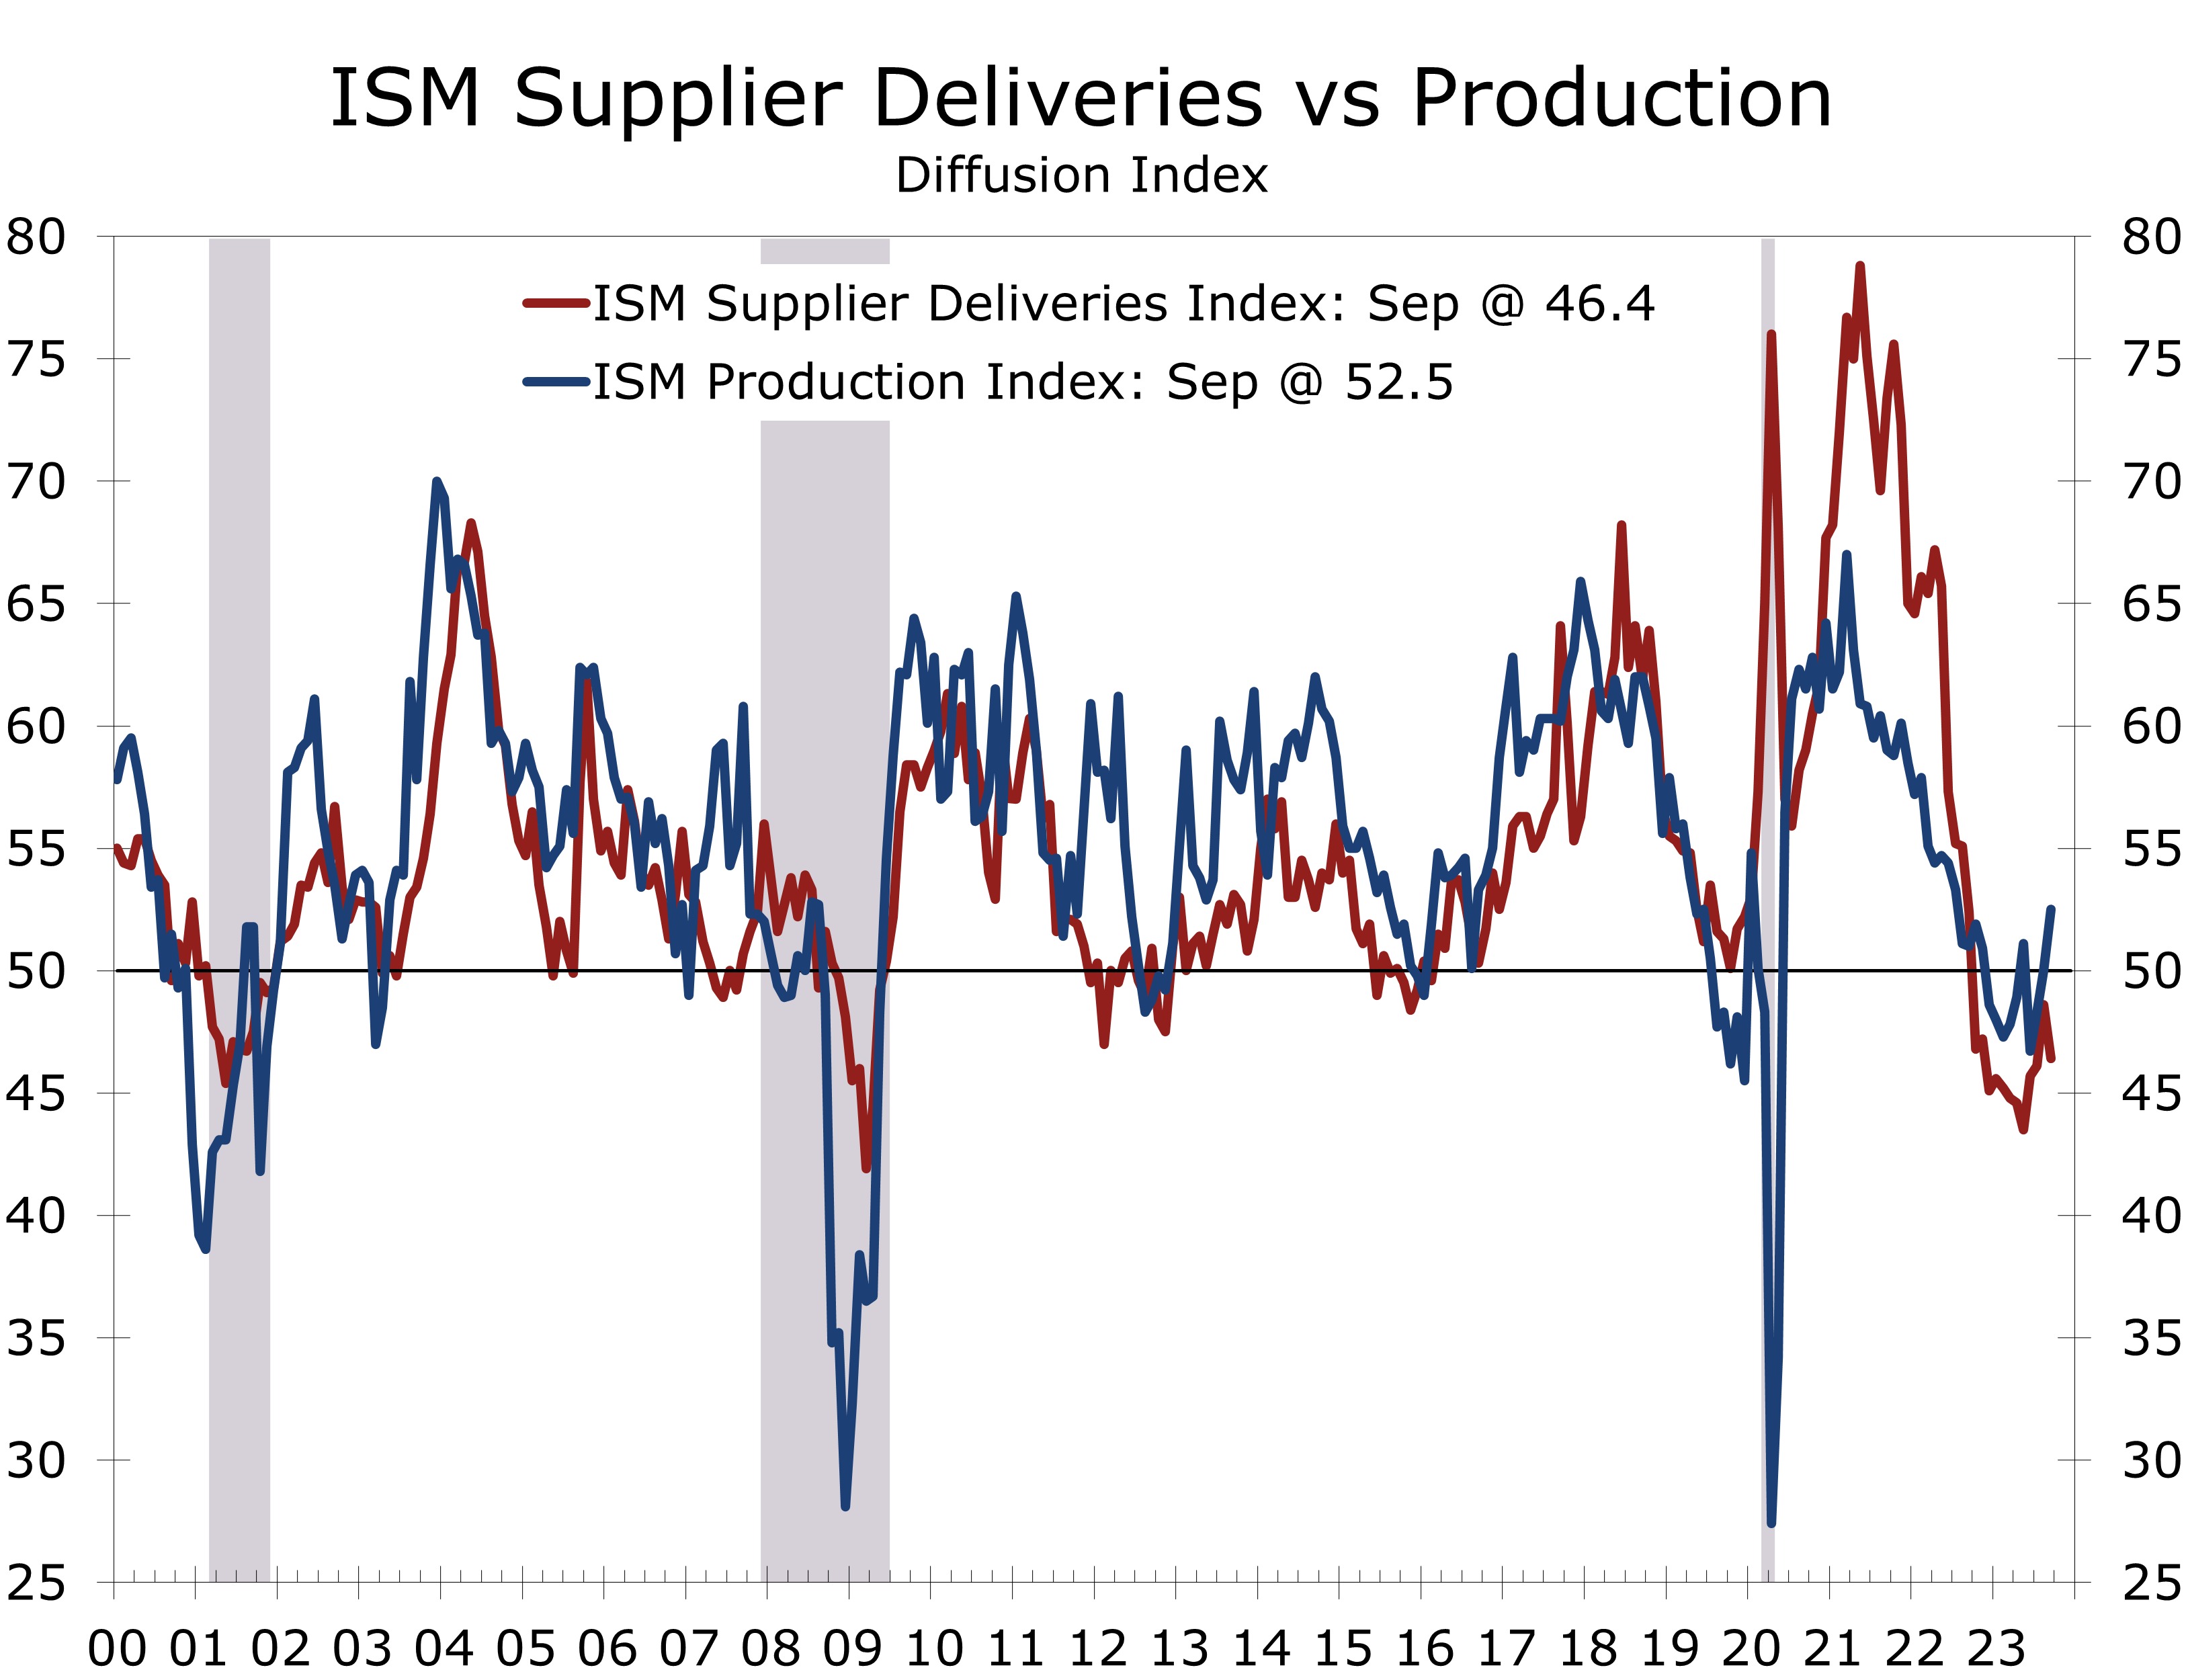
We suspect some of the recent improvement in production and employment is coming from a further lessening of supply chain disruptions. The Supplier Deliveries and Production indices typically move together. The extreme difficulty in bringing supply chains back up following the pandemic caused delivery times to lengthen considerably and pulled the supplier delivery index to all-time highs. With supply chains less of a headwind, production is getting a slight boost.
The improvement in production and employment may not have much staying power. The unfilled orders index fell 1.7 points and remains exceptionally low at 42.4 on a monthly basis and the 12-month moving average is a smidgen below that at 42.3. The unfilled orders series is strongly correlated with employment, and the most recent reading suggest manufacturers will be paring payrolls in 2024.
The Prices Paid series tumbled 4.6 points in September to 43.8, despite sharp increases in energy prices. The list of products where prices are falling grew longer, led by aluminum, caustic soda, corrugated boxes, and ocean shipping rates. The list of commodities in short supply also grew shorter and continues to be led by electrical components and equipment.

Disclaimer: This publication has been prepared for informational purposes only and is not intended as a recommendation offer or solicitation with respect to the purchase or sale of any security or other financial product nor does it constitute investment advice.
New Home Sales Decline Modestly in August and Consumer Confidence Fell Further in September
Softer Economic Data Headed into the Fall
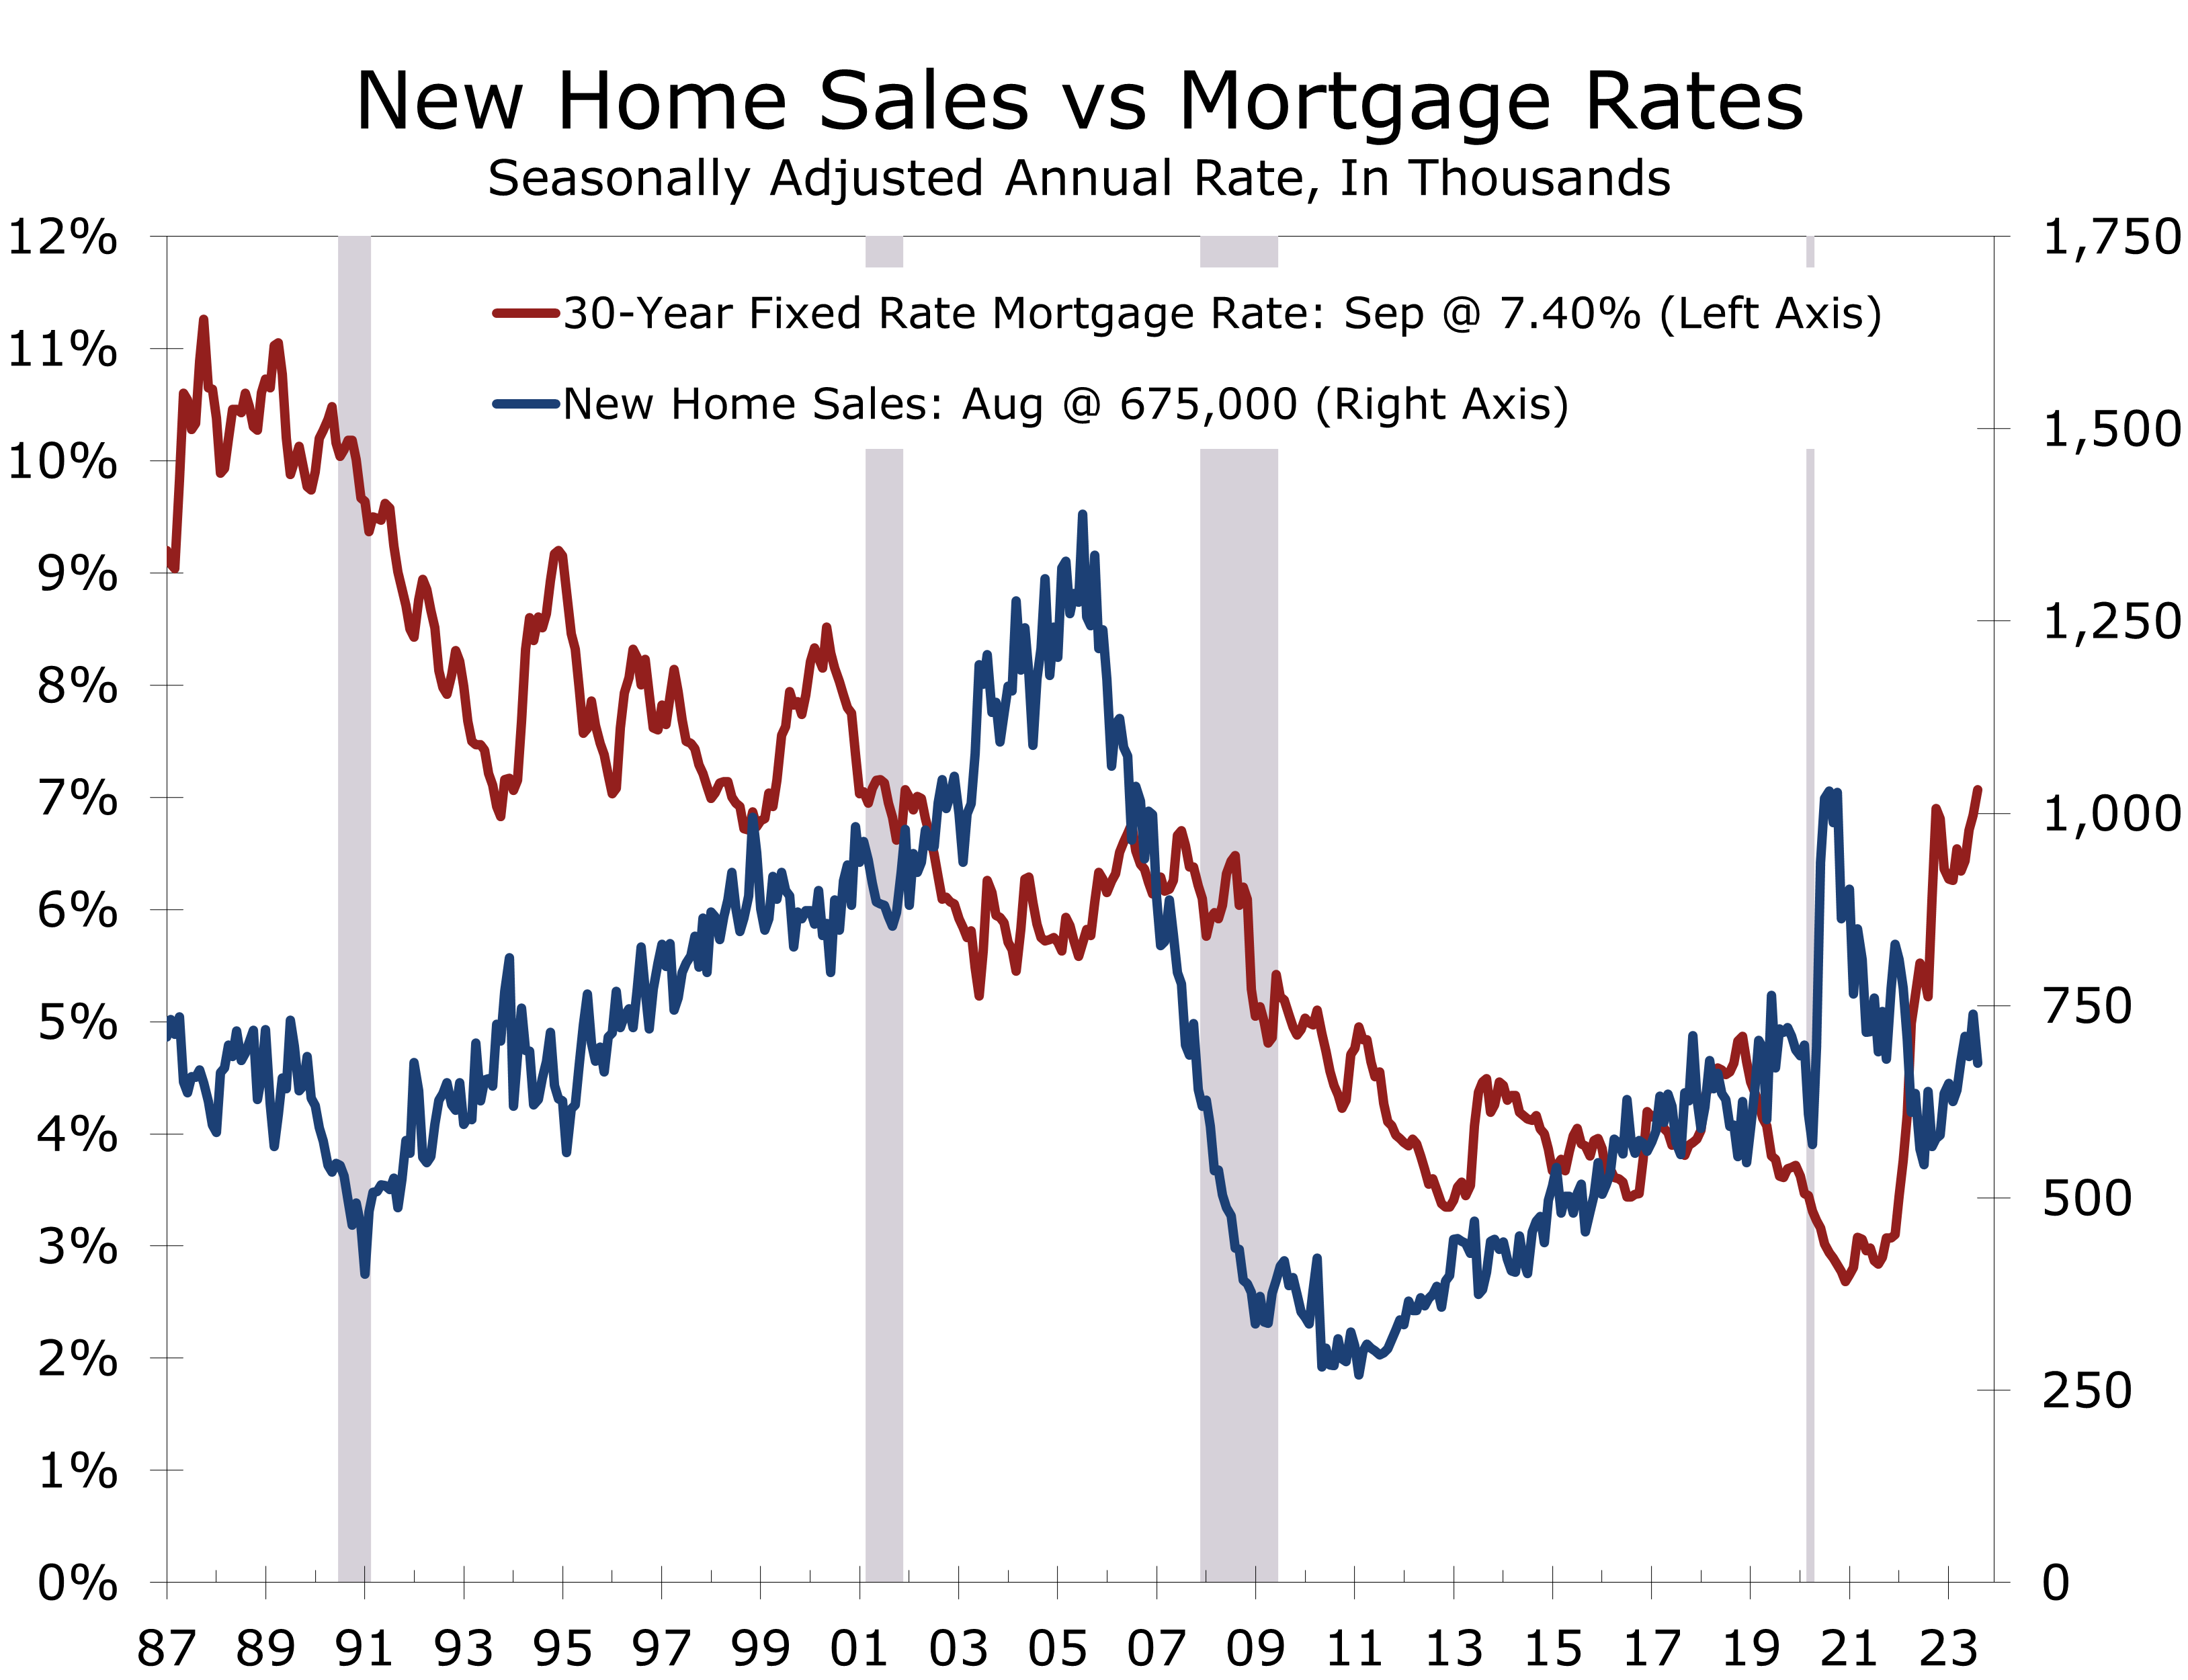
- New home sales fell 8.7% in August to a 675,000-unit pace. July sales were revised higher, which reduces much of the sting from the larger-than-expected August drop.
- Sales rose in the Northeast (+6.7%) but fell in the Midwest (-17.2%), West (-9.4%) and South (-7.5%).
- The inventory of new homes rose slightly in August to 436,000 homes, which translates into a 7.8-month supply.
- The median price of a new home fell to $430,300 in August and is down 2.3% over the past year.
- Home price data was released separately this morning, which continues to show strong price appreciation for existing homes.
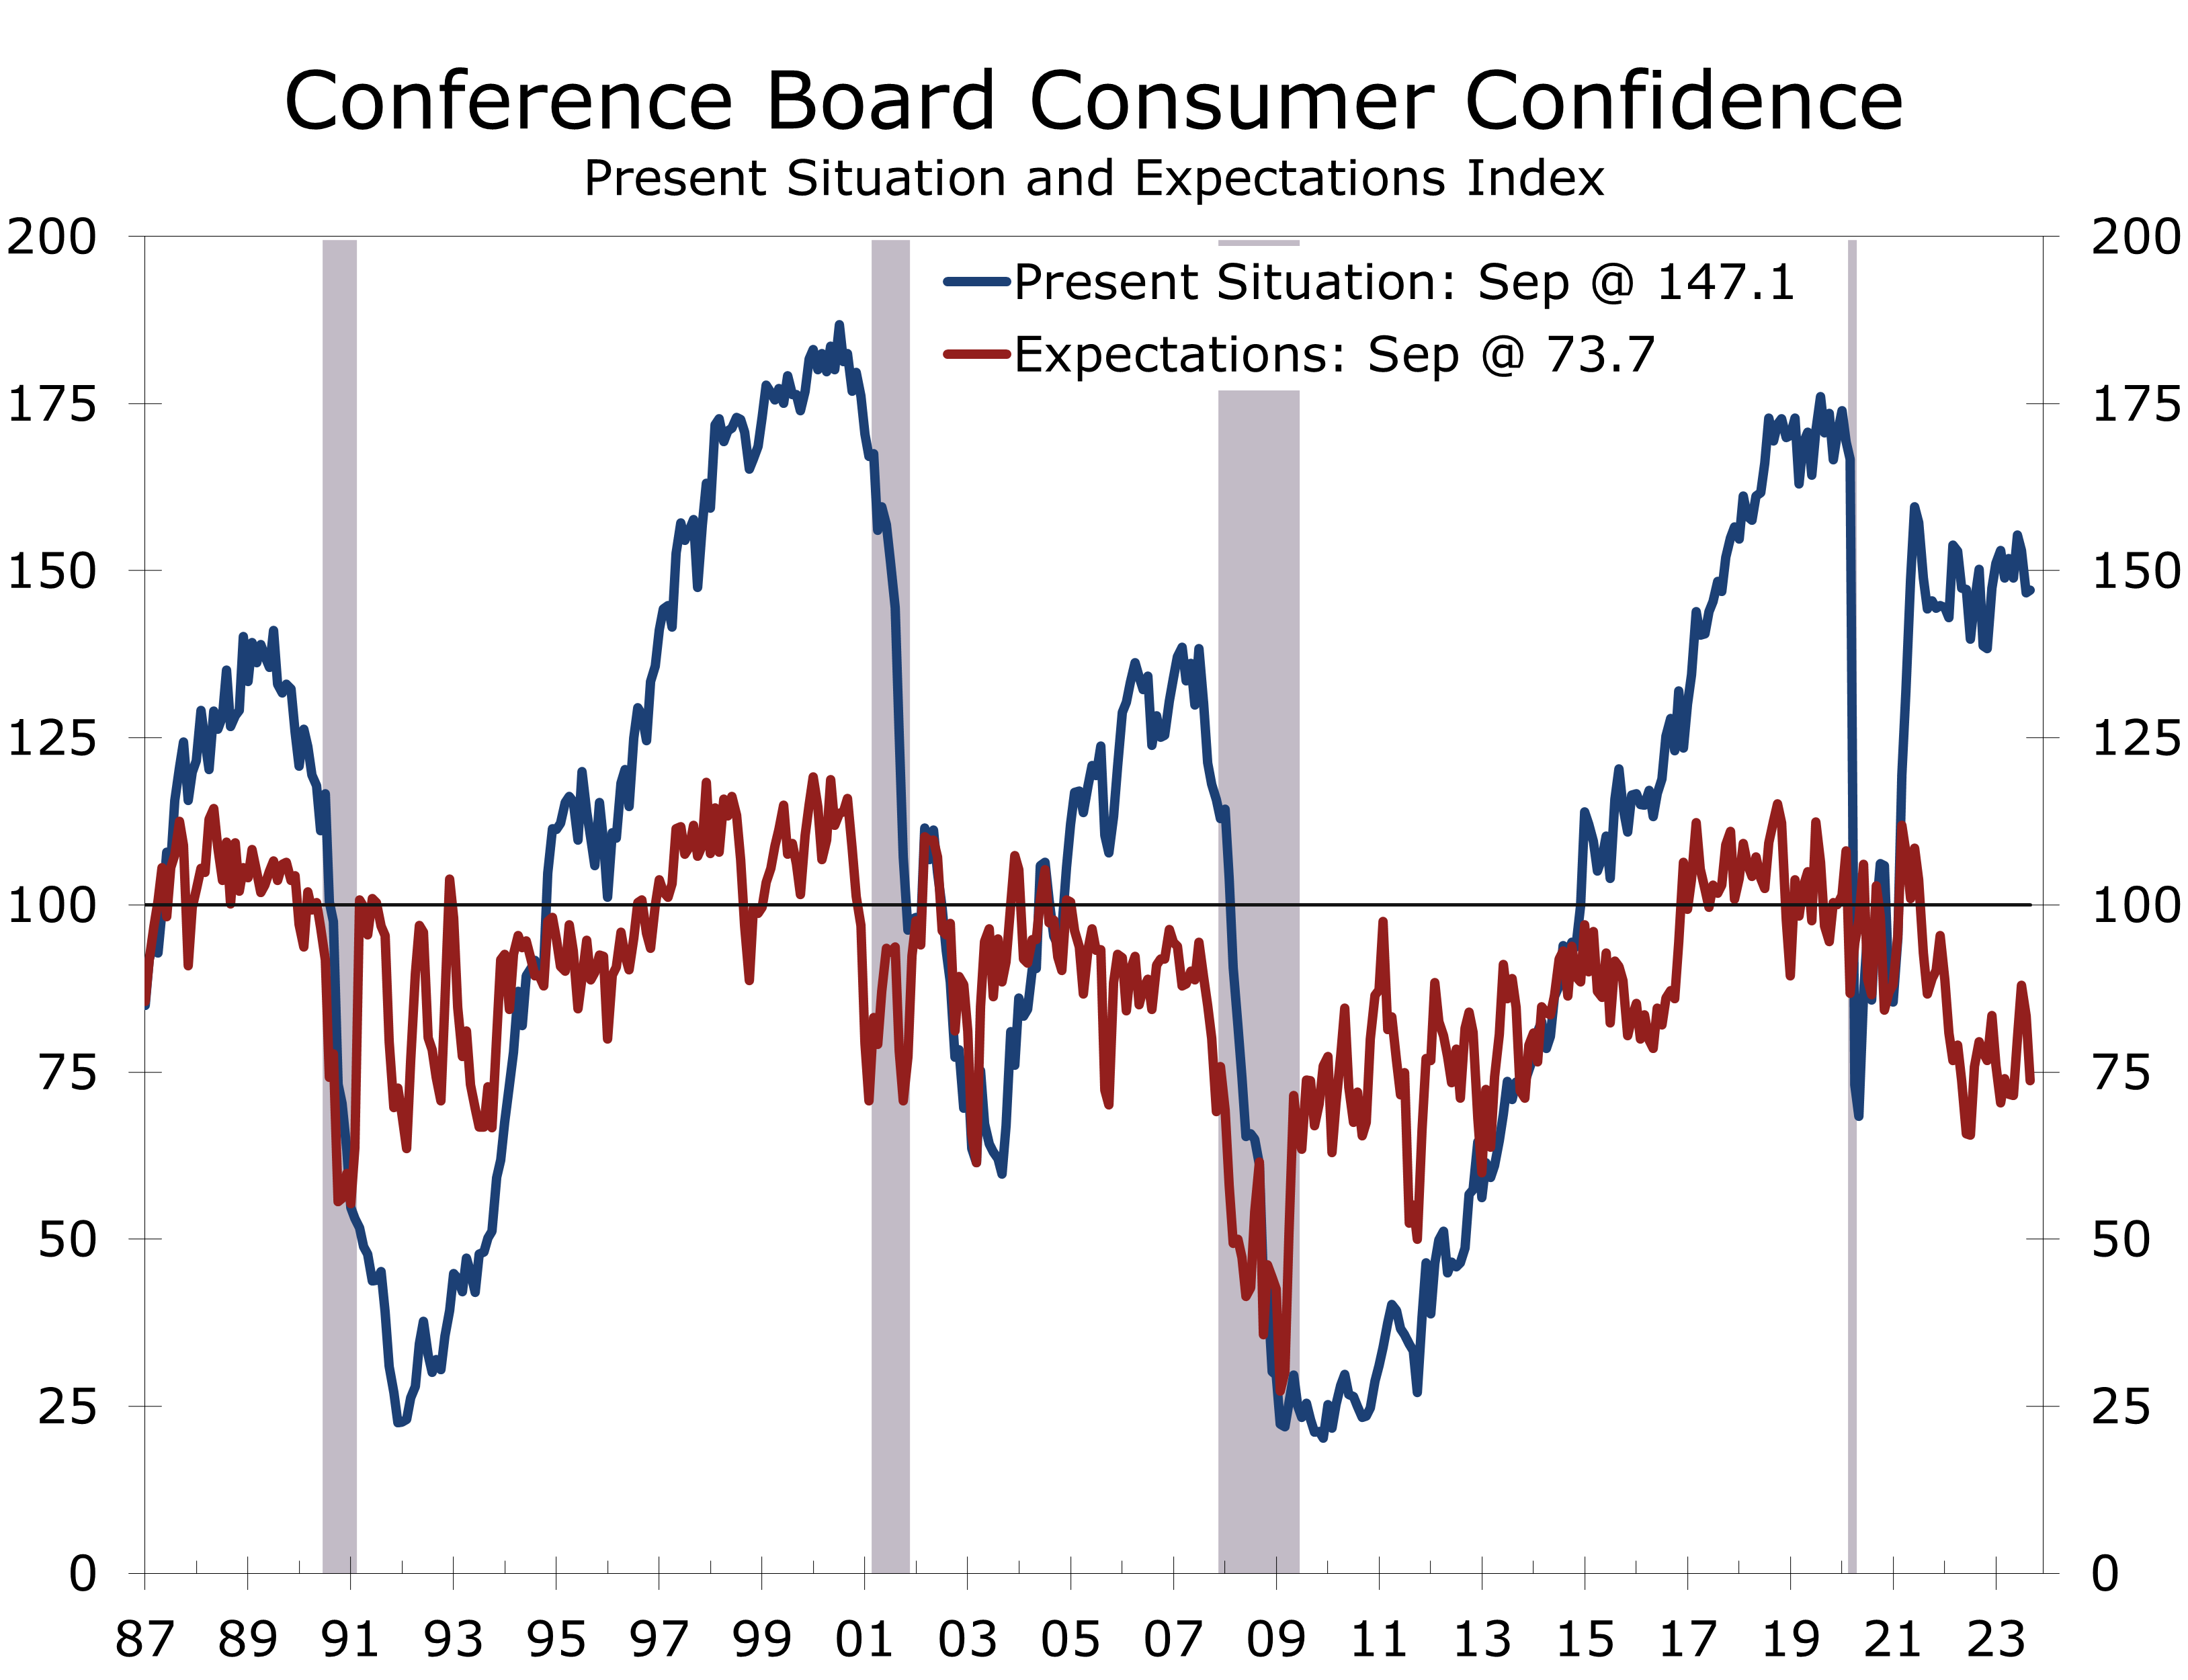
- Consumer Confidence declined more than expected in September, reflecting growing concerns about higher food and energy prices, and rising interest rates.
- On balance, today’s economic reports show higher interest rates and higher gasoline prices are beginning to chip away at the economy’s surprising resilience. After what looks to be a strong Q3, we look for growth to slow in the final quarter of this year.
New home sales fell 8.7% in August to a 675,000-unit pace. The drop was slightly larger than expected but an upward revision to the July data left sales fairly close to consensus expectations. New home sales are coming under pressure from higher mortgage rates, which rose above 7.50% in late September.
Home builders have benefitted from the persistent shortage of existing homes throughout much of this year, which allowed new home sales to rise even as mortgage rates increased. Sales have been under pressure ever since mortgage rates topped 7%, however. Earlier this month, home builders reported that buyer traffic fell 5 points in September to 30, following a 5-point drop in August. Realtors also reported an uptick in contract cancelations on existing homes, as mortgage rates rose more than expected ahead of closing.
New home sales have come under pressure ever since mortgage rates rose above 7%.
Builders are becoming more cautious. Higher interest rates, higher home prices and higher construction costs mean housing affordability is likely to remain stretched for some time. Builders are responding by discounting prices and buying down mortgage rates. This helps at the margin and may help stave off an avalanche of cancelations but becomes less effective as rates move even higher.
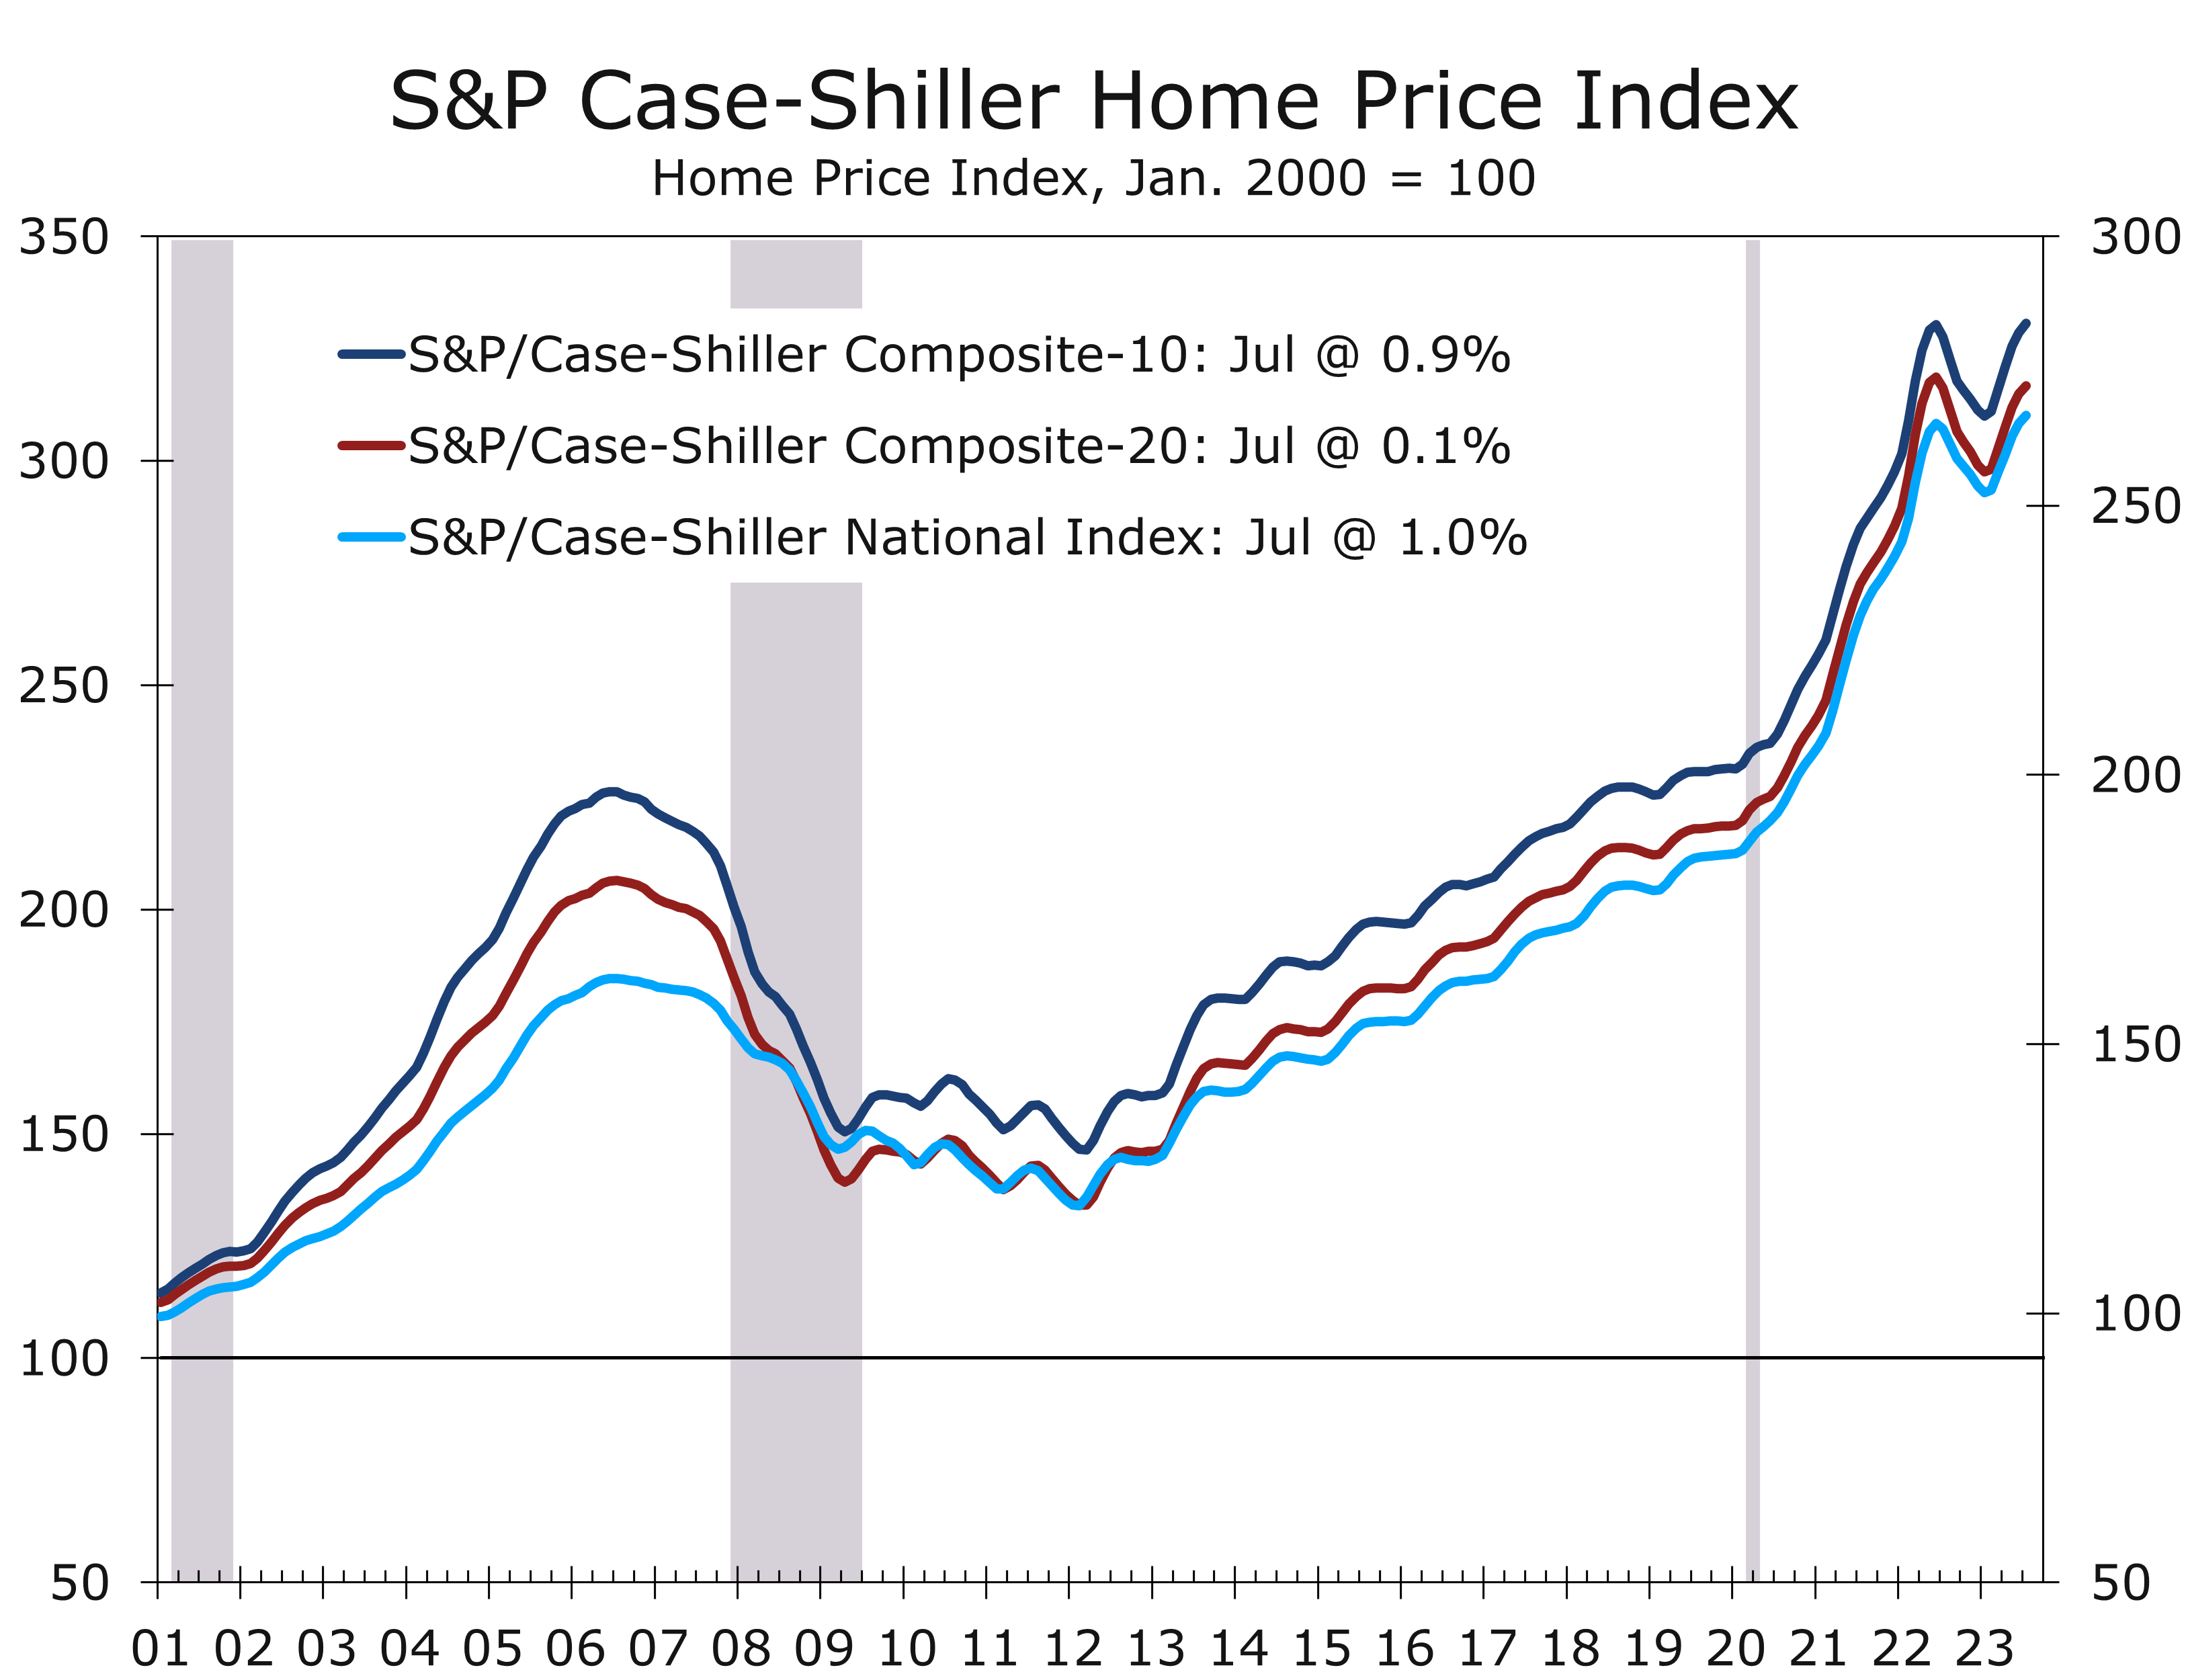
The latest CoreLogic S&P Case-Shiller Home Price Index reported another sizeable rise in home prices in July, with the National Index, 20-City, and 10-City indices each rising 0.6%. The National Index has risen 1.0% over the past year and is now slightly above its prior peak, hit in June 2022. The 10-City Index has also risen back above its prior peak. While 19 of the 20 metros in the 20-City Index rose in July, this index has lagged and is up just 0.1% over the past year. Several metro areas in the West included in the 20-City Index, such as San Francisco, Phoenix, and Portland, saw sharper declines during the second half of last year and have seen smaller rebounds this year.
Home prices have rebounded since bottoming out in January and are now at a new high.
The Midwest lays claims to three of the nation’s top five markets for home price appreciation. Home prices have risen 4.4% over the past year in Chicago and are up 4.0% in Cleveland. New York (+3.8%), Detroit (+3.2%) and Atlanta (2.2%) round out the top five.
Higher home prices have boosted household wealth, with households now holding a collective $31.6 trillion in equity, up from $22 trillion prior to the pandemic. The rise in home equity helps explain the resilience of consumer spending, even though consumers are not tapping equity anywhere near as much in prior cycles.
We suspect home prices are now weakening. The Case-Shiller data lag by a few months, the most recent data are for July. Other more timely price measures. such as those provided by Zillow, are beginning to show signs of slowing once again. The culprit is higher mortgage rates, which are leading to slew of cancelations for new and existing homes, resulting in more discounting by builders and concessions by sellers.
Consumer Confidence fell a larger than expected 5.7 points in September to 103. All of the drop was in the expectations series, which tumbled 9.6 points to 73.7. An expectations index reading below 80 is generally consistent with a recession. The expectations series is more closely tied to swings in consumer behavior and points to some cooling in consumer spending and home buying later this year.
Consumers’ assessment of current economic conditions edged 0.4 points higher to 147.1, largely due to another strong assessment of current labor market conditions. The current conditions index remains at a level historically consistent with strong economic growth and the improvement in current labor market conditions is consistent with a slight drop in the unemployment rate during September.
Disclaimer: This publication has been prepared for informational purposes only and is not intended as a recommendation offer or solicitation with respect to the purchase or sale of any security or other financial product nor does it constitute investment advice.
Home Sales Continue to Decline Amidst Lean Inventories, Rising Prices and Higher Rates
Existing Home Sales Decline Modestly in August
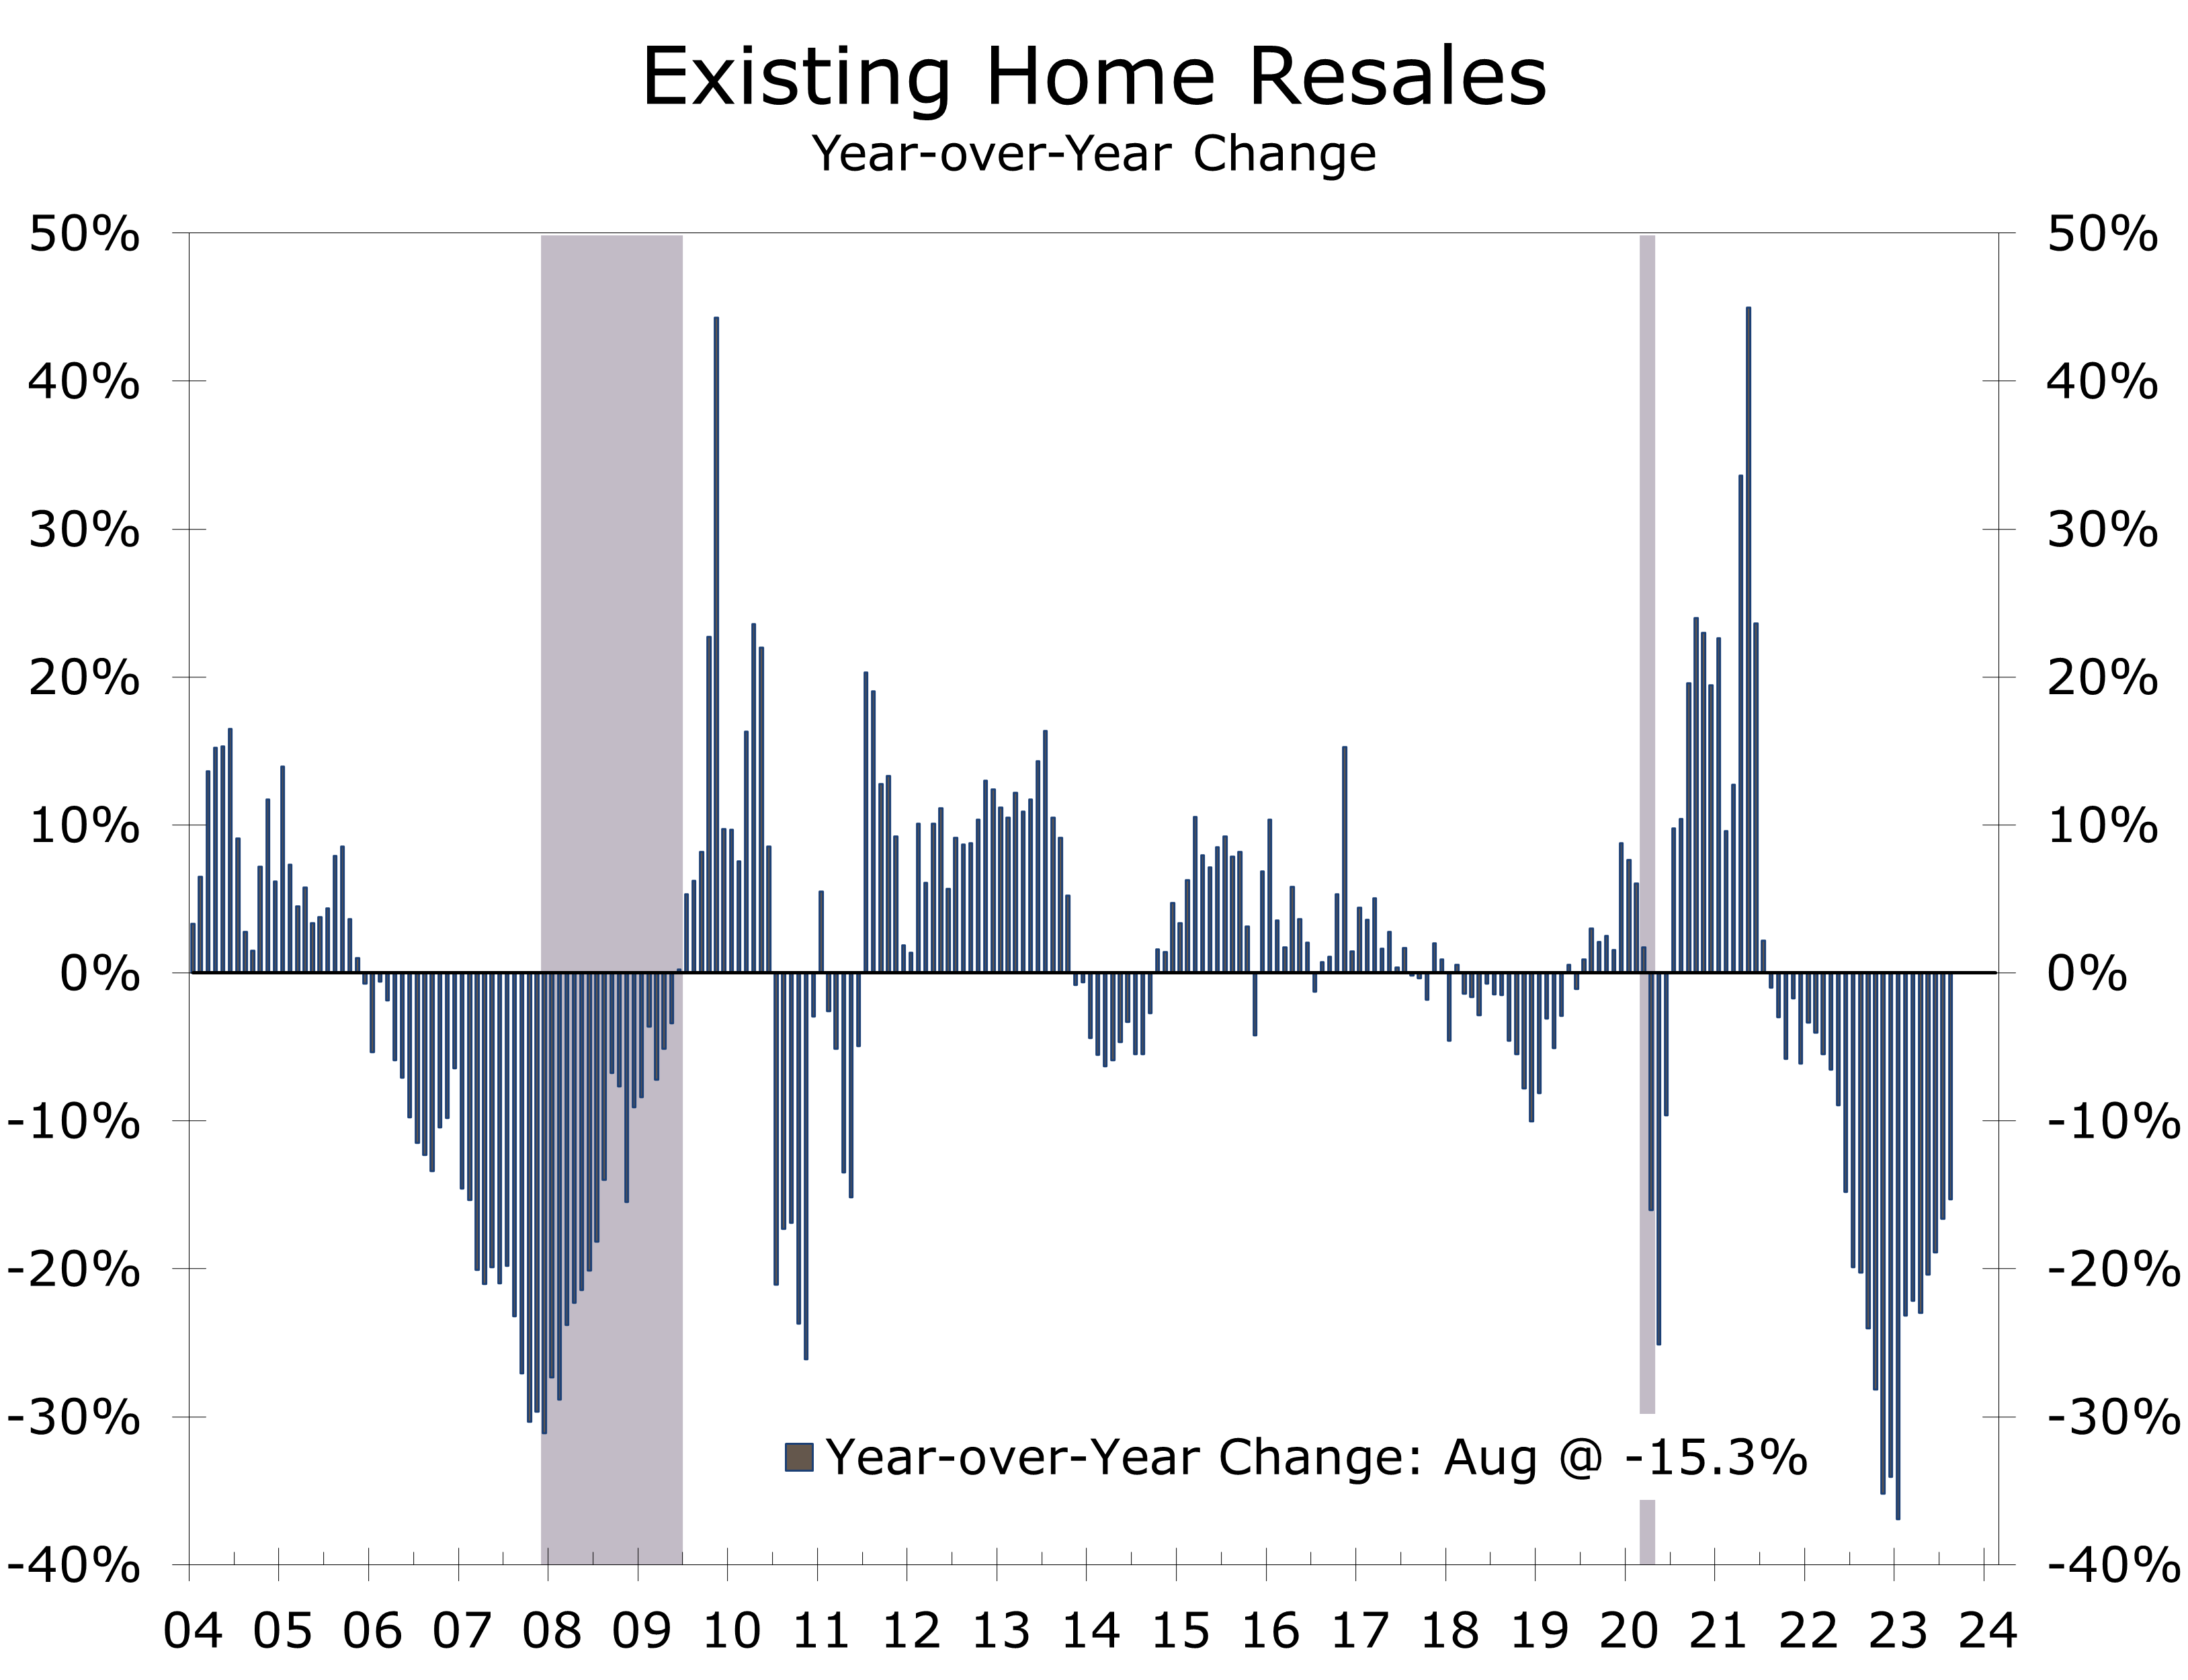
- Existing home sales fell 0.7% in August to a 4.04 million-unit pace.
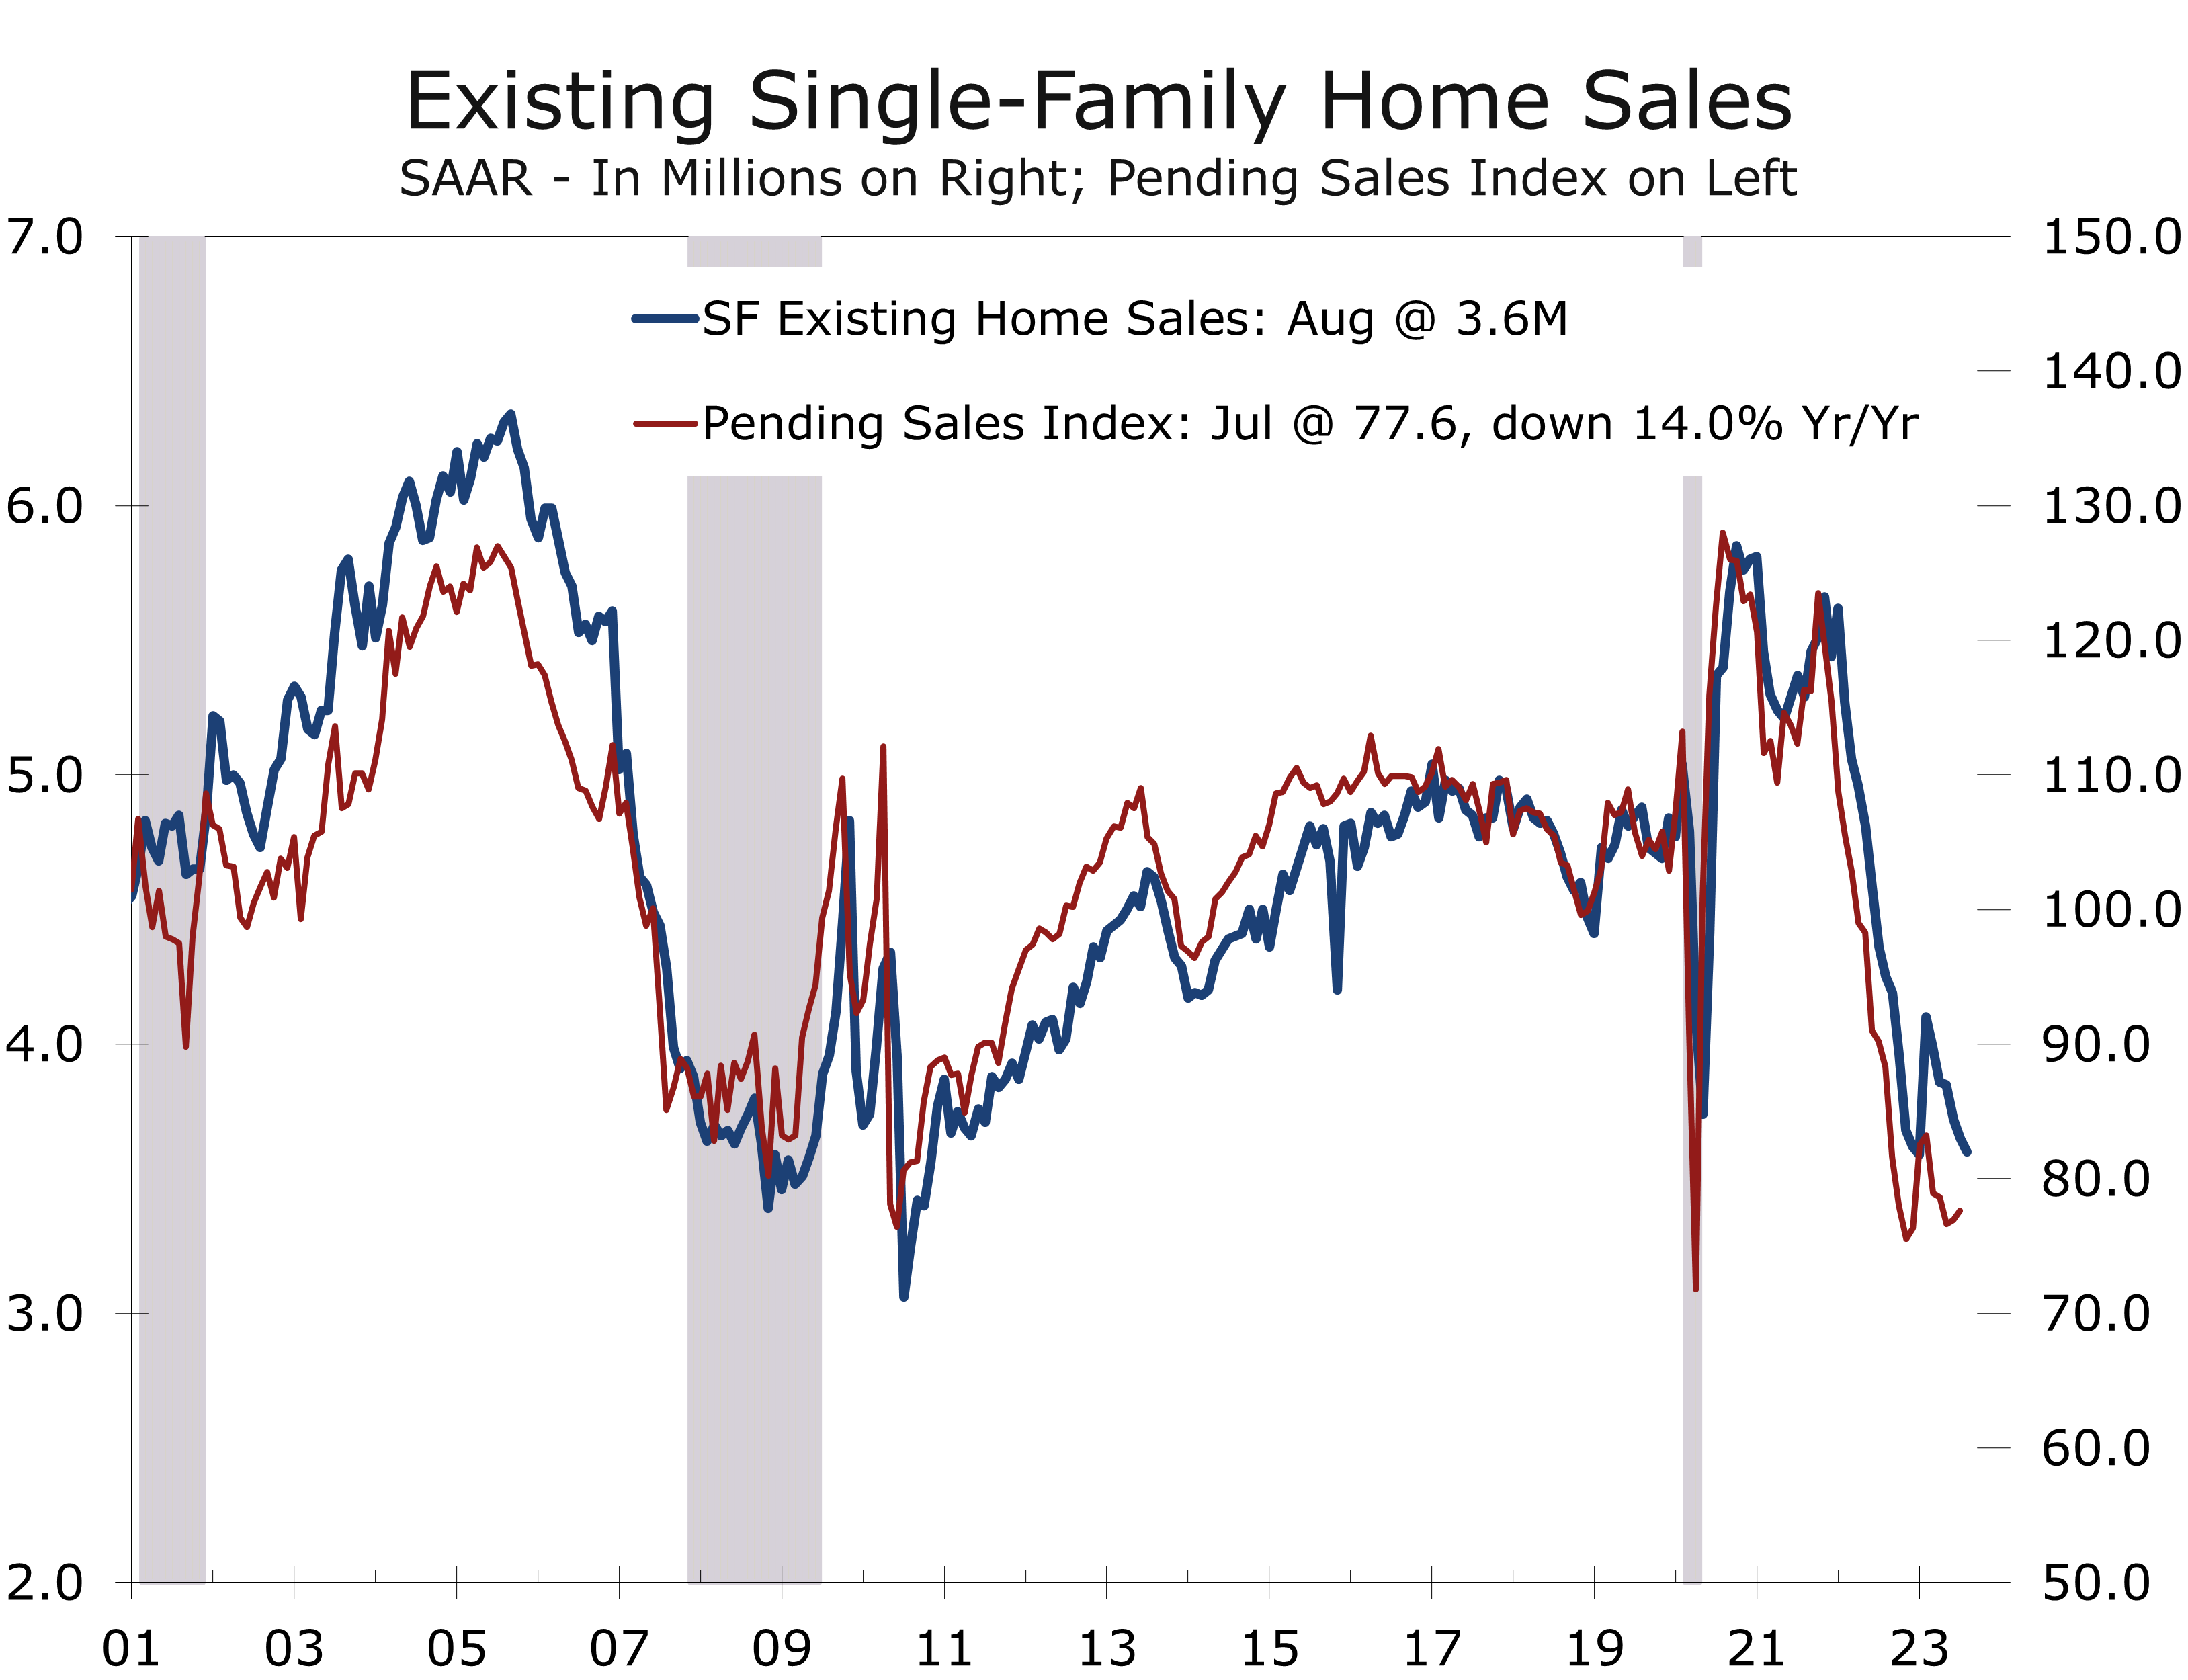
- Sales of single-family homes fell 1.4% to a 3.6-million-unit pace, while sales of condos and co-ops rose 4.8% to a 440,000-unit pace.
- Overall sales fell 2.6% in the West and 1.1% in the South but rose 1.0% in the Midwest and were unchanged in the Northeast.
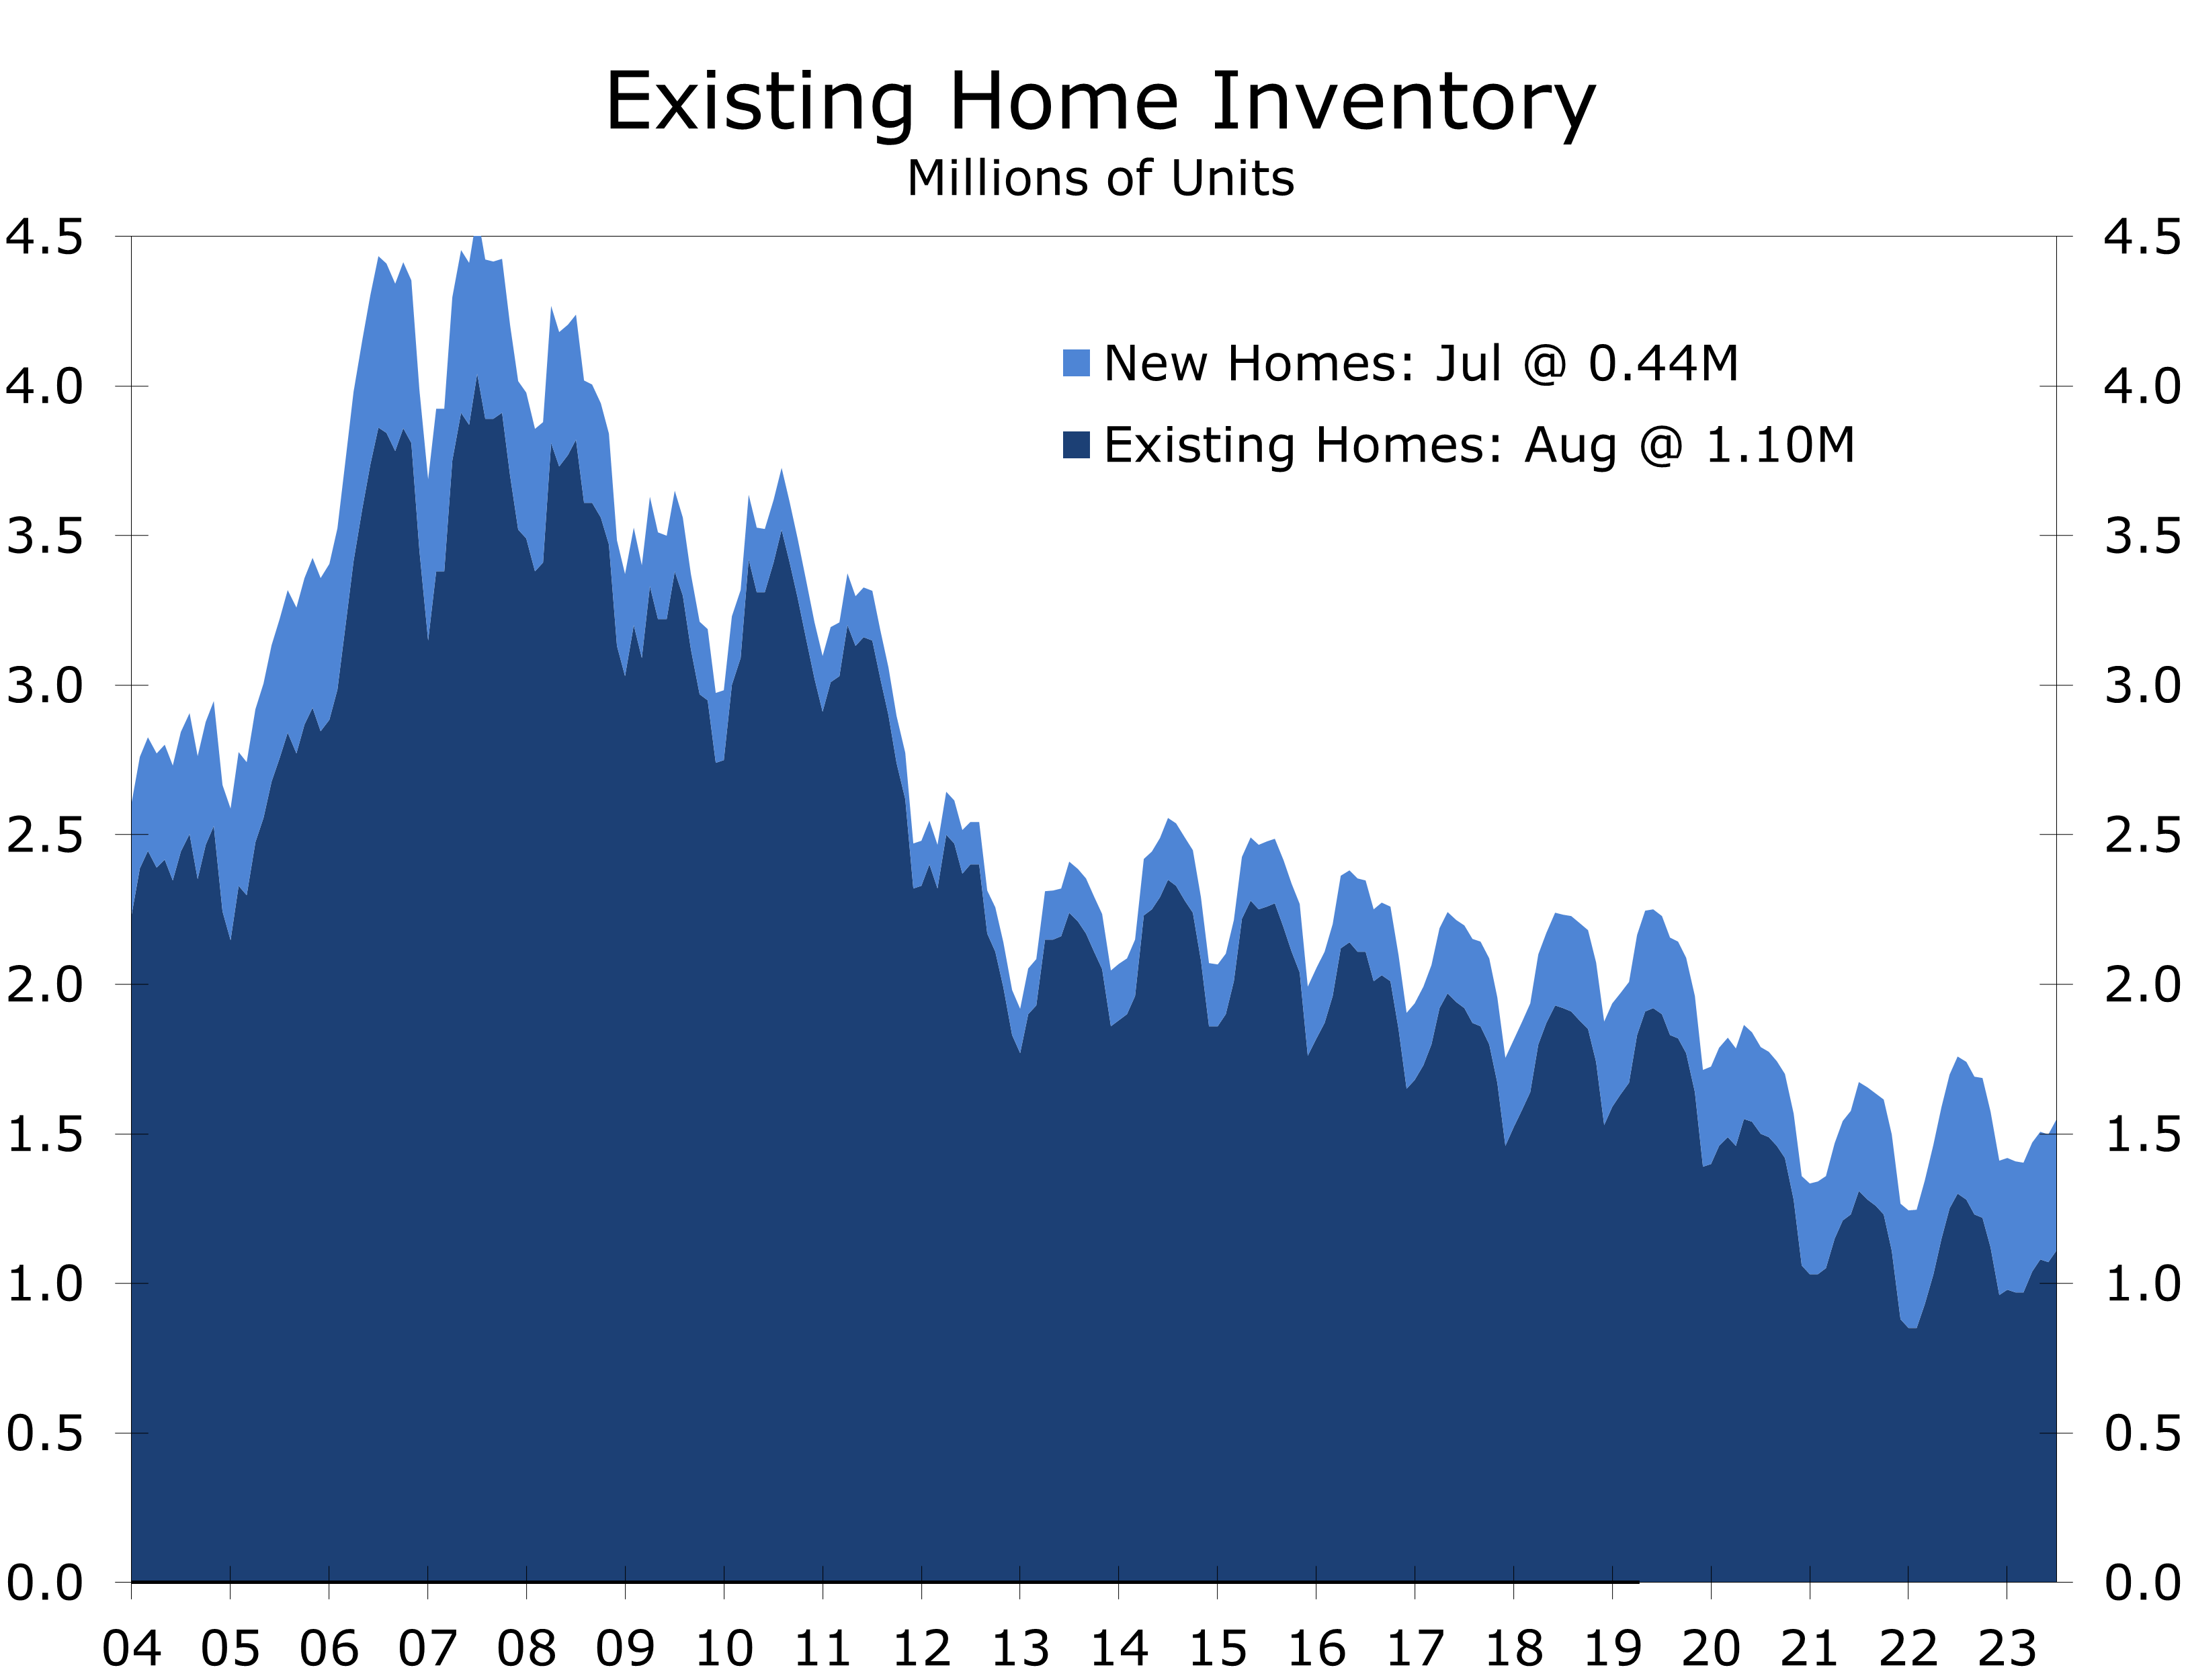
- Inventories of existing homes remain tight, with just 1.11 million homes for sale at the end of August, which is unchanged from July.
- The median price of an existing home rose to $407,100 in August and is up 3.9% from last August. The median price for a single family home rose to $413,500, up 3.7% year-to-year. The median price for condos/co-ops rose 6.2% over the past year to $354,600.
- Affordability hurdles are likely pushing more buyers into condominium and co-ops.
- Existing home sales continue to trend lower, as buyers continue to bid up prices amidst exceptionally low for-sale inventory. Sales closed in August were put under contract in June and July, when mortgage rates were a quarter percentage point lower than today.
Existing home sales continued to trend lower in August, with overall sales declining 0.7% to a 4.04 million unit pace. Sales have fallen 15.3% over the past year and have declined year-to-year for the past 25 months. Overall sales are down a cumulative 38.4% since peaking in January 2021.
The slide will likely continue. Existing sales track closings, which were likely put under contract in June and July, when mortgage rates were about a quarter percentage point lower than their current 7.19%. There were some faint hopes sales would level off or even edge higher in August because pending home sales, which track purchase contracts, rose modestly in July. Buyers are facing affordability hurdles, however, and higher mortgage rates may have upended some of those purchase contracts.
Ordinarily a 38% drop in existing home sales would lead to a moderation in home price appreciation.
The housing market is in an odd place today. Ordinarily a 38% drop in sales would lead to a moderation in prices, and that appeared to be the case last year, with the price of a median home falling around 13% from June 2022 until January of this year. The number of homes for sale fell even more than sales , however, which means there is more competition for the paltry number of homes available for sale. Prices have since surged back near their previous high.
The persistent imbalance between the supply and demand improved modestly in August, as higher prices have brought out a few more sellers. Sales of existing homes have fallen 15.3% over the past year, while the inventory of existing homes available for sales has fallen 14.1%. At the current sales pace, the 1.1 million existing homes available for sale equates to a 3.3 month supply, which is the same as it was in July but up from 3.2 months a year ago. A normal supply of would be around 4.5 to 5 months, a level that has not been maintained consistently in more than 7 years.
Existing home inventories would have to essentially double in order to significantly moderate home price gains. Doubling for-sale inventory will be tough. Nearly 80% of homeowners with a mortgage currently have a rate of 5% or less, 60% have a rate of 4% or less, and just over 37% have a mortgage rate of 3% or less. Few of these homeowners have any incentive to sell their homes today, as they would be giving up their ultra-low rate mortgage, which has insulated them from soaring housing costs.
The National Association of Realtors also took note of the nascent stabilization in existing home sales. Existing home sales have fallen in 17 of the past 19 months. The only significant increase was in February, when a temporary pullback in mortgage rates to 6% enabled buyers to rush back in and complete sales that had fallen through when rates spiked late last year.
Sales have shown signs of stabilizing in recent months. Pending home sales rose 0.9% in July following a 0.4% rise in June. Those gains raised hopes existing home sales would perk up in August and September. The lag between purchase contracts and closings is typically around 6 weeks. This past month’s drop in existing home sales was the smallest monthly drop of any of the 17 declines since the persistent slide in existing home sales began back in February 2022.
Unfortunately, purchasing a home likely became tougher in September. Mortgage rates have spiked in recent weeks and are currently about a quarter point higher than they were in mid-August and rates appear to be headed even higher in the aftermath of yesterday’s FOMC meeting. Mortgage applications for the purchase of a home have been trending lower.
The combination of rising interest rates and higher home prices has pulled affordability to its lowest level in decades. A family earning the median income, that purchase the median priced home with a 20% down payment, must devote a record 28.5% of their gross income to interest and principal payments. When you add in taxes and insurance, which have also spiked, home sales look like they are headed a bit lower.
Disclaimer: This publication has been prepared for informational purposes only and is not intended as a recommendation offer or solicitation with respect to the purchase or sale of any security or other financial product nor does it constitute investment advice.
The Fed Maintains Course for a Soft Landing
The Fed Looks Set to Lean into the Wind
- The Federal Reserve left its federal funds rate target unchanged at 5.25-5.50%.
- The FOMC policy statement acknowledges moderating job growth but continues to emphasize inflation remains elevated.
- FOMC members are in a wait and see mode on growth and inflation but continue to lean toward hiking rates at least one more time.
- The Summary of Economic Projections now calls for 2.1% real GDP growth this year, up a full percentage point from their June.
- Powell’s press conference contained few surprises. He acknowledge household balance were stronger than initially thought, which contributed to the economy’s resilience.
- Powell stressed the Fed would proceed carefully, suggesting an awareness of the risk over overtightening.
- Bottom line: The Fed left the door open for an additional rate hike but also noted they would likely lower rates more slowly. We expect the Fed to lean into the wind as the economic growth slows and pressure builds to cut interest rates.
The FOMC left its target range for the federal funds rate unchanged at 5.25-5.50% at its September FOMC meeting. The overwhelming majority of market participants expected the Fed to remain on hold and the bulk of the interest today was whether there would be any changes to their policy statement and the updated Summary of Economic Projections (SEP).
Changes to the policy statement were minimal. The Fed’s assessment of economic activity was upgraded from ‘moderate’ in July to ‘solid’ today. The move makes sense, given the upgrade to the Fed’s real GDP forecast for 2023, which was raised to 2.1% from 1% in June. Real GDP is expected to rise 1.5% in 2024, up from 1.1% earlier, and grow 1.8% in both 2025 and 2026, which is close to the CBO’s estimate of potential GDP growth.
The Fed’s economic forecast now calls for a prolonged soft landing. Slower economic growth over the next year is expected to nudge the unemployment rate up from 3.8% this year to 4.1% in 2024 and 2025. That is slightly lower than the Fed projected in June and suggest FOMC members expect labor markets to remain tight over the forecast period.
A prolonged soft landing means interest rates will likely remain higher for longer.
A prolonged soft landing means interest rates will likely remain higher for longer. The SEP has the federal funds rate ending this year a quarter percentage point higher than it is currently. The biggest change is the FOMC now only sees a cumulative cut of half a percentage point in 2024, versus a full point cut earlier.

Despite maintaining an unemployment rate near the mid-point of the range of forecasts for ‘full employment’, core inflation is expected to be slightly lower this year and about the same as it was previously projected for 2024 and 2025. Core inflation is expected to return to 2.0 in 2026 and remain there over the long run.
The benign inflation environment combined with the higher projected path for the federal funds rate means the real federal funds rate (federal fund rate minus core PCE inflation) is half a percentage point higher for 2024 and 0.4 percentage points higher for 2005. Even in 2026, the real federal funds rates is 90 basis points, which is at the high end of rising estimates for the neutral federal funds rate.
Higher projections for the real federal funds rate suggest policy will remain tight well into 2025.
The higher projections for the real federal funds rate suggest monetary will remain tight well after the Fed begins to cut interest rates next year. This part of the Fed’s forecast is a nod to recent discussion suggesting the neutral federal funds rate has risen. The median forecast for the federal funds rate at the end of 2026 is 2.9%, which is well above the median estimate for the long-term federal funds rate, which was unchanged at 2.5%.

We expect estimates for the long-term federal funds rate to gradually edge higher to 2.9%. Seven of the 19 FOMC participants currently have projections above 2% and average forecast derived from longer-run federal funds rate dot-plot works out to 2.76%.
Taken together, the policy statement, Powell’s press conference and the Summary of Economic Projections make a compelling case that interest rates are likely to rise a bit higher than previously thought and remain for longer. We expect the Fed to cut rates begrudgingly, to bring inflation back down to their 2% target.
A prolonged soft landing means interest rates will likely remain higher for longer.
The Fed’s updated forecast might stem some of the criticism from congress that the Fed was pursuing a policy that would send the economy into recession. The environment the Fed now envisions is a near picture perfect soft landing. Whether an economy growing this modestly can successfully navigate the shocks from periodic government shutdowns, labor strikes and unforeseen geopolitical events is an open question but for now the Fed appears set on a credible course to a soft landing.

Disclaimer: This publication has been prepared for informational purposes only and is not intended as a recommendation offer or solicitation with respect to the purchase or sale of any security or other financial product nor does it constitute investment advice.
Housing Starts Tumble in August
Hurricane Hillary Undermined Starts in August
- Housing starts declined 11.3% in August to a 1.283-million-unit pace, which is the slowest pace since June 2020.
- Starts fell sharply in every region except the Northeast and were led by a 28.9% plunge in the West – likely due to the impact of Hurricane Hillary.
- Multi-family starts accounted for the bulk of the decline, plunging 26.3% to a 342K pace.
- Higher interest rates, tightening credit and a mountain of projects under construction are cutting into multi-family starts.
- Single-family starts fell a more modest 4.3% to a 941K pace, and rose modestly in the South, which accounts for more than half the nation's starts.
- Homebuilder confidence fell 5 points to 45 in September, reflecting rising interest rates and weaker prospective buyer traffic.
- Higher interest rates are clearly making an impact in the housing market. While much has been made of sales lost due to the lock-in effect on existing homes, higher mortgage rates are pricing out even more potential home buyers at the same time higher short term rates are curbing spec development.
Housing starts fell 11.3% in August to a 1.283-million unit pace, marking their largest monthly drop in more than a year. Both single-family (-4.3%) and multi-family starts (-26.3%) declined, with multi-family accounting for the bulk of the drop. Starts fell in every region of the country except the Northeast, where they inched up 1.0%. The largest drop was in the West, where Hurricane Hillary helped slash starts by 28.9%.
While builders caught a break earlier this year when buyers frustrated by the lack of existing homes turned to the new home market, higher interest rates are clearly taking a bite out of home building. More buyers are being priced out of home buying altogether than are being diverted from the existing home market. Mortgage applications for the purchase of a home have plummeted 12.6% over the past 10 weeks, which was when the rate on a 30-Year conventional mortgage began to rise above 7% on a sustained basis.
Higher mortgage rates have cut into home buying, which is causing builders to slow starts.
While single-family starts are now trending lower, this past month’s drop was exaggerated by Hurricane Hillary, which depressed starts in Southern California and Nevada. Single-family starts plummeted 26.9% in the West. Home construction also slowed in the Northeast and Midwest, where single-family starts fell 1.8% and 12.3%, respectively. Single-family starts rose a solid 8.1% in the South, which is by far the largest region for single-family starts.
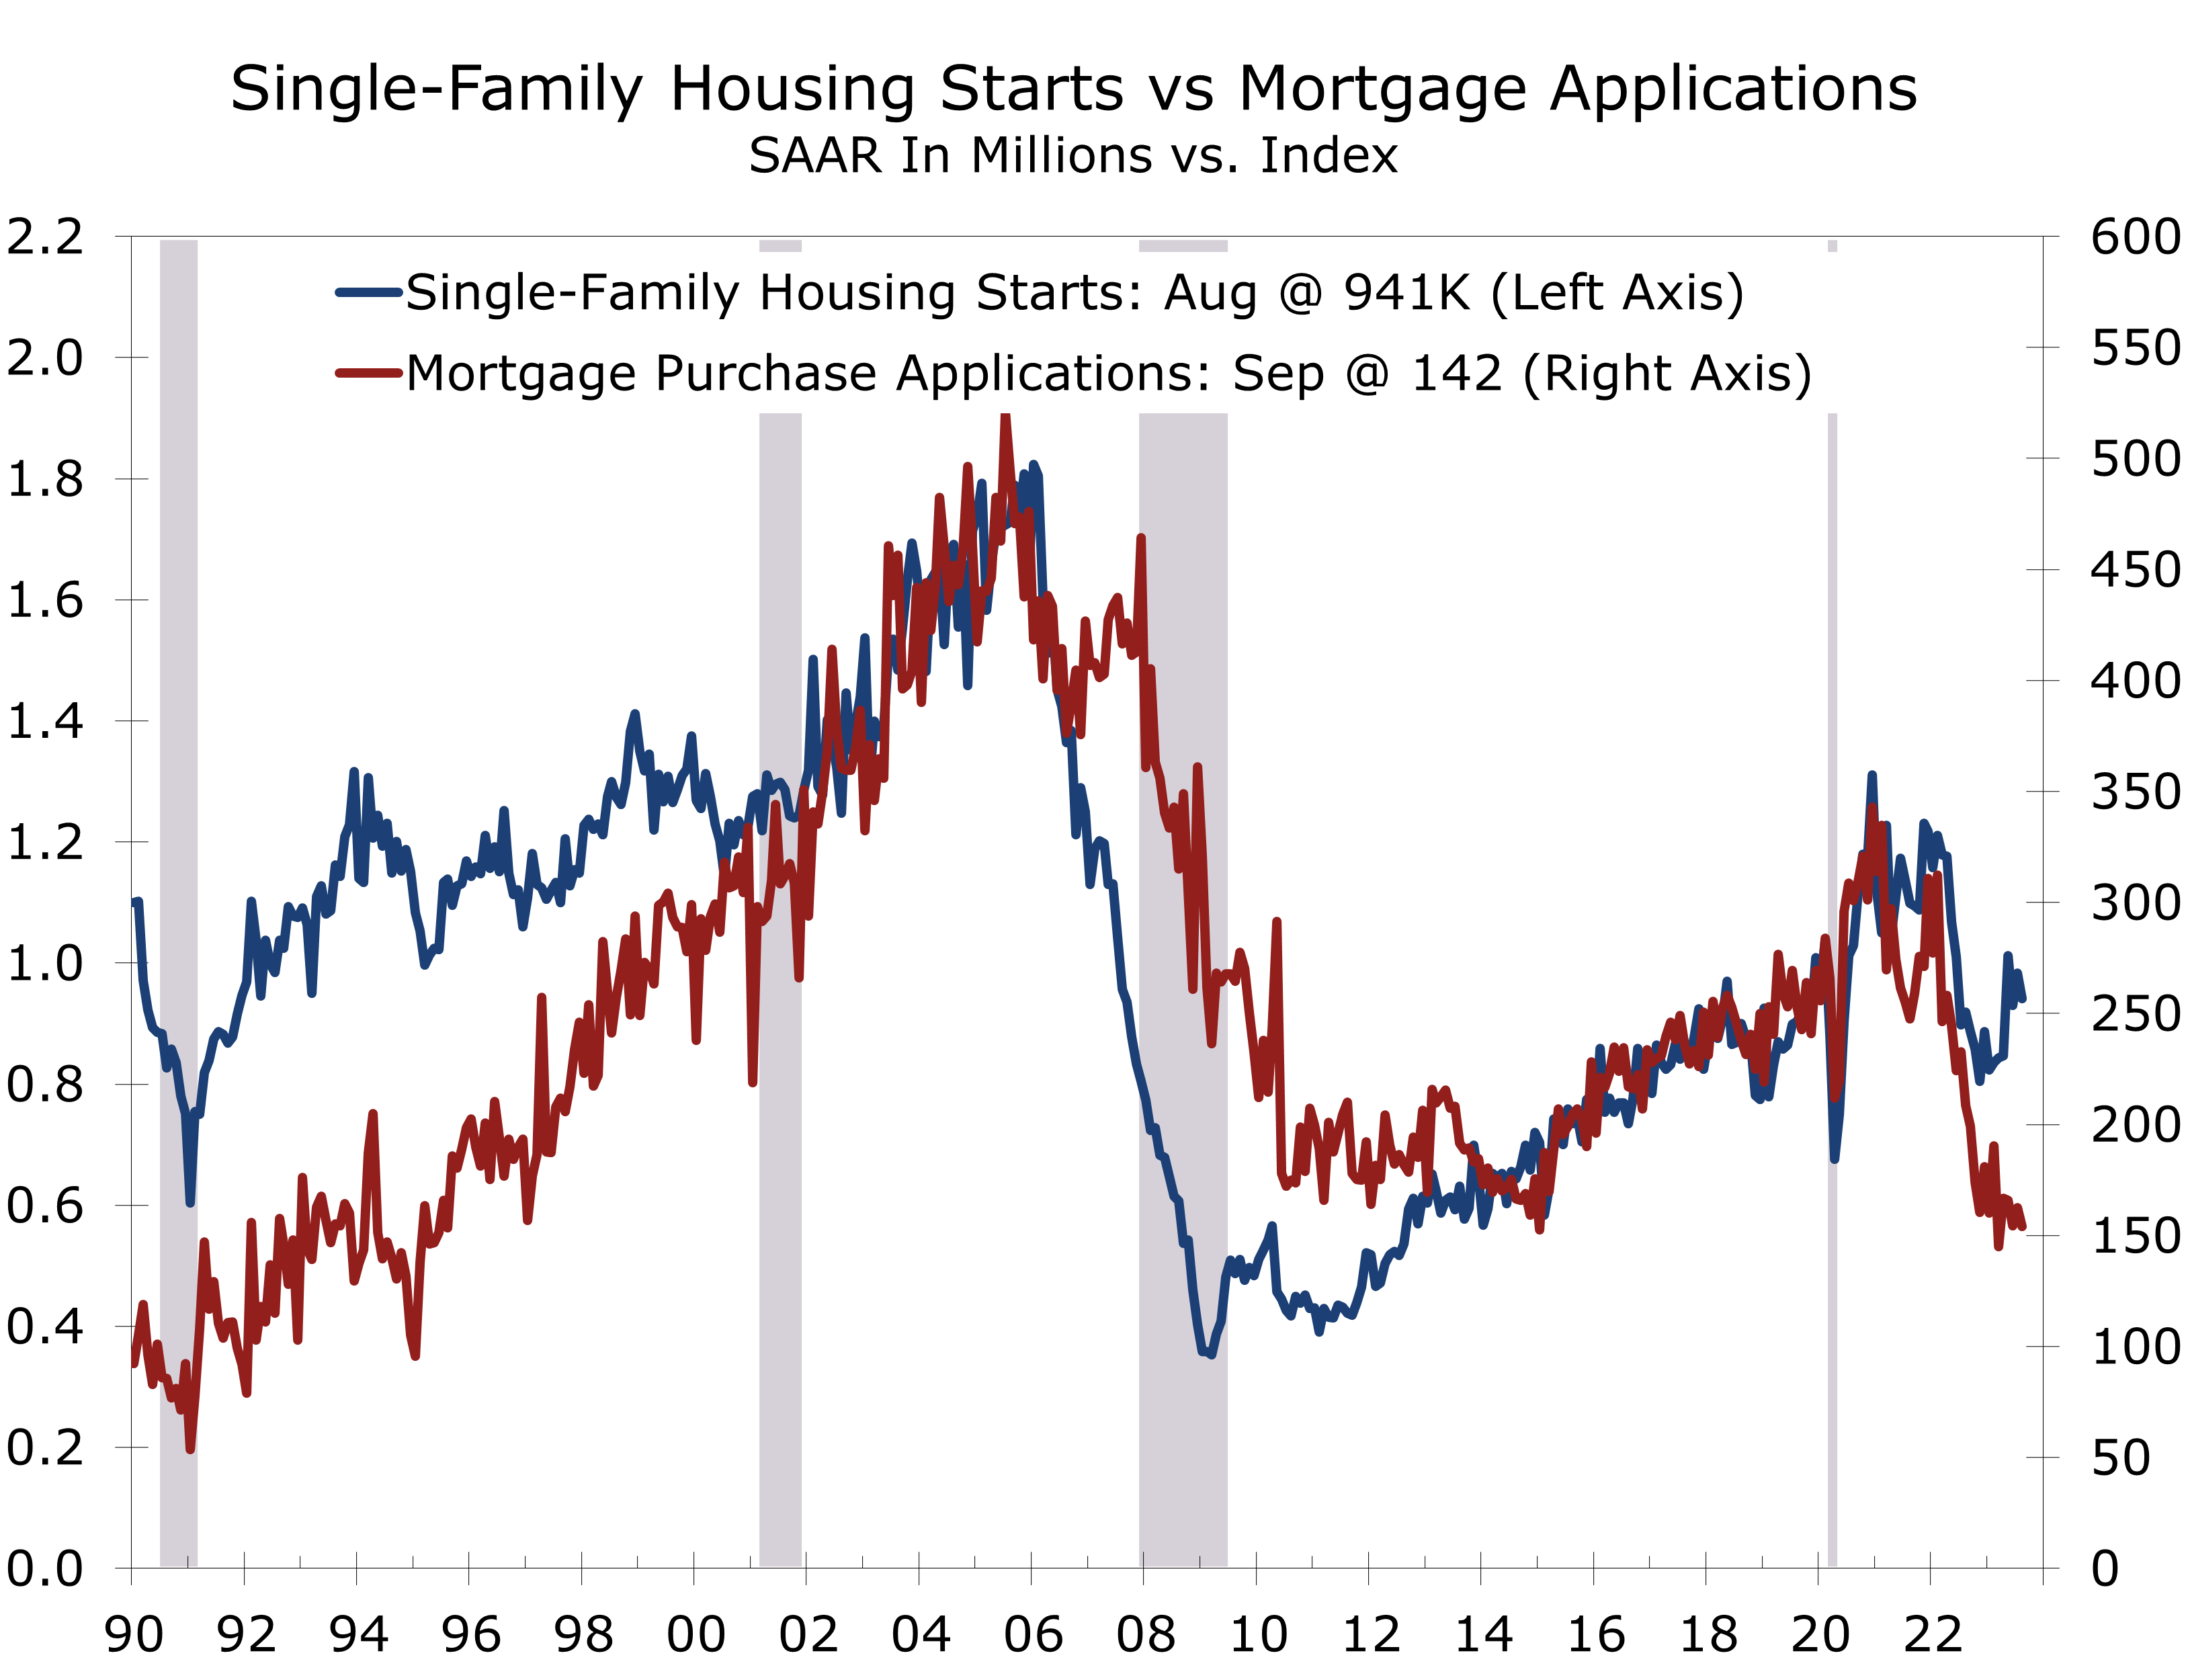
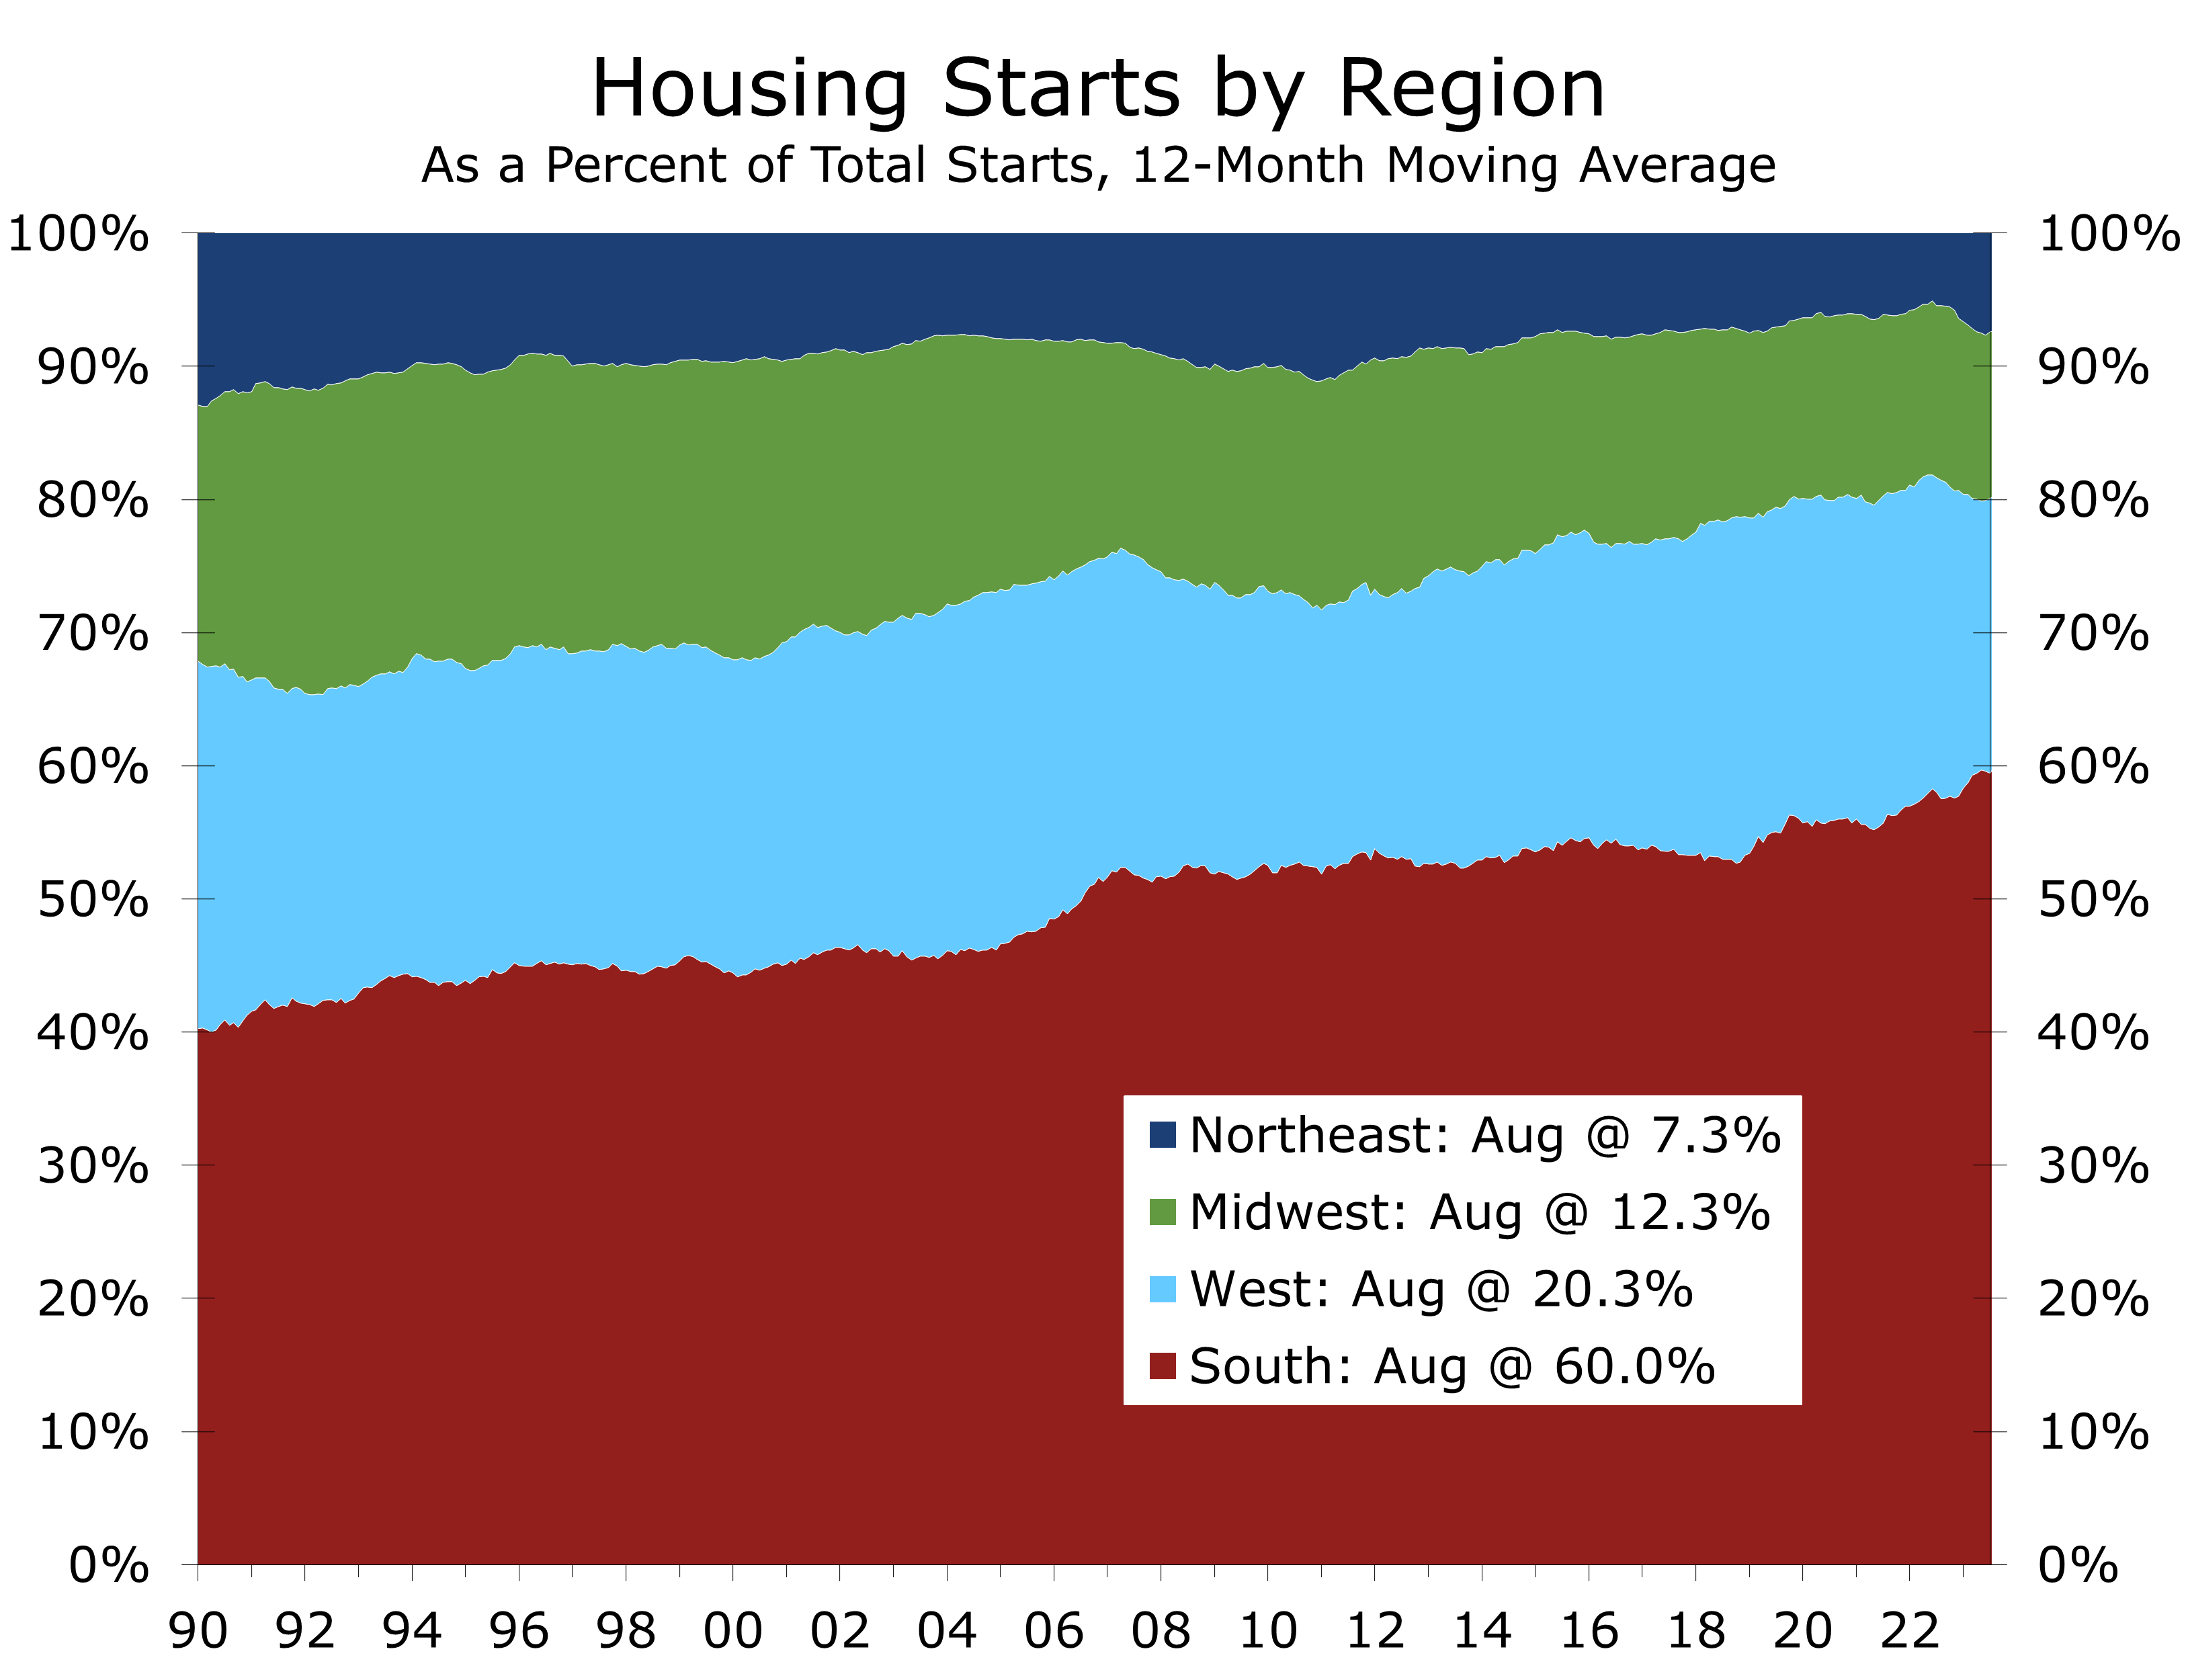
The South is benefitting from an influx of new residents and businesses, and continues to see strong overall job growth, which is fueling home building in Texas, Florida, the Carolinas, Georgia, and middle Tennessee. The South accounted for 60% of all single-family starts through the first 8 months of this year.
Apartment building is also going strong in the South, but activity has begun to cool in recent months due to rising interest rates and tightening credit conditions amidst concerns about overbuilding. Multi-family starts plunged 35.6% in the South in August, falling to their lowest level since December 2020. The pullback in construction comes at a time when there are a record number of apartments set to be completed in rapidly growing markets such as Austin, Raleigh, Nashville, and Charlotte. The bulk of new construction in the South is in the largest metros, including Dallas-Fort Worth, Houston, Atlanta, and South Florida.
The hurdles for financing new apartment projects have risen substantially.
The South is not the only region seeing a pullback in apartment construction. Apartments account for the bulk of multi-family starts of projects with 5 or more units. Such starts have tumbled 27.9% since peaking last August. Starts of projects with 2 to 4 units, while off their peak, still appear to be trending higher.
The housing market is one area of the economy where the Fed can see some tangible signs that higher interest rates are making an impact. This past month’s drop in housing starts, however, was exaggerated by the effects of Hurricane Hillary, which slashed starts in the West. Higher interest rates have also had some perverse effects, as they reduced the supply of existing homes for sale and sent home prices sharply higher.
The housing market is one area where the Fed’s rate hikes are cooling demand.
Low interest rates helped ignite an apartment construction boom following the pandemic. That earlier surge in construction is now slowing rent increases, as the supply of apartments rises up to meet demand. There are some notable exceptions. Rents have surged to record heights in Manhattan, where construction lagged following the pandemic, and is now seeing the return of office workers.
We expect the Fed to hold rates steady at the September FOMC meeting. The Fed will also likely maintain a dot plot that keeps the door open for at least one more quarter-point rate hike at the two remaining FOMC meetings in 2024.

Disclaimer: This publication has been prepared for informational purposes only and is not intended as a recommendation offer or solicitation with respect to the purchase or sale of any security or other financial product nor does it constitute investment advice.
Back to ‘old’ School on Inflation & Rates
Old School Course Syllabus
- Positive economic surprises outnumbered negative ones during the first half of 2023, giving rise to hopes the Fed might just pull of a softish landing after all.
- Real GDP growth rose at a solid 2.4% annual rate during the second quarter, and employers continued to add workers at a healthy clip. The stronger pace of growth means the economy should be better able to withstand the impact of higher interest rates.
- First half growth was bolstered by the surprising resilience of the housing market. Demand rebounded earlier this year but there were relatively few existing homes available for sale. The mismatch pulled prices higher and very quickly reversed the declines registered in the second half of last year. Builder confidence also rebounded, as buyer traffic and new home sales improved.
- The rapid uptake of major stimulus programs such as the Inflation Reduction Act and CHIPS and Science Act has led to a surge in construction of new EV plants and semiconductor facilities.
- We believe the economy’s run of good luck may be ending. Fitch’s downgrade of the US credit rating provides a needed wakeup call that the nation’s precarious fiscal position might trigger some financial market volatility later this summer and fall. The Treasury stretched its finances in the months leading up to the debt ceiling deal and will need to replenish their coffers by issuing close to $2 trillion in securities over the next 6 months.
- We are looking for a ‘softish landing’, with real GDP growth averaging a 0.7% pace over the next six quarters, including back-to-back negative quarters at the end of this year and in early 2024.
This past month saw both inflation and nonfarm employment moderate further, strengthening the case for a softish landing. Not only has employment growth moderated but the number of job openings has slowed over the past two months. The inflation data for the past three months also show encouraging signs, with some key inflation gauges running close to the Fed’s target. Our forecast still has a recession beginning late this year or early next year, but the odds of either a continuation of the rolling recessions we have seen this past year or a ‘softish landing’, where real GDP declines for a quarter or two but the NBER does not declare an official recession, have clearly improved.
The last week of August brought a slew of economic data that helped clarify how much momentum the economy has. The “second” estimate of second quarter GDP revealed that growth was as strong as first reported. Real GDP growth now comes in at 2.1%, 0.3 percentage points less than the advance estimate. Downward revisions to inventories and business fixed investment were offset by upward revisions to state and local government spending, exports, consumer spending, federal spending, and residential investment. The following day brought July consumer spending data, which came in much stronger than expected, with real personal consumption climbing 0.6% in July and spending revised up in June as well.
The burst of spending in June and July puts real personal consumption 0.9% above its second quarter average. This means consumer spending, which accounts for two-thirds of real GDP, will rise at a 3.6% pace if spending is unchanged in both August and September. As it is, we expect to see some payback in August. Spending got a huge boost from record Amazon Prime Day sales in July. Consumers also spent more freely for travel and entertainment, with concerts and blockbuster movie weekends bolstering services outlays.
The surprising strength in consumer spending caused many economists, including us, to raise estimates for third-quarter real GDP growth. The widely followed Atlanta Fed GDPNow estimate for third quarter growth rose to 5.9%. Third quarter growth will not likely be anywhere near that strong. The GDPNow estimate is not an actual forecast by the Atlanta Fed but rather an estimate based off historical relationships between various economic indicators and real GDP growth over time. Our current estimate calls for real GDP to rise at a 3.5% pace in the current quarter. Much of the strength, however, is frontloaded.
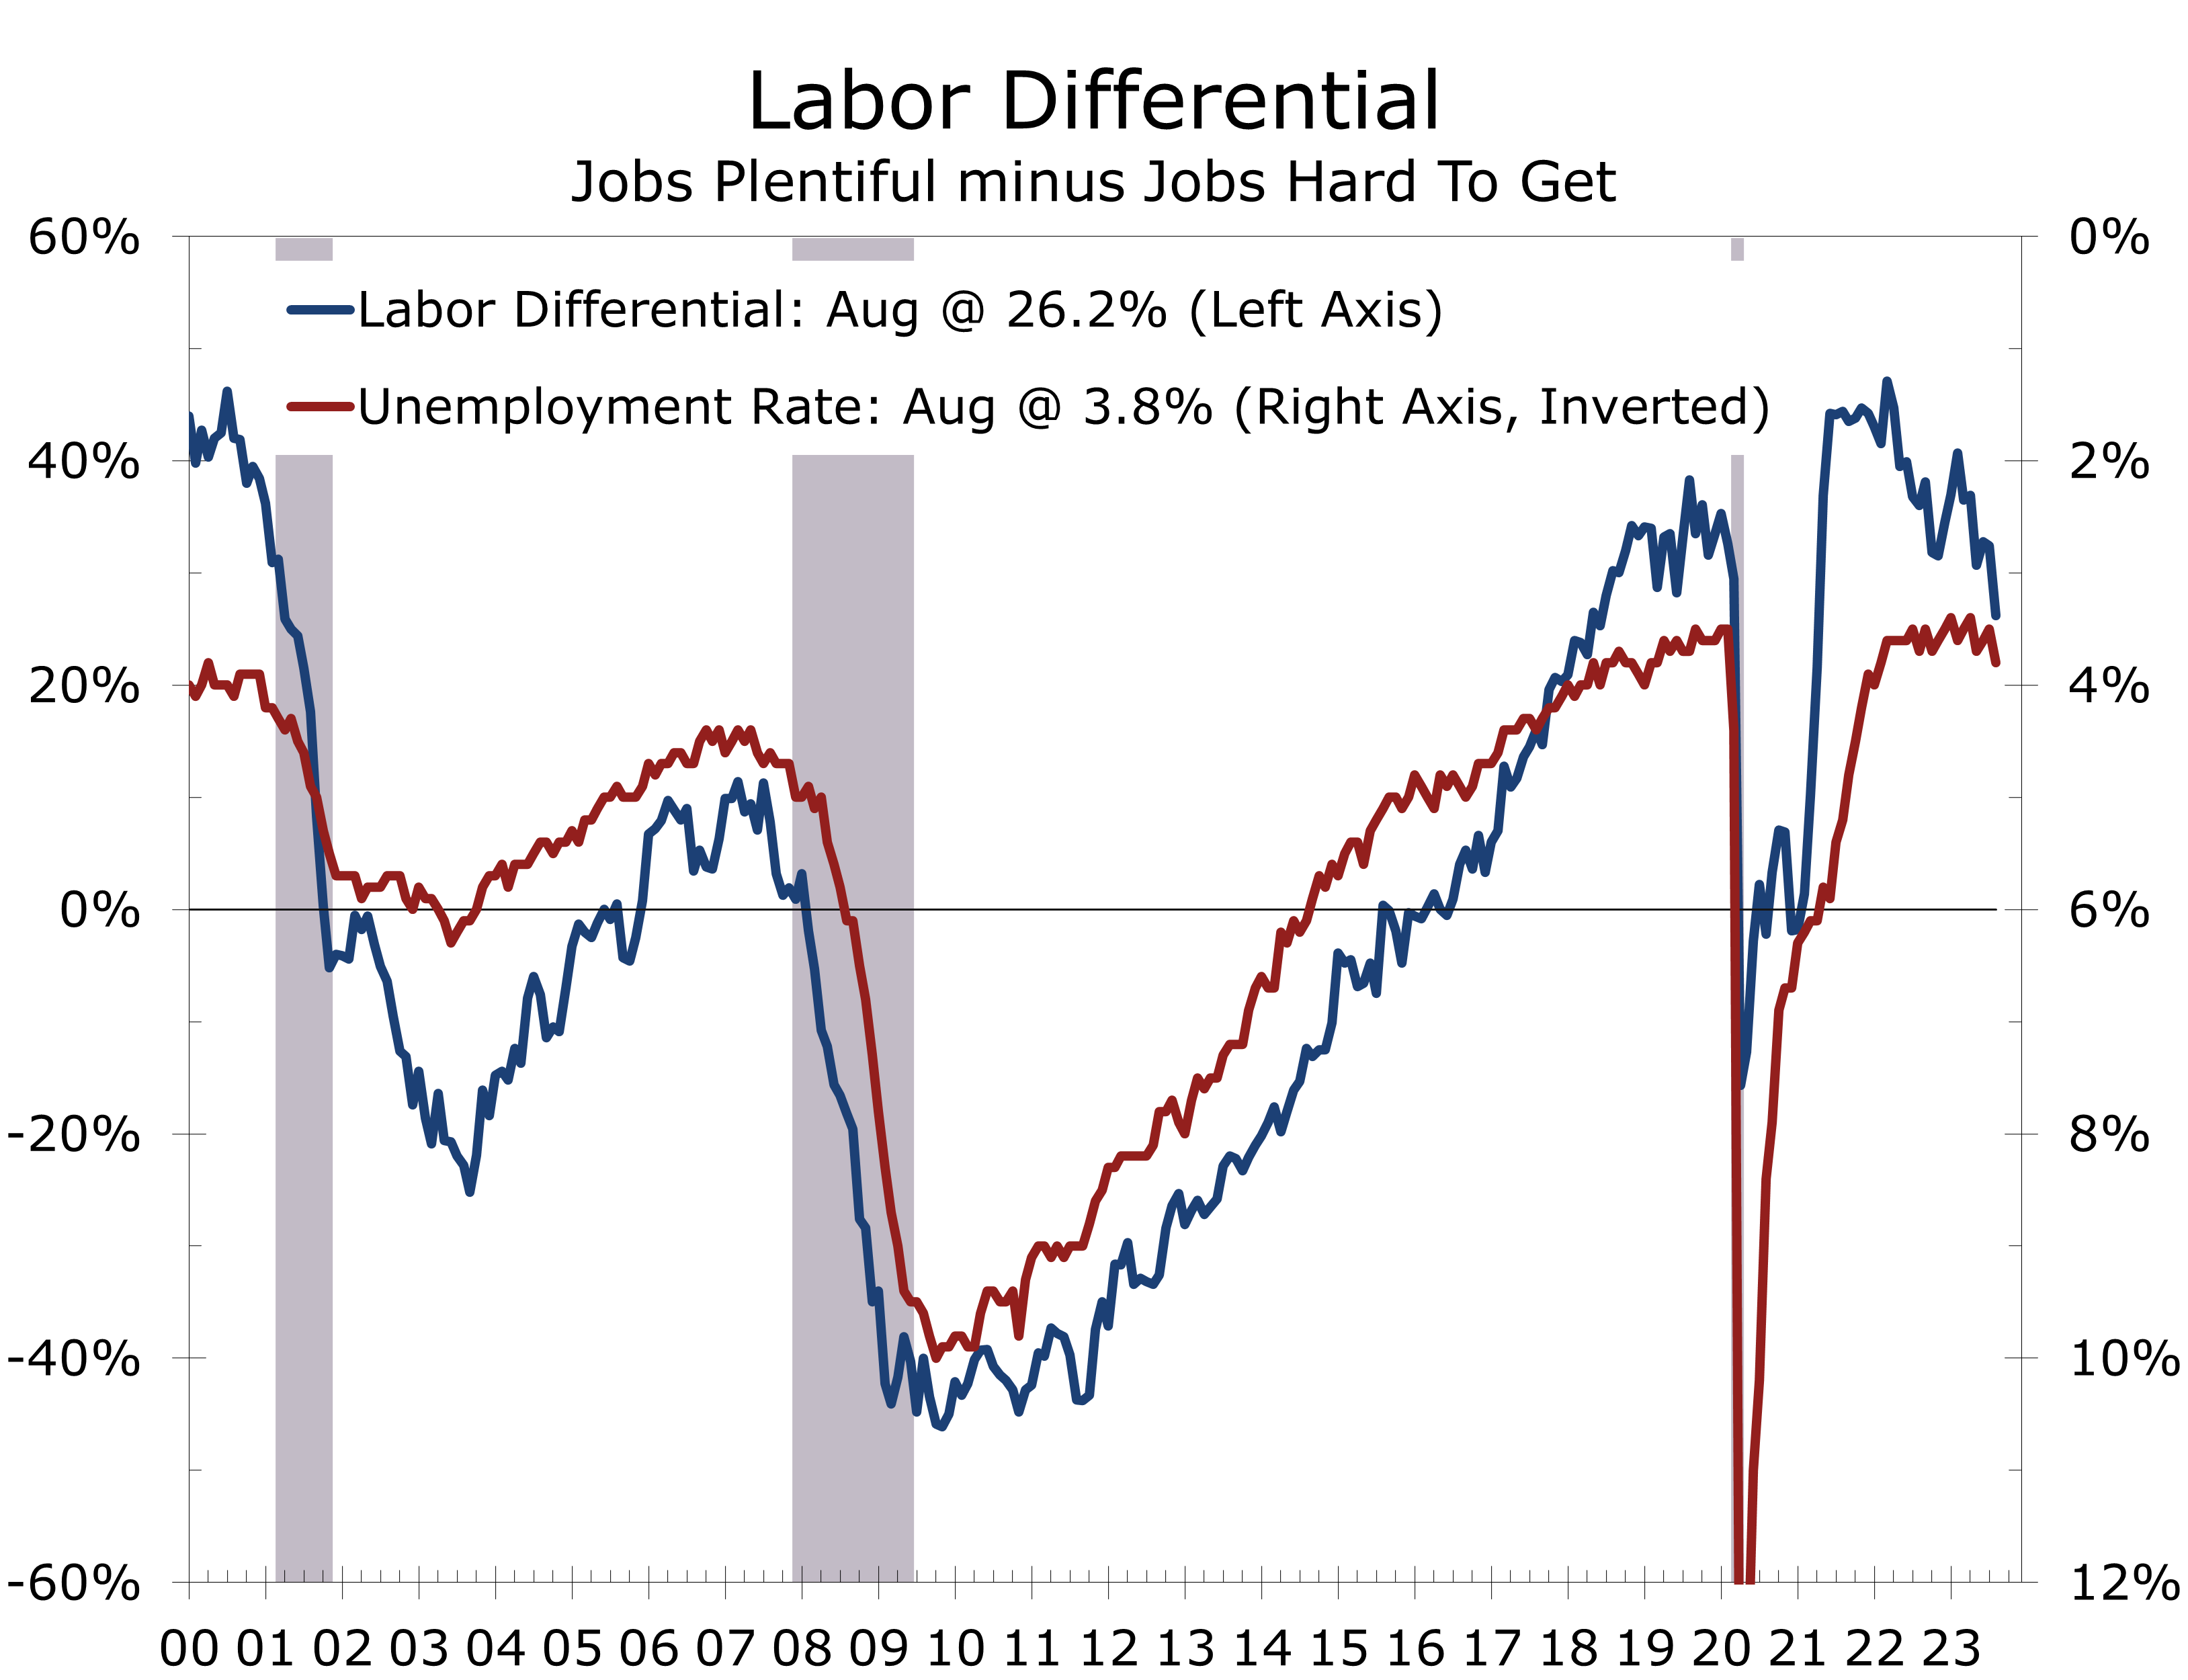
We are already seeing signs economic growth cooled off a bit in August. Consumer confidence fell by a larger than expected 7.9 points in August to 106.1. While the overall index remains relatively high, consumers’ assessment of both the current economic situation and future expectations fell meaningfully. Moreover, the proportion of consumers stating ‘jobs were plentiful’ fell to its lowest level since April 2021, while the proportion stating ‘jobs were hard to get’ increased. The labor market differential, which takes the difference between these two, fell to its lowest level since April 2021. The drop would be consistent with an increase in the unemployment rate just under 4%.

Right on schedule, the labor market data confirmed what consumers were saying. Job growth slowed, the unemployment rate rose, labor force growth increased, and wage gains moderated. When you add in the earlier reported decline in Job Openings, this past month’s employment data checked off every major box on the Fed’s punch list.
Some analysts were quick to point out that two special factors played a role in holding back August job growth – the shutdown of long-troubled less-than-truckload carrier Yellow Corporation contributed to an outsized 34,000-job loss in transportation and warehousing, and the ongoing
Hollywood/SAG-AFTRA strike resulted in the loss of 15,000 jobs in the information sector. While this is true, we feel it is a mistake to simply add these jobs back into the total. For starters, job growth for the prior two months was revised lower by a combined 110,000 jobs. The average gain for the past three months is just 150,000, less than half the average gain of 327,000 jobs during the prior 12 months. Moreover, while the Hollywood/SAG-AFTRA strike is a temporary setback that will almost certainly be reversed once the strike is settled, the losses at Yellow Corporation are more reflective of the ongoing freight recession impacting shippers in general, as well as tightening credit conditions, which are making it harder for financially stressed companies to roll over maturing debt.
Yellow is not the only company that abruptly shut down this past month. Furniture-makers Klaussner and Mitchell Gold + Bob Williams also closed permanently in August, wiping out more than 1,400 jobs and continuing a long string of furniture industry cutbacks this year. Business closures in general picked up this summer, including a wide range of businesses including retailers, craft breweries and restaurants. Job losses will take a few more weeks to show up in the employment data but might already be impacting the Job Openings and Labor Turnover (JOLTS) data, which showed a sharp decline in job openings the past two months and a pronounced drop in the number of voluntary quits. With workers more concerned about job security, wage demands should moderate further.
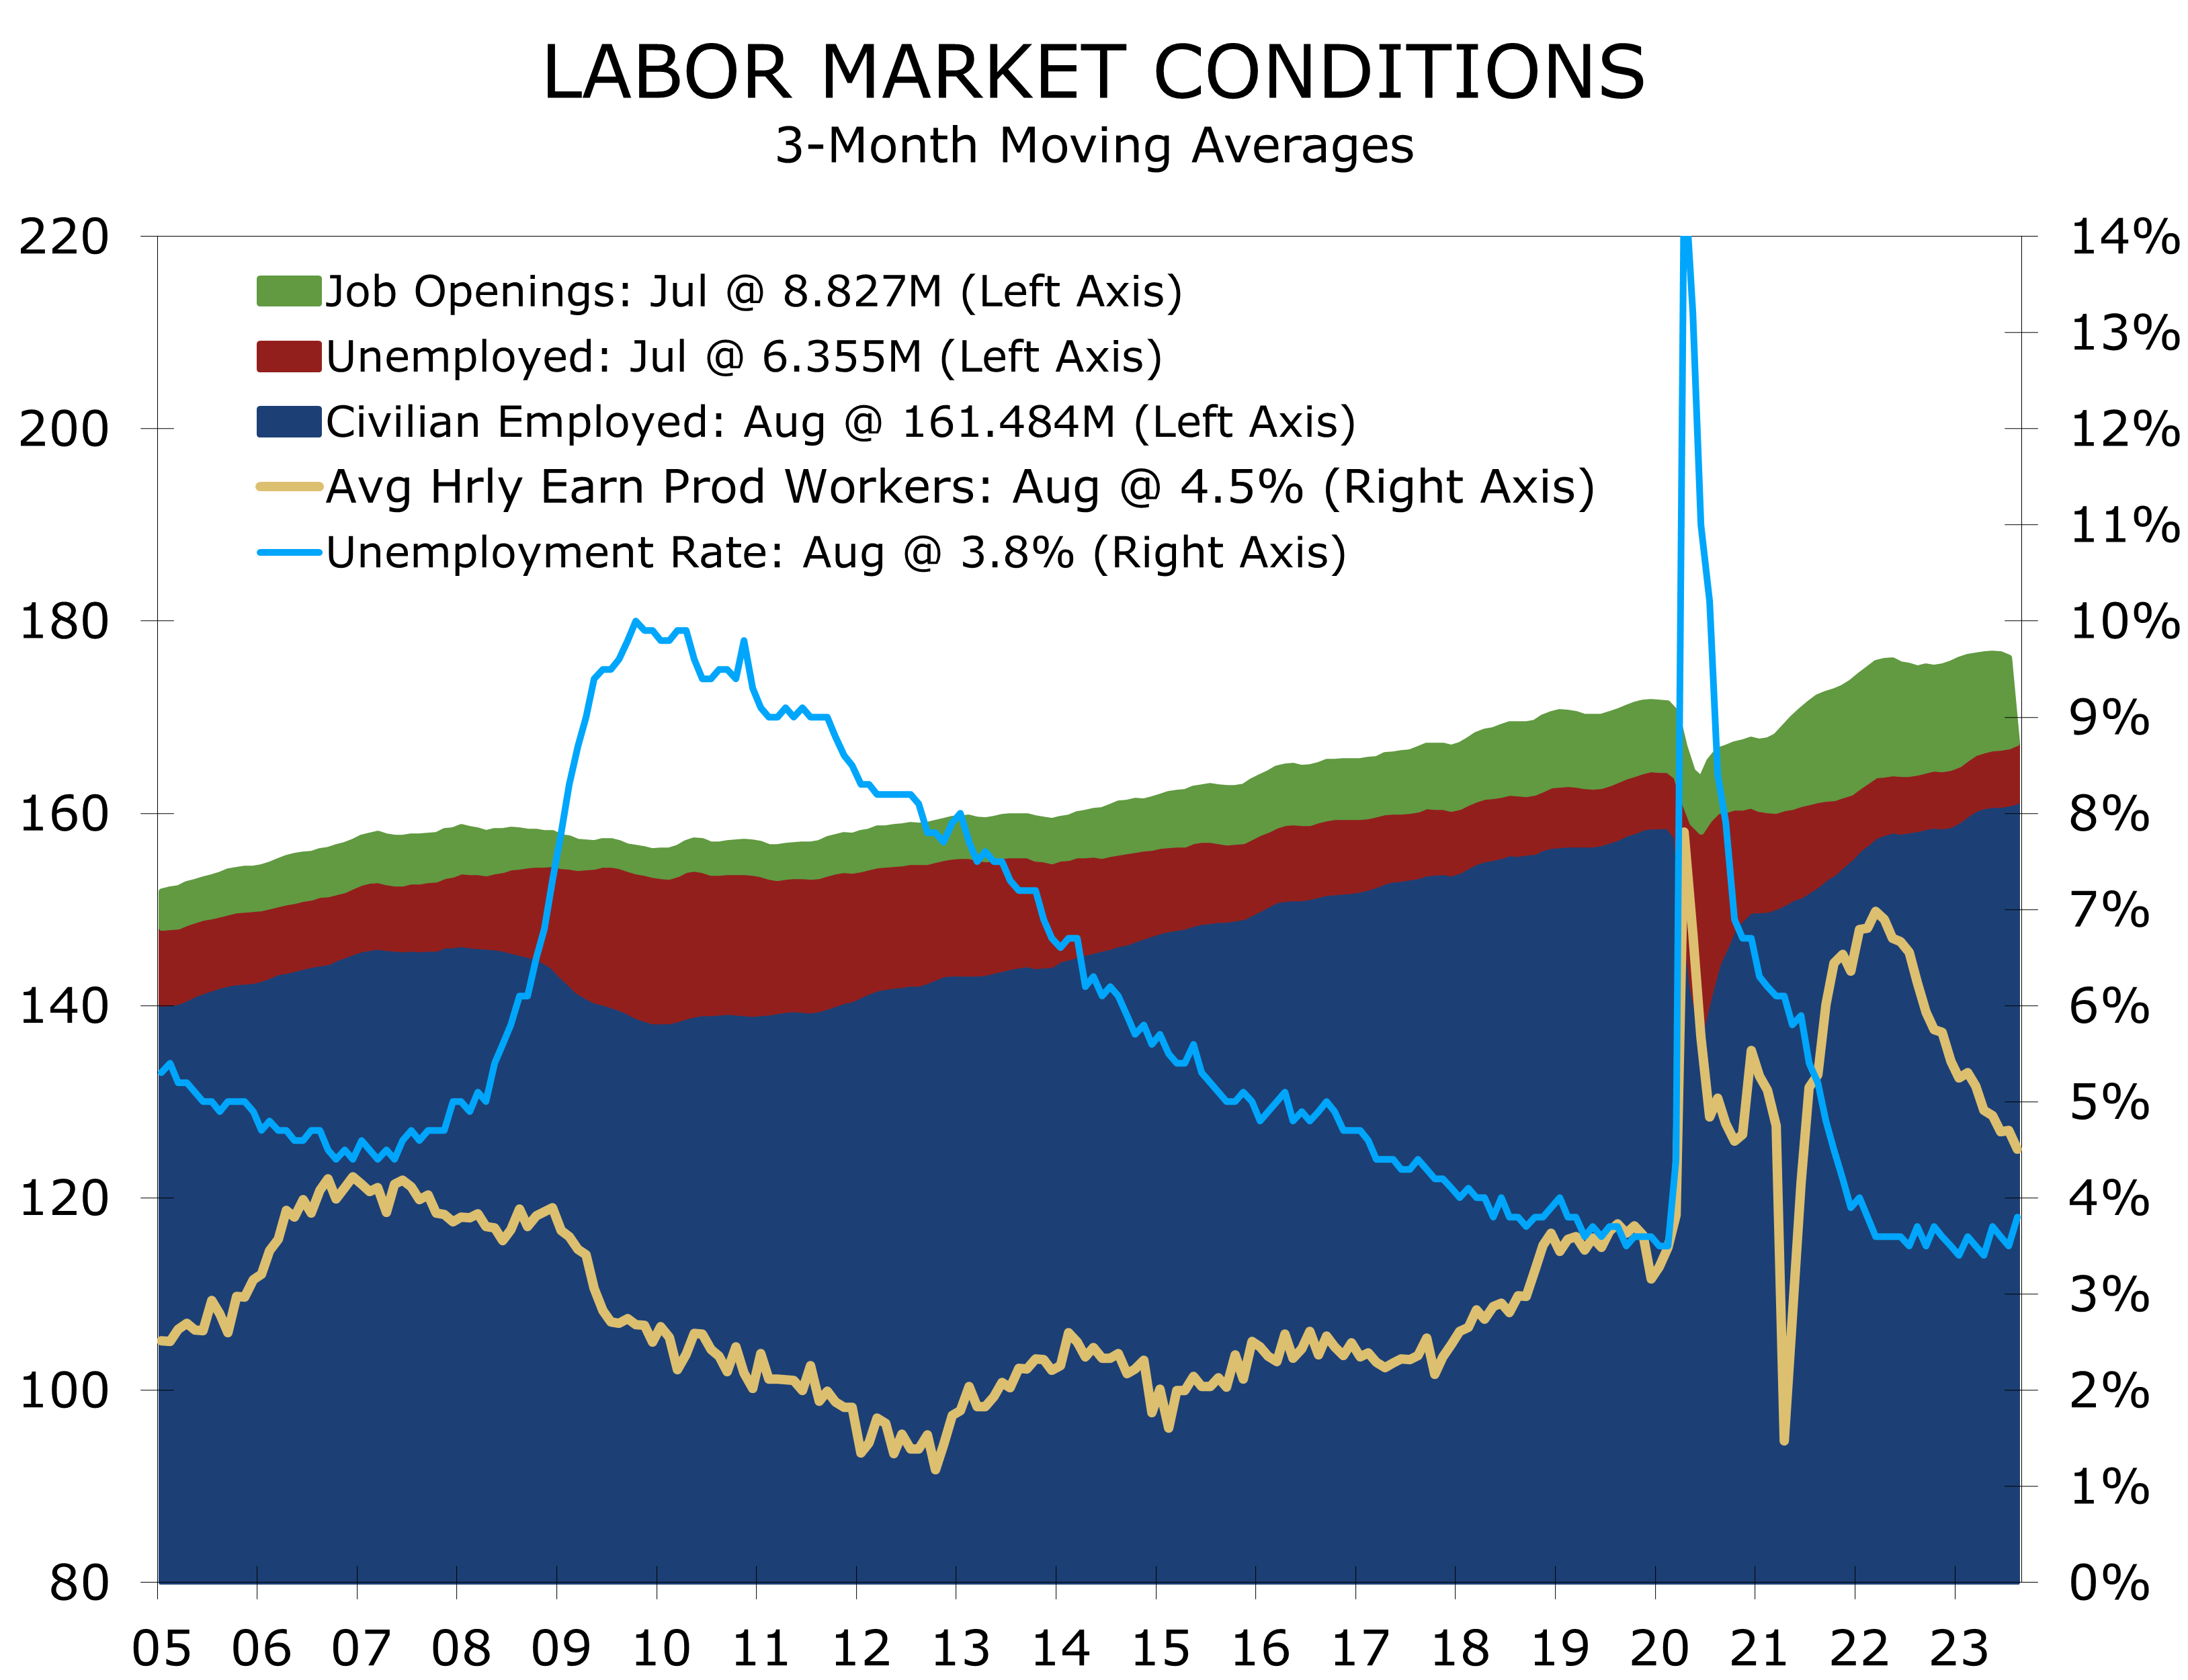
The latest data suggests the rebalancing of the labor market is further along than previously thought. The JOLTS data reported the number of job openings fell by 338,000 in July to 8.837 million jobs. While that still slightly exceeds the 6.355 million unemployed, it marks the lowest number of job openings since March 2021. The number of job openings for the prior month were also revised lower and now clearly appear to be on a downward trend.
The eye-popping 0.3 percentage point rise in the unemployment rate is not cause for concern. The entire increase is due to a surge in labor force participation, which is another positive step in rebalancing the labor market. The labor force increased by a mammoth 736,000 in August, easily outpacing the 222,000-person rise in civilian employment. The difference between the two shows up as a 514,000-person increase in the number of unemployed.
With a little more slack in the labor market, wage increases can continue to moderate. Average hourly earnings rose just 0.2% in August and are now up 4.3% year-to-year on an overall basis and up 4.5% year-to-year for production workers. The deceleration in wage increases is backed up by survey data from the Atlanta Fed and private sources. Wage pressures are still too high, however, to bring inflation back down to the Fed’s 2% target, particularly with labor disputes becoming more frequent and the major motor vehicle producers facing contentious contract negotiations with the United Auto Workers this month. Given recent productivity trends, wage increases would need to be 3.5% or less to bring inflation back to 2% on a sustained basis.
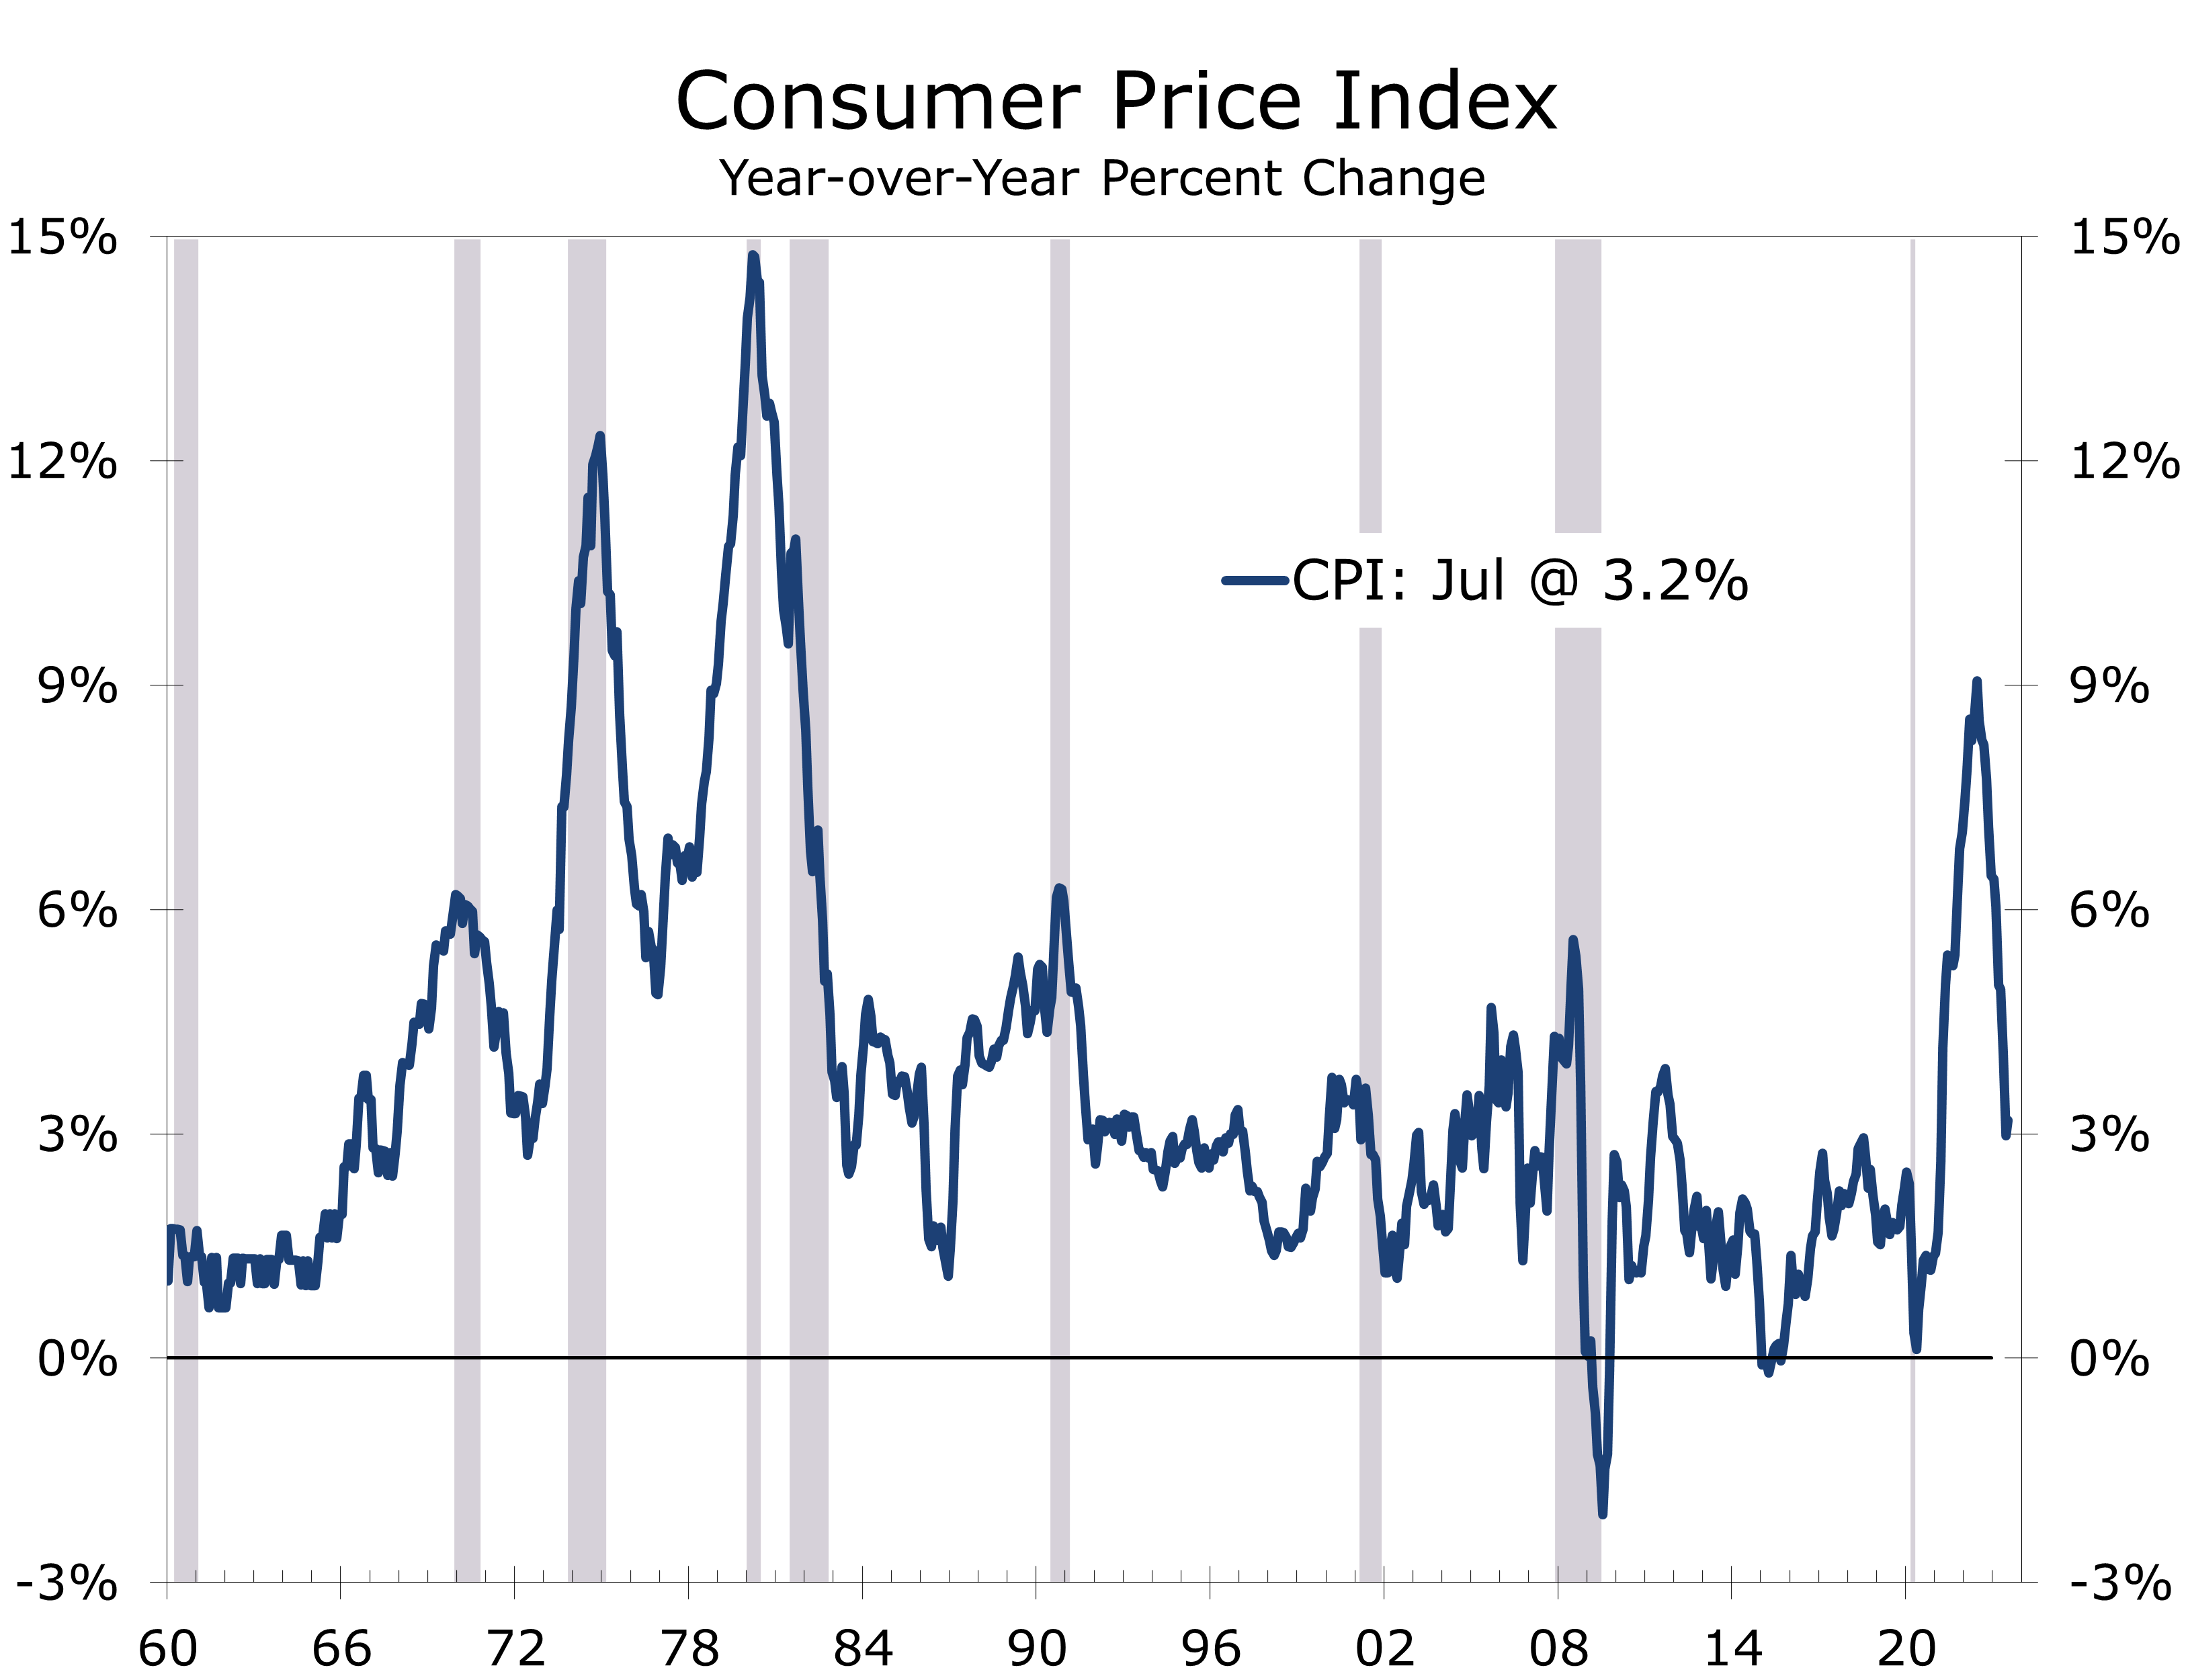
The softer employment data will allow the Fed to hold rates steady at their September FOMC meeting. The consensus view has been that the Fed would take a break from rate hikes at the September meeting and a growing proportion of forecasters now believe the Fed has finished hiking interest rates for this cycle. That could certainly be the case, but the Fed’s job will get tougher. The recent improvement in inflation, which has seen the year-to-year change in the CPI fall from 9.1% last all June to 3.2% in July, has been overstated. Overall inflation has benefitted from falling oil prices, easy year-to-year comparisons, and a whole host of special factors that have temporarily depressed seasonally adjusted prices for hotels, airfares, and medical care. Oil prices have rebounded more recently, and retail gasoline prices have been rising at a time that they normally would be falling, which will lead to some outsized gains in coming months. Moreover, the temporary seasonal factors holding back prices on airfares, hotel rooms and medical care will all reverse this fall.
Those higher inflation readings are likely to show up around the same time the Bureau of Economic Analysis reports blockbuster GDP for the third quarter, which might be enough for the Fed to push through another quarter-point interest rate hike at the November 1 FOMC Meeting. Of more immediate concern, however, is what changes FOMC members make to the Summary of Economic Projections (SEP) released following their September 20th meeting.
We expect the FOMC estimate for 2023 economic growth to increase, while the estimate for the yearend unemployment rate will decline slightly. The median estimate for the yearend federal funds rate is currently 5.60% for this year and 4.60% for 2024, which suggests the Fed will hike the funds rate one more time this year and will cut interest rates at some point next year. We expect the Fed to keep the median federal funds rate where it is for 2023 but slightly raise the rate for 2024 and 2025, as well as their projection for the longer run federal funds rate, which is currently 2.5%. Both the Central Tendency and Range of participants’ projections for the longer run federal funds rate rose at the June meeting, which might be a precursor to a rise to 2.7% or 2.8% at the September meeting. This would reinforce the idea that the Federal Reserve is in no hurry to cut interest rates and provide a powerful signal to the financial markets, businesses and consumers that interest rates will remain higher for longer. The Fed’s SEP will also include projections for 2026 for the first time.
Determining where interest rates are headed long term is a difficult task and involves assumptions on the future course of inflation, demographics, potential real GDP growth, and size of federal budget deficits. We believe inflation will average close to 3% in 2004 and feel the Fed will have a difficult time bringing inflation back down to their 2% target on a sustained basis.
We feel monetary policy is going to go back to old school, with Powell shifting from channeling his inner Volcker to channeling Alan Greenspan. Volcker brought inflation down from double digits in 1980 to 4% by 1985. Greenspan brought inflation down to 2% over the next decade.
Leaning Into the Wind
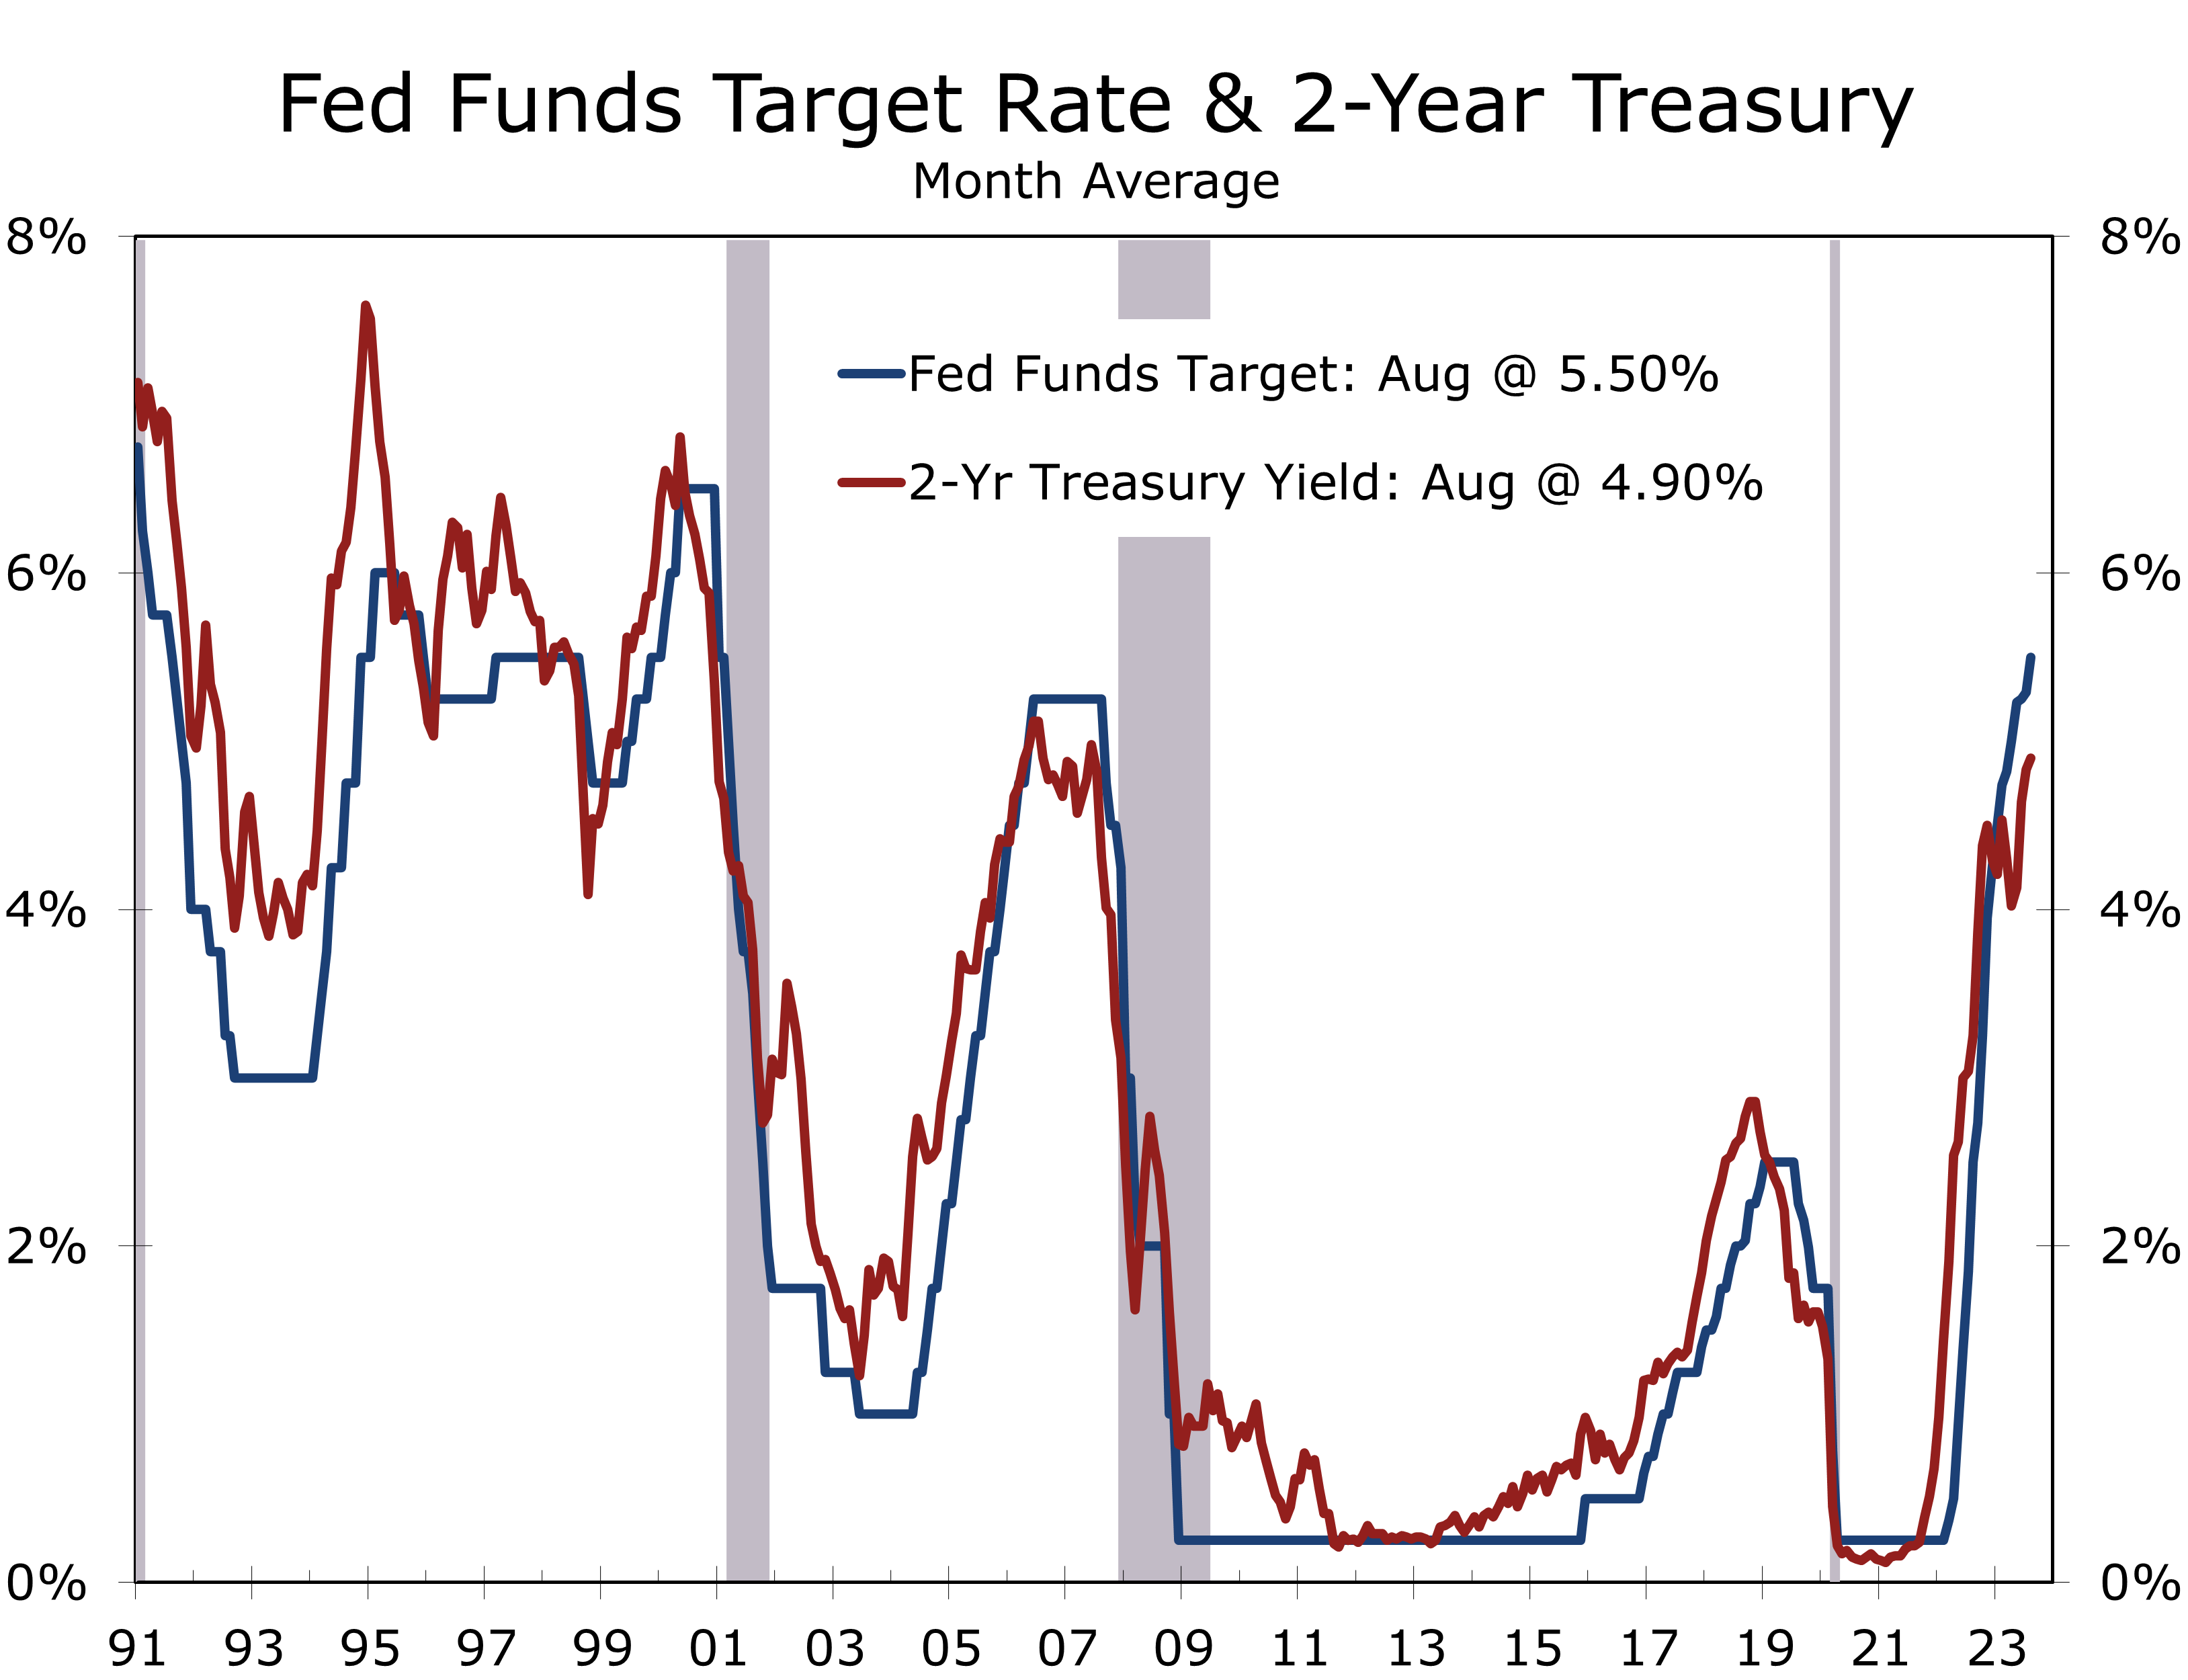
Greenspan’s blueprint for bringing inflation down was to lean into the wind by tightening policy more aggressively when the economy was growing solidly, particularly if there was a supply shock that was temporarily suppressing inflation. While the Fed would be pre-emptive on the upside, they would drag their feet lowering rates once the economy lost momentum. This policy became to be known as opportunistic disinflation and we feel a return to this policy over the next few years will be needed to bring inflation back to the Fed’s 2% target. For reference, the federal funds rate averaged 6.06% from 1985 through 1995.
The mid-1990s brought the advent of the Internet age and subsequent tech boom, which boosted productivity growth and allowed the Fed to follow an easier policy. The federal funds rate averaged 4.05% from 1995 through 2007. The funds rate also dropped to a then modern-era low 1 % in the aftermath of the September 11 attacks before steadily trekking higher amidst the housing boom.
The housing bust and ensuing Global Financial Crisis brought in a new policy regime, with the federal funds rate falling to nearly zero and remaining there for the next 8 years. The Fed nudged interest rates slightly higher in 2016 and then began to gradually raise rates in 2017 and 2018, before cutting them amidst slowing growth in 2019. Even including this modest interest rate cycle, the federal funds rate averaged just 0.71% from the end 2007 to the end of 2019. The Fed subsequently brought the funds rate back down to near zero after the onset of the COVID-19 pandemic and held it there until they began to raise interest rates in March 2022.
Unless the economy is hit with another major calamity, we do not expect the Federal Reserve to drop interest rates to near zero again. Near zero interest rates defy the laws of economics, encourage speculation, and worsen economic inequality. Near zero interest rates are also extremely difficult to exit. The Fed is seizing the opportunity they have today, where residual monetary and fiscal stimulus from the pandemic and the front-end boost from the Inflation Reduction Act and CHIPS ACT allow them to pursue a more aggressive tightening than they would otherwise.
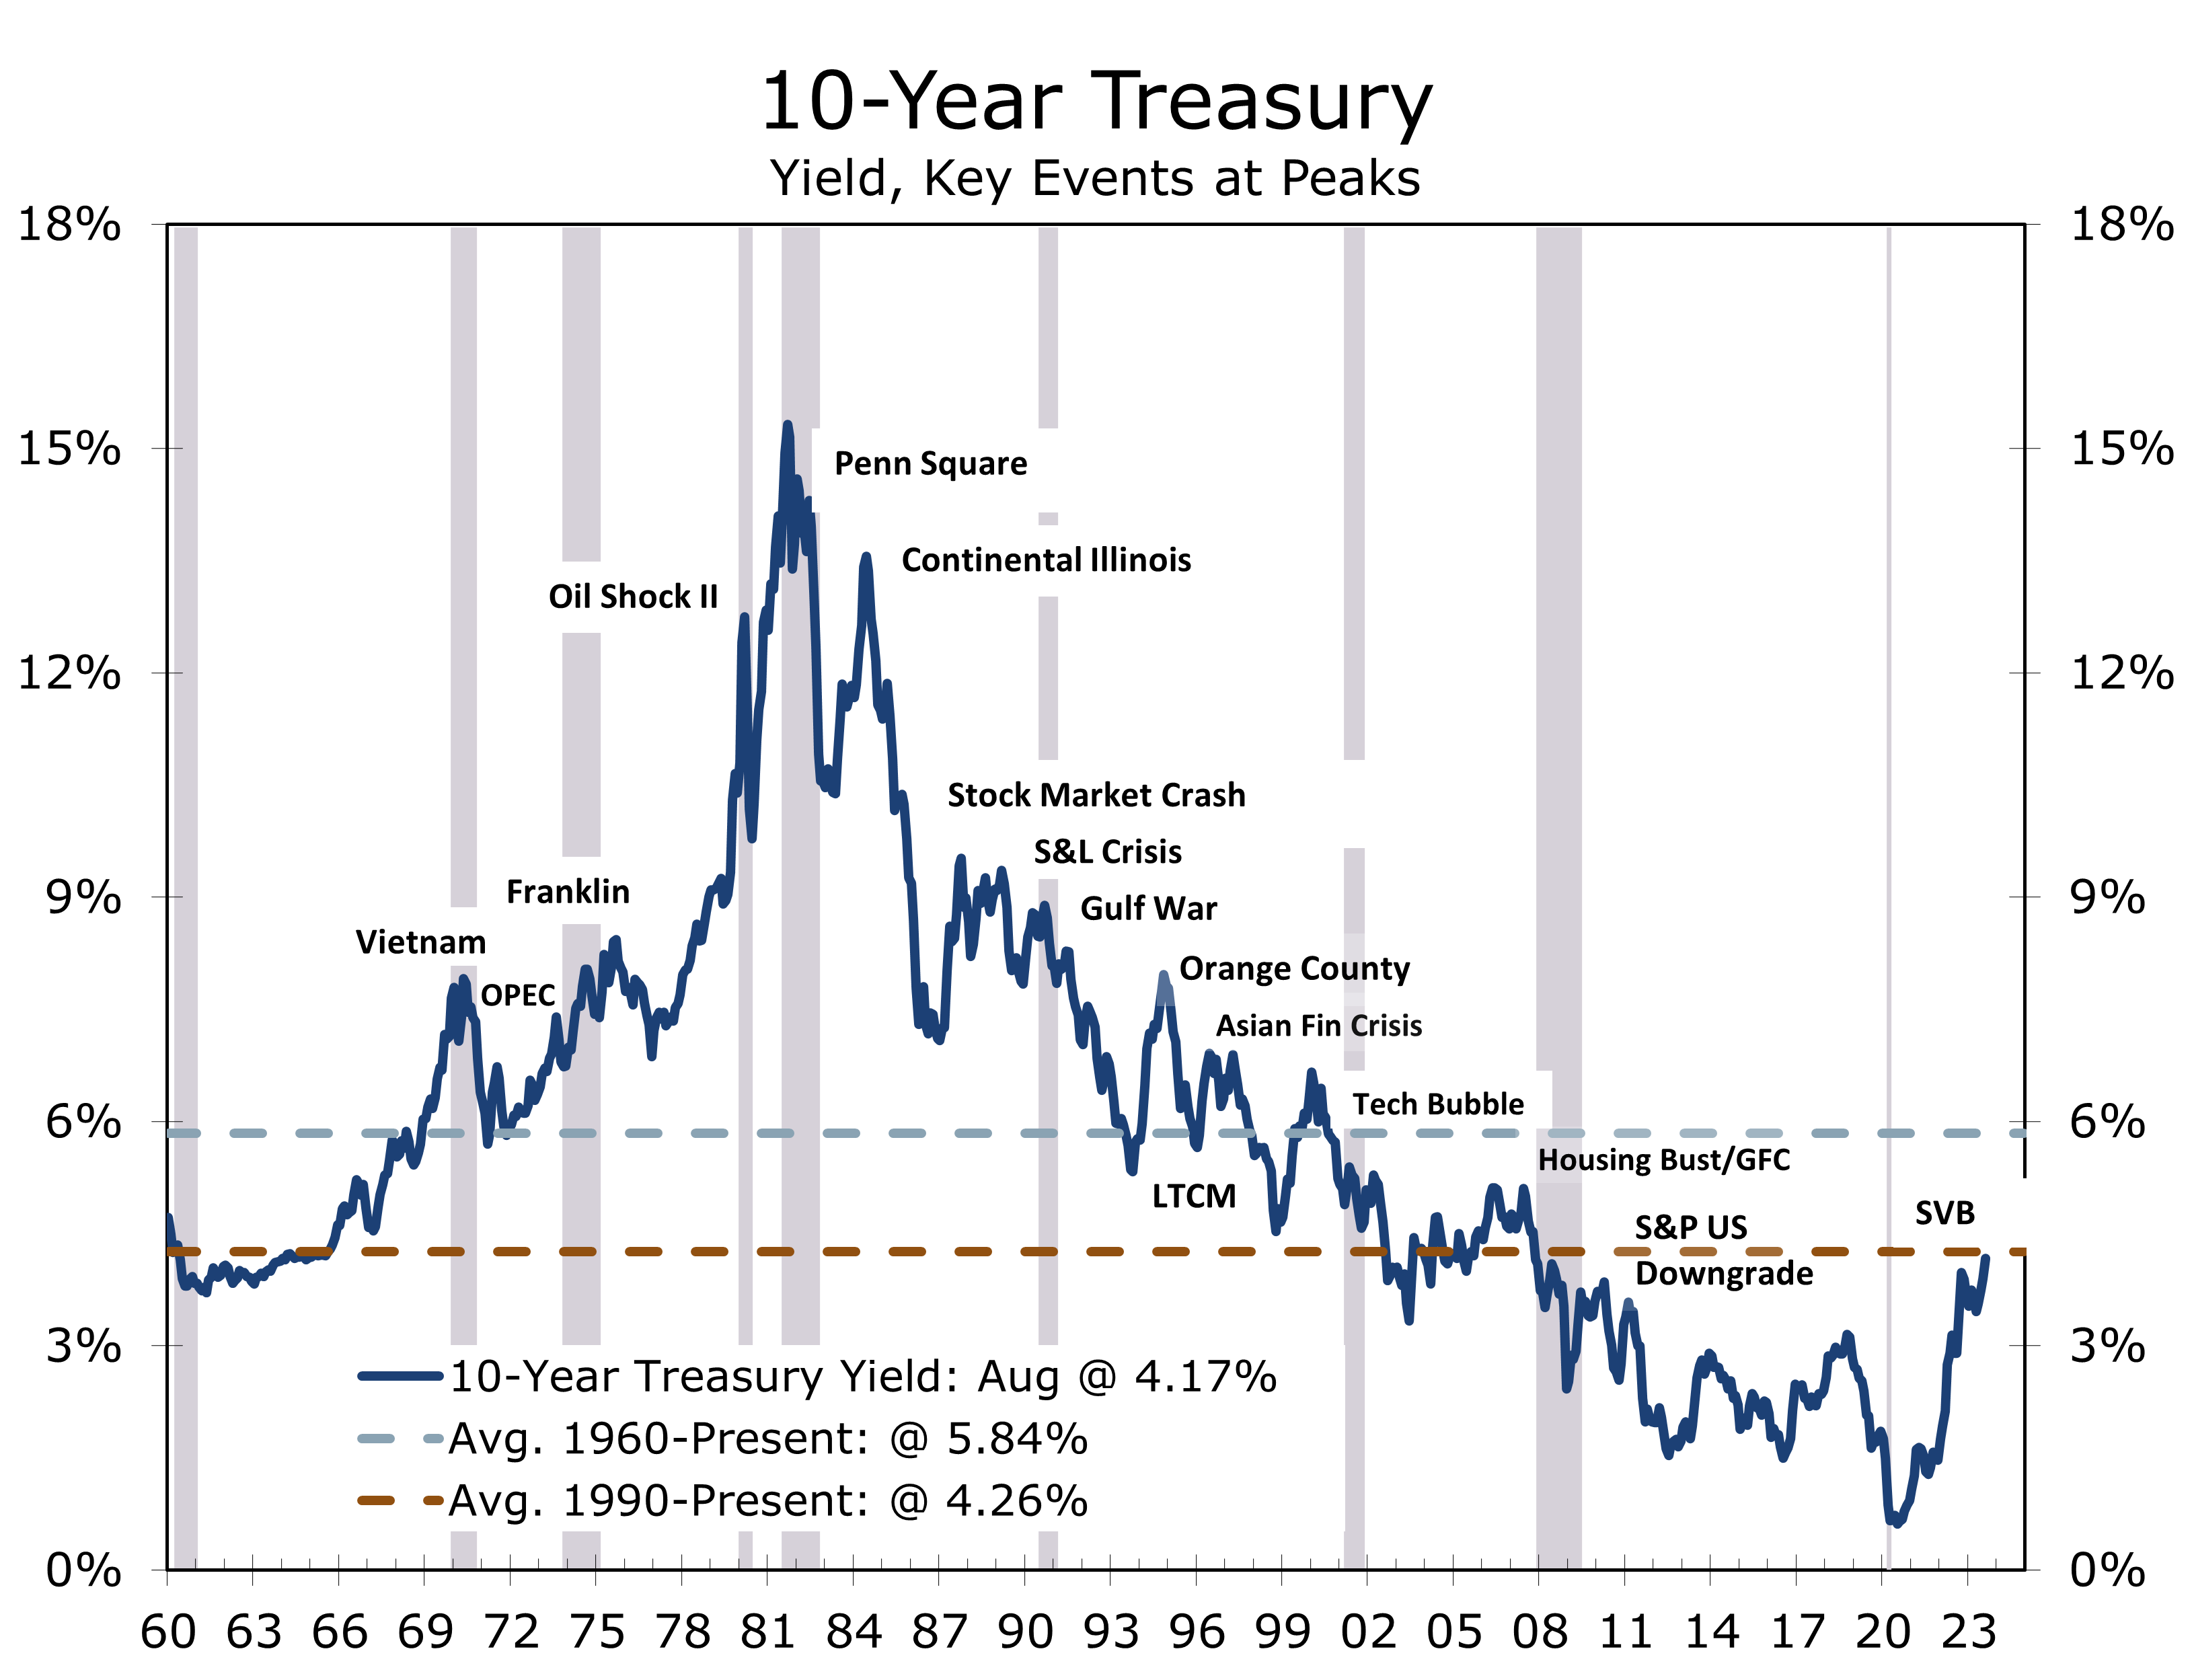
Longer term we see the federal funds rate averaging around 3% through the rest of the decade, which is a half percentage point above the Fed’s current estimate for the longer funds rate. A federal funds rate at this level would be consistent with the 10-Year Treasury averaging between 4% and 4.25% through the end of the decade, which is well above current consensus estimates but well within historic norms.
Our interest rate forecast is also higher than the Congressional Budget Office (CBO), which sees the 10-Year Treasury Note averaging 3.80% between 2023 and 2033. With a normal yield curve, the CBO’s 10-Year Treasury forecast works out to a 2.5% average for short-term T-Bills and the federal funds rate. Since the bulk of Treasury financing is done short-term, short-term rates averaging closer to our forecast of 3% would add significantly to the federal budget deficit, which is already projected to rise to a record level relative to GDP.
We have made some slight adjustments to our economic forecast. The most notable is we no longer have a negative quarter for real GDP in 2023. We still see a recession over the next year as more likely than a soft landing, but the odds of the latter have risen while the odds of the former have fallen. The lags between when the yield curve first inverts the onset of recession are between 12 and 18 months. A 15-month lag would put the onset of recession in October and 18 months would put the start of recession in January 2024.
More fundamentally, we expect the economy to slow in response to higher interest rates, tightening credit conditions and waning fiscal stimulus. Higher interest rates are already weighing on new and used vehicle sales. This summer’s surprising strength in new home sales also looks like it is fading, given the recent slide in mortgage applications. Tighter credit will also lead to more bankruptcies and layoffs, as more companies face difficulty rolling over maturing debt. Additionally, the resumption of student loan repayments may dampen consumer spending, particularly in discretionary services, although it might slightly boost labor force growth.
Disclaimer: This publication has been prepared for informational purposes only and is not intended as a recommendation offer or solicitation with respect to the purchase or sale of any security or other financial product nor does it constitute investment advice. Any forward looking statements or forecasts are not guaranteed and are subject to change at any time. Information from external sources have not been verified but are generally considered reliable.
© 2023 CAVU Securities, LLC
Questions? Email: CompassReport@cavusecurities.com
Texas Travels to Alabama for a Preview of SEC 2.0
An Early Season High-Profile Matchup
- Duke, FSU, Colorado and the Pac-12 were the big positive surprises in week 1 of the college football season. Clemson, LSU, and TCU were the biggest disappointments.
- This week’s big matchup has 10h-ranked Texas at 3rd-ranked Alabama, in a rematch of last season’s early and classic.
- Alabama is one the most storied football programs in the nation, while Texas long dominated the Southwest Conference before its collapse and has consistently contended for the Big-12 crown.
- Both teams are coming off ‘disappointing’ seasons most schools would relish.
- The game could go a long way toward answering questions about whether Alabama’s program has lost a step and if the Texas Longhorns are set to join the handful of elite college football programs.
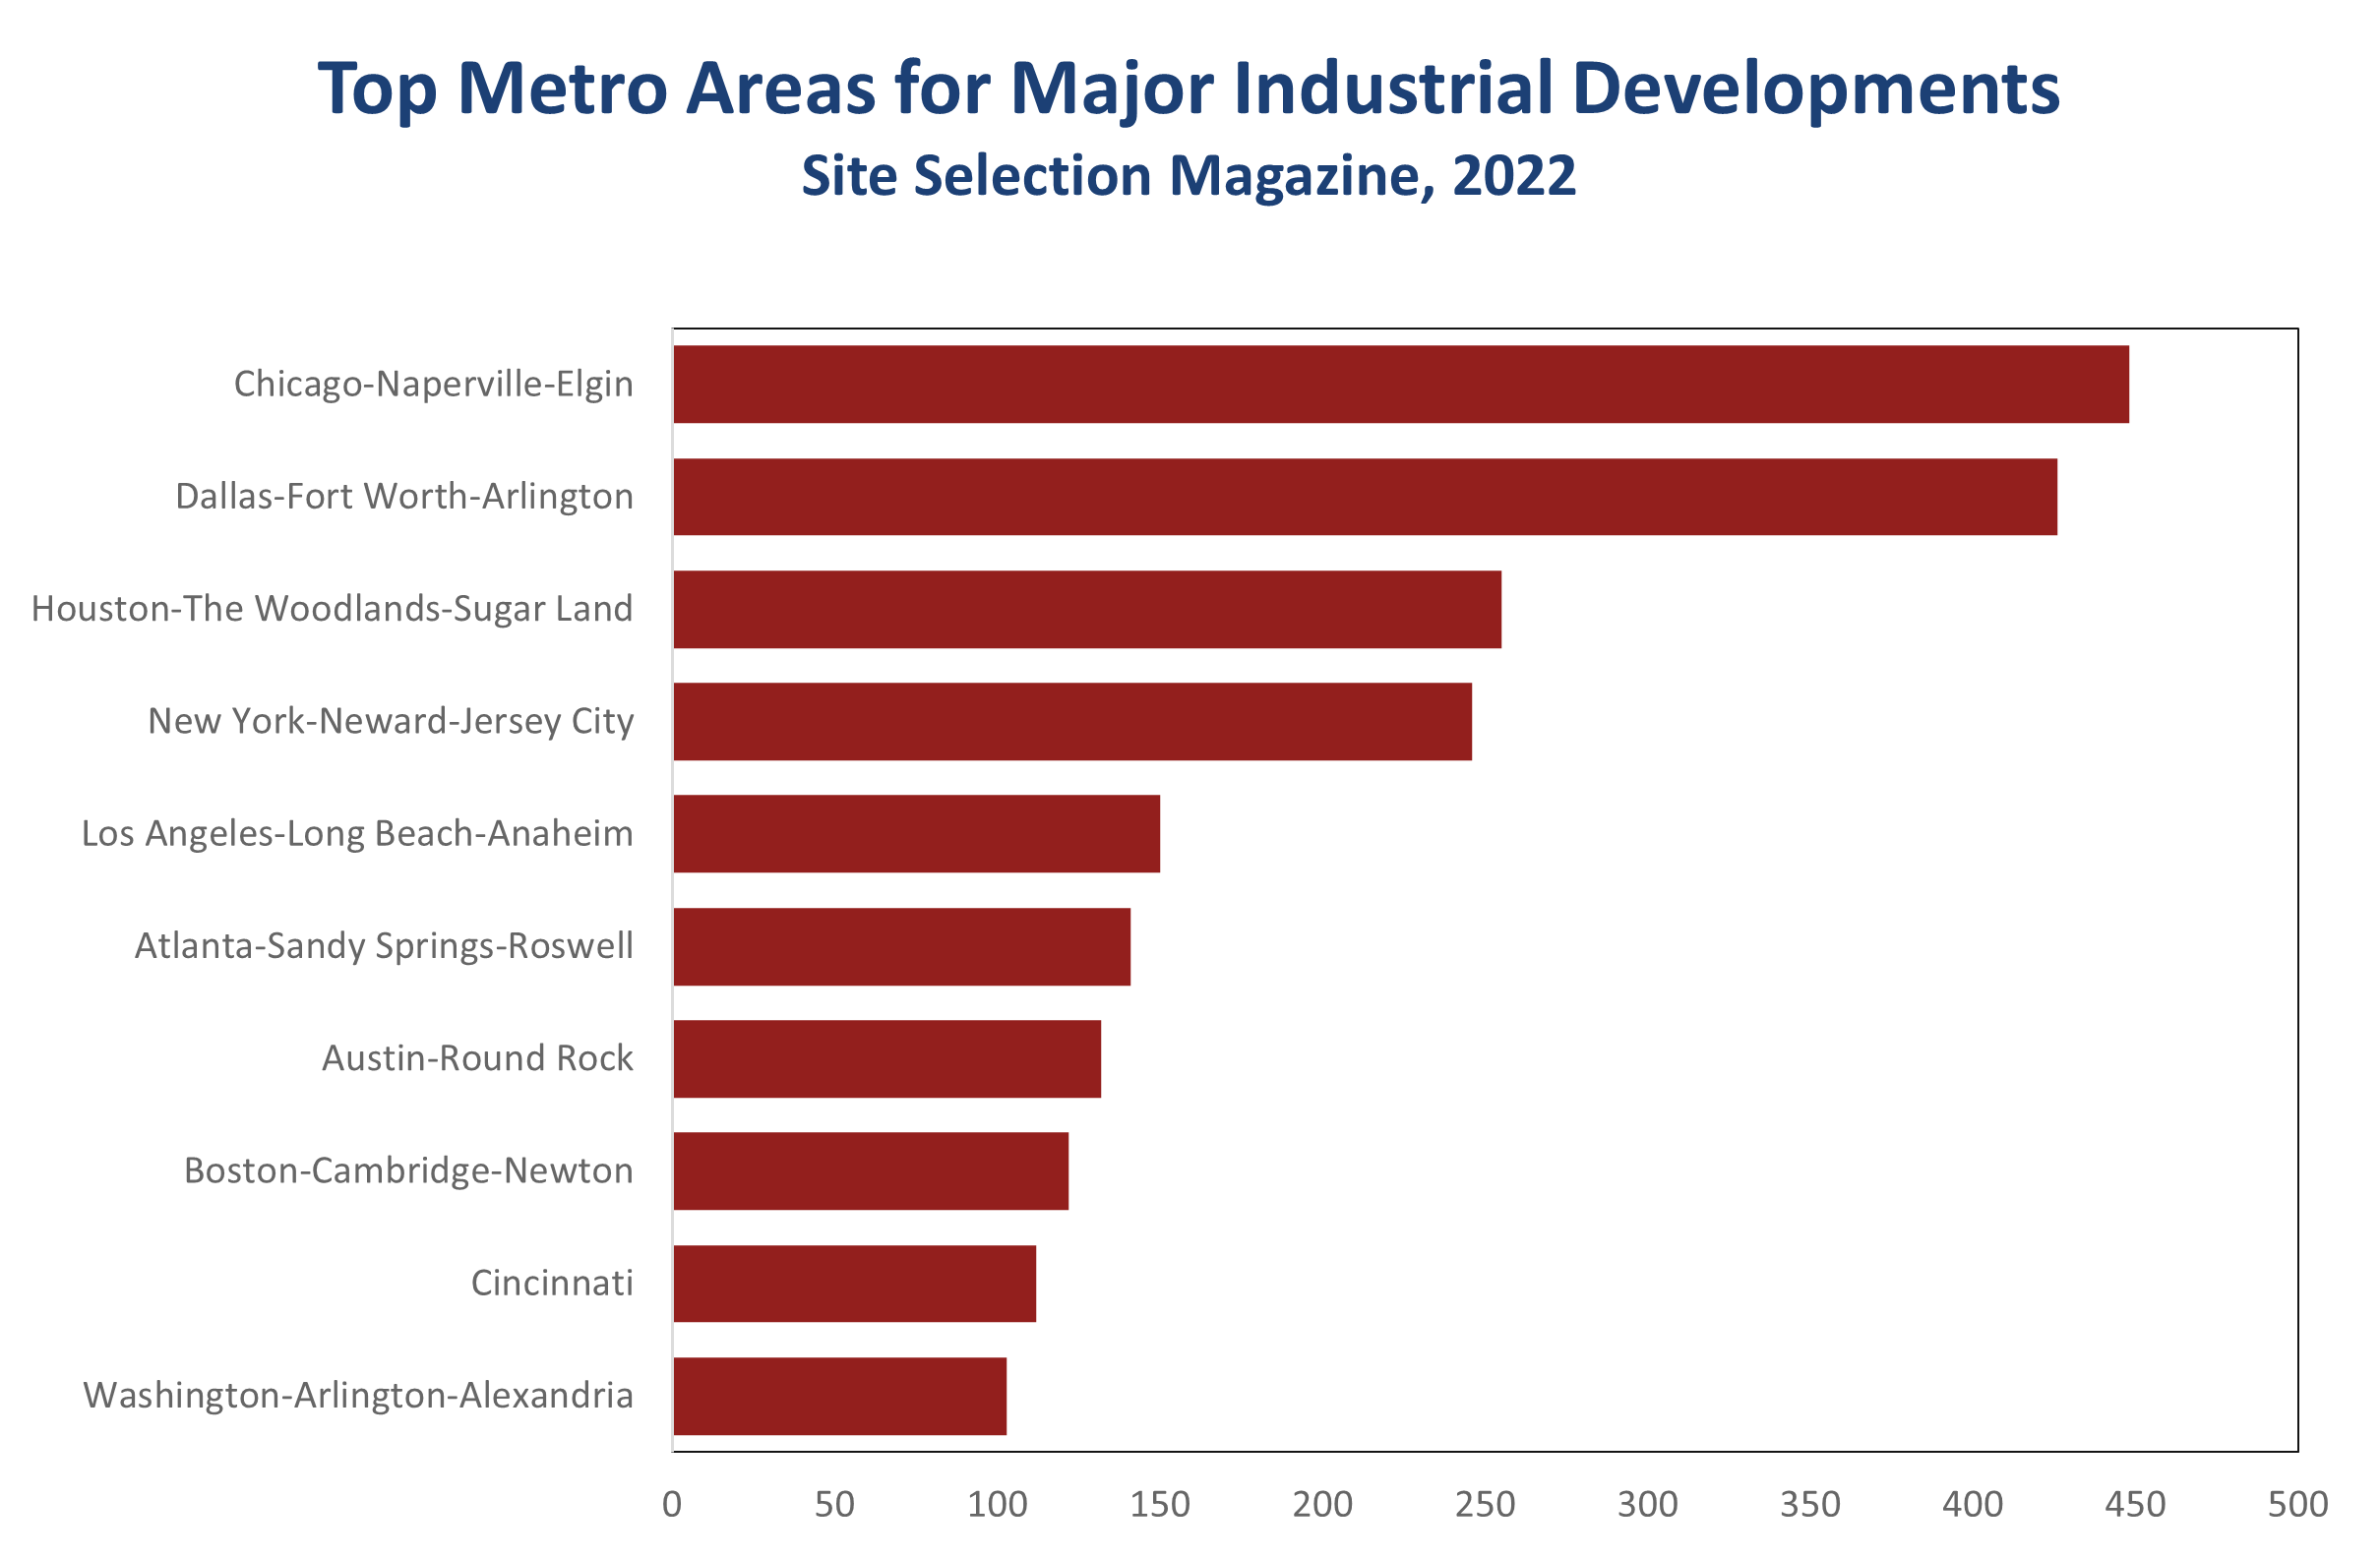
- The Texas economy has been as dominant as Alabama’s football program. Alabama is growing more modestly but enjoying a colossal wave of industrial development.
Week 1 of the 2023 College Football season brought plenty of surprises to go along with the usual early season blowouts. While most major programs schedule light opponents for opening week, there were a few notable exceptions. Colorado proved that even noon games could be ‘Prime Time’ with its surprisingly strong victory over a heavily favored TCU. The biggest surprises came later, with FSU dominating LSU Sunday night and Duke trouncing Clemson 28-7 on Monday night. Another surprise is that the Pac-12 began its last season with every team a winner, something that will certainly never be repeated.
This week’s key matchup features 10th-ranked Texas traveling to Tuscaloosa to face 3rd-ranked Alabama. The game is a rematch of last season’s early classic and will be televised by ESPN at 7 pm EST. Texas appeared to be on the verge of an upset, only to see Alabama battle back, following a controversial call on what appeared to be a safety by the Texas defense, to ultimately win 20-19.
The game will answer questions about both programs. Texas, coached by Steve Sarkisian, a former assistant coach for Nick Saban, has had a great deal of success with recruiting of late. The Longhorns have been trying to return to their former status as one of the nation’s elite college football programs. A win Saturday would further that goal.
Alabama has had to deal with talk that it has lost a step. The Crimson Tide finished 11-2 last year, including a decisive 45-20 victory over Big-12 Champion Kansas State in the Sugar Bowl. That was good enough to finish 5th in the final AP Poll. Moreover, both of Alabama’s losses were by razor thin margins to good teams (Tennessee and LSU), on the road and in overtime.
Nick Saban and Alabama fans were quick to make those points to the Playoff selection committee last season to no avail. While they had a strong argument, it was hard not to take 1-loss TCU, which narrowly lost the Big-!2 Championship game to Kansas State and then convincingly beat Michigan in the semi-final game before getting utterly getting trounced 65-7 by Georgia in the most lopsided championship game on record.
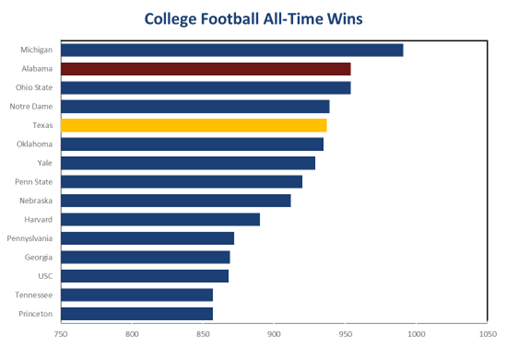
The Playoff committee may simply have had a bit of Alabama-fatigue. The Crimson Tide is one of the most storied football programs in the country. Since the team’s inaugural season in 1892, Bama has accumulated 968 wins, 18 national championships and a record 76 bowl appearances.
As hard as it is to believe, Alabama was not always the King of the Hill. College football originated at private schools, mostly in the Ivy league and then spread to the Midwest. Alabama did not gain national prominence until they defeated the then all-powerful Pennsylvania Quakers in 1922, coached by John Heisman.
The Pennsylvania victory marked a turning point for Alabama football and football in the South in general. Still for years, journalists would question the legitimacy of Alabama’s success because of a perception they played a ‘soft’ schedule. Schools in the Southwest, such as Arizona State, decades later would have to put up with the same skepticism.
Texas began playing football in 1893 and has an illustrious history dating back to the days it dominated the Southwest Conference. The SWC collapsed in 1985 following a series of recruiting scandals, the worst of which resulted in SMU’s program receiving the ‘death’ penalty. Texas won 27 Conference titles (19 outright) in the SWC’s 81 years. The Longhorns then moved to the Big-12, where they won 3 more Conference titles and their last National Championship in 2005.
Texas greatest consistent success came under legendary coach Darrell Royal, who was head coach from 1957 to 1976. Coach Royal won 3 National Championships during his 20-year tenure and finished ranked in the Top 5 in 7 other seasons. Texas never had a losing season under Royal’s tenure.
The Longhorn’s success continued under coach Fred Akers, who guided the team to an 11-0 regular season record his first year as head coach but lost to Notre Dame in the Cotton Bowl. Akers coached the Longhorns for 10 years and finished in the top 10 three times. His best season was 1981, when Texas finished 10-1-1 and ranked second. The 1984 team also went 11-0 and would have won the National title but lost to Georgia late in the Cotton Bowl 10-9. Under Akers the Longhorns went 2-8 in Bowl games and 5-6 in his last season (1976), the first losing season for Texas in 30 years and the end of their ‘elite’ program status.
The Texas economy has been as dominant over the past 25 years as the Alabama Crimson Tide has been in football. After being decimated by the collapse in oil prices in the mid-1980s, the Texas economy has reinvented itself with a diversified mix of industries ranging from information technology and advanced manufacturing to a reformulated energy business centered around cutting-edge technology, data science and the state’s diverse energy resources.
The renaissance of the Texas economy began organically, with the growth of home-grown tech giants Texas Instruments and Dell Computer. The state gained considerable momentum, however, with growing trade with Mexico following NAFTA and growing frustration with burdensome regulations and anti-business sentiment in other states, most notably California. Of companies leaving the Golden State, more moved their headquarters to Texas than any other state, including marquee firms Toyota, Hewlett Packard, Oracle, Tesla, Charles Schwab and CBRE.
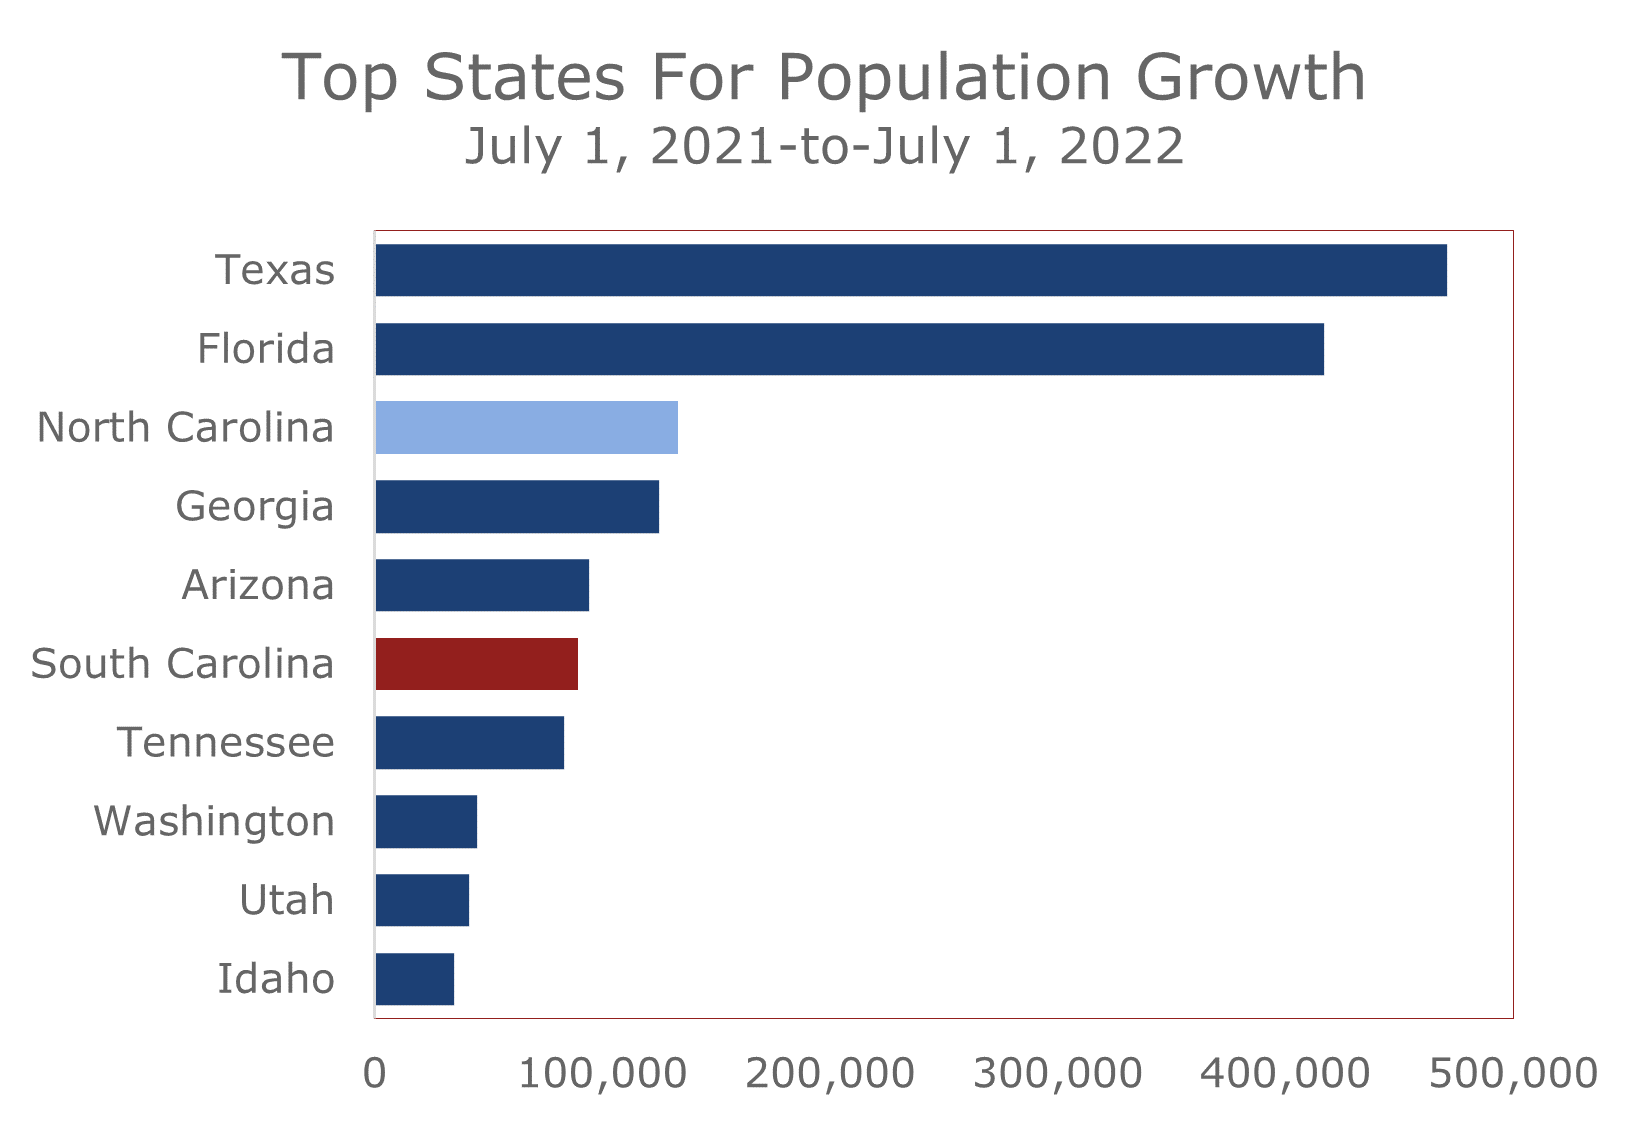
Texas has led the nation in population growth in recent years, with the bulk of the growth occurring in the Golden Triangle between Dallas-Fort Worth, Houston, San Antonio, and Austin. These for metros consistently rank as the fastest growing economies in the country in terms of population and employment growth. The Lone Star state also ranks high in business startups and is a leader in manufacturing, logistics and technology.
Alabama’s economy has traveled a quieter road to economic success. While the Magnolia State has typically not ranked among the nation’s fastest growing, Alabama’s economic transition compares favorably with anyone. The state’s business and political leadership saw the writing on the wall, as their historic dependence on textiles and agriculture left them vulnerable to the inevitable move toward globalization. The state aggressively courted Mercedes Benz, which located its first US assembly plant between Tuscaloosa and Birmingham in 1993.
Mercedes paved the way for other auto producers. Honda soon followed, beginning production at its plant in Lincoln, 40 miles east of Birmingham, in 2001. Hyundai opened a plant near Montgomery in 2005. The most recent arrival is a joint Toyota-Mazda assembly plant which opened outside Huntsville in 2021. In addition to these major assembly plants, Alabama has landed numerous suppliers. The state’s steel industry has also been reinvigorated with an influx of investment and renewed national focus on infrastructure improvements.
Aerospace and technology are another key source of growth, with Airbus opening its A320 assembly plant in Mobile back in 2015 and Huntsville leading the nation’s return to the moon project. Huntsville has landed scores of aerospace and technology firms and consistently ranks as one of the fastest growing MSAs.
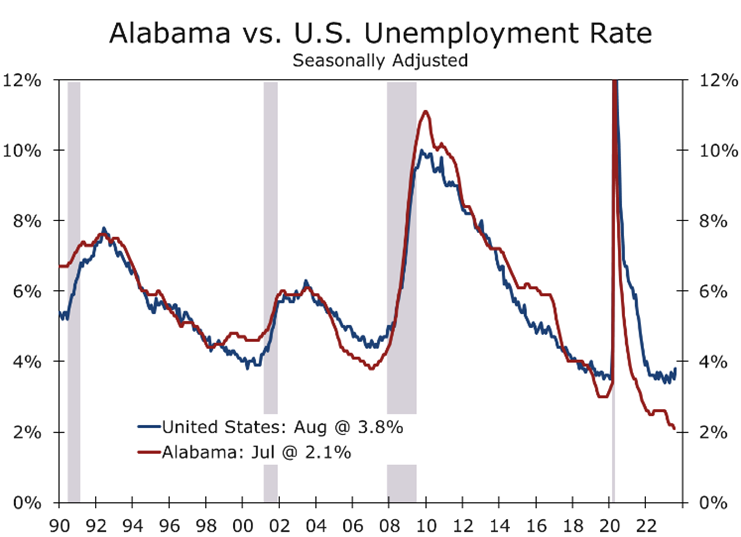
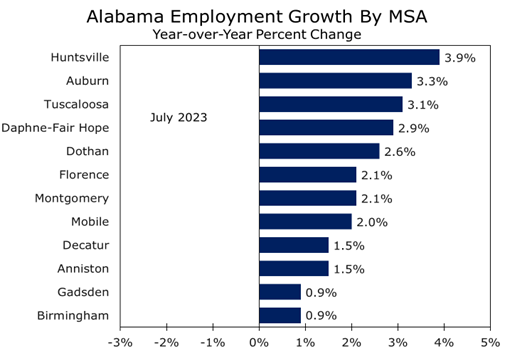
Alabama continues to attract scores of industrial projects. Auto producers are investing millions of dollars to upgrade plants to produce new models. The state is also landing manufacturers looking re-shore production of critical materials and products. Alabama did suffer a blow when the Biden Administration announced they would keep the Space Command in Colorado Springs rather than move it to Huntsville. Still the state’s unemployment rate plummeted to an all-time low 2.1% in July.
Alabama is well positioned to weather any slowdown in the national economy. The Magnolia state is less exposed to overbuilding in commercial real estate and its manufacturing base is weighted toward motor vehicles and aerospace, which should both weather any slowdown fairly well.
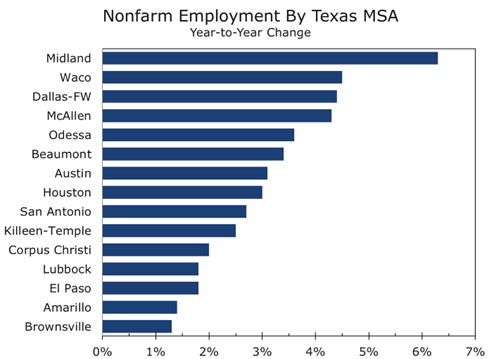
The Texas economy is rolling, with employers adding a nation’s best 448,200 jobs over the past year. Job growth remains broad based, with gains across every key industry and in all of the state’s metro areas. The unemployment rate remains low at just 2.9%.
Texas is also well positioned to weather a slowdown in the national economy. The state’s energy sector has already dealt with difficult times and is leaner and more efficient. The industry can remain profitable at lower price points and also employs a smaller proportion of the state’s workforce. The technology sector is going through a bit of a lull as well, although it is hard to get too concerned about the tech sector given all the investment going into semiconductor plants around the state.
Saturday’s football game will provide the Texas Longhorns a shot at redemption for last year’s loss in Austin. The Horns had Alabama on the ropes and looked like they were going to put the game away when their defense appeared to have pulled a safety. Instead, the referees ruled it was an incomplete pass. Alabama went on to win that game 20-19, but Texas fans felt they had been robbed.
Games like this are the things that rivalries are made off and an Alabama-Texas rivalry is possible with Texas joining the SEC next season. One player to watch is Adonai Mitchell, a transfer wide receiver from Georgia’s back-to-back National Championship teams. Mitchell knows what it takes to beat Alabama and could be a key asset in this game.
There is more than just redemption for last season on the line for Texas. Texas last National Championship was in 2005. The Longhorns played Alabama for the National title in 2010, after going 13-0 in the regular season and winning the Big-12 Championship. The Longhorns lost 37-21, however, and Texas has not really figured into the National Championship picture since.
A win over Alabama in Tuscaloosa Saturday night would go a long way toward re-establishing Texas as an elite program again. Alabama looks to be as good as ever and is riding a 21-game winning streak at home. So, beating Alabama and joining the ranks of elite college football programs is possible but the Longhorns will clearly have to earn it.
Disclaimer: This publication has been prepared for informational purposes only and is not intended as a recommendation offer or solicitation with respect to the purchase or sale of any security or other financial product nor does it constitute investment advice.
College Football Sets Its Sights on the Carolinas
Two Teams to Watch Square Off in Charlotte
- College Football GameDay returns to Charlotte this Saturday for the Duke’s Mayo Classic, which will match the universities of North Carolina and South Carolina.
- This year marks the 60th meeting between the two schools, with UNC leading the series 35-20-4. South Carolina, however, has won 13 of the past 19 matchups.
- Both teams are widely considered to be on the cusp of contending for their respective conference championships.
- The teams feature two of this year’s top QBs: in UNC’s Drake Maye and South Carolina’s Spencer Rattler.
- The match is also likely to draw attention to the ever expanding ACC, which just voted to invite California, Stanford, and SMU into the league.
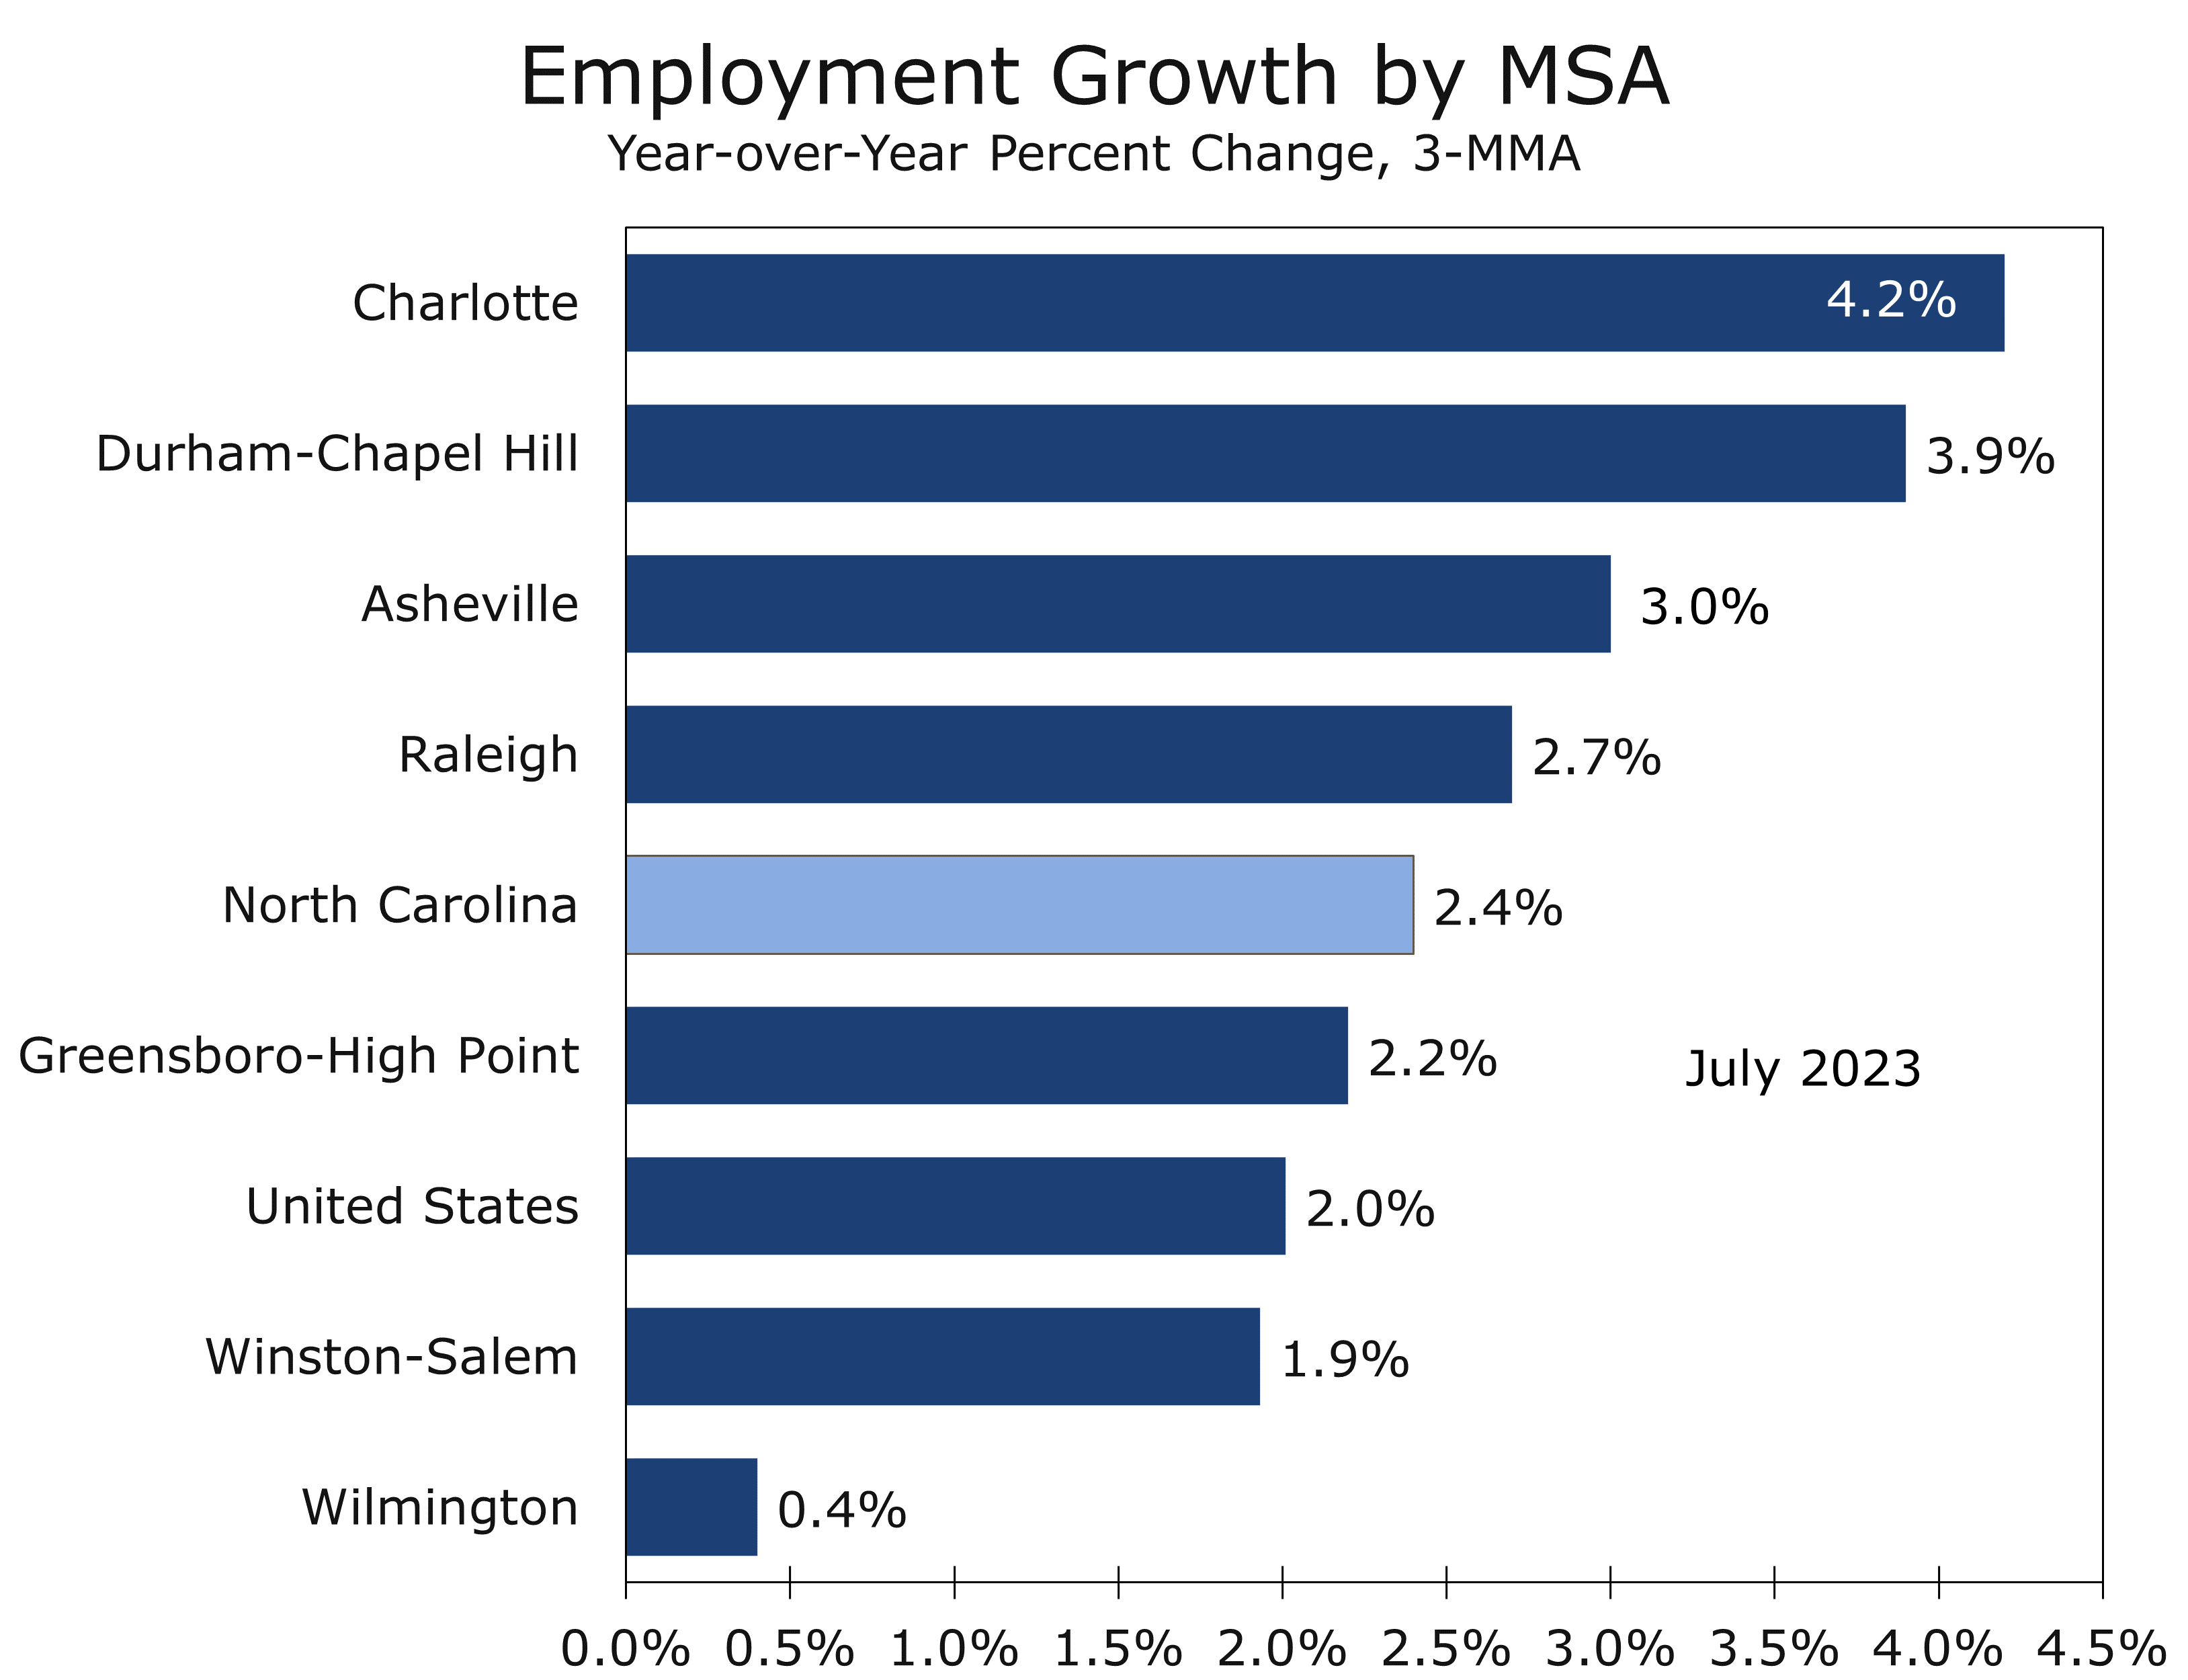
- Charlotte is an ideal backdrop for the game. Its booming skyline, dotted with a half dozen cranes, perfectly captures the Carolina rapid economic growth.
The North Carolina Tar Heels and South Carolina Gamecocks will face off this Saturday evening in the Duke’s Mayo Classic at Charlotte’s Bank of America Stadium. ESPN’s Gameday will be on hand to usher in the college football season, making its third trip to Charlotte’s Romare Bearden Park in the past three years. The park is just a couple of short blocks away from Bank of America Stadium.
Despite their proximity to one another, this year marks only the 60th meeting between the two schools. North Carolina leads the series 30-25-4 and won 29 of the first 40 meetings. South Carolina has dominated the series in recent years, winning 13 of the past 19 games played between the two.
The University of North Carolina began to play football regularly back in 1888 and South Carolina began play four years later in 1890. The two teams played for the first time in 1903, with North Carolina prevailing 17-0.
Both schools joined the Southern Conference in 1924 and were founding members of the Atlantic Coast Conference when it formed in 1953. The decision to form the ACC emanated from the Southern Conference’s decision to ban post-season play. South Carolina subsequently left the ACC in 1971 to become an Independent and later joined the Southeastern Conference in 1992.
Collectively over its previous 120 seasons, North Carolina boasts an overall record of 677-536-48. Over this time period, the Tar Heels have won 9 conference championships (4 Southern and 5 ACC) and competed in 37 bowl games, going 15-22. North Carolina has also won the ACC Coastal division twice since the division format was implemented in 2005, losing to Clemson both times.
North Carolina went 9-5 this past season but was on the cusp of doing much better. The Tar Heels were 10-1 going into their final two games, which they lost in very close and disappointing fashion, blowing a 17-point lead to lose to Georgia Tech 21-17 and losing in overtime to arch-rival NC State 30-27. The Heels then went on to lose to Clemson 39-10 in the ACC Championship and then a squeaker to Oregon 28-27 in the Holiday Bowl.
South Carolina began playing college football back in 1892 and has amassed an all-time record of 630 wins, 605 losses and 44 ties. They competed as a Major Independent, member of the Southern Conference, Atlantic Coast Conference (ACC) and Southeastern Conference (SEC). The Gamecocks have competed in 25 bowl games, going 10-15, and have one conference championship, the ACC Championship in 1969.
South Carolina went 8-5 this past season but finished the season strong with back-to-back victories over then fifth-ranked Tennessee 63-38 and seventh-ranked Clemson 31-30. Those victories earned the Gamecocks a birth in the Gator Bowl, where they narrowly lost to Notre Dame 45-38.
South Carolina’s strong finish has raised hopes for this season. Quarterback Spencer Rattler returns for his final year, but the Gamecocks lost 7 starters on both offense and defense from last year’s squad.
The Gamecocks great success came under Coach Steve Spurrier, who coached the Cocks from 2005 to 2015. Under Spurrier the Gamecocks went a collective 86-49, including three consecutive 11-win seasons, with the team finishing in the top 10 in all three seasons.
North Carolina’s greatest success came under Mack Brown in the mid-1990s, when the Heels had back-to-back 10-win seasons. The success helped bring football out of the shadow of UNC’s basketball program and prompted upgrades to Keenen Stadium. The program hit its pinnacle in a nationally televised showdown with Florida State. Both schools came into that late season game undefeated, with UNC ranked 5th and FSU ranked 3rd. Florida State prevailed that night and Coach Brown was soon lured away to coach the Texas Longhorns.
North Carolina and South Carolina have played just 59 times, which is surprising given the two were founding members of the ACC. The last time the two met was in the 2021 Duke’s Mayo Bowl. South Carolina won 38-21, marking a positive end to coach Shane Beamer’s inaugural season, finishing with a 7-6 record.
As far as rivalries go, this is not a heated one. South Carolina saves its greatest ire for in-state rival Clemson and Georgia. North Carolina’s fiercest rivals are Duke and NC State and Heels fans save their ire for basketball. One point of contention is the use of the Carolina moniker, with both schools laying claim to it.
There was only one Carolina colony from 1629 to 1712, with most of the development along the coast and eastern lowlands. The early history of the Carolinas was one of continual political conflicts and constant clashes with pirates and Native American tribes. In 1712, the colony was split into two, with South Carolina being the more dominant due to extensive development around Charleston, which was one of the largest and wealthiest towns in North America.
The origin of the Tar Heels dates back to colonial times. North Carolina’s economy was built around natural resources, one of which was abundant pine trees in the eastern half of the state. The Pine Trees were a source of turpentine and tar, which was used by the British Navy to coat the bottom of their ships. To produce tar, logs were covered in dirt and burned so the tar would ooze out into a channel. North Carolina was then one of the world’s leading producers of tar and its residents were then derisively referred to as ‘Tar Boilers’.
The impetus for the switch from shameful Tar Boilers to revered Tar Heels is somewhat in dispute. One theory is that when Lord Cornwallis’s troops forded the Tar River in May 1781 on their way to Yorktown, they emerged from the river with Tar on their feet that was dumped in the river to slow their crossing.
The most likely source of the Tar Heels moniker comes from the Civil War, when a regiment North Carolina stood firm in a battle in a fierce battle in Virginia, while a supporting Virginia regiment retreated. After the battle one of the Virginian’s asked derisively if there was any more tar left in the North State. The North Carolinians responded “No, old Jeff has bought it all up.” When the Virginian’s asked what Jeff was going to do with it, the North Carolinians responded that they were going to “put on the heels of Virginians so that they stick around and fight next time.”[1]
North Carolina was the last state in the South to commit to fight for the Confederacy. South Carolina was the first. The Gamecocks moniker, however, is firmly grounded in the Revolutionary War. The State newspaper in Columbia dubbed the team the Gamecocks because the way they played reminded them of the tactics employed by General Thomas Sumter in the Revolutionary War.
Sumter was an early pioneer of guerilla warfare and affectionately referred to as the Carolina Gamecock. His tactics prevented the British from attacking Georgia and pushed them out of the Carolinas entirely and into Virginia where they finally surrendered.
[1] https://alumni.unc.edu/whats-in-a-name-why-were-all-called-tar-heels/
While the Gamecocks name has a long history in South Carolina, what really made the name stick were the events following South Carolina’s 1930 12-6 upset victory over rival Clemson, which was coached by John Heisman. After the game some South Carolina fans paraded around a poster depicting a victorious rooster standing over a defeated Tiger. The sight provoked a fight that turned into a near riot the following day when South Carolina fans again displayed the poster in a parade that included cadets from both schools.
The Carolinas have changed quite a bit in the years since. The widespread adoption of air conditioning helped attract new residents to the region. Development pushed north to the Piedmont, where the fall line provided abundant waterpower and railroads provided connections to the Northeast, Midwest, and other parts of the South. Both states soon became leaders in textile and apparel production, and North Carolina also became the leading producer of furniture and tobacco products.
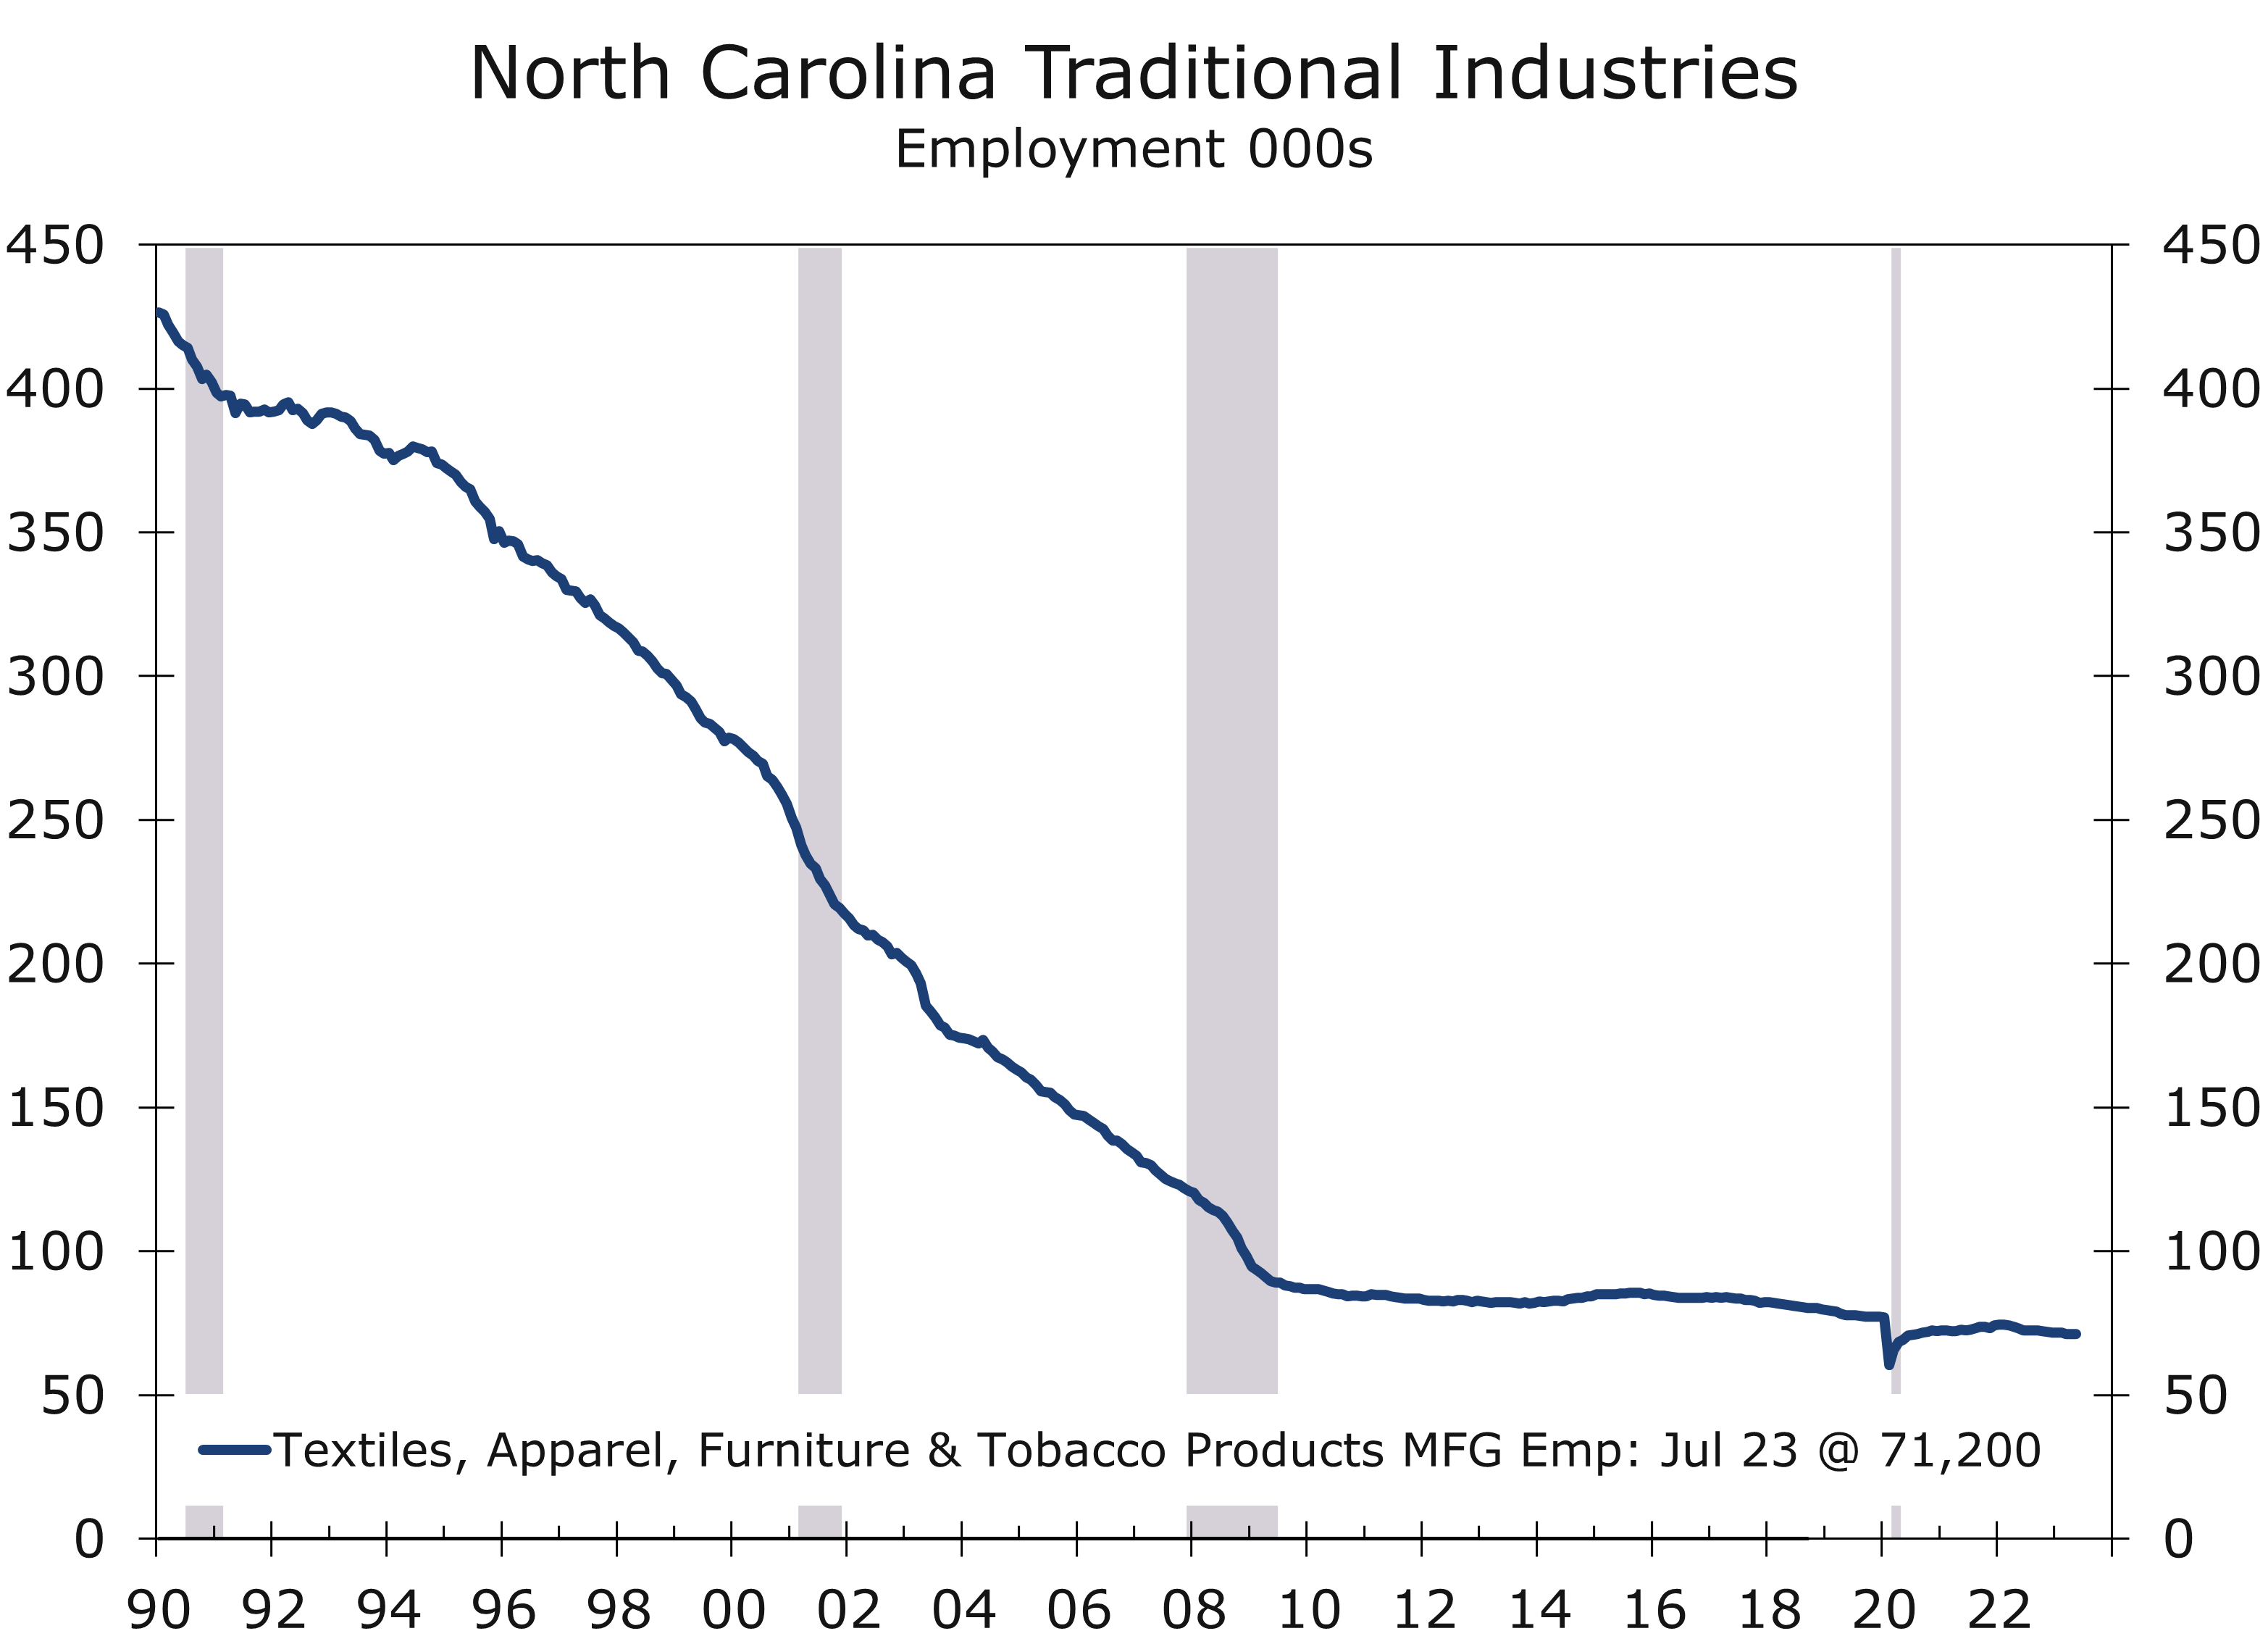
Along with agriculture and forestry, the dependence on these three resource-dependent industries would prove perilous, as attitudes toward smoking shifted and competition from emerging economies and China would dramatically shrink the footprint of the textiles, apparel, and furniture industries. The big three went from accounting for a third of North Carolina’s economy in the mid-1970s to less than 3% today.
Fortunately, leaders from business, government and academia had the foresight to plan for the evolution of the Carolinas economy. One of the key building blocks was the formation of Research Triangle Park, located between Raleigh, Durham, and Chapel Hill, which came together under Governor Luther Hodges. The park, which is one of the largest research parks in the nation, got a major boost in the mid-1960s, when IBM located a major research hub in the Research Triangle Park.
Today RTP is home to one of IBM’s largest employment bases and hosts more than 300 other enterprises, including Cisco, Fidelity, GlaxoSmithKline, Grifols and Biogen. And RTP is still growing rapidly, adding several major investments by leading life sciences companies as well as major campuses from Google, which added an engineering hub in Durham, and Apple, which is building its East Coast headquarters in the Wake County portion of Research Triangle Park.
North Carolina’s transformation was not limited to the Triangle region. As recently as the early 1990s, four of Charlotte’s ten largest employers were textile firms. Today the city is a major hub for financial services and is home to the headquarters of Bank of America, Truist Financial, and the largest employment center for Wells Fargo. Virtually every financial services firm has a presence in Charlotte, which boast a large base of skilled financial services workers and is seeing rapid growth in FinTech. The Charlotte area is also home to numerous corporate headquarters, including Fortune 500 firms such as Lowes, Nucor, and Honeywell, as well as rapidly growing firms such as LendingTree and Brightspeed.
One of the features that makes Charlotte such a good place for corporate headquarters is the proximity of the Charlotte-Douglas International Airport, which is located just 7 miles from Uptown Charlotte. Charlotte Douglas is the second largest hub for American Airlines and is the 10th busiest airport in the nation based on passenger traffic. CLT boast nonstop flights to 181 destinations throughout the U.S. and 26 countries. The airport is one of the fastest growing in the nation and is in the midst of a multi-billion dollar expansion that will upgrade the terminal, add more gates, and build a fourth parallel runway.
The Charlotte-Douglas International Airport is not only a powerful economic driver for Charlotte and the State of North Carolina but also provides a key competitive edge for South Carolina. The Charlotte and the South Carolina’s Upstate are home to the largest concentration of German-owned firms in the country. The ties to Germany data back to the textile industry but are now mostly due to the emergence of the automotive industry, as well as industrial machinery, robotics, and chemicals. The availability of nonstop flights to Frankfurt and Munich is essential to sustain this key source of growth.
The transformation of South Carolina’s economy is best exemplified by the growth of BMW located between the Greenville-Spartanburg International Airport and I-85. Since announcing its first North American assembly plant nearly thirty years, the BMW plant in Greer has been constantly expanding since it opened in 1994 and is BMW’s largest assembly plant in the world.
BMW exports the majority of its output via the Port of Charleston. The assembly plant employs more than 11,000 workers. BMW has also attracted scores of suppliers to the Upstate and other parts of South Carolina. BMW’s presence has also encouraged the state to pursue opportunities further up the value chain by establishing research centers at Clemson and UofSC focusing on advanced manufacturing, automotive safety, and material science.
The UofSC is a new moniker for the University of South Carolina. Most people still refer to South Carolina as USC, but a long running feud and trademark lawsuit with the University of Southern California (a private institution) resulted in a settlement where South Carolina would officially use the abbreviation UofSC instead of USC.
BMW’s role in South Carolina’s evolution to higher value added manufacturing cannot be overstated. The textile industry peaked in South Carolina during the early to mid-1970s, with textiles and apparel accounting for close to one-third of the Upstate’s 1973 private sector employment base. BMW was not the first step taken to dramatically diversify the state’s economic base. Michelin was recruited to the state nearly two decades earlier. The French-owned firm has its North American headquarters, research facilities and proving grounds in Greenville. The firm operates more than a dozen facilities across the state and employs over 9,000 workers.
The success of Michelin and BMW paved the way for other manufacturers to expand into the Palmetto State. These firms proved that you could build a world class product in South Carolina and also highlighted the state’s worker training initiative and its excellent community colleges and technical schools.
Volvo opened an assembly plant outside of Charleston in 2018 and Mercedes assembles Sprinter vans there as well. South Carolina has also attracted scores of other tire manufacturers in recent years, including large facilities for Bridgestone/Firestone, Continental, Trelleborg and Giti. More tires are produced in South Carolina than any other state, and South Carolina is also the nation’s leading tire exporter.
South Carolina’s manufacturing base took another huge step forward when Boeing announced it would acquire a key supplier and set up a major assembly operation to build its 787 Dreamliners in Charleston. Boeing employs around 7,000 workers in Charleston, where it operates several facilities in addition to its massive Dreamliner plant. The firm is currently adding a second production line.
Boeing is not the only firm producing airplanes in South Carolina. Lockheed began building F-16s in Greenville back in 2021 and has a large backlog of orders.
Just as with the automotive sector earlier, the growth of the aerospace industry is attracting numerous suppliers to South Carolina. The state is also investing in job training programs that will help ensure there is a steady stream of skilled workers.
More recently, South Carolina’s economy has gotten a huge boost from a flood of EV-related investments, including plants for AESC, which is investing $810 million to build a plant near Florence, which will produce batteries and components for a new line of BMW produced in Spartanburg. Redwood Materials is investing $3.5 billion in a massive EV battery plant outside Charleston and Scout Motors announced plans to build a $2 billion assembly plant just north of Columbia.
Charlotte is a fitting location for this weekend’s Battle of the Carolinas. The Queen City is located between the two schools, 92 miles north of the University of South Carolina and about 140 miles southwest of Chapel Hill. Charlotte also epitomizes the Carolina’s economic vibrancy. Bank America Stadium, surrounded by dozens of tower cranes building office buildings, apartments, and the new Atrium/Wake Forest School of Medicine, is the perfect venue to see evidence of the region’s growth.
The game itself should be a good one. North Carolina comes in as a two and half-point favorite. South Carolina has won 4 of the past 5 contests, however, and has high hopes going into the season following last year’s back-to-back wins over top 10 teams (Tennessee and Clemson). South Carolina lost 14 starters off last year’s squad, however, and North Carolina’s experience should give them a slight edge.
Disclaimer: This publication has been prepared for informational purposes only and is not intended as a recommendation offer or solicitation with respect to the purchase or sale of any security or other financial product nor does it constitute investment advice.
Employment Rises Solidly in August
Hiring Hit Some Speed Bumps
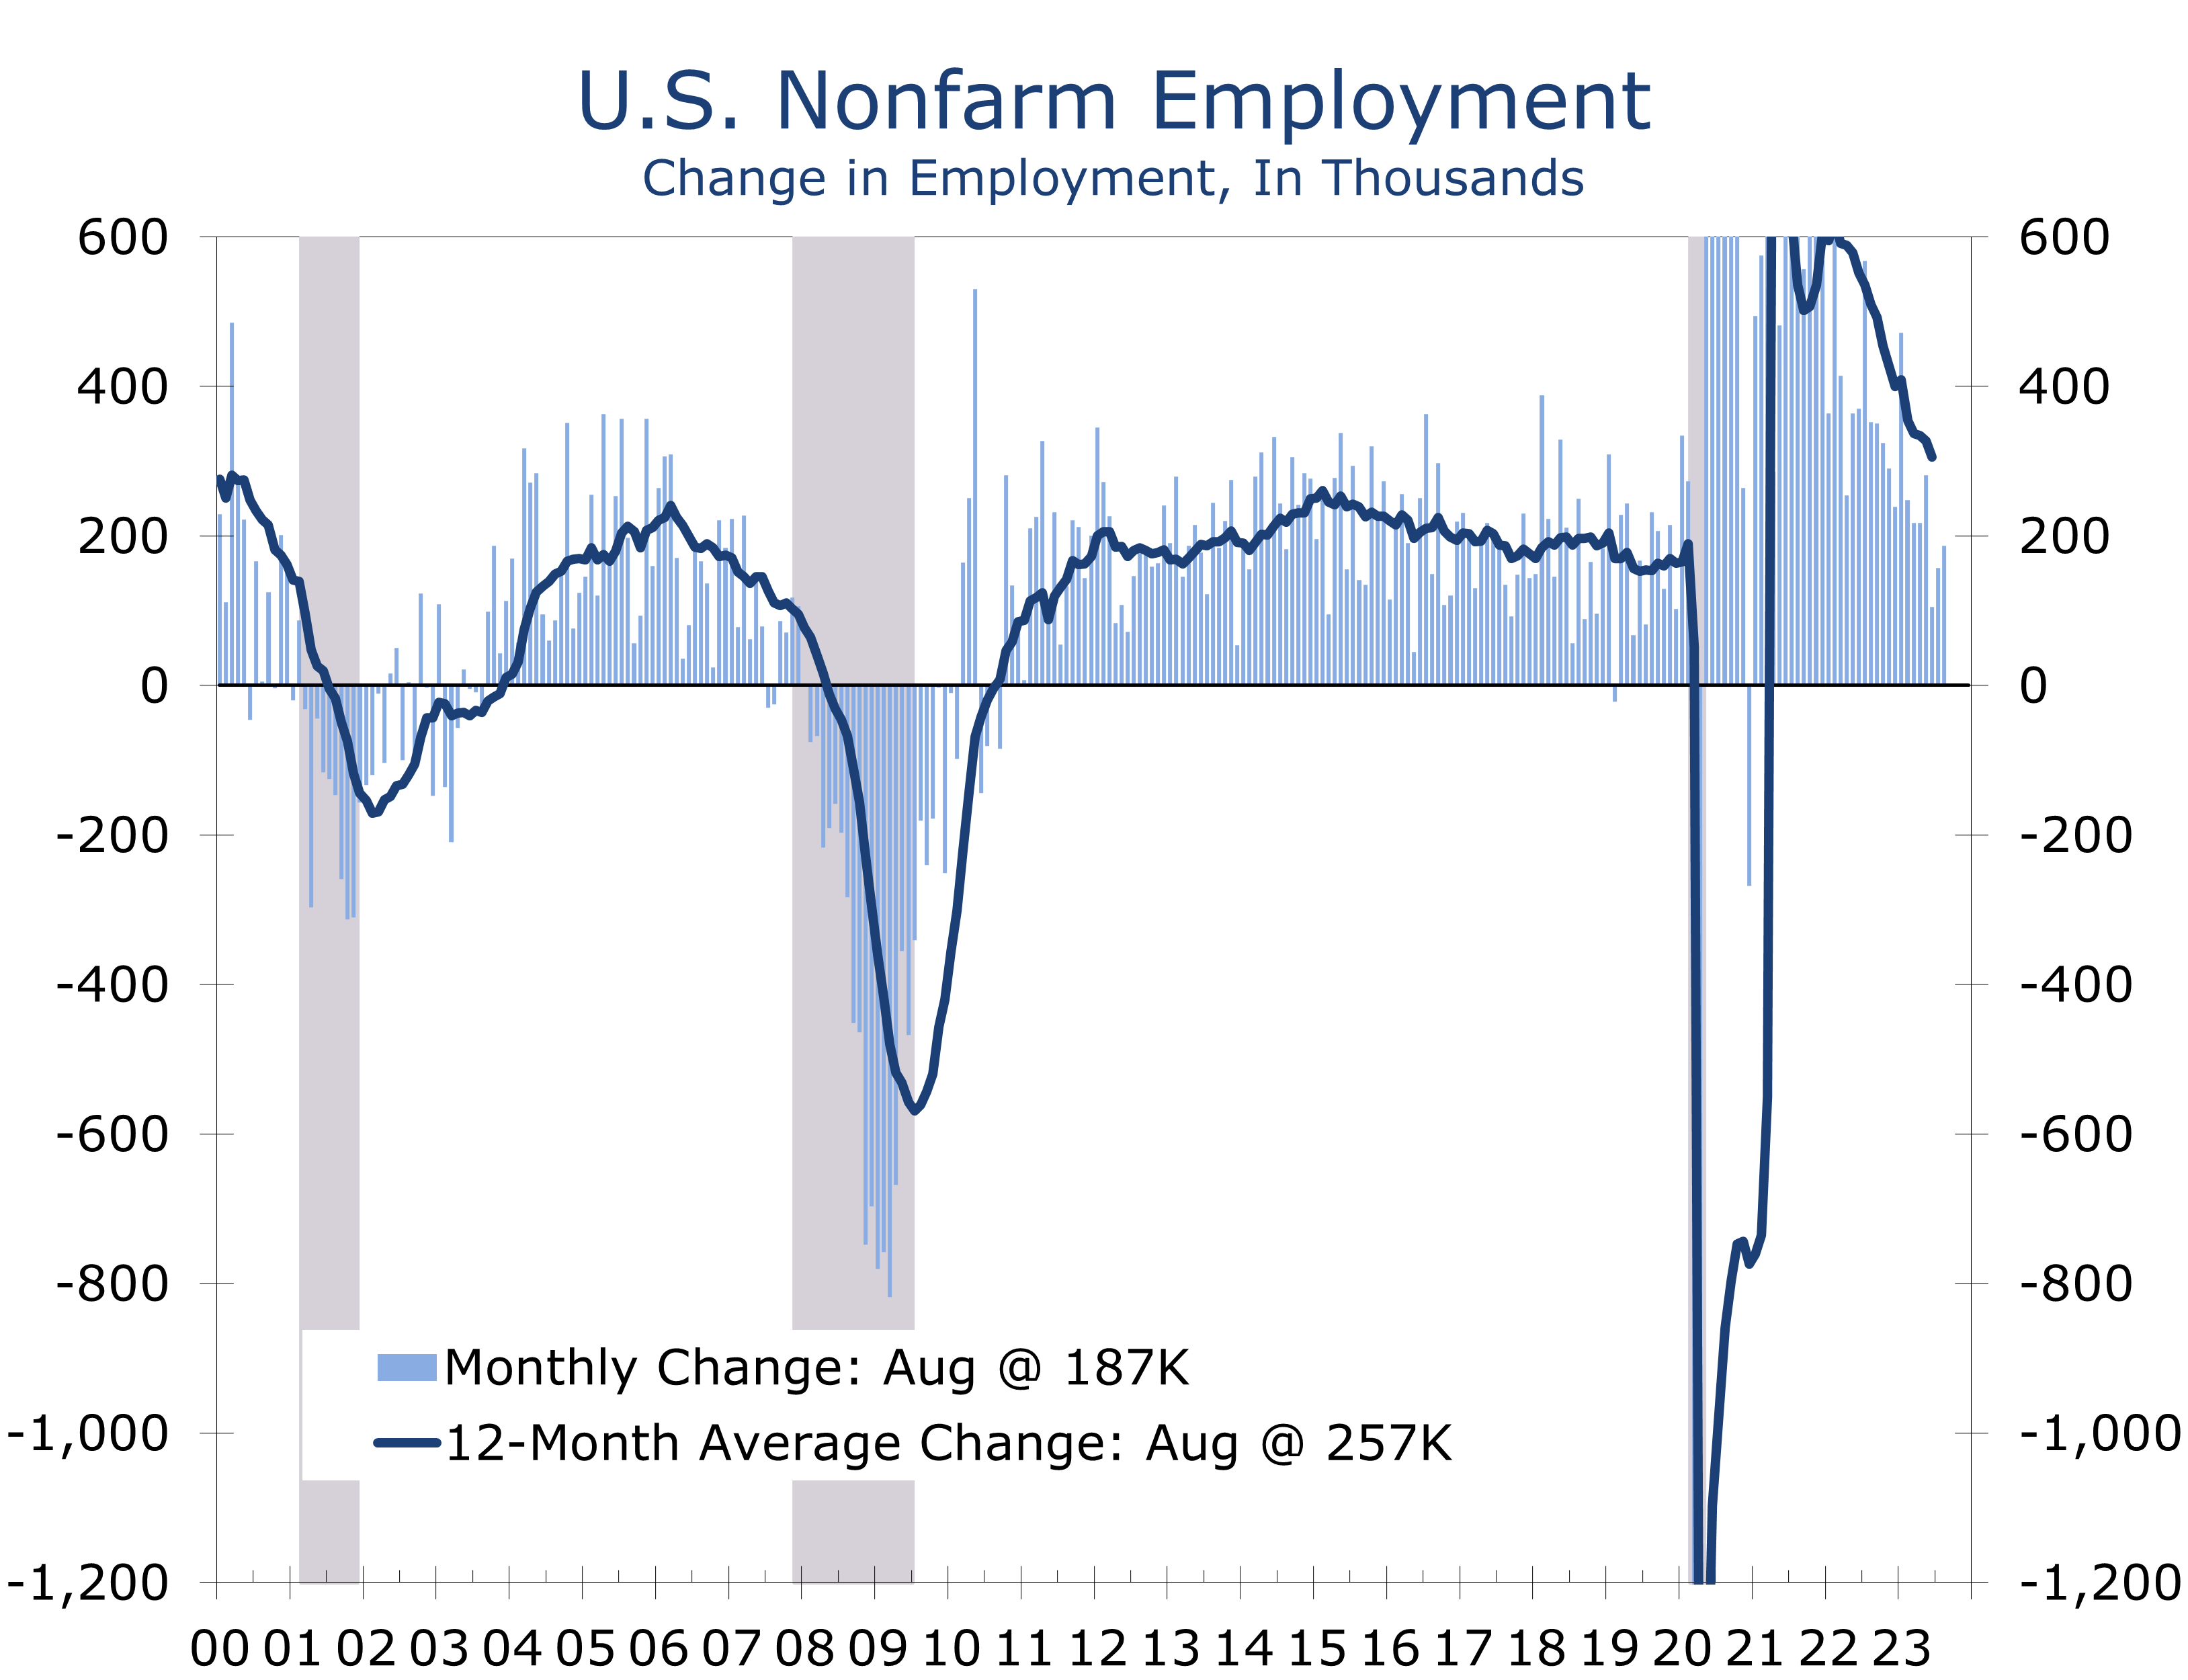
- Employers added 187,000 jobs in August, while the unemployment rate rose to 3.8%.
- Hiring was held back by the closure of Yellow Freight Lines, which pulled down employment in the trucking and warehousing by 36.7K.
- The Hollywood Strike also cut employment in the motion picture industry by 16.8K.
- Hiring remains strong in areas still striving to bring payrolls back to their pre-pandemic trend, including health care, leisure and hospitality and other services.
- Construction (+22K) and manufacturing (+16K) also posted solid gains.
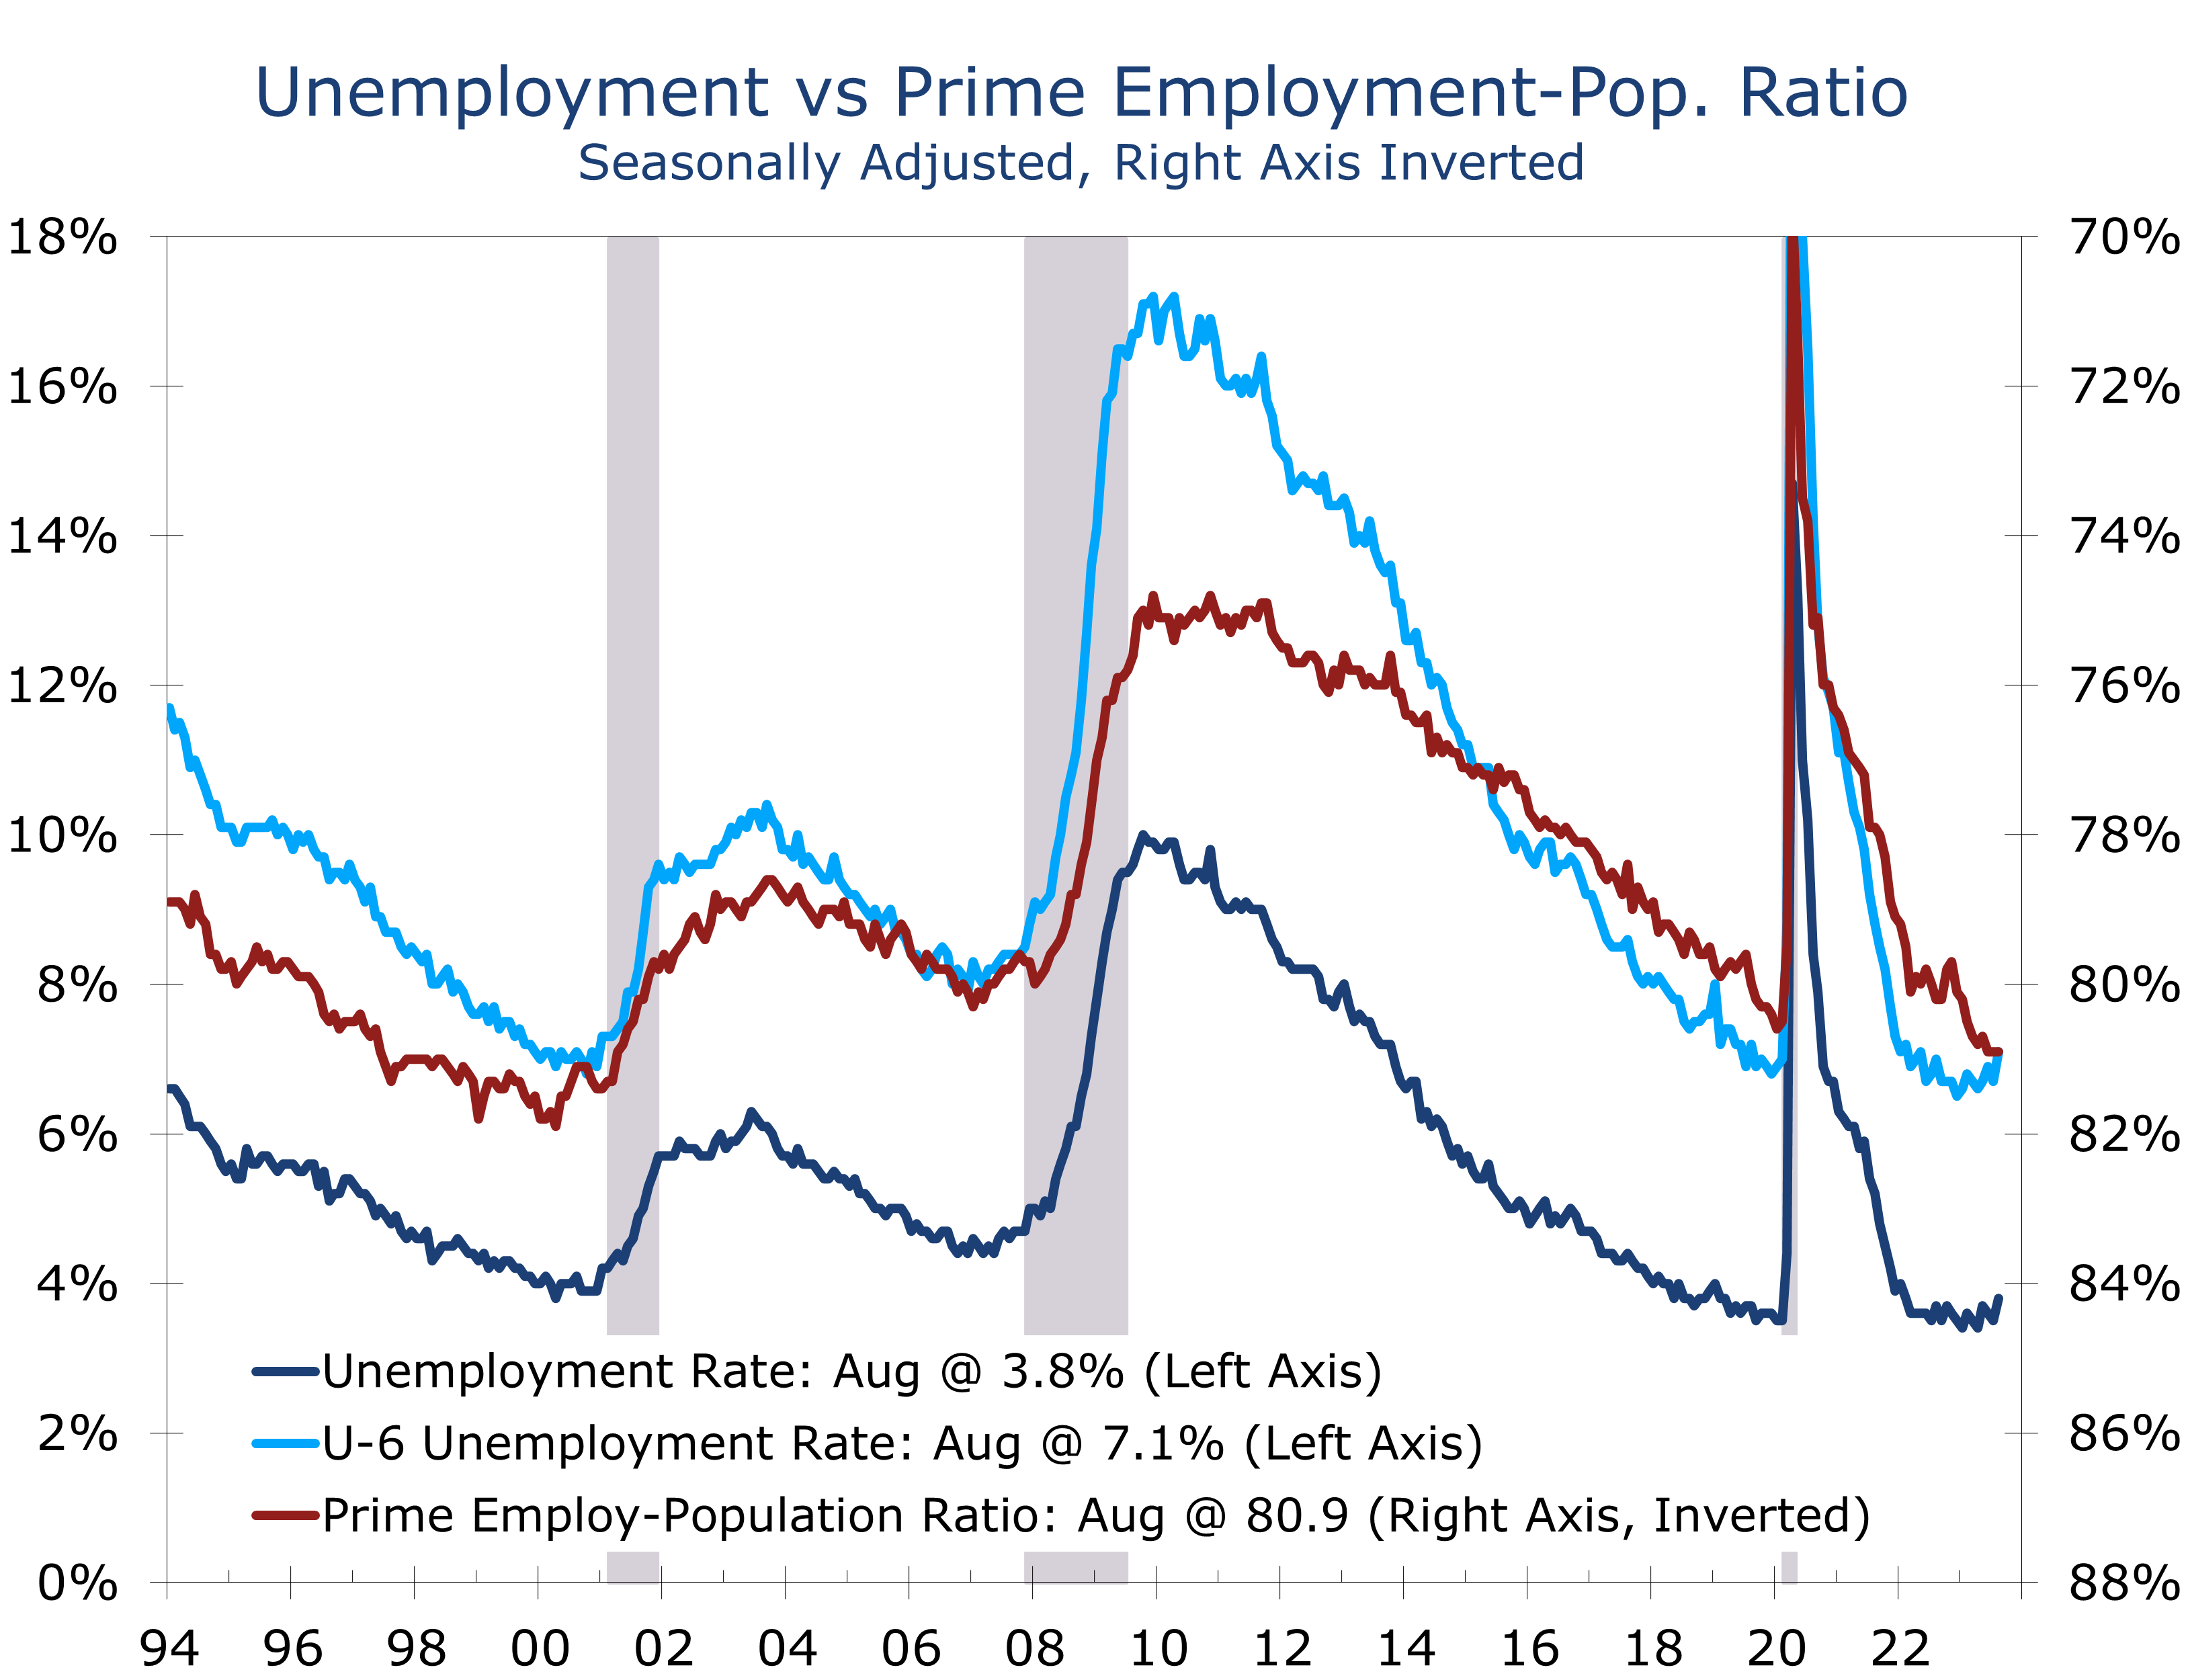
- The unemployment rate rose 0.3 percentage points to 3.8%, as a 736,000-person surge in labor force growth outpaced a 222,000 rise in household employment.
- Average hourly earnings rose just 0.2% in August and are now up 4.3% year-to-year.
- Nonfarm employment rose solidly in August, despite large losses due to the Yellow Freight Lines shutdown and Hollywood actors strike, which combined to eliminate 53,500 jobs.
Nonfarm payrolls rose a more modest 187,000 in August, as the shutdown of Yellow Freight Lines helped cut employment in trucking and warehousing by 36,700 jobs. In addition, the ongoing actors and writers strike cut 16,800 jobs from payrolls in the motion picture business, which is included in information services. The unemployment rate rose to 3.8%.
The initial read on August employment is this is a Goldilocks-type of report. Hiring is cooling off, the unemployment rate is inching higher and wage increases are slowing. The eye-popping 0.3-percentage-point rise in the unemployment rate to 3.8% reflects an outsized gain in the labor force, which is a positive. Household employment rose a solid 222,000 in August.
Wages and salaries rose just 0.2% in August, which marks the smallest increase since February 2022. Wages and salaries posted uncharacteristically small gains in the goods sector this past month, with the weakness most notable in staff and administrative positions. Wages for production workers rose solidly.
The key takeaway from August payrolls is hiring continues to decelerate. Employers added a net 187,000 jobs, compared to an average monthly gain of 271,000 jobs during the prior 12 months. While last month’s gain slightly topped expectations, revisions to the June (-80K) and the July (-30K) data reinforce the pre-existing downward trend. Moreover, job gains remain heavily concentrated in health care and leisure and hospitality, both of which are striving to bring payrolls back to their pre-pandemic trend.
Service providers accounted for the bulk of job growth in August, adding a net 143,000 jobs. The bulk of that increase was in health care and social services, which added 97,000 jobs. Demand for health care has surged in recent months, as people are going back to the doctor and dentist office and moving forward with treatments and procedures put off during the pandemic. Ambulatory health care added 40,000 jobs in August, and hospitals added 15,000 jobs. Another 17,000 jobs were added at nursing homes and residential care facilities.
Construction continues to benefit from fiscal stimulus, which is also lifting manufacturing.
Construction is another notable bright spot. Much of this past month’s gains were in nonresidential specialty contractors (+12.1K) and heavy and civil engineering (+7.1K). The gains reflects ongoing commercial projects, as well as a bevy of industrial projects driven in part by the Inflation Reduction Act and CHIPs Act. Residential construction also remains solid, as builders still have a massive backlog of homes under construction.
Manufacturers added 16,000 jobs in August, with much of that growth occurring in wood products (3.1K) and fabricated metals (+4.6K), two industries that directly benefit from the ongoing construction boom.
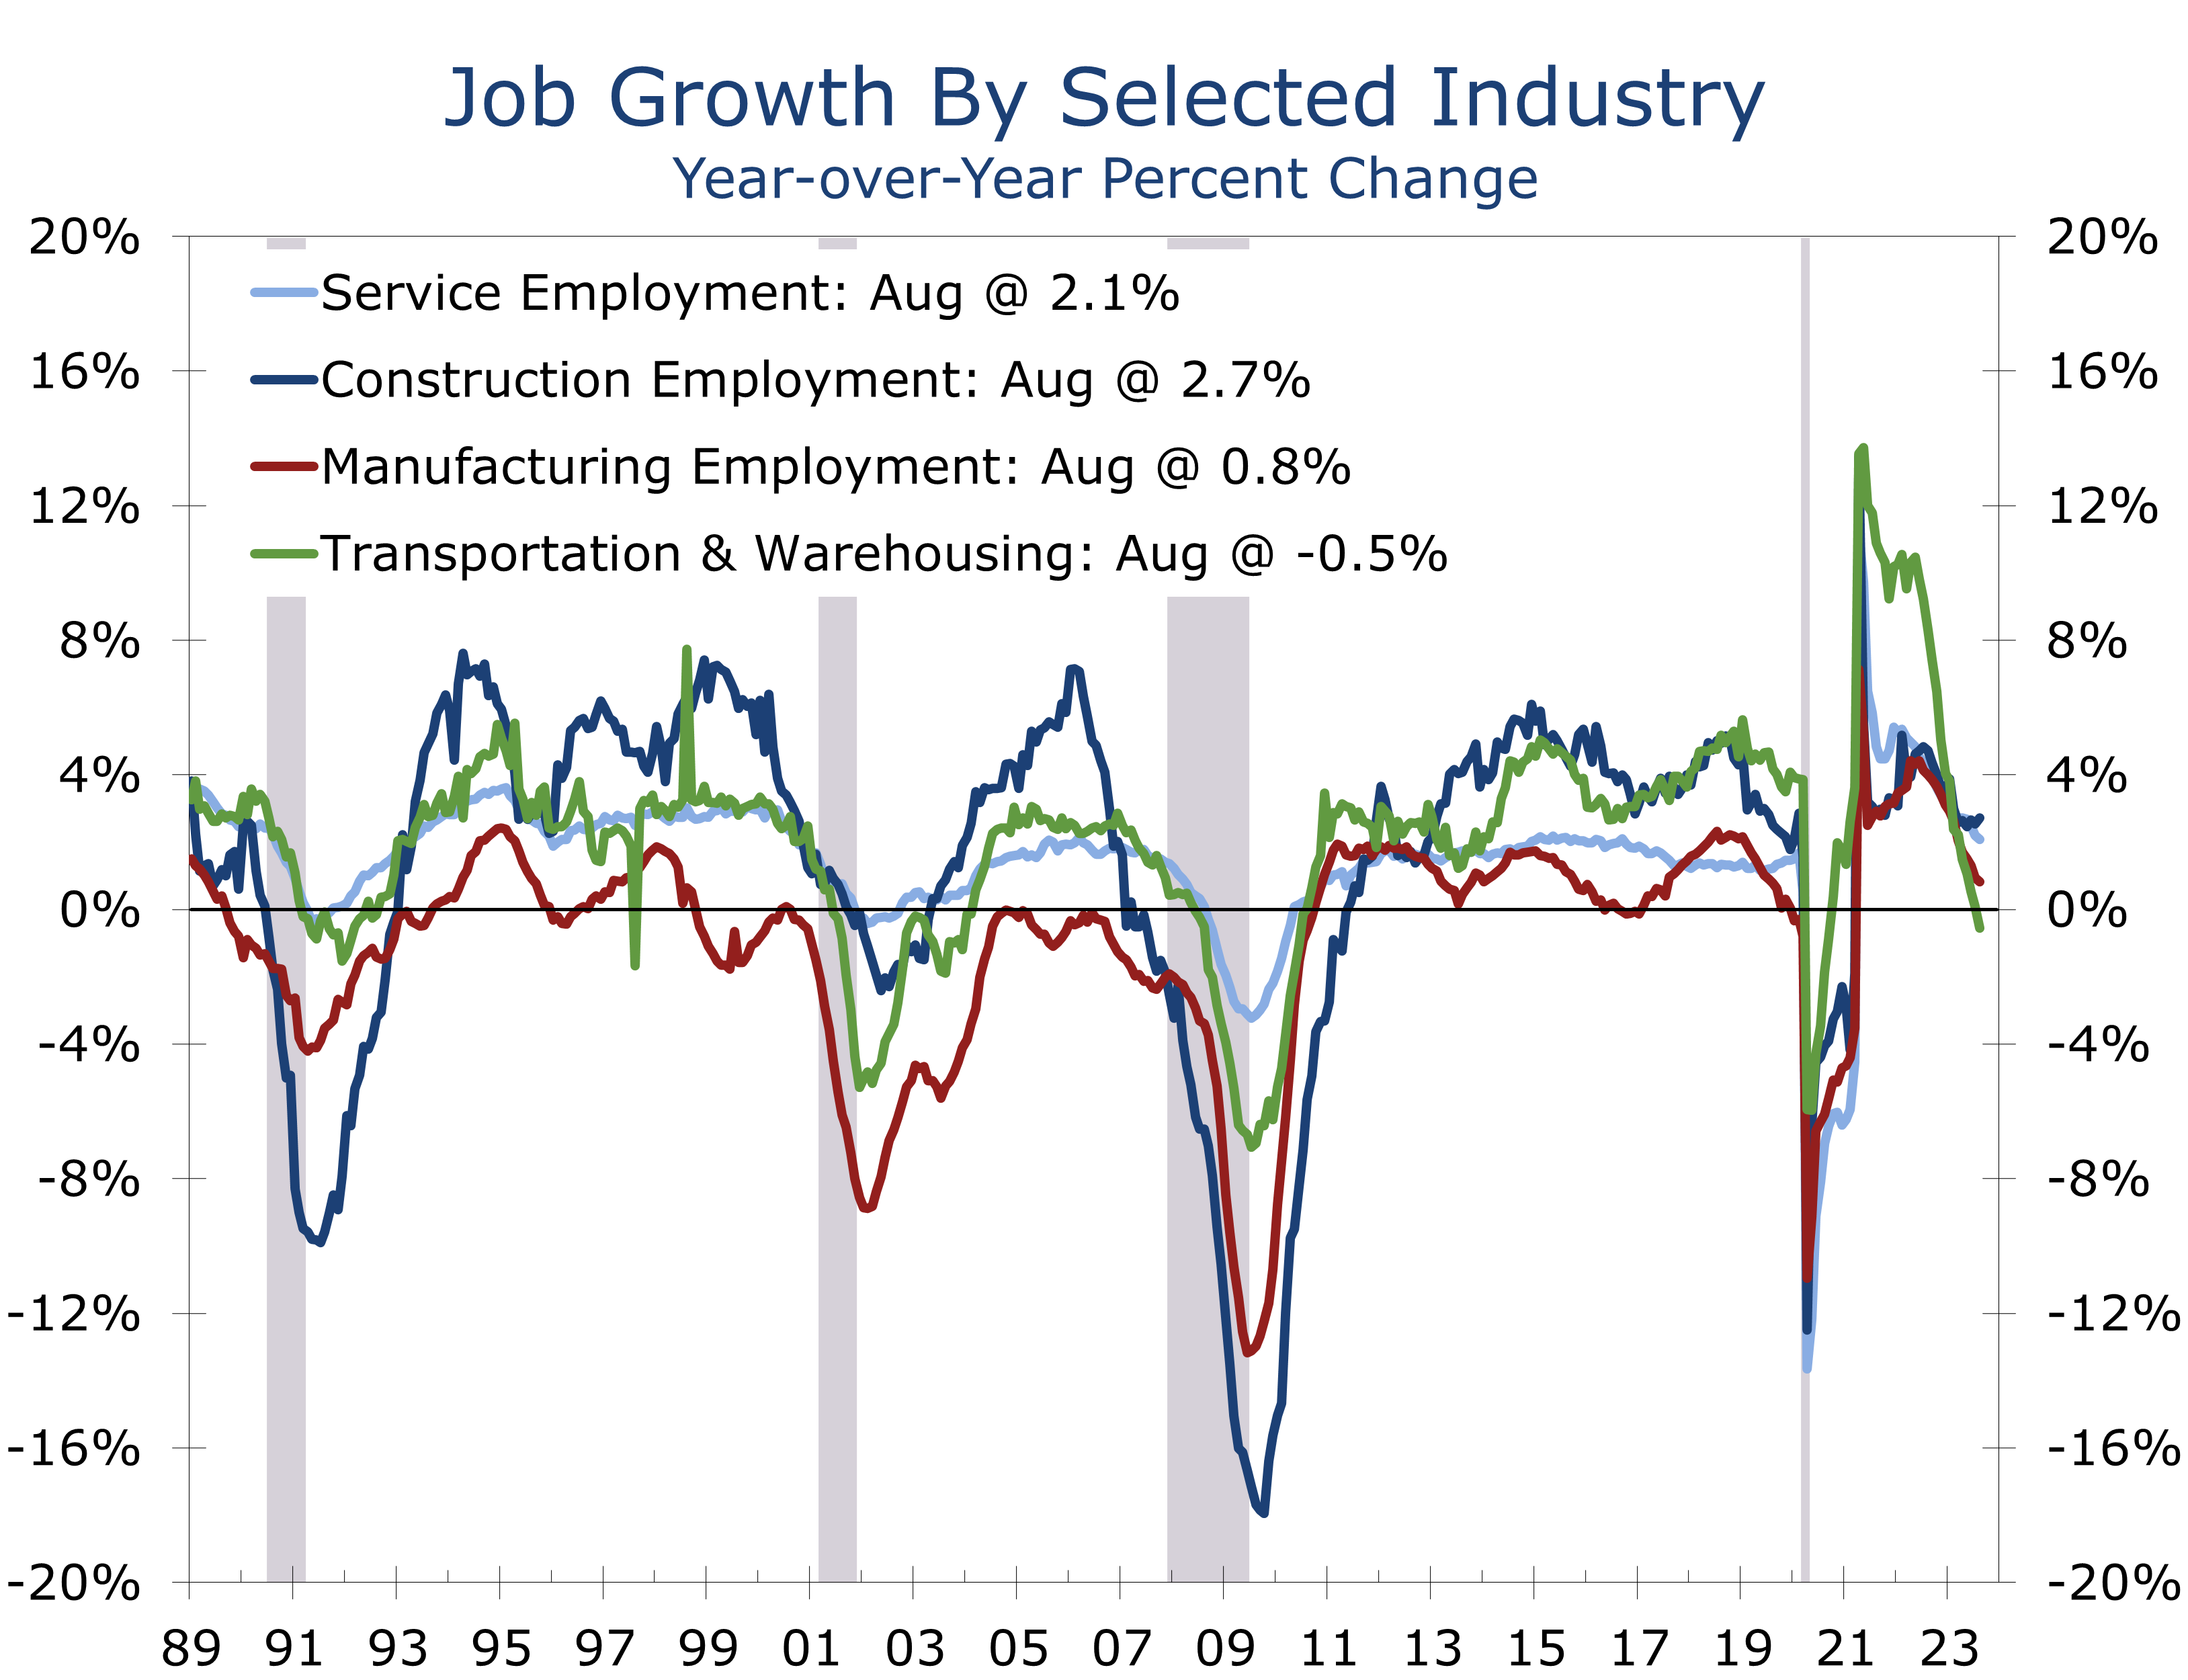
Trucking and warehousing posted an outsized 36,700 job loss in August, driven largely by the shutdown of Yellow Freight Lines. The economy is going through a broader inventory cycle, however, that is resulting in lower freight volumes for truckers in general. Demand for consumer discretionary goods also remains soft, resulting in some shutdowns and job losses in the furniture industry and other areas.
The freight recession took a toll on trucking and warehousing jobs in August.
Inventory building in the motor vehicle sector, ahead of a possible strike this fall, is helping offset some of the weakness at consumer products manufacturers.
The bottom line for the August employment report is hiring has likely slowed enough to take a September rate hike off the table. The CME notes the odds of a November hike also fell sharply following the report. We feel this reaction is overdone and premature. The August payrolls have tended to underestimate job growth, resulting in subsequent upward revisions. Aggregate hours worked bounced back a solid 0.4% in August, which is consistent with the third quarter real GDP growth in the 3% to 3.5% range.
Disclaimer: This publication has been prepared for informational purposes only and is not intended as a recommendation offer or solicitation with respect to the purchase or sale of any security or other financial product nor does it constitute investment advice.
Consumers Appear Set to Keep Dancing Until the Music Stops
Consumer Spending Outpaces Income in August
- Personal income rose 0.2% in July. Wages and salaries rose a more solid 0.4%. Proprietors’ income and rental income both rose solidly as well. Transfer receipts fell 0.6%.
- Consumer spending remained strong, however, climbing 0.8%, with solid broad-based gains.
- With spending outpacing income, the saving rate fell an eye-popping 0.8 percentage points to 3.5%.
- Both the PCE price index and core PCE deflator rose 0.2% in July.
- The overall PCE deflator is now up 3.3% over the past year, while the core is up 4.2%.
- Core services prices excluding housing rose 0.5% in July and remain up 4.7% over the past year, which is down only marginally from its peak of 7.9% hit in November 2021.
- After adjusting for inflation, consumer spending grew 0.6% in July, which gets the third quarter off to a strong start. Slower income growth, diminishing savings and sticky inflation point to a correction later this year.
July’s personal income and spending report ties together a number of loose ends from other economic indicators released earlier this month. The report is consistent with the soft landing narrative, as income growth continues to moderate. Headline inflation is also improving, but there are also signs that inflation remains sticky in many core categories.
Personal income rose just 0.2% in July, which was below expectations. The miss was largely due to a continuing slowdown in government transfer payments, which fell 0.6%. Most of that drop was in receipts of Medicaid benefits and ‘other’ benefits. Unemployment benefits also declined slightly, falling for the third consecutive month, while most other benefits categories, including Social Security and Veterans’ benefits posted modest gains.
Wages and salaries rose 0.4%, which is in line with more modest job gains in recent months. Wages and salaries are growing fastest in the services sector and government. Manufacturing and transportation are seeing more modest gains, reflecting slower growth in the goods sector.
Over the long run, wages and salaries set the trend for consumer spending. Consumers have been making up for lost time in recent months, spending freely for travel and entertainment. That spending spree has helped drive the saving rate back down to 3.5%.
With much of consumers’ pandemic-era savings drawn down, spending will now more closely track wages and salaries, which remain up a respectable 6.2% over the past year. Even factoring in 4% inflation, real consumption should remain solidly positive, providing some cushion against a likely slowdown in job growth.
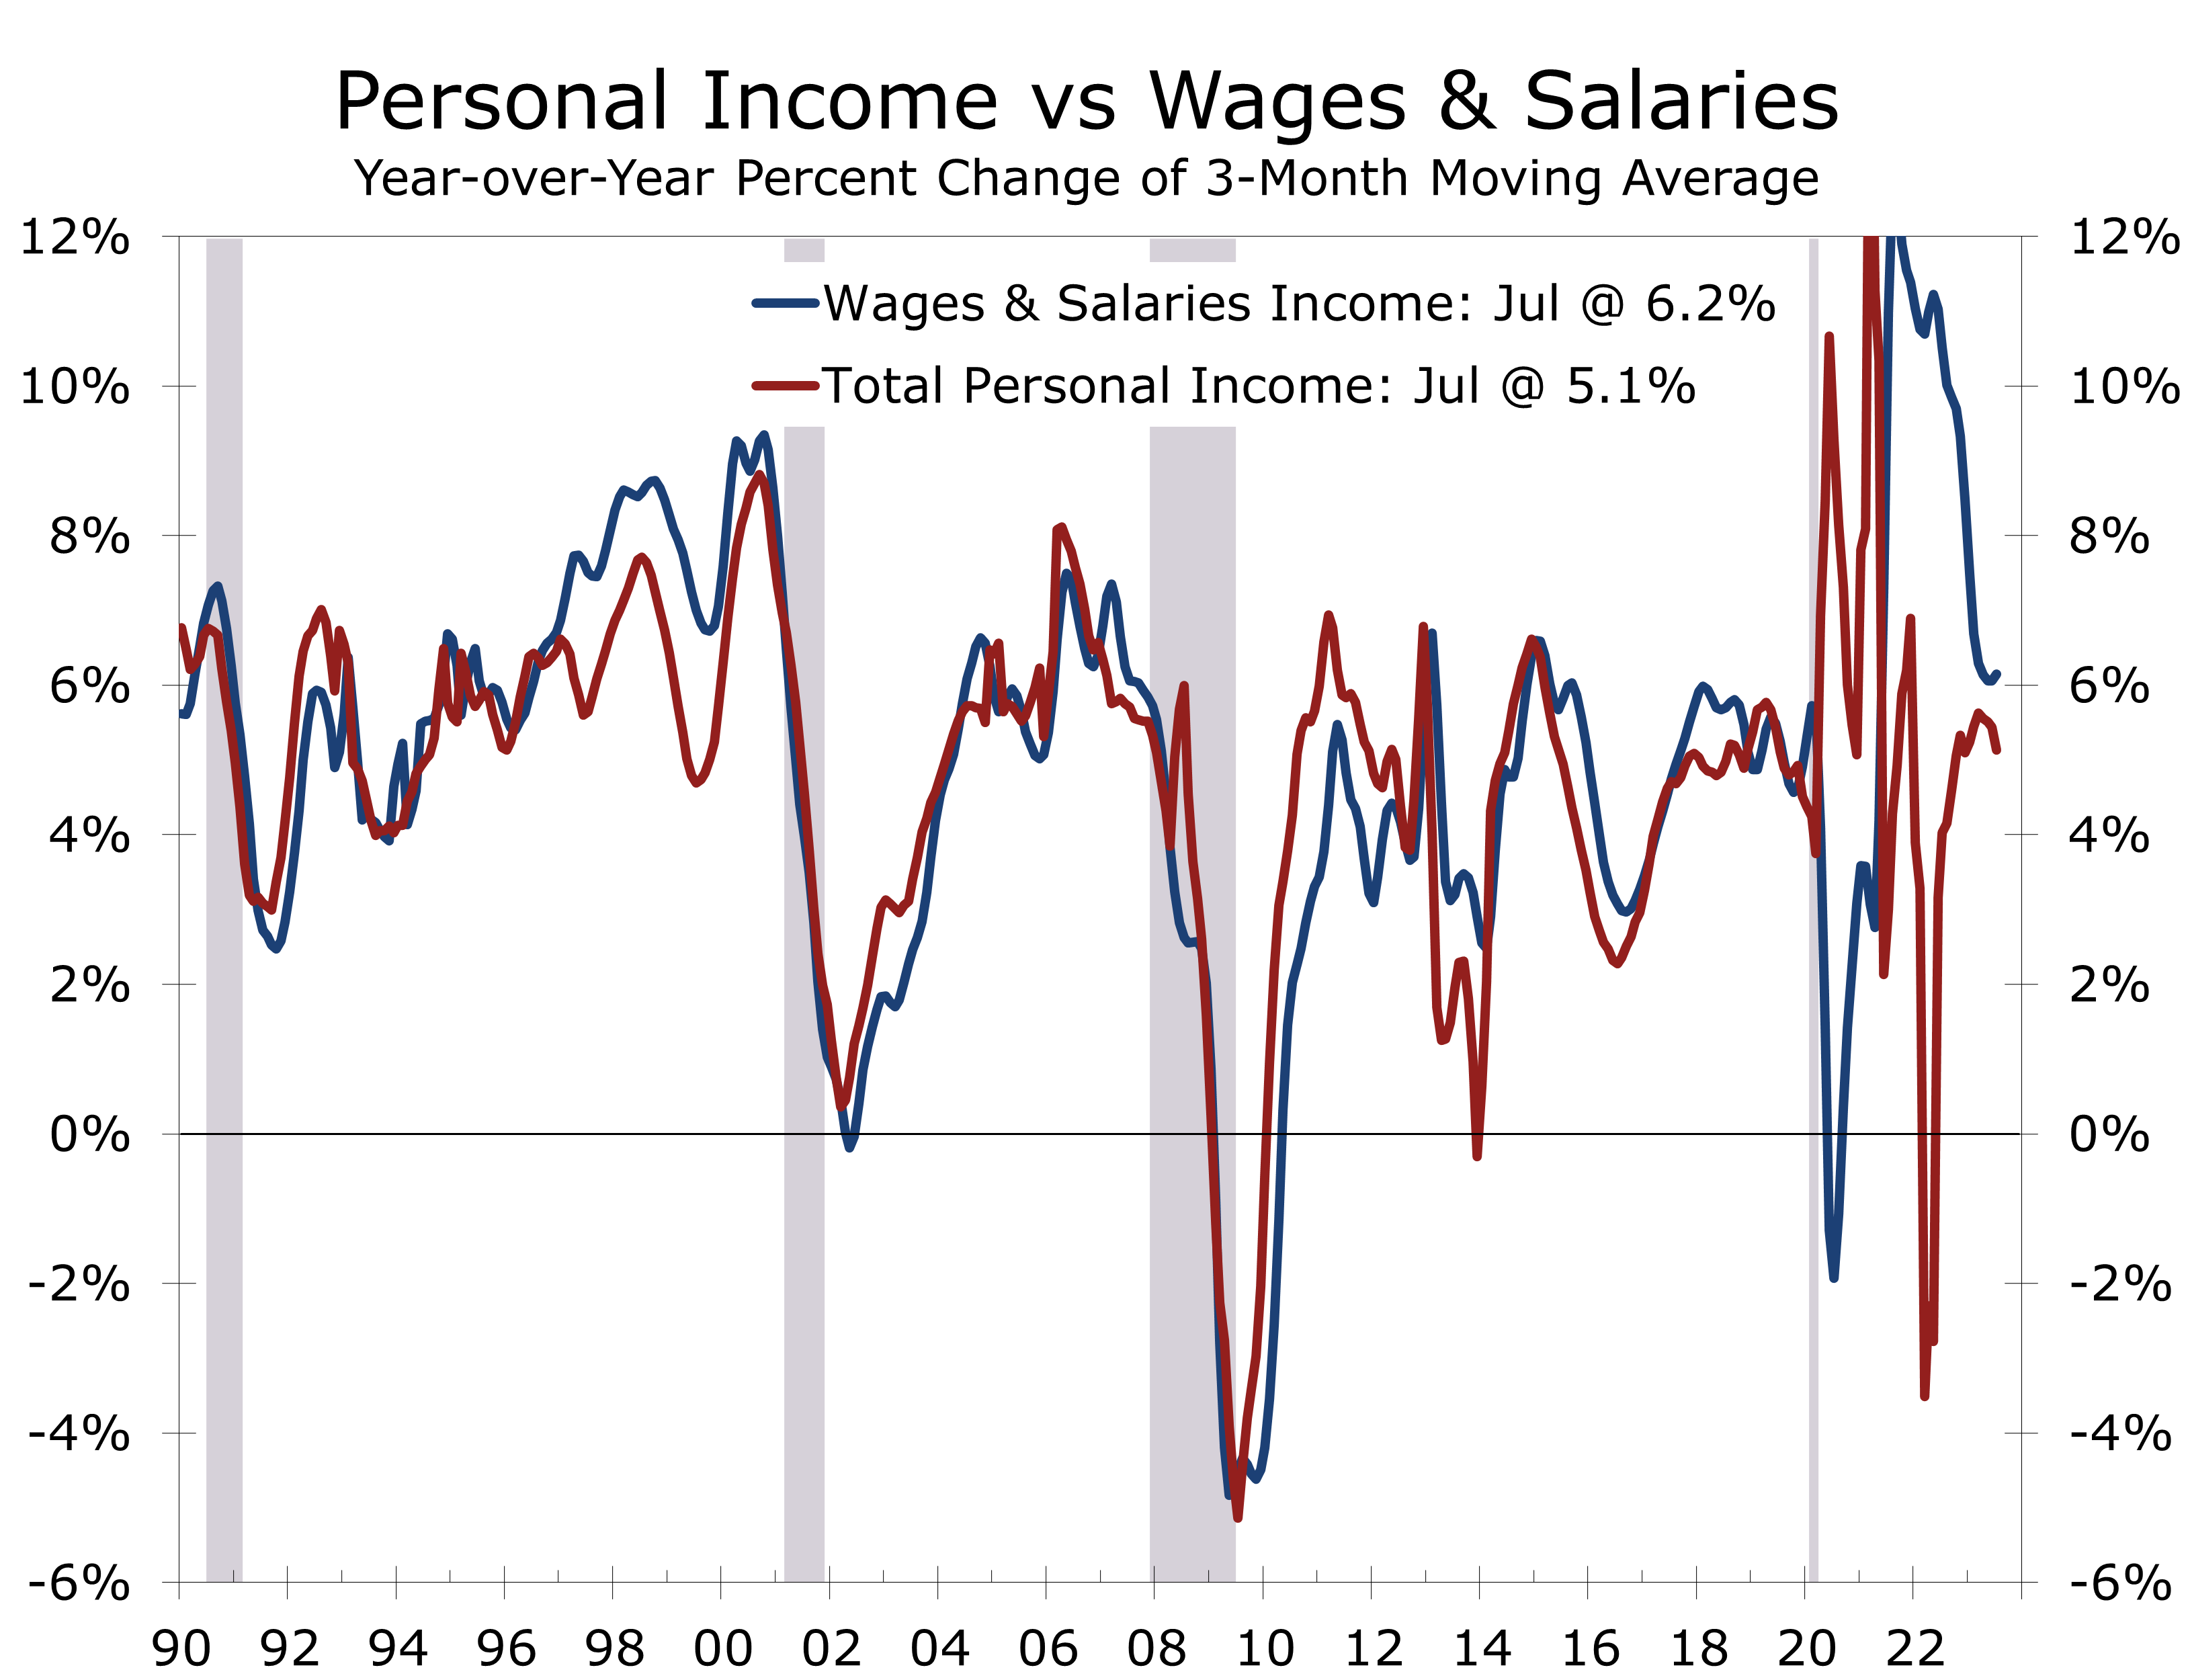
Nominal consumer spending rose 0.8% in July and growth for the prior month was revised 0.1 pp higher to 0.6%. After adjusting for inflation, real consumer spending rose 0.6% and has risen at a 2.8% annual rate over the past three months. Spending rose broadly, with outlays on durable goods rising 1.4% and outlays on nondurables climbing 0.7%. Services outlays rose 0.4%, the largest gain since March.
The strength in spending and the upward revision to the June data get the third quarter off to a strong start. With the increase, consumer spending is 0.9% above its second quarter average, which means real personal consumption, which accounts for more than two-thirds of GDP, would rise at a 3.6% pace if spending was unchanged through the rest of the quarter.
With July’s strong growth in consumer spending, the third quarter is off to a strong start.
We might see some payback in August. Spending in July was bolstered by record Amazon Prime Day sales and efforts by brick and mortar retailers to compete with them. Spending on travel and entertainment also saw exceptionally strong growth, with concerts and blockbuster movie weekends bolstering services outlays. Several retailers have noted softer back-to-school sales in August, which might produce an outsized impact after seasonal adjustment.

Even if there is some payback in August, the third quarter looks to be quite solid. We are now looking for consumer spending to rise at a 4% annual rate in the third quarter and see real GDP rising at around a 3.5% pace. Output and employment may also get a boost from ramped up auto production ahead of a possible strike this fall.
Strong third quarter GDP growth slightly lifts the odds the Fed will hike the federal funds rate another quarter percentage point but does not change the Fed’s narrative or timetable, which has them hiking rates at least one more time this year.
Disposable income, or after-tax income was unchanged in July. Tax payments rose 1.3%, nullifying the 0.2% in personal income. The difference between disposable income and consumer spending yields personal saving, which fell sharply in July, pulling the saving rate back down to 3.5%.
Consumers have likely exhausted much of their extra savings built up during the pandemic. This means spending will more closely track wage and salary growth, which will slow along with nonfarm employment growth later this year.

Disclaimer: This publication has been prepared for informational purposes only and is not intended as a recommendation offer or solicitation with respect to the purchase or sale of any security or other financial product nor does it constitute investment advice.