
The Stakes of Peace: How Resolving Ukraine Shapes U.S. Leadership, Markets, and Global Order
Trump, Putin, and the Long Game
- Trump’s frustration with Putin suggests growing awareness of Russian stalling tied to Dugin’s strategy to control all of Ukraine.
- A Russia-favorable peace risks fracturing NATO unity and significantly diminishing U.S. leadership credibility around the world.
- An effective counterstrategy would require energy leverage, NATO reassurance, and firm negotiation deadlines to pressure Russia.
- A successful resolution could reinvigorate the Western alliance and global order.
- The resolution of the Russia-Ukraine war will shape the global order, with major implications for trade, capital flows, and asset markets. A well-executed outcome could reassert U.S. leadership, help achieve broad-based trade agreements, strengthen the dollar, normalize capital flows, and catalyze global growth. Risks of policy missteps and further Russian deception, however, remain elevated and could carry heavy costs.
The potential resolution of the Russia-Ukraine war carries far-reaching consequences for geopolitics and financial markets alike. Donald Trump’s recent frustration with Vladimir Putin — highlighted by public rebukes and pressure to cease attacks on Kyiv — suggests a growing awareness that Putin is deliberately stalling negotiations, playing from Aleksandr Dugin’s long-term geopolitical strategy of weakening Ukraine and the West. While Trump’s instinct favors swift deal-making, a rushed settlement risks inadvertently advancing Moscow’s objectives, undermining U.S. leadership, and fracturing Western unity, resulting in long-term negative consequences.
Putin’s tactics, rooted in Dugin’s ideology but tempered by pragmatic opportunism, aim to bleed Ukraine and exhaust Western patience – a strategy that has worked against U.S. interests in Vietnam, Iraq, and most recently, Afghanistan. By escalating attacks even as negotiations advance, Putin seeks to secure territorial gains and normalize the erosion of Ukraine’s sovereignty. Trump’s challenge is to recognize that he faces not a willing negotiating partner, but a master of protracted conflict that is more interested in the long game. Recognizing these tactics — and crafting a strategy to counter them — is essential.
Aleksandr Dugin, in his 1997 work Foundations of Geopolitics, lays out a Eurasianist vision aimed at weakening Western influence, dismantling the U.S.-led global order, and reasserting Russian dominance over its historical sphere, with Ukraine as a central target. Dugin sees Ukraine’s independence as a direct threat to Russia’s geopolitical destiny, making its subjugation critical to fracturing NATO, dividing Europe, and undermining U.S. leadership.
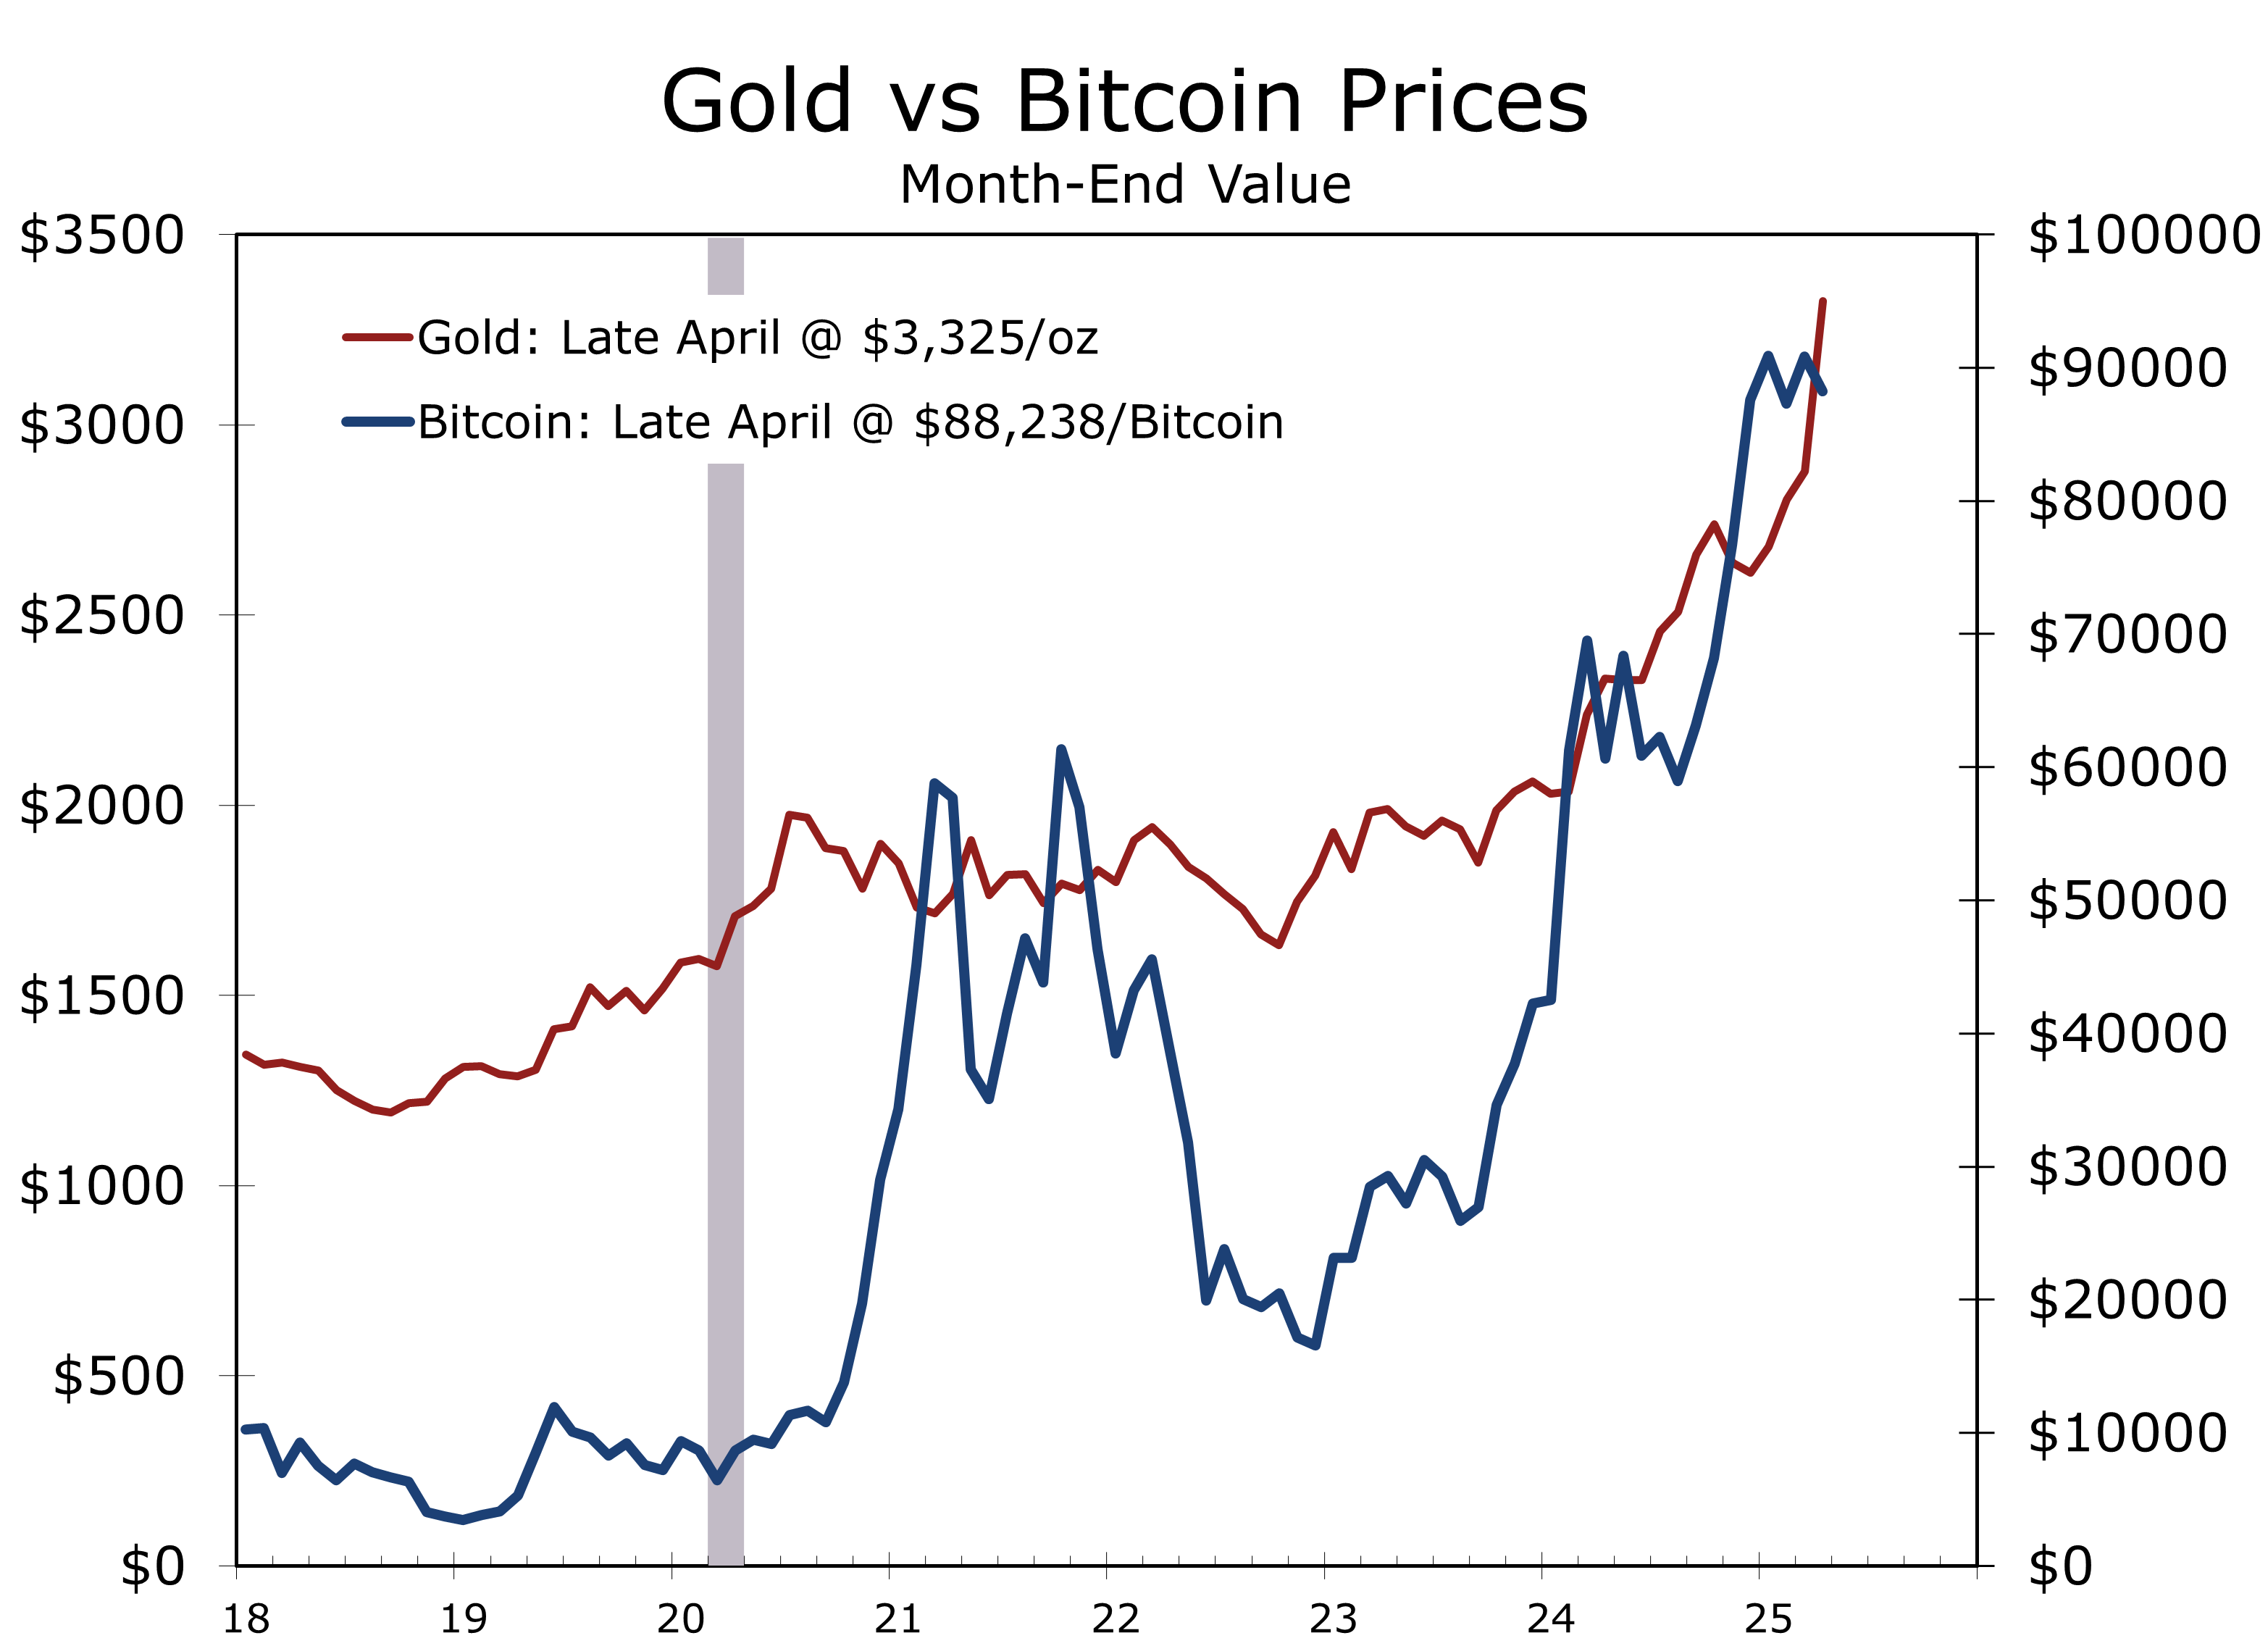
Dugin’s ideas have heavily influenced Vladimir Putin’s strategy, fueling a drawn-out conflict that strains Western alliances, disrupts global trade, drives energy volatility, and threatens capital flows and the dollar’s global dominance. A prolonged or poorly managed resolution to the Ukraine war risks validating Dugin’s playbook and injecting sustained uncertainty into the global economy, at a moment when U.S. financial leadership is already under pressure. Putin views the current environment—marked by fragmented U.S. trade talks with key allies—as a historic opportunity.
Putin view the current trade tensions between the U.S. and its allies as a historic opportunity.
A successful U.S. counterstrategy would require several coordinated actions:
- Leveraging American energy dominance to weaken Russia’s revenues.
- Reaffirming NATO commitments to deter further Russian adventurism.
- Imposing strict deadlines and conditionality on negotiations to prevent endless stalling.
- Empowering Ukraine with interim security guarantees while talks proceed.
These steps would allow the United States to shift the negotiating balance while avoiding the perception of abandoning an ally.
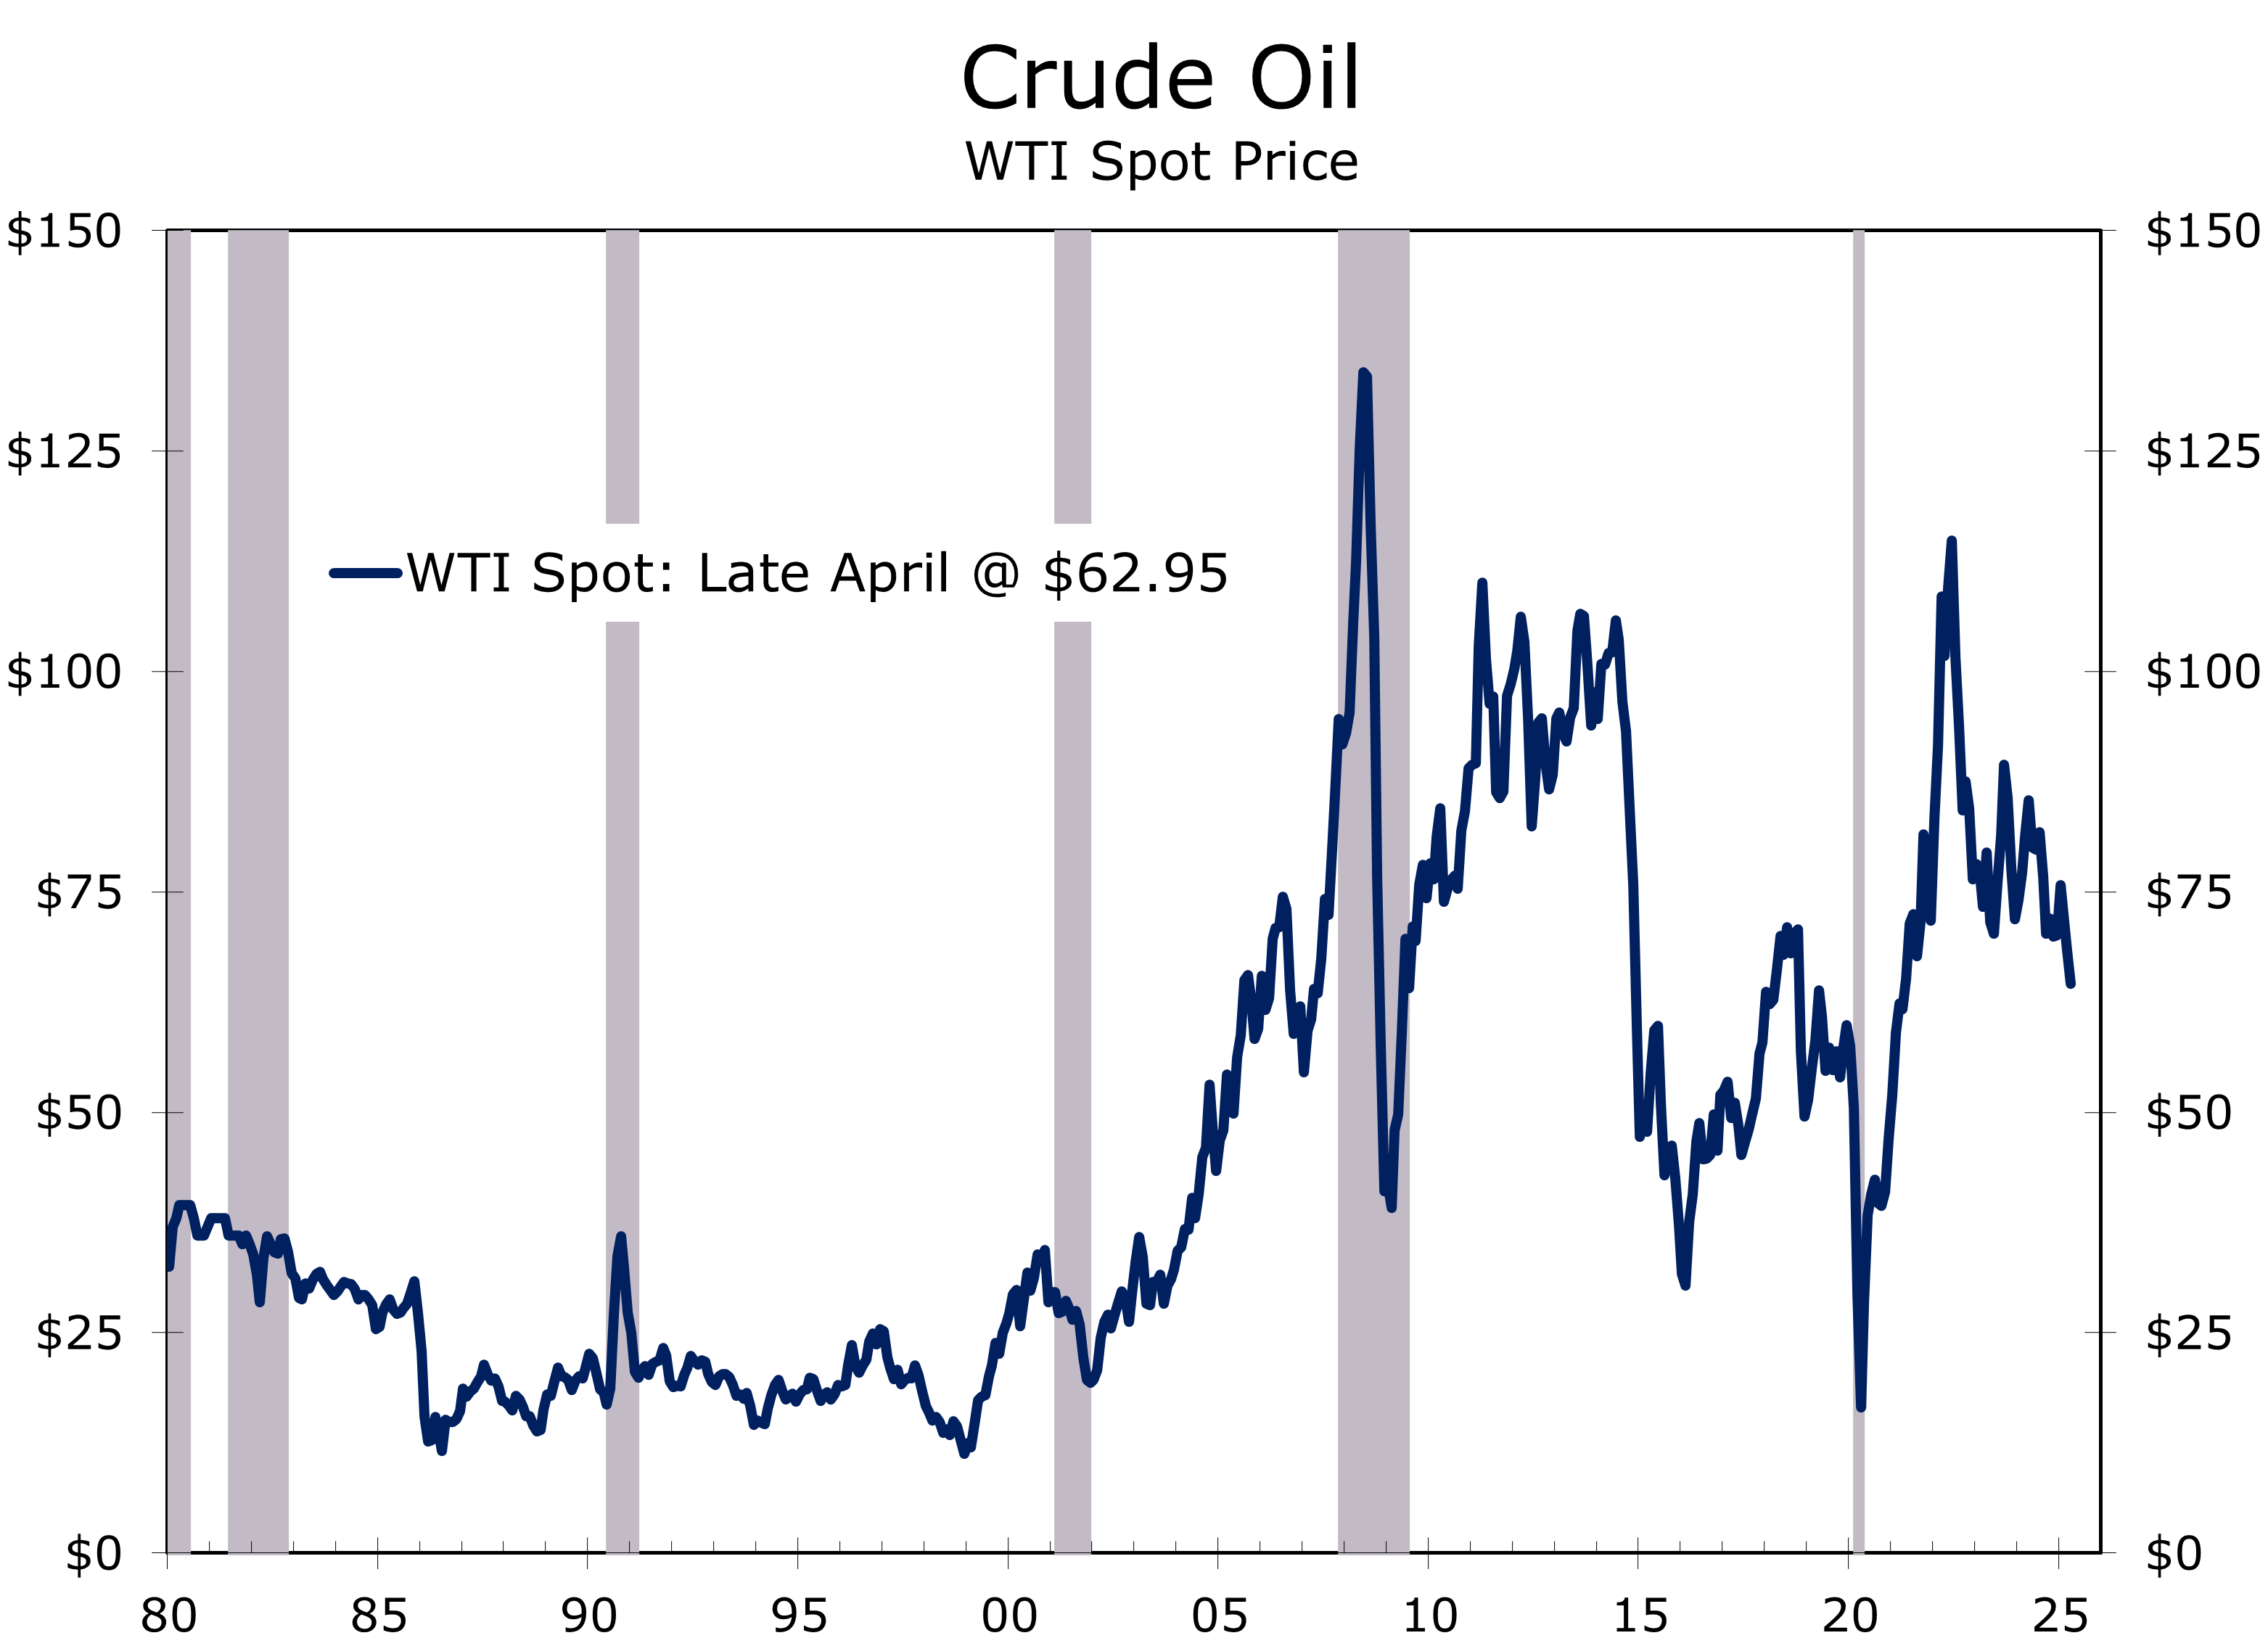
From a geopolitical perspective, a poorly structured settlement could erode U.S. prestige and encourage future aggression by autocracies, theocracies and dictatorships worldwide. Conversely, a strategically sound resolution would reinforce the credibility of American leadership, reinvigorate the Western alliance, and stabilize Eastern Europe.
The economic and financial implications are equally significant. A clear de-escalation of the war would lower global geopolitical risk premiums, revive international trade, and ease inflationary pressures tied to energy and agricultural markets. The U.S. dollar would likely strengthen as a safe-haven asset, buoyed by renewed investor confidence in American leadership and institutional stability. Capital inflows into U.S. markets would intensify, supporting higher asset valuations and lower interest rates.
A successful resolution would not only save lives but also potentially unleash a virtuous cycle.
A successful resolution of the Russia-Ukraine conflict would not only save countless lives but could also unleash a virtuous cycle: renewed U.S. leadership, stronger Western cohesion, a healthier global trade environment, firmer asset markets, and anchored inflation expectations. The margin for error, however, is slim, and the consequences of a misstep could be severe. Misreading Putin’s tactics—or accepting a settlement that merely masks long-term instability—could squander a historic opportunity and embolden adversaries elsewhere. A Russian victory would represent a strategic setback for the United States on par with the withdrawals from Vietnam and Afghanistan, with lasting damage to U.S. credibility. If Trump and U.S. negotiators can anticipate Russian deception and manage the process effectively, the West has a rare opportunity to end a costly conflict and reassert American leadership at a pivotal moment.
Disclaimer: This publication has been prepared for informational purposes only and is not intended as a recommendation offer or solicitation with respect to the purchase or sale of any security or other financial product nor does it constitute investment advice.
April 28, 2025
Mark Vitner, Chief Economist
704-458-4000

Housing Starts Slide Sharply Amid Policy Uncertainty and Cost Pressures
Housing Starts Stall, Remodeling Holds Firm
- Housing starts fell 11.4% in March to a 1.324 million-unit pace.
- Single-family starts fell 14.2% to 940,000 units — the slowest since May 2024. Multi-family starts fell 3.5%, as developers remain sidelined amid oversupply and financing hurdles. Building permits rose 1.6%, with all the gain coming in the more volatile multi-family sector.
- Starts plunged 31% in the West and 17% in the South, while the Midwest surged 76% on weather and timing.
- Tariffs, labor shortages, and uncertainty continue to weigh on builder confidence.
- While prospective buyer traffic remains weak, builders remain optimistic about sales over the next six months.
- Remodeling remains a bright spot, with spending supported by aging homes and strong homeowner equity.
- Tariffs, labor shortages, and policy shifts will continue to shape the housing landscape through 2025. Although mortgage rates are expected to ease slightly if the Federal Reserve follows through on anticipated rate cuts, affordability remains a challenge for buyers, especially in higher-cost regions.
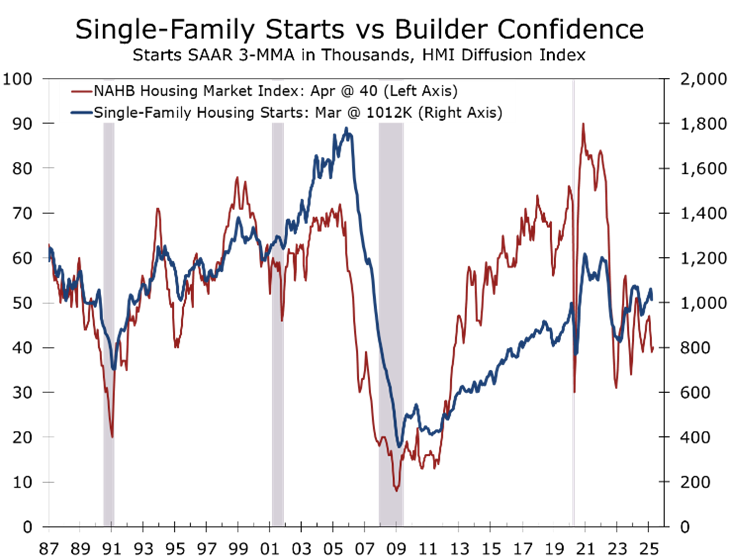
Homebuilding entered the key spring building season on a cautious note, with a sharper-than-expected slowdown in new starts, even with better weather. Overall housing starts fell 11.4% month-over-month to a 1.324-million-unit pace, 100,000 units below consensus expectations. While total starts remained 1.9% above year-ago levels, the underlying trend remains weak, particularly the single-family segment.
Single-family housing starts declined 14.2% to a 940,000-unit pace, the slowest pace since May and down nearly 10% from its year-ago pace. Single-family starts had remained above 1 million units during the prior four months, which is normally the slowest part of the year for homebuilding. The recent pullback underscores growing caution from homebuilders, even as mortgage rates have retreated modestly from their cycle highs. Meanwhile, multi-family starts held steady at 370,000 units, suggesting that developers remain sidelined amid oversupply concerns and persistent financing hurdles.
Building permits rose in March but the number of permitted-but-not-started projects has risen.
Building permits climbed 1.6% to a 1.482 million-unit pace — a modest upside surprise. Still, the wider than usual gap between permits and starts underscores the uncertain path forward, as rising inventories and tight credit temper future groundbreakings.
Regionally, the data painted a fragmented picture. The West posted a steep 30.9% drop, underscoring the sector’s greater vulnerability to rising materials costs and trade-related price volatility. The South — the nation’s largest housing market — fell 17.1%, in line with national trends. The Midwest surged an outsized 76.2%, likely driven by improved weather, lower land costs, and regionally specific, timing-related project launches rather than underlying demand strength.
Single-family homebuilding remains constrained by unrelenting affordability hurdles.
The single-family market remains constrained by affordability challenges, policy uncertainty, and a persistent shortage of buildable lots. The NAHB/Wells Fargo Housing Market Index (HMI) edged up to 40 in April but remains firmly in contraction, underscoring builder caution.
Tariffs have emerged as a key headwind, adding an estimated $9,200 in material costs per home. Higher costs will squeeze margins, particularly with nearly 30% of builders cutting prices and over 60% using sales incentives such as mortgage rate buydowns.
Despite these pressures, single-family starts are still expected to improve modestly this year as mortgage rates retreat toward the 6.5% range. Our baseline forecast assumes the U.S. narrowly avoids recession.
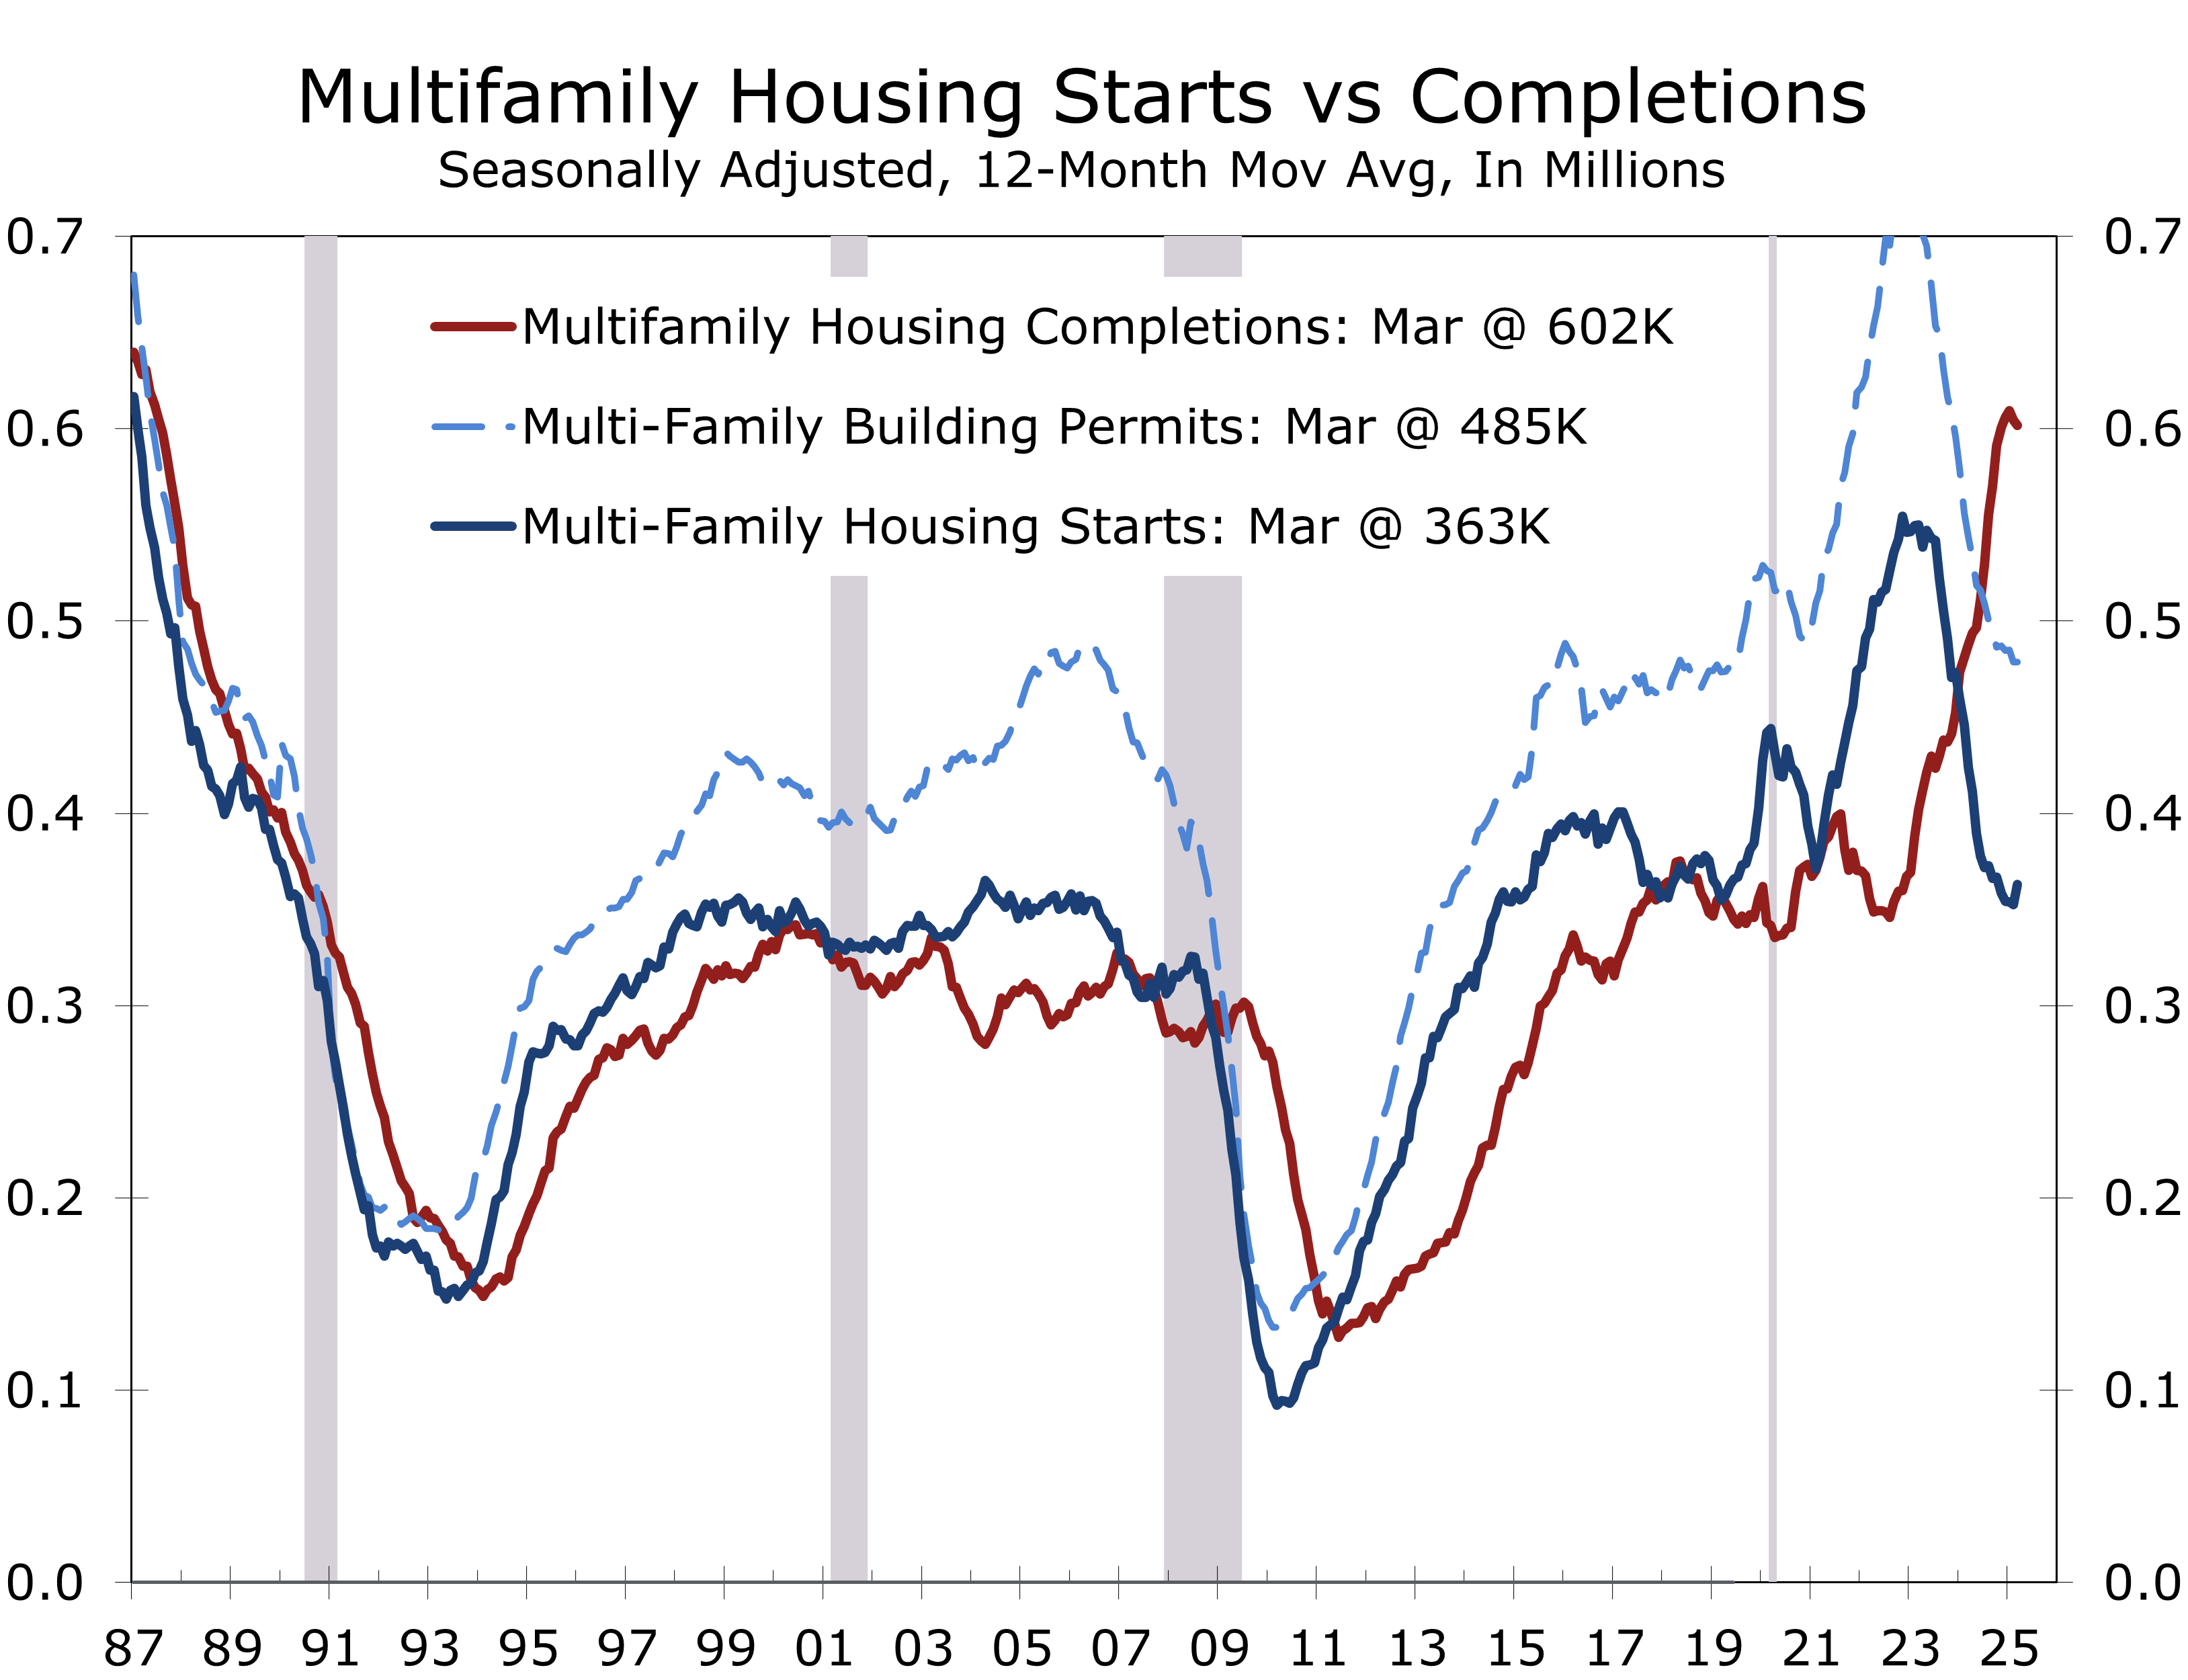
Multi-family starts, having already endured a steep 2024 contraction, remain stagnant. Developers face both an oversupply of new units and limited access to affordable capital, opening a wide gap between starts and permits. The NMHC Apartment Market Conditions Survey has now reported looser conditions for 10 consecutive quarters, while the Architectural Billings Index (ABI) for multi-family remains mired in negative territory for 31 straight months — a clear sign that recovery is unlikely in the near term. Leasing remains strong, which will hopefully help clear the deluge of completions from projects started back in 2022.
In sharp contrast to new construction, residential remodeling remains a relatively bright spot. The aging U.S. housing stock — now averaging 41 years — coupled with strong homeowner equity has fueled steady demand for renovations. The NAHB expects remodeling spending to grow 5% in 2025 and another 3% in 2026, despite higher material costs driven by tariffs on lumber and appliances.
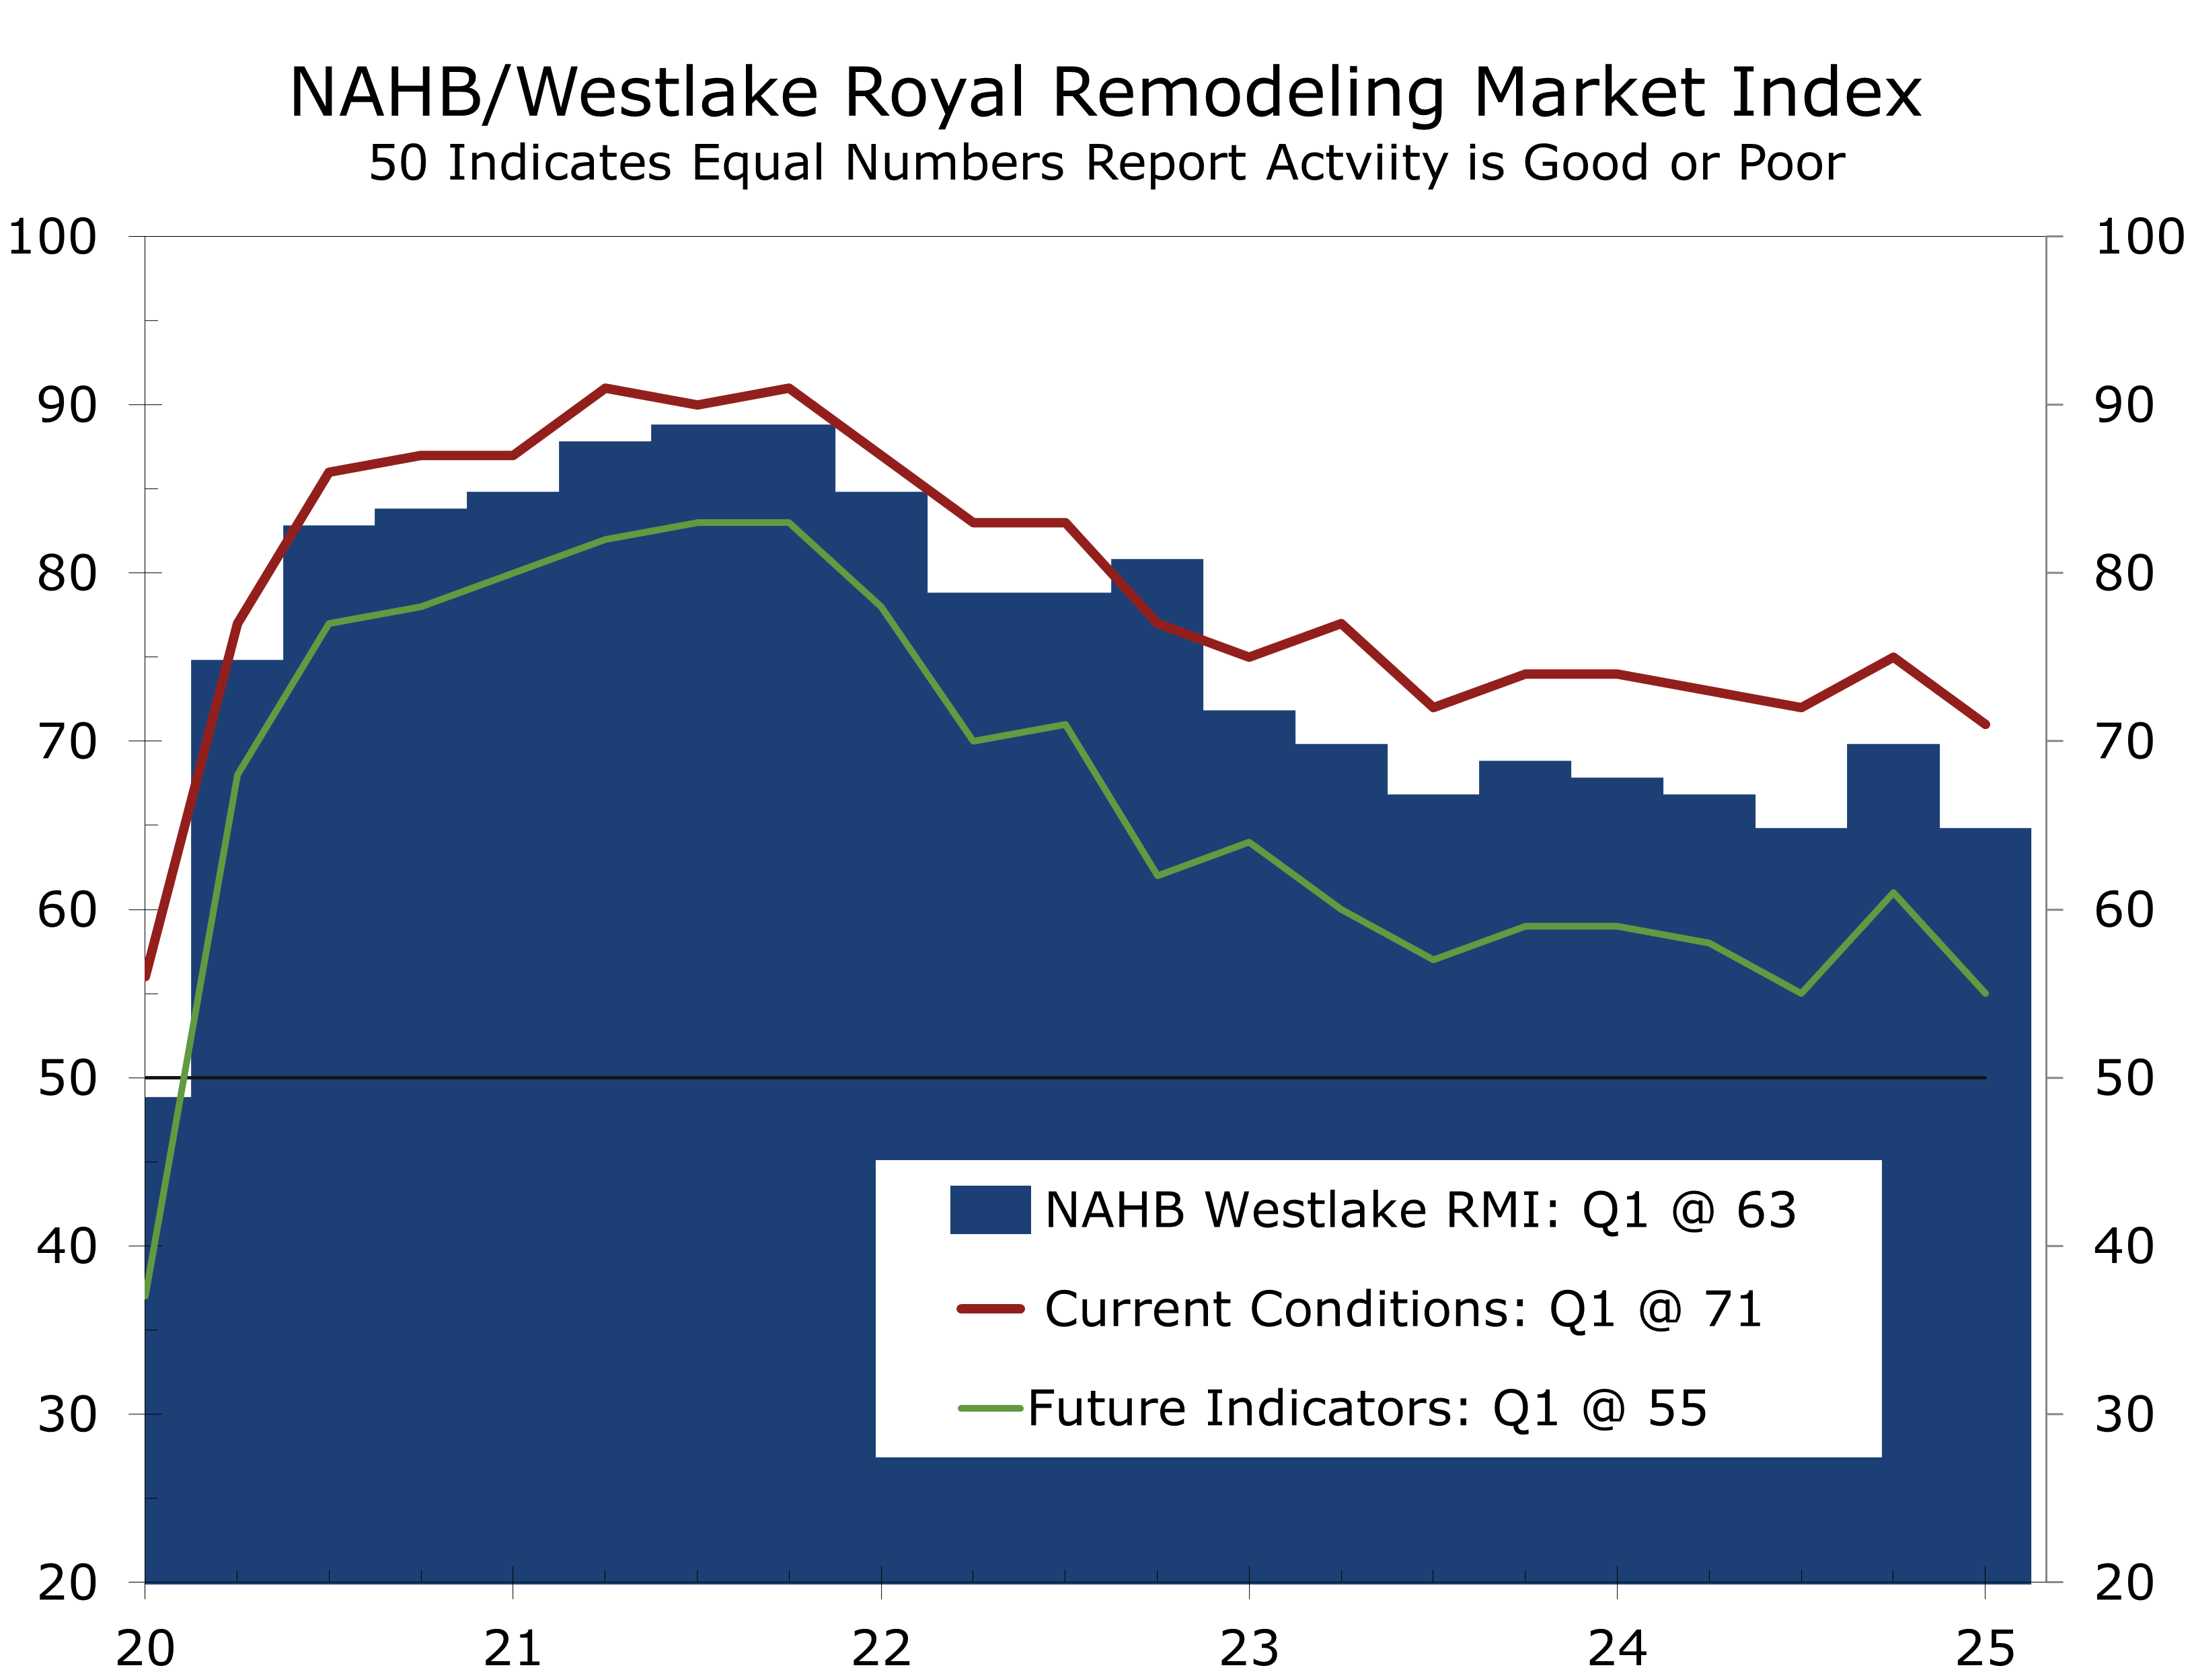
The NAHB/Westlake Remodeling Market Index (RMI) slipped slightly to 63 in Q1 but remains in expansion territory. Homeowners continue to invest in upgrades, particularly as elevated mortgage rates keep more owners locked into their current homes.
Disclaimer: This publication has been prepared for informational purposes only and is not intended as a recommendation offer or solicitation with respect to the purchase or sale of any security or other financial product nor does it constitute investment advice.
April 17, 2025
Mark Vitner, Chief Economist
(704) 458-4000
Pre-Tariff Spending Spurt Boosts Retail Sales
Tariff Fears Fuel Big-Ticket Purchases
- Retail sales rose 1.4% in March, fueled by a 5.3% surge in motor vehicle sales.
- Excluding autos, sales rose 0.5%, with gains reported in 10 of 12 major categories.
- Gas station sales fell 2.5% due to lower prices; ex-gasoline, sales advanced a solid 1.7%.
- Gains were broad based, with building materials, recreation and sport stores, and electronics stores all posting solid gains. Online sales were soft, however, and furniture stores saw sales drop 0.7%.
- Core retail sales (control group) posted a softer-than-expected 0.4% gain, though upward revisions to prior months signal firmer underlying strength.
- March retail sales should alleviate some of the darker fears about the outlook. While the data preceded April’s tariff turmoil, the underlying trend is stronger than earlier thought and the first quarter ended on a strong note that should carry over into the current quarter.
U.S. retail sales rebounded sharply in March, rising 1.4% and marking a welcome turnaround after two consecutive weak prints. While the rise was broadly in line with expectations, the underlying details point to consumer spending than previously assumed. Auto sales surged 5.3%, a move widely attributed to front-loaded purchases ahead of anticipated tariffs. Combined with upward revisions to prior months, the data ease concerns that the economy is on the edge of, or already in, recession. Real personal consumption now appears on pace for a 1% annualized gain in Q1 — a clear deceleration from the prior quarter’s 4% pace, but materially better than earlier estimates.
Beyond the tariff-driven dynamics, several temporary factors likely provided a meaningful boost. The rebound from weather‑related disruptions and illness earlier in the quarter helped unlock pent‑up demand. In addition, the peak of tax‑refund disbursements in late February and early March temporarily lifted disposable income. The distribution of retroactive Social Security payments during the month also added modest incremental support to household cash flow.
This year’s extremely late Easter may have also provided an unexpected boost. Retail sales are adjusted for seasonal, holiday, and trading‑day differences, occasionally resulting in head‑scratching reports. When Easter comes late, the Census Bureau smooths retail sales by pulling some of the sales it expects to occur in April into March. The opposite adjustment applies in years when Easter falls early.
March retail sales also likely benefited from improving weather, following a colder and wetter‑than‑usual winter and a particularly severe flu season.

Looking beyond temporary distortions, the underlying data highlight a remarkably resilient U.S. consumer. History reminds us to never underestimate the American consumer’s willingness to spend, even as economic headwinds gather. Control group sales — the core input for the most discretionary components of the Bureau of Economic Analysis’ personal consumption calculations — advanced a solid 0.4% in March. Upward revisions to the two prior months underscore the firmer underlying trend.
Never underestimate the American consumer, even when economic headwinds gather.
Incorporating the stronger data, we have revised our Q1 real personal consumption growth estimate to a 1.2% annualized rate, up from 0.9%. While some forecasts are likely to come in higher, we expect unseasonably mild March weather to suppress utility use, limiting the upside for services spending.
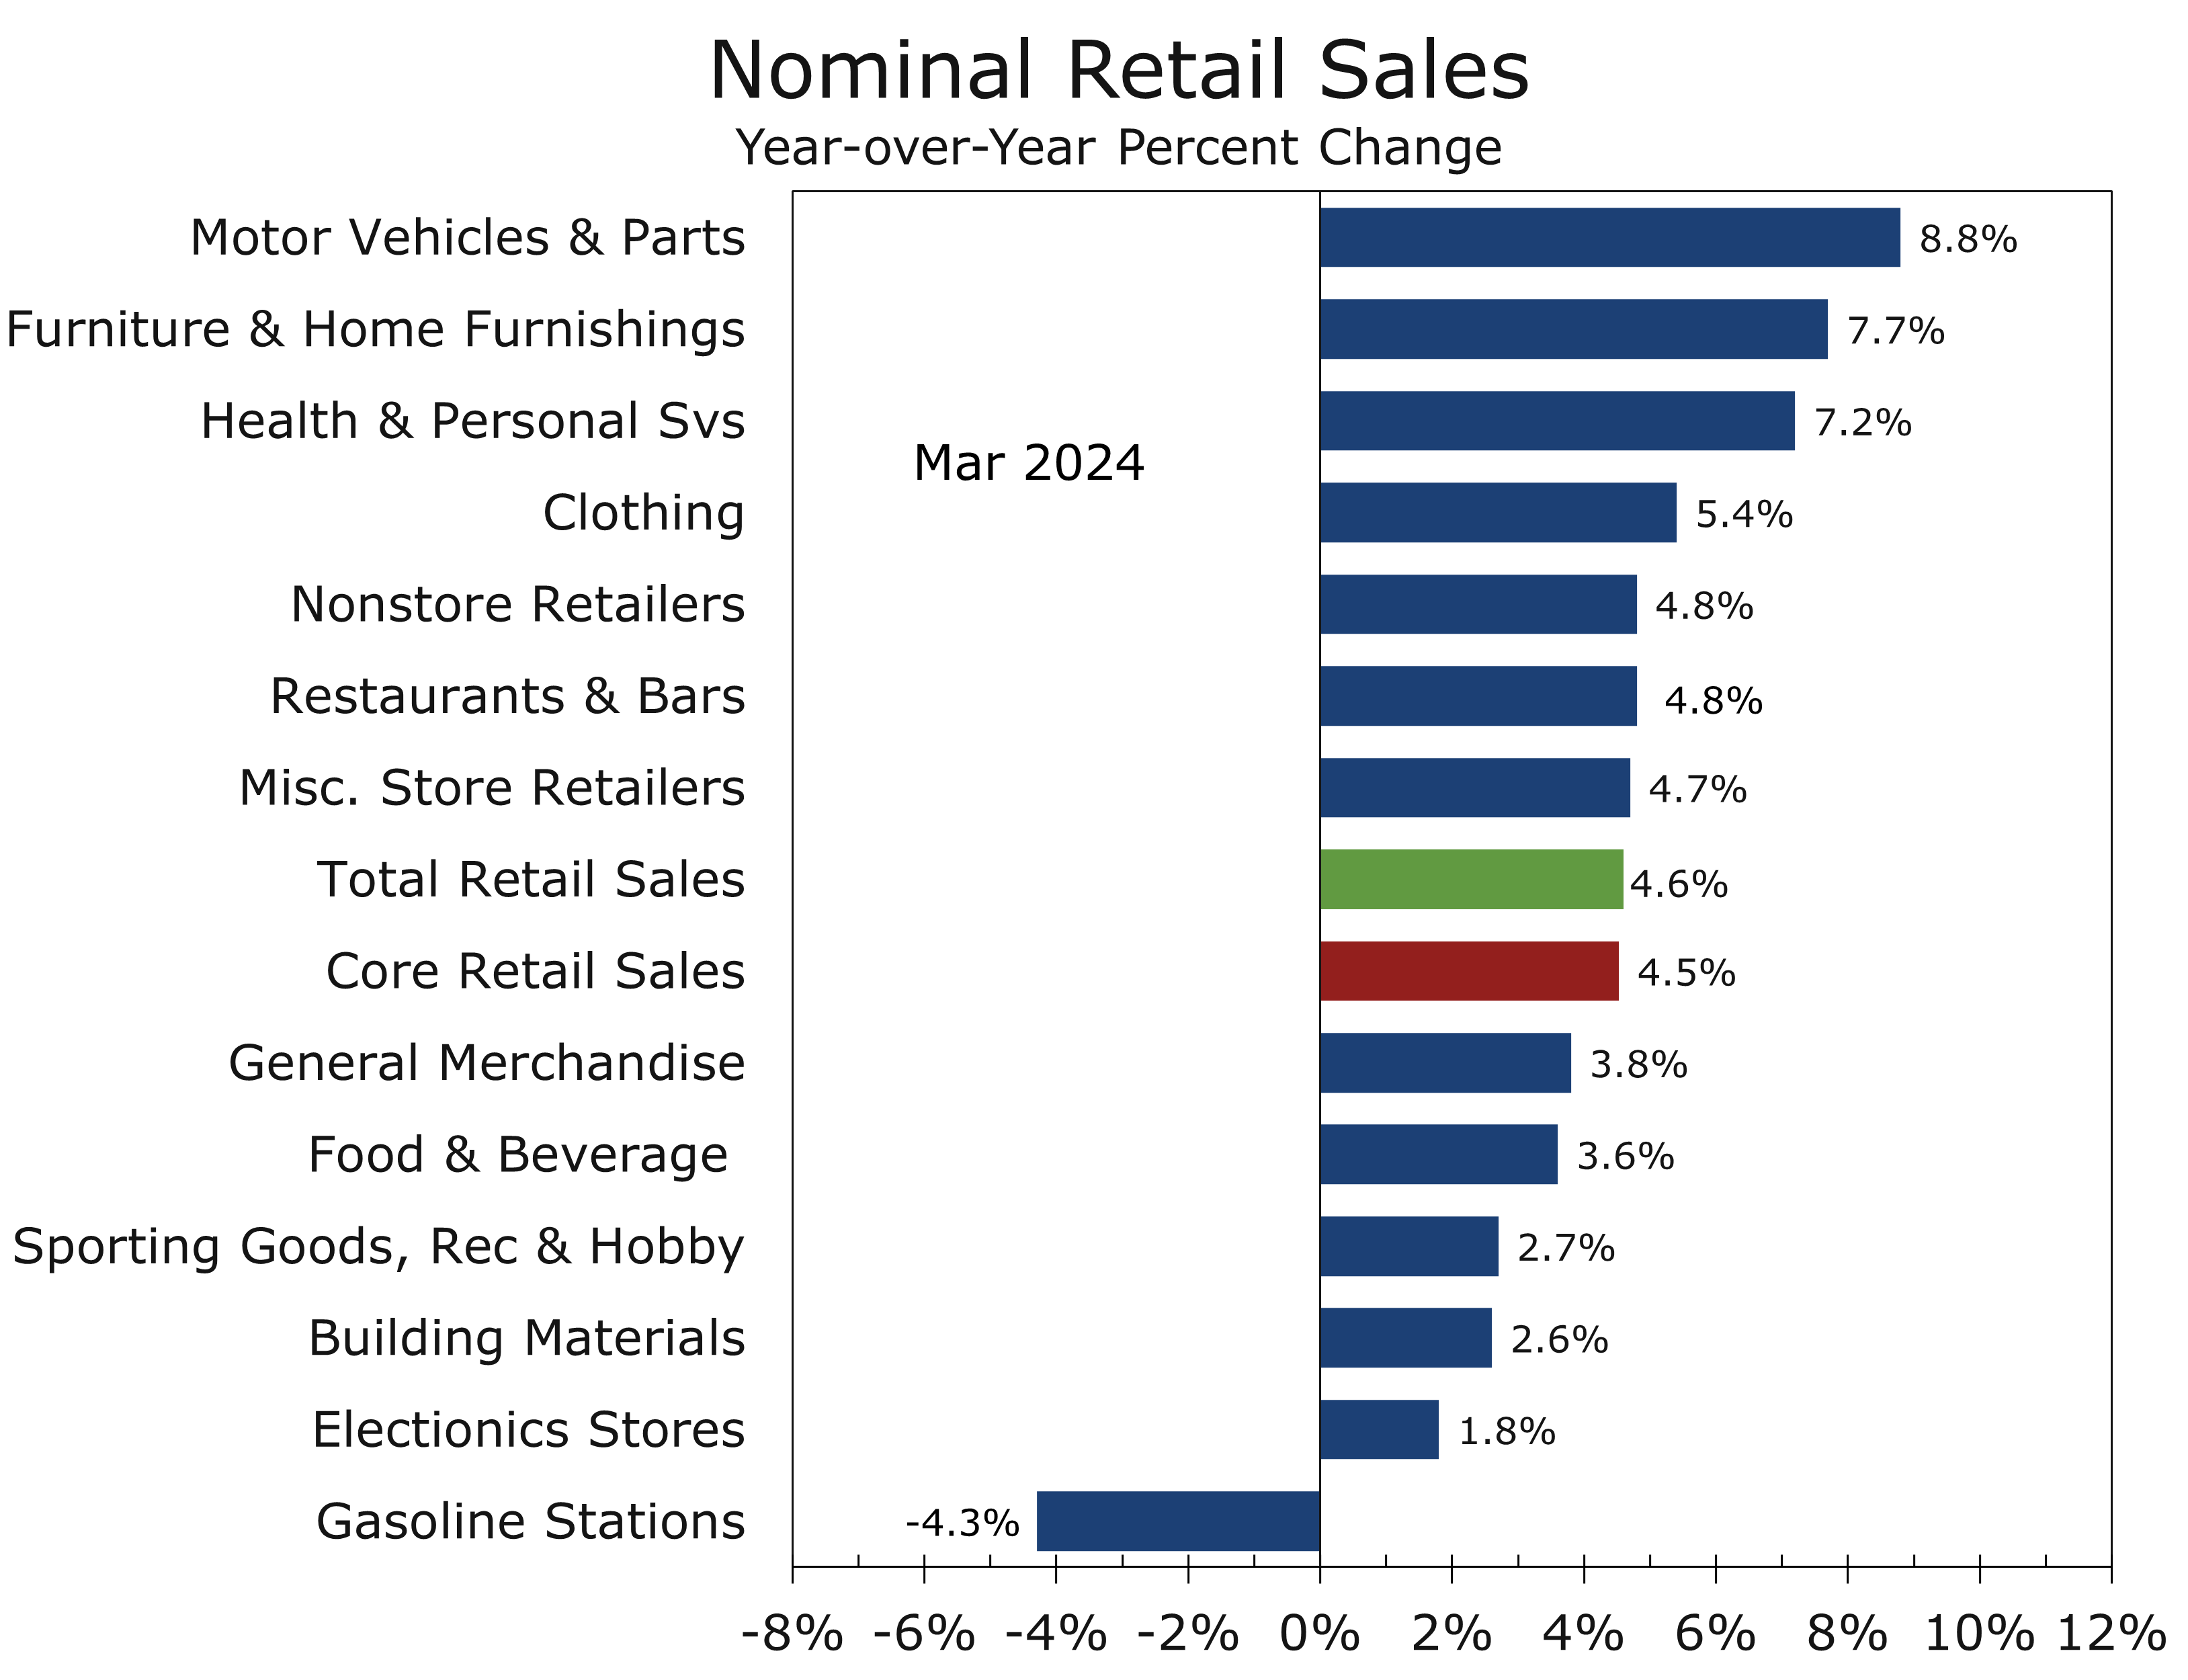
Retail sales look meaningfully stronger following March’s strong retail sales report. Year-over-year comparisons highlight a resilient consumer, with furniture sales up 7.7%, health and personal care stores rising 7.2%, clothing advancing 5.4%, nonstore sales up 4.8%, and restaurants up 4.8%. That said, core retail sales have been tempered by continued softness at department stores, sporting goods, and electronics.
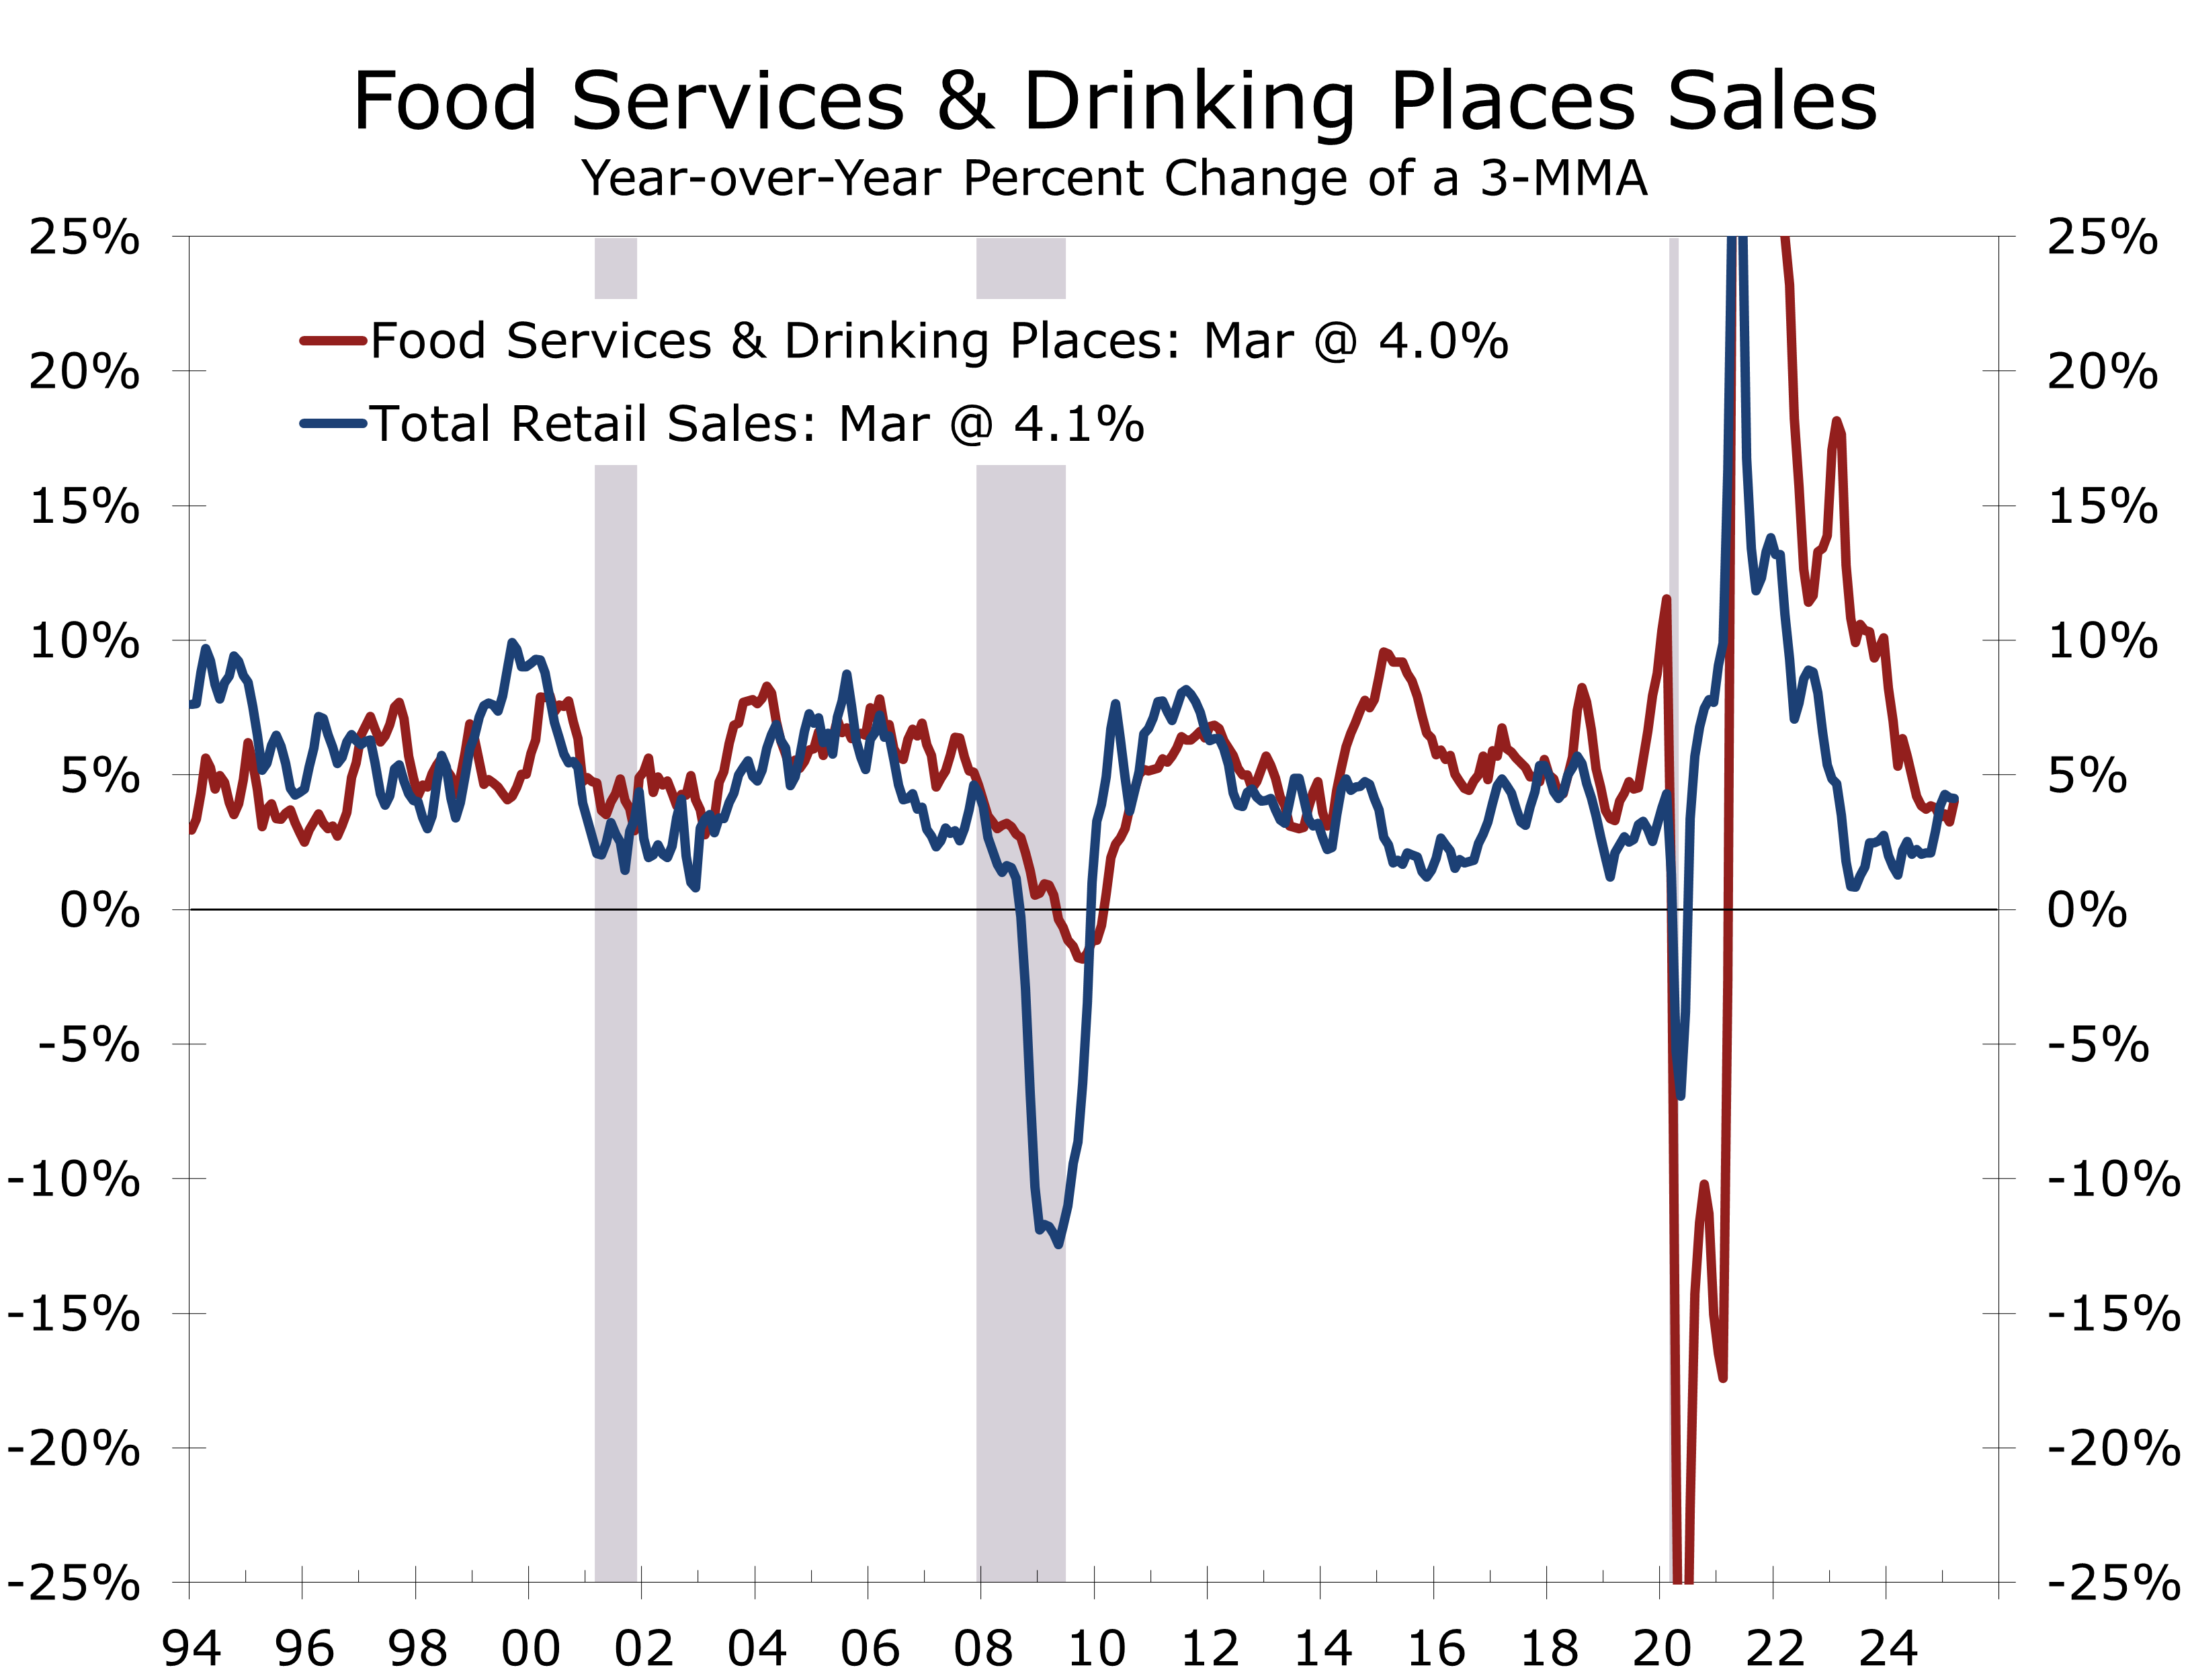
Calendar dynamics provided a notable tailwind to the foodservice sector. OpenTable data indicated a significant surge in Valentine’s Day dining, with reservations trending higher than in 2024, partly due to the date falling on a Friday this year. While sales experienced a brief dip following the April 2 tariff announcements, they have since rebounded, particularly in popular spring‑break destinations. The unusually late Easter has extended the spring‑break season, boosting foodservice‑related sales.
The unusually late Easter holiday has extended the spring break season.
Another trend boosting restaurants is the return to the office, which is driving lunchtime and after-work business. Office employment is now back near its pre-pandemic peak in most major MSAs. Other retailers that cater to the office workforce, dry cleaners, shoe shops and miscellaneous retail, are also benefiting.
The latest retail sales data push back at the notion that the economy is either in recession or soon will be. While growth has clearly slowed and the risks have clearly increased, we still see a better-than-even chance of the economy avoiding recession in 2025.
Disclaimer: This publication has been prepared for informational purposes only and is not intended as a recommendation offer or solicitation with respect to the purchase or sale of any security or other financial product nor does it constitute investment advice.
April 16, 2025
Mark Vitner, Chief Economist
(704) 458-4000
Tariff Fears Overwhelm Better Inflation News
Inflation Surprises to the Downside in March
- The headline CPI fell 0.1% in March, driven by a sharp decline in energy prices (-2.4%) that more than offset a 0.4% rise in food prices. The core CPI rose 0.1%, which was also well below expectations.
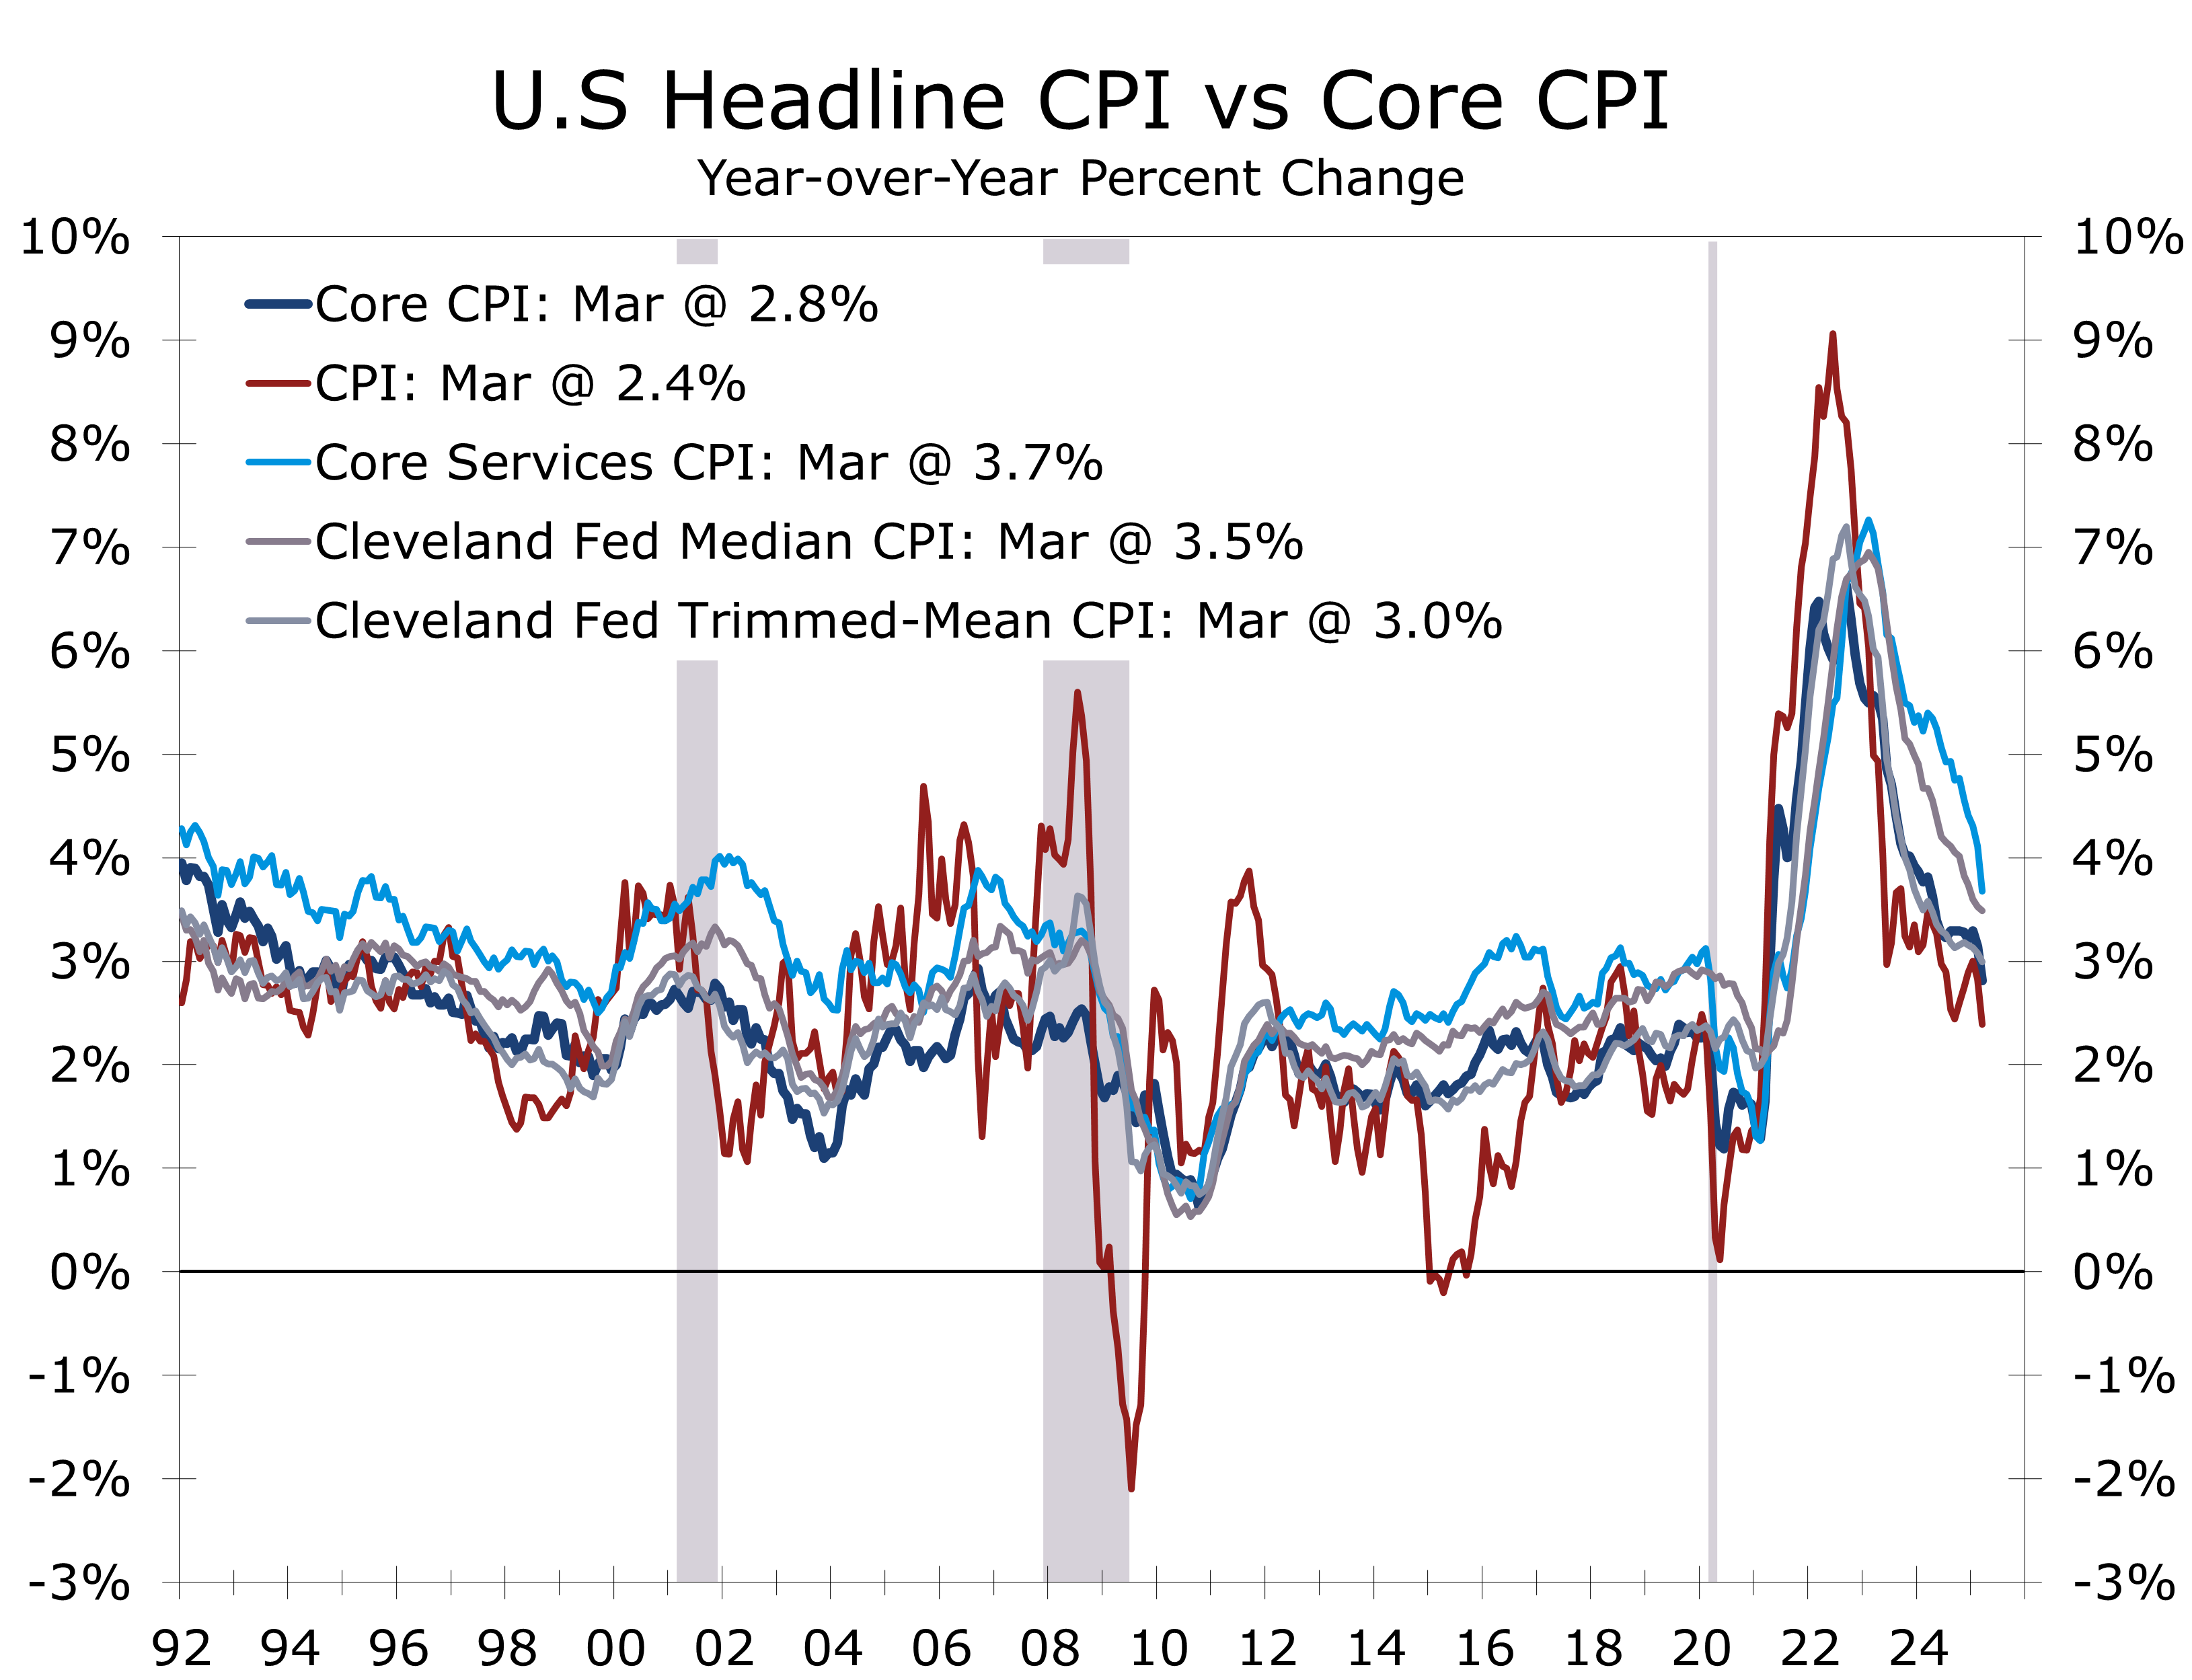
- Year-over-year headline CPI fell to 2.4%, its lowest since February 2021, while core CPI held at 2.8%, the smallest 12-month gain since March 2021.
- Travel-related costs (gasoline, airfares, lodging away from home) weakened, partly due to this year’s late Easter.
- Core goods prices remained flat in March and are down 0.6% year-to-year. Tariffs on Chinese imports are expected to reverse this trend; apparel (+0.4%) and furniture (+0.6% NSA) already may be feeling the impact.
- Shelter costs increased, with rent up 0.3% and owners’ equivalent rent (OER) up 0.4%. Motor vehicle insurance fell 0.8%, a rare decline, though still up 7.5% year-over-year.
- Tariff concerns overshadowed a better-than-expected CPI report. Price pressures are cooling in core services and energy, which may help offset the sting of higher tariffs.
Concerns over the persistence of higher-than-expected tariffs—particularly with China—have overshadowed any relief from the better-than-expected March Consumer Price Index (CPI) report. Headline CPI fell 0.1% in March after rising 0.2% in February, defying expectations for a modest increase. The decline was largely driven by a 2.4% drop in energy prices, including a sharp 6.3% fall in gasoline.
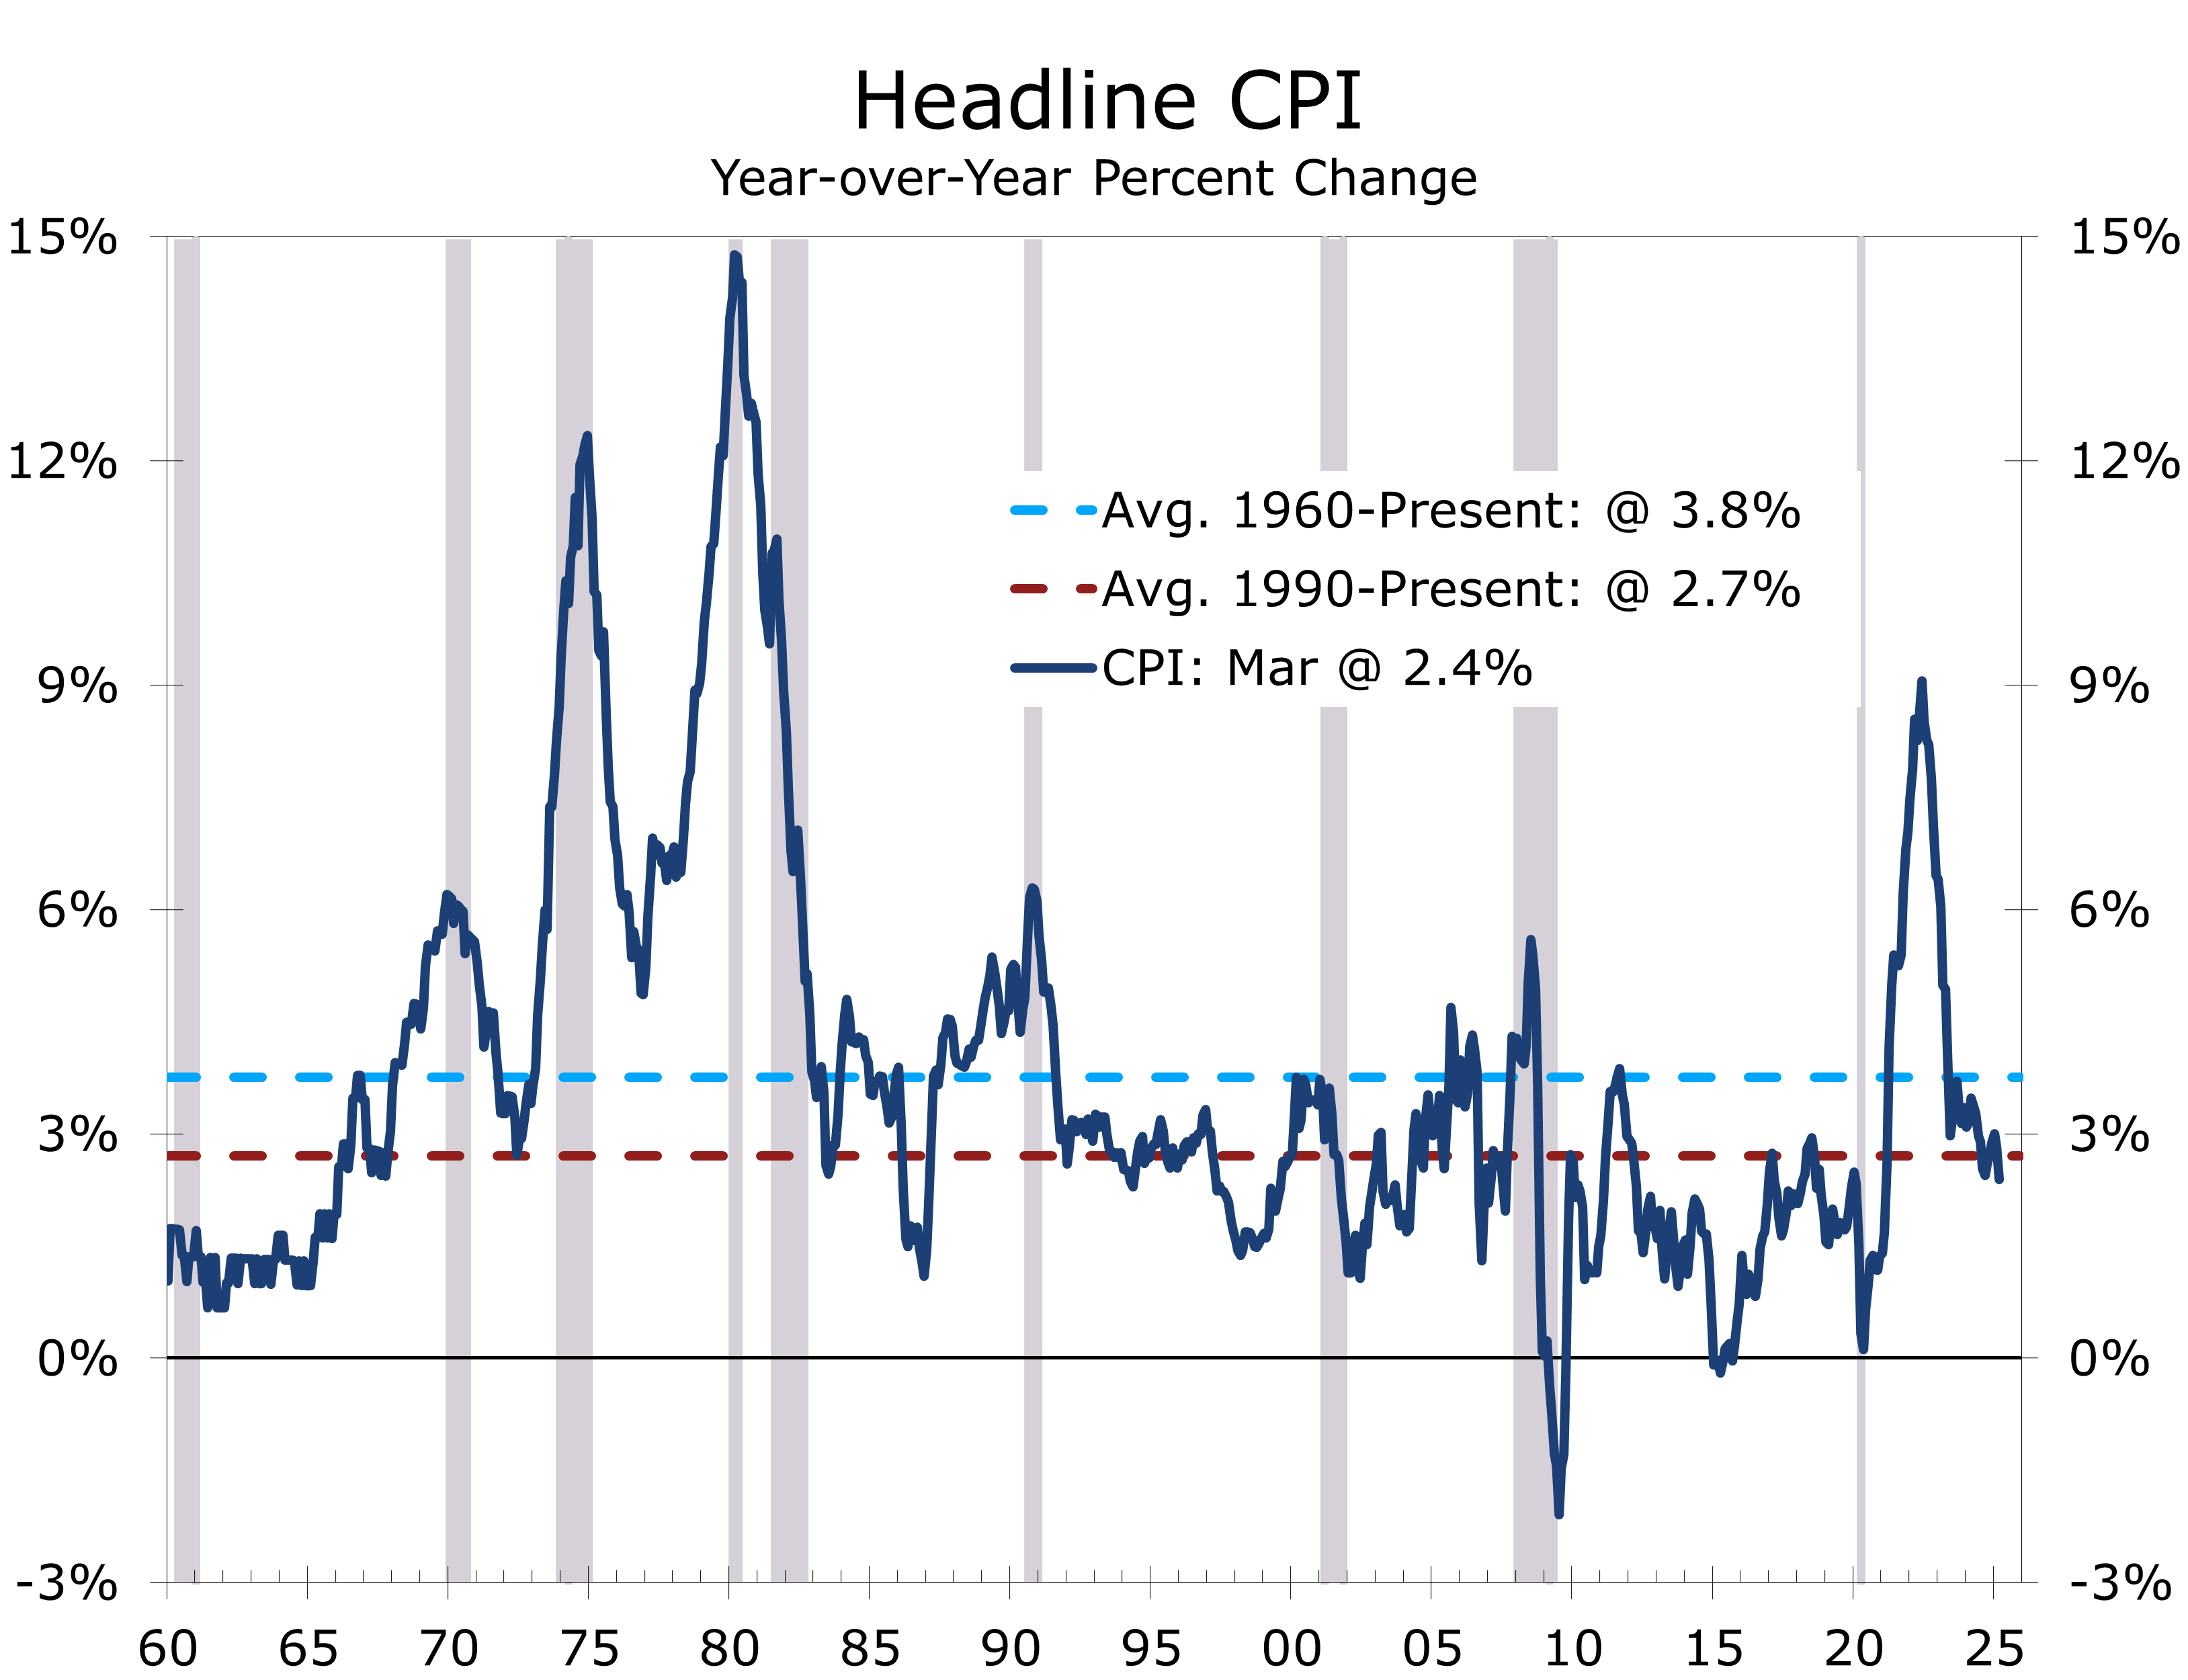
Core CPI, which excludes food and energy, rose just 0.1%, down from 0.2% in February. This brought the year-over-year increase down to 2.8%, the smallest annual gain since March 2021. Meanwhile, headline CPI slowed to 2.4% year-over-year, the lowest reading since February 2021.
While the Fed continues to favor the core PCE deflator as its primary inflation gauge, the headline CPI is now well below its long-term average. Notably, much of the recent disinflation has come from core services—an area less susceptible to tariff-related pressures. Moreover, the recent slide in energy prices should help stem both the slide in consumer sentiment and rise in inflation expectations.
The year-to-year change in the headline CPI is now well below its long-run average.
The headline CPI is now running below its long-run average. Most alternative inflation measures show similar improvement, albeit from slightly higher levels.
Energy prices fell sharply in March, with gasoline tumbling 6.3%. Gasoline prices usually perk up in spring, as driving increases along with evening daylight and springtime travel. Easter comes exceptionally late this year, however, which has weighed on travel and driving. The effects extended to other travel-related categories. Airline fares declined 5.3% (following a 4.0% drop in February) and lodging costs fell 3.5%.
Partially offsetting lower energy prices, food prices rose 0.4%. Grocery prices increased 0.5%, led by a 5.9% spike in eggs and a 1.3% rise in meats, poultry, fish, and eggs. Restaurant prices rose 0.4%, with full-service meals up 0.6%. Over the past year, food prices rose 3.0%, with egg prices up 60.4%—continuing to strain household budgets, especially for middle- and lower-income families. Relief is in the pipeline, however, as wholesale egg prices have plummeted in recent weeks.
Inflation is easing across most measures and tariffs may not upend this as much as feared.
One of the more encouraging aspects of the inflation data has been the sharp slide in core services’ prices. The improvement is backed up by the continued deceleration in both the Median and Trimmed-Mean CPI, which exclude many of the more volatile components, like used cars, that exaggerated the swings in both the headline and core CPI.
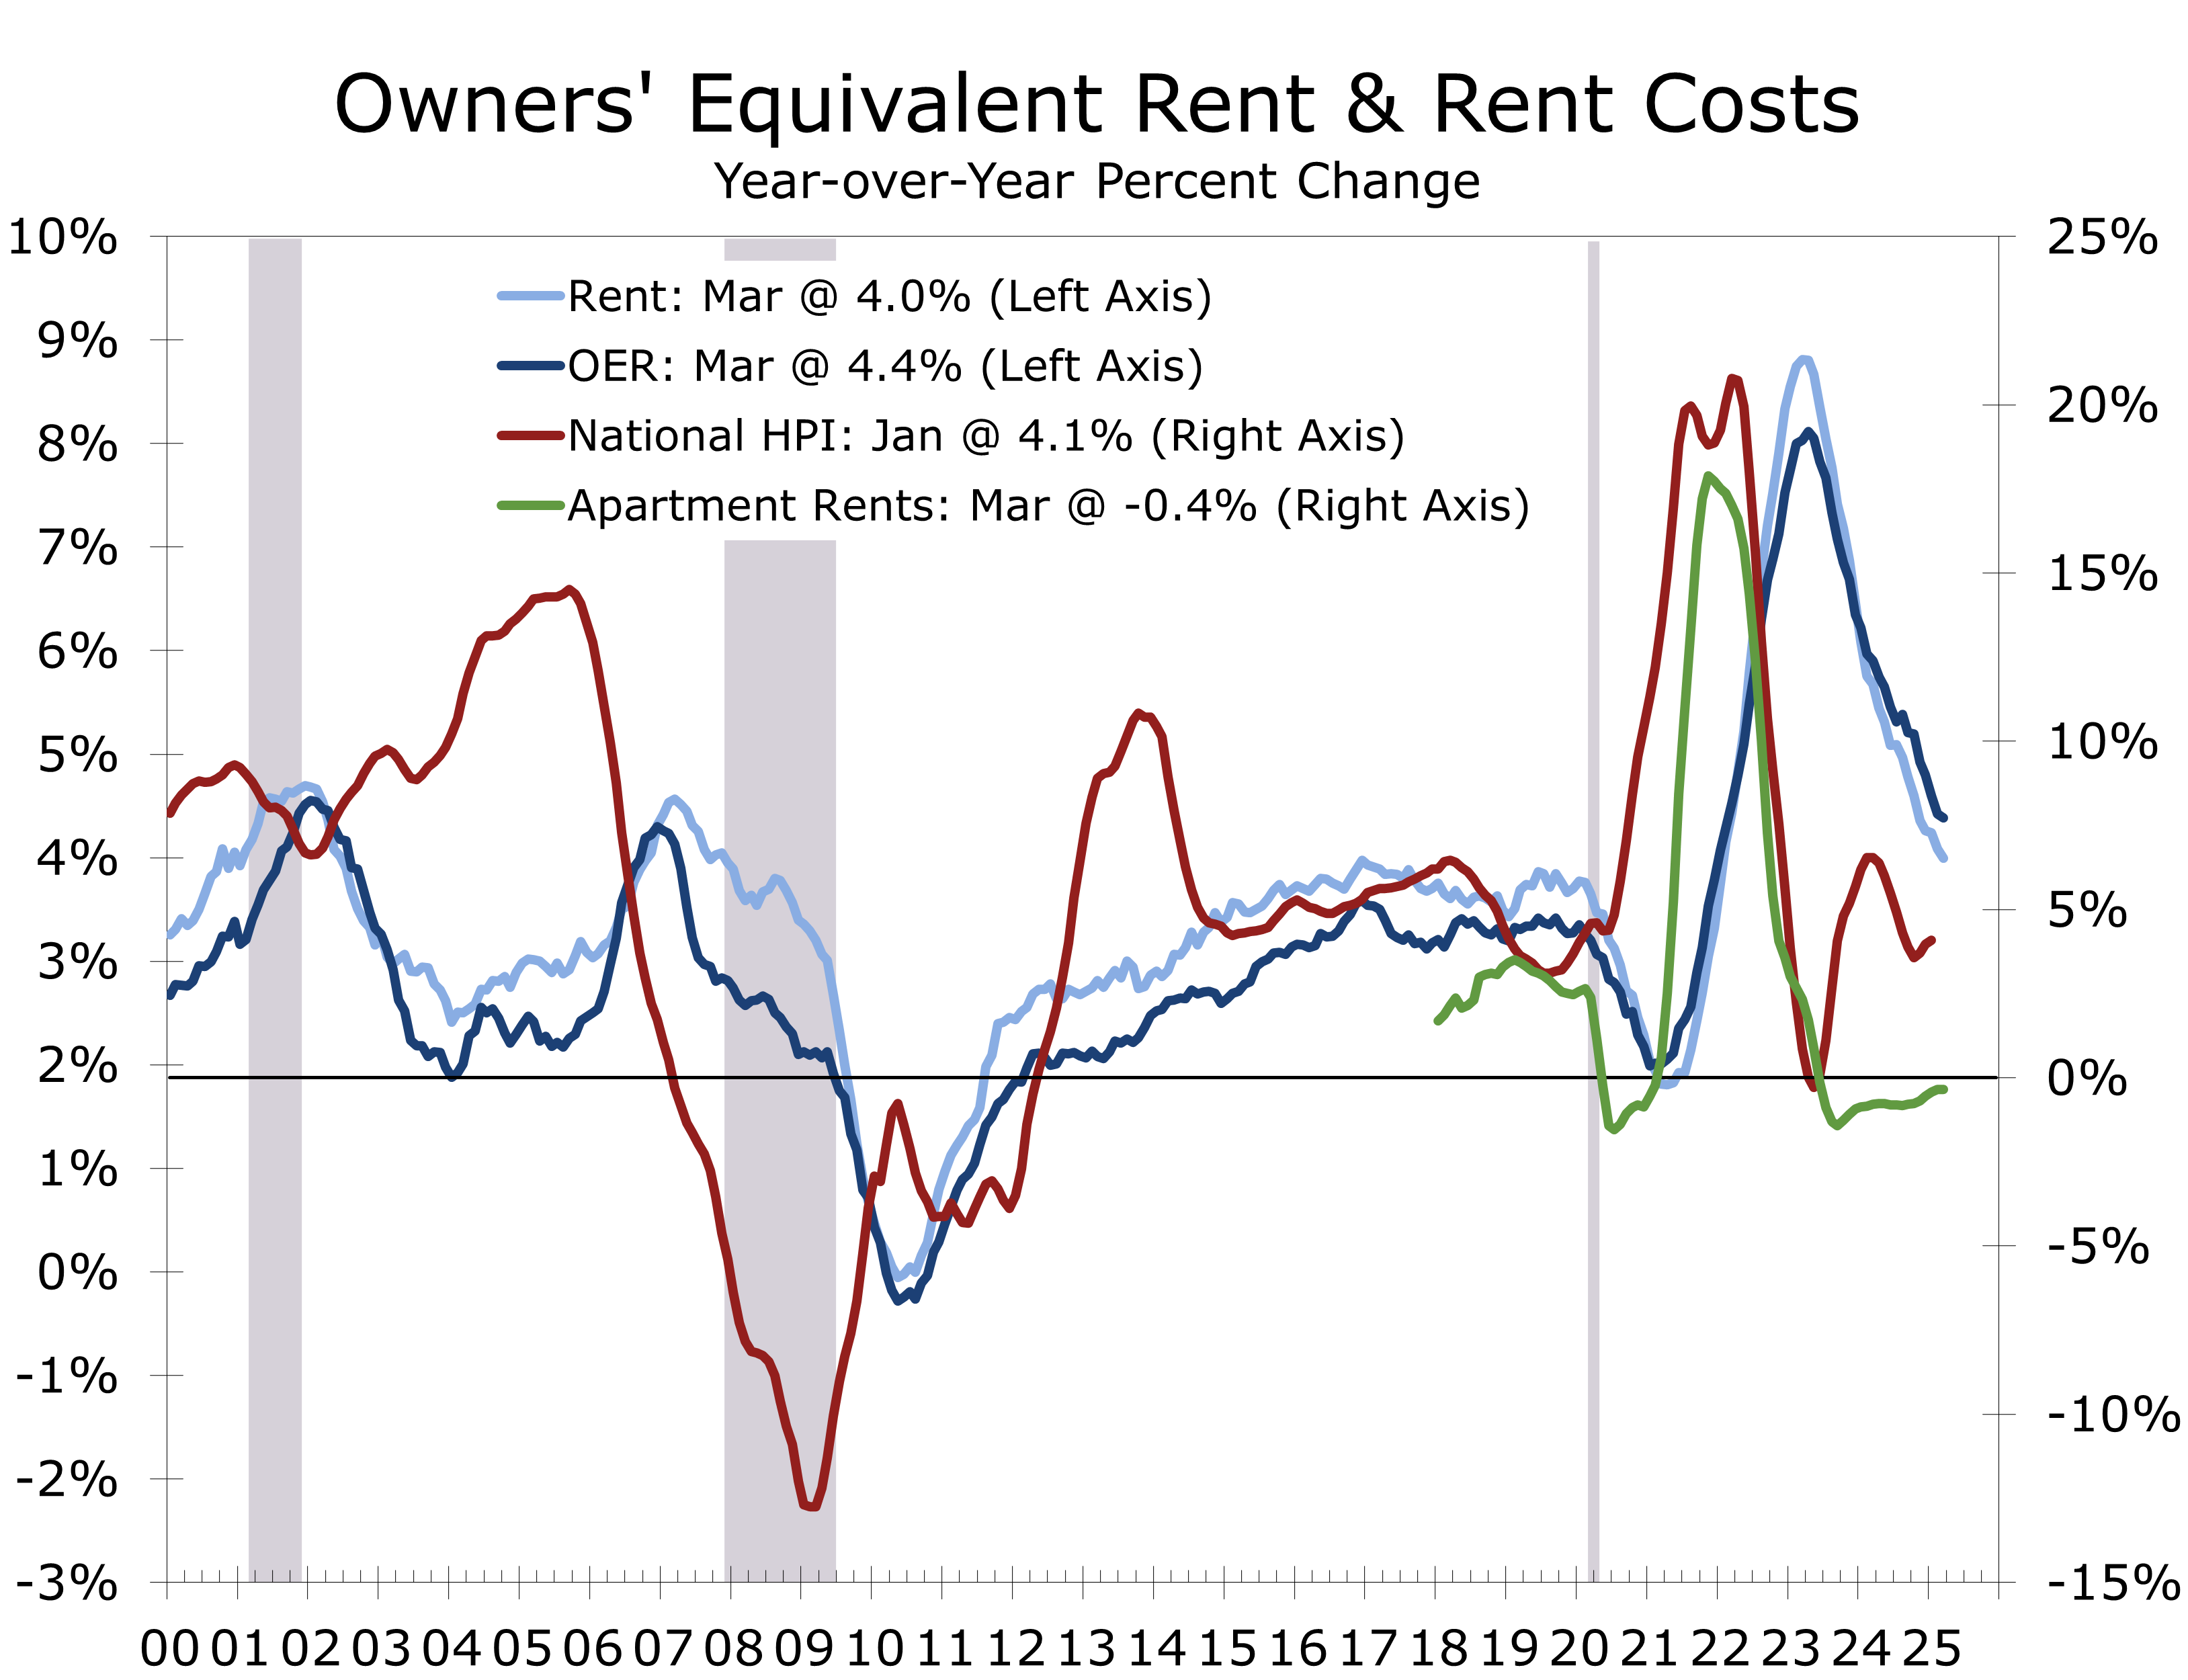
Residential rent and owners’ equivalent rent have been key contributors to the recent moderation in core inflation. Shelter costs rose just 0.2% in March, with owners’ equivalent rent up 0.4% and rent up 0.3%. Lodging costs fell 3.5%. Over the past year, residential rent growth has slowed by 1.7 percentage points to 4.0%, down 4.1 points from its peak two years ago. Owners’ equivalent rent has decelerated by 1.5 points to 4.4%, down 3.7 points from its April 2023 high.
Market-based measures of apartment rents, home prices, and single-family rents have slowed even more than the Bureau of Labor Statistics’ official housing cost data. As official figures catch up with market trends, residential rent and owners’ equivalent rent are likely to continue easing into 2025. Given housing’s outsized weight in both the economy and inflation metrics, this moderation should help cushion some of the impact from higher tariffs.
We raised our 2025 inflation forecast in response to the rollout of significantly larger-than-expected tariffs. We now project headline CPI to rise 3.4% and core CPI to increase 3.5%. Tariffs apply to the dutiable value of imported goods—typically tied to production costs and represent a relatively small share of retail prices.
Disclaimer: This publication has been prepared for informational purposes only and is not intended as a recommendation offer or solicitation with respect to the purchase or sale of any security or other financial product nor does it constitute investment advice.
April 10, 2025
Mark Vitner, Chief Economist
Piedmont Crescent Capital
(704) 458-4000
NFIB Small Business Optimism Slips Below Long-Term Average Amid Policy Uncertainty
Sentiment Falters Amid Renewed Uncertainty
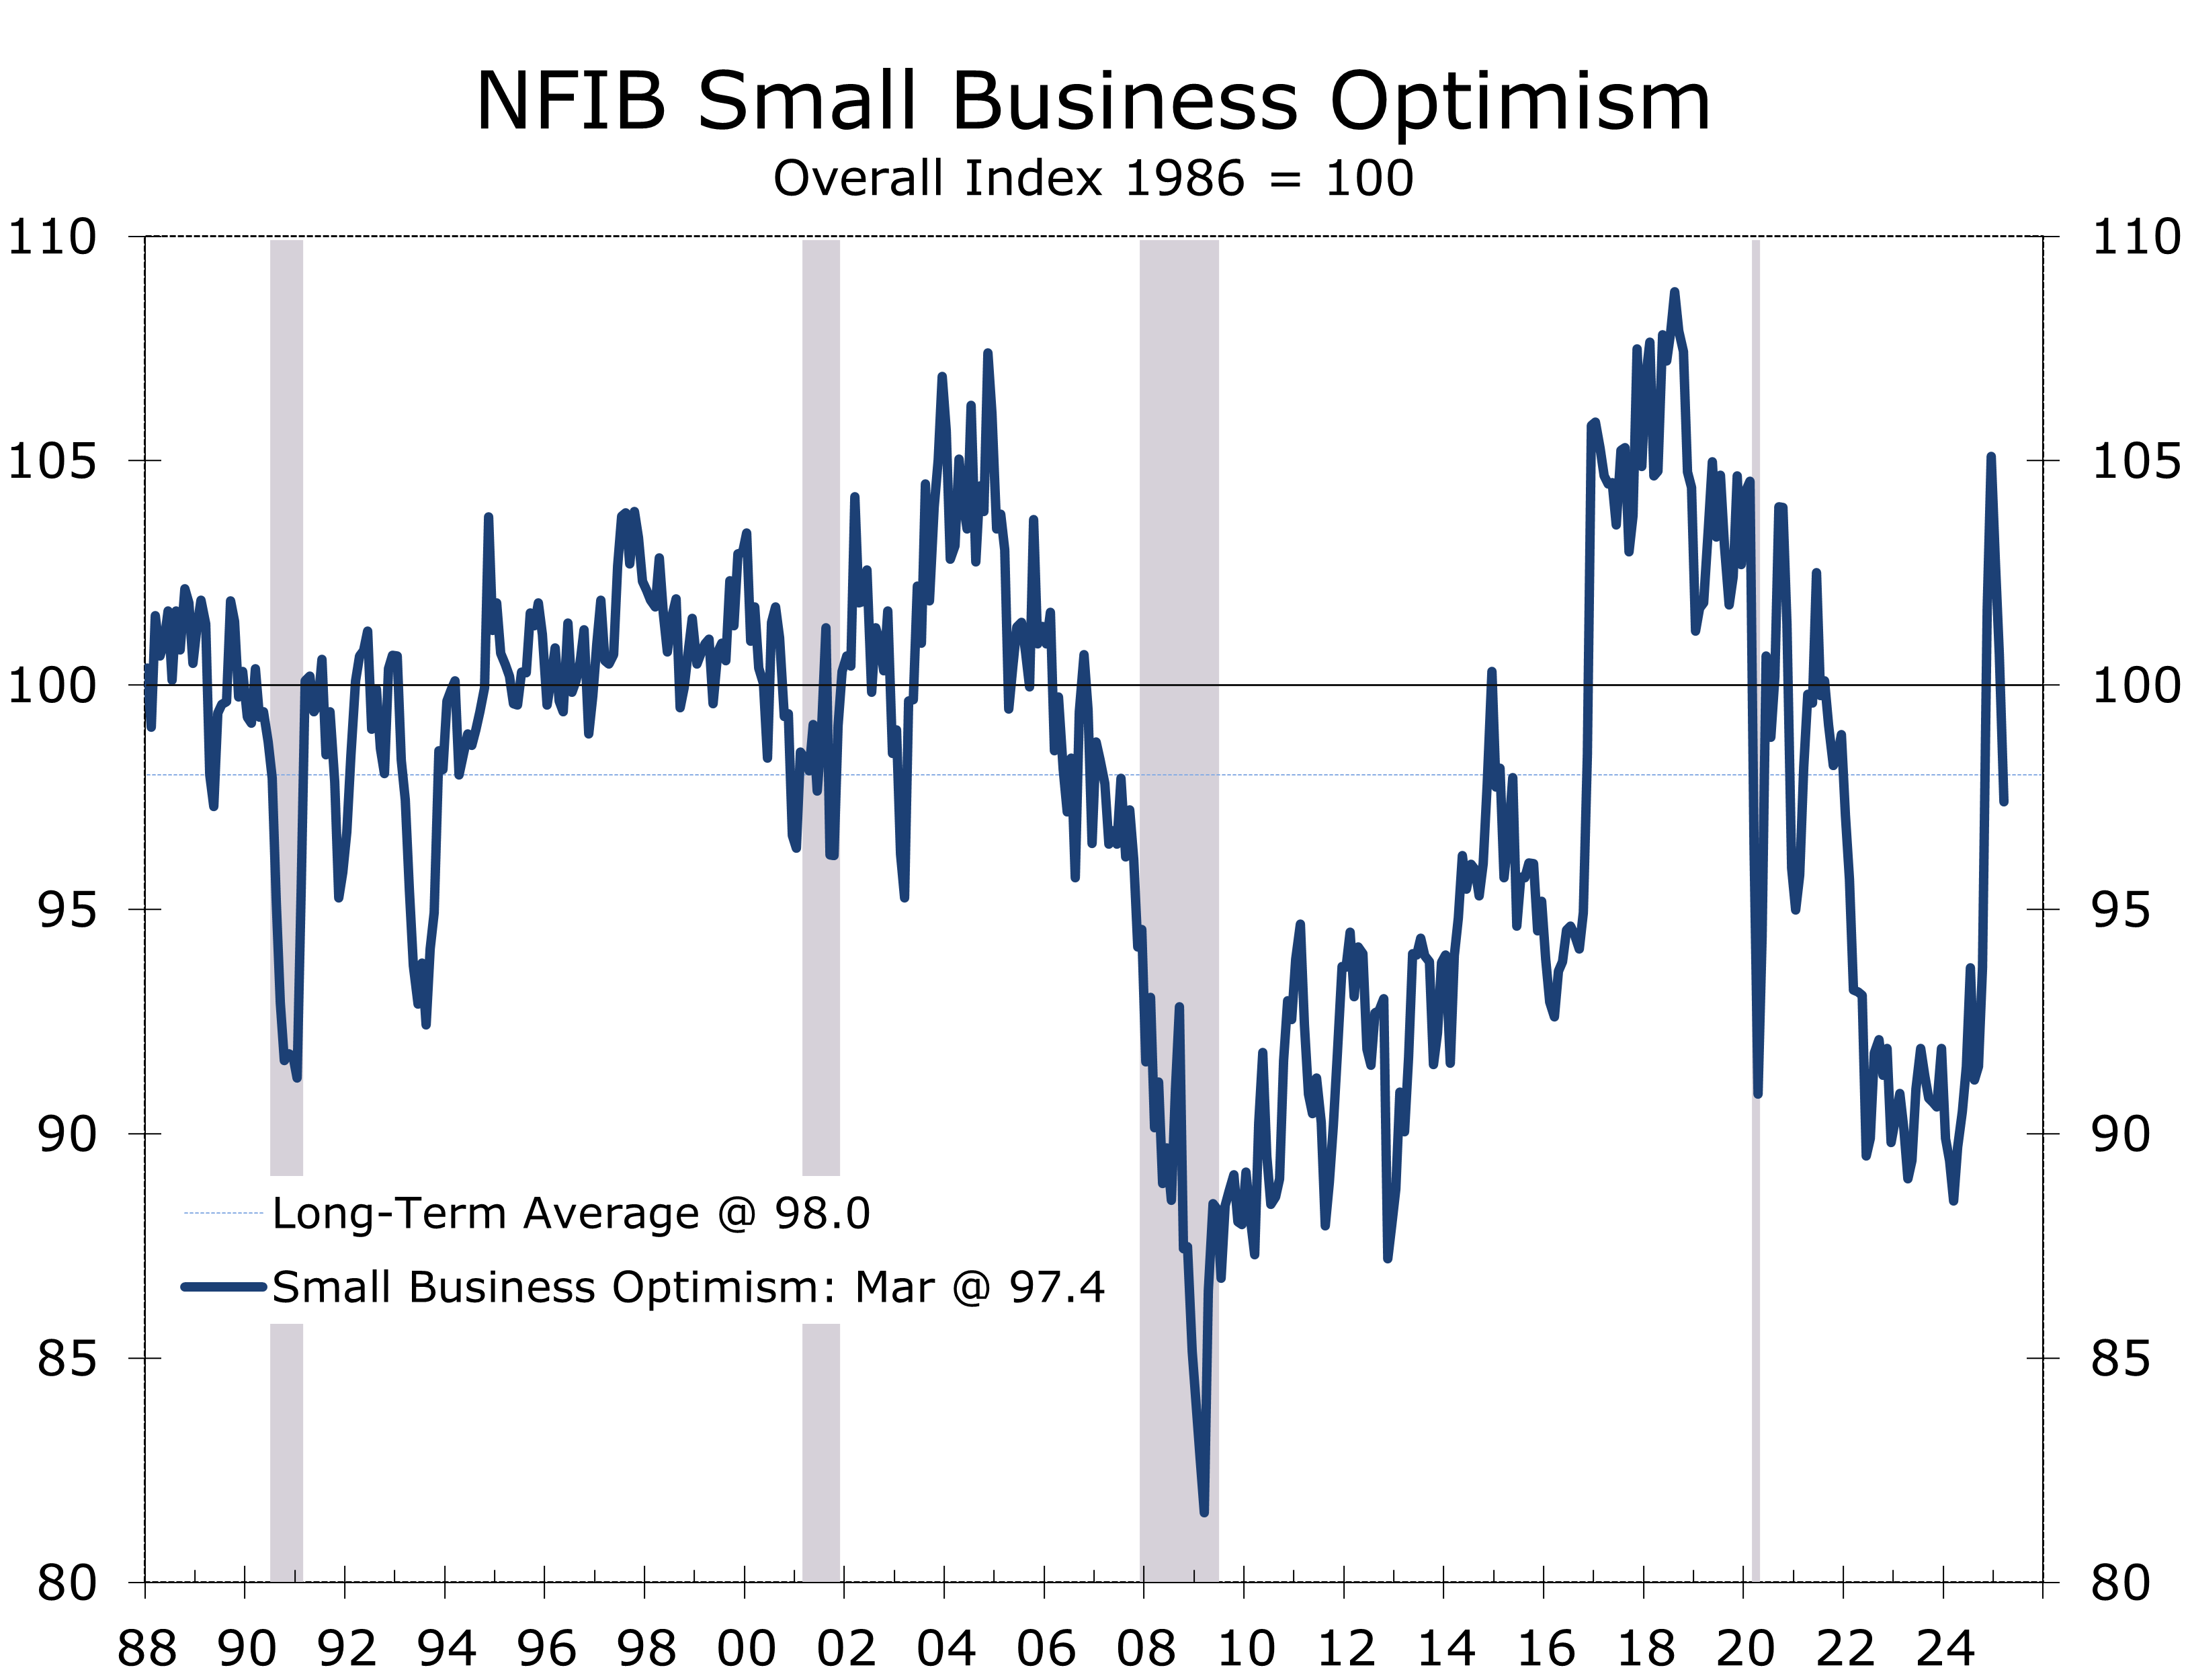
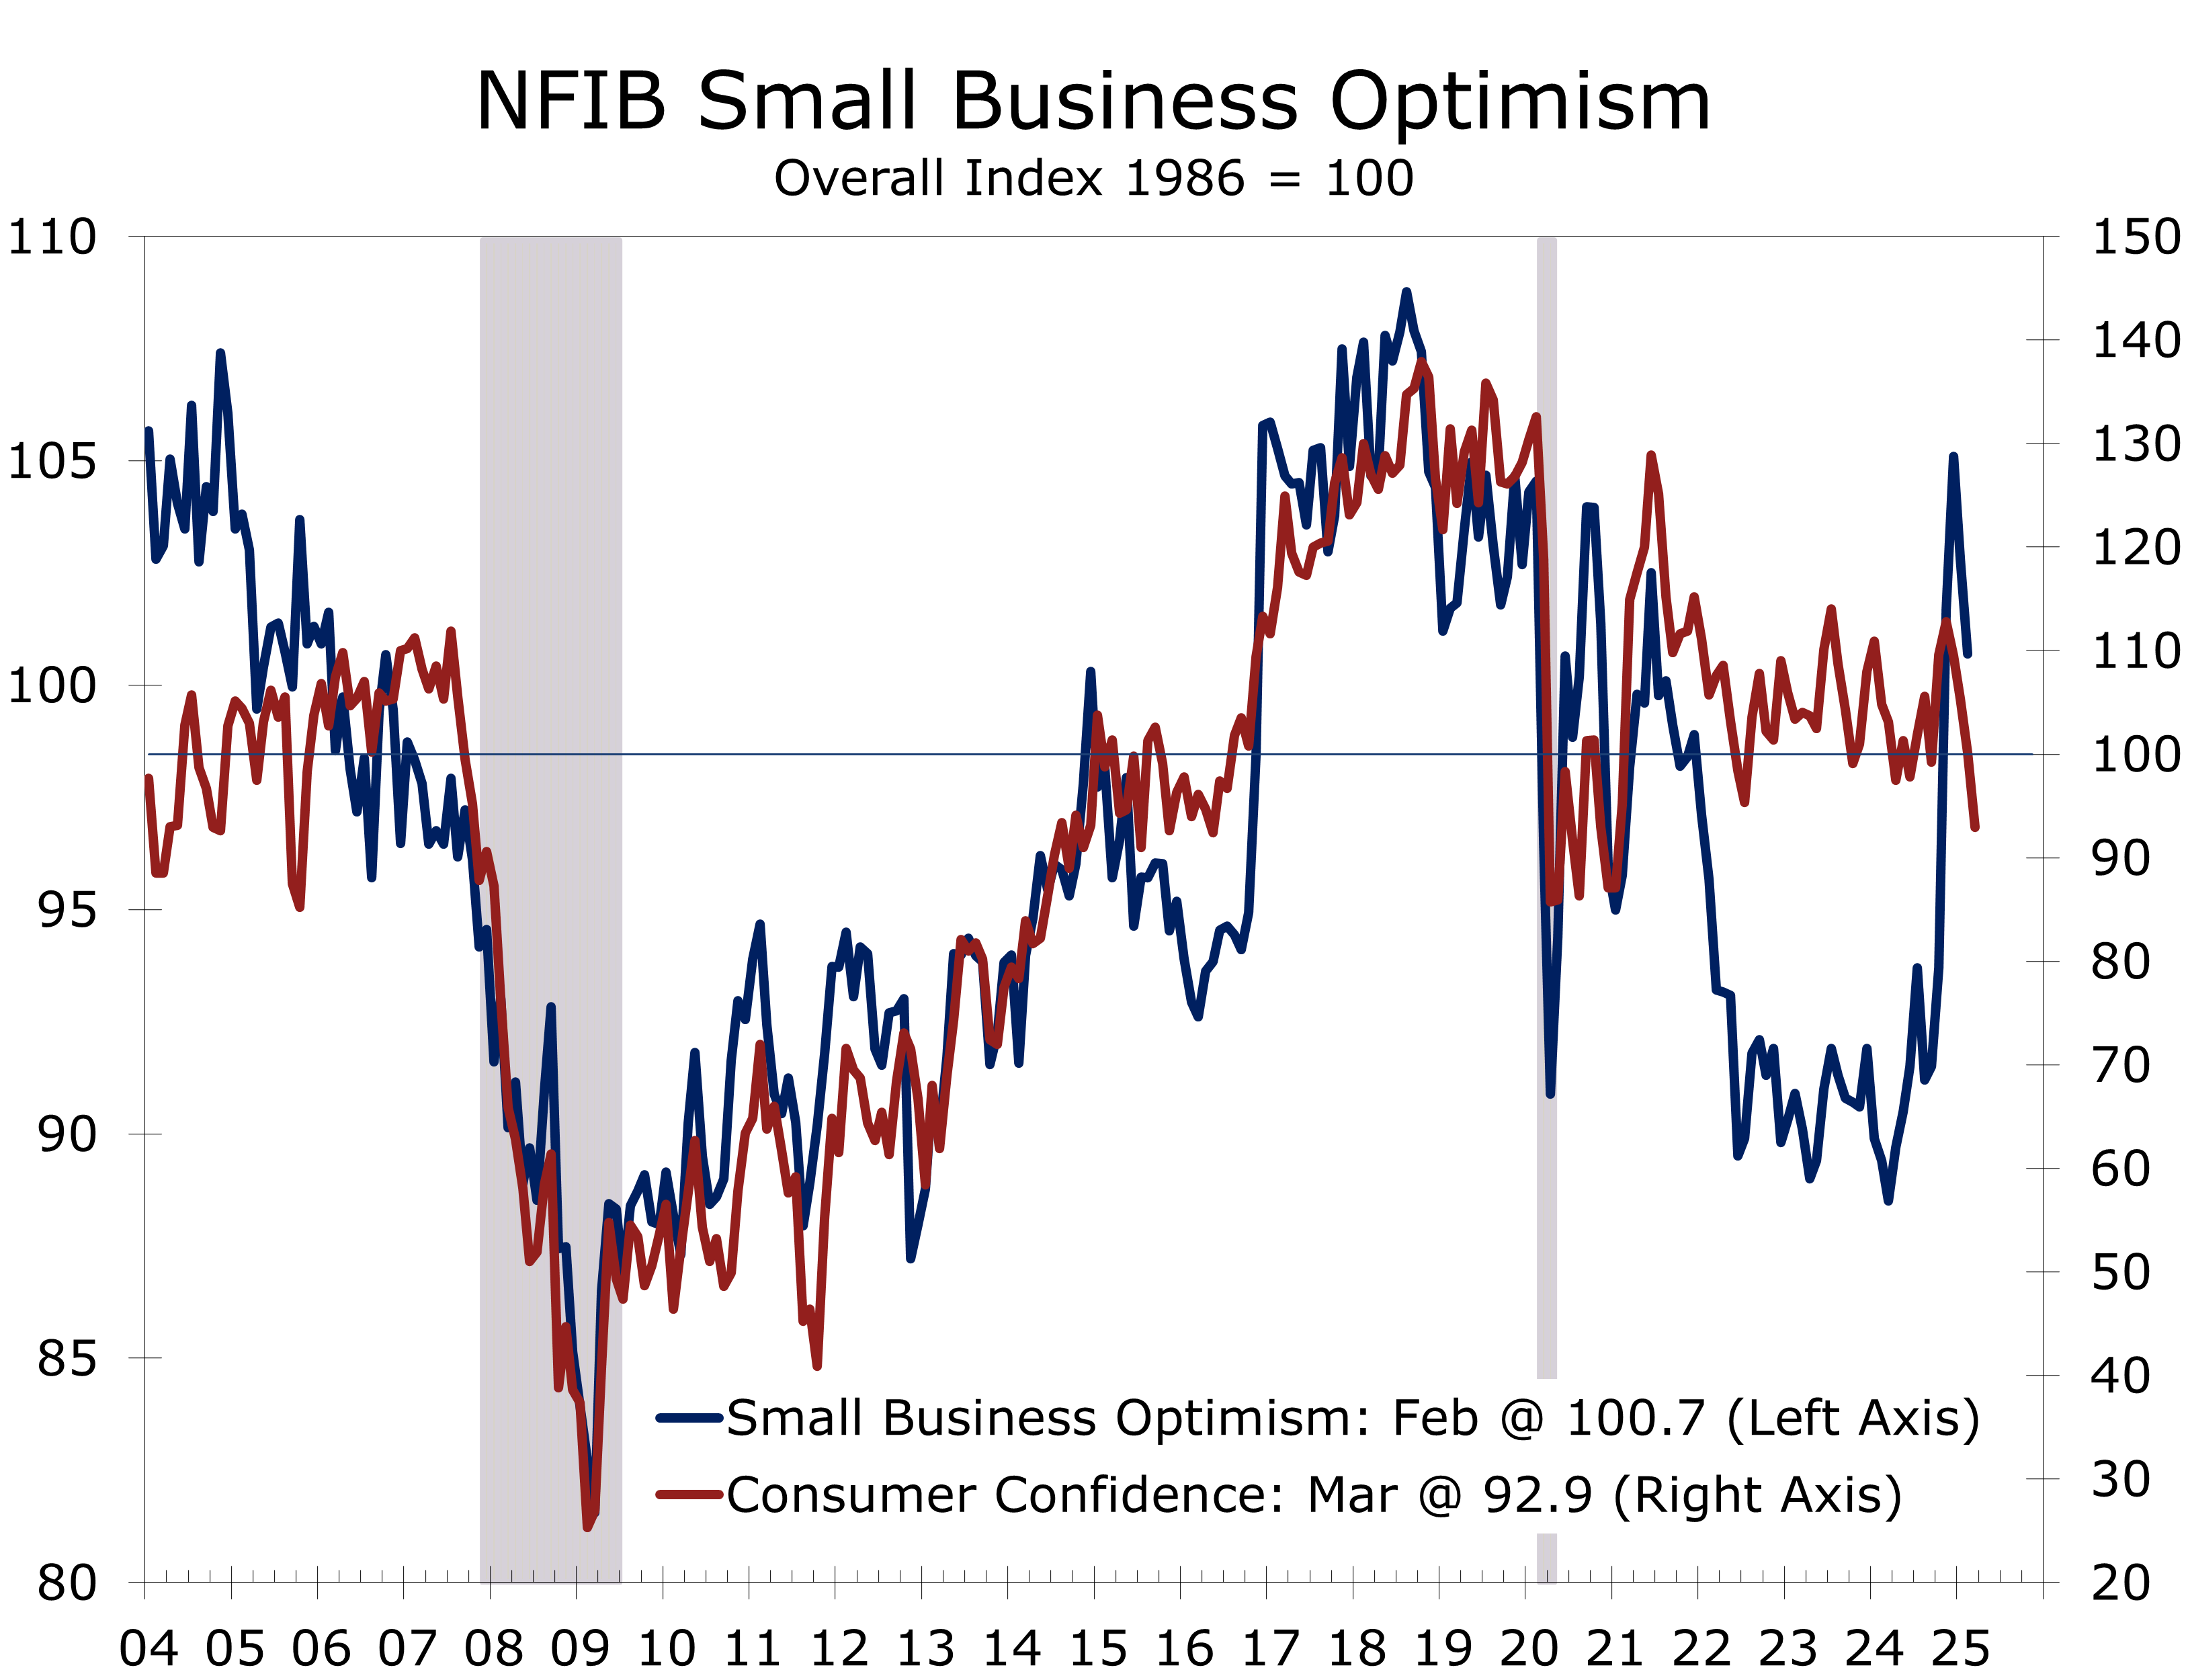
- The NFIB Small Business Optimism Index declined 3.3 points to 97.4 in March, its largest drop since June 2022, and is now slightly below its long-term average of 98.
- Expectations took a big hit, with the share expecting better business conditions plunging 16 points to 21% and real sales expectations tumbling 11 points to 3%.
- Uncertainty remains historically high at 96, despite an 8-point drop in March.
- Job openings rose to 40%, led by gains in construction and transportation, but net hiring plans fell to a one-year low.
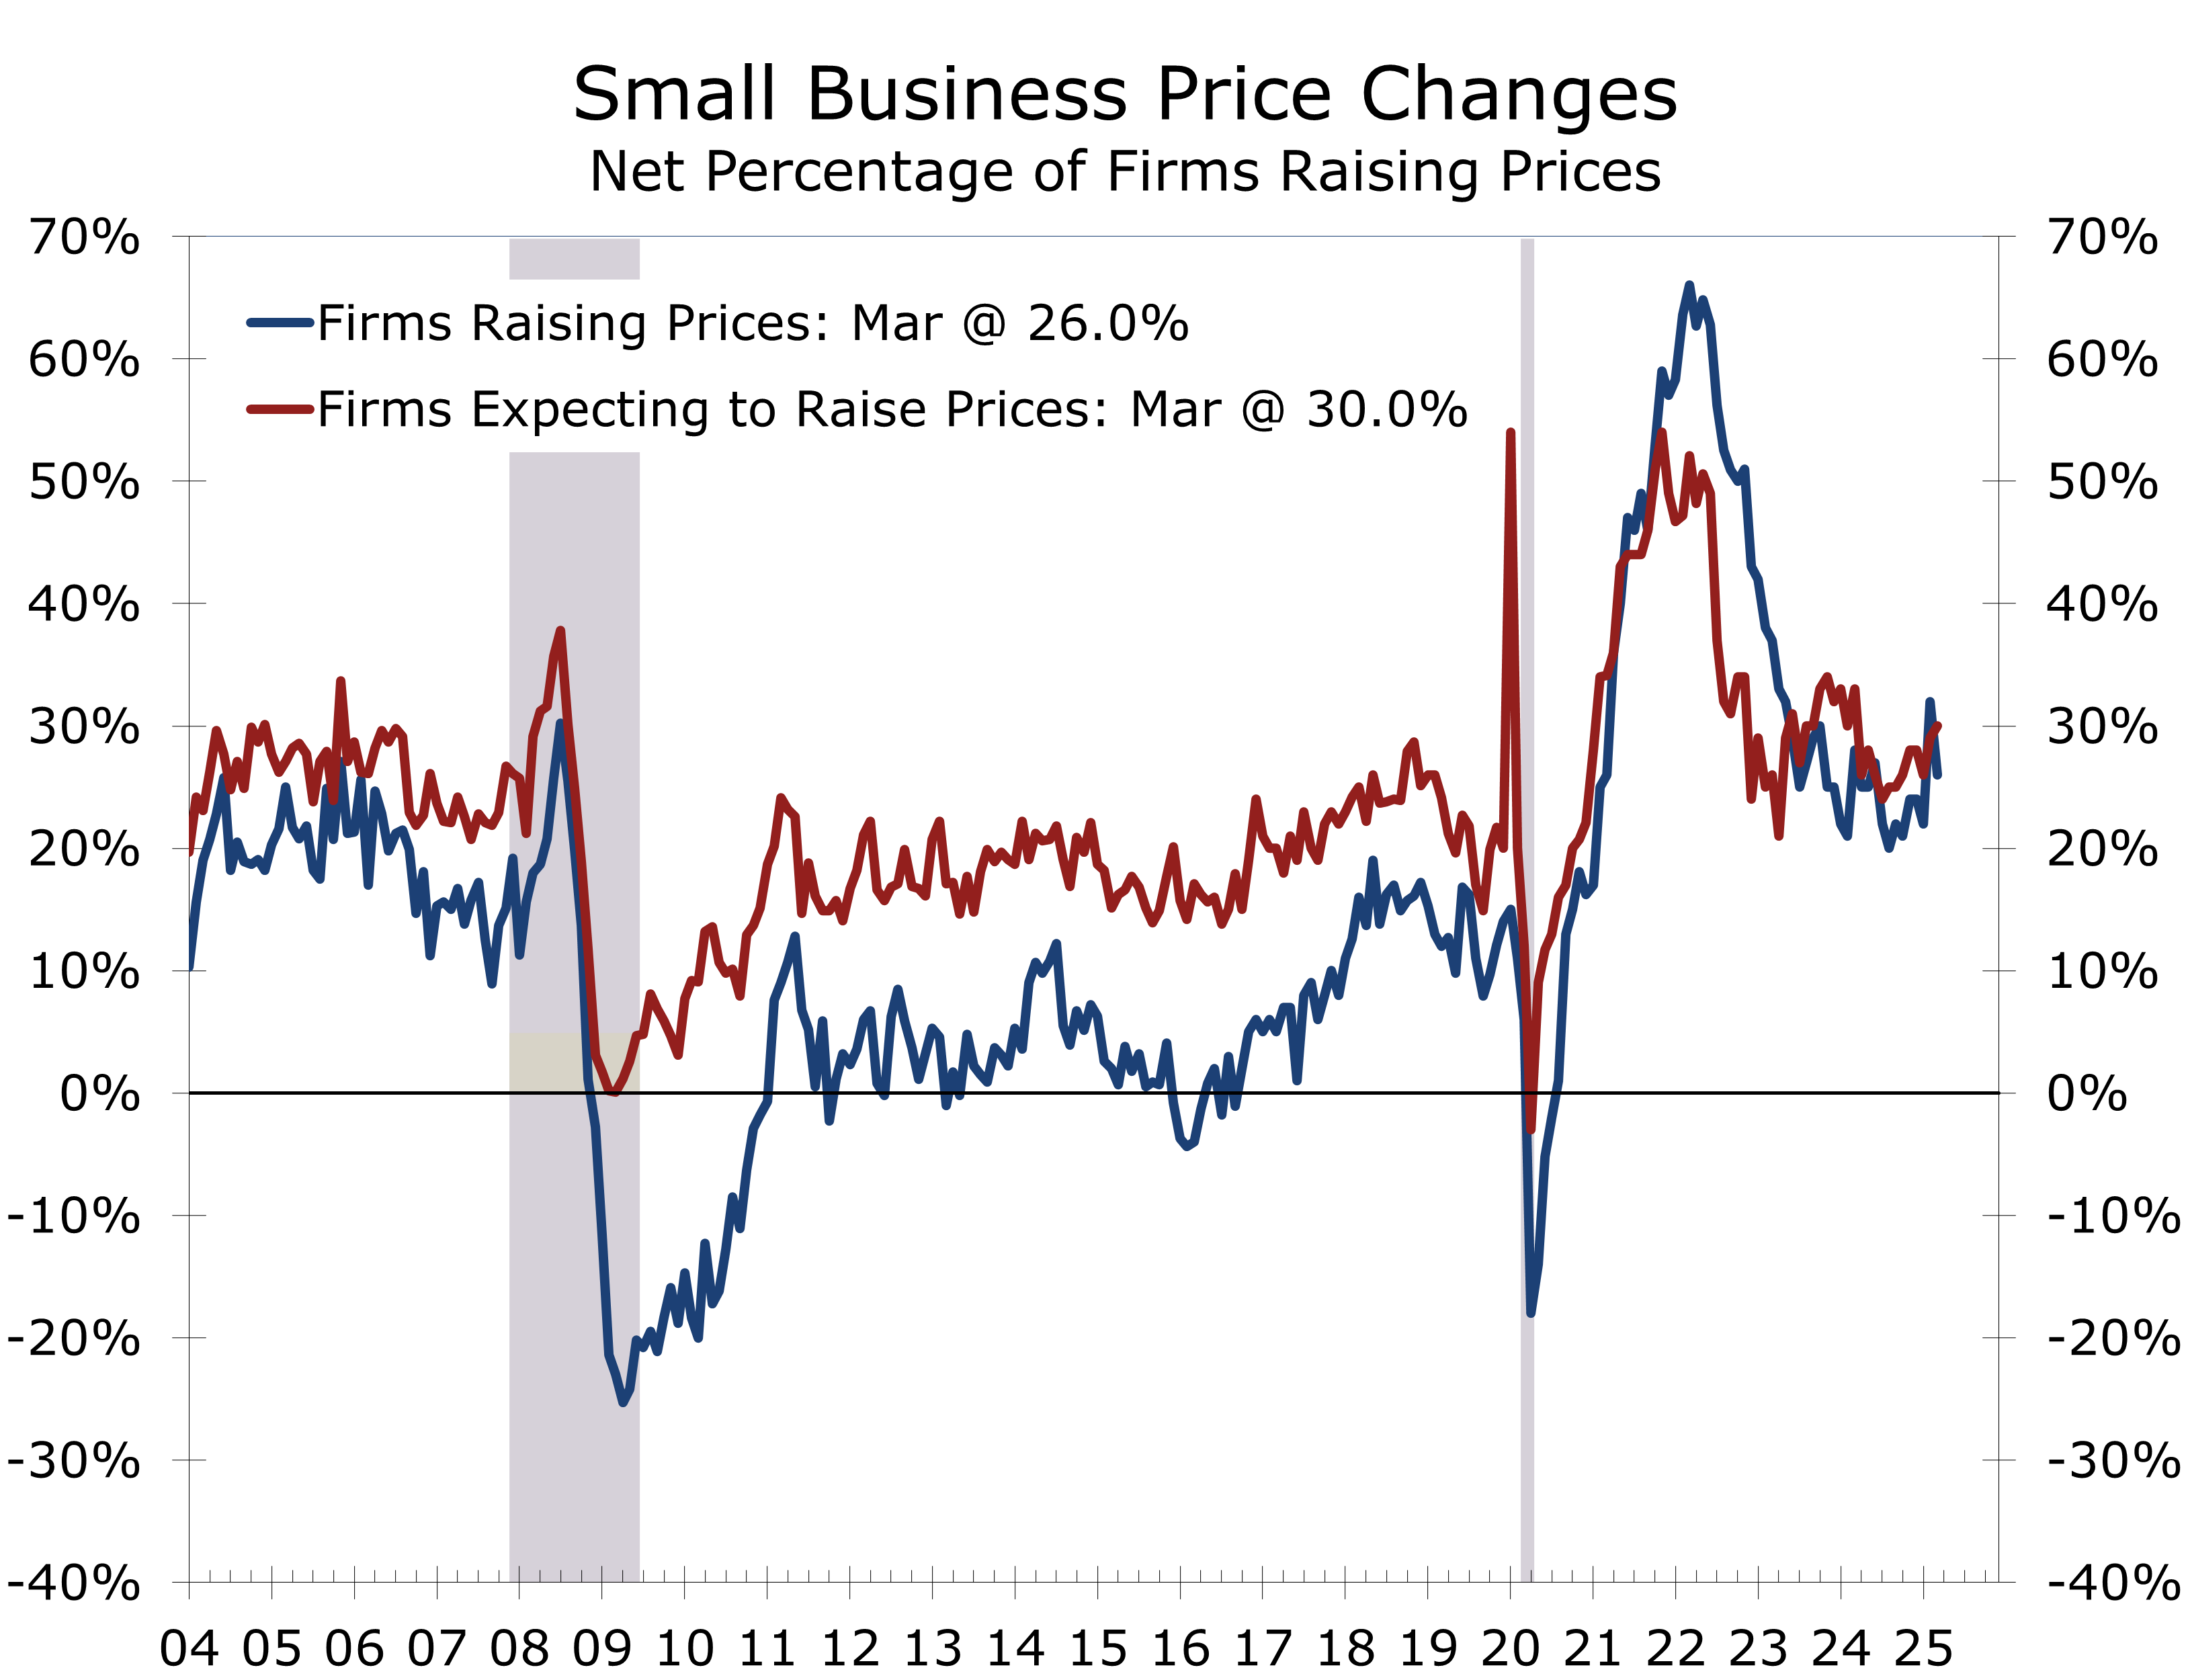
- Twenty-six percent of firms increased their prices, a figure still well above historical averages. Wage increases were widespread, and margin pressure is intensifying.
- Tightening credit conditions are evident as concerns about loan access have surged and short-term interest rates have climbed to 8.9%, suggesting increased financing constraints for small businesses.
- Small business owners were already on edge before unexpectedly large tariffs were announced on April 2. Small businesses have fewer options to offset the impact of tariffs and will likely curtail investment and hiring.
The NFIB Small Business Optimism Index fell 3.3 points to 97.4 in April, the largest monthly pullback since June 2022. The index has now fallen below its 51-year average of 98, retreating further from December’s recent cycle high of 105.1. The March reading underscores a broad-based deterioration, with business owners citing elevated uncertainty tied to domestic policy changes, the rollout of tariffs, and slower-than-expected regulatory relief under President Trump’s second term. While the Uncertainty Index edged down from a near-record 104 to 96, it remains significantly above the long-term norm, reflecting Main Street’s growing unease.
Small Businesses were cautious ahead of the introduction of surprisingly large tariffs in April.
The most significant driver of the headline decline was a 16-point drop in the net percentage of owners expecting better business conditions, now at 21%. Real sales expectations also fell 11 points to 3%. These reversals mark a swift erosion in confidence following December’s surge in optimism. The net percentage of owners viewing the present as a good time to expand fell to 9% (down 3 points), and business health perceptions weakened, with a 2-point decline in those rating conditions as “good.” The sharp pivot highlights how policy signals—especially around trade and regulation—can create rapid sentiment reversals.
Labor demand remains robust. Job openings rose 2 points to 40%, with notable strength in construction (+10 points m/m; +12 y/y) and transportation (+23 points to 53%). Manufacturing openings remained steady, while agriculture and wholesale trade remain softer. Openings for skilled workers rose to 33%, while unskilled job openings remained unchanged at 13%.
While job openings have remained high, actual hiring has slowed and should slow further.
While job openings remained high, actual hiring softened: 14.4% of firms reduced headcount, while just 9.6% added staff. Net hiring plans slipped 3 points to 12%, the lowest level in nearly a year. Compensation pressures remain acute, with 38% of firms raising wages (up 5 points), and 19% planning further hikes.
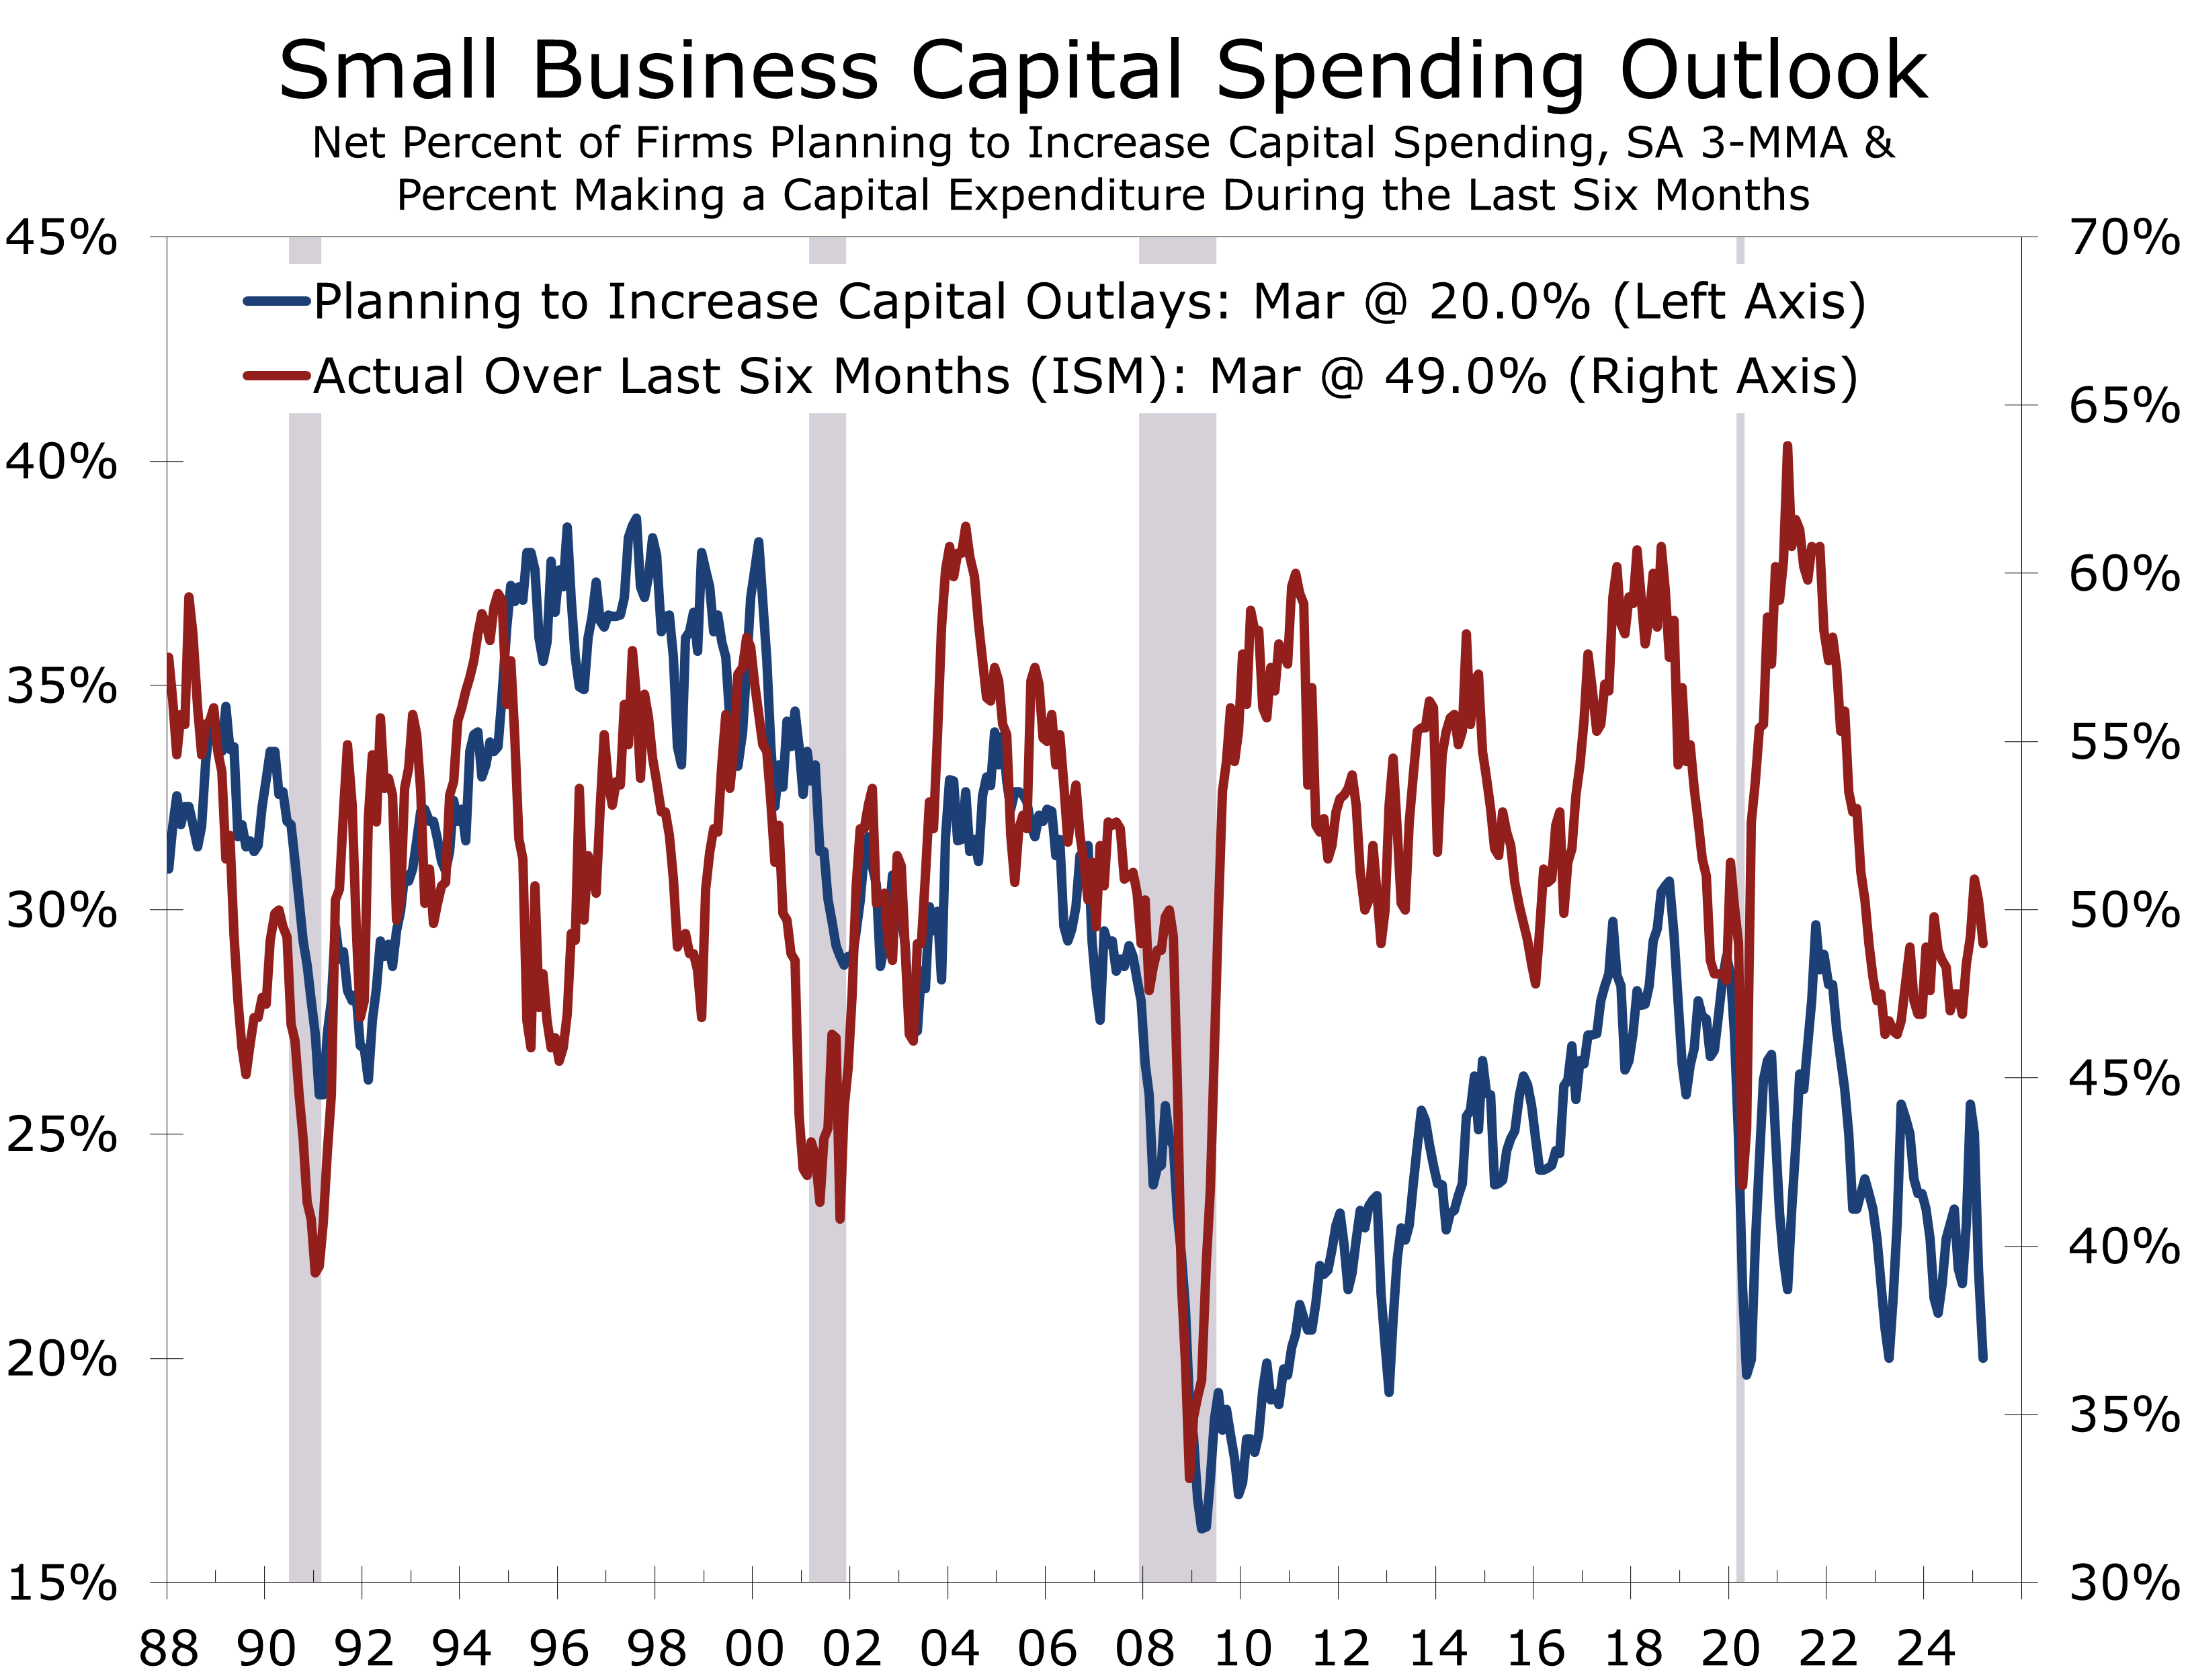
Capital expenditures saw a slight improvement, with 59% of firms reporting spending in the last six months (a 1-point increase). This was driven by a 6-point rise in equipment purchases and a 3-point rise in facility improvements. Vehicle purchases fell 3 points. Future capital spending plans remain cautious, rising 2 points to a historically low 21%. Inventory data also indicates weakness: with a net -3% adding to inventory, and a net -7% stating their current inventory are too low. Planned inventories remained unchanged, aligning with expectations of slowing sales.
While headline inflation has recently retreated, small business owners continue to pass along their higher cost. In March, 26% of firms raised prices (down 6 points), but this remains well above the 8% pre-2020 average. Planned price hikes increased to 30% (up 1 point), but a rising share of firms (10%) cut prices, suggesting some sector-specific softness and providing some early indication of the limits of pricing power.
Small business owners are having difficulty passing along their higher operating costs.
Credit conditions are tightening. The percentage of firms reporting difficulty accessing credit increased 4 points to 6%—the largest monthly rise since September 2023. The average short-term loan rate reached 8.9%, its highest level since early 2007. Despite financing being a top concern for only 3%, tighter credit and higher interest rates are hindering investment and impacting housing-sensitive sectors.
The latest NFIB data aligns with a slowing economy. Business owners were reporting diminished pricing power prior to the unveiling of tariffs. Consequently, investment and hiring are expected to slow, weighing on economic growth this spring and summer.
Disclaimer: This publication has been prepared for informational purposes only and is not intended as a recommendation offer or solicitation with respect to the purchase or sale of any security or other financial product nor does it constitute investment advice.
April 8, 2025
Mark Vitner, Chief Economist
Piedmont Crescent Capital
(704) 458-4000
Liberation Day Marks A Major Shift in U.S. Trade Policy with High Economic Stakes
Liberation Day Tariffs & Implications
- President Trump’s "Liberation Day" initiative places a 10% tariff on all U.S. imports, with additional reciprocal tariffs of up to 49% targeting trade deficit-heavy nations.
- The administration aims to reduce the trade deficit, reshore manufacturing, and enhance national security by reducing reliance on foreign supply chains in critical industries.
- Early indicators suggest economic fallout, rising inflation, and declining business confidence, with reduced expectations for growth amid fears of retaliatory tariffs.
- Our initial analysis is that tariffs will be more disruptive to the U.S. economy and will likely prompt a response from key trading partners.
- We have further reduced our forecast for 2025 economic growth and raised our inflation forecast. The impact on consumer prices is likely to be less than feared, however.
- We remain optimistic that current trade turbulence will drive a necessary update to the post-World War II trading system and a reworking of NAFTA/USMCA to ensure a better deal for the U.S., Canada and Mexico.
President Trump’s “Liberation Day” tariff initiative represents a major shift in U.S. trade policy. Implemented under the International Emergency Economic Powers Act (IEEPA), the plan declares a national emergency to address unfair trade practices and persistent trade imbalances. The policy establishes a minimum 10% tariff on all U.S. imports, while additional reciprocal tariffs of up to 49% target countries with substantial trade surpluses with the U.S., including Cambodia (49%), South Korea (25%), and the European Union (20%).
Additional executive actions include:
- A 25% tariff on light vehicles (effective April 3).
- A 20% tariff on Chinese imports.
- 25% tariffs on steel and aluminum, with tariffs on key auto parts phased in by July.
Liberation Day is aimed at correcting the nation’s large structural trade imbalance.
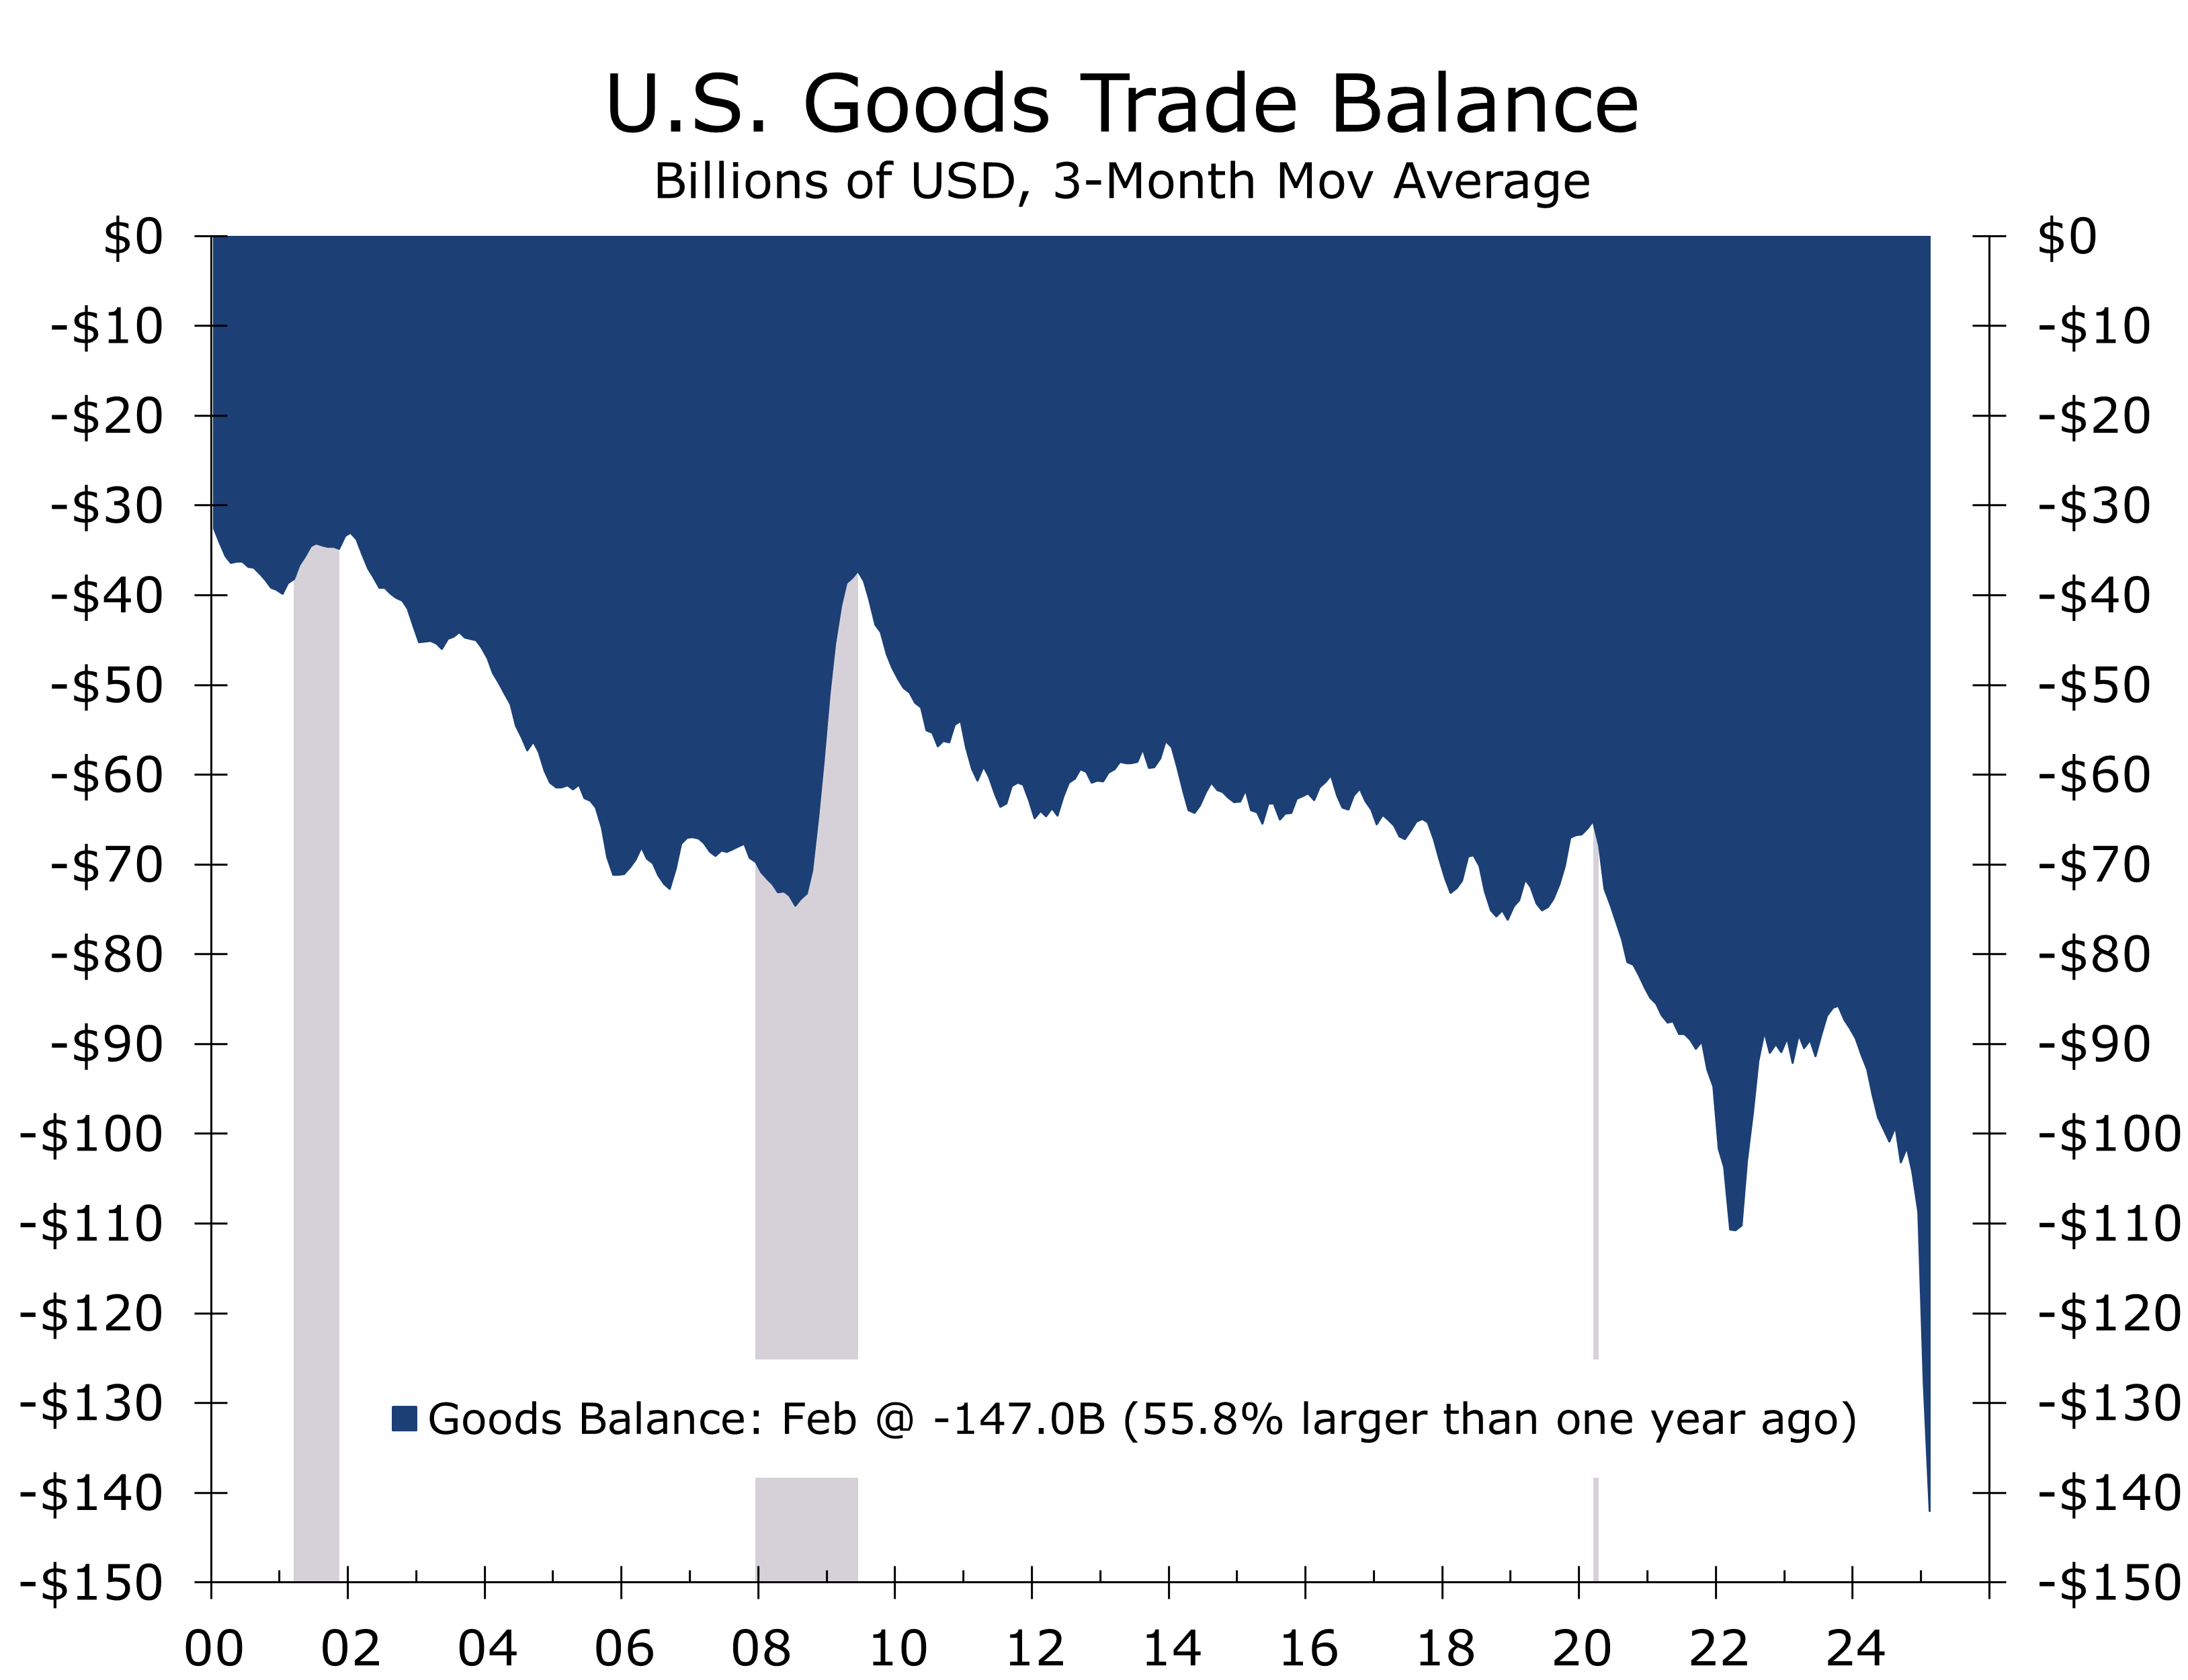
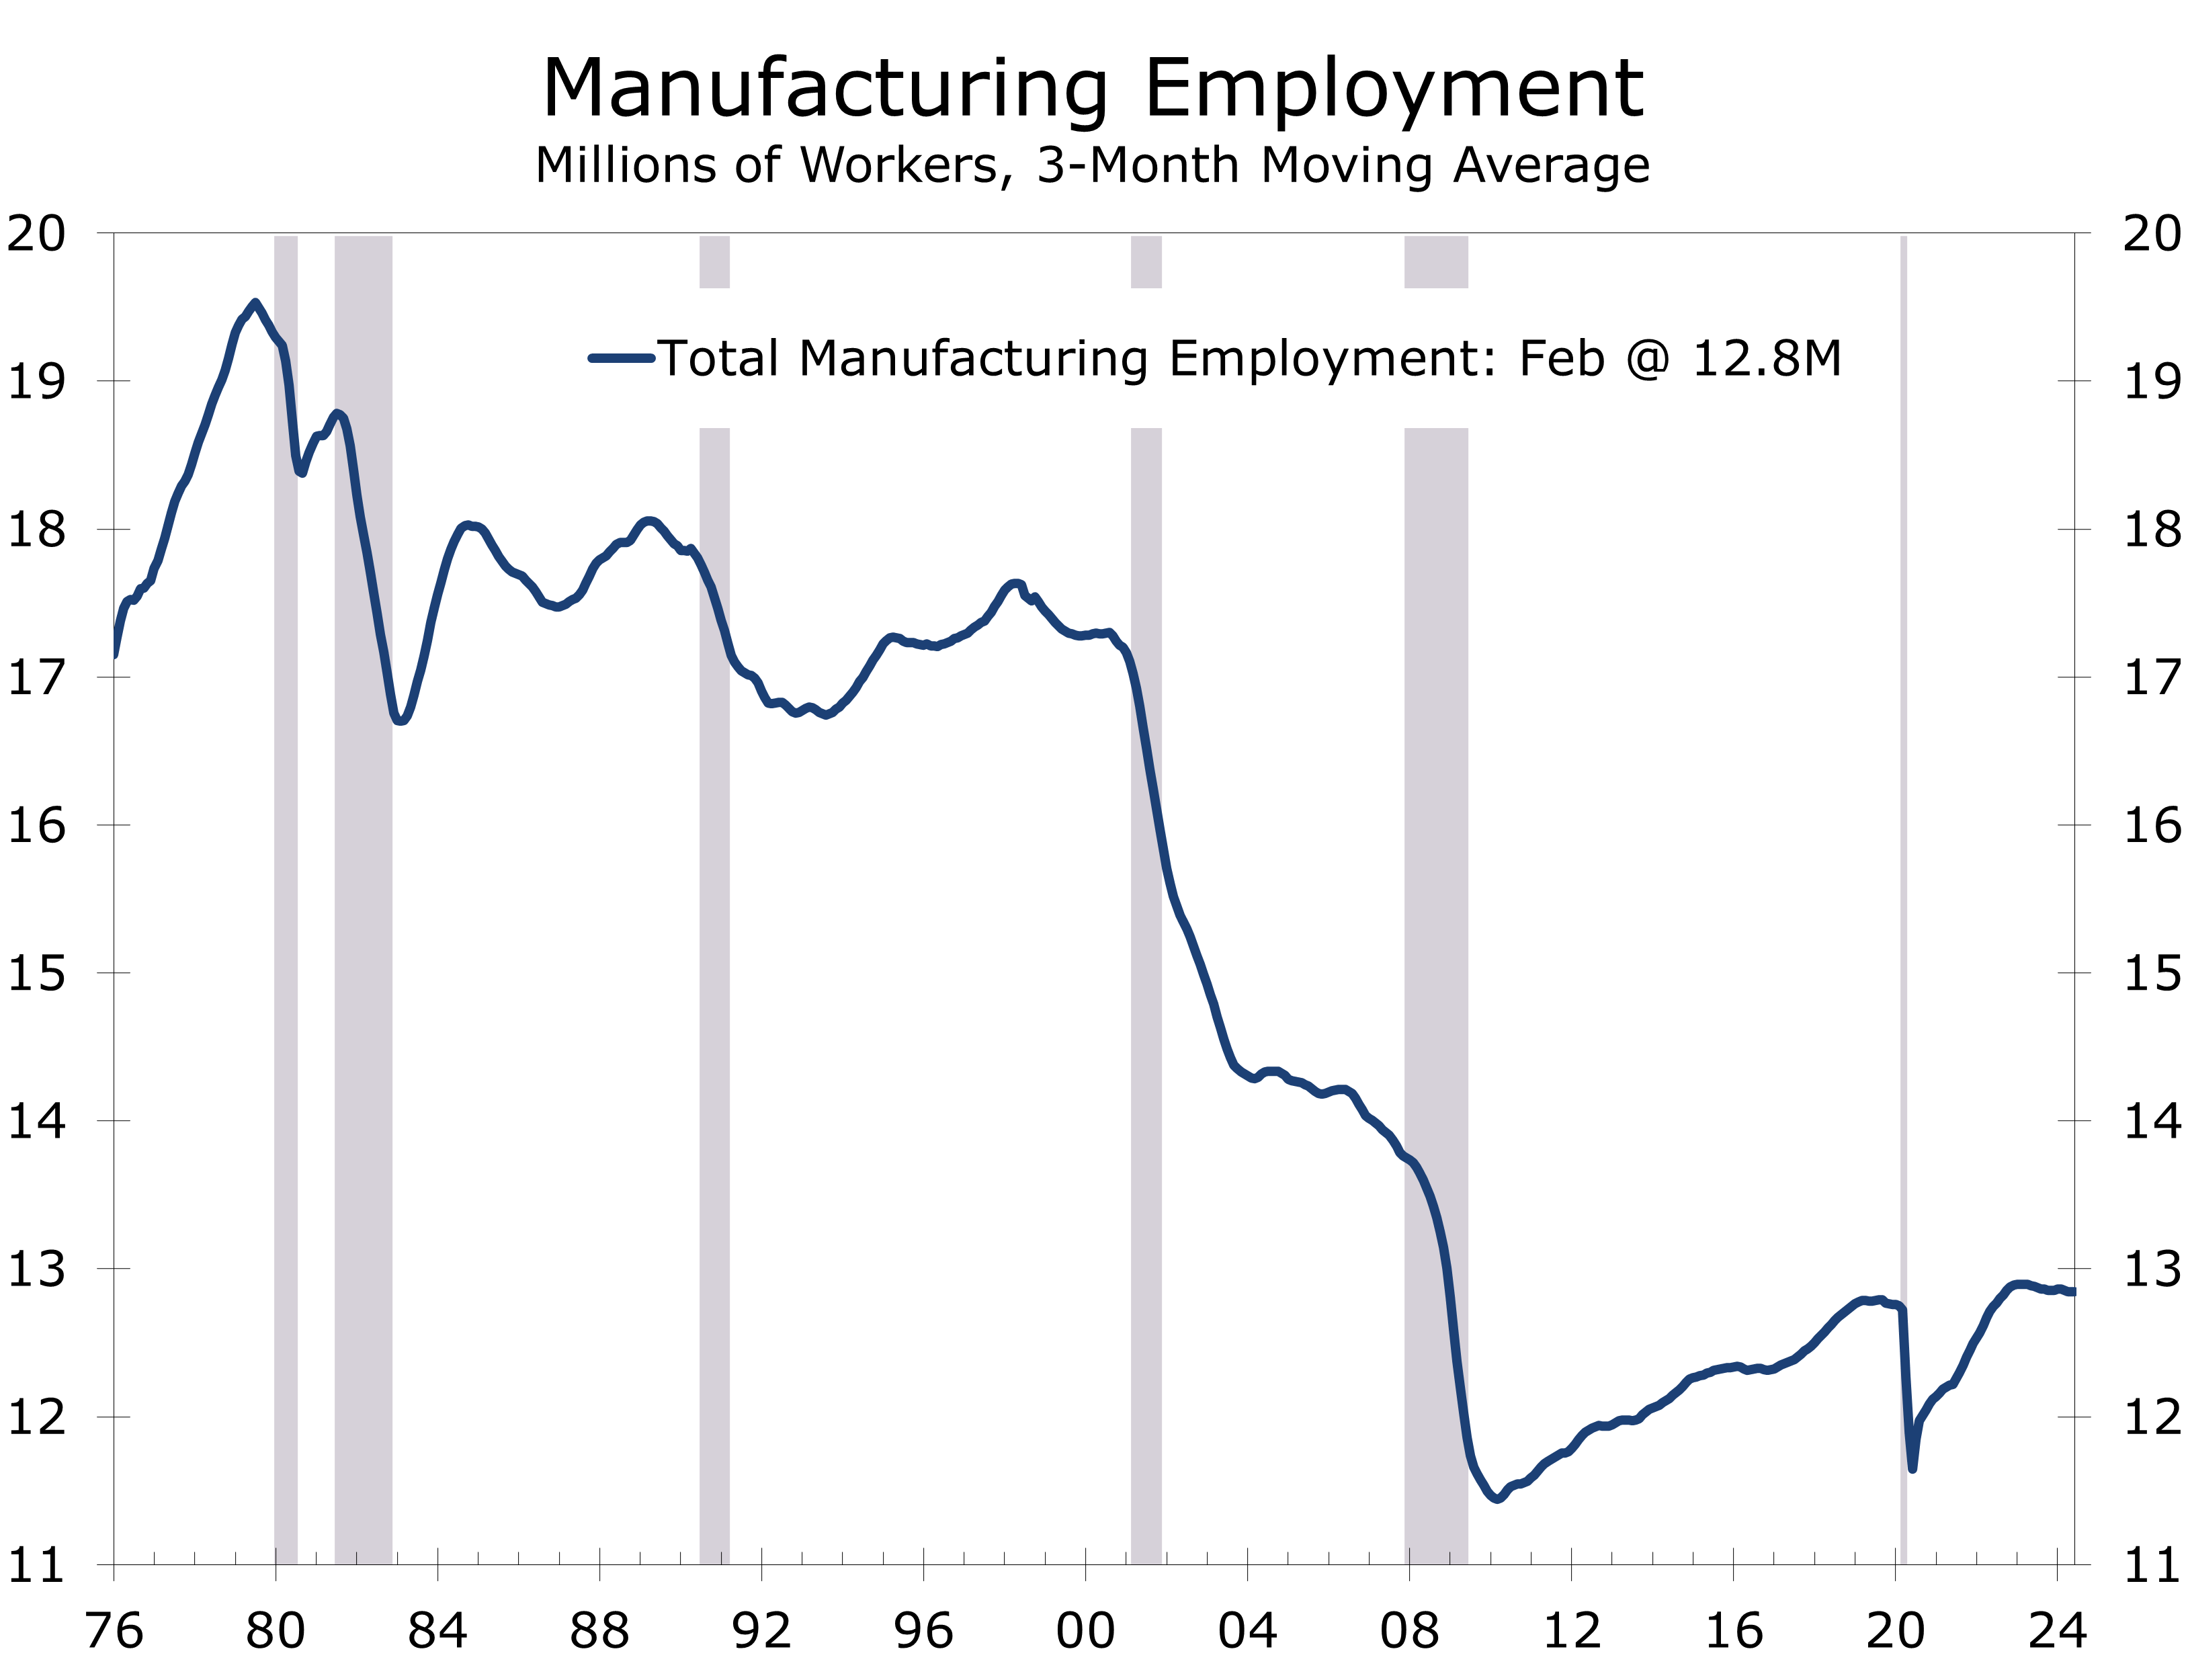
“Liberation Day” is aimed at correcting the nation’s structural trade imbalances. The U.S. trade deficit in goods reached $1.2 trillion in 2024, and manufacturing’s share of GDP declined from 28.4% in 2001 to 17.4% in 2023, contributing to the loss of 5 million manufacturing jobs since 1997. The auto sector alone posted a $93.5 billion trade deficit in 2024, underscoring the push for reshoring production.
The initiative also aims to promote fair trade by addressing tariff disparities, such as the U.S. 2.5% tariff on passenger vehicles compared to the EU’s 10% and India’s 70%. Eliminating these gaps could increase U.S. exports to India by $5.3 billion and generate $18 billion annually in remanufactured goods.
National security concerns also factor into the policy. The administration aims to reduce reliance on foreign supply chains in critical sectors such as autos, pharmaceuticals, and microelectronics. The U.S. auto industry is operating at just 68.4% capacity, below its historical average of 74.9%. Other concerns include counterfeit goods, which cost the U.S. economy between $225 billion and $600 billion annually, and unfair trade practices such as currency manipulation and value-added tax (VAT) policies, which purportedly cost U.S. firms over $200 billion per year.
We remain optimistic that the current trade turbulence will prompt a much-needed update to the post-World War II trading system. The world is currently navigating a post-Cold War era under an outdated framework designed reflecting a different economic landscape. NAFTA and the USMCA, originally established to create a competitive trading bloc in response to China’s rise, must be reworked to prevent China from benefiting more than the U.S., Canada, and Mexico. Additionally, a robust strategy to address steel transshipments must be developed and enforced.
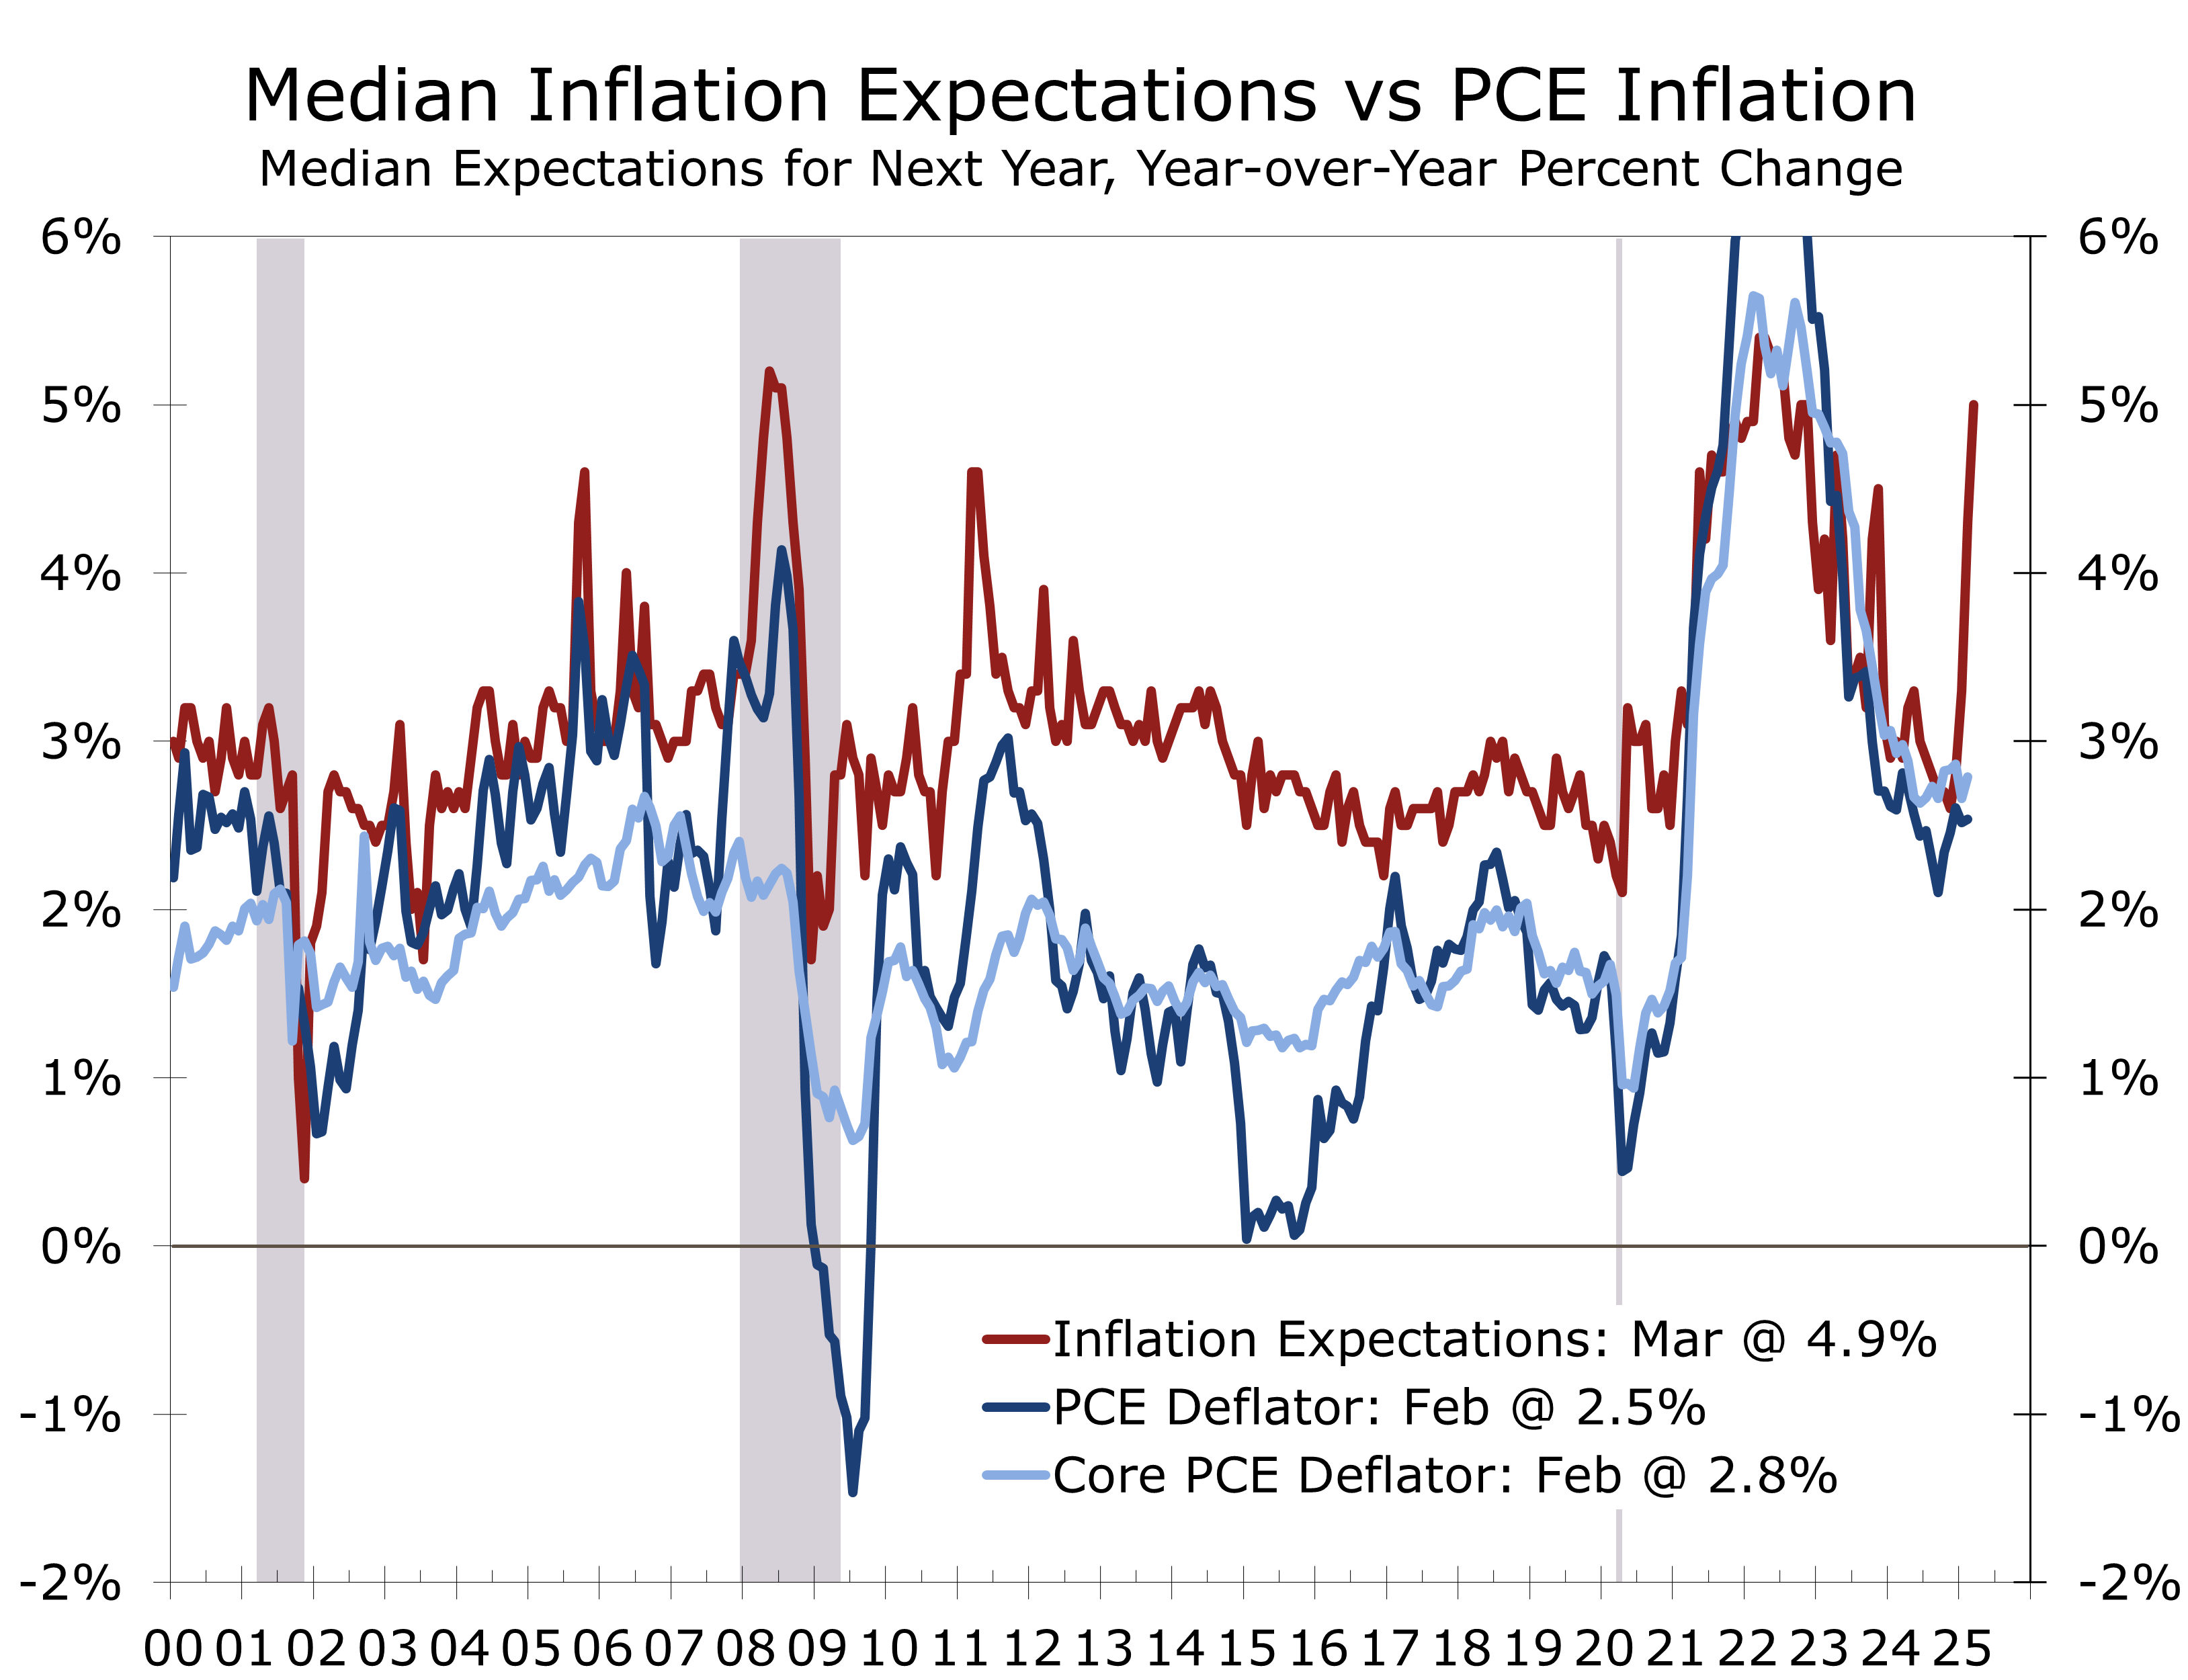
The economic fallout from “Liberation Day” is already evident. Despite contested studies predicting stronger GDP growth and job creation, early signs show negative implications. The Federal Reserve lowered its economic outlook in March, while boosting their inflation projections. Consumer and business confidence have also dropped sharply due to concerns over retaliatory tariffs and supply chain disruptions, while inflation expectations have spiked.
Our analysis indicates that the new tariff structure may be more disruptive than expected. The higher-than-anticipated tariff rates, even with exemptions, could burden the U.S. economy. Reshoring production will take time, causing short-term cost increases before domestic industries can scale up. Moreover, the uneven treatment of trade partners and targeted measures against China and the EU raise the risk of escalatory responses.
Tariffs are a blunt and infrequently used economic tool, often offering short-term benefits that fail to address underlying structural competitive issues. While unfair trade practices exist, they are not the primary cause of the U.S. trade imbalance. The Trump administration views the tariff rates as a negotiation tactic to secure lower tariffs through bilateral agreements, but this outcome seems overly optimistic, contributing to global market volatility and increased economic uncertainty.
The 10% minimum tariff is designed to be permanent and potentially could generate $300 billion annually. Imports will likely fall, however, so the tariff duties would likely be less. The revenue would help reduce the deficit or provide tax relief and can be at least somewhat justified, given the U.S. Navy’s outsized role in protecting global trade routes, ensuring freedom of navigation that otherwise would be more uncertain and costly to transit.
Tariffs are based on the dutiable value, which is typically much lower than the retail price.
Tariff Impact on Consumer Goods:
It is essential to note that tariffs apply to the landed value of imports, excluding shipping, insurance, and financing costs. For clothing, the dutiable value typically represents only 10% of the retail price, while for automobiles, it accounts for about 65%.
For a $50,000 imported car subject to a 25% tariff:
- The dutiable value is approximately $32,500 ($50,000 × 0.65).
- The tariff adds $8,125 ($32,500 × 25%).
- If fully passed on, the price could rise to $58,125, a 16.25% increase.
However, the actual impact may be lower. Some consumers may shift to domestic models, while others may delay purchases, waiting for market conditions to stabilize. Additionally, manufacturers and dealers might absorb part of the cost, making actual price increases more variable.
For smartphones, where tariffs on Chinese and Vietnamese imports were unexpectedly high, the dutiable value is typically $350–$400 per unit (about 50% of retail price). A 46% tariff would add approximately $175 to an $800 smartphone if fully passed on.
Revised Economic Outlook:
Ultimately, we remain optimistic that the current trade turbulence will prompt a much-needed update to the post-World War II trading system. We have long argued that the world is navigating a post-Cold War era under an outdated framework designed for a different economic landscape. NAFTA and the USMCA, originally established to create a competitive trading bloc in response to China’s rise, must be reworked to prevent China from benefiting more than the U.S., Canada, and Mexico. Additionally, a robust strategy to address steel transshipments must be developed and strictly enforced.
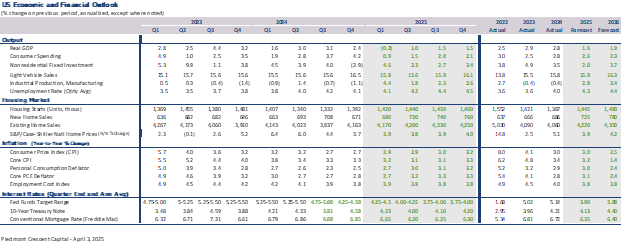
Given February’s soft consumer spending data and the continued decline in consumer confidence, we now forecast Q1 2025 real GDP to contract by 0.2%. The Atlanta Fed’s GDPNow model projects a 0.5% decline (gold-adjusted basis), with surging gold imports exaggerating the trade deficit’s drag. Imports of consumer goods and industrial materials have surged more than 55% over the past year, with much of that increase in the past three months – which may slice as much as 3 points off Q1 GDP growth.
For 2025, we have lowered our 2025 GDP growth forecast to 1.1% on a Q4-to-Q4 basis, 0.5 percentage points below the Fed’s latest projection. This implies a 0.5 percentage point rise in the unemployment rate. Inflation is also expected to run 0.5 percentage points higher, with the core PCE deflator projected to rise 3.3% in 2025. Despite higher inflation, we still expect the Federal Reserve to cut rates three times this year. We assign a 35% probability of recession—more than one in three, but still below an even likelihood.
Disclaimer: This publication has been prepared for informational purposes only and is not intended as a recommendation offer or solicitation with respect to the purchase or sale of any security or other financial product nor does it constitute investment advice.
April 3, 2025
Mark Vitner, Chief Economist
Piedmont Crescent Capital
(704) 458-4000
Uncertainty Continues to Cloud the Outlook
Economic Uncertainty in 2025: Trade, Jobs, and Growth
- Concerns over President Trump’s various tariff initiatives and efforts to reduced government spending have led to heightened uncertainty, which has weighed on consumer and business confidence. This has led businesses to increase imports, postpone investments, and reduce hiring, ultimately resulting in significantly lower forecast for GDP growth this year.
- The Federal Reserve's initial assessment of President Trump's tariff increases indicates that core PCE inflation is projected to rise 3.0% in 2025, a 0.5 percentage points faster than their previous forecast. Simultaneously, the median GDP growth estimate for 2025 was lowered by 0.4 percentage points to 1.7%. Chair Powell also made note of heightened uncertainty apparent in the economy today, and implied that the Fed would proceed cautiously.
- While increased inflation and decreased GDP growth forecasts have raised stagflation concerns, these worries are likely premature, as both inflation and unemployment remain historically low. We define stagflation and provide some benchmarks that provide some context to assess this threat. We also examine the risks of recession by various measures.
- Tighter U.S. immigration policy has significantly reduced net immigration into the U.S., which is weighing on labor force and employment growth. Industries that are expected to be most impacted include leisure and hospitality, construction, healthcare and agriculture. Overall job growth is expected to slow in coming months, reflecting the smaller contribution from immigrants and reduced hiring by the federal government.
- Geopolitical risks remain high and will continue to influence the outlook. Progress on a ceasefire between Russia and Ukraine has been modest but remains promising. Israel has halted aid into the Gaza strip, renewed air attacks on Hamas and moved troops back into Gaza. The U.S. has also increased attacks on the Houthi’s and is moving two carrier groups to the area. One key near-term risk is that Israel moves to destroy Iran’s nuclear weapons facilities, which might lead to some disruptions in oil supplies from the Middle East and higher global oil prices. Tariffs remain the dominant geopolitical concern, with hopes rising for a lighter touch on reciprocal tariffs.
- We are now looking for real GDP to grow at just a 0.8% pace in the first quarter and just 1.9% for 2025 as a whole, on a calendar year basis. On a fourth quarter to fourth-quarter basis, our 2025 forecast is slightly below the Fed’s, at just 1.6%. Job growth is expected to weaken notably over the next few months, which we believe will open the door for two quarter-point rate cuts this summer, and possibly a third this fall.
The March Federal Open Market Committee (FOMC) meeting reaffirmed the Federal Reserve’s cautious, data-dependent approach, holding the federal funds rate steady at 4.25%-4.5% while slowing the pace of quantitative tightening (QT). The Fed also announced the runoff of maturing Treasury securities will decline from $25 billion to $5 billion per month, while mortgage-backed securities runoff remains at $35 billion. This adjustment reflects the Fed’s intent to maintain ample liquidity while navigating evolving economic risks. With growth moderating and inflation proving more persistent, the FOMC remains comfortable waiting to assess the full impact of recent and upcoming policy shifts before making further adjustments.
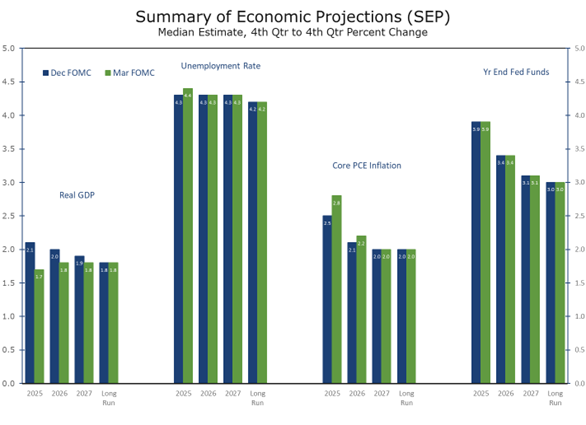
The Fed’s updated Summary of Economic Projections (SEP) suggests a more stagflationary outlook. The 2025 GDP growth forecast was downgraded to 1.7% from 2.1%, while core PCE inflation expectations rose to 2.8% from 2.5%. Despite the median dot plot continuing to signal two 25-basis-point rate cuts in 2025, a growing number of FOMC participants now see fewer cuts, with eight members expecting less than 50 basis points of easing. Chairman Powell acknowledged the rise in short-term inflation expectations, particularly in response to tariffs, but emphasized that a hawkish pivot would require a broader and sustained unanchoring of long-term inflation expectations. While the University of Michigan’s measure of long-term inflation expectations has increased, Powell downplayed its significance, noting that other indicators remain stable.
Financial markets responded positively to the Fed’s measured approach, with the 10-year Treasury yield initially declining by 10 basis points and equities rallying. The financial market’s improved post-meeting tone has carried over, even amidst continued volatility on various tariff proposals. The decision to slow QT is expected to provide additional support to the economy, particularly by keeping long-term yields in check, which may offer relief to the housing market as it enters the spring selling season.
The Fed may be underestimating labor market risks, as hiring trends point to a weakening job market. QCEW data suggests employment growth through last September was overstated by about 550,000 jobs. If payrolls decline further and unemployment exceeds 4.4%, the Fed might be forced into more aggressive rate cuts. However, persistent inflation—especially from tariffs—may constrain policy flexibility and delay easing until late this year or even 2026. While some compare the Fed’s updated outlook to the 1970s stagflation, those fears seem overstated. Even with slower growth, unemployment is expected to peak at 4.5%, and inflation should remain below 3%, both close to the Fed’s long-run objectives and far from the crisis levels of that earlier era.
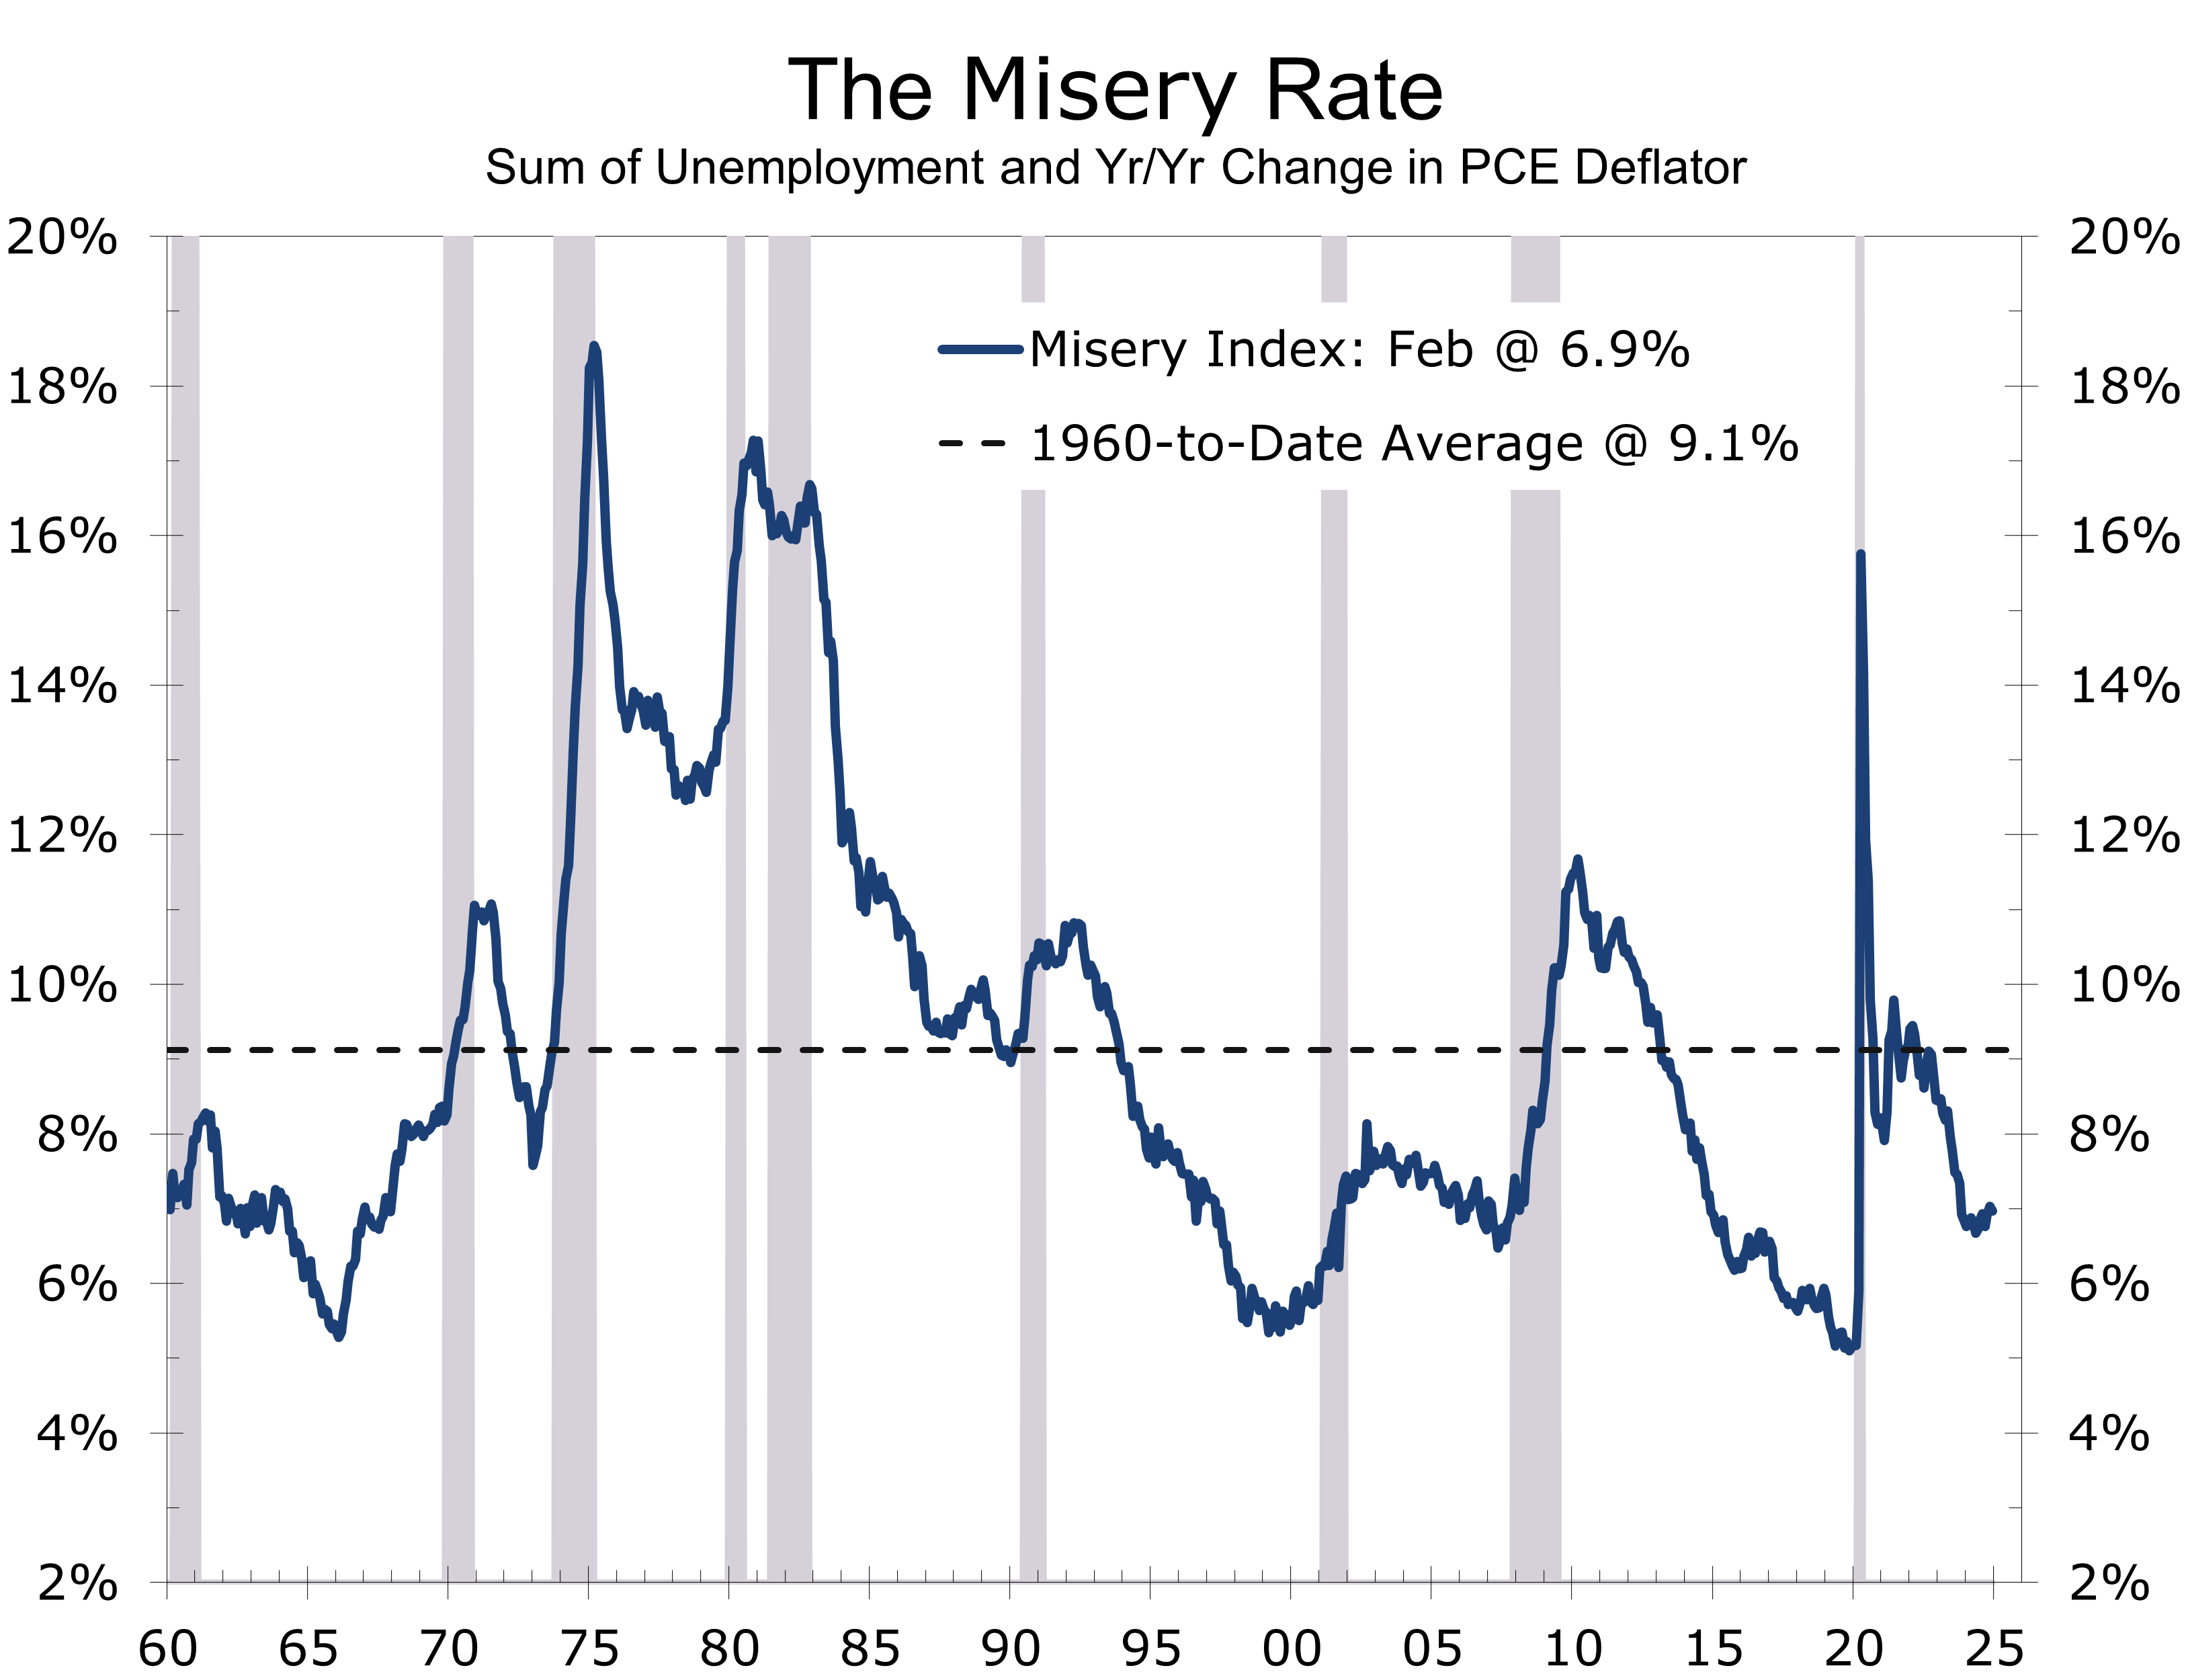
We continue to believe that full-fledged stagflation is unlikely. For stagflation to take hold, inflation would need to rise at least one percentage point above the Fed’s 2% target and either persist or show signs of further acceleration, while unemployment would have to rise a full percentage point above the Fed’s full-employment threshold of 4.3% and remain elevated or continue increasing. This sets the minimum stagflation threshold at 8.3%. Current conditions are still well below that level, with inflation at 2.8% and unemployment at 4.1%, which is still below the full-employment threshold. Additionally, solid productivity growth is helping contain inflationary pressures and preventing a wage-price spiral.
The Misery Index, which combines inflation and unemployment, provides a useful gauge of stagflation risk. At 6.9%, it is still well below the 8.3% threshold. Even with our forecast of unemployment rising to 4.4% and core PCE inflation reaching 3.0% by year-end, the Misery Index would only rise to 7.4%. By contrast, during the stagflationary periods of the 1970s and early 1980s, the Misery Index routinely exceeded the high teens due to exceptionally loose monetary policy and major demographic shifts, particularly the influx of baby boomers and women into the workforce. Today’s inflationary pressures stem from more temporary factors—tariffs, supply chain disruptions, and fading pandemic stimulus.
If stagflation risks were to rise, the Fed would face a difficult choice: tighten monetary policy aggressively to control inflation at the cost of higher unemployment and a potential recession or tolerate higher inflation at the risk of unanchoring inflation expectations. Historical precedent favors decisive action, implying higher interest rates. If the Fed were to allow inflation to persist, the eventual costs of bringing it back down would likely be higher. Fortunately, today’s environment is different. Inflation expectations remain well-anchored, and the Fed’s measured approach to rate cuts reflects its strategy to balance inflation risks with risks to the labor market.
Given current conditions, we expect the Fed to maintain policy flexibility—responding as needed to prevent a temporary rise in inflation from becoming entrenched while standing ready to ease if labor market conditions deteriorate. This underpins the Fed’s pause in lowering interest rates. The next move is still more likely to be a rate cut rather than a hike, but the timing has become less certain, with financial markets still expecting two quarter-point cuts this year, albeit with less conviction than before.
Retail sales experienced a significant decline in January, with the headline figure contracting by 0.9% alongside a broad-based pullback across key categories. While adverse weather and seasonal adjustment factors played a role in the reduction, the widespread weakness indicates a softer start to Q1 consumer spending. A major contributing factor was the downturn in auto sales, while discretionary categories—such as sporting goods, furniture, and building materials—witnessed the steepest declines. Additionally, non-store retail sales, primarily online, decreased, prompting questions about whether weather alone was responsible for January’s weakness.
Consumer sentiment has continued to deteriorate in early February, reflecting increasing policy uncertainty. With excess savings largely exhausted, current spending relies more on employment and income growth. Elevated grocery prices and rising insurance costs are likely significant contributors to the decline in sentiment. Consumers’ assessment of current conditions has dropped 6.4 points since December to 68.7, while expectations for future economic conditions—which have a closer link to actual spending—have fallen by 6.0 points to 67.3.
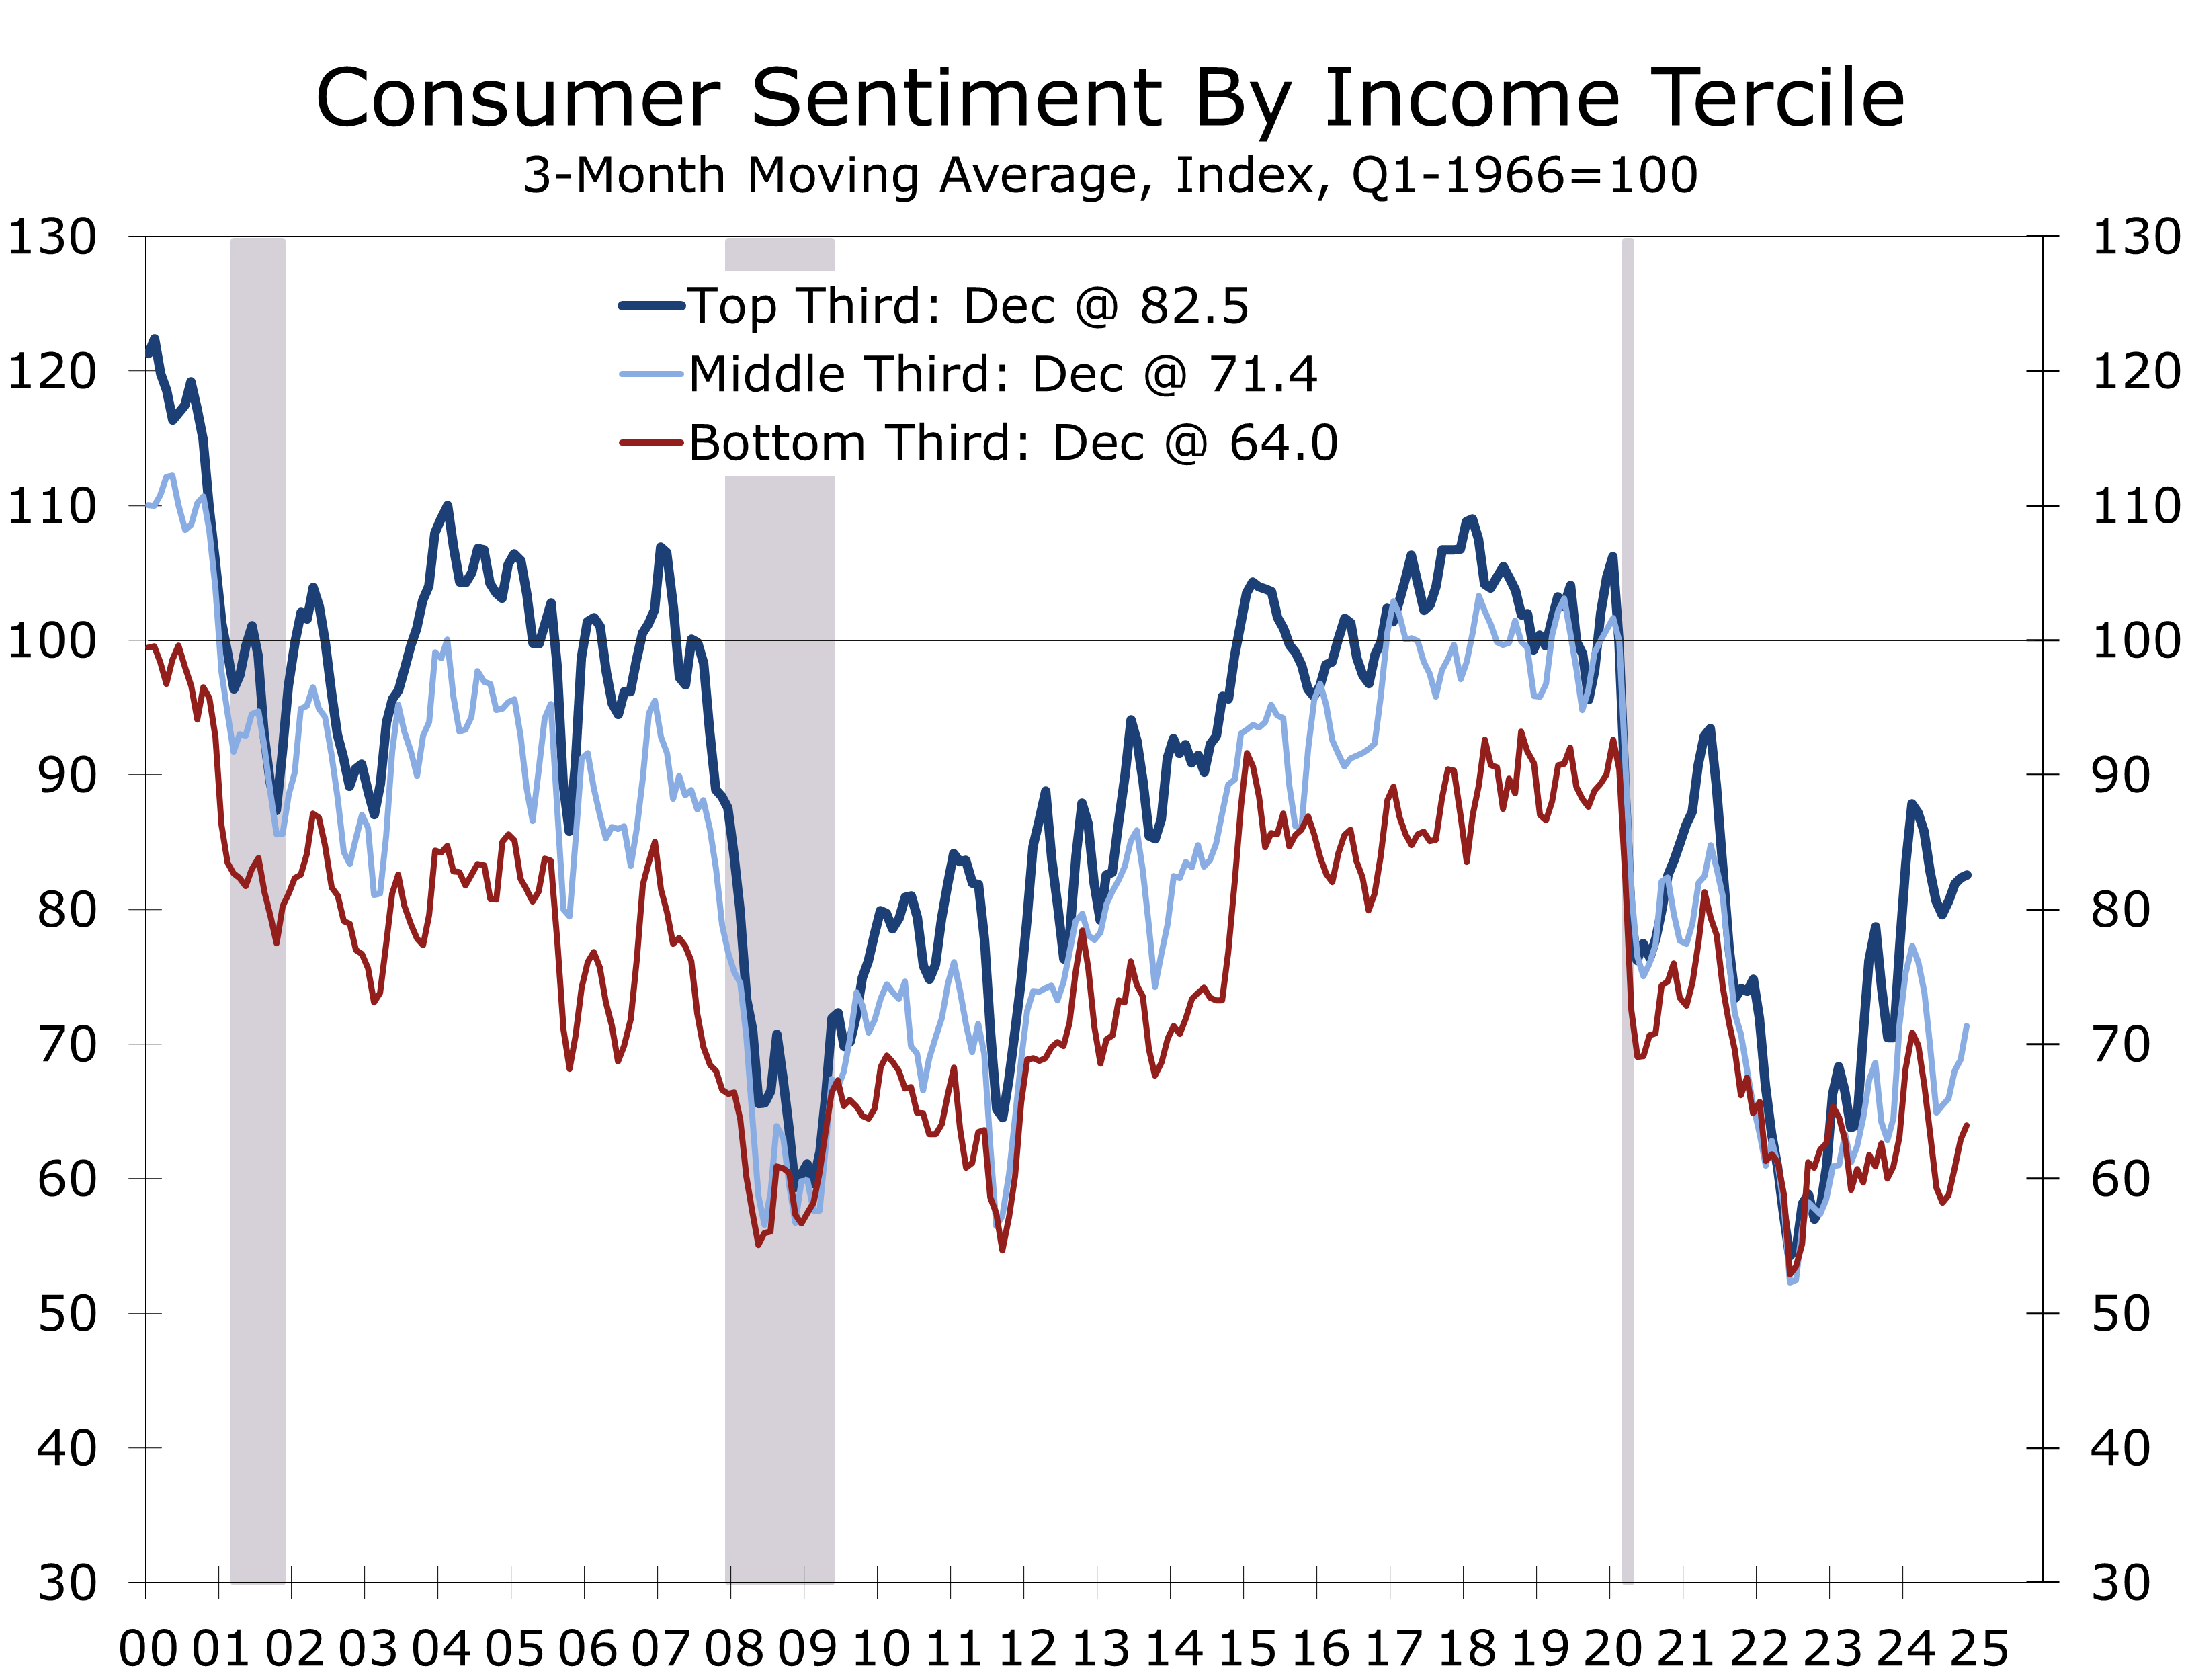
The University of Michigan’s consumer sentiment survey highlights particular weakness among lower-income households. Sentiment for the lowest income tercile has decreased to 64, matching the levels seen during the depths of the Global Financial Crisis. Middle-income households are only slightly more optimistic, with sentiment at 71.3. These figures suggest that economic uncertainty and rising costs are disproportionately affecting consumers with tighter budgets, posing a potential obstacle to discretionary spending.
Despite these concerns, underlying fundamentals support consumer spending in 2025. The unemployment rate remains low at 4%, and weekly jobless claims are near historic lows. Wage growth is robust, and household balance sheets—along with slightly lower interest rates compared to a year ago—should provide some support. Low-rate financing incentives are expected to sustain light vehicle sales and big-ticket spending.
However, financial strength is not evenly distributed across income groups. Rising costs for necessities are disproportionately impacting lower- and middle-income households, putting pressure on discretionary spending. Given these dynamics, we have slightly reduced our estimate for Q1 consumer spending and continue to anticipate a below-consensus gain of just under a 2% annual rate.
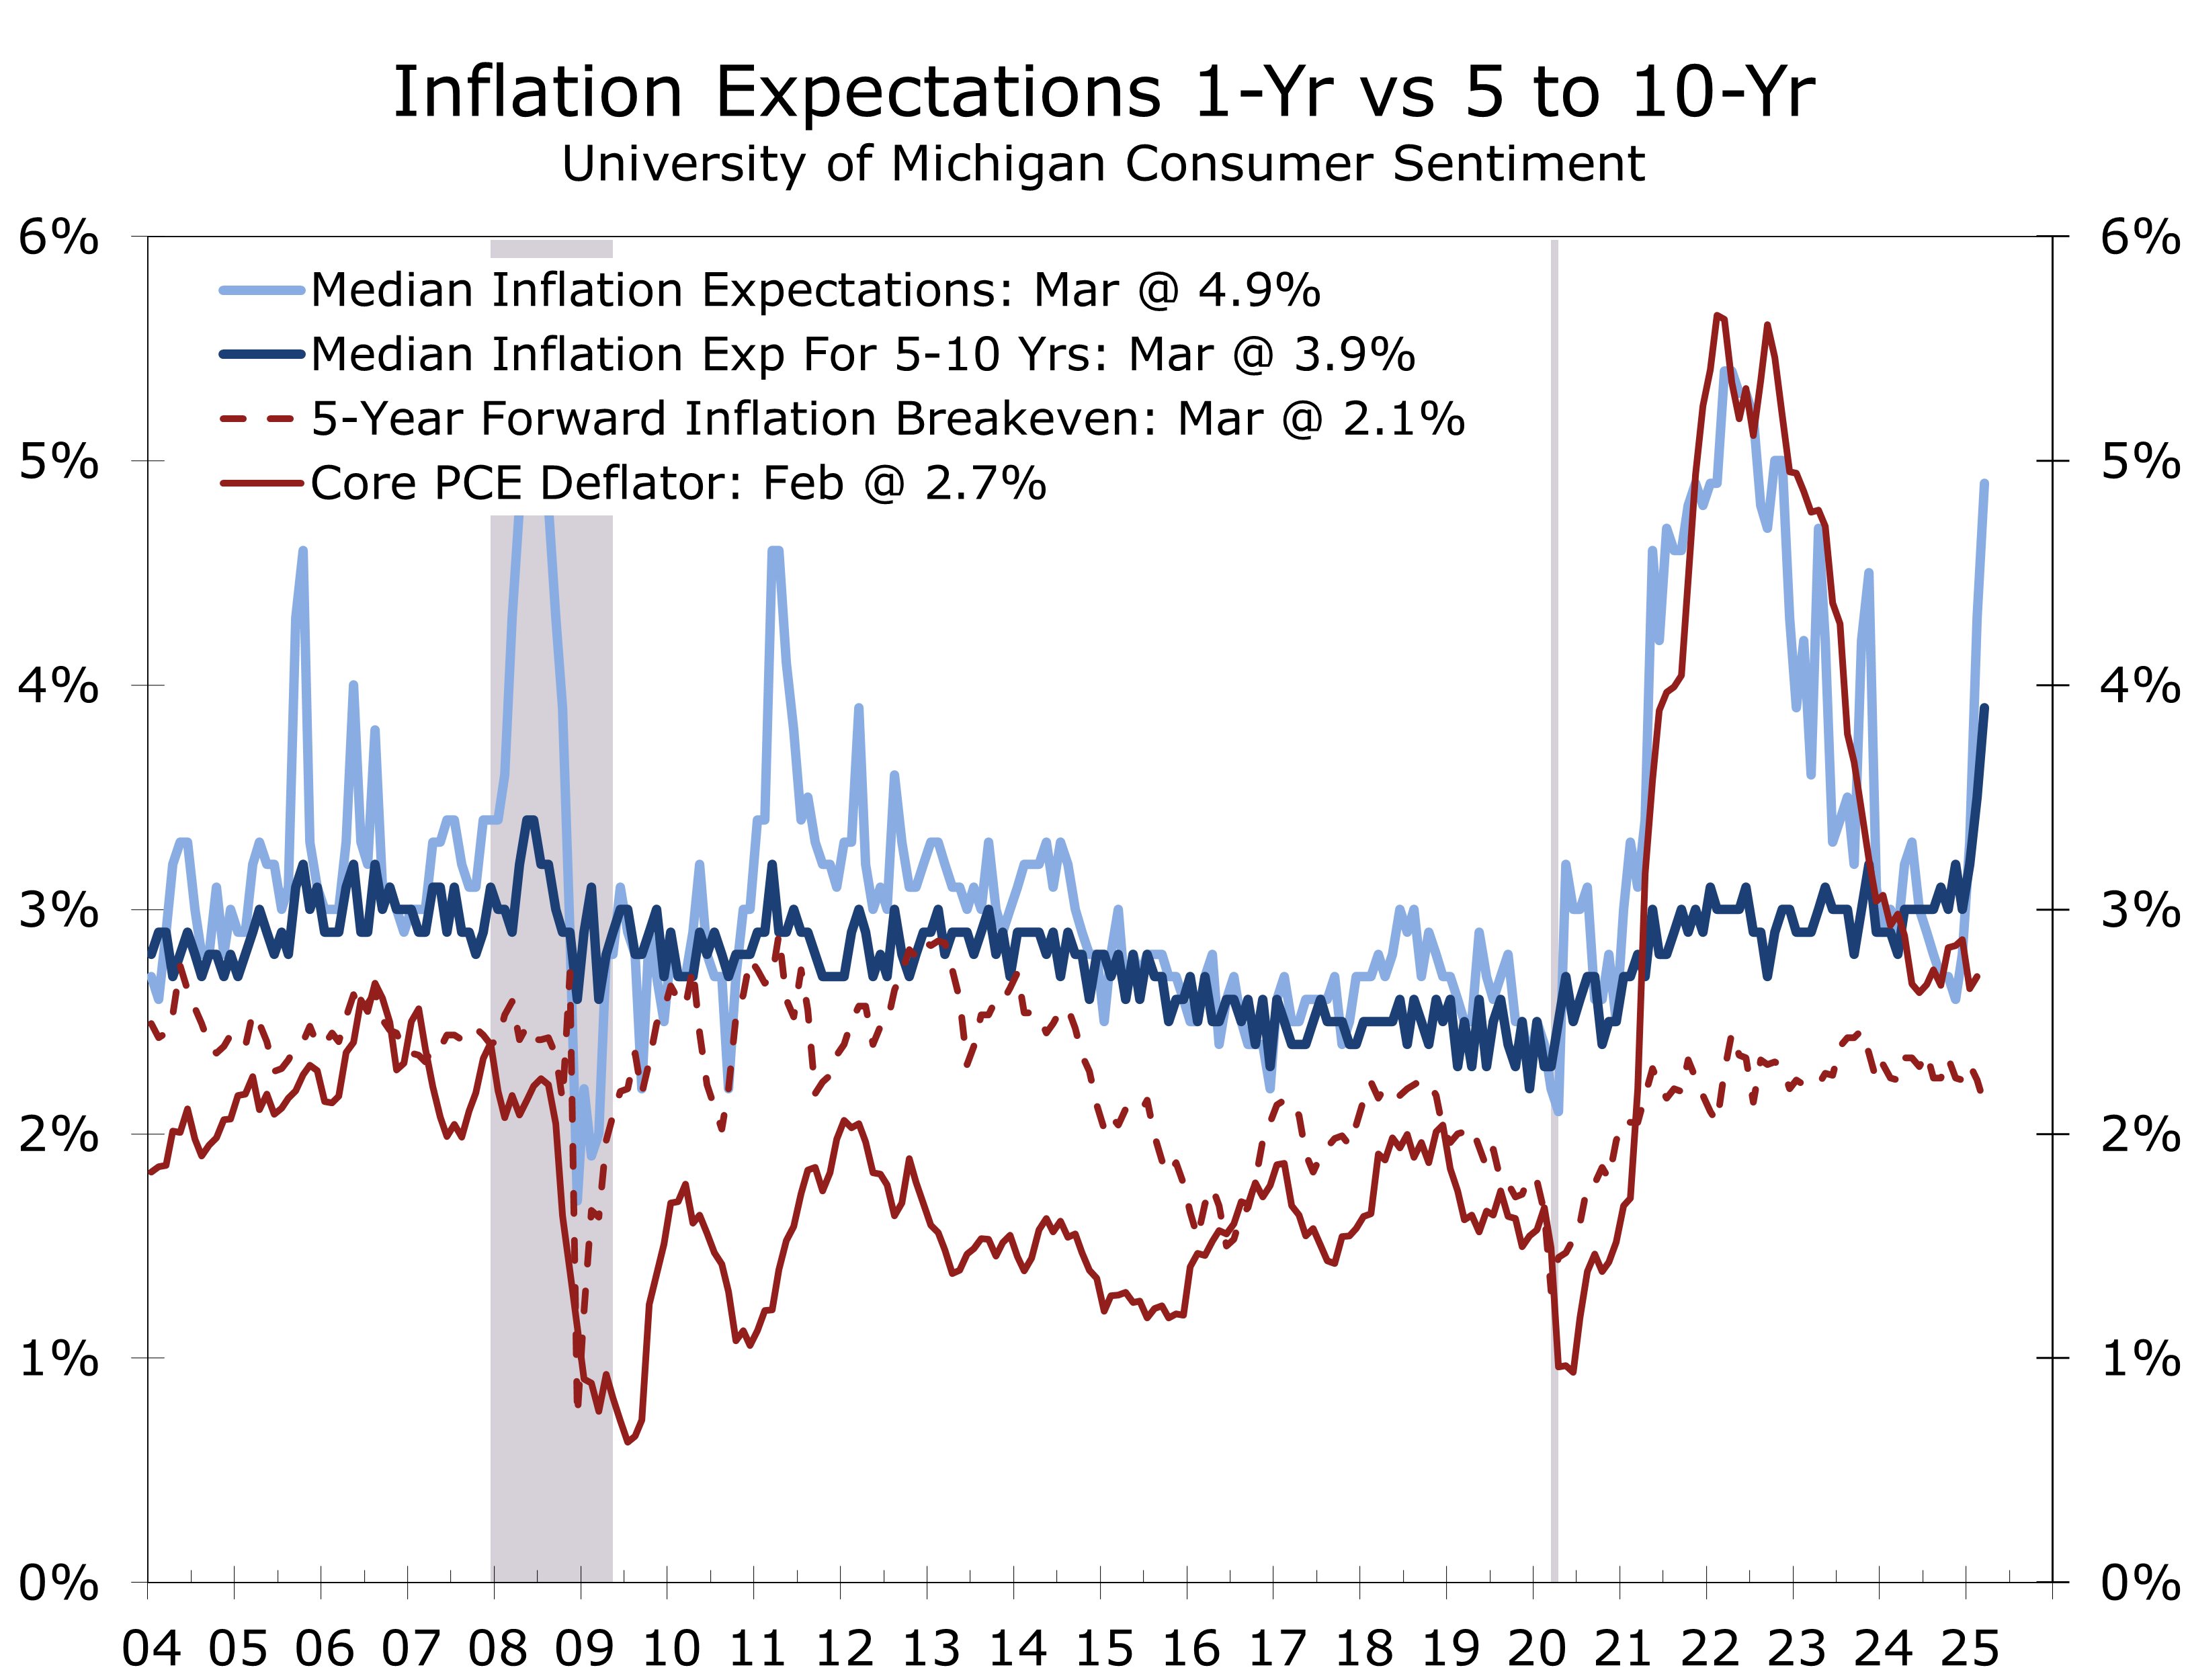
Concerns over tariffs’ impact on consumer prices have driven a sharp rise in inflation expectations. The University of Michigan’s Consumer Sentiment Survey showed one-year inflation expectations climbing 0.6 percentage points to 4.90% in March, while five-year expectations rose 0.4 points to 3.90%. Since the end of last year, one-year expectations have surged 2.1 points, and five-to-ten-year expectations have increased 0.9 points. Meanwhile, market-based measures, such as the five-year, five-year forward inflation breakeven, have remained stable, even edging down from 2.24% to 2.12% over the same period.
Federal Reserve officials, including Chair Jerome Powell, have acknowledged this divergence but prioritize market-based indicators. At his March 19, 2025, FOMC press conference, Powell dismissed the University of Michigan survey as an “outlier,” emphasizing that long-term inflation expectations remain well-anchored. The Fed views the inflationary impact of tariffs as a one-time shock rather than a sustained driver of inflation, reinforcing confidence that inflationary pressures will stay contained despite short-term consumer concerns.
The gap between consumer inflation expectations and market forecasts likely stems from an information disparity. Many consumers assume tariffs apply to retail prices, but they are actually levied on the lower imported value of goods, excluding transportation, insurance, and financing costs. This significantly reduces their direct impact on prices. For clothing for example, the imported value is typically just 10% of the retail price. Financial markets, which are better informed on these intricacies, expect tariffs to raise prices in the short term but also slow economic growth, leading to lower inflation over time.
Our view is more nuanced. Trump’s tariff initiative is larger and more variable than expected. We foresee a slightly greater near-term inflationary impact, as businesses preemptively raise prices to cushion against rising costs. This could be worse than the financial markets and the Fed anticipate, particularly for automobiles, computers, and consumer electronics, where the imported value comprises a larger share of retail prices. Supply disruptions may further raise operating costs, which would be passed on to consumers. Additionally, the wave of tariff-related news effectively provides businesses cover to raise prices more easily.
President Trump’s recent executive order imposes a 25% tariff on imported light vehicles starting April 3, 2025, with key auto parts following by May 3 and all parts within 90 days. While vehicles and components under the USMCA receive partial exemptions, tariffs still apply to non-U.S. content. As a result, the effective U.S. tariff rate will rise by approximately 2.5 percentage points by July, with some non-USMCA imports facing tariffs as high as 50%. Reciprocal tariffs set to take effect on April 2 could complicate the impact.
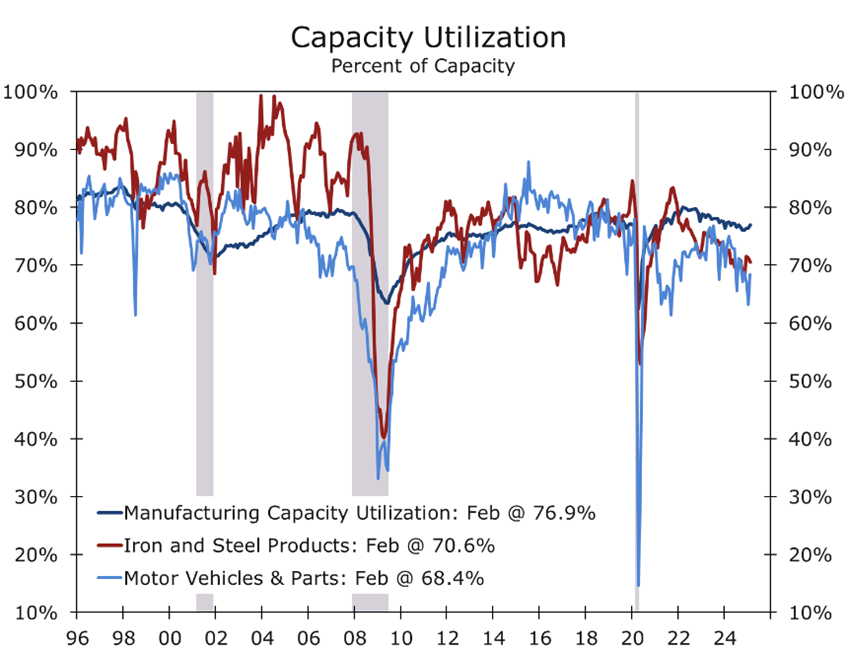
The Administration justifies the move on national security grounds and the need to bolster domestic manufacturing. The White House highlights a $93.5 billion auto parts trade deficit in 2024 and a shrinking industry workforce. By raising import costs, the policy aims to push consumers toward American-made vehicles and incentivize domestic production. A study cited by the administration suggests a global 10% tariff could significantly boost the U.S. economy and employment. There is some room to boost output. The Fed’s latest data show the U.S. auto industry operating at 68.4% of capacity, compared to a historical average of 74.9%. While domestic production should theoretically rise, the broader economic impact remains uncertain. The iron and steel industry is operating at 70.6% of capacity versus an historic average of around 78%.
Higher vehicle prices will likely burden consumers, as the average new car now costs nearly $50,000. Affordability concerns are at a multi-decade high, with automobiles—both new and used—out of reach for a historically large share of U.S. consumers. Automakers like Ford and General Motors, reliant on international supply chains, will likely face higher costs. Meanwhile, major trading partners such as China, Japan, and Germany may impose retaliatory tariffs, further complicating the outlook.
Tariffs align with Trump’s broader economic nationalism, echoing tariffs on steel, aluminum, and Chinese goods during his first term. The auto industry’s economic and symbolic significance makes it central to his trade strategy. However, complexities surrounding exemptions, administrative burdens, and retaliation risks create uncertainty about long-term effects on the U.S. economy and global trade.
Trump’s ultimate goal is unclear—whether to raise revenue, boost domestic manufacturing, or ultimately reshape the global trading system with lower and more transparent trade barriers. The likely outcome is a mix of these objectives. We expect the tariff battle to be largely contained to 2025, with the administration working to minimize economic disruptions ahead of the 2026 midterm elections.
The Trump Administration’s aggressive tariff policies have clouded the economic outlook. Businesses have accelerated imports ahead of tariff implementation, sharply widening the trade deficit and weighing on first-quarter GDP growth. The extent of the drag depends on how quickly these imports move into inventories or reach end users, both of which contribute to GDP. While Q1 output may decline, final domestic demand remains positive, and any shortfall from front-loaded imports should reverse in later quarters, boosting growth.
Beyond trade volatility, the broader economy has also lost momentum. We estimate job growth has been overstated by roughly 550,000 over the past year, with hiring also heavily concentrated in health care, social services, leisure and hospitality, and state and local government. With heightened uncertainty, hiring is expected to slow this spring and summer. However, tighter border enforcement has significantly curbed immigration and labor force growth, limiting any upward pressure on the unemployment rate.
Business investment is a bright spot. Shipments of nondefense capital goods have risen solidly in Q1, driven by equipment for new plants constructed under the Inflation Reduction Act and CHIPS Act. Additionally, commercial aircraft shipments have surged as Boeing works through its backlog.
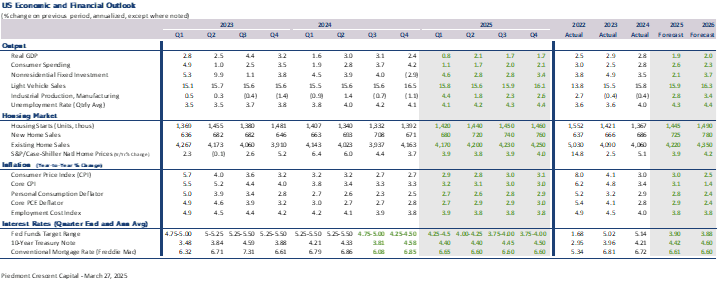
Our outlook remains cautious, with real GDP projected to grow 1.6% in 2025. However, strong late-2024 growth should lift the annual average to 2.1%. Risks remain skewed to the downside, as the Administration prioritizes early wins on trade and tax reform at the expense of short-term economic disruptions. We expect the Federal Reserve to cut rates twice this year, with the first cut possibly as early as June.
Disclaimer: This publication has been prepared for informational purposes only and is not intended as a recommendation offer or solicitation with respect to the purchase or sale of any security or other financial product nor does it constitute investment advice. Any forward-looking statements or forecasts are not guaranteed and are subject to change at any time. Information from external sources have not been verified but are generally considered reliable..
February 28, 2025
Mark Vitner, Chief Economist
Piedmont Crescent Capital
704-458-4000
FOMC March 2025: Rate Pause, QT Slowdown, and Revised Economic Projections
Navigating Uncertainty: The Fed's Cautious Path
- The Fed held its federal funds rate target steady at 4.25%-4.5%, maintaining its extended pause following 100 basis points of cuts from September to December 2024.
- The pace of Quantitative Tightening (QT) will slow, with the runoff of maturing Treasury securities reduced from $25 billion to $5 billion per month, while mortgage-backed securities runoff remains at $35 billion.
- The Fed downgraded its 2025 GDP growth forecast to 1.7% from 2.1%, while raising core PCE inflation expectations to 2.8% from 2.6%.
- The median dot plot projection still anticipates two 25 basis point rate cuts in 2025, but a growing number of FOMC members are leaning toward fewer cuts, signaling a slightly more hawkish stance.
- Powell acknowledged tariff-related inflation risks, which could delay a return to the Fed’s 2% inflation target.
- We believe the Fed is underestimating labor market risks and anticipate weaker job numbers in the coming months, which could prompt a more aggressive policy response.
The March Federal Open Market Committee (FOMC) meeting delivered few surprises but reinforced the Fed’s cautious and data-dependent stance. The central bank maintained its federal funds rate target at 4.25%-4.5%, reflecting its commitment to an extended pause following the 100 basis points reduction in rates from September to December 2024. Additionally, the Fed announced a slowdown in Quantitative Tightening (QT), reducing the monthly runoff of maturing Treasury securities from $25 billion to $5 billion beginning in April, while keeping the runoff of mortgage-backed securities steady at $35 billion per month. This policy adjustment reflects the Fed’s intent to ensure liquidity remains ample while navigating evolving economic and geopolitical conditions.
The Fed is adopting a more cautious view on the economy and will remain data dependent.
The updated Summary of Economic Projections (SEP) highlighted a downward revision to 2025 GDP growth, which is now expected at 1.7%, down from 2.1% in December. Core PCE inflation expectations were revised higher to 2.8% from 2.6%, reflecting concerns over persistent inflation pressures. The Fed’s dot plot still anticipates two 25 basis point rate cuts in 2025, but with a more hawkish tilt—eight FOMC members now project fewer than 50 basis points of cuts, up from four in the prior forecast. This shift suggests that concerns over inflationary pressures and policy uncertainty are weighing more heavily on policymakers.

Chair Powell’s post-meeting comments emphasized the Fed’s intent to remain flexible. He downplayed inflation concerns stemming from the University of Michigan’s survey, noting that other measures, such as the New York Fed’s inflation expectations survey and market-based indicators, remain stable.
The spike in inflation expectations in the UMich Consumer Sentiment Survey looks like an outlier.
Powell also acknowledged the inflationary impact of tariffs, estimating a temporary price increase of a few tenths of a percentage point, which could delay the Fed’s return to its 2% inflation target until 2026. However, he stressed that the overall economic outlook remains balanced, justifying the Fed’s wait-and-see approach.
Markets responded positively to the Fed’s update view, with the 10-Year Treasury yield falling around 10 basis points and stocks rallying following Powell’s comments. The slowdown in QT is expected to provide additional support to economy and financial markets. Lower long-term interest rates should provide some needed relief to housing as it enters the critical spring selling season, mitigating some of the broader economic slowdown projected in the Fed’s SEP.

Despite the Fed’s cautious optimism, we believe policymakers are underestimating labor market risks. Hiring trends point to slowing job growth, and we expect the labor market to weaken in the coming months. QCEW data suggests job growth through last September is currently overstated by about 550,000 jobs. If payrolls slow more sharply and unemployment exceeds 4.4%, the Fed may need to adjust policy more aggressively. We expect a rate cut this June, with additional moves this summer and possibly this fall.
Conversely, persistent inflation—particularly from tariff-induced price pressures—might delay or reduce expected rate cuts. Powell’s emphasis on uncertainty underscores the Fed’s cautious, data-driven approach. While the Fed maintains an easing bias, rising inflation concerns suggest policymakers are ready to shift course if needed. Such a shift seems less likely today, given the recent slide in energy prices.
Many have rushed to label the Fed’s outlook as stagflationary, but comparisons to the 1970s are overstated. Even with slower growth, unemployment is expected to peak around 4.5%, and inflation, even after being stoked by tariffs, should remain below 3%—both well below late-1970s levels. Additionally, tariff-related price increases are likely temporary, with inflation trending lower over the next two years.

Disclaimer: This publication has been prepared for informational purposes only and is not intended as a recommendation offer or solicitation with respect to the purchase or sale of any security or other financial product nor does it constitute investment advice.
February 20, 2025
Mark Vitner, Chief Economist
Piedmont Crescent Capital
(704) 458-4000
Housing Starts Rebound in February
Housing Starts Bounce Back in February
- Housing starts increased 11.2% to 1.501 million SAAR, though the previous two months’ starts were slightly revised lower.
- Single-family starts rose 11.4% to a 1.108 million unit pace, the highest level since February 2024. Multifamily starts increased 10.7% to a 393,000 unit pace.
- Building permits declined 1.2% to 1.456 million units, with single-family permits nearly flat at 992,000 units (down 0.2%) and multifamily falling 3.1% to 464,000 units.
- Weather impacts were evident across the country, with starts soaring in the Northeast (+47.4%) and South (+18.3%), rising solidly in the West (+5.9%), but tumbling in the Midwest (-24.9%).
- Housing completions fell 4.0%, with single-family completions rising 7.1% and multifamily completions falling 20.8%.
- Units under construction edged up 0.1%, with single-family units flat and multifamily units up 0.3%.
- Homebuilding faces a challenging year. High home prices, elevated mortgage rates, a weakening labor market, persistent inflation and policy uncertainty are keeping many potential buyers on the sidelines.
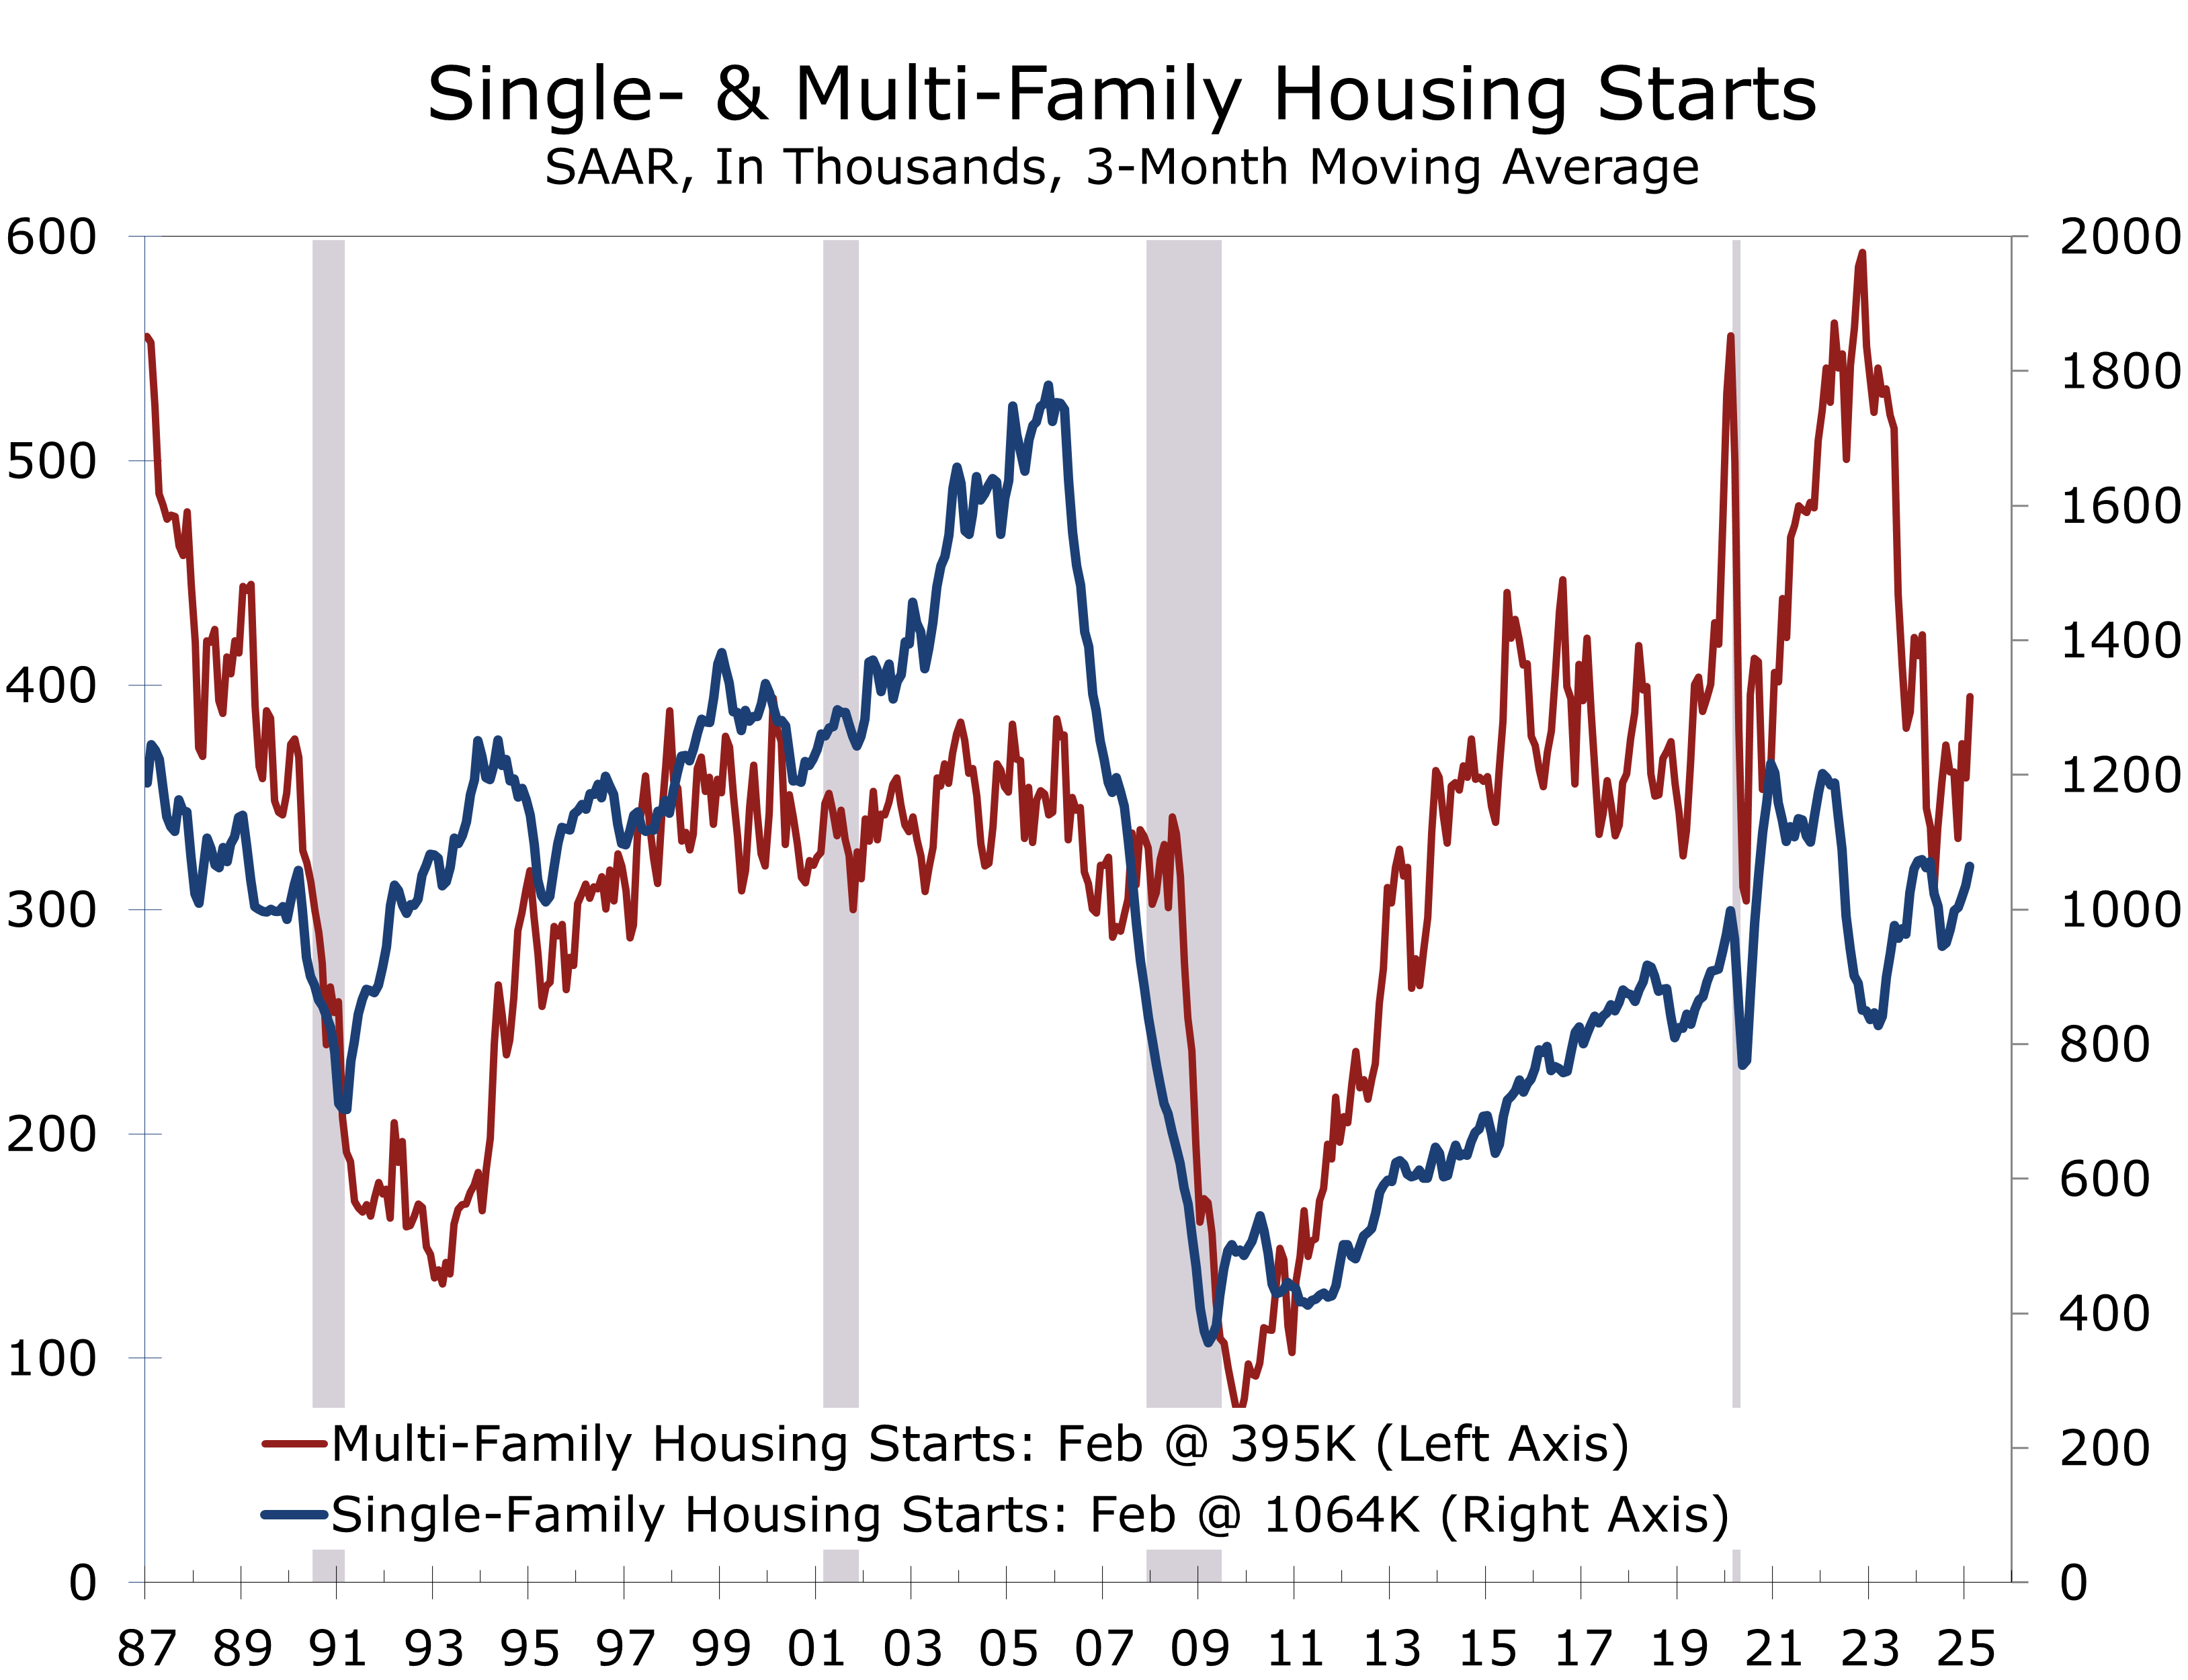
Home building rebounded in February, with housing starts surging 11.2% to a 1.51 million unit seasonally adjusted annual rate (SAAR). This increase exceeded expectations for a modest rebound following January’s weather-related slowdown. Building permits—which tend to lead starts by 1 to 2 months and are less influenced by weather distortions—dipped 1.2% to a 1.456 million-unit pace. While the stronger February housing starts data is a rare bit of good news, we doubt it reflects a momentum shift for the sector, which faces persistent headwinds from tariffs, labor shortages, and sagging consumer sentiment.
The jump in housing starts was broad-based, driven by an 11.4% increase in single-family starts to a 1.108 million unit pace and a 10.7% rise in multifamily starts to 393,000 units. The rebound reflects a normalization after January’s severe winter weather disrupted construction, particularly in the Northeast and South.
February’s stronger housing starts likely does not signal a momentum shift for home building.
Starts averaged 1.426 million units the past 2 months, close to the recent trend in permits and consistent with our 2025 forecast for 1.445 million starts. Building permits fell 1.2% and have averaged 1.465 million units the past two months. Single-family held steady at 992,000 units, while multifamily fell 3.1%, reflecting uneasiness about the torrent of new supply.
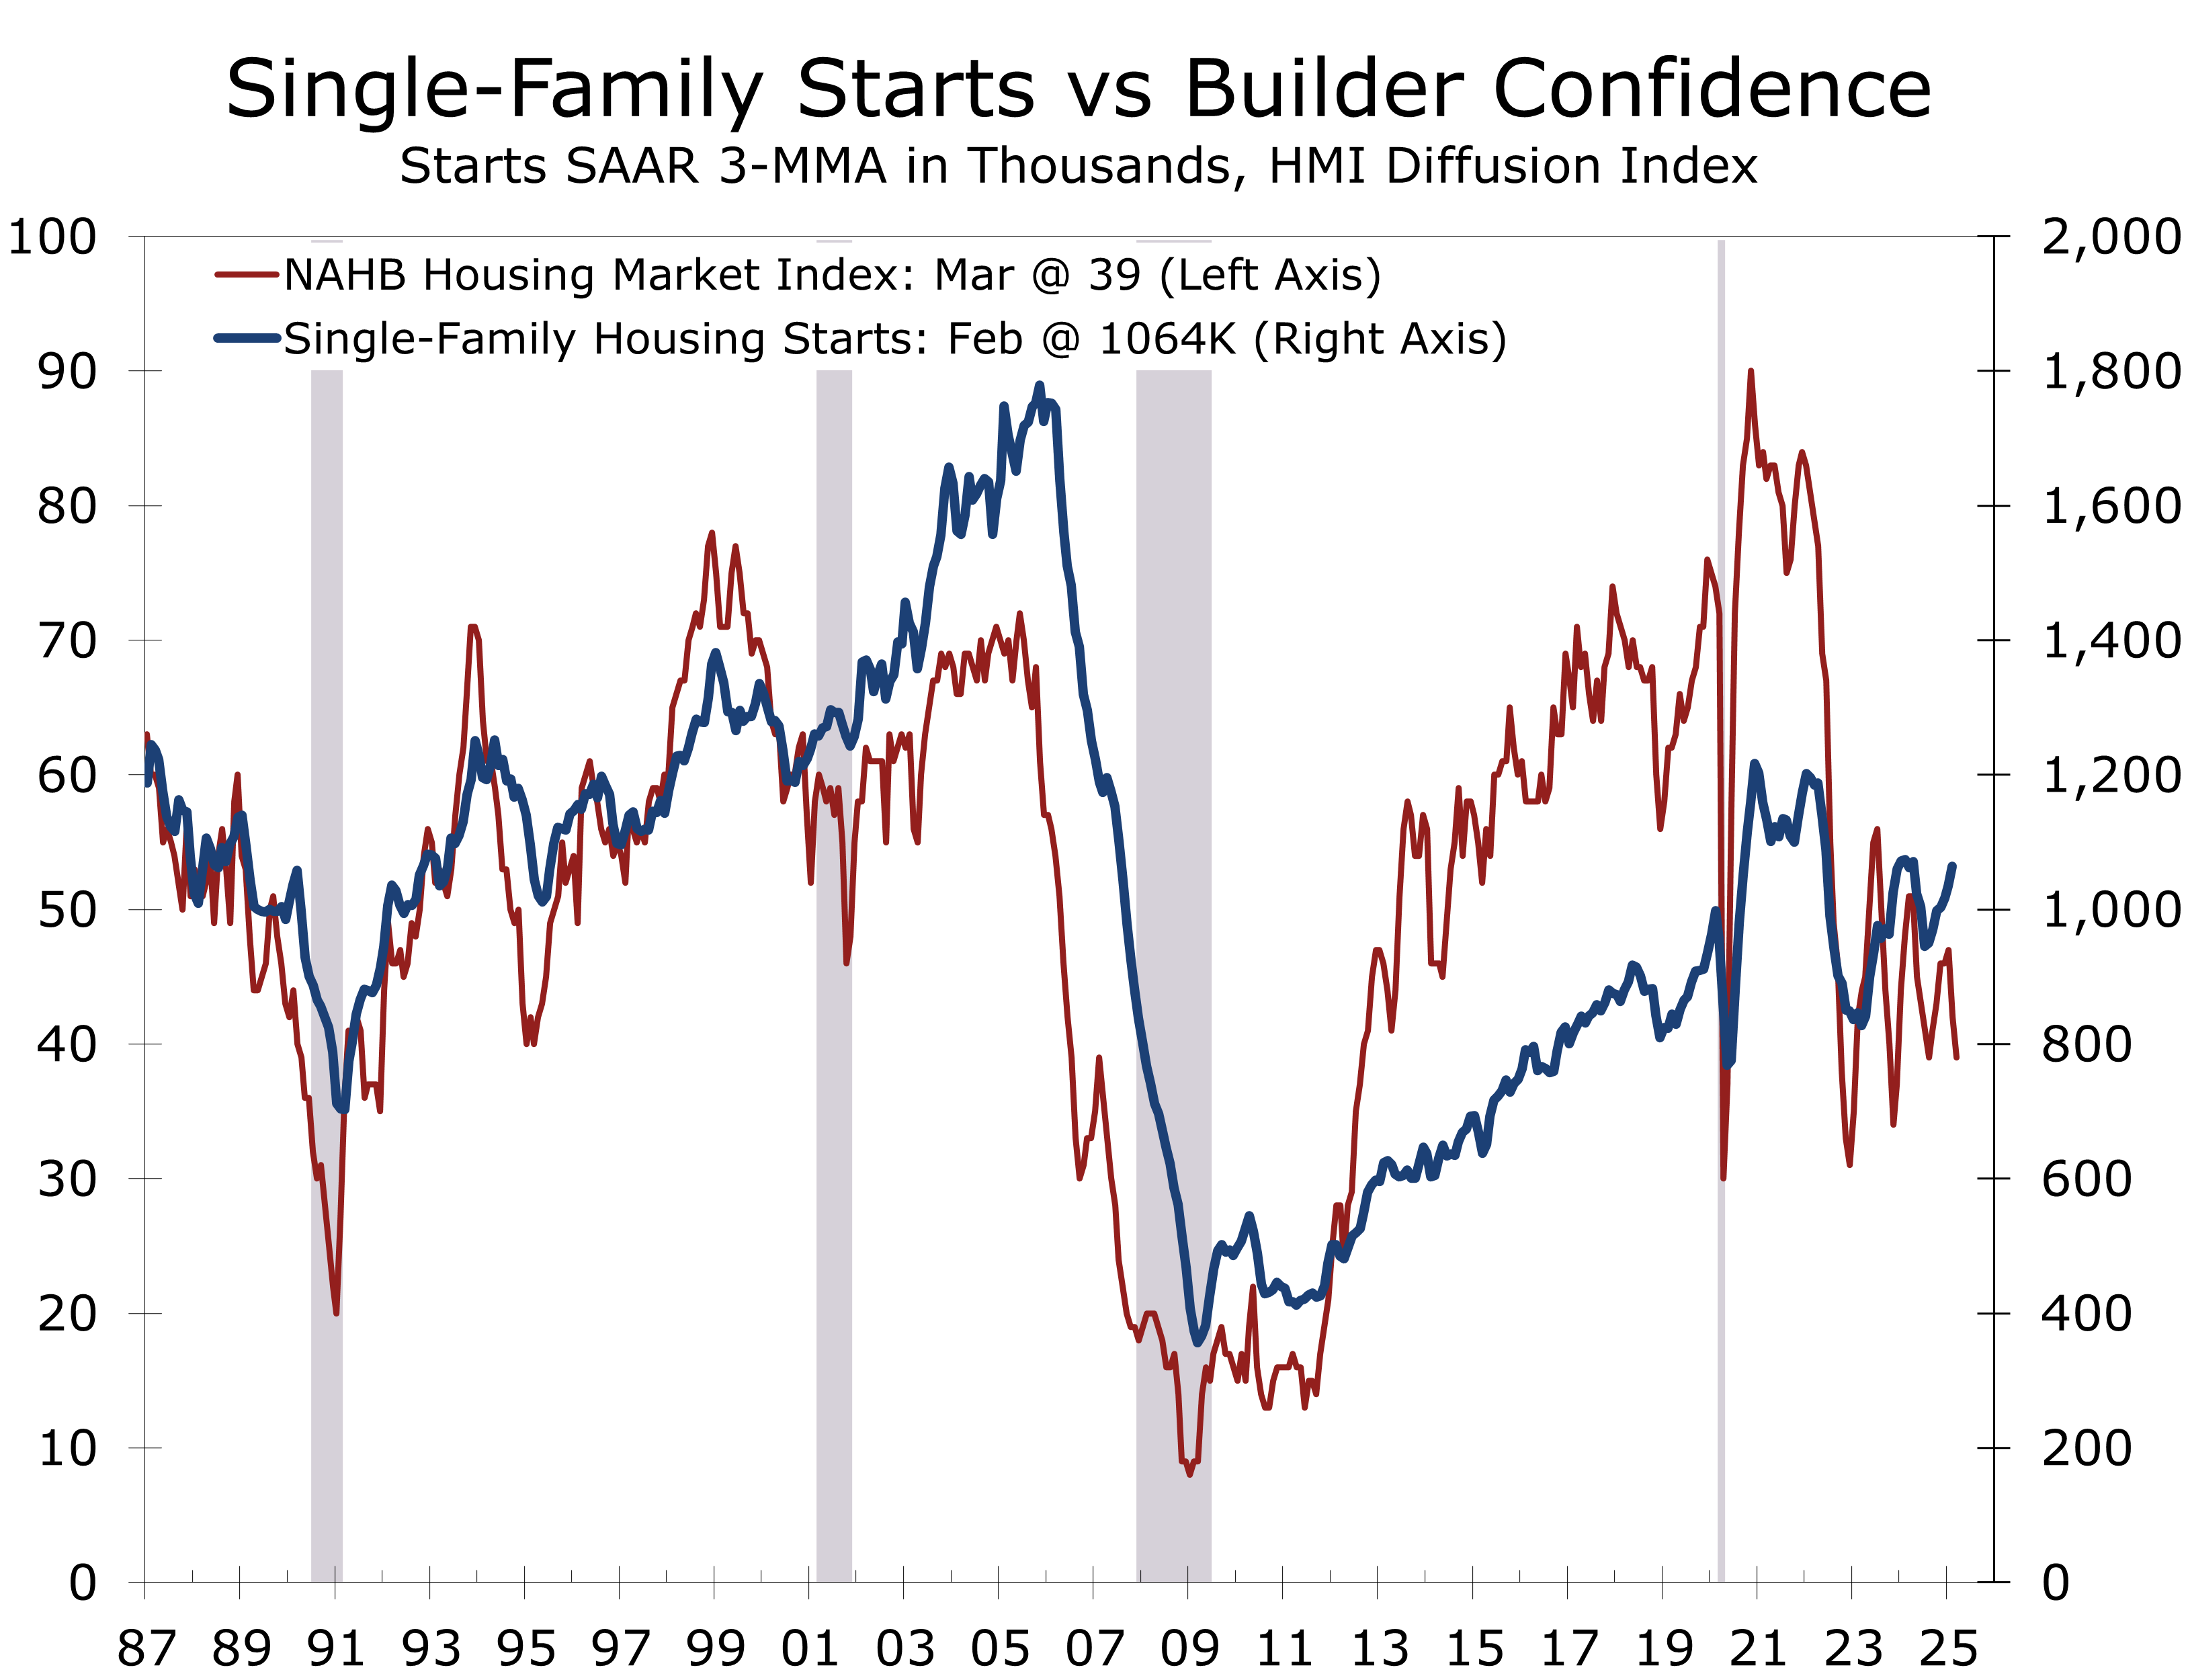
Builder sentiment, as measured by the National Association of Home Builders (NAHB)/Wells Fargo Housing Market Index (HMI), fell to 39 in March—its lowest since August 2024. Homebuilders cited potentially higher input costs from tariffs and worsening labor shortages tied to immigration policies under President Trump. Despite a 40-basis-point decline in mortgage rates since January, builders noted growing buyer caution and weaker prospective buyer traffic. Prospective buyer traffic tumbled 5 points in March to 24, its lowest level in 15 months.
Builders remain exceptionally cautious, reflecting uncertainty and weak buyer traffic.
February’s rise in housing starts was concentrated in the Northeast (+47.4%) and South (+18.3%), which both rebounded from unseasonably cold winter weather in January. By contrast, starts rose a more modest 5.9% in the West and plunged 24.9% in the Midwest.
Permits were also mixed, with the Midwest posting an +8.9% rise. The South (+1.0%) also posted a modest gain, while permits fell in the Northeast (-15.3%) and West (-7.6%). Despite the drop, the West is proving resilient, following a 42.3% surge in January. The Midwest’s volatility underscores disparities driven by weather, economic conditions, and supply constraints.
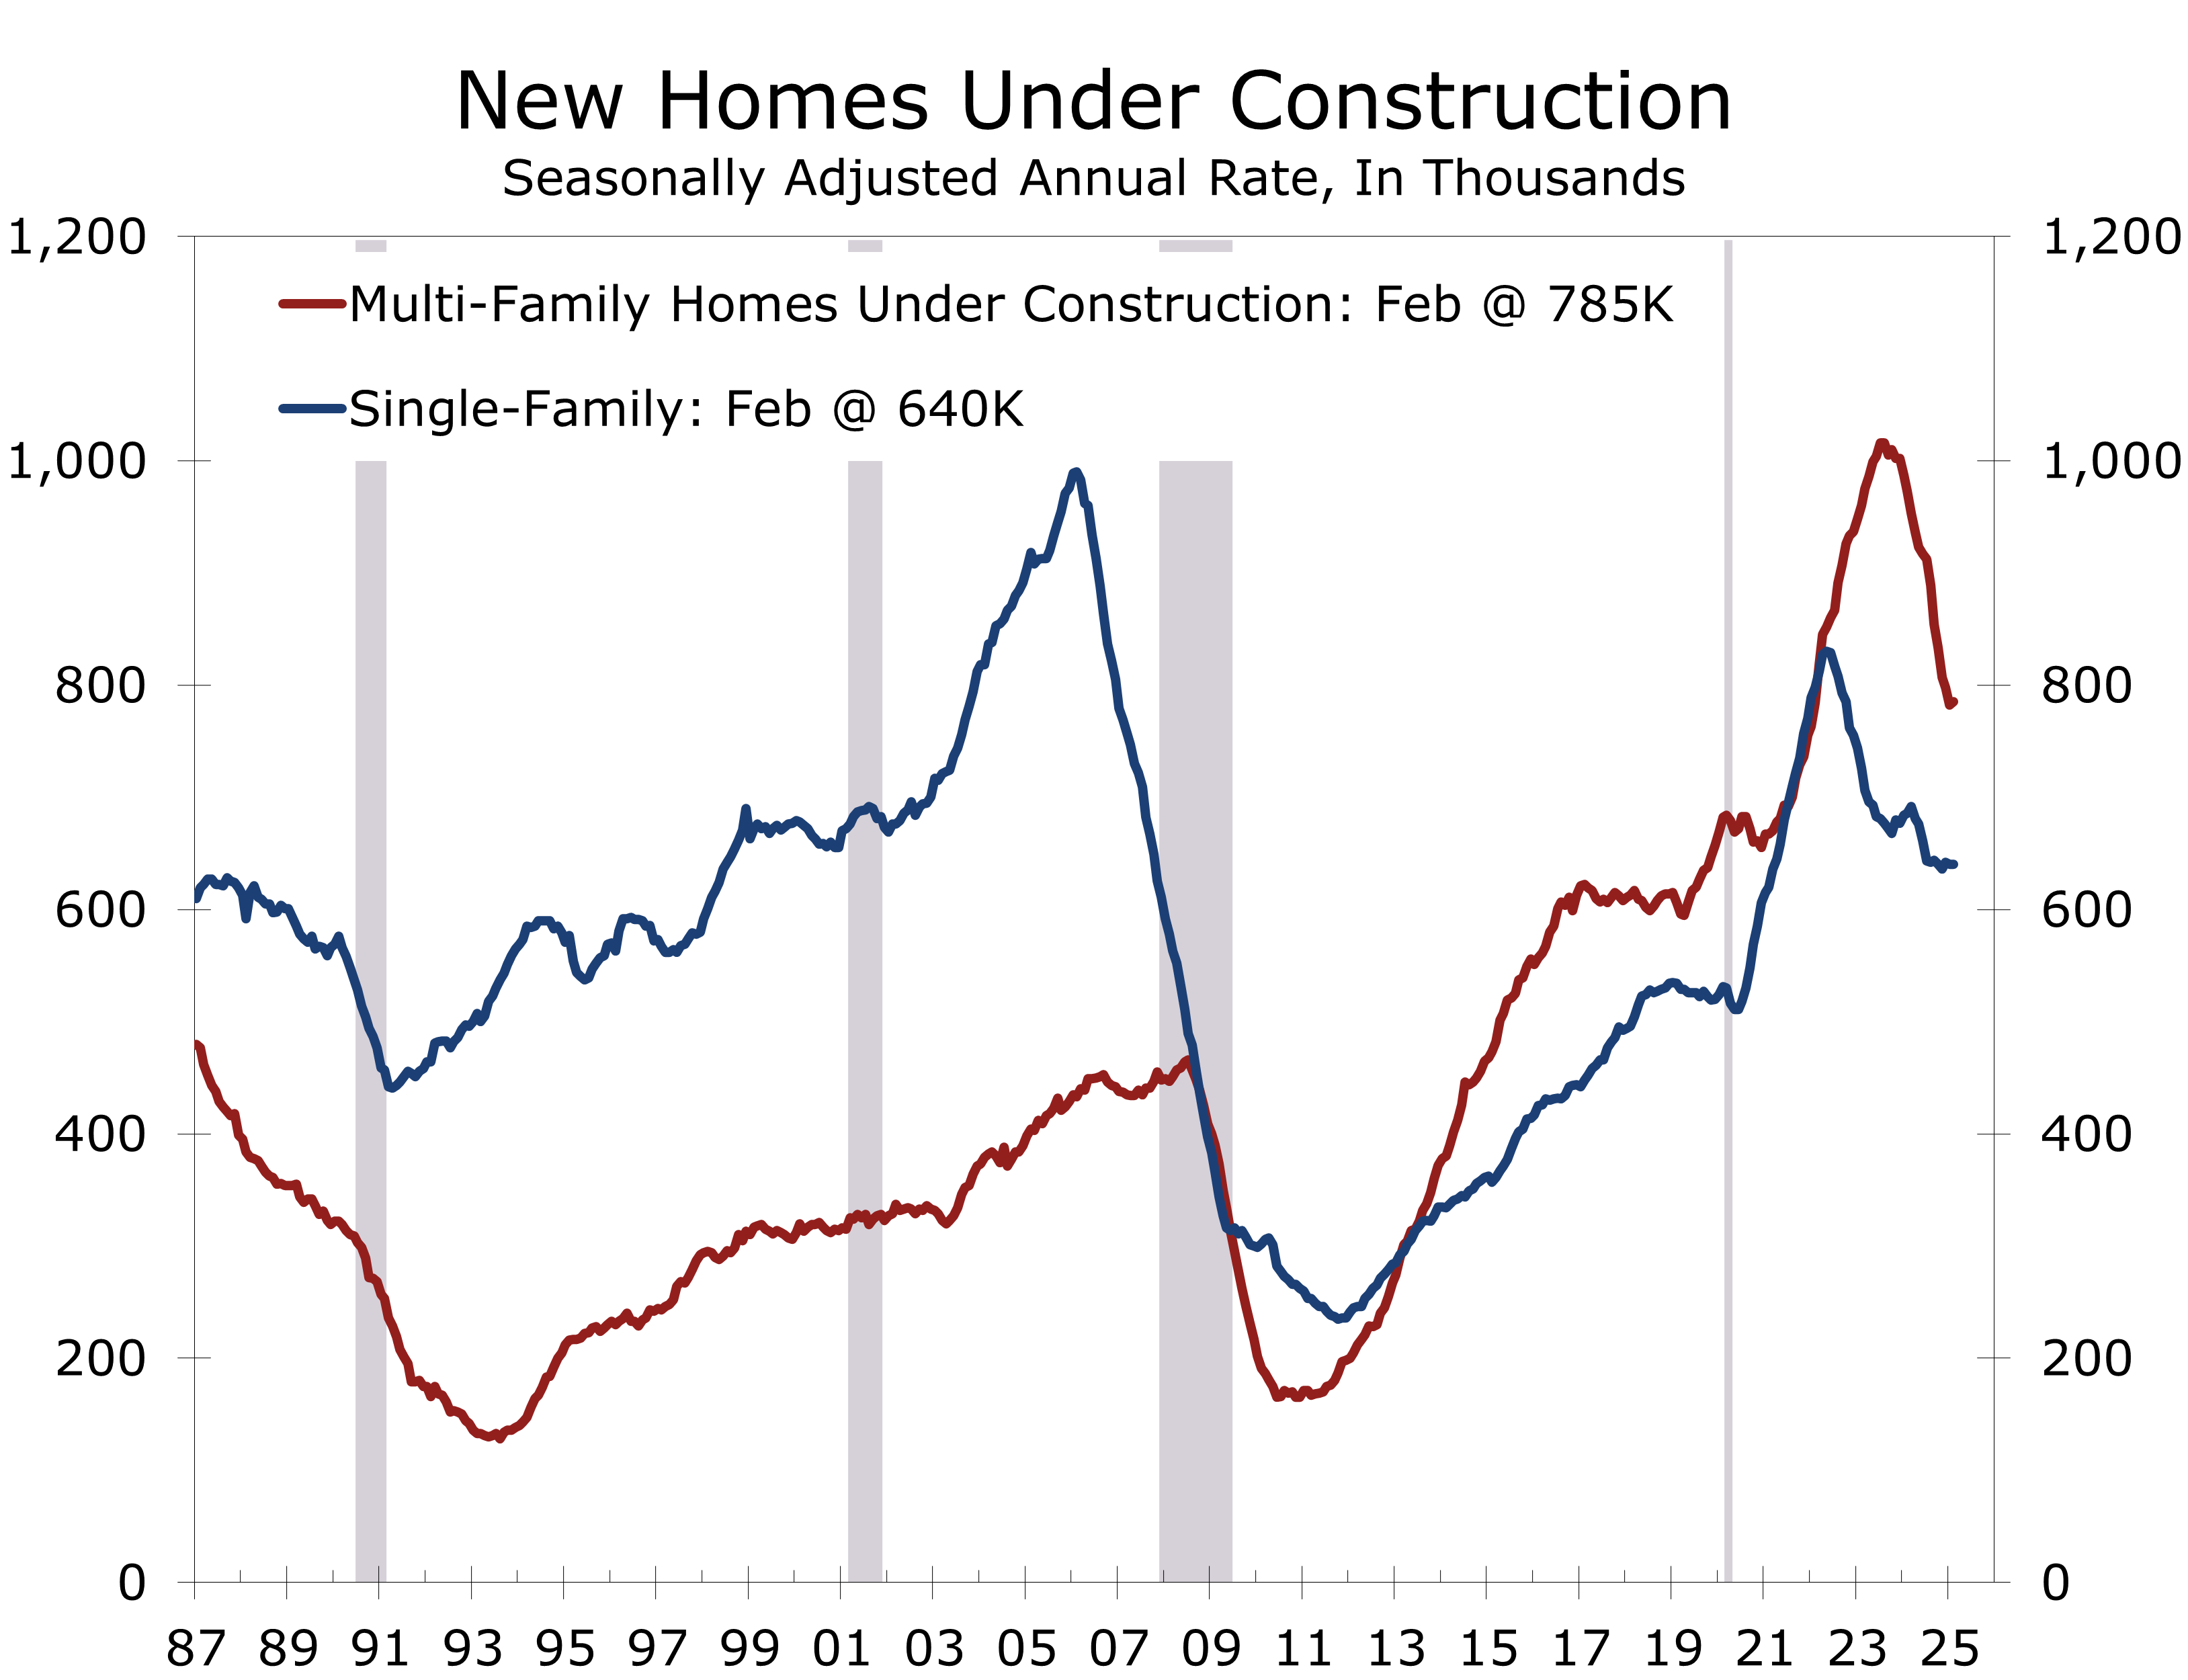
Housing completions dipped 4.0%, primarily due to a 20.8% drop in multifamily units. Single-family completions rose 7.1%. Units under construction saw a negligible increase, yet remain down for the quarter, which will weigh on residential investment and is consistent our forecast for just 1.2% Q1 GDP growth.
While the quarter was soft, February’s stronger data provide a glimmer of optimism. The January-February average of 1.426 million starts, coupled with steady permits, suggesting a possible floor for home building. Sustaining this momentum faces significant hurdles, however. Tariffs are inflating input costs, labor shortages are intensifying, and economic uncertainty is eroding both builder and buyer confidence. While recent mortgage rate declines offer some relief, buyer wariness persists, as evidenced by the NAHB survey, casting doubt on the spring selling season.
The housing sector’s significance to the broader economy remains paramount. The Federal Reserve possesses levers to stimulate construction, notably by cutting short-term rates and narrowing the substantial spread between 30-year mortgages and 10-year Treasuries. Ending quantitative tightening would provide additional relief.
Disclaimer: This publication has been prepared for informational purposes only and is not intended as a recommendation offer or solicitation with respect to the purchase or sale of any security or other financial product nor does it constitute investment advice.
March 18, 2025
Mark Vitner, Chief Economist
Piedmont Crescent Capital
(704) 458-4000
The Labor Market Shows Signs of Fraying Around the Edges
Another Month of Steady but Moderating Job Growth
- Employers added 151,000 in February, topping January’s downwardly revised 125,000-job gain.
- The unemployment rate inched up to 4.1% from 4.0%.
- Job gains broadened, with health care (+52,000), financial activities (+21,000), transportation and warehousing (+18,000), and social assistance (+11,000) leading growth.
- Part-time employment for economic reasons jumped by 460,000; those not in the labor force but wanting a job rose by 414,000.
- Wage growth eased to just 4.0% year-over-year, down from 4.2% in January.
- Secretary Bessent noted the economy is shift away from stimulus-driven growth, which will likely result in more moderate job gains this year. The downside risks to growth have clearly increased, and softer hours worked and slower wage growth are consistent with our call for real GDP growth at around a 1.2% pace this quarter.
Sample report copy. Edit here to change this text. Lorem ipsum dolor sit amet, consectetur adipiscing elit. Ut elit tellus, luctus nec ullamcorper mattis, pulvinar dapibus leo.
The February jobs report paints a labor market that’s holding firm but beginning to fray around the edges. Nonfarm payrolls rose by 151,000, outpacing January’s downwardly revised 125,000, though the three-month average dipped to roughly 200,000 from 237,000—a clear sign that hiring momentum is slowing. The unemployment rate crept up to 4.1%, a slight uptick that suggests the labor market’s tightness is beginning to loosen after a prolonged stretch near historic lows.
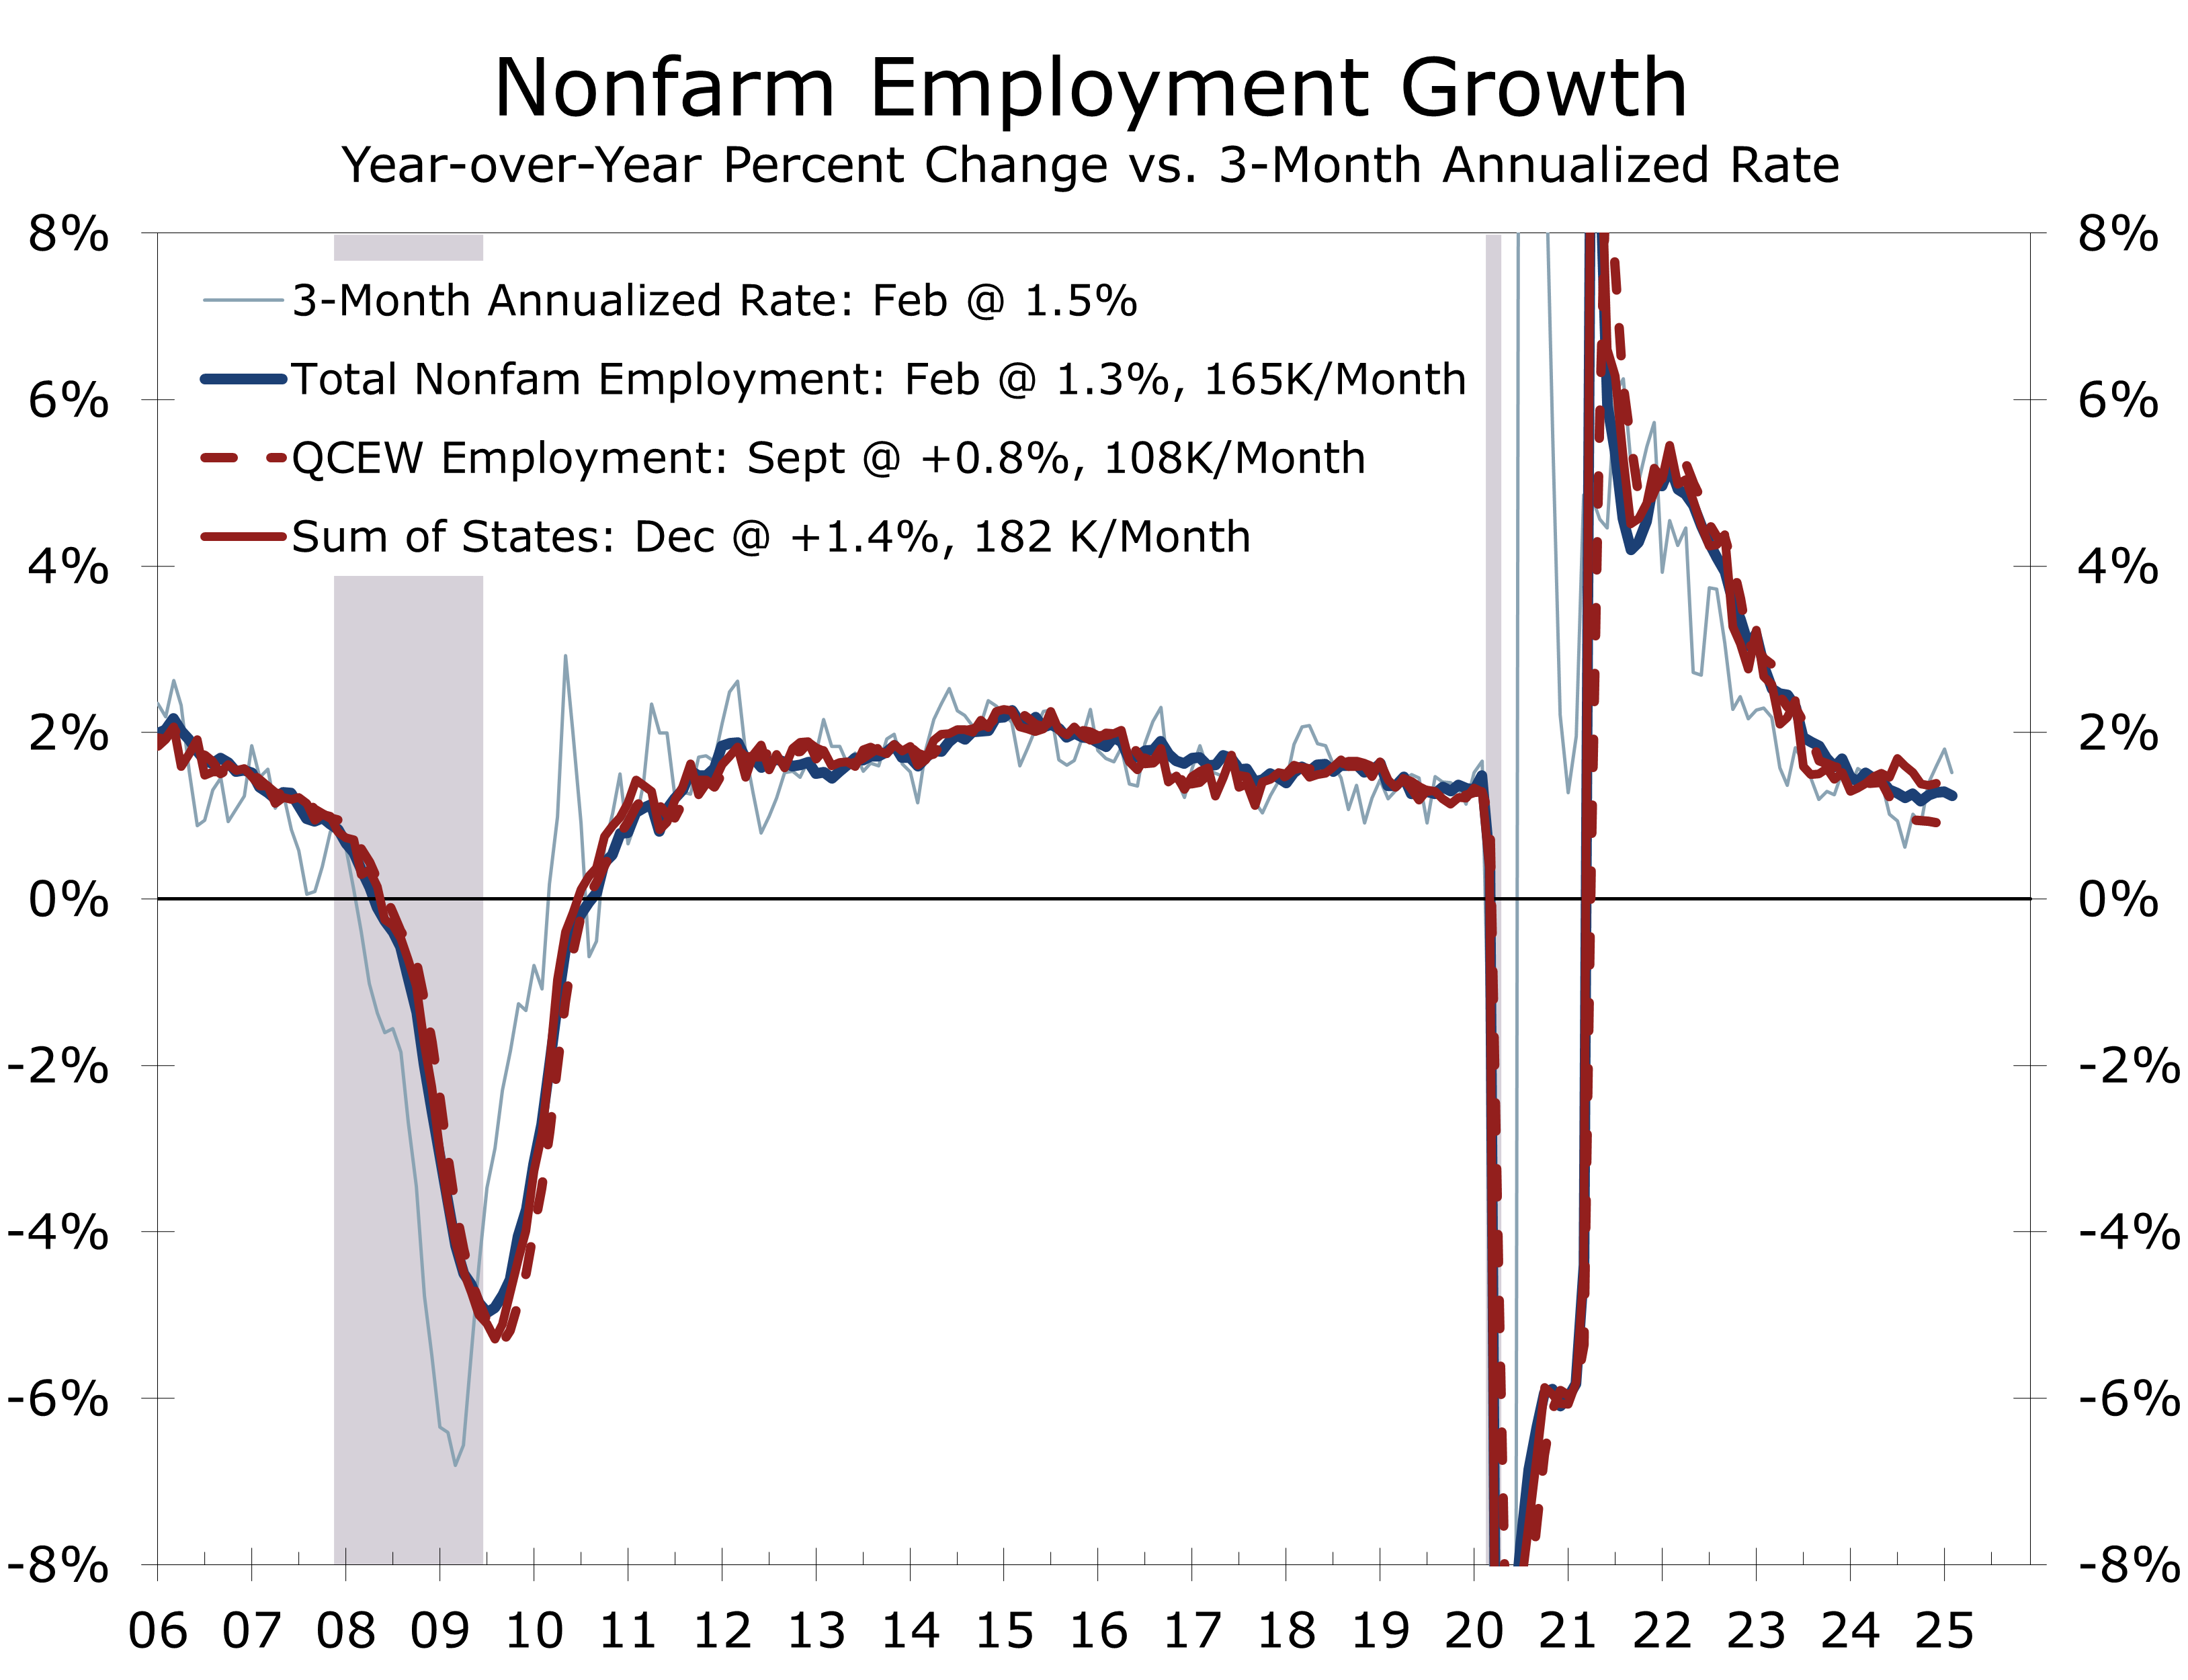
The latest jobs data offer a mixed view of the labor market. The average over the past three months looks perfectly healthy at 200,000 jobs per month. Net hiring the past two months, however, has averaged just 138,000 jobs. By comparison, the latest data show employers have added an average of 168,000 jobs per month over the past year.
The underlying trend of job growth is likely slower than recent data suggest.
QCEW data through September, released after last month’s annual employment revisions, show employers adding just 108,000 jobs per month from September 2023 to September 2024. This suggests job growth will likely be revised lower again in next February’s annual update. Our early projection points to a 0.3% downward revision, or about 475,000 fewer jobs than currently reported. This discrepancy raises caution around the current figures, indicating a weaker labor market than the headline numbers suggest. Slower immigration-driven labor force growth this year further supports this thesis.
Job gains were more broad-based than in recent months, driven by health care, financial activities, transportation and warehousing, and social assistance. The payrolls diffusion index rose 6.0 points to 58.4, near its average of 58.8 for the year prior to Covid, reflecting a welcome broadening beyond the few industries that have dominated growth over the past year. Health care, social services, leisure and hospitality, and government made up over 75% of job gains this past year. Federal government payrolls fell by 10,000, likely due to buyouts and layoffs, while retail trade lost 6,000 jobs, partly due to strike activity.
The breadth of industries adding job increased sharply, both overall and in manufacturing.
A few warning signs are emerging. Part-time employment for economic reasons jumped 460,000 to 4.9 million, indicating more difficulty finding full-time work. Those not in the labor force but wanting a job rose 414,000 to 5.9 million, suggesting more slack in the market. The employment-population ratio dipped 0.2 points to 59.9%, reinforcing the cooling trend.
Wages rose 4.0% year-over-year, down from 4.2% in January, with the average workweek holding at 34.1 hours. Slower earnings growth may ease concerns about wage-driven inflation, giving the Fed more flexibility in its next steps.

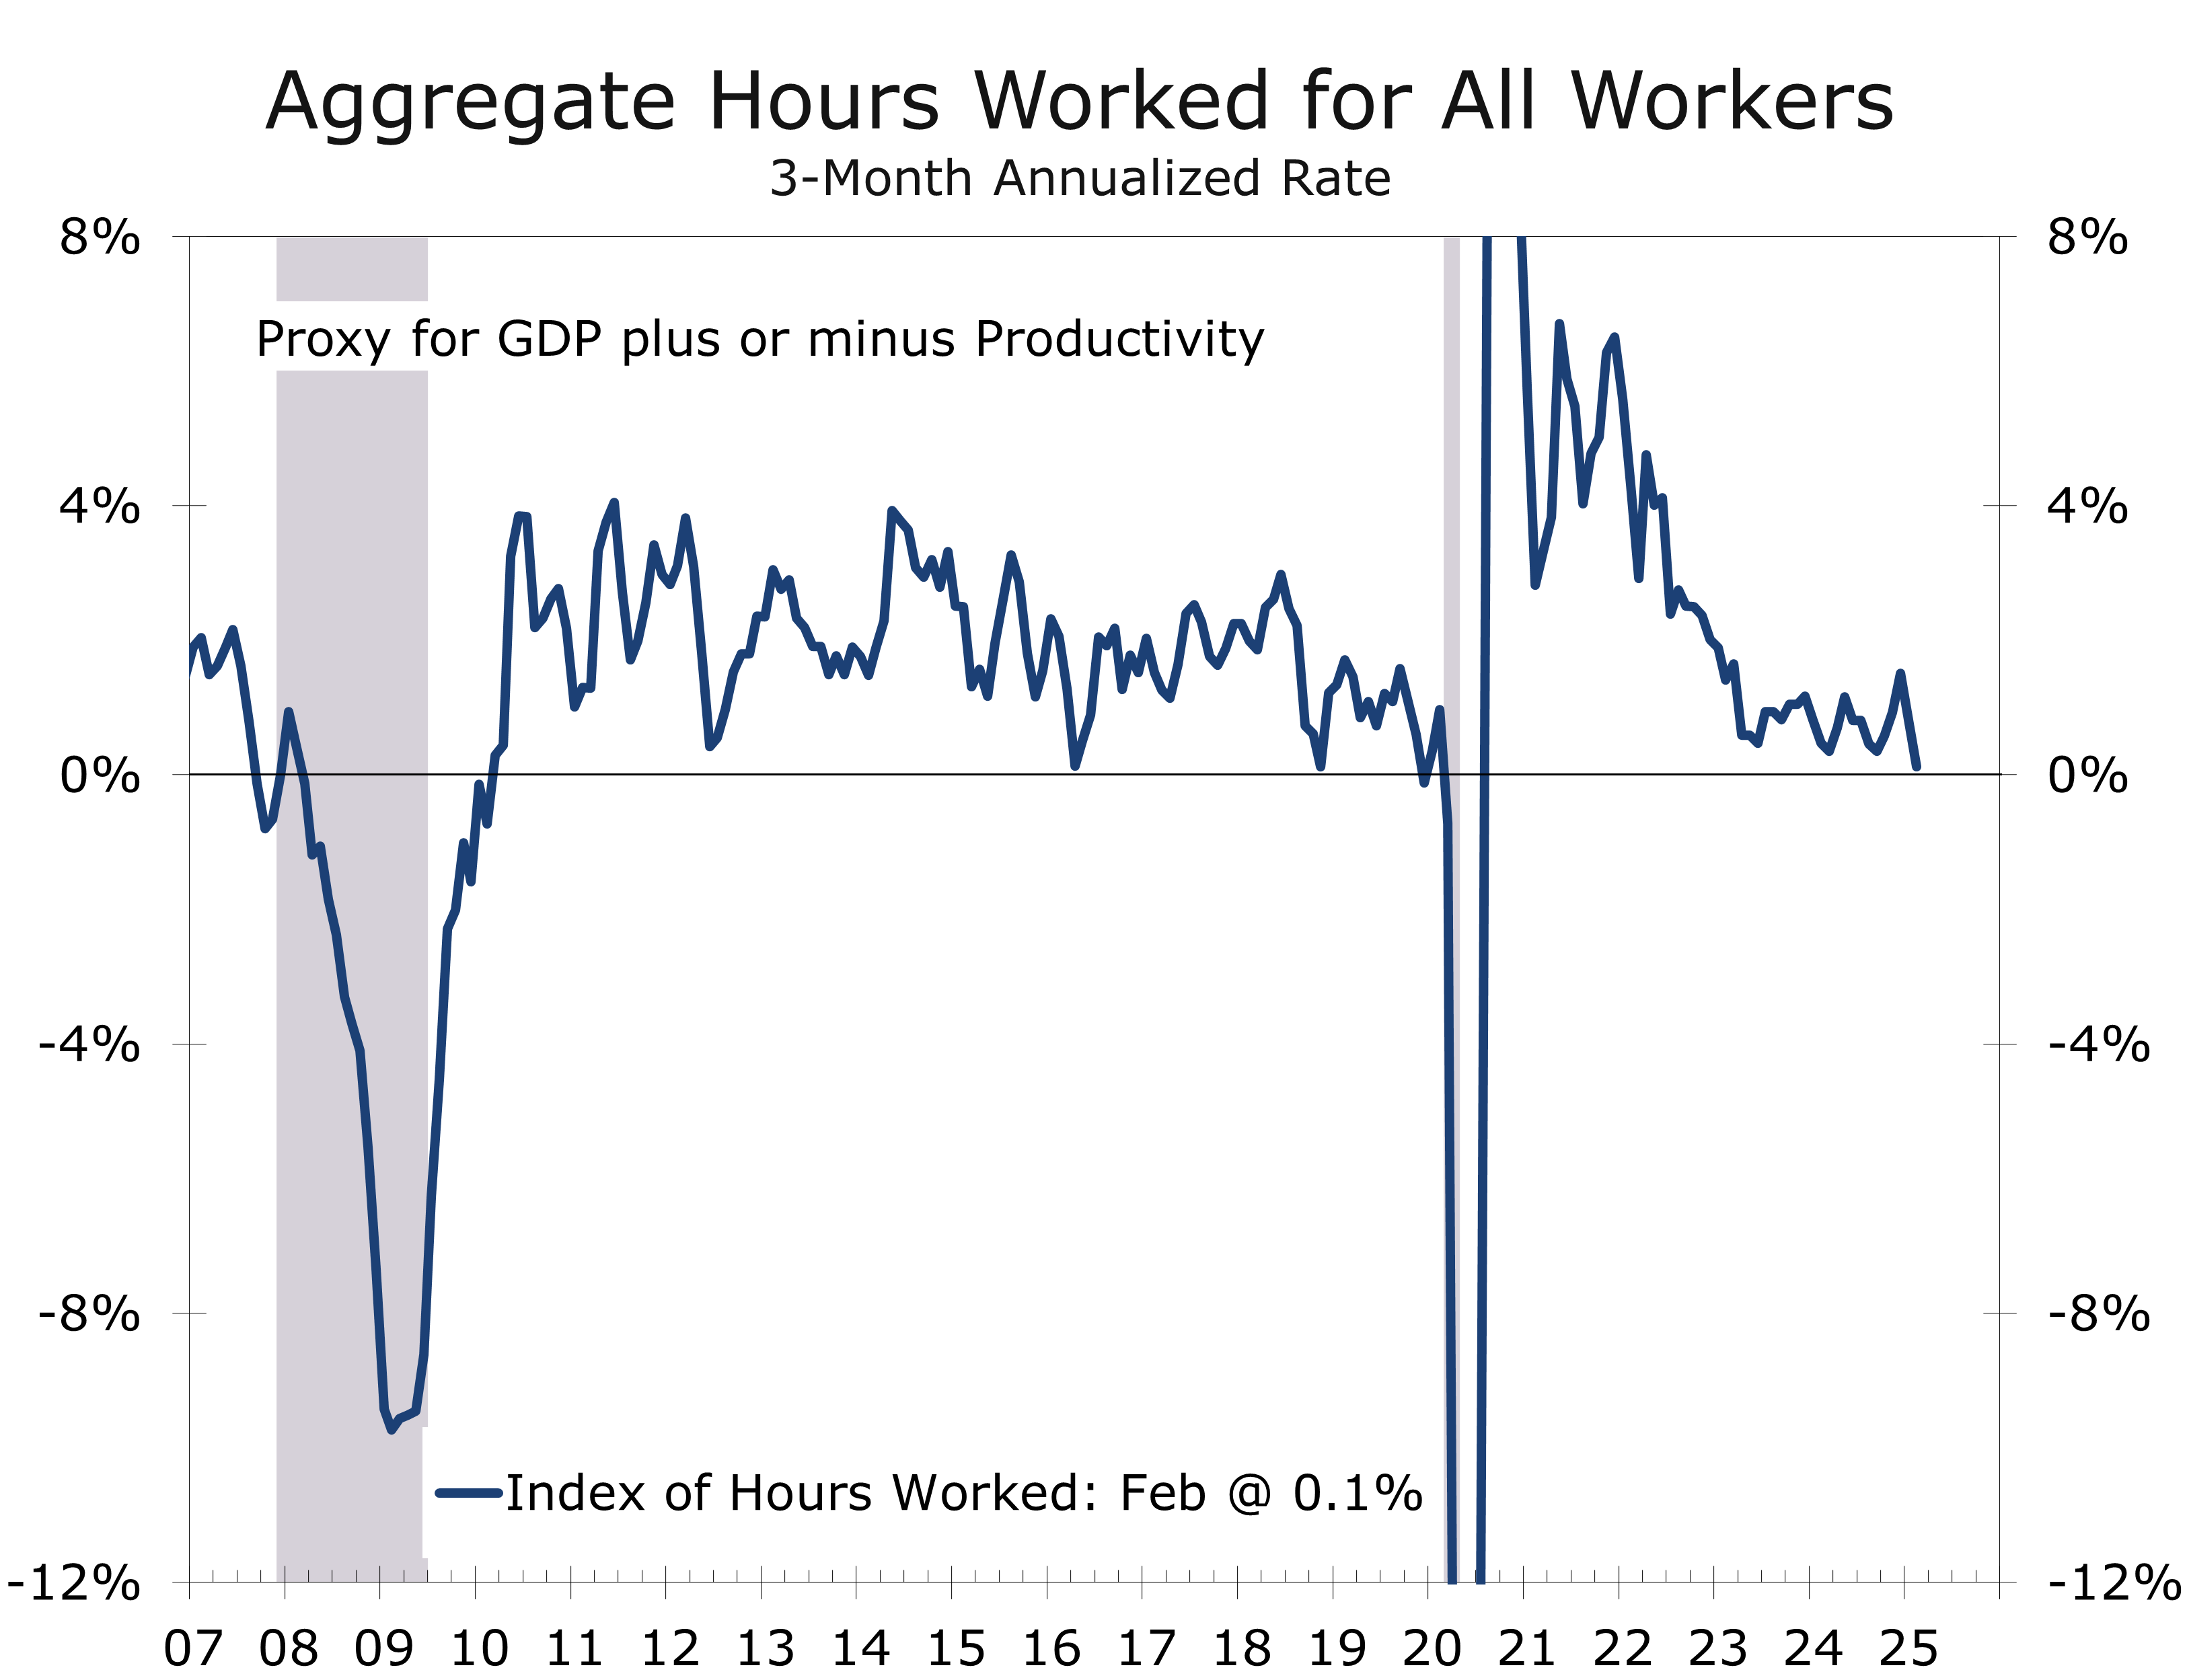
For policymakers, the report delivers a mixed bag. The labor market’s core strength—solid job growth, low unemployment, and slightly more diversified gains—argues for keeping rates steady, at least for now. But the slowdown in hiring, rising part-time work, and softening wage pressures are another indication of the economy losing steam, strengthening the case for an easing this spring. On that point, aggregate hours worked in the economy have risen at just a 0.1% pace over the past three months, implying Q1 real GDP growth somewhere between 1% and 1.5%.
With job growth fraying around the edges, the Fed is likely to focus more on supporting growth.
February’s employment data show a labor market still standing tall but fraying around the edges. Treasury Secretary Bessent noted that he sees signs of the economy rolling over as growth shifts from stimulus-driven growth to private sector-driven growth. The Fed faces a challenge of managing this transition, which currently appears chaotic and has more unknowns than usual. With elevated risks and a longer timeline for reaching its 2% inflation target, the Fed will likely lean more toward supporting growth.
Disclaimer: This publication has been prepared for informational purposes only and is not intended as a recommendation offer or solicitation with respect to the purchase or sale of any security or other financial product nor does it constitute investment advice.
March 7, 2025
Mark Vitner, Chief Economist
Piedmont Crescent Capital
(704) 458-4000