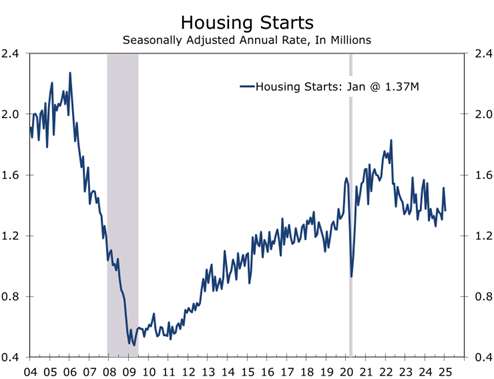
Housing Starts Rebound in February
Housing Starts Bounce Back in February
- Housing starts increased 11.2% to 1.501 million SAAR, though the previous two months’ starts were slightly revised lower.
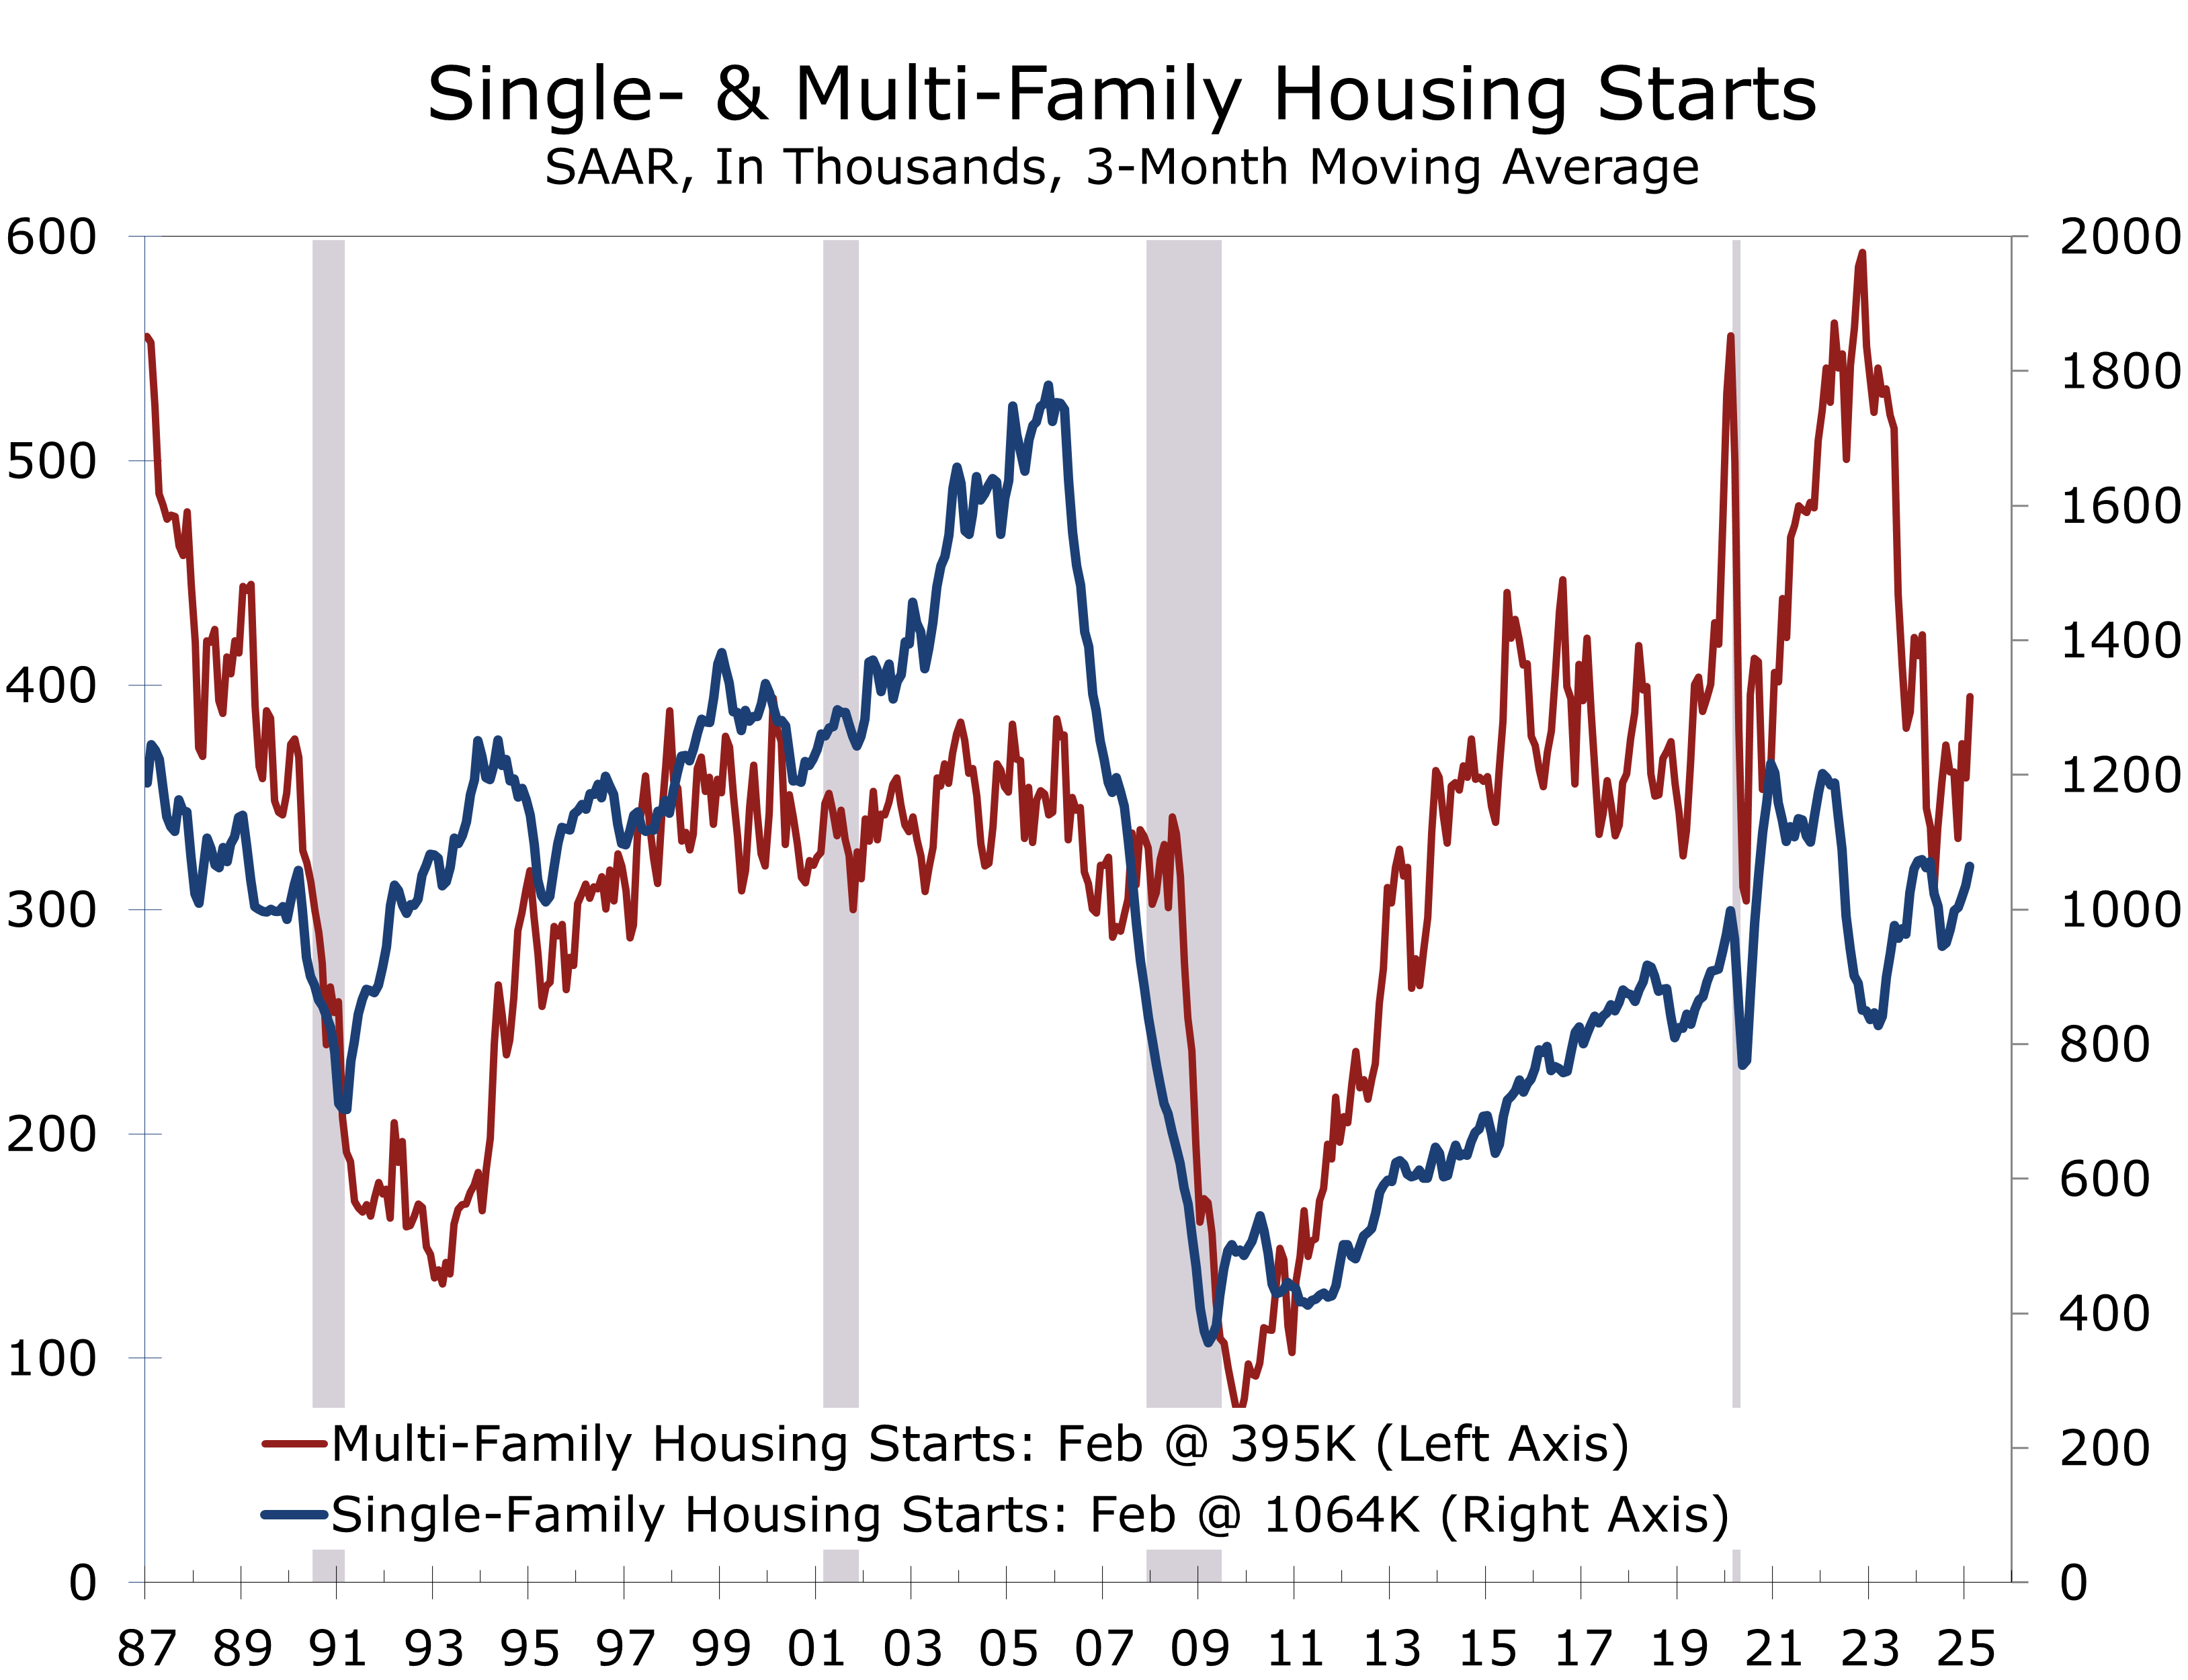
- Single-family starts rose 11.4% to a 1.108 million unit pace, the highest level since February 2024. Multifamily starts increased 10.7% to a 393,000 unit pace.
- Building permits declined 1.2% to 1.456 million units, with single-family permits nearly flat at 992,000 units (down 0.2%) and multifamily falling 3.1% to 464,000 units.
- Weather impacts were evident across the country, with starts soaring in the Northeast (+47.4%) and South (+18.3%), rising solidly in the West (+5.9%), but tumbling in the Midwest (-24.9%).
- Housing completions fell 4.0%, with single-family completions rising 7.1% and multifamily completions falling 20.8%.
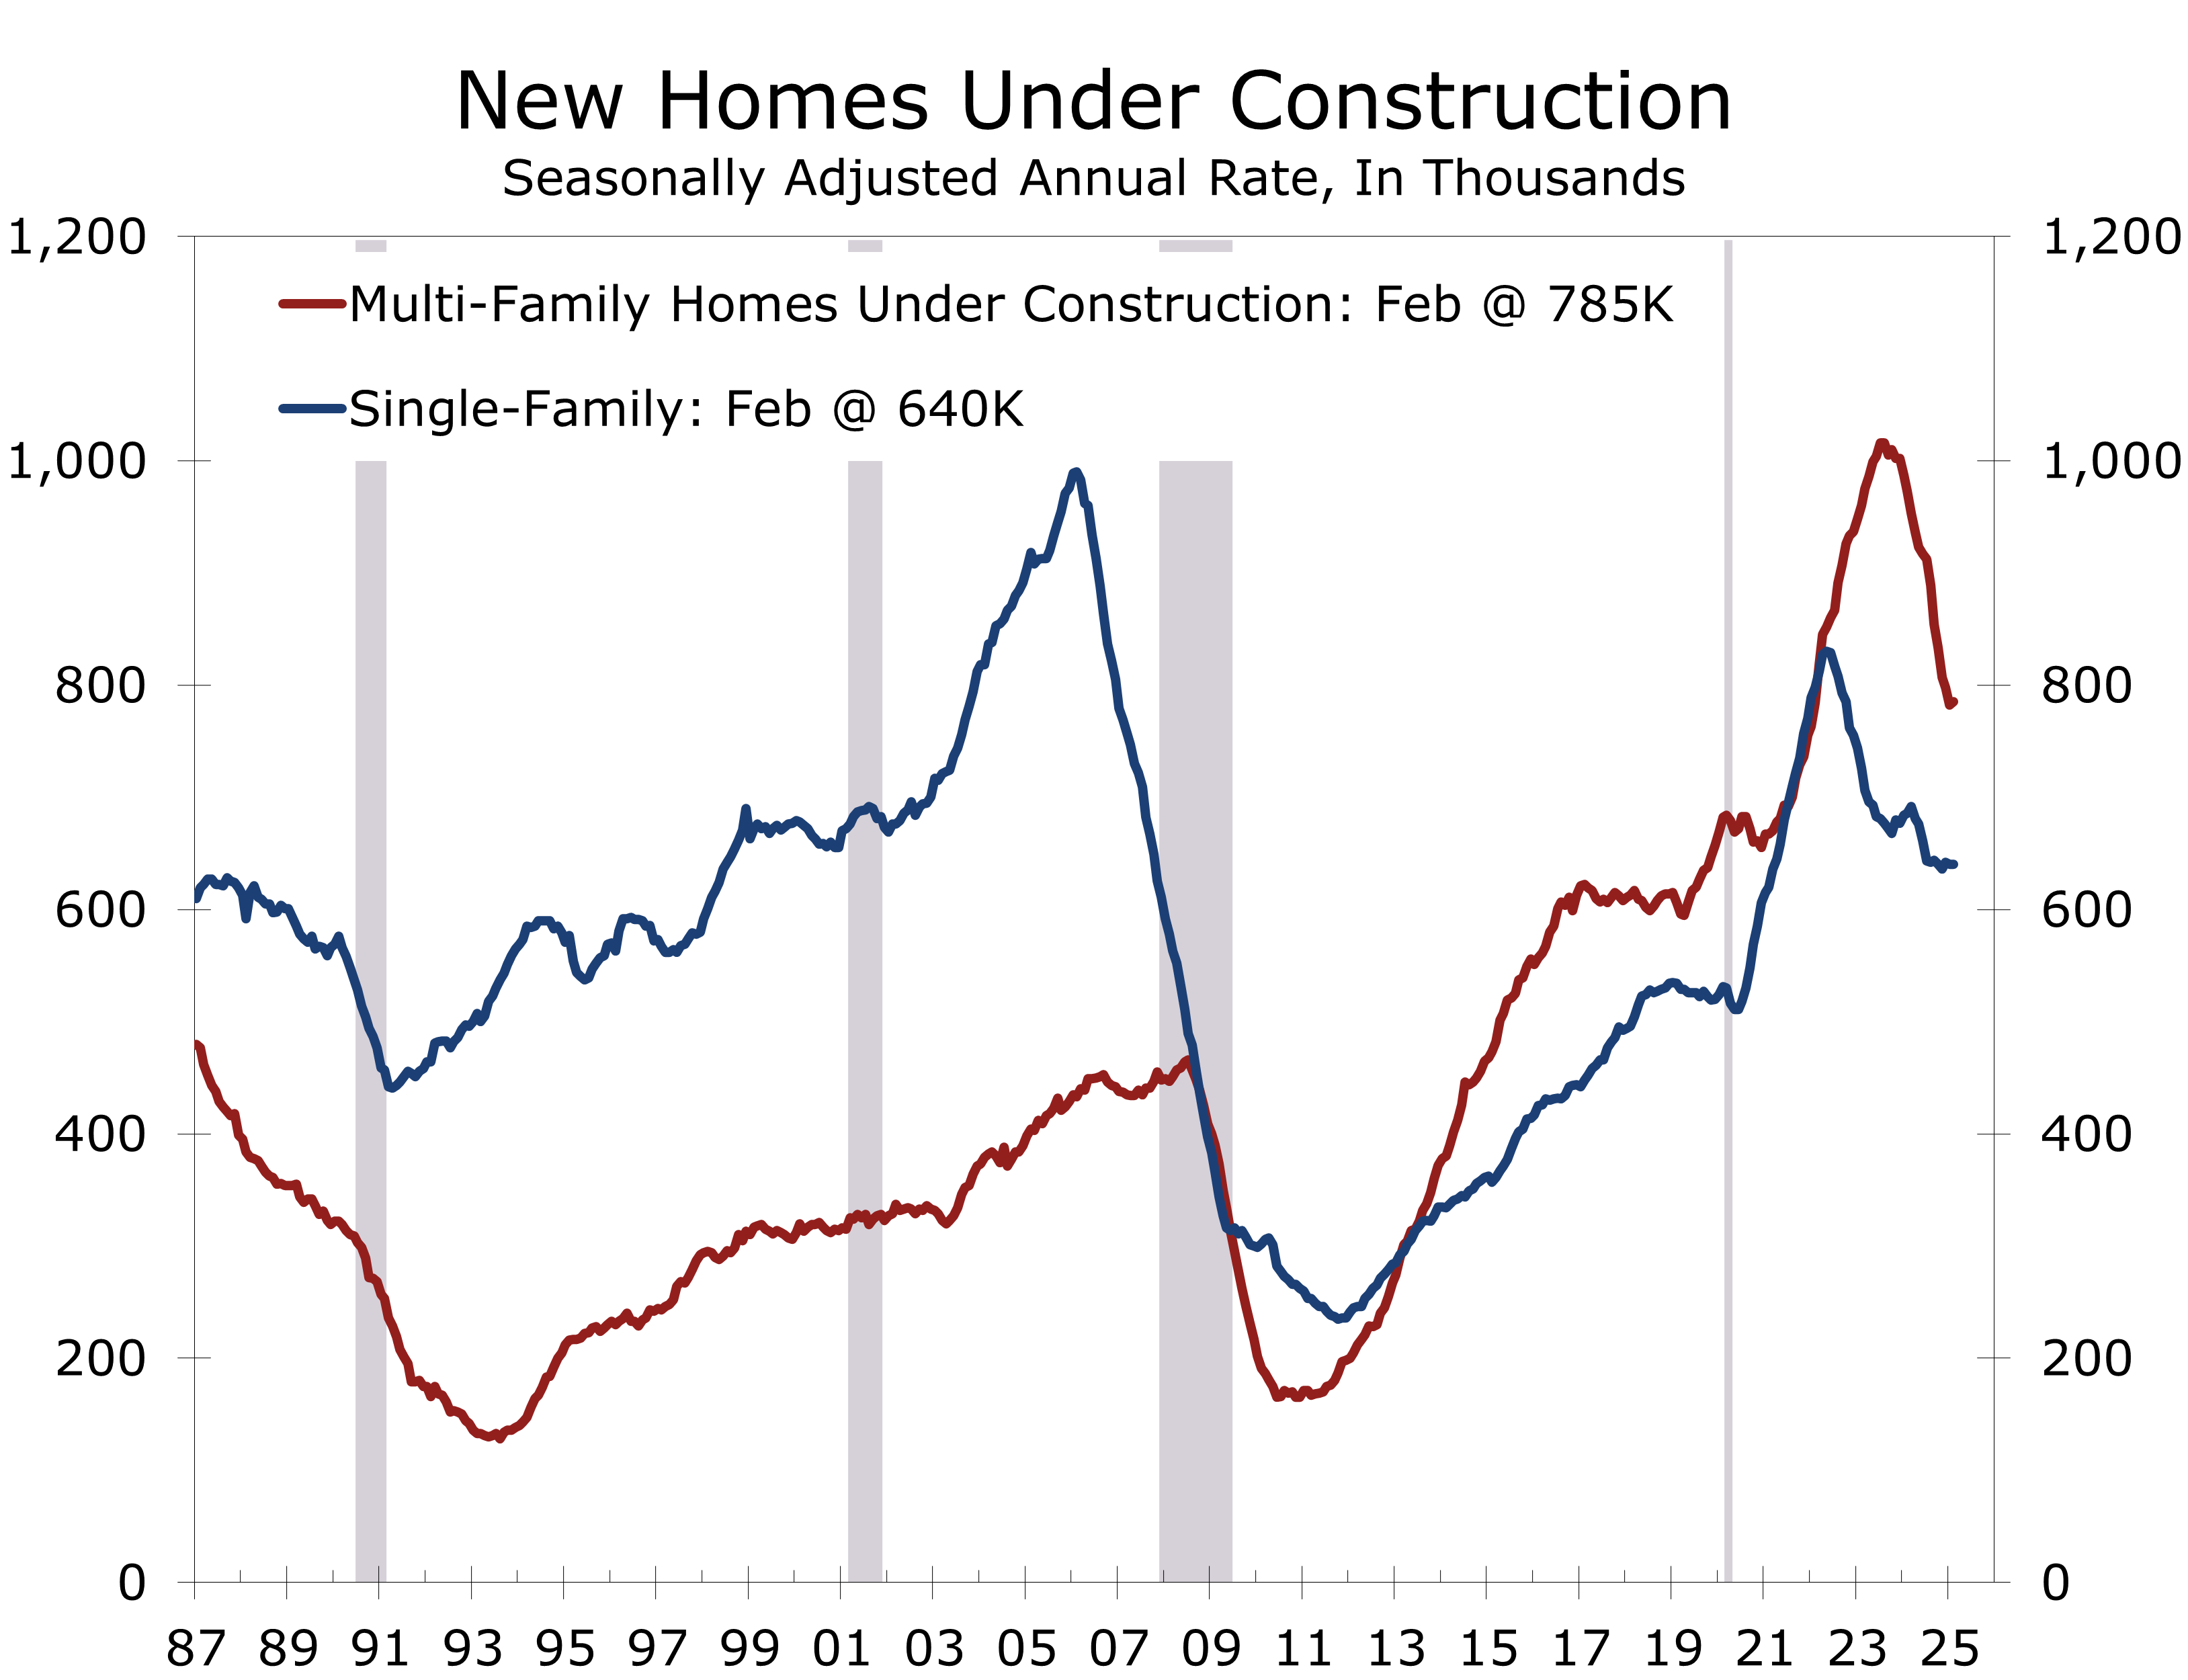
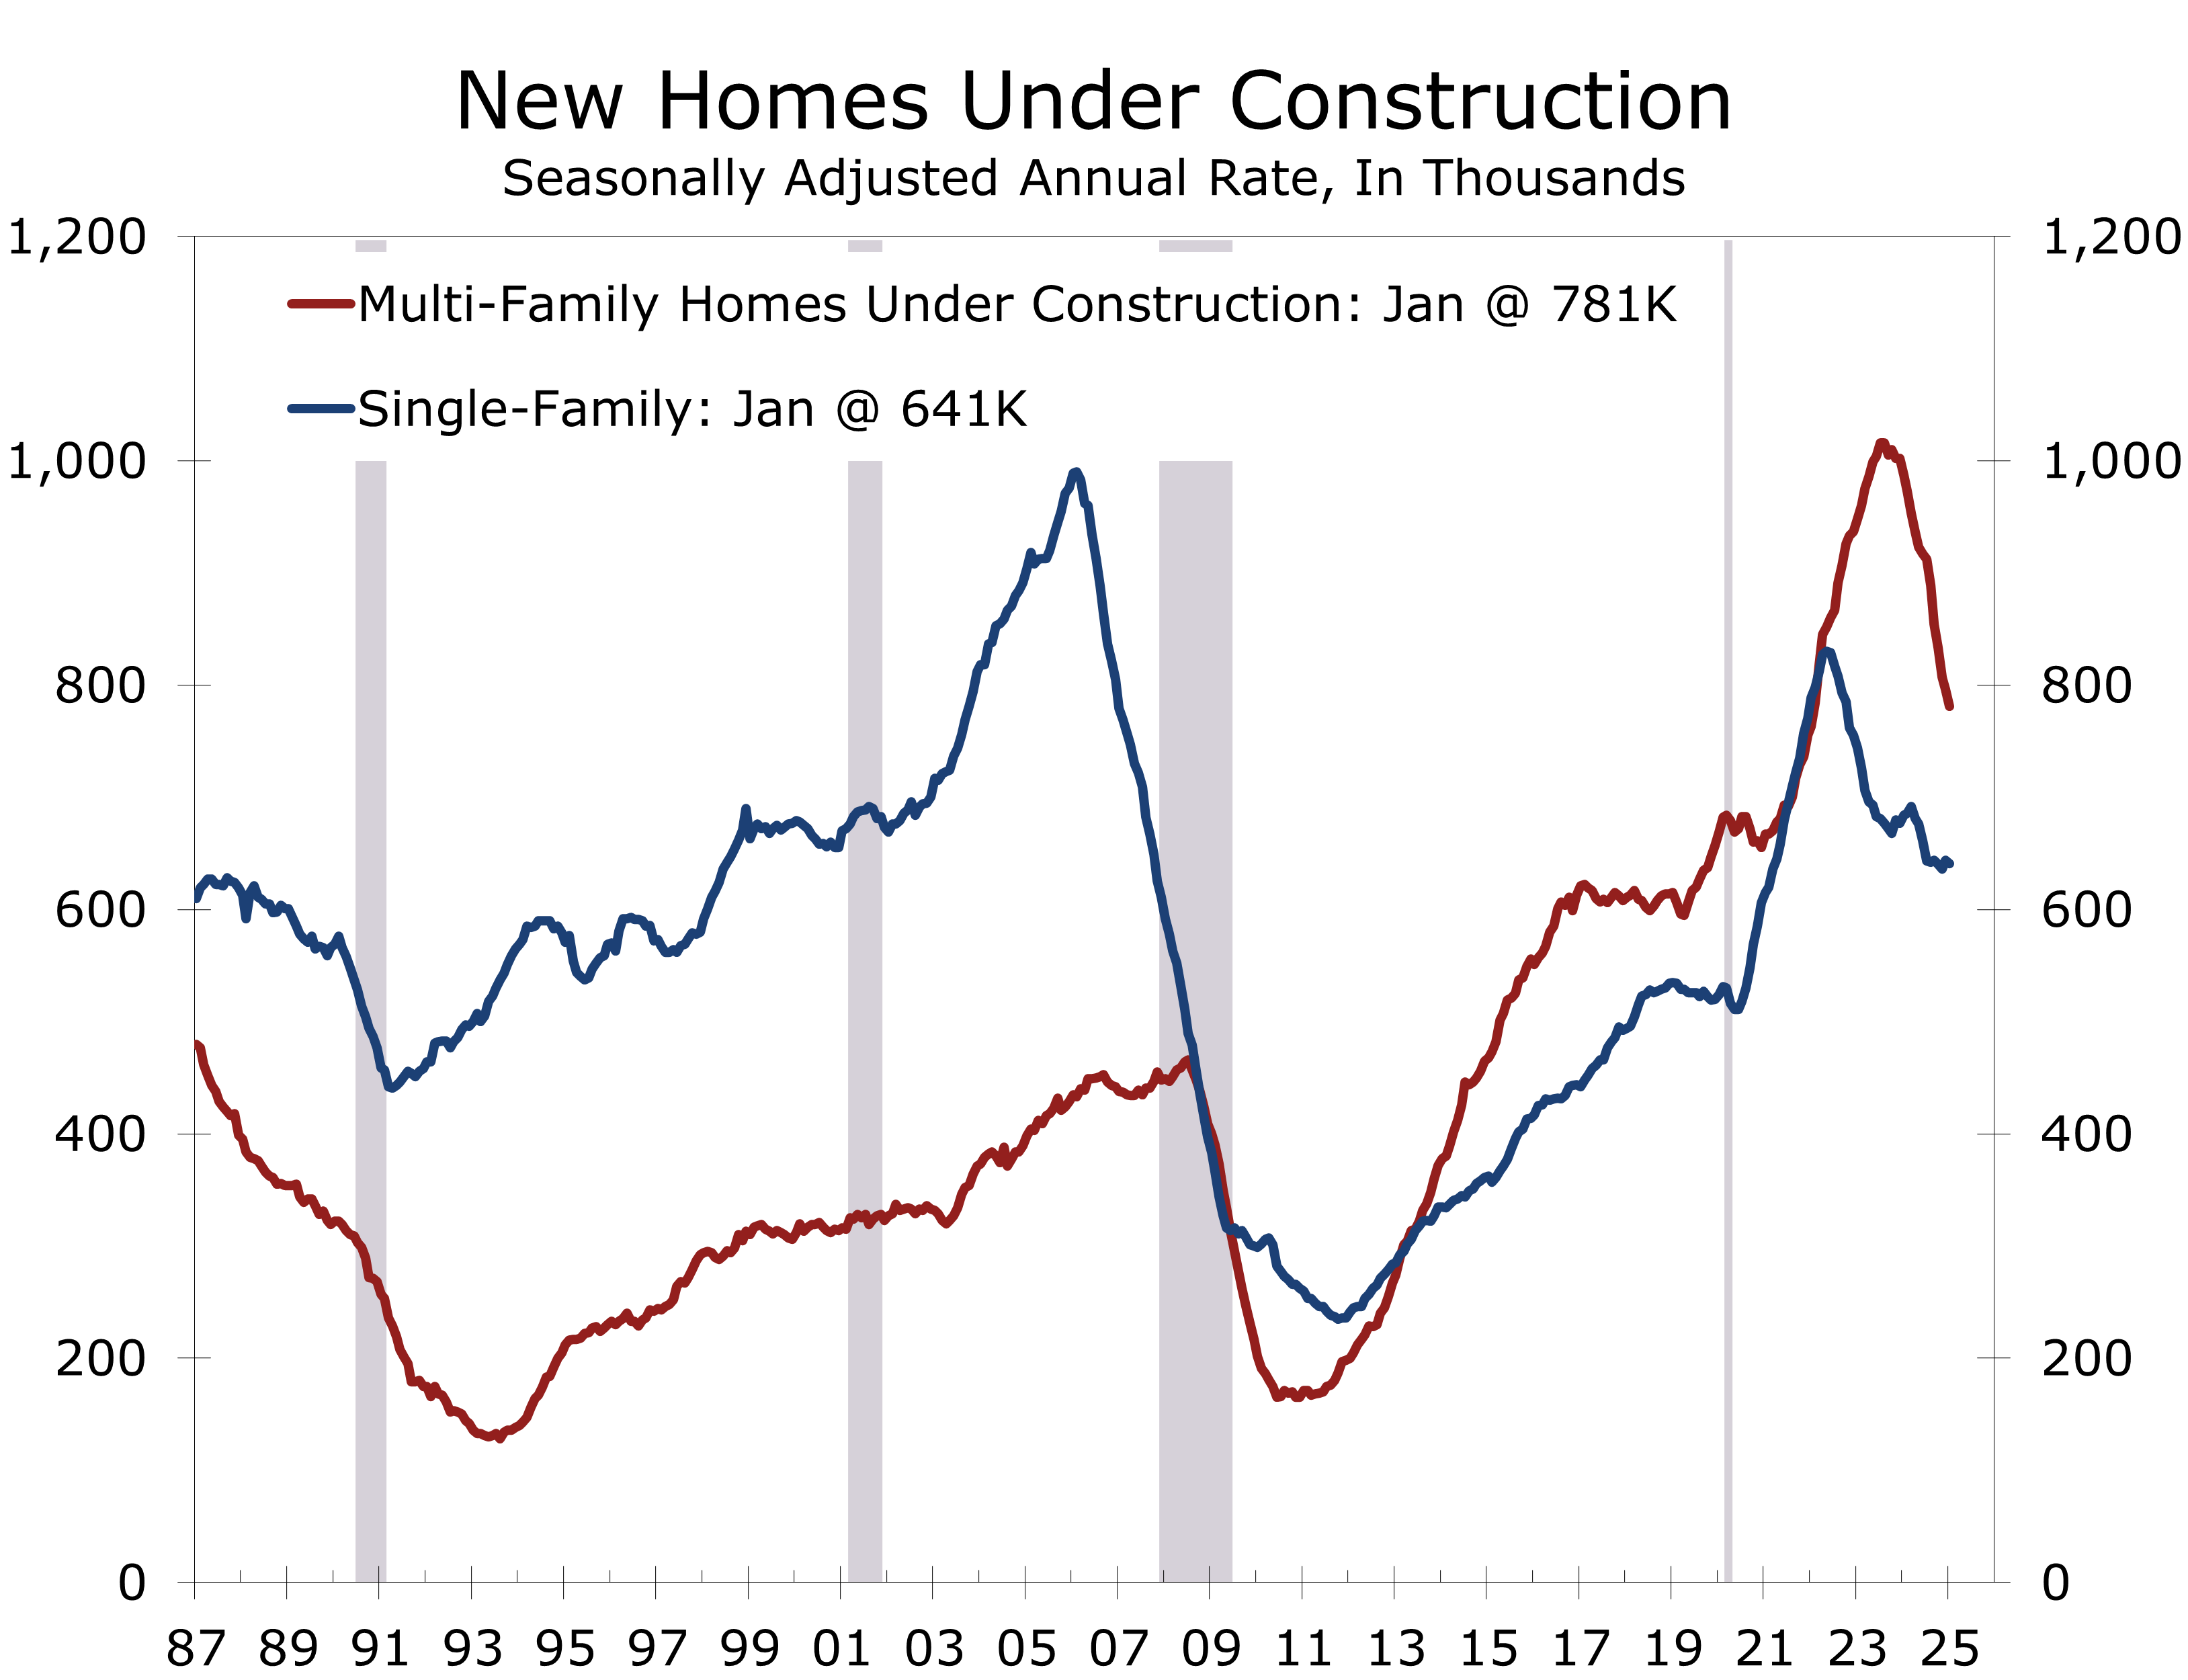
- Units under construction edged up 0.1%, with single-family units flat and multifamily units up 0.3%.
- Homebuilding faces a challenging year. High home prices, elevated mortgage rates, a weakening labor market, persistent inflation and policy uncertainty are keeping many potential buyers on the sidelines.
Home building rebounded in February, with housing starts surging 11.2% to a 1.51 million unit seasonally adjusted annual rate (SAAR). This increase exceeded expectations for a modest rebound following January’s weather-related slowdown. Building permits—which tend to lead starts by 1 to 2 months and are less influenced by weather distortions—dipped 1.2% to a 1.456 million-unit pace. While the stronger February housing starts data is a rare bit of good news, we doubt it reflects a momentum shift for the sector, which faces persistent headwinds from tariffs, labor shortages, and sagging consumer sentiment.
The jump in housing starts was broad-based, driven by an 11.4% increase in single-family starts to a 1.108 million unit pace and a 10.7% rise in multifamily starts to 393,000 units. The rebound reflects a normalization after January’s severe winter weather disrupted construction, particularly in the Northeast and South.
February’s stronger housing starts likely does not signal a momentum shift for home building.
Starts averaged 1.426 million units the past 2 months, close to the recent trend in permits and consistent with our 2025 forecast for 1.445 million starts. Building permits fell 1.2% and have averaged 1.465 million units the past two months. Single-family held steady at 992,000 units, while multifamily fell 3.1%, reflecting uneasiness about the torrent of new supply.
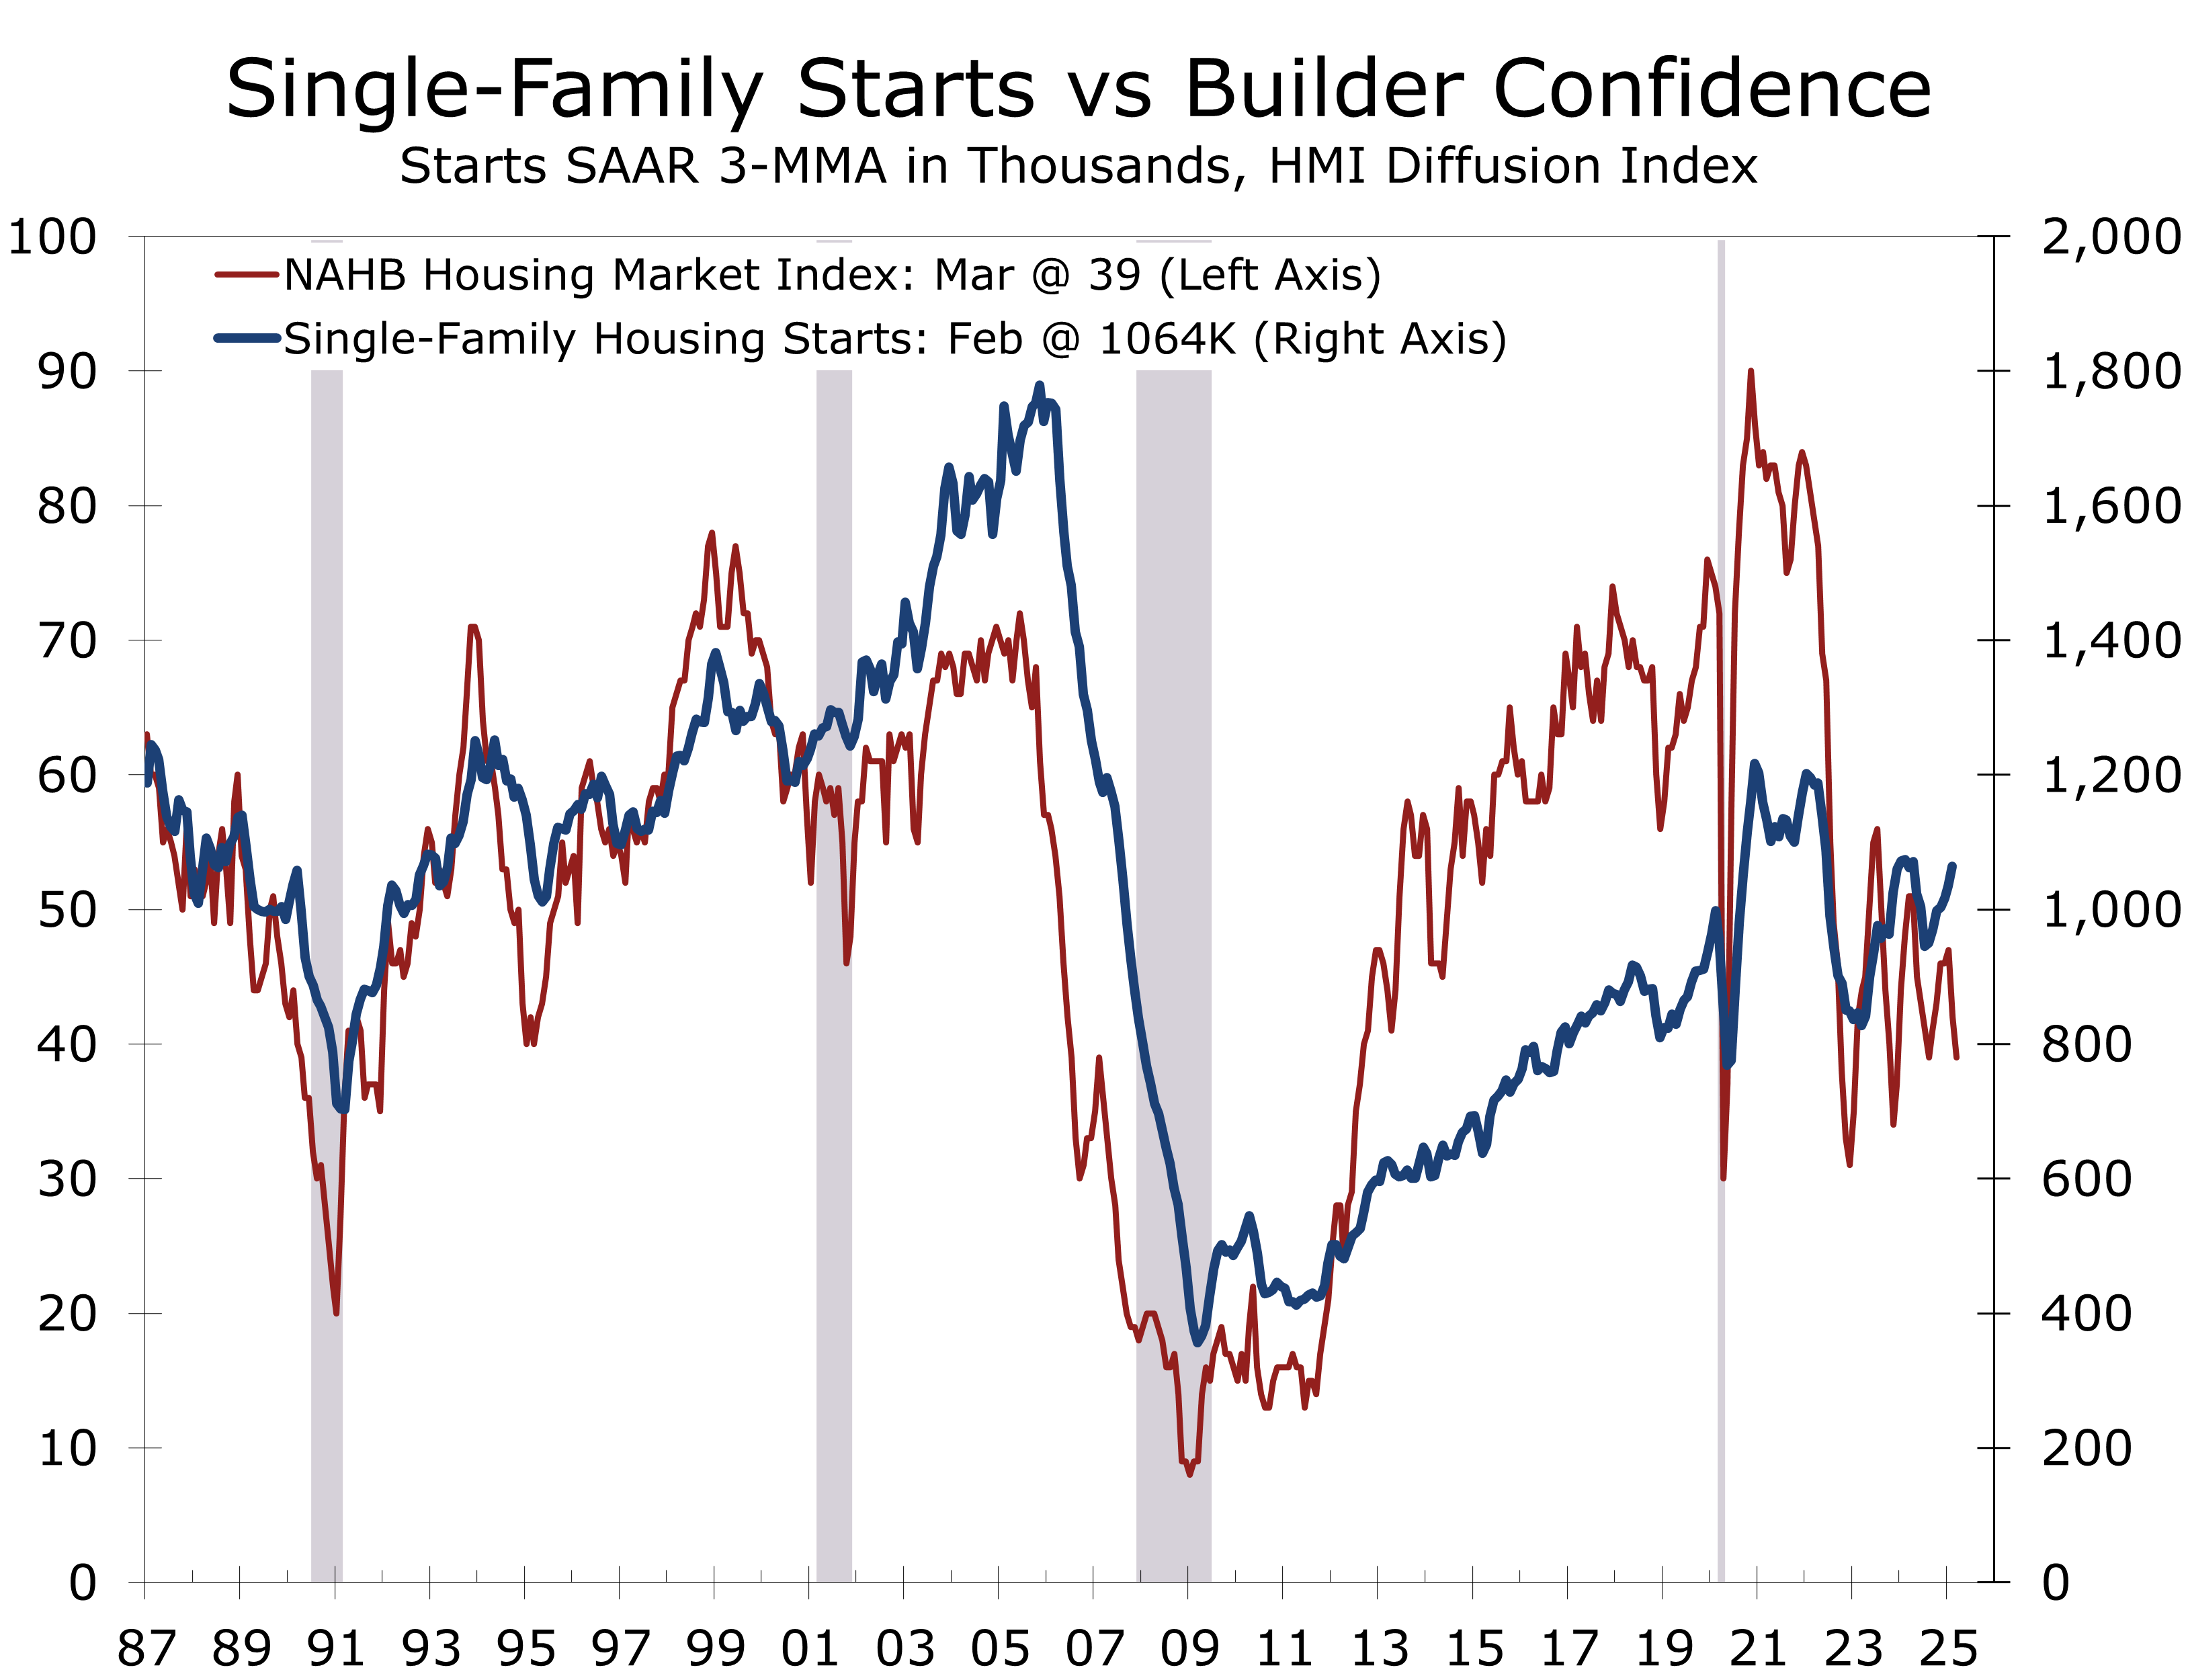
Builder sentiment, as measured by the National Association of Home Builders (NAHB)/Wells Fargo Housing Market Index (HMI), fell to 39 in March—its lowest since August 2024. Homebuilders cited potentially higher input costs from tariffs and worsening labor shortages tied to immigration policies under President Trump. Despite a 40-basis-point decline in mortgage rates since January, builders noted growing buyer caution and weaker prospective buyer traffic. Prospective buyer traffic tumbled 5 points in March to 24, its lowest level in 15 months.
Builders remain exceptionally cautious, reflecting uncertainty and weak buyer traffic.
February’s rise in housing starts was concentrated in the Northeast (+47.4%) and South (+18.3%), which both rebounded from unseasonably cold winter weather in January. By contrast, starts rose a more modest 5.9% in the West and plunged 24.9% in the Midwest.
Permits were also mixed, with the Midwest posting an +8.9% rise. The South (+1.0%) also posted a modest gain, while permits fell in the Northeast (-15.3%) and West (-7.6%). Despite the drop, the West is proving resilient, following a 42.3% surge in January. The Midwest’s volatility underscores disparities driven by weather, economic conditions, and supply constraints.
Housing completions dipped 4.0%, primarily due to a 20.8% drop in multifamily units. Single-family completions rose 7.1%. Units under construction saw a negligible increase, yet remain down for the quarter, which will weigh on residential investment and is consistent our forecast for just 1.2% Q1 GDP growth.
While the quarter was soft, February’s stronger data provide a glimmer of optimism. The January-February average of 1.426 million starts, coupled with steady permits, suggesting a possible floor for home building. Sustaining this momentum faces significant hurdles, however. Tariffs are inflating input costs, labor shortages are intensifying, and economic uncertainty is eroding both builder and buyer confidence. While recent mortgage rate declines offer some relief, buyer wariness persists, as evidenced by the NAHB survey, casting doubt on the spring selling season.
The housing sector’s significance to the broader economy remains paramount. The Federal Reserve possesses levers to stimulate construction, notably by cutting short-term rates and narrowing the substantial spread between 30-year mortgages and 10-year Treasuries. Ending quantitative tightening would provide additional relief.
Disclaimer: This publication has been prepared for informational purposes only and is not intended as a recommendation offer or solicitation with respect to the purchase or sale of any security or other financial product nor does it constitute investment advice.
March 18, 2025
Mark Vitner, Chief Economist
Piedmont Crescent Capital
(704) 458-4000
The Labor Market Shows Signs of Fraying Around the Edges
Another Month of Steady but Moderating Job Growth
- Employers added 151,000 in February, topping January’s downwardly revised 125,000-job gain.
- The unemployment rate inched up to 4.1% from 4.0%.
- Job gains broadened, with health care (+52,000), financial activities (+21,000), transportation and warehousing (+18,000), and social assistance (+11,000) leading growth.
- Part-time employment for economic reasons jumped by 460,000; those not in the labor force but wanting a job rose by 414,000.
- Wage growth eased to just 4.0% year-over-year, down from 4.2% in January.
- Secretary Bessent noted the economy is shift away from stimulus-driven growth, which will likely result in more moderate job gains this year. The downside risks to growth have clearly increased, and softer hours worked and slower wage growth are consistent with our call for real GDP growth at around a 1.2% pace this quarter.
Sample report copy. Edit here to change this text. Lorem ipsum dolor sit amet, consectetur adipiscing elit. Ut elit tellus, luctus nec ullamcorper mattis, pulvinar dapibus leo.
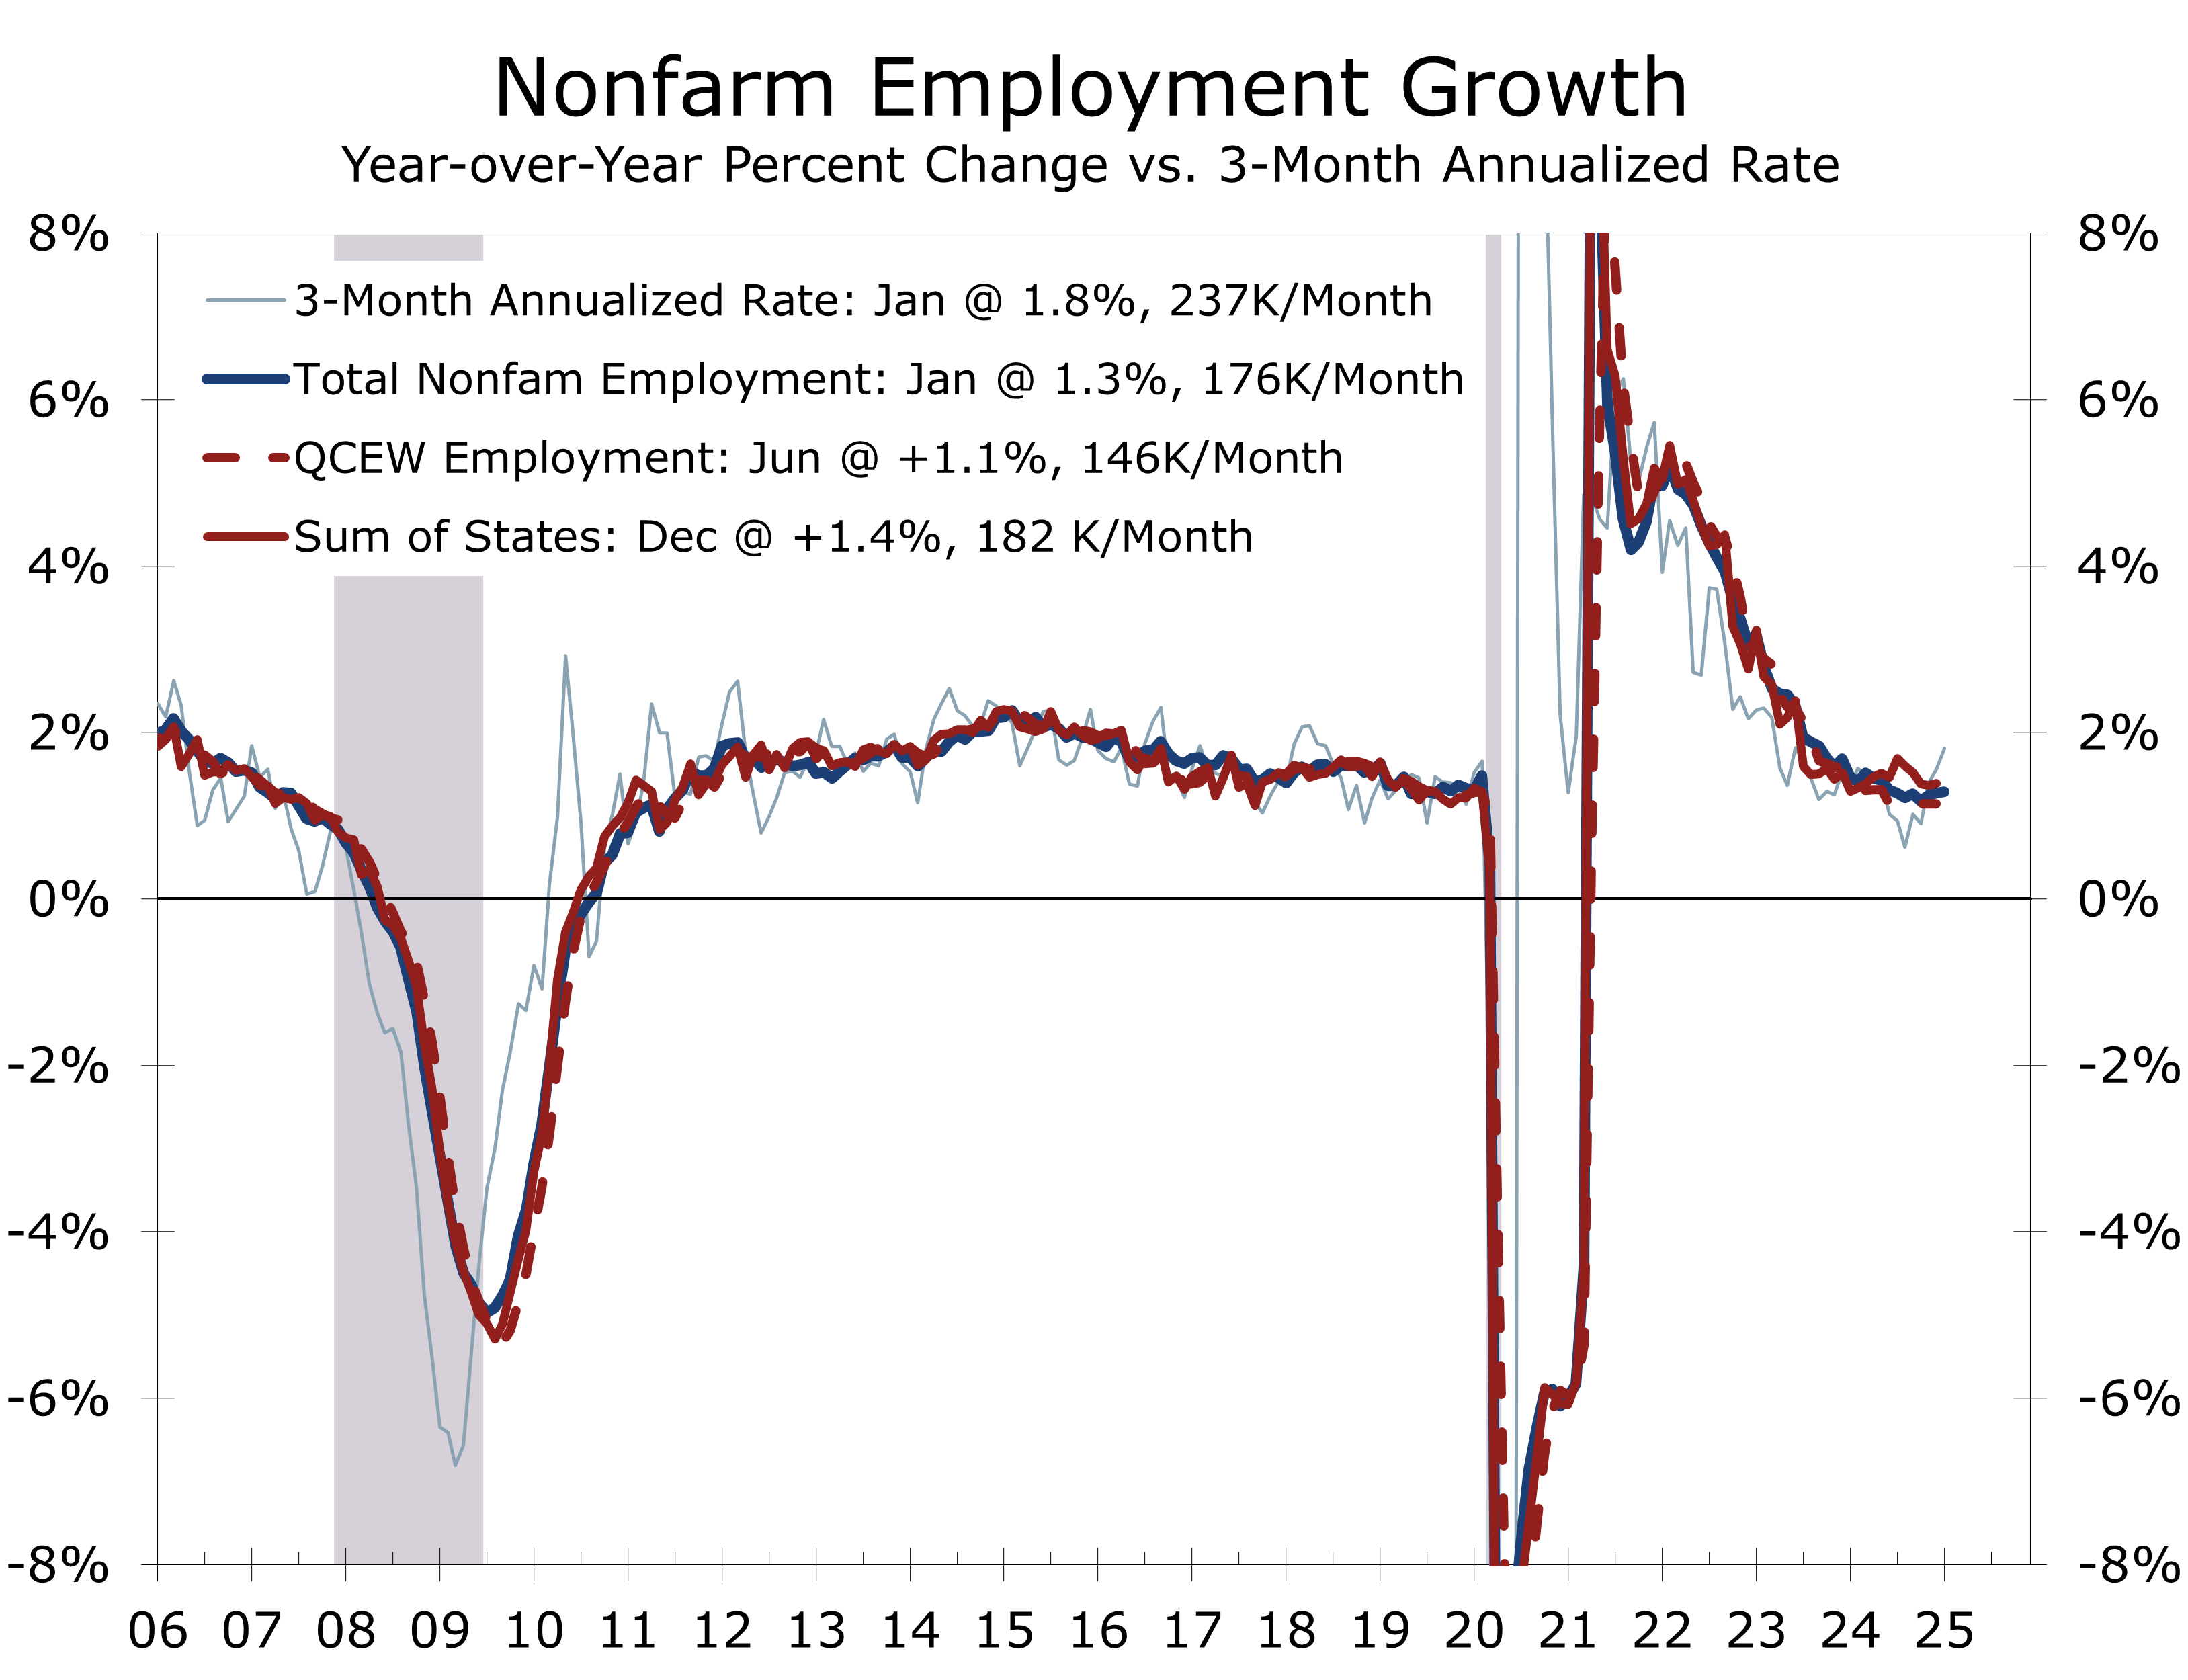
The February jobs report paints a labor market that’s holding firm but beginning to fray around the edges. Nonfarm payrolls rose by 151,000, outpacing January’s downwardly revised 125,000, though the three-month average dipped to roughly 200,000 from 237,000—a clear sign that hiring momentum is slowing. The unemployment rate crept up to 4.1%, a slight uptick that suggests the labor market’s tightness is beginning to loosen after a prolonged stretch near historic lows.
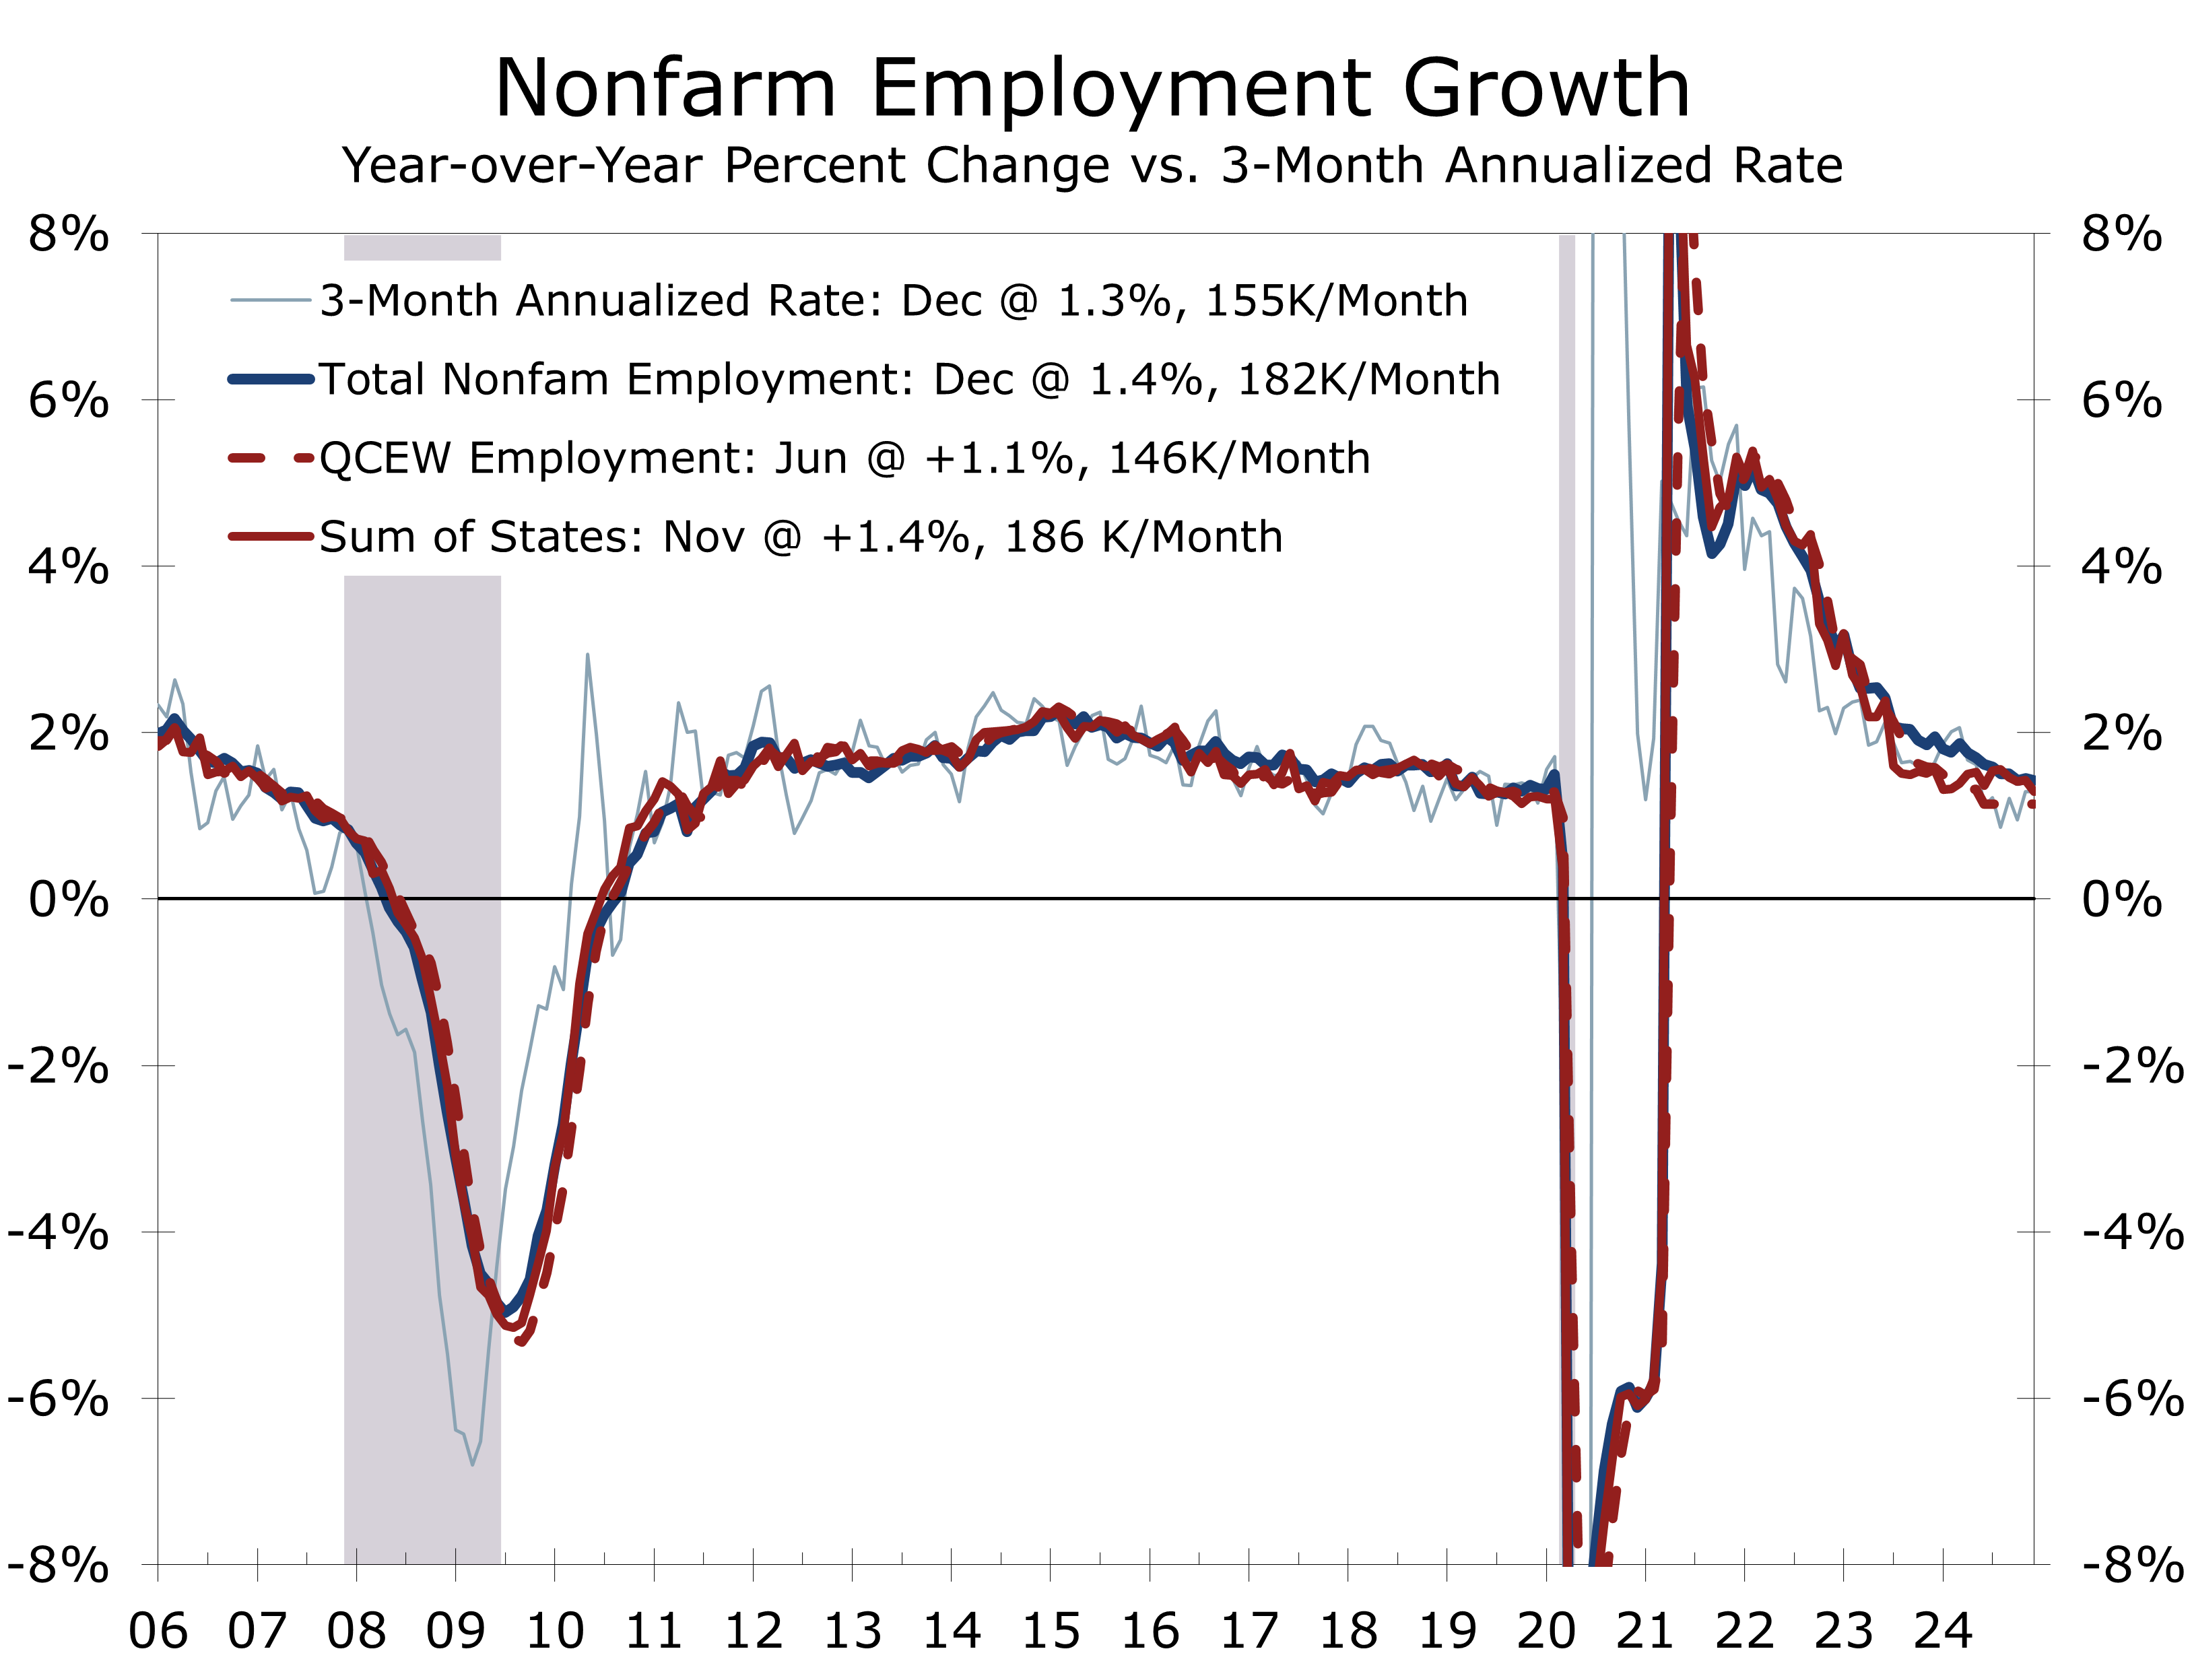
The latest jobs data offer a mixed view of the labor market. The average over the past three months looks perfectly healthy at 200,000 jobs per month. Net hiring the past two months, however, has averaged just 138,000 jobs. By comparison, the latest data show employers have added an average of 168,000 jobs per month over the past year.
The underlying trend of job growth is likely slower than recent data suggest.
QCEW data through September, released after last month’s annual employment revisions, show employers adding just 108,000 jobs per month from September 2023 to September 2024. This suggests job growth will likely be revised lower again in next February’s annual update. Our early projection points to a 0.3% downward revision, or about 475,000 fewer jobs than currently reported. This discrepancy raises caution around the current figures, indicating a weaker labor market than the headline numbers suggest. Slower immigration-driven labor force growth this year further supports this thesis.

Job gains were more broad-based than in recent months, driven by health care, financial activities, transportation and warehousing, and social assistance. The payrolls diffusion index rose 6.0 points to 58.4, near its average of 58.8 for the year prior to Covid, reflecting a welcome broadening beyond the few industries that have dominated growth over the past year. Health care, social services, leisure and hospitality, and government made up over 75% of job gains this past year. Federal government payrolls fell by 10,000, likely due to buyouts and layoffs, while retail trade lost 6,000 jobs, partly due to strike activity.
The breadth of industries adding job increased sharply, both overall and in manufacturing.
A few warning signs are emerging. Part-time employment for economic reasons jumped 460,000 to 4.9 million, indicating more difficulty finding full-time work. Those not in the labor force but wanting a job rose 414,000 to 5.9 million, suggesting more slack in the market. The employment-population ratio dipped 0.2 points to 59.9%, reinforcing the cooling trend.
Wages rose 4.0% year-over-year, down from 4.2% in January, with the average workweek holding at 34.1 hours. Slower earnings growth may ease concerns about wage-driven inflation, giving the Fed more flexibility in its next steps.

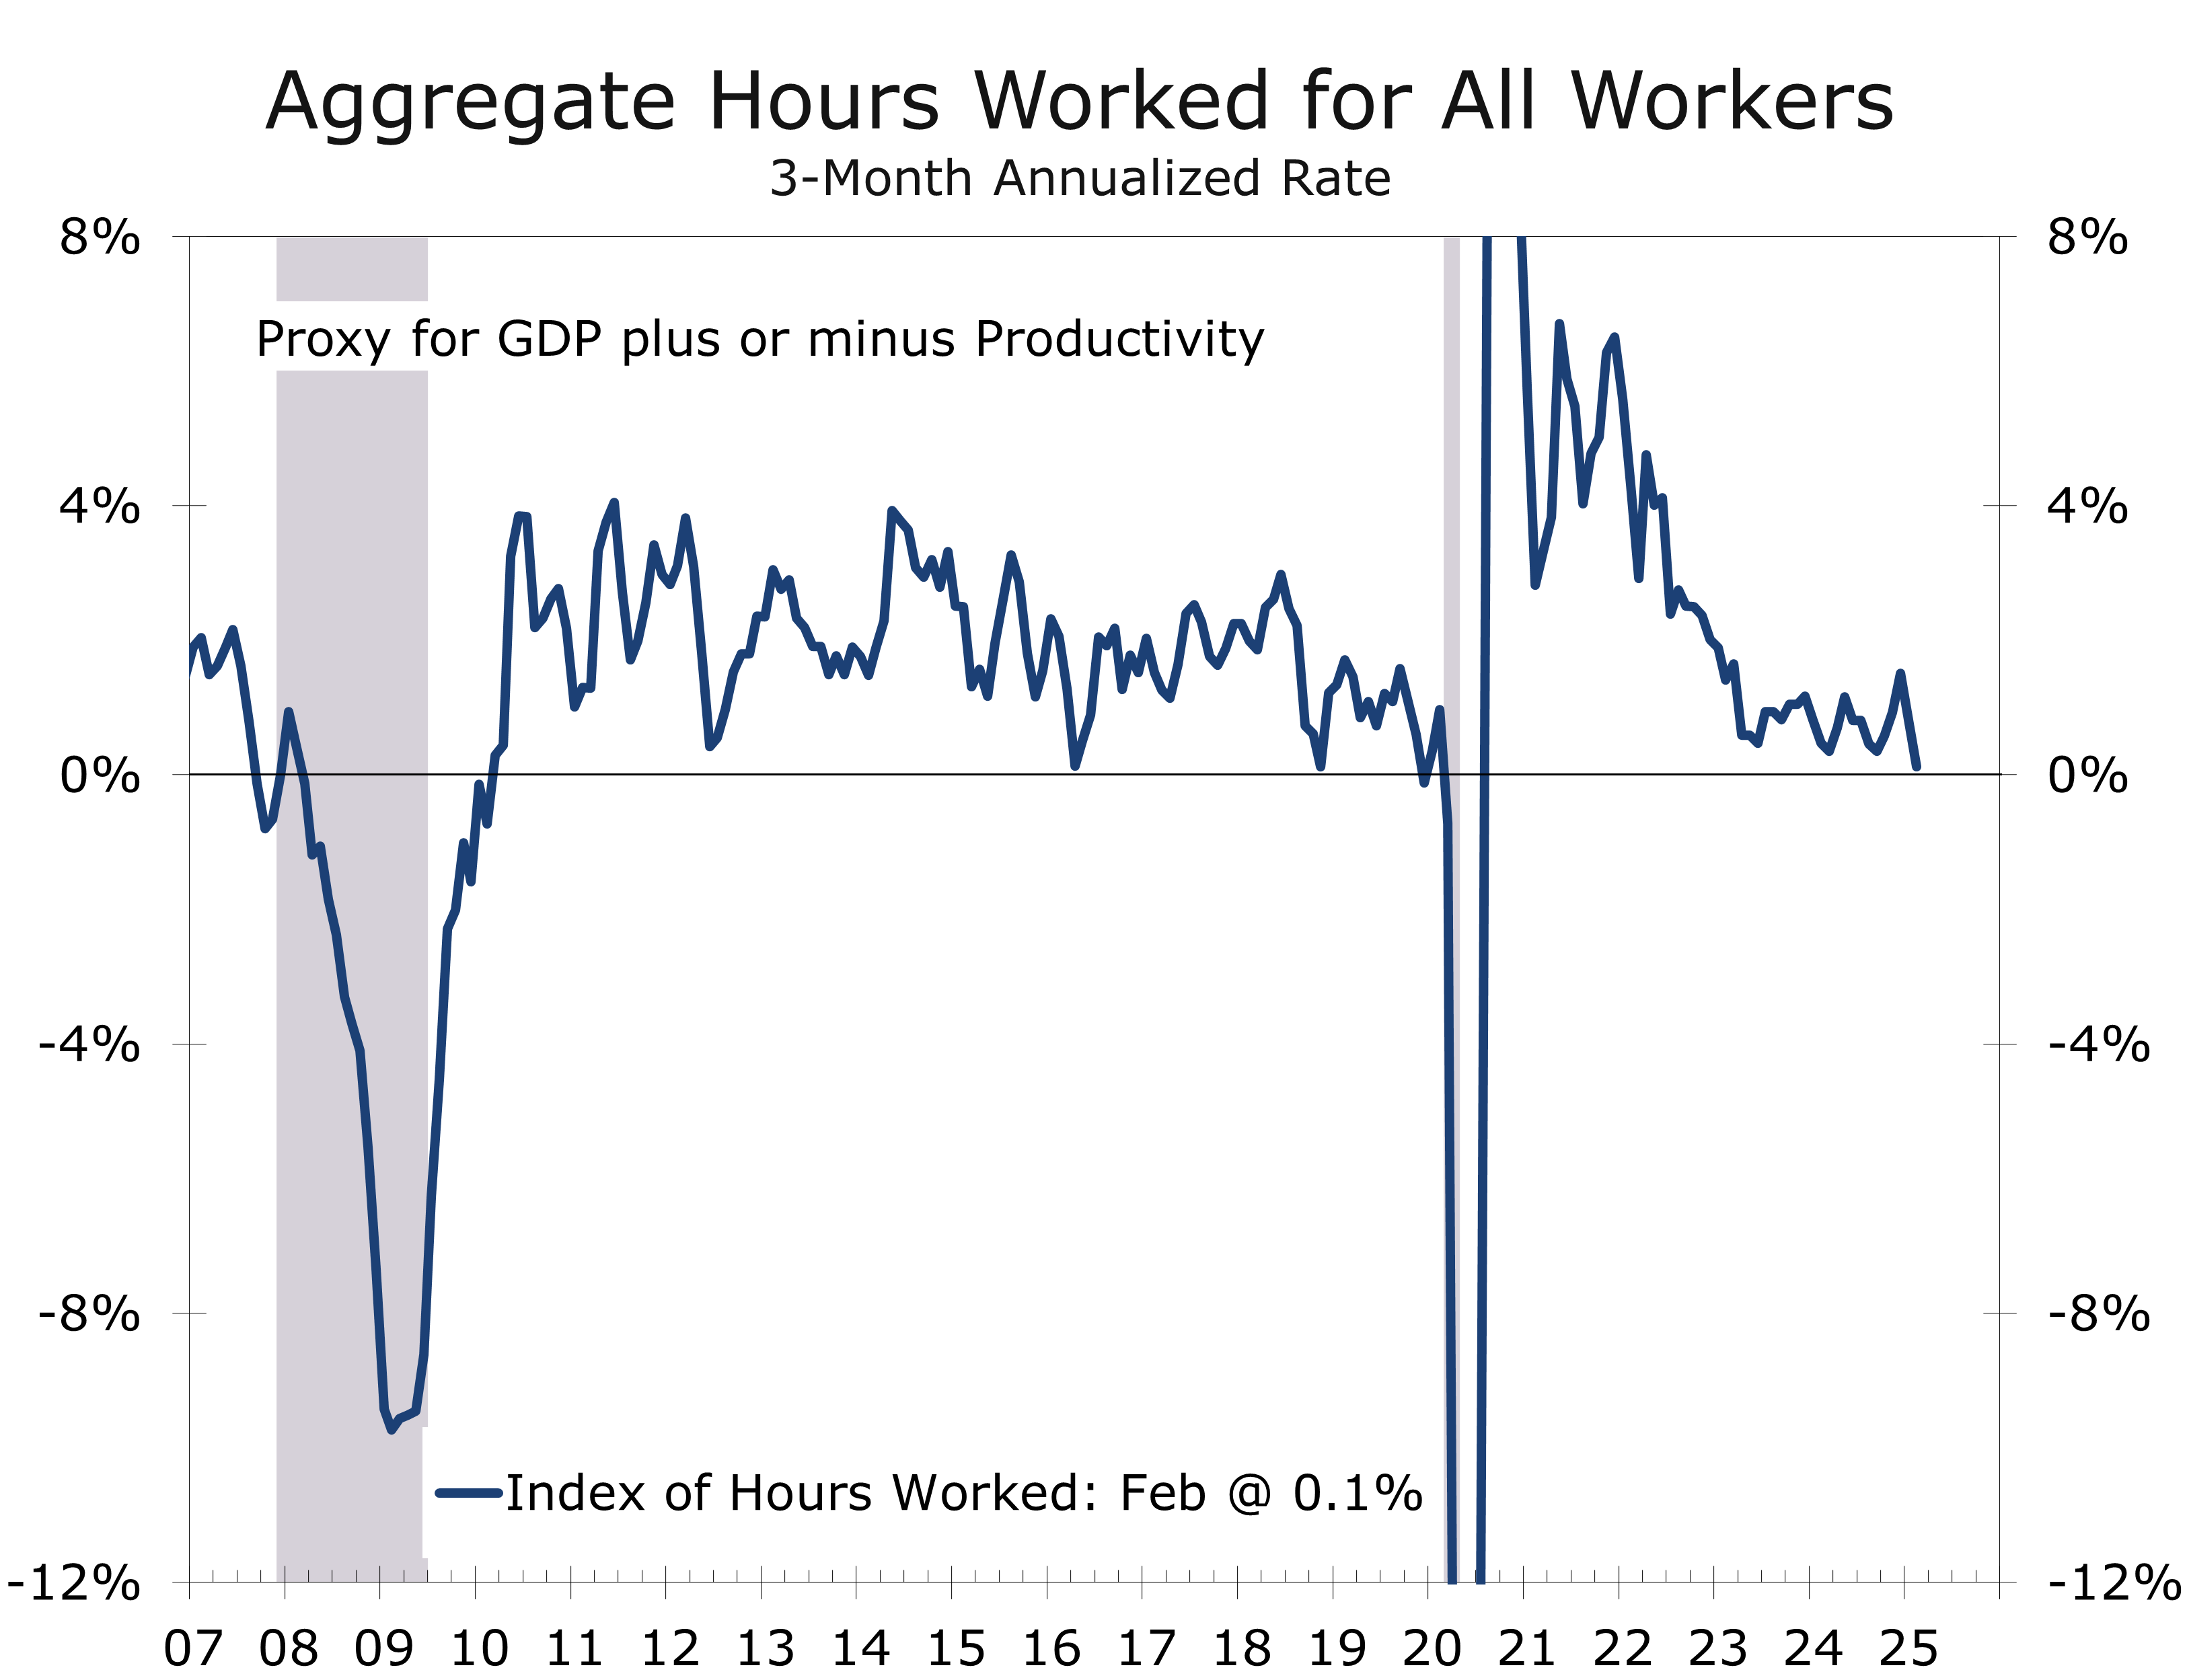
For policymakers, the report delivers a mixed bag. The labor market’s core strength—solid job growth, low unemployment, and slightly more diversified gains—argues for keeping rates steady, at least for now. But the slowdown in hiring, rising part-time work, and softening wage pressures are another indication of the economy losing steam, strengthening the case for an easing this spring. On that point, aggregate hours worked in the economy have risen at just a 0.1% pace over the past three months, implying Q1 real GDP growth somewhere between 1% and 1.5%.
With job growth fraying around the edges, the Fed is likely to focus more on supporting growth.
February’s employment data show a labor market still standing tall but fraying around the edges. Treasury Secretary Bessent noted that he sees signs of the economy rolling over as growth shifts from stimulus-driven growth to private sector-driven growth. The Fed faces a challenge of managing this transition, which currently appears chaotic and has more unknowns than usual. With elevated risks and a longer timeline for reaching its 2% inflation target, the Fed will likely lean more toward supporting growth.
Disclaimer: This publication has been prepared for informational purposes only and is not intended as a recommendation offer or solicitation with respect to the purchase or sale of any security or other financial product nor does it constitute investment advice.
March 7, 2025
Mark Vitner, Chief Economist
Piedmont Crescent Capital
(704) 458-4000

A View from the Piedmont: Geopolitics Overshadow Softer Economic News
Growth Worries Overtake Inflation Concerns
- Growth concerns retook center stage with the Atlanta Fed’s GDPNow forecast plunging 5.5 points since Thursday to -2.8% for Q1, mostly due to a surge in imports.
- Consumer spending fell 0.2% in January, and consumer confidence saw the largest decline since 2021.2%.
- Consumers also feel less upbeat about the labor market, and weekly first-time unemployment claims rose to 242,000.
- Inflation moderated slightly, with the overall PCE price index decelerating to 2.5% year-to-year in January. The core PCE decelerated to 2.6% year-to-year.
- The U.S. trade deficit widened to a record $153.3 billion in January, driven by a surge of imports ahead of expanded tariffs.
- The February ISM Manufacturing PMI and January construction spending both came in weaker than expected, contributing to growth concerns.
- The S&P 500 sold off sharply on tariff concerns, falling 4.8% since February 19. Bond yields have also fallen sharply, with the 10-Year Note falling below 4.20%.
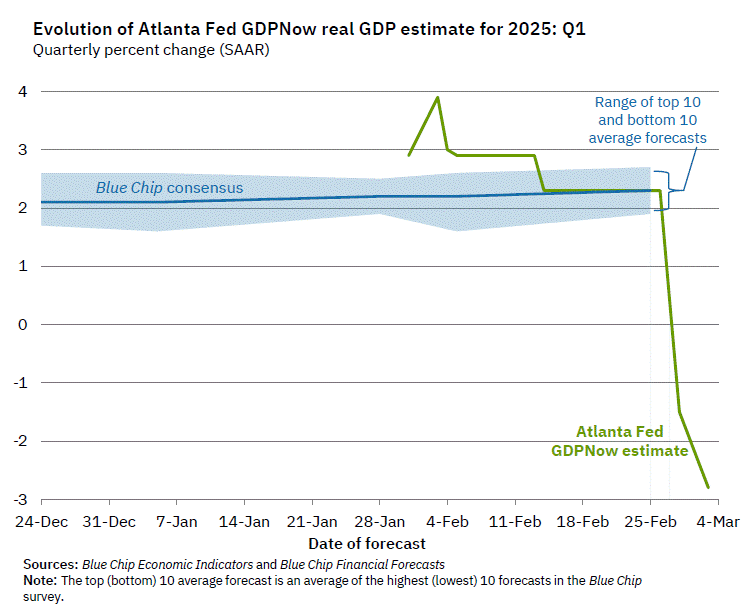
Recent economic data reveals a mixed picture: inflation is easing, but growth is slowing sharply, as evidenced by the Atlanta Fed’s GDPNow forecast plummeting from 2.3% to -2.8% in just a few days. This, coupled with rising geopolitical uncertainty, creates a volatile economic landscape.
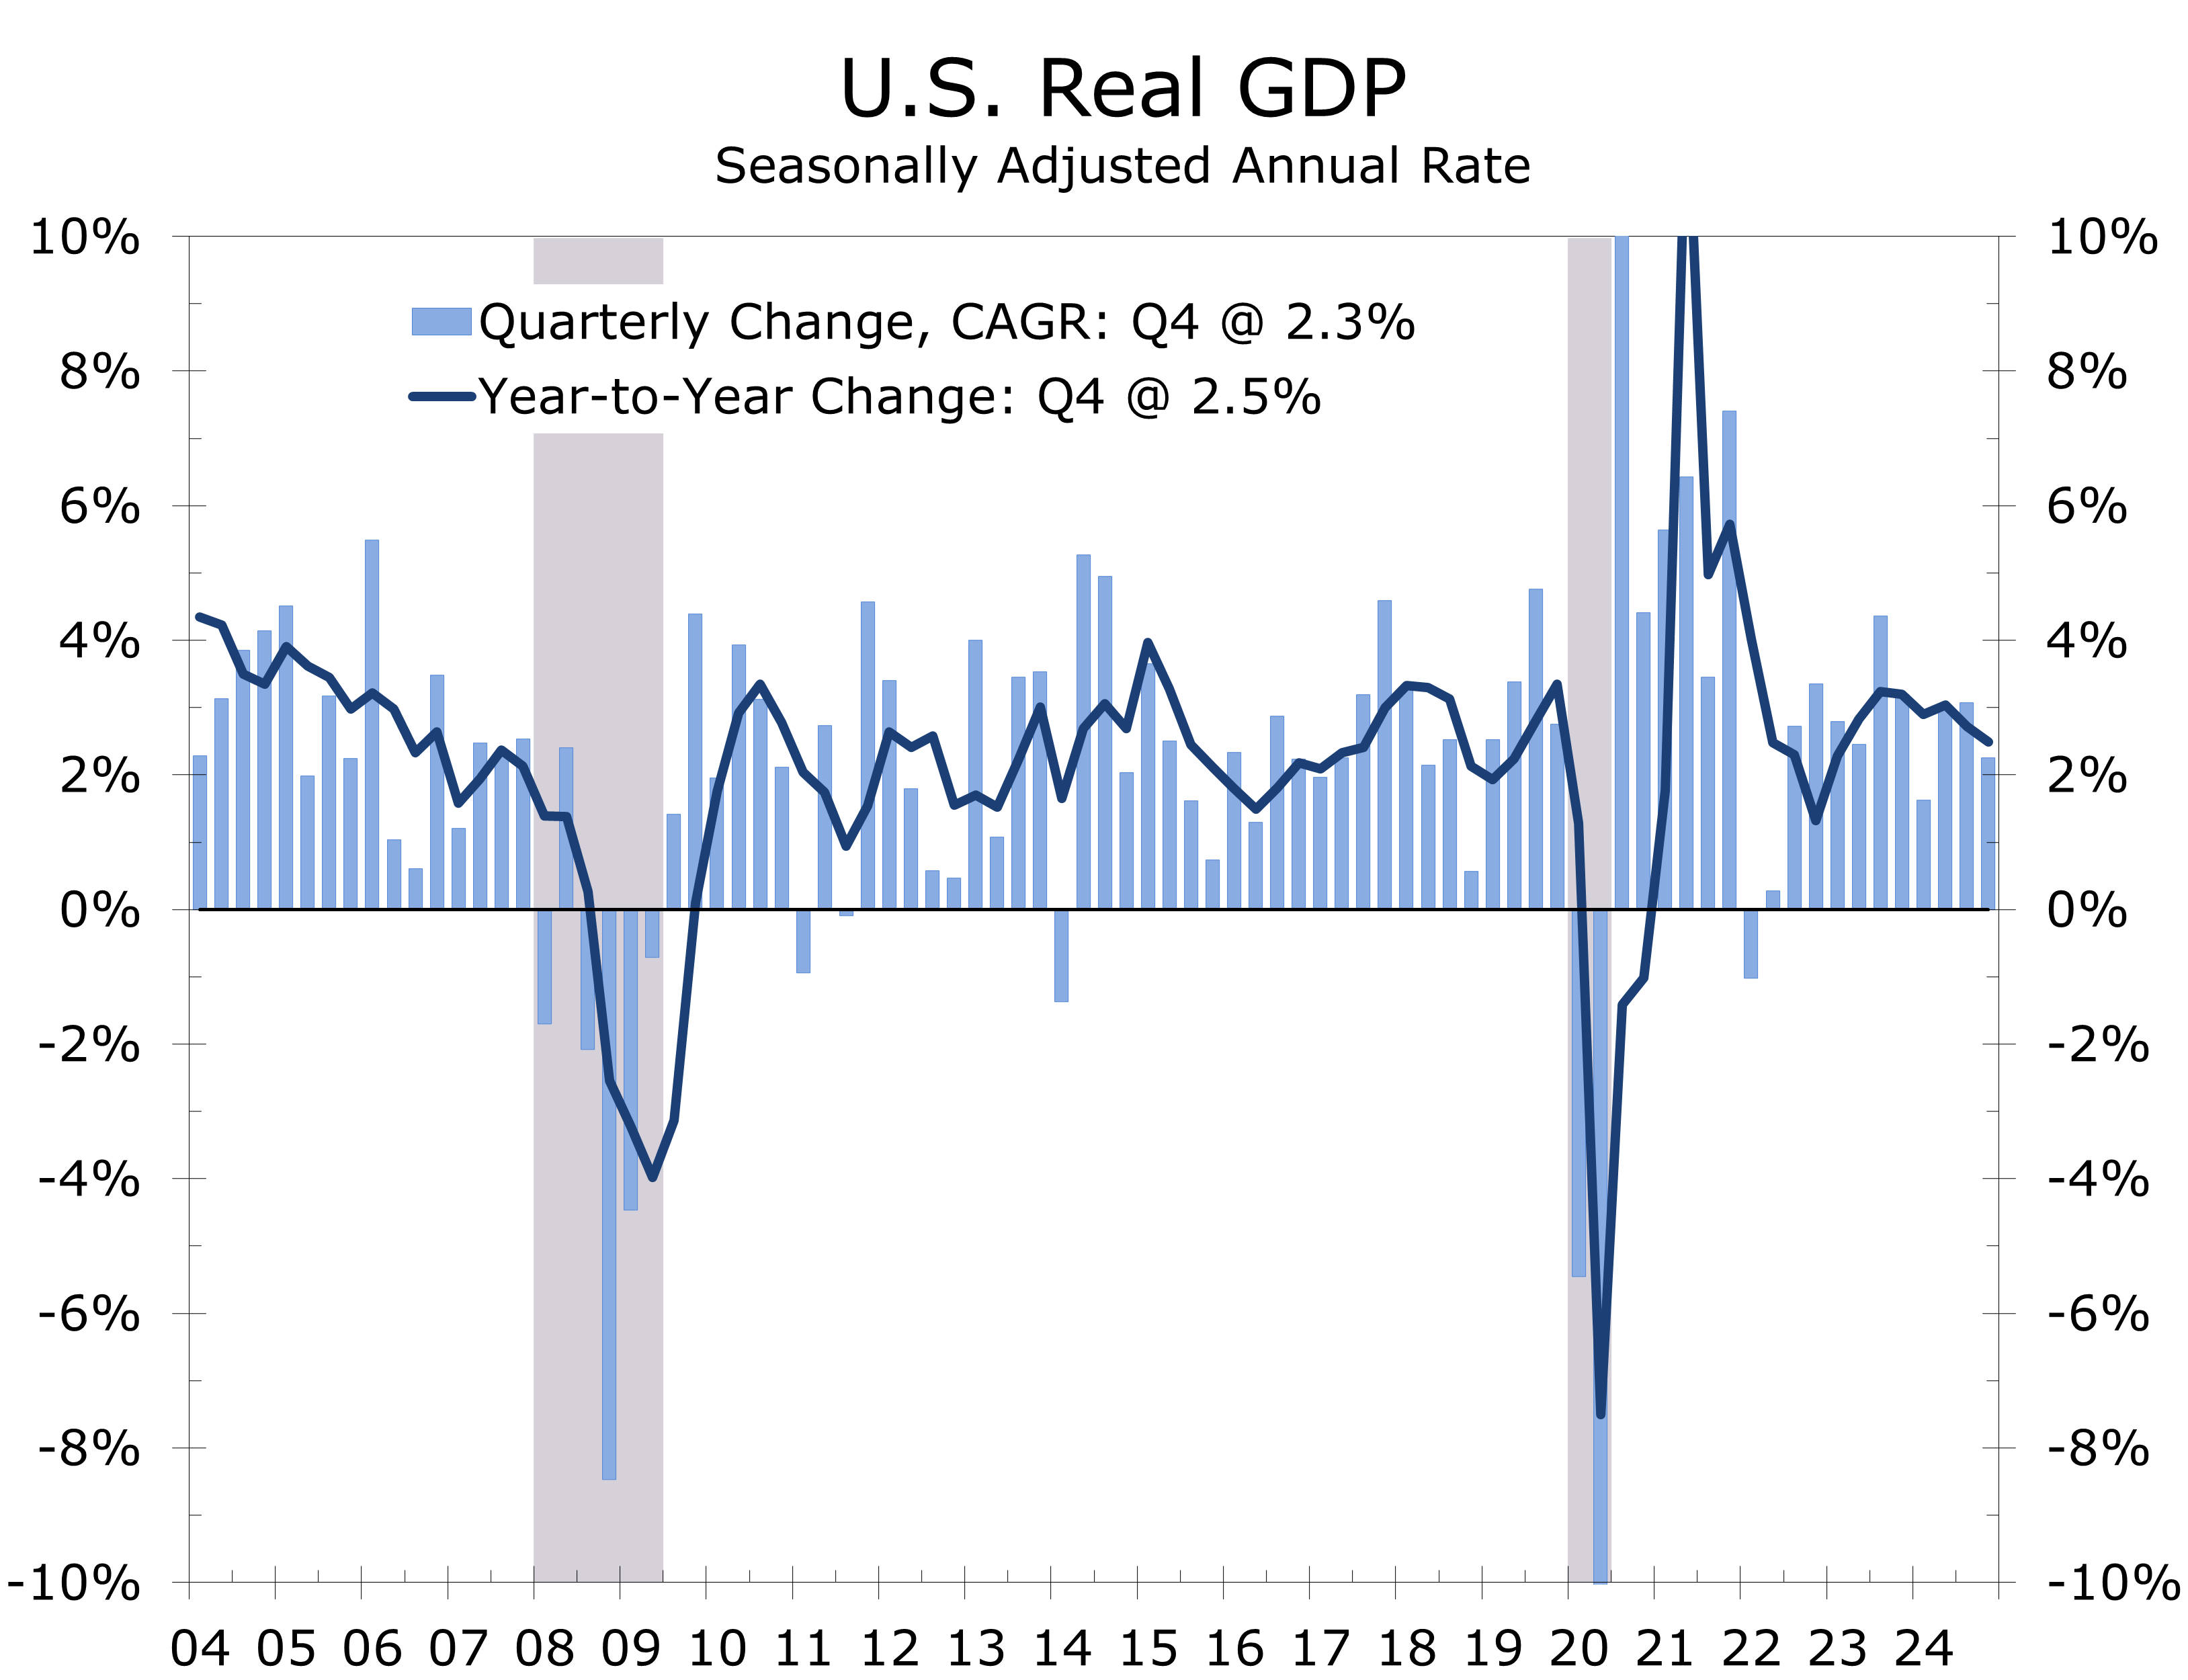
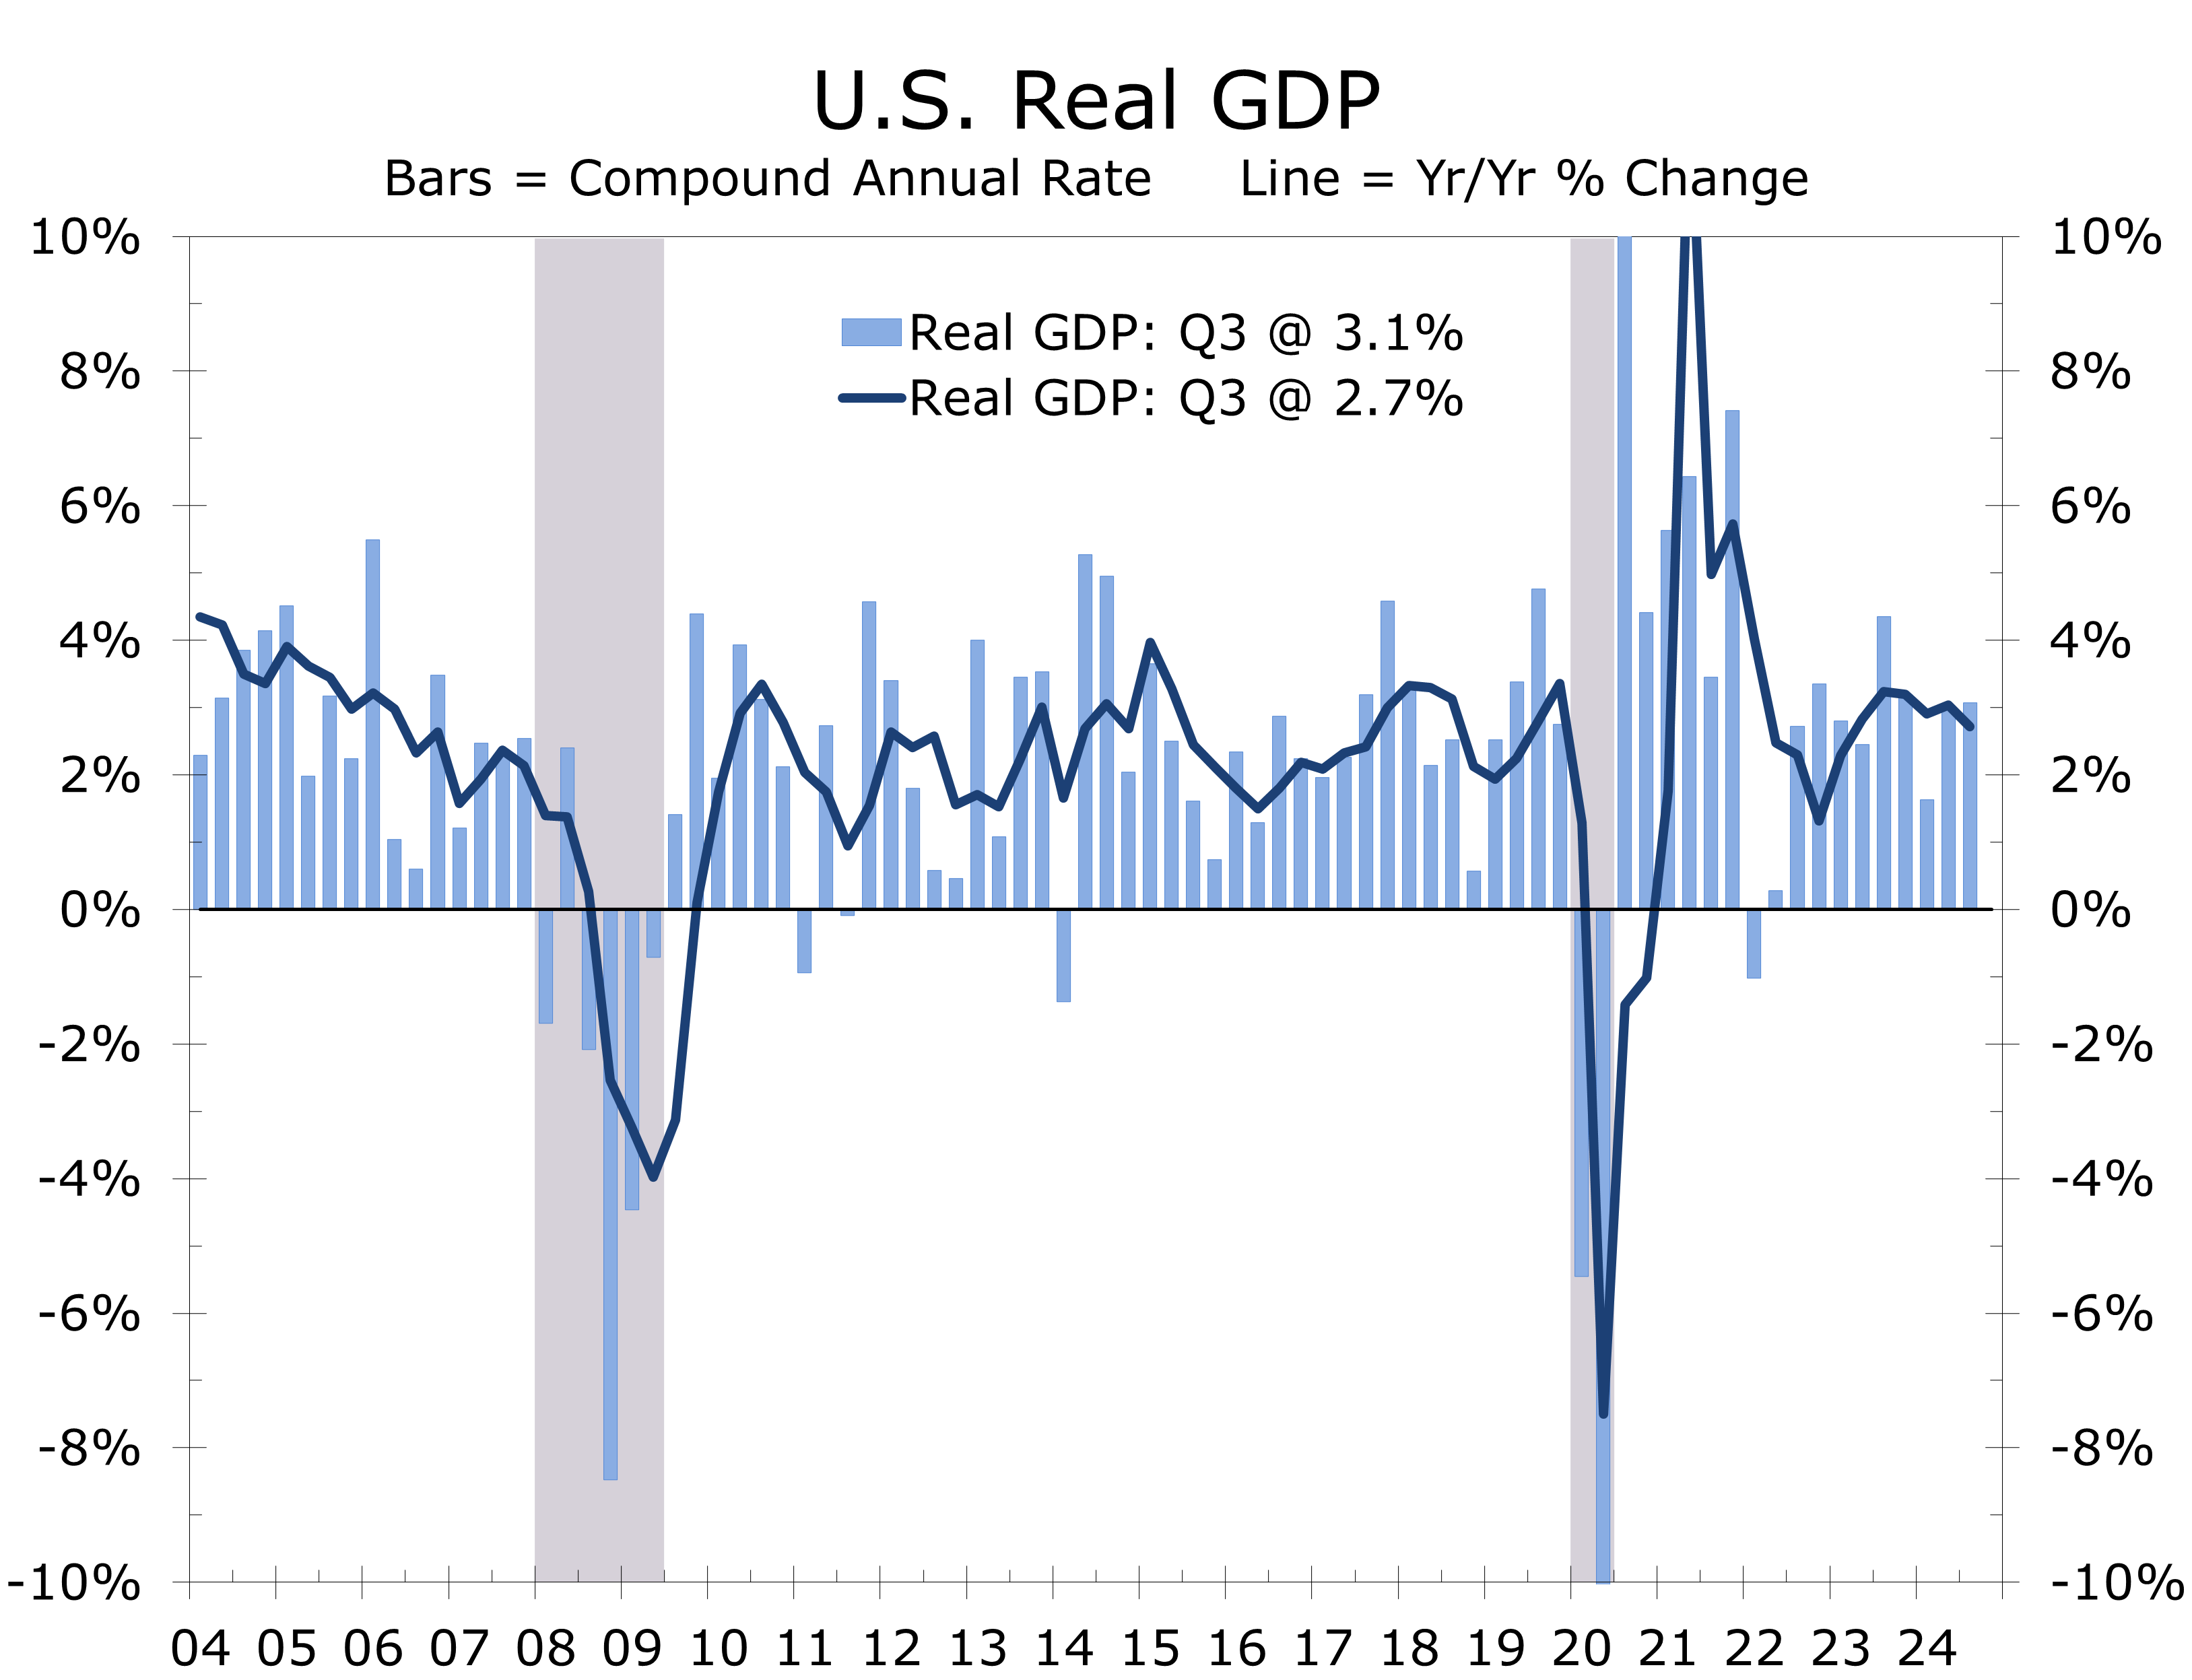
The sudden shift in the Atlanta Fed measure suggests that economic growth has slowed from its recent strong pace. The latest data show real GDP grew at a 2.3% pace in the fourth quarter. Private final domestic demand, our preferred output measure, grew at a 3% pace, which is roughly in line with its average for the past two years.
More recent data suggests downside risks to economic growth have risen. Consumer spending fell 0.2% in January, the largest drop in 4 years. This drop may be partly due to unseasonably cold weather, which kept buyers away from car dealers. The Los Angeles wildfires and post-holiday seasonal factors may have also exaggerated the extent of January’s weakness.
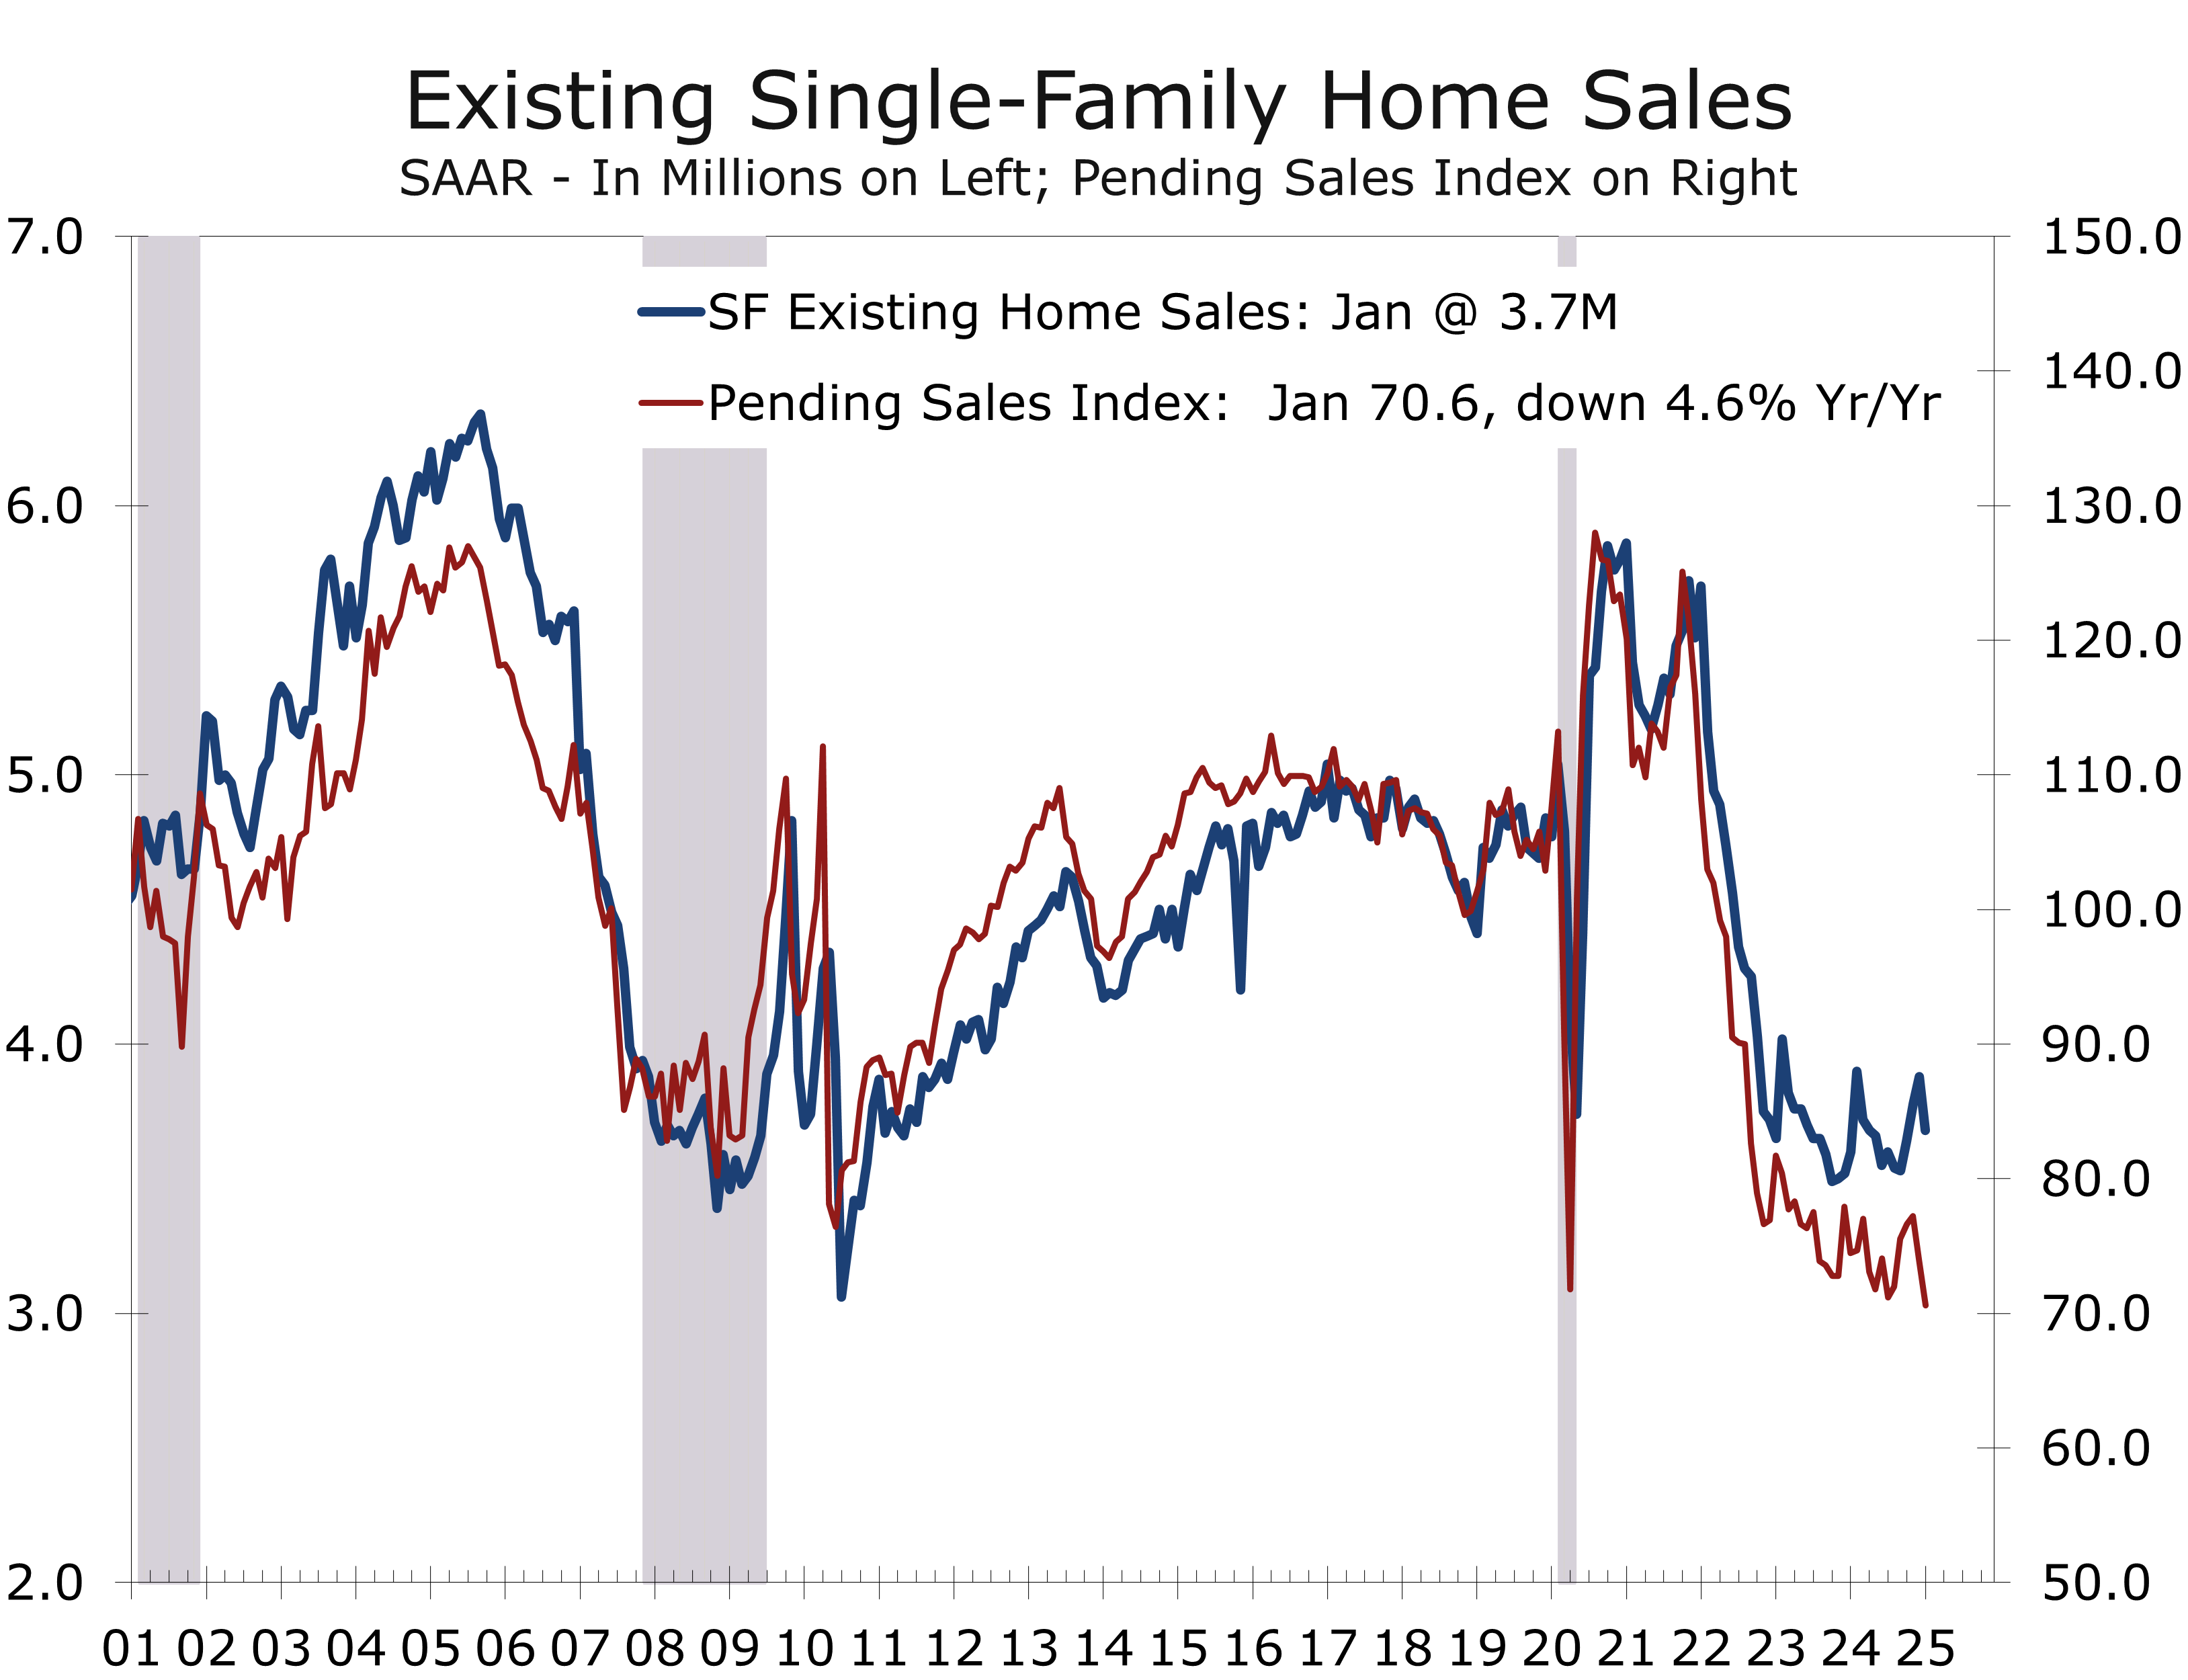
Part of the spending pullback is legitimate, however, and reflects a downshift in economic growth. Both new and existing sales remain exceptionally weak and pending home sales, which lead existing home sales by a month of two, plunged to an all-time low in January. The weakness in home sales is carrying over into reduced demand for household durable goods and home furnishings. The recent slide consumer confidence validates the slowdown and hints that February’s spending, which should show some improvement, will likely be weak as well.
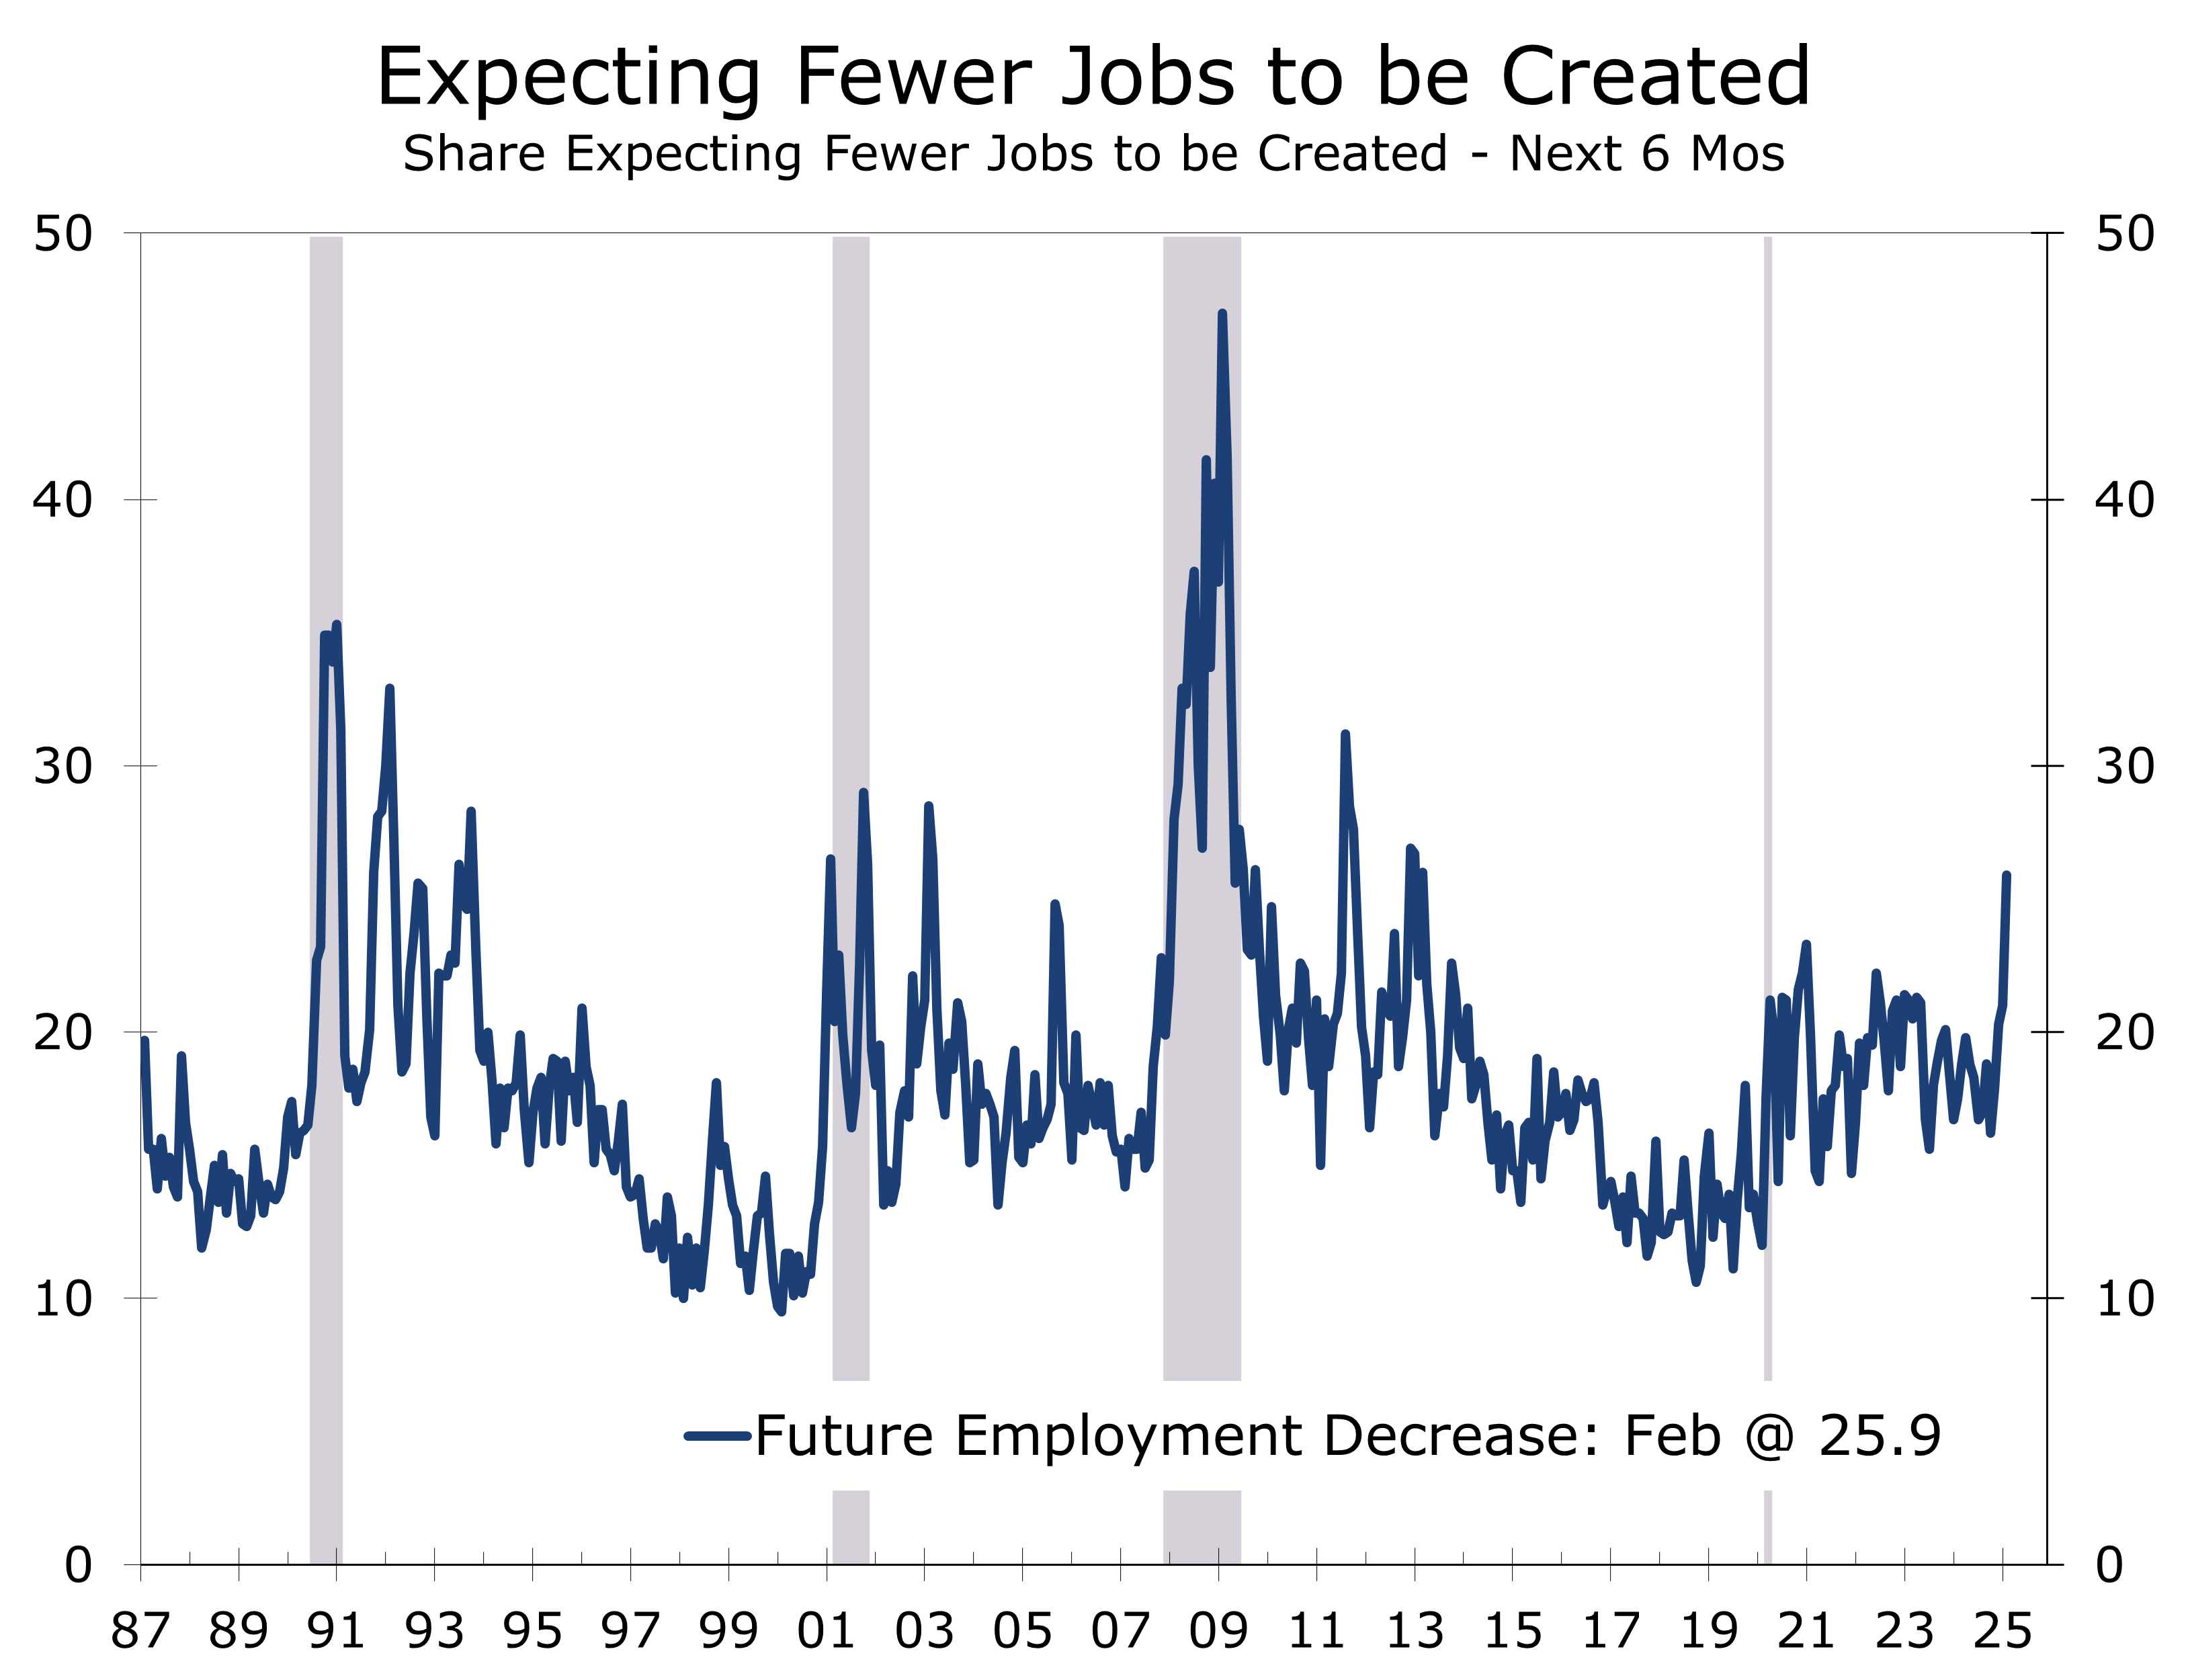
Consumer confidence took a big hit in February 2025, with the Conference Board’s index posting its largest monthly decline since 2021, falling to 98.3 from 105.3 in January. Both current conditions and future expectations worsened, with expectations plummeting nearly 10 points to 72.9. The labor differential, the difference between the share of respondents saying jobs are ‘plentiful’ versus ‘hard to get’, decreased for the second straight month and is near a cycle low. Moreover, more consumers expect fewer jobs to be created over the next six months (25.9%) than any time since the pandemic.
We are beginning to see some cracks in the labor market. Weekly first-time unemployment claims rose last week to 242,000 from 220,000, with claims in Washington, D.C., roughly four times higher than they were this time last year, likely evidence of Trump’s layoffs of government employees and belt-tightening by contractors. Jobless claims remain historically low, and most forecasts have the unemployment rate holding steady at 4% in February.
January’s PCE inflation moderated to 2.5% year-over-year, down from 2.6% in December. The core PCE deflator also decelerated to 2.6% in January, down from 2.9% in December. The better PCE news is a relief following more problematic gains in the CPI and PPI earlier in February and rising inflation expectations in the Consumer Sentiment survey.
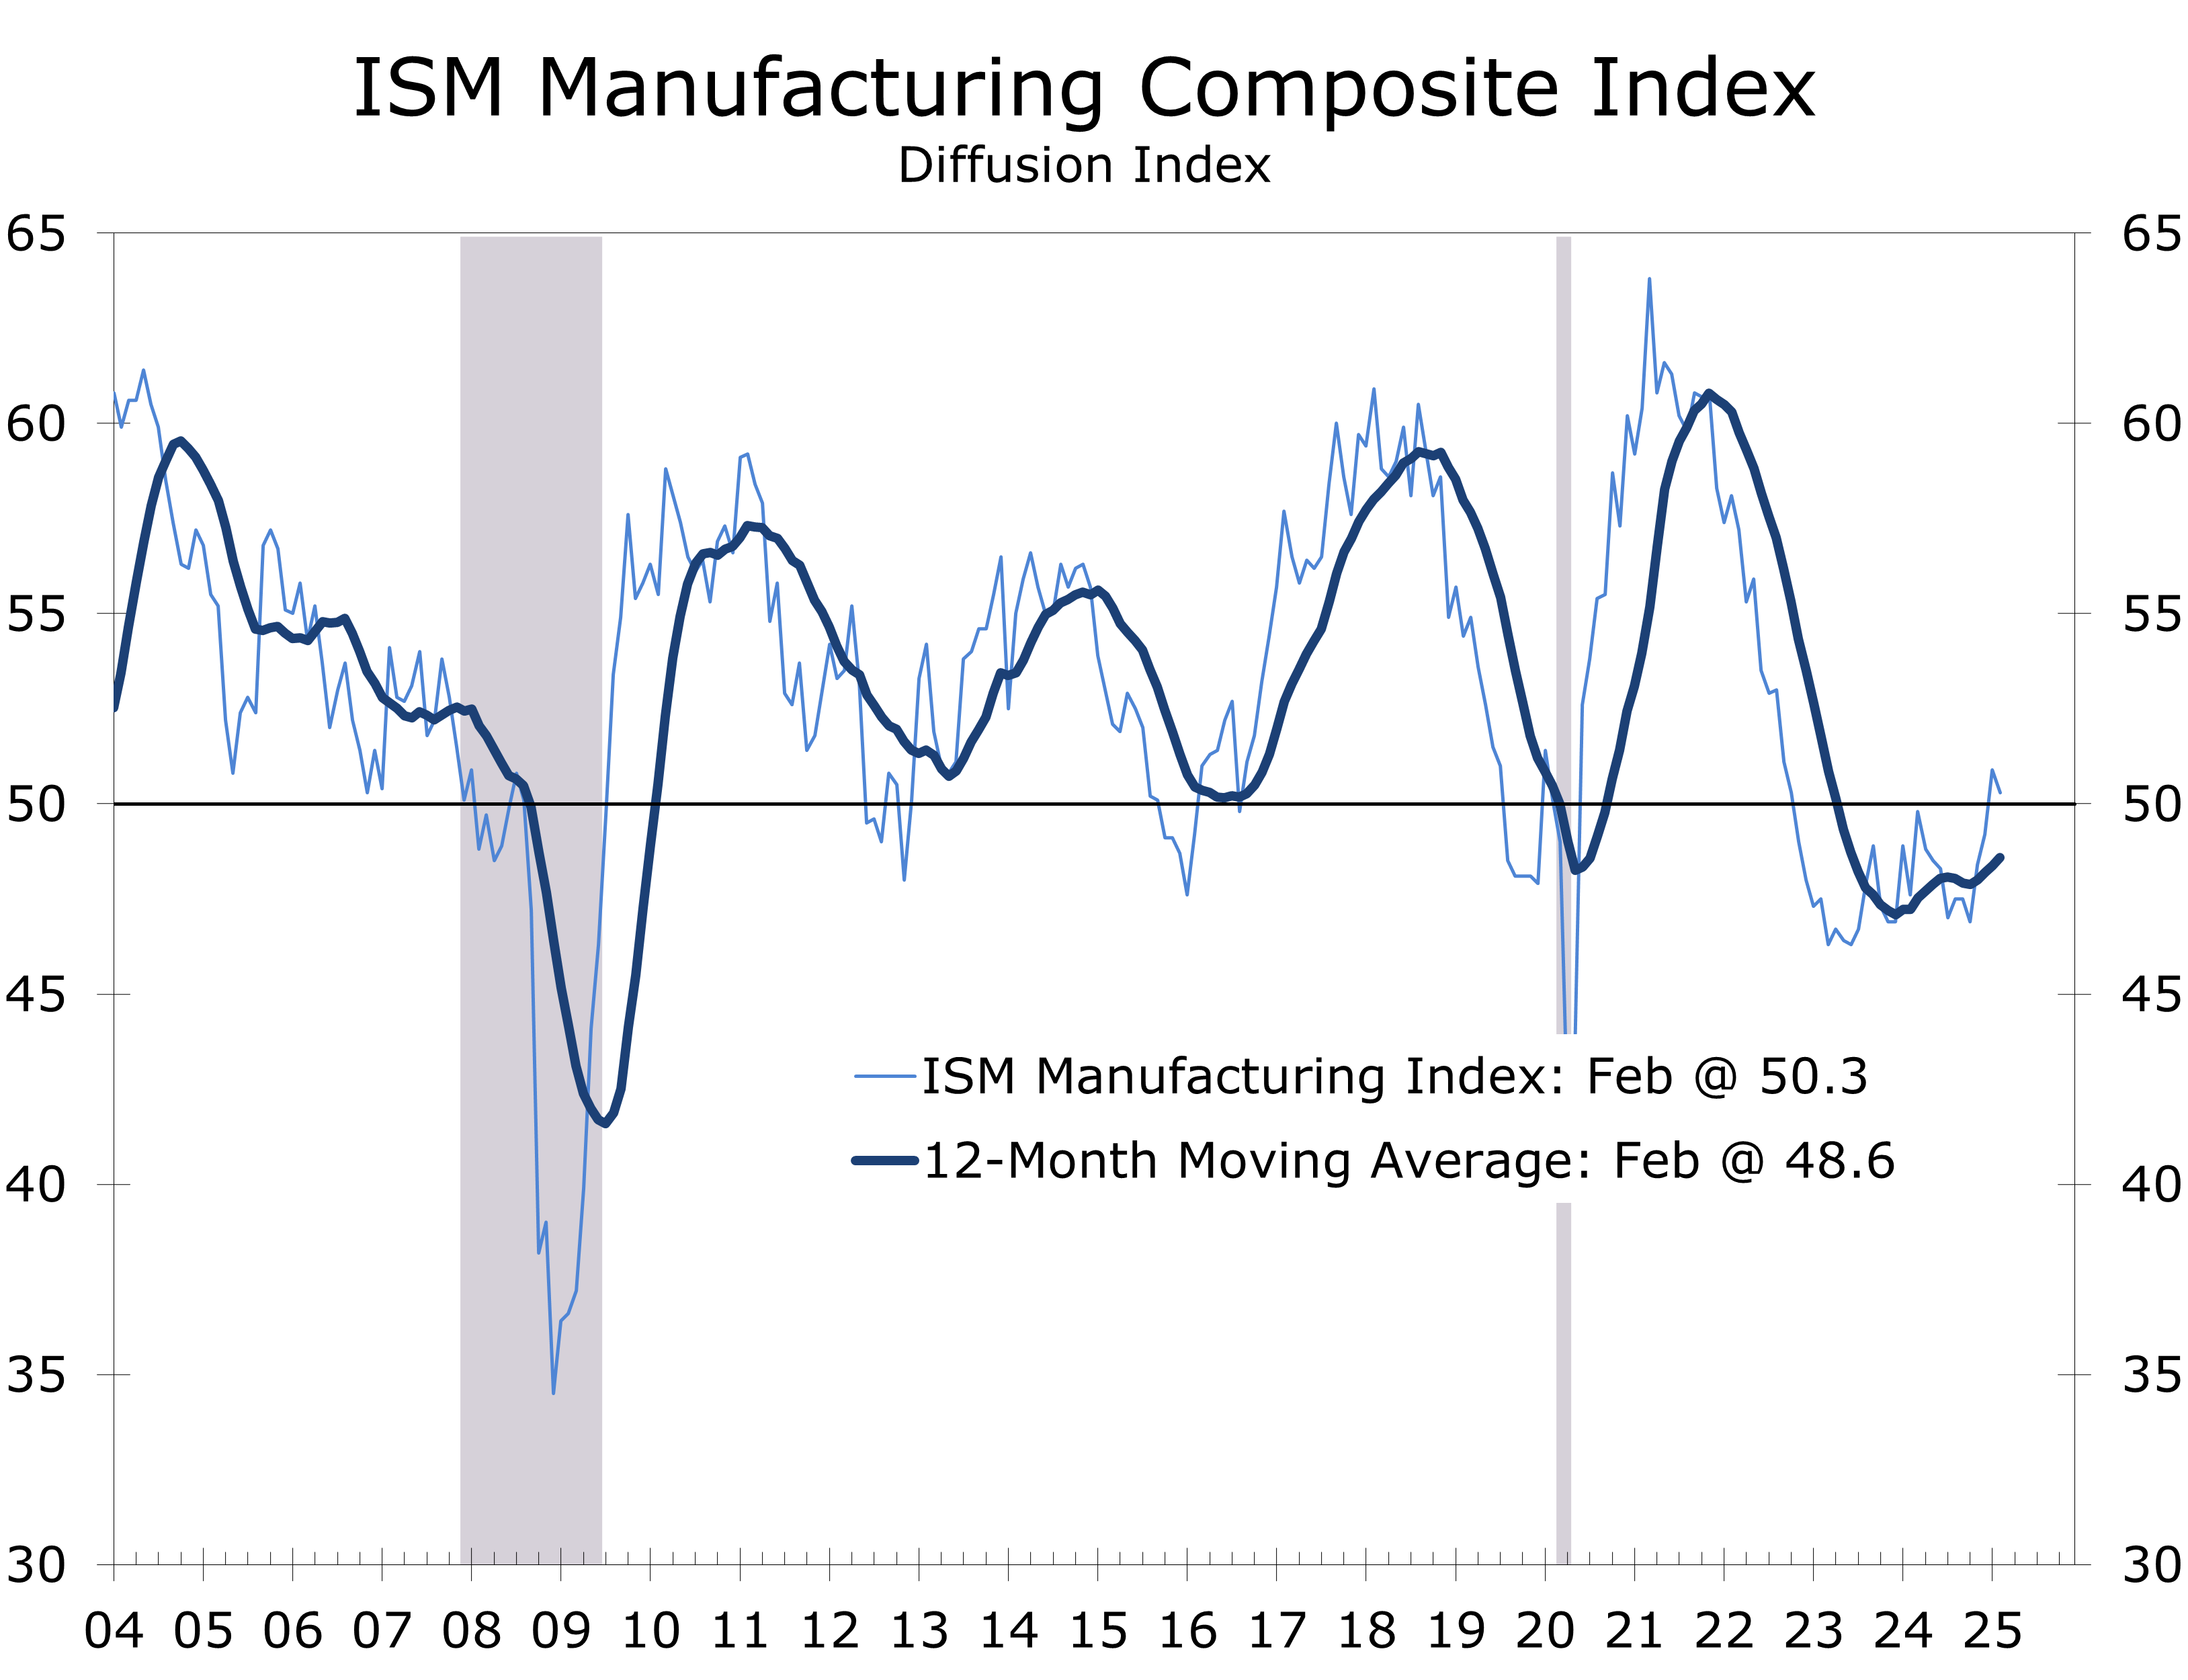
The ISM Manufacturing Purchasing Managers Index (PMI) fell slightly more than expected, falling 0.6 points to just 50.3 in February. The PMI held just above the key 50 break-even level, which signals expansion in manufacturing, for the second consecutive month, following 26 months of contraction.
The underlying data in the PMI were weak, including New Orders, which dipped to 48.6 and Production, which slipped to 50.7, showing continued expansion. The Employment Index fell to 47.6, suggesting some softening in manufacturing jobs, while the Prices and Suppliers Delivery indices both jumped to their highest levels since 2022. Tariffs were mentioned 20 times in the ISM report, highlighting the impact that policy uncertainty is having on businesses and supply chains.
The front loading of imported goods and materials has caused imports to skyrocket and widened the trade deficit to a record $153.3 billion in January. Industrial supplies accounted for much of the increase and some of that will likely end up in inventories, which will partially offset the hit to Q1 GDP growth.
The sharp reversal in the closely watched Atlanta Fed GDPNow forecast has garnered significant attention. The index plunged a combined 5.5 points Friday and Monday, reflecting weaker consumer spending, the deluge of imports and weaker January residential construction spending.
GDPNow provides a highly mechanical estimate of GDP by extrapolating the latest economic data based on historical relationships. While valuable, it should be used with caution. Much of the recent weakness stems from a surge in imports as businesses move to get ahead of tariffs. These imports will increase inventories, consumer spending or investment, which will show up later in GDPNow, partially offsetting the drag from the widening trade deficit. Additionally, gold imports—excluded from GDP—also surged.
As a result, while Q1 GDP growth will likely be weaker, a -2.8% contraction seems overstated. Our forecast now stands at +0.9% and assumes a rebound in consumer spending, large rise in inventories and a narrowing trade gap in the coming months.
Atlanta Fed GDPNow is a highly mechanical tool and likely exaggerates the recent deterioration.
Financial market volatility has risen as market participants’ primary concern has shifted from inflation back to economic growth. The S&P 500 has fallen 4.8% since February 19, with about one-third of that drop coming Monday after President Trump affirmed that 25% tariffs on Canada and Mexico would go in effect on February 4. Bond yields have also plummeted, with the 10-year Treasury yield falling from 4.79% on January 14 to just 4.16% on Monday. The yield on the 10-Year Treasury is now back below the 3-Month T-Bill. The 10-Year yield still remains above the 2-Year, but the spread has narrowed in ways that have historically signaled slower growth ahead.
Trump-Zelenskiy Meeting and Fallout
President Donald Trump and Ukrainian President Volodymyr Zelenskiy held a tense meeting at the White House on February 28, ending with Trump canceling a planned news conference and asking Zelenskiy to leave. Tensions escalated when Zelenskiy pressed for security guarantees, and Vice President Vance pushed back, raising a range of other grievances. The fallout from this clash could weaken U.S. support for Ukraine at a critical moment in its war with Russia. It also heightened concerns about ongoing tariff negotiations, adding to supply chain concerns.
Elon Musk’s Call for U.S. to Leave NATO and UN
Elon Musk publicly called for the U.S. to withdraw from NATO and the United Nations over the weekend. This move aligns with growing skepticism within the Trump administration towards international organizations and alliances. We do not see a scenario where the U.S. pulls out of NATO. We also see little prospect that Trump will let Russia run over Ukraine. The rhetoric is dangerous, however, and could serve to bolster Russia’s confidence and demoralize Ukraine. History has shown time again that appeasing an aggressor only leads to more destructive aggression.
Cultural Reflection: The 2025 Oscar Ceremony
“Anora” dominated the Academy Aways, winning best picture, director, actress, editing, and original screenwriting. Sean Baker won for directing, editing, and writing, while Mikey Madison won best actress and Zoe Saldaña won best supporting actress for “Emilia Pérez.” Hollywood is one of the world’s leading U.S.-based institutions that has the heft to promote freedom, human rights, and ideals to move mankind in a positive direction, even if we often collectively shake our heads at what passes for entertainment.
Disclaimer: This publication has been prepared for informational purposes only and is not intended as a recommendation offer or solicitation with respect to the purchase or sale of any security or other financial product nor does it constitute investment advice.
March 4, 2024
Mark Vitner, Senior Economist
mark.vitner@piedmontcrescentcapital.com
(704) 458-4000
Colder Temperatures Slow Home Building
Winter Weather Restrained Home Building
- Housing starts fell 9.8% in January to a 1.37 million unit annual rate.
- Single-family starts fell falling 8.4% to a 993,000-unit pace and multifamily starts tumbling 13.5% to 373,000-unit pace.
- Building permits, which are less impacted by the weather, edged up by 0.1% to a 1.48 million-unit pace.
- Housing completions surged by 7.6% for January, with multifamily completions up 11% year-over-year, reflecting efforts to finish projects ahead of competing projects.
- Builder sentiment, as per the NAHB/Wells Fargo HMI, fell to 42 in February, its lowest level in 5 months, reflecting concerns about high construction costs, elevated interest rates, and reduced housing affordability.
- The number of homes under construction continues to decline from its recent highs, with single-family down 6.3% from last year and multifamily down a whopping 21%.
- Homebuilding faces a challenging year. High home prices, elevated mortgage rates and a weakening labor market are weighing on buyer traffic and sales. Declining consumer, small business, and homebuilder confidence, coupled with persistent inflation and policy uncertainty, further dampen the outlook.
Home builders are beginning the year cautiously, as many would-be buyers remain on the sidelines due to persistent affordability concerns. Housing starts declined 9.8% to a 1.37 million unit pace in January, with single-family starts falling 8.4% to 993,000 units, 1.8% below their year ago pace. Multifamily starts plunged 13.5% to a 373,000 unit pace, reflecting rising vacancies, softening rents and tight credit conditions. Builder confidence also declined, and builders have scaled back sales expectations for this year.
Harsh winter weather impacted much of the country during January, which likely exaggerated the extent of the pullback. The Northeast and South saw starts tumble 27.6% and 23.3% respectively, while the Midwest endured a 10.4% drop. The supply starved West bucked the trend with a 42.3% increase, more than reversing weakness from a month earlier.
Harsh winter weather likely exaggerated January’s pullback in housing starts.
Building permits, which are less impacted by the weather, edged 0.1% higher in January to a 1.48 million unit pace, suggesting more resilience. Single-family permits remained unchanged, while multifamily edged up 0.2%. This regional variation was evident with permits decreasing 6.1% in the Northeast and slightly in the South but increasing in the Midwest and West.
The 7.6% rise in completions for January suggests builders may be accelerating projects to avoid potential cost increases from looming tariffs on lumber and other materials. Multifamily completions rebounded from last month’s decline, now running 11.1% above year-ago levels. Apartment developers appear to be rushing to finish projects before material and appliance costs rise. With nearly two apartments completed for every new start, the focus has shifted from breaking ground to finishing existing projects, easing supply shortages.
Nearly two apartments were completed in January for every apartment start.
The number of homes under construction continues to decline, with single-family units down 6.3% over the past year and permits for projects with five or more units plunging 22.5%. This slowdown in new construction will likely impact employment and Q1 GDP growth. Housing has significant ripple effects, driving demand for furniture, appliances, and services, making this decline a potential warning sign for broader economic weakness.
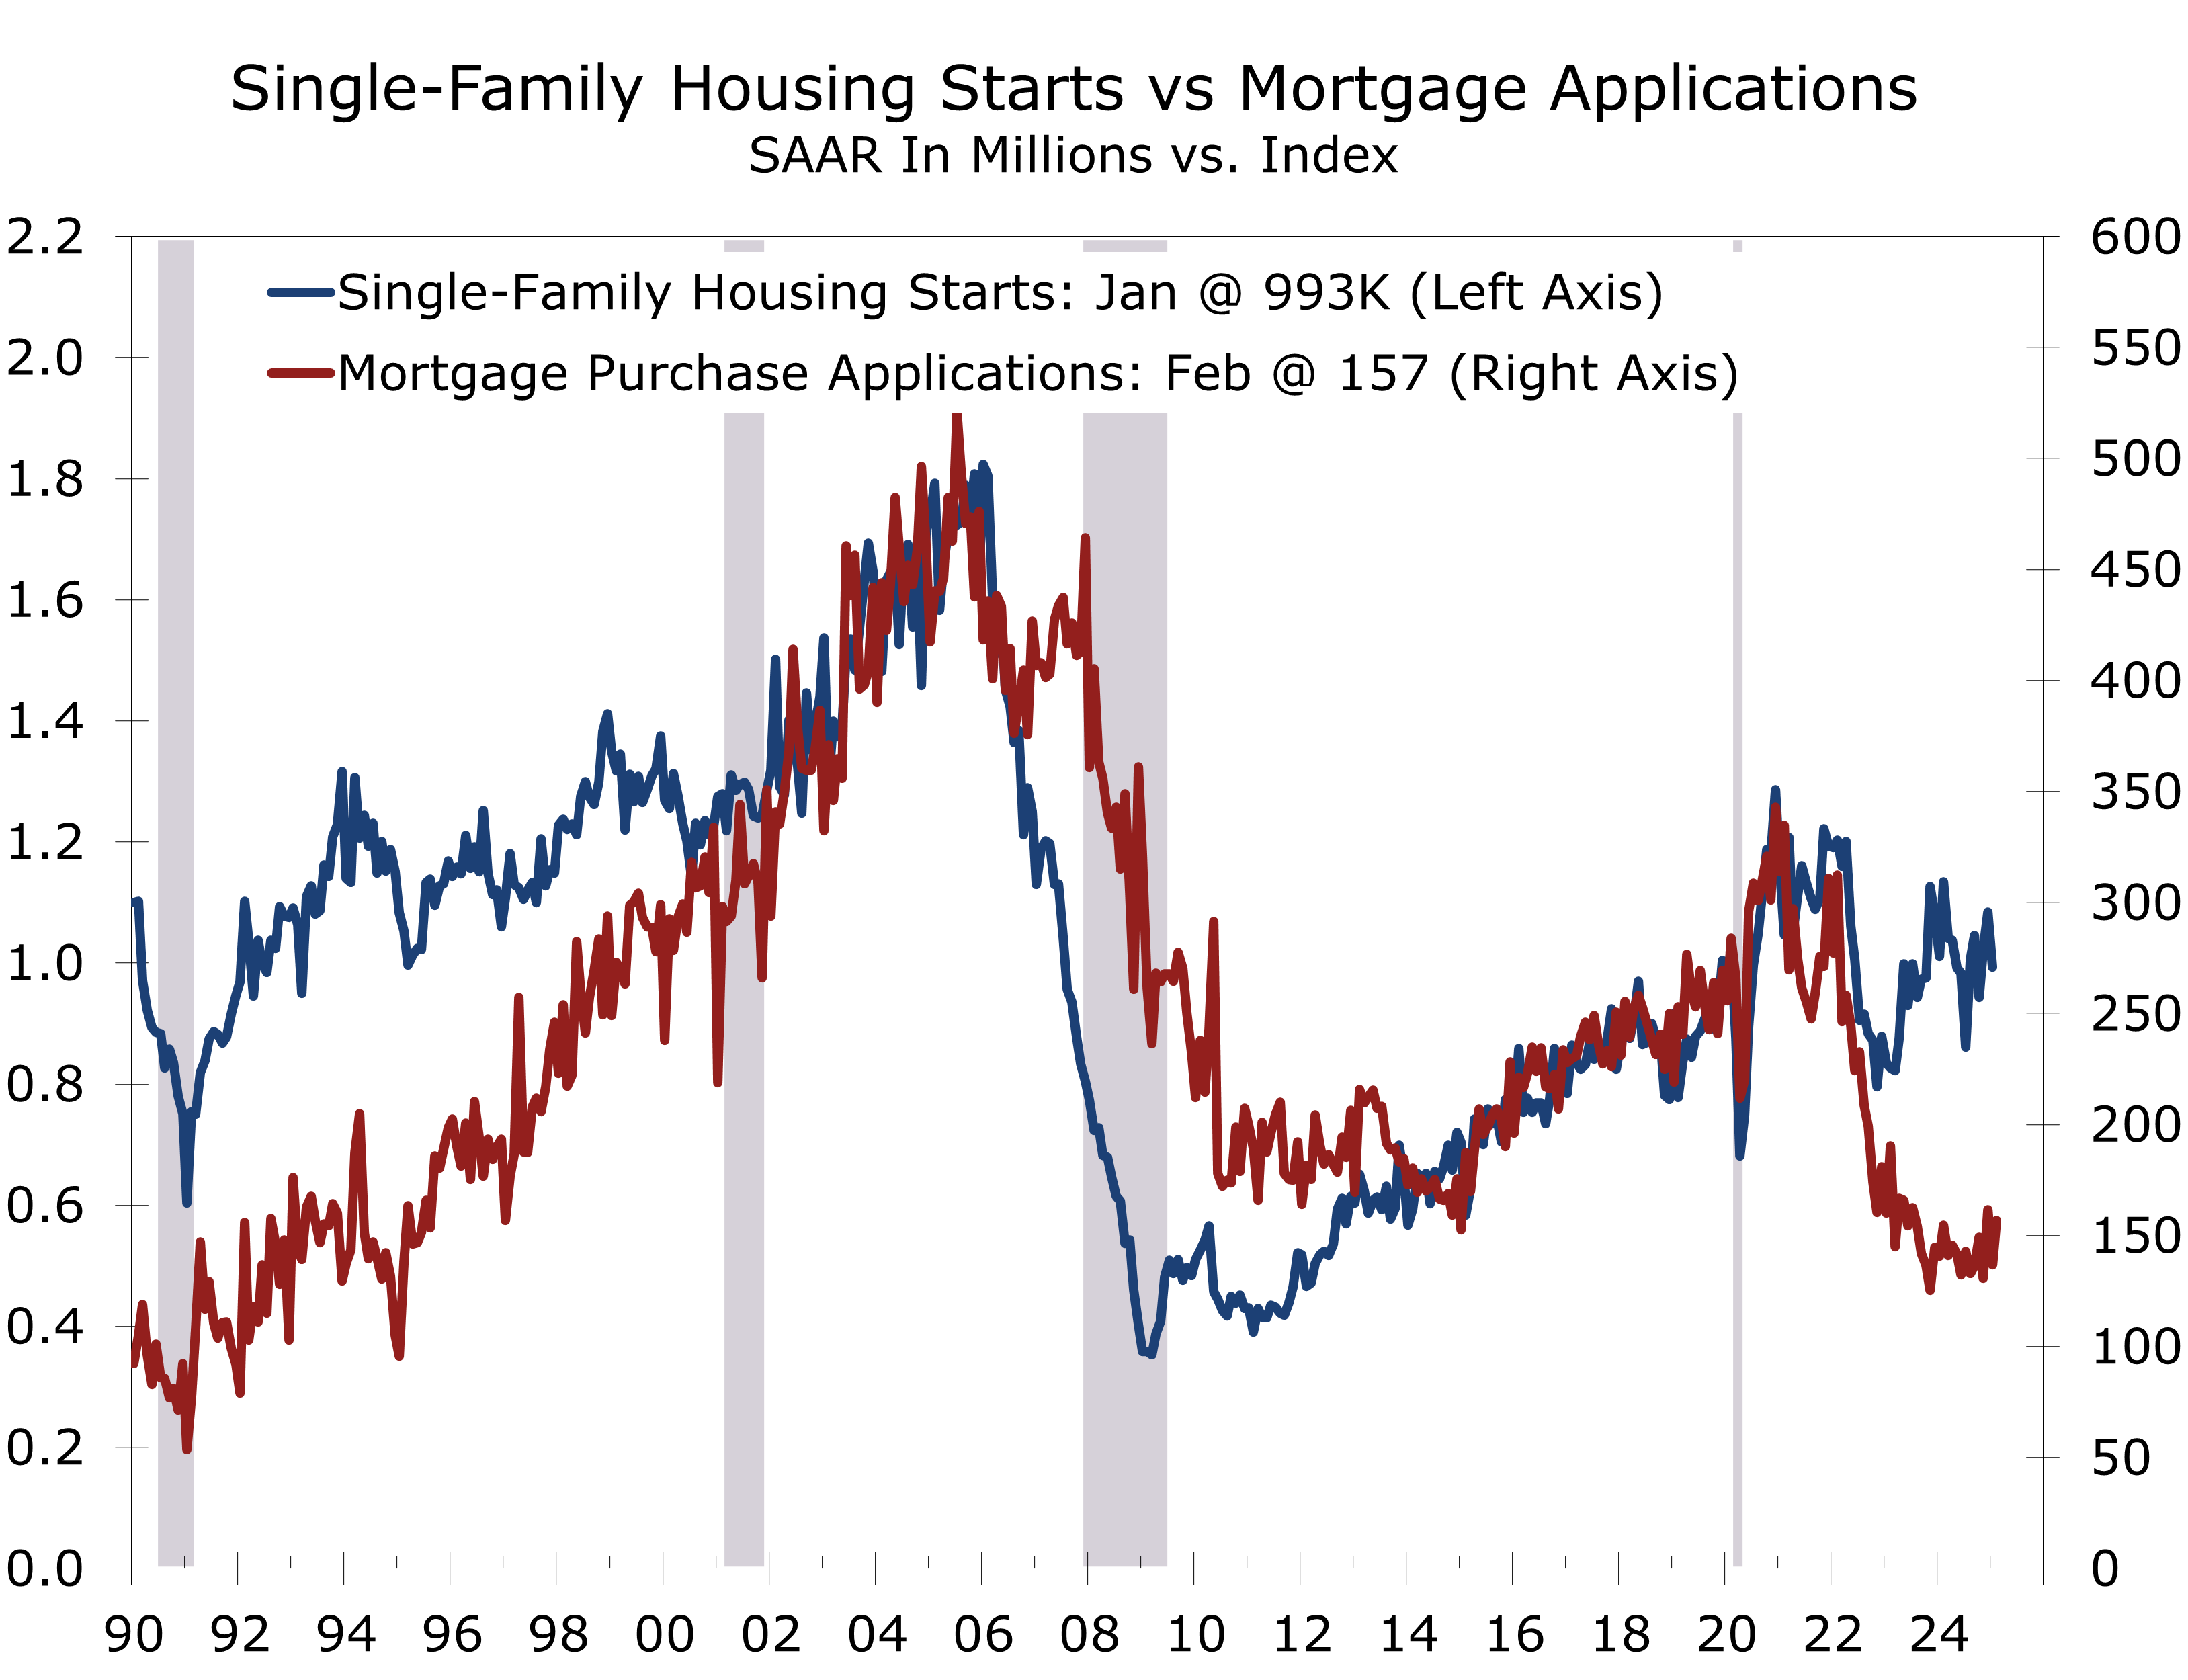
Meanwhile, home builders are increasingly focusing on single-family rentals, which accounted for 9.5% of starts last year. This trend helps explain the divergence between mortgage purchase applications and starts.
Builder sentiment, as measured by the NAHB/Wells Fargo Housing Market Index (HMI), fell to 42 in February, the lowest in five months. This decline reflects builders’ frustration with high construction costs and disappointment over the Fed’s reluctance to cut rates before the second half of the year. Persistently high mortgage rates and affordability challenges further weigh on confidence.
All three HMI components declined: current sales fell 4 points to 46, future sales expectations dropped 13 points to 46, and buyer traffic slipped 3 points to 29. While housing starts should rebound in line with permits, weakening builder confidence and harsh winter weather pose downside risks to homebuilding and construction employment this spring.
The ongoing decline in sentiment points to a slowdown in new construction, which could weigh on economic growth. While weaker growth may push bond yields lower and reduce mortgage rates, it would also likely dampen job and income growth, further restraining homebuying. Single-family starts for the rental market are also set to slow, facing the same pressures—rising vacancy rates and weakening rents—that are curbing traditional apartment construction.
Disclaimer: This publication has been prepared for informational purposes only and is not intended as a recommendation offer or solicitation with respect to the purchase or sale of any security or other financial product nor does it constitute investment advice.
February 19, 2025
Mark Vitner, Chief Economist
Piedmont Crescent Capital
(704) 458-4000
The Economy is Adjusting to Trump Time
Tariffs Will Add to Stubborn Inflation in 2025
- The world continues to grapple with the rapid policy shifts introduced by the Trump Administration. Wide-ranging tariffs have become a reality—some serving as short-term negotiating tools, while others aim to reinforce trade agreements and reshape the global trading structure. These tariffs will contribute modestly to inflation in 2025, though their impact will diminish the following year. U.S. manufacturing is expected to see modest growth this year.
- Economic growth fell short of expectations in Q4, with real GDP rising at a modest 2.3% annual rate. However, final domestic demand remains steady at around 3%, consistent with the past two years. The Q4 GDP shortfall was primarily driven by a surge in imports ahead of anticipated tariffs, a trend that may persist in the early months of this year.
- Job growth began the year slowly, with employers adding just 146,000 jobs in January. However, upward revisions to the previous two months lifted the three-month average to 237,000. Annual revisions showed 589,000 fewer jobs added between March 2023 and March 2024, in line with expectations. Growth remains heavily concentrated in health care and social services, leisure and hospitality and government.
- Inflation began the year on a surprisingly higher note, and annual data revisions showed slightly less progress has been made at returning inflation to the Fed’s 2% target. With higher tariffs looming, inflation may prove persistent than had been anticipated, likely delaying the Fed’s next rate cut by at least a few months.
- President Trump has moved quickly to implement his campaign agenda, imposing tariffs, strengthening border security, expediting deportations of undocumented persons convicted of violent crimes, reducing government waste, and downsizing the federal workforce. The rapid pace has caught his opposition off guard, leading to some unexpected early progress. This month’s CAVU Compass explores the prospects and implications of these actions.
- The administration has secured trade deals with Colombia, Panama, Canada, and Mexico and recently announced plans to launch peace talks between Russia and Ukraine. We estimate a 65% probability that the war will end this spring. Meanwhile, the fragile ceasefire between Israel and Hamas remains at risk, as Trump and Netanyahu have taken a more aggressive stance to secure the release of hostages from the October 7 attacks. Renewed conflict could push oil prices and shipping costs higher, while a ceasefire in Ukraine would help ease inflationary pressures and support economic growth, particularly in Europe.
The world continues to grapple with the rapid policy shifts introduced by the Trump Administration, particularly in the area of trade. From steel and aluminum tariffs to broad-based reciprocal measures against countries that impose duties on U.S. goods, the Administration’s aggressive stance threatens to disrupt global markets, reshape supply chains, and force businesses to alter the way they source and produce products. While some tariffs are intended as short-term negotiating tools, others reflect a broader strategy to reinforce existing trade agreements, such as NAFTA/USMCA, and others seek to restructure the global trading system.
One of the most significant consequences of Trump’s tariffs is their impact on inflation and consumer spending. As tariffs raise the cost of imported goods, businesses often pass these costs on to consumers, driving prices higher. While the overall effect on U.S. inflation in 2025 is expected to be modest, it remains a concern for policymakers and the Federal Reserve, particularly as inflation has already proven more resilient than anticipated. Tariffs could also contribute to inflation by fueling inflation expectations, giving businesses greater flexibility to raise prices. The primary risk is a feedback loop—firms preemptively hike prices, households adjust expectations, and wage pressures build—potentially forcing the Fed to take a more restrictive stance.
We have adjusted our inflation forecast, with tariffs now expected to add between 0.4 and 0.5 percentage points to core inflation this year. While this impact is expected to gradually diminish, the path back to the Fed’s 2% target will be longer-. Higher inflation will also weigh on consumer spending, particularly among middle- and lower-income households. Recent consumer sentiment surveys indicate rising near-term inflation expectations and weaker overall sentiment, with middle- and lower-income households feeling the greatest strain.
U.S. manufacturing is projected to experience modest growth this year as some companies relocate production to the U.S. to circumvent tariffs. The steel industry stands to gain from the 25% tariffs on all imported steel, while aluminum producers may also benefit, though the impact will be limited due to the relatively small number of operating aluminum smelters in the U.S. The broader implications of tariffs are more intricate—higher input costs could negate some of these advantages, particularly for sectors heavily dependent on steel and aluminum. Furthermore, retaliatory tariffs from other nations have the potential to hinder U.S. exports. The economic strain of U.S. trade policies is anticipated to affect Europe, Canada, and Mexico more significantly, although exemptions for essential imports such as aluminum, softwood lumber, and auto parts might alleviate some of the impacts.
We expect U.S. economic growth to slow to a 2% pace in the first half of this year. Imports are likely to exert a modest drag on GDP growth in Q1, as firms front-load shipments ahead of tariff increases. However, some of this impact will be offset by increased inventory building. Additionally, higher long-term interest rates will continue to weigh on home buying and overall spending on big-ticket items. Efforts to curb government spending will also likely lessen the tailwind from the IRA and CHIPS programs driving business fixed investment.
Inflation began the year with higher-than-expected increases in both consumer and wholesale prices for January. The Consumer Price Index (CPI) rose by 0.5%, marking its largest monthly gain since August 2023, while core CPI increased by 0.4%. The Producer Price Index (PPI) also exceeded predictions, with a headline increase of 0.4%. Additionally, annual data revisions indicated that inflation has not decreased as much as previously estimated, raising concerns that the Federal Reserve may maintain higher interest rates for an extended period.
Market expectations have adjusted accordingly, with no anticipated rate cuts through spring and summer and only a slight possibility of one by the end of the year. Some former Federal Reserve officials have even suggested the possibility of a rate hike, though this is considered unlikely. In his February congressional testimony, Fed Chair Jerome Powell confirmed that the central bank is not in a hurry to reduce rates, supporting the view that the federal funds rate will remain above its neutral level well into next year.
The market’s initial response to January’s inflation data may be exaggerated. While inflation is still on a downward trend, the final reduction from 3% to 2% is expected to take longer than the drop from 9.1% to 3%. The post-pandemic unwinding of price spikes, particularly in used cars and gasoline, amplified earlier progress. Moreover, upcoming tariff increases could apply upward pressure on prices, although consumer resistance to price hikes may mitigate the impact, affecting sales and prompting some companies to adjust their pricing strategies. Higher productivity and moderating wage growth are expected to contribute to easing inflation later in the year, creating a more stable environment for businesses and consumers.
Although the notable increases in CPI and PPI sparked concerns, they may exaggerate the potential inflation threat. Seasonal factors likely influenced the January data, as price adjustments for items with infrequent changes tend to cluster at the beginning of the year. Similar patterns have been observed in previous years, driven by one-time factors such as insurance premium resets and wage negotiations from the prior year. These seasonal distortions suggest that progress in reducing inflation is slowing but not halting or reversing. Importantly, the underlying data in the PPI report indicate that the personal consumption expenditures (PCE) deflator—the Federal Reserve’s preferred inflation measure—is unlikely to rise as sharply as CPI and PPI. Furthermore, both median and trimmed-mean CPI continue to trend downward, as do similar measures for the PCE deflator.
The financial markets were further unnerved by unexpectedly poor results from the early January University of Michigan Consumer Sentiment Survey. Consumer sentiment dipped slightly, falling to 73.2 from 74.0 in December, which was only modestly worse than expected. The decline was entirely driven by the expectations component, which fell 3.1 points to its lowest level in six months, reflecting increased concerns over future economic conditions and inflation. In contrast, the current conditions index rose 2.8 points, as low gasoline prices and solid employment conditions continued to bolster perceptions of personal finances.
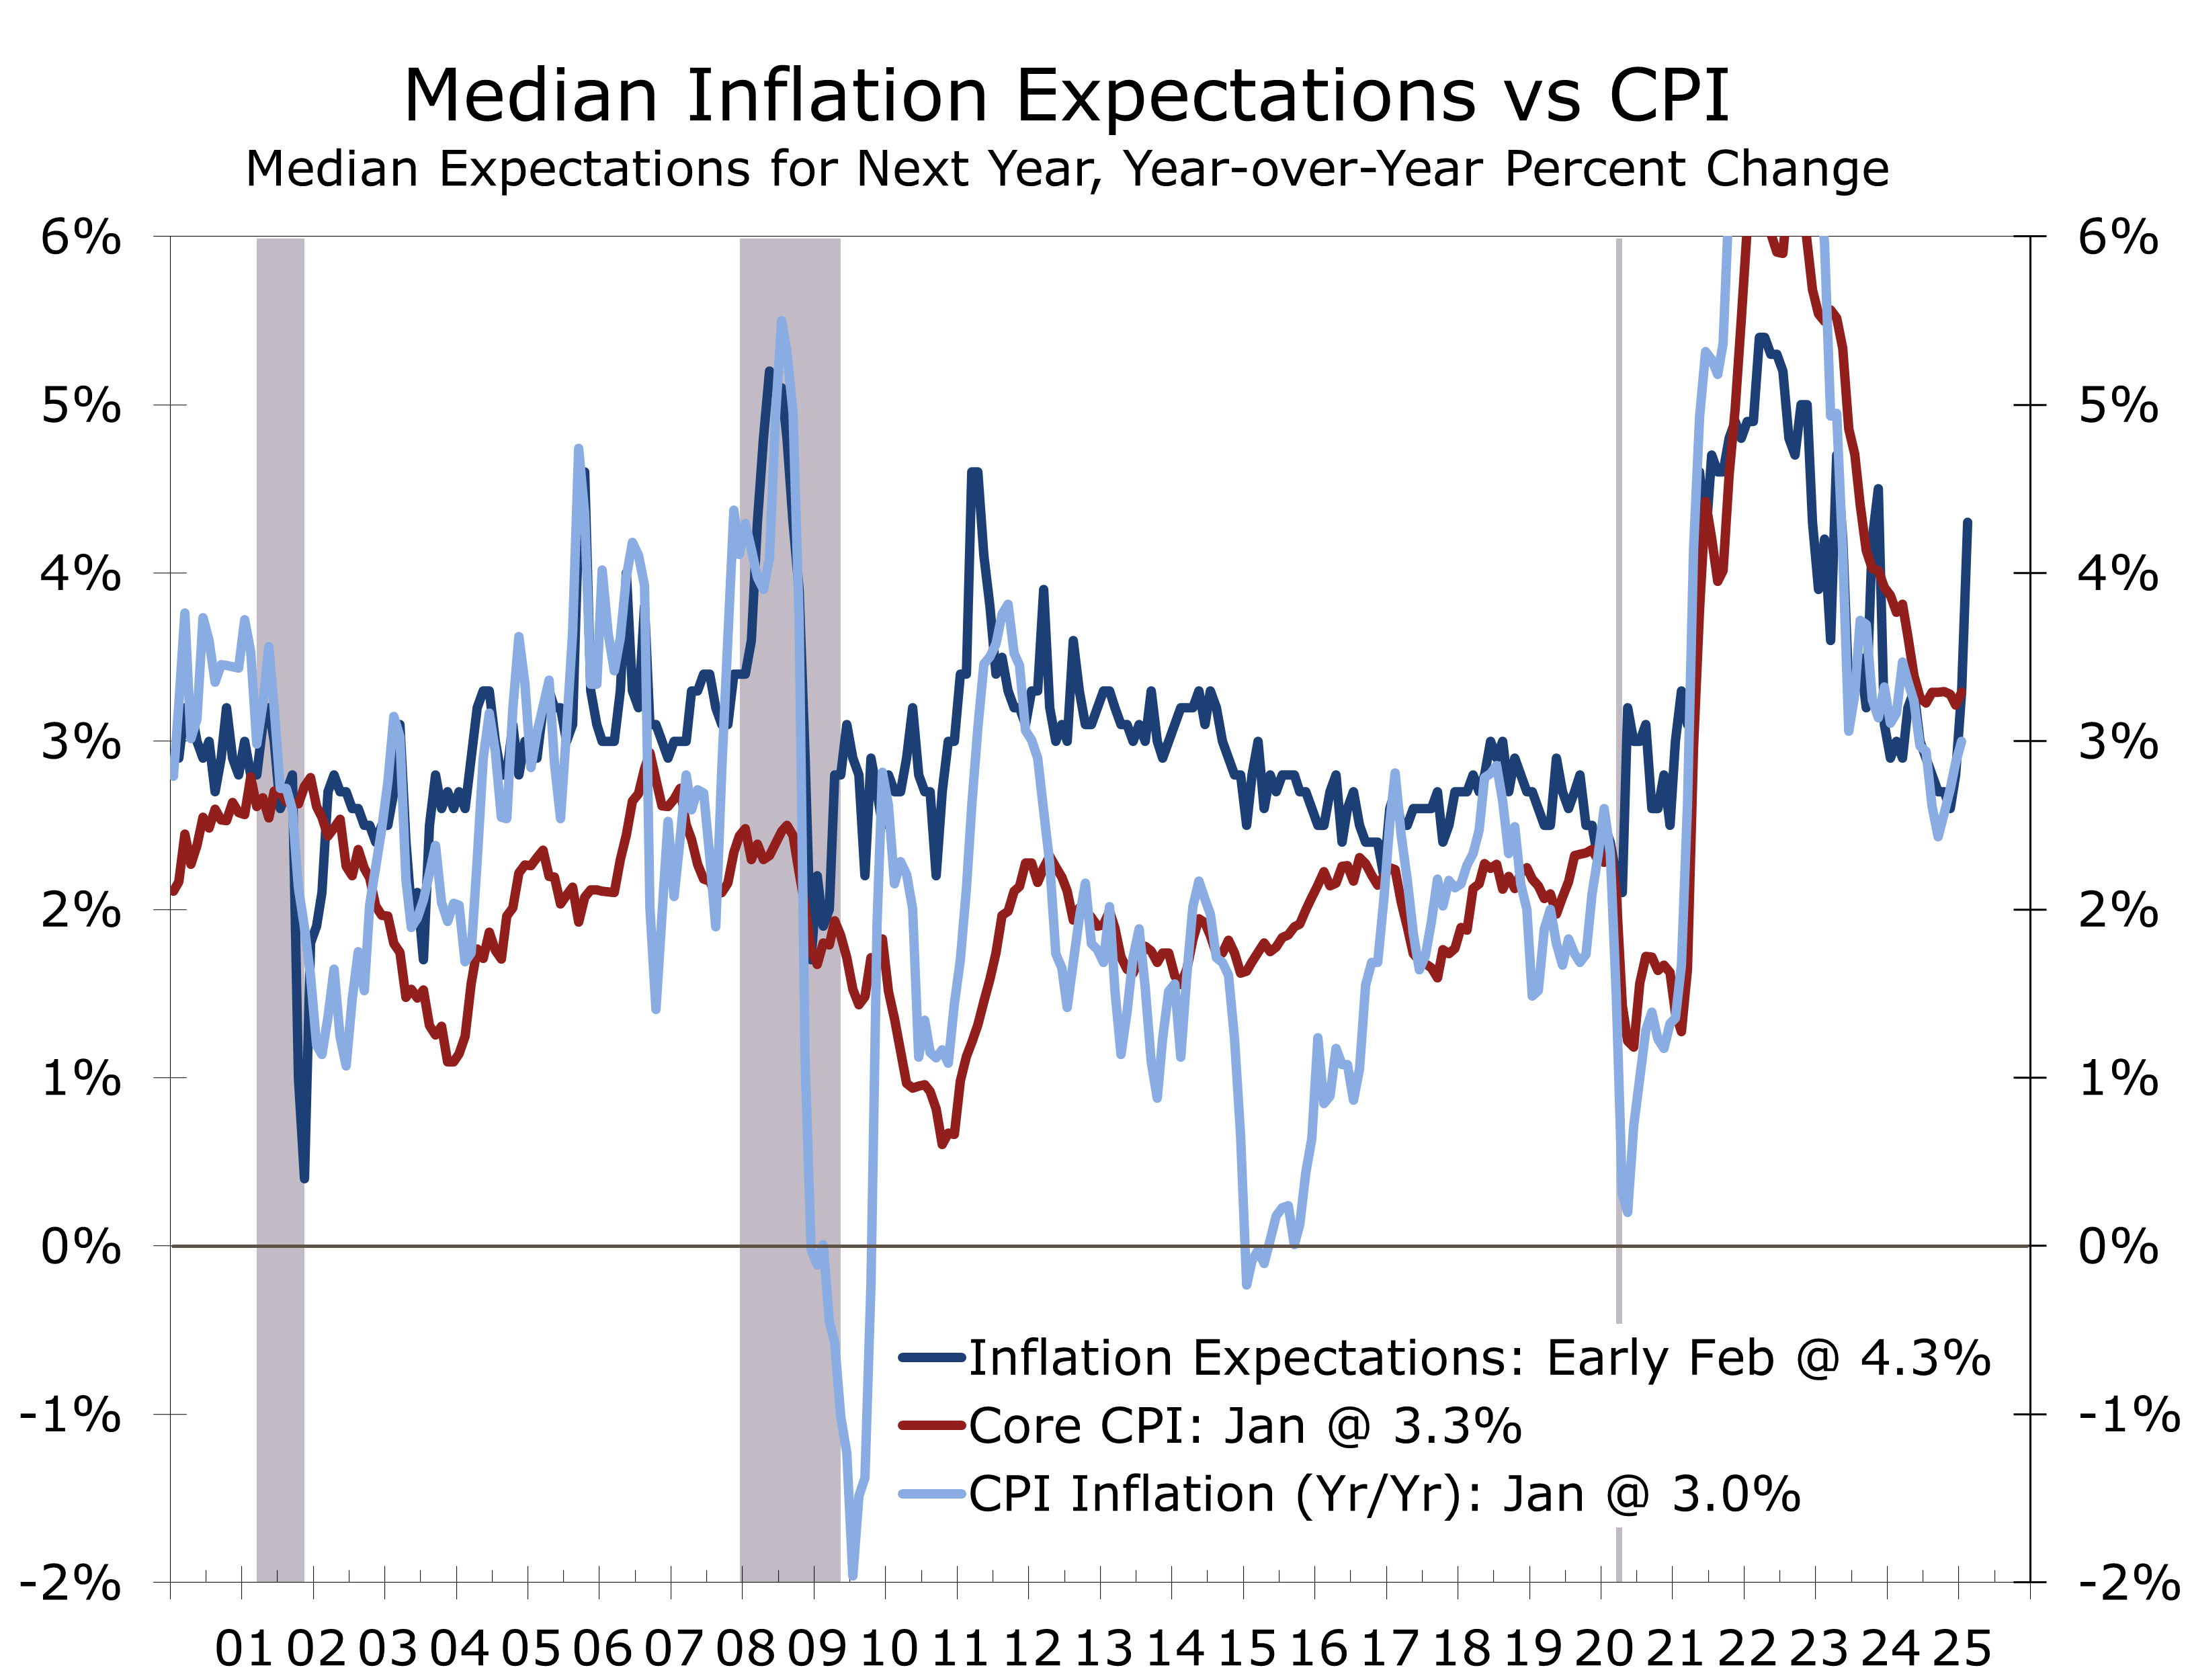
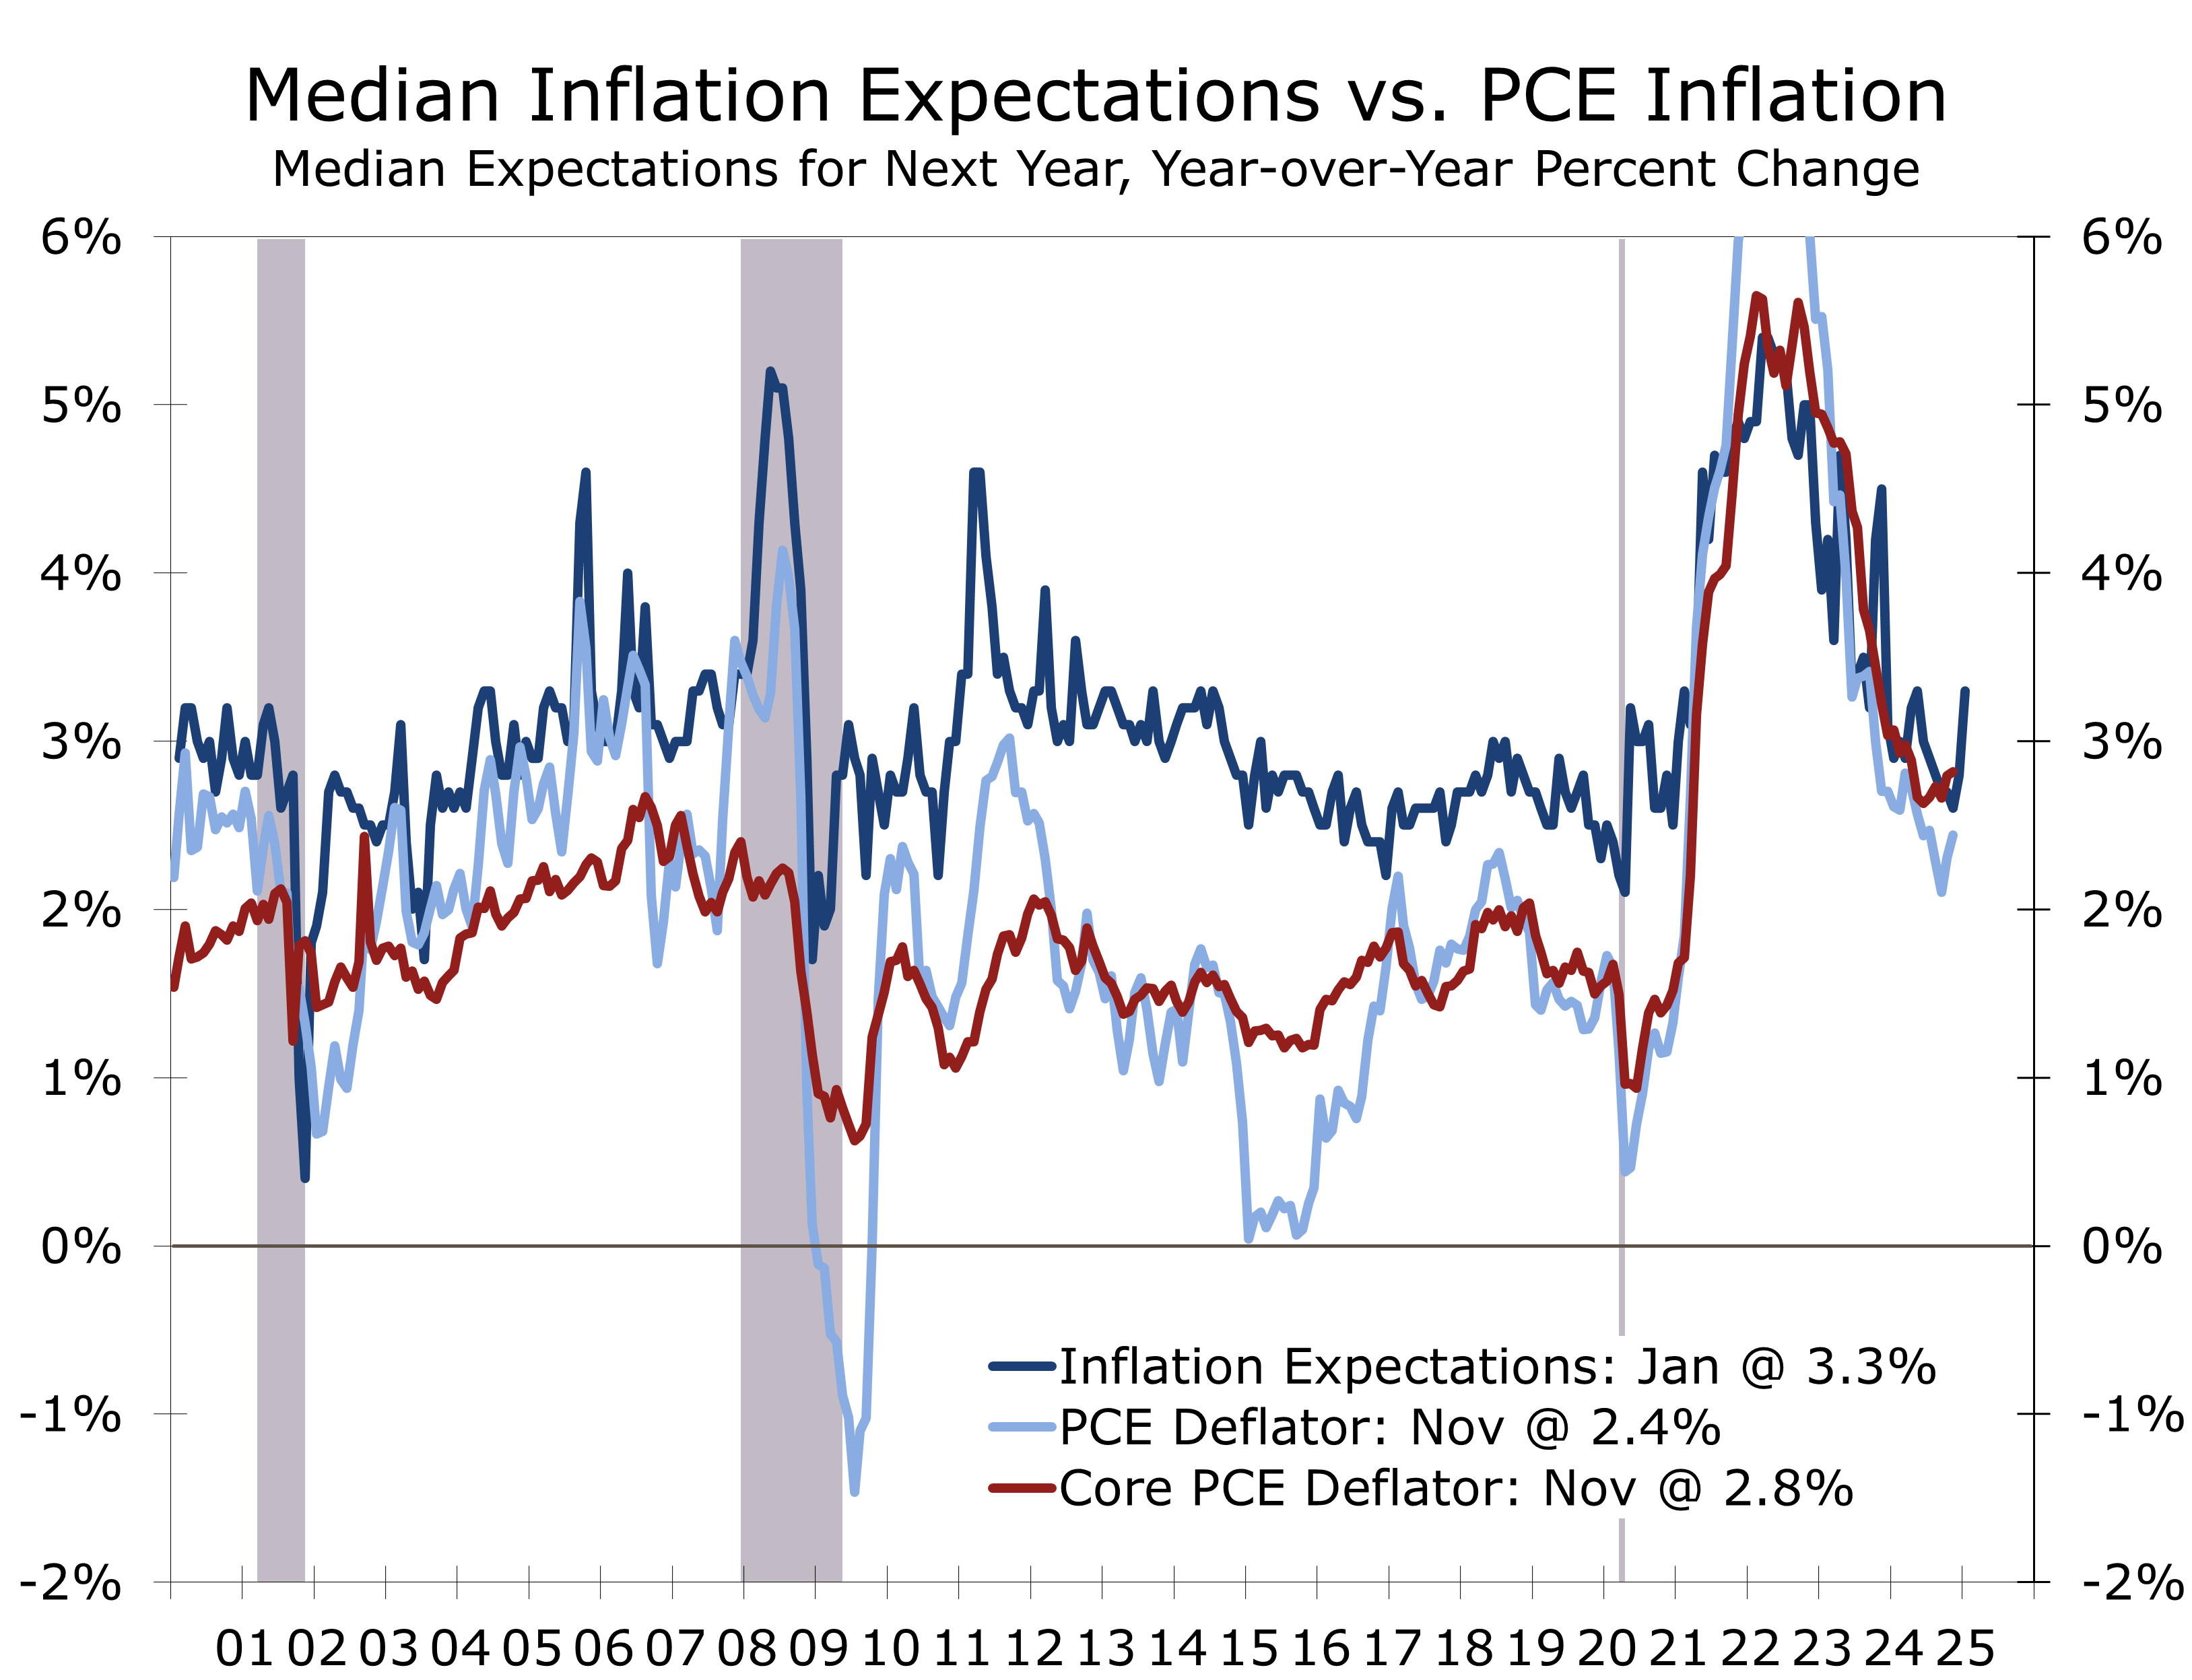
The divergence between the two indices highlights consumers’ growing worries about inflation and some trepidation about the incoming Trump administration, which promises to unleash significant changes. While earlier progress in slowing inflation had brought some relief, concerns about future price increases—exacerbated by uncertainty surrounding tariffs—dampened sentiment. Year-ahead inflation expectations surged to 3.3%, up from 2.8% in December, marking the highest level since May 2024. Long-term inflation expectations also increased, climbing 0.3 percentage points to 3.3%, the largest monthly increase since May 2021 and the highest level since June 2008.
While the surprisingly large jump in inflation expectations is unnerving, it is important to note that the preliminary Consumer Sentiment data, particularly the inflation components, are often misleading. The more comprehensive data reported at end of the month often reverse early-month swings in inflation expectations entirely. That said, there are ample reasons to believe the uptick in inflation expectations is more genuine than in the past. Progress on reducing inflation has stalled in recent months, and the Fed has acknowledged that the path back to its 2% inflation target is likely to be longer and more uneven than previously anticipated.
Heightened concern about inflation likely reflects recent price hikes at grocery stores, particularly for frequently purchased items such as eggs. The UMich notes that the rise in inflation concerns is evident across various demographic groups, with particularly strong increases among lower-income households and politically Independent-leaning individuals. Combined with added inflationary risks from tariffs, inflation expectations may remain elevated in the near term, giving the Federal Reserve further reason to remain cautious. The Fed places significant emphasis on keeping inflation expectations anchored and will work to discourage consumers from accelerating purchases to stay ahead of anticipated price increases.
Retail sales experienced a significant decline in January, with the headline figure contracting by 0.9% alongside a broad-based pullback across key categories. While adverse weather and seasonal adjustment factors played a role in the reduction, the widespread weakness indicates a softer start to Q1 consumer spending. A major contributing factor was the downturn in auto sales, while discretionary categories—such as sporting goods, furniture, and building materials—witnessed the steepest declines. Additionally, non-store retail sales, primarily online, decreased, prompting questions about whether weather alone was responsible for January’s weakness.
Consumer sentiment has continued to deteriorate in early February, reflecting increasing policy uncertainty. With excess savings largely exhausted, current spending relies more on employment and income growth. Elevated grocery prices and rising insurance costs are likely significant contributors to the decline in sentiment. Consumers’ assessment of current conditions has dropped 6.4 points since December to 68.7, while expectations for future economic conditions—which have a closer link to actual spending—have fallen by 6.0 points to 67.3.
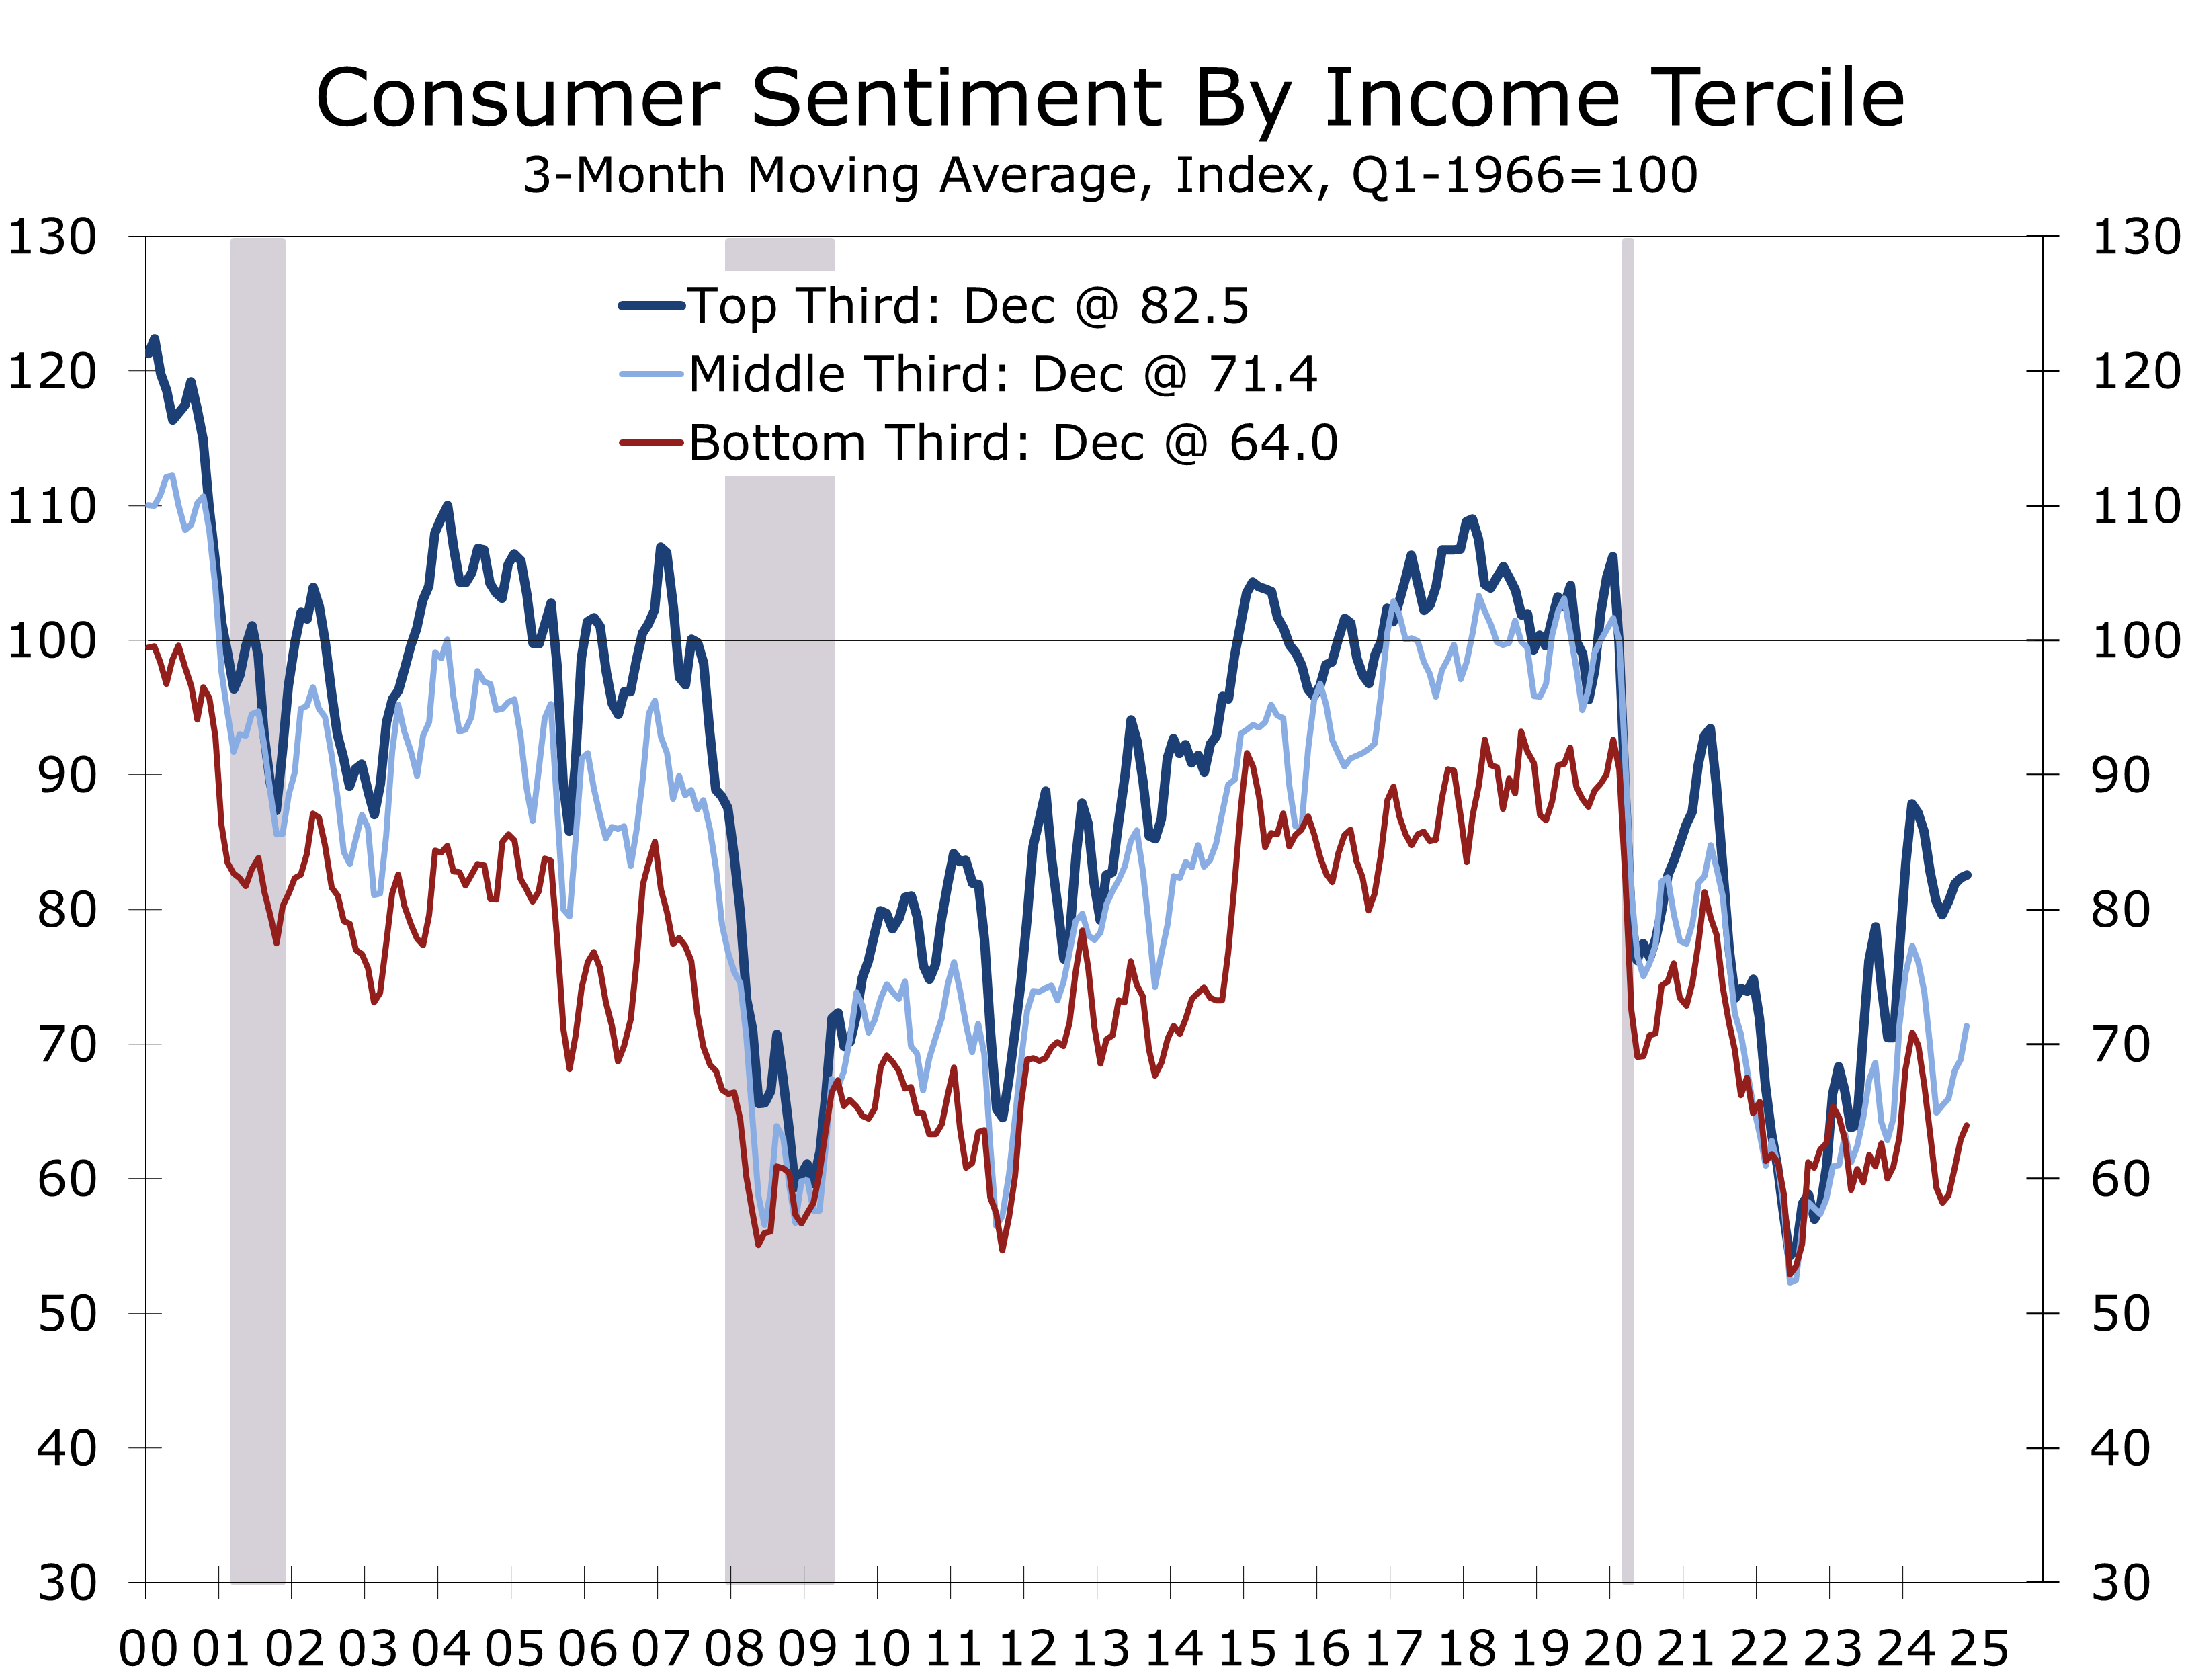
The University of Michigan’s consumer sentiment survey highlights particular weakness among lower-income households. Sentiment for the lowest income tercile has decreased to 64, matching the levels seen during the depths of the Global Financial Crisis. Middle-income households are only slightly more optimistic, with sentiment at 71.3. These figures suggest that economic uncertainty and rising costs are disproportionately affecting consumers with tighter budgets, posing a potential obstacle to discretionary spending.
Despite these concerns, underlying fundamentals support consumer spending in 2025. The unemployment rate remains low at 4%, and weekly jobless claims are near historic lows. Wage growth is robust, and household balance sheets—along with slightly lower interest rates compared to a year ago—should provide some support. Low-rate financing incentives are expected to sustain light vehicle sales and big-ticket spending.
However, financial strength is not evenly distributed across income groups. Rising costs for necessities are disproportionately impacting lower- and middle-income households, putting pressure on discretionary spending. Given these dynamics, we have slightly reduced our estimate for Q1 consumer spending and continue to anticipate a below-consensus gain of just under a 2% annual rate.
An old axiom in economic analysis advises distinguishing between what you think the Fed will do and what you think it should do. In today’s hyperpolarized political climate, this principle is just as relevant when assessing the Trump administration. It is more constructive to focus on what the administration will do rather than what one believes it should do. Another key rule to apply—take Trump seriously, but not literally—meaning the most hyperbolic rhetoric from both Trump and his opposition should be ignored or at least downplayed.
The administration’s priorities include strengthening border security, deporting undocumented migrants convicted of violent crimes, and using tariffs as a policy tool, revenue enhancement, and a means to leverage U.S. market power. DOGE also aims to reduce government waste to curb the deficit and build credibility for any potential future entitlement reform. In foreign affairs, securing strategic shipping chokepoints such as the Panama Canal and Northwest Passage is a focus, alongside recalibrating NATO to reflect post-Cold War realities. Trump has also expressed a desire to broker lasting peace in the Israel-Hamas and Russia-Ukraine conflicts.
The administration’s agenda is advancing rapidly, catching opponents off guard. Tariffs have been implemented faster and more decisively than expected. While Mexico and Canada secured an extension, comprehensive tariffs are set to take effect on March 4 and are expected to remain in place, along with a 25% tariff on steel and aluminum imports. A primary objective is curbing the transshipment of Chinese steel via Canada and Mexico.
Legal challenges against DOGE are likely to prove fleeting, as the administration has utilized the U.S. Digital Service—an agency created under Obama—to execute its plans. DOGE also remains popular with the public. Total savings from DOGE are likely to fall well short of solving the government’s spending crisis and persistent deficits, although DOGE has already proven more effective at uncovering savings than most previous efforts.
Securing peace between Israel and Hamas remains difficult. The Trump administration has resumed arms shipments to Israel, hoping to pressure Hamas into submission. In contrast, a Russia-Ukraine ceasefire appears more plausible. While Ukraine will not join NATO, an increased European military presence and US economic ties would be relied upon to deter renewed Russian aggression. A ceasefire could ease inflationary pressures in Europe and the U.S. and would support economic growth in Europe.
The weaker-than-expected January employment data, higher-than-expected inflation, and a sharp drop in retail sales align well with our below-consensus call for Q1 GDP growth. We noted last month that the Los Angeles wildfires would weigh more heavily on Q1 growth than early consensus estimates suggested. Recoveries from fires and floods tend to take longer than those from hurricanes or earthquakes, delaying any lift from rebuilding. Given the size of Los Angeles’ economy, the disruption is significant enough to impact national data on employment, income, retail sales and manufacturing.
Beyond natural disasters, the uneven distribution of economic strength remains our key concern. Upper-income households are more insulated from inflation due to rising asset prices, while lower-income, asset-light households face increasing pressure from higher costs of essentials like groceries, housing, and transportation. This divergence is contributing to weaker discretionary spending and broader economic uncertainty.
Technical factors will also restrain Q1 growth. Accounting for housing losses will weigh on consumer spending, while inventory building ahead of potential tariffs will boost imports and temporarily inflate inventory levels. Despite slower Q1 growth, the Fed is unlikely to cut rates with unemployment near 4%. However, inflation should continue to decelerate gradually this year, paving the way for a 25-basis-point cut in late spring or early summer. While we still expect two quarter-point cuts this year. The case for a second cut is now less certain.
Policy uncertainty will also restrain business investment. Concerns over tariffs, the Inflation Reduction Act, and the CHIPS Act will weigh on capital spending in the first half of the year. However, as more clarity emerges on trade, taxes, and deregulation, we expect growth to strengthen in the second half of this year.
Disclaimer: This publication has been prepared for informational purposes only and is not intended as a recommendation offer or solicitation with respect to the purchase or sale of any security or other financial product nor does it constitute investment advice. Any forward-looking statements or forecasts are not guaranteed and are subject to change at any time. Information from external sources have not been verified but are generally considered reliable..
February 18, 2025
Mark Vitner, Chief Economist
Piedmont Crescent Capital
704-458-4000
The Fed Must Hold the Line to Tame Inflation
Inflation Comes in Hotter Than Expected
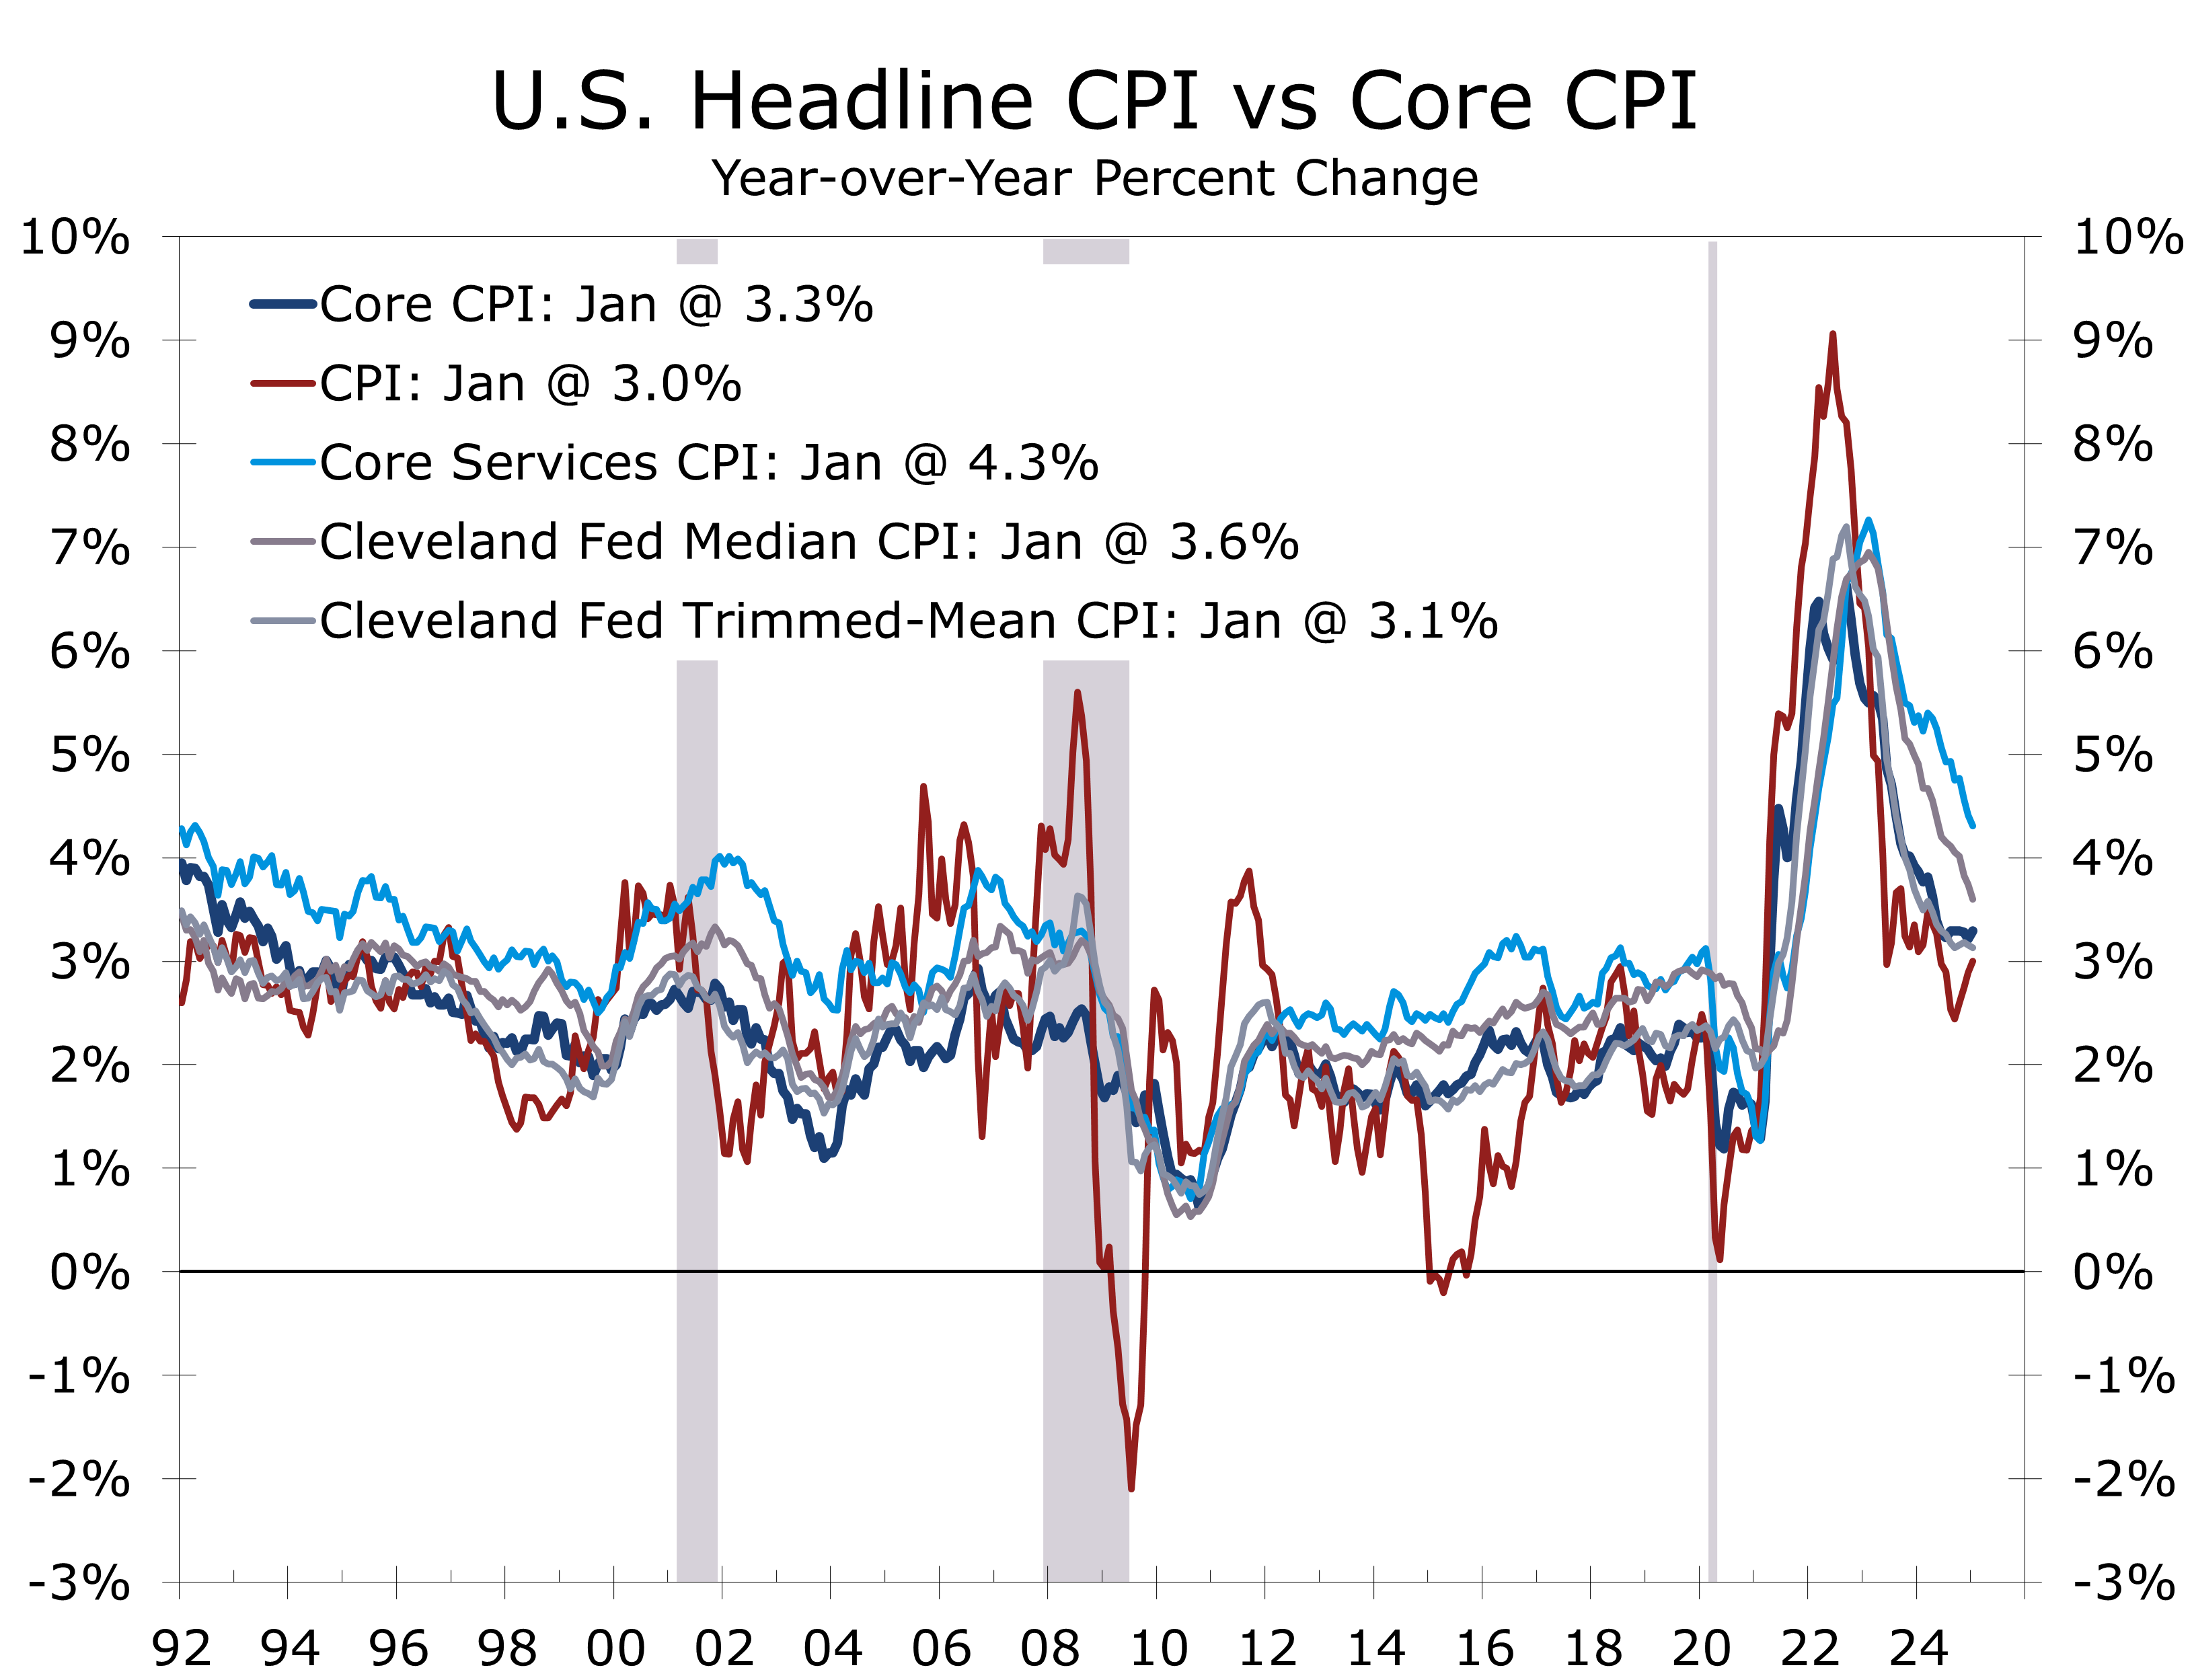
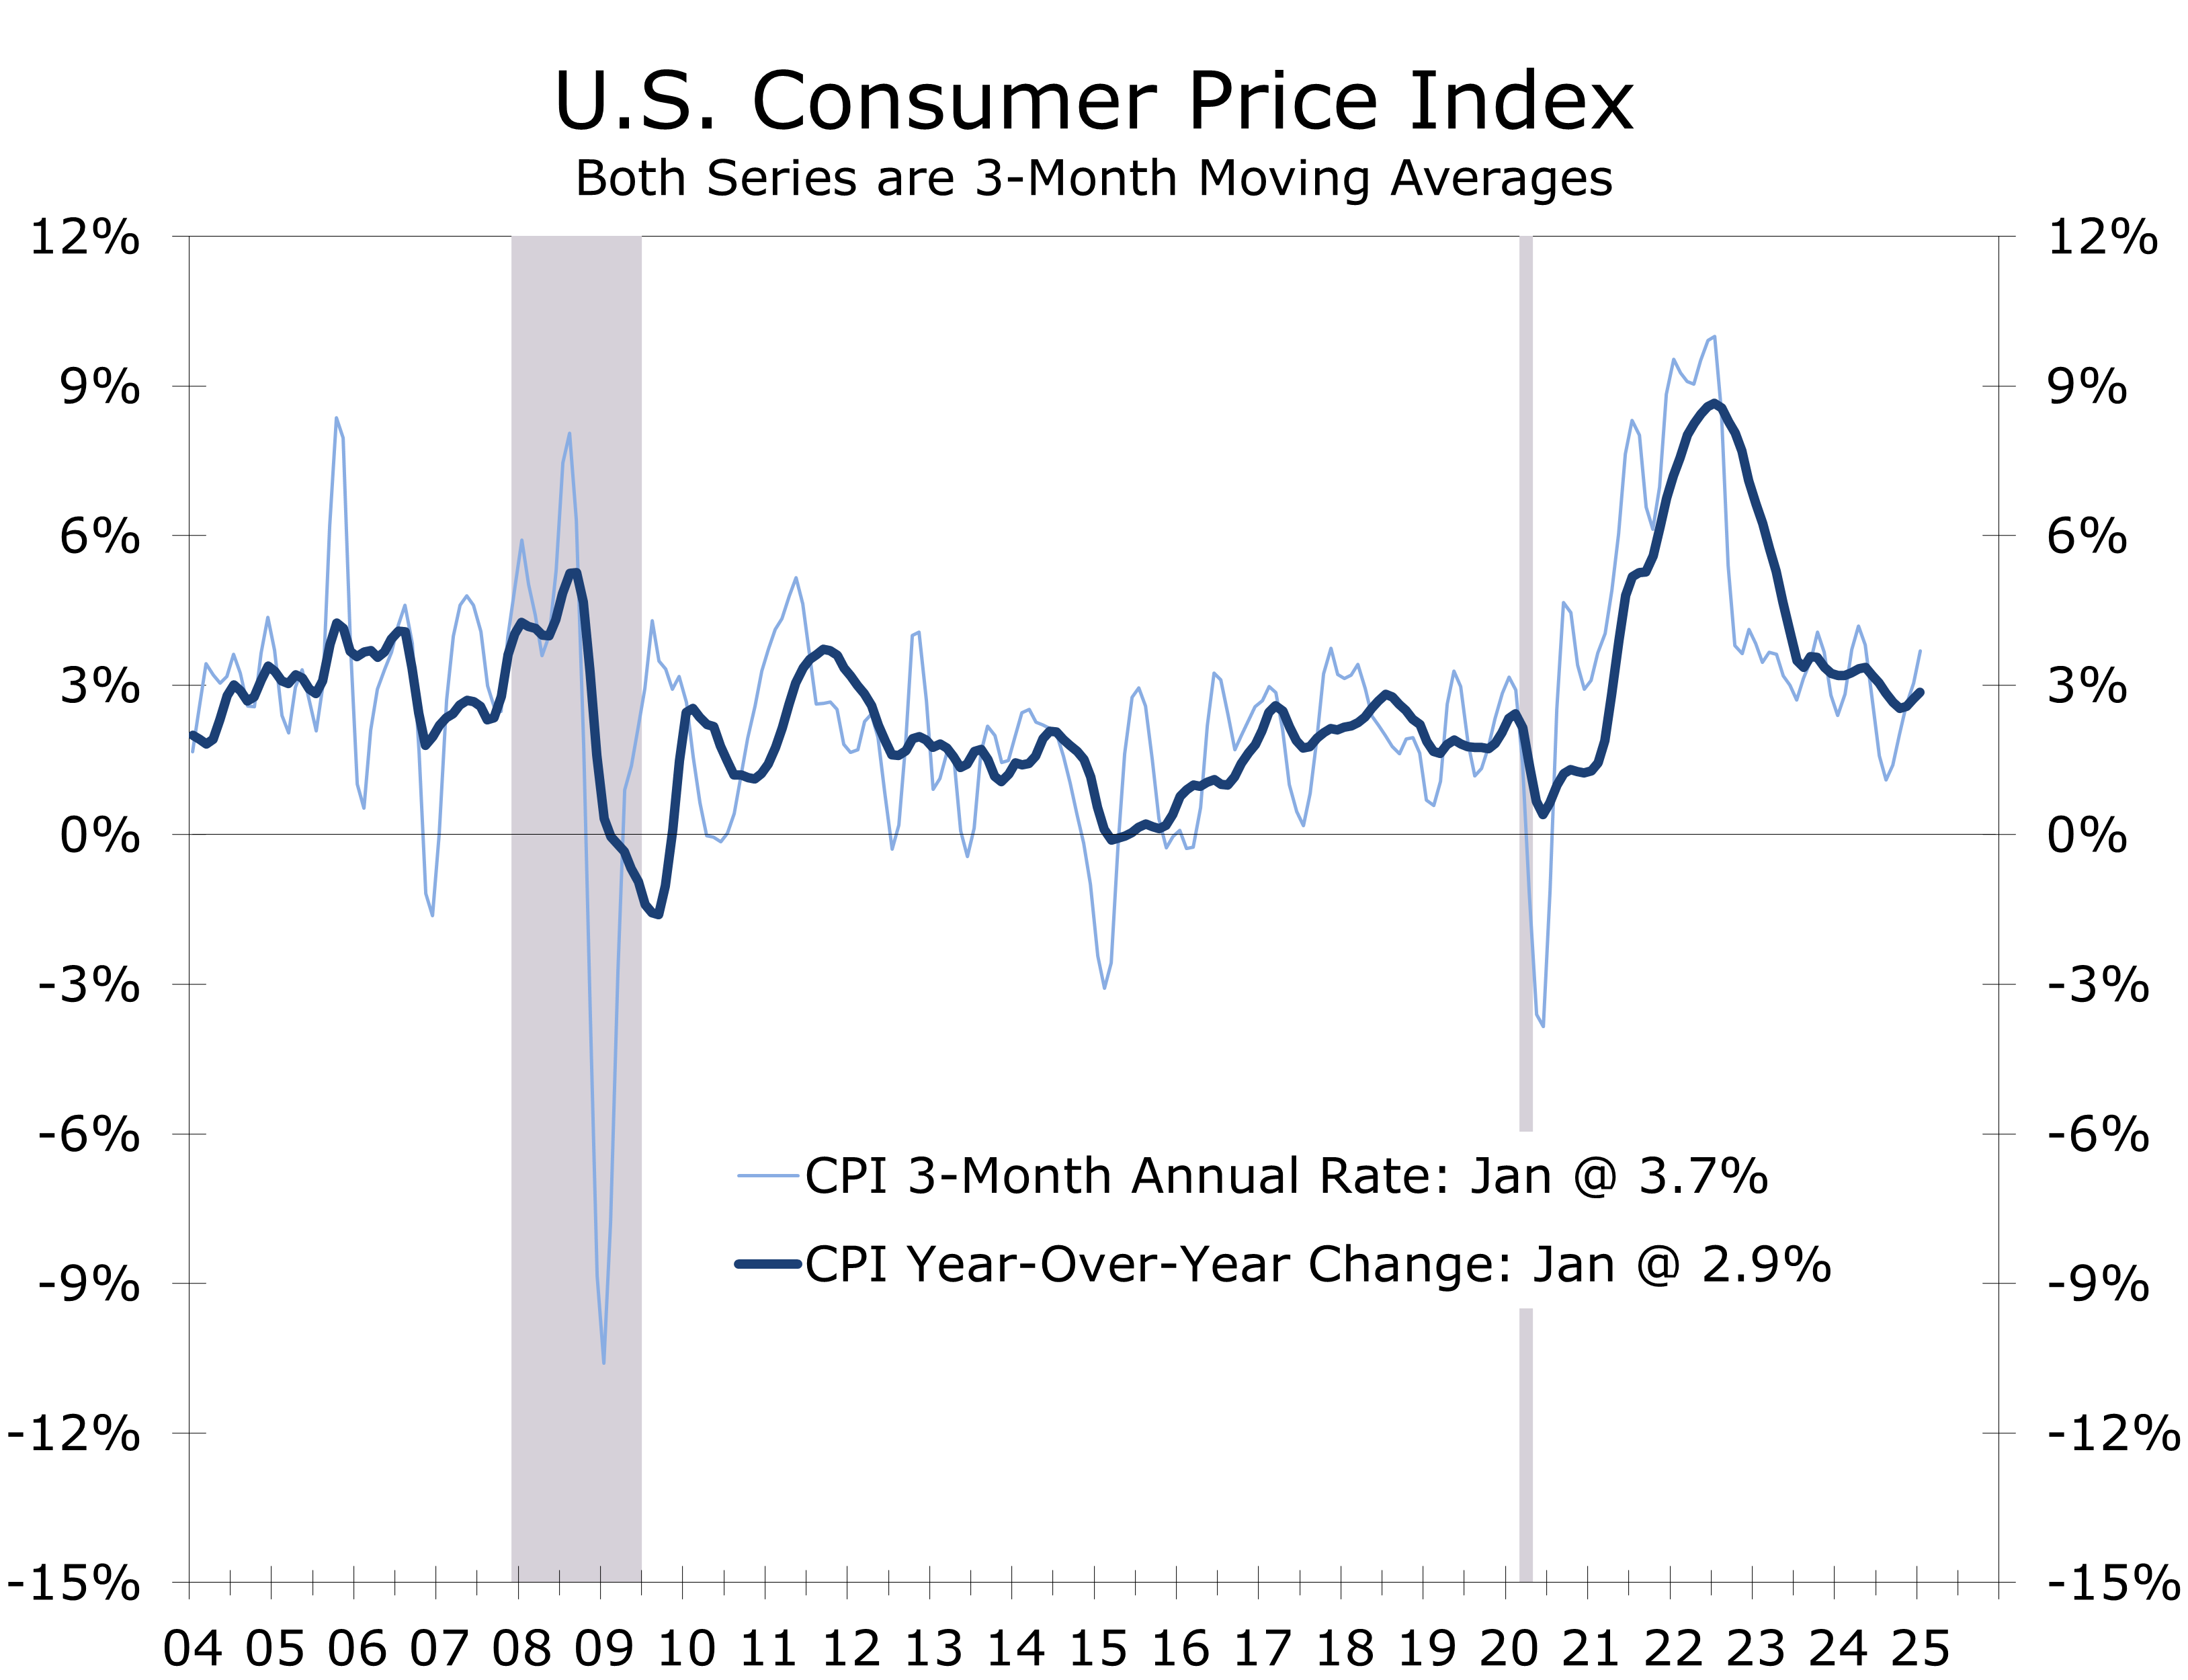
- The headline CPI jumped 0.5% in January and has risen at a 3.7% annual rate over the past three months.
- The core CPI rose 0.4% in January and 3.3% year-over-year, highlighting persistent price pressures for key essential purchases.
- Energy prices rose 1.1%, led by a 1.8% jump in gasoline prices, though year-over-year energy inflation remains subdued (+1.0%).
- Egg prices surged 15.2% in January, up 53.0% year-over-year, contributing to two-thirds of the 0.5% increase in grocery prices.
- Auto-related costs surged, with motor vehicle insurance up 2.0% in January and 11.8% year-over-year, while used car prices increased 2.2%.
- Service-sector inflation remains stubborn, driven by rising costs for motor vehicle insurance, airline fares, medical care, and recreation.
- Policymakers are likely to keep interest rates elevated to prevent an inflation resurgence, particularly given persistent price pressures in essentials such as food, shelter, and transportation.
The January Consumer Price Index (CPI) report showed inflation running slightly hotter than expected, with the headline CPI rising 0.5%, following a 0.4% increase in December. Over the past three months, the CPI has increased at an annualized rate of 3.7%, and on a year-over-year basis, inflation remains at 3.0%. The core CPI, which excludes food and energy, rose 0.4% in January and 3.3% over the past year, reflecting persistent price pressures in key service categories.
Shelter costs continued to be a significant contributor to inflation, rising 0.4% and accounting for nearly 30% of the overall CPI increase. Energy prices also moved higher, with the index rising 1.1% in January, driven by a 1.8% jump in gasoline prices. Food prices rose 0.4%, with food at home up 0.5% and food away from home increasing 0.2%. The sharp rise in grocery and fuel costs aligns with the uptick in near-term inflation expectations seen in the University of Michigan’s Consumer Sentiment Survey.
In addition to January’s rise in gasoline prices, other auto-related prices surged in January.
Core goods prices were mixed, with used vehicle prices climbing 2.2%, further intensifying affordability concerns in the new car market, while apparel and household furnishings declined. On the services side, price pressures remained strong, with motor vehicle insurance up 2.0%, and airline fares, recreation, medical care, and communications posting gains.
Eggflation Rocks the Grocery Aisle
Food inflation was driven by a 1.9% rise in meats, poultry, fish, and eggs, with egg prices surging 15.2%, the largest monthly jump since June 2015. Egg prices are now up 53.0% year-over-year, contributing to two-thirds of the monthly increase in food-at-home costs. Other notable gains included nonalcoholic beverages (+0.9%) and dairy (+0.3%). In contrast, fruit and vegetable prices fell 0.5%, led by a 2.0% drop in tomatoes and a 2.6% decline in other fresh vegetables. The cereals and bakery index also slipped (-0.4%), with breakfast cereals down 3.3%.
Dining-out costs rose more modestly (+0.2% month-over-month, +3.4% year-over-year), with limited-service meals up 0.3% and full-service meals up just 0.1%. Rising food costs will impact restaurants, however, with some chains already adding surcharges.
Energy prices jumped 1.1% in January, led by a 1.8% surge in gasoline prices.
The energy index rose 1.1% in January, with gasoline prices increasing by 1.8%. Electricity prices remained unchanged, while natural gas prices rose 1.8%. Over the past 12 months, energy prices have increased by just 1.0%, with gasoline prices down 0.2% year-over-year and fuel oil down 5.3%, partially offset by increases in electricity (+1.9%) and natural gas (+4.9%).
Excluding food and energy, the core CPI rose 0.4% and is up 3.3% year-to-year. Shelter costs remain elevated, with owners’ equivalent rent and rent both up 0.3% in January and lodging costs rising 1.4%. Medical care costs rose 0.2%, with prescription drug prices up 2.5%.
Auto-related costs were another major driver, with motor vehicle insurance jumping 2.0% in January and 11.8% year-over-year. Used car prices increased 2.2%, possibly reflecting heightened demand following this past fall’s storms and floods. Other notable gains included recreation (+1.0%), communication, airline fares, and education. Apparel prices declined 1.4%, and personal care and home furnishings costs also fell.
Stubbornly high prices, particularly for essentials like food, shelter, transportation, and medical care, will likely keep the federal funds rate higher for longer, as policymakers work to prevent an inflation flare up.
Tariffs add another layer of risk. While their direct impact may be limited, they could fuel inflation by boosting expectations or giving businesses cover to raise prices. The chief risk is a feedback loop—firms preemptively hike prices, households adjust expectations, and wage pressures build—potentially forcing the Fed to adopt a more restrictive stance.
Disclaimer: This publication has been prepared for informational purposes only and is not intended as a recommendation offer or solicitation with respect to the purchase or sale of any security or other financial product nor does it constitute investment advice.
Solid Job Growth and a Tight Labor Market
Solid Job Growth Will Keep the Fed on Hold
- Nonfarm payrolls rose 143,000 in January, with the unemployment rate dipping to 4.0% - the lowest since May 2024.
- Job growth is concentrated in health care, retail trade, and government sectors, which accounted for 93% of overall job gains.
- Revised data shows 620,000 fewer jobs added through 2024 than previously reported, which was now worse than expected and should keep the Fed on hold.
- The lower unemployment rate reflects a further tightening in labor market conditions, with a slowdown in immigration ahead of the presidential election likely contributing to the trend.
- Average hourly earnings rose by 4.2% year-over-year, reinforcing concerns about wage-driven inflation and caution from the Fed.
- The January employment report suggests the labor market can handle prolonged higher interest rates. While January job growth was weaker than expected, upward revisions to prior months raised the three-month average to 237,000 per month. Annual benchmark revisions were in line with expectations, removing the need for a more immediate rate cut.
Nonfarm payrolls increased by 143,000 in January, while the unemployment rate fell to 4.0%. Job gains remain heavily concentrated in health care, social assistance, retail trade, and government, which together accounted for 93% of total job growth. Employment at motor vehicle assembly plants, temporary staffing firms, and in the mining and energy extraction sectors declined slightly.
The annual benchmark revisions show 620,000 fewer nonfarm jobs were created through the end of 2024 than previously reported, aligning closely with our estimate. This downward revision likely diminishes the urgency for the Federal Reserve to cut interest rates.
Annual benchmark revisions were no worse than expected, leaving the Fed on hold.
January’s decline in the unemployment rate reflects a tightening labor market. This year’s population adjustment was unusually large due to a spike in immigration. Had the new population figures been applied to earlier data, the unemployment rate would have fallen by 0.2 percentage points, to 3.9%.
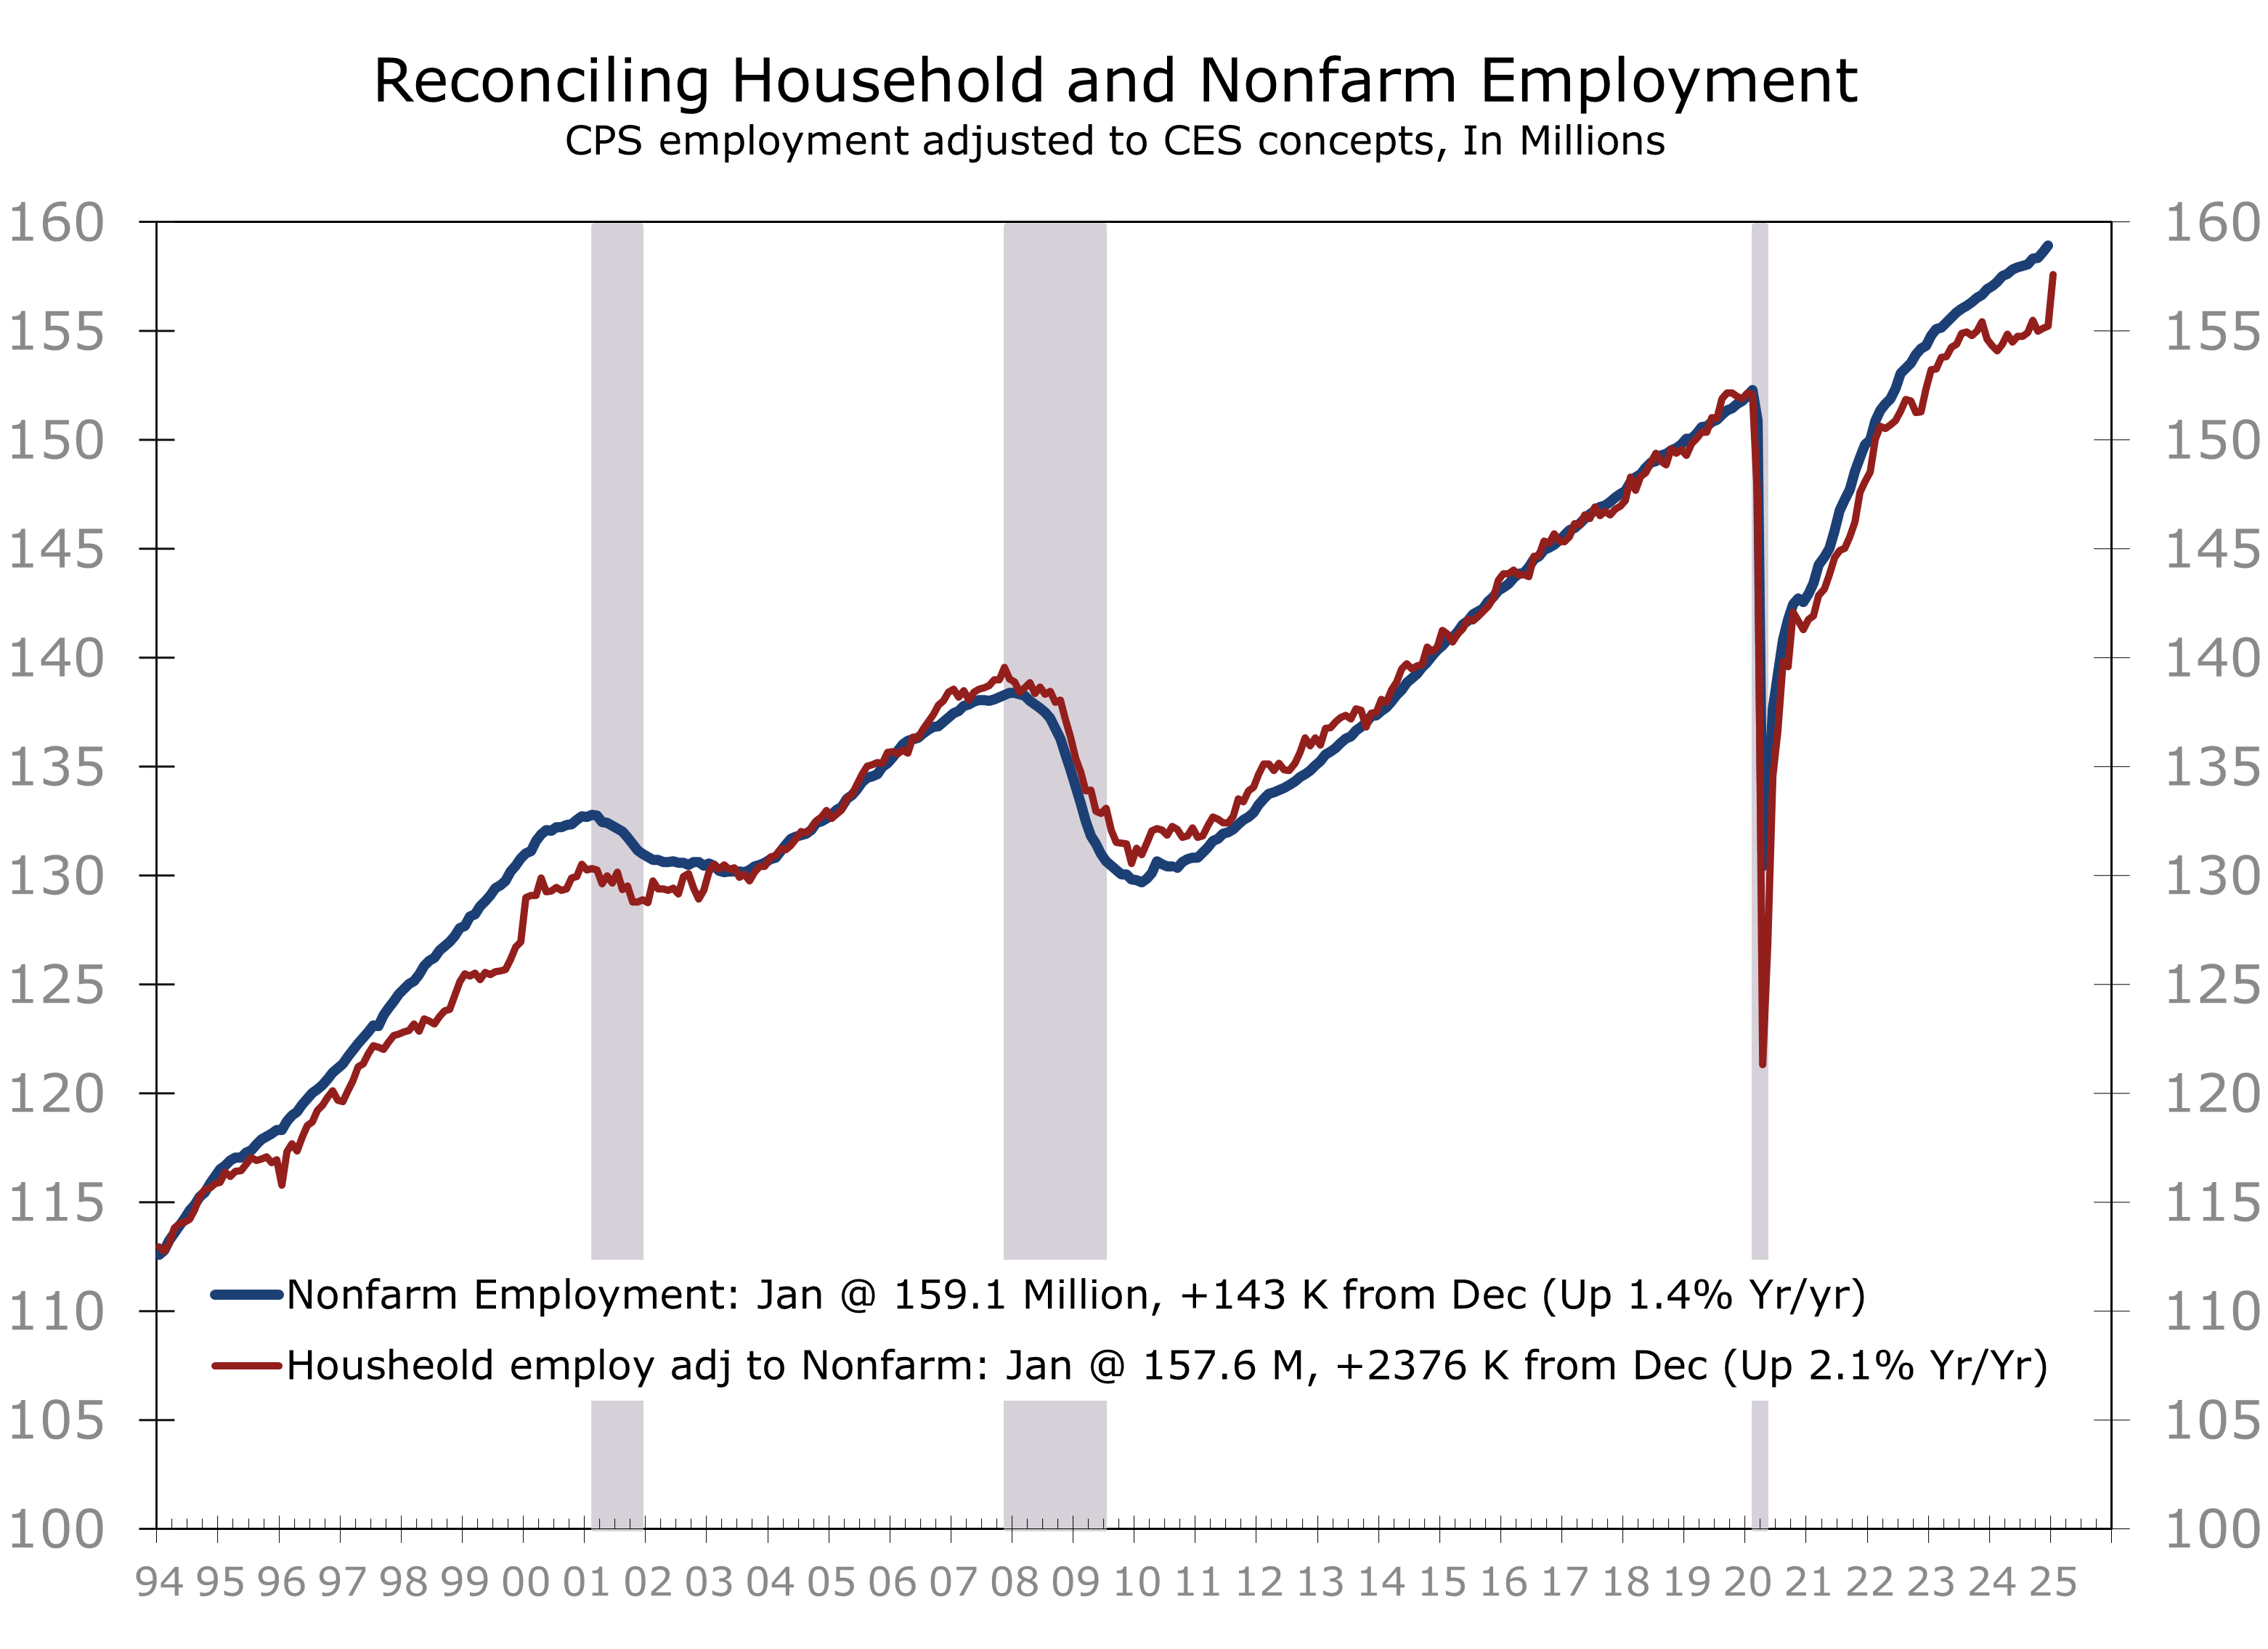
The annual adjustments also helped close what had been an unusually wide gap between nonfarm payrolls (CES) and the BLS-adjusted civilian employment series (CPS). The gap ended the year with adjusted civilian employment 4.3 million jobs below nonfarm payrolls but narrowed to just 1.46 million fewer in January.
While job growth moderated in December, it remains solid, averaging 237,000 per month over the past three months and 176,000 per month over the past year. With the unemployment rate at 4% and rising inflation expectations, the Fed will likely remain on hold.
Overall job growth is moderating and the breadth of industries adding jobs is narrowing.
While job growth remains solid, the pace of growth is moderating, and the breadth of industries adding staff is narrowing. Health care, retail, and government jobs dominated job growth this past year, and that trend continued into January. Health care added 44,000 positions, driven by gains in hospitals (+14,000), nursing facilities (+13,000), and home health care services (+11,000). Retail trade added 34,000 jobs, led by general merchandise retailers (+31,000). Government employment rose by 32,000.
The January jobs data signals that the labor market can withstand higher short-term interest rates for an extended period. While job growth in January was weaker than expected, upward revisions to prior months lifted the three-month average to 237,000 per month, and the annual benchmark revisions were no worse than expected. The Fed would have needed to see a significant downward revision to the benchmark data to justify a more immediate rate cut.

The unemployment rate fell to 4.0%, the lowest since May 2024, highlighting the tight labor market. January’s data, including annual population updates, suggests that a slowdown in immigration—particularly ahead of the presidential election—is further tightening labor conditions.
The unemployment rate edged higher and household employment data remain weak.
Average hourly earnings rose 4.2% year-over-year, partly due to a later survey period capturing a greater proportion of annual wage increases. Combined with rising inflation expectations, this raises concerns about wage-driven inflation, prompting the Fed to take a cautious approach. With solid job growth continuing, the Fed can afford to wait for more data before further easing its previous tightening.
The annual revisions and population adjustments provide clarity on labor market strength. Most employment measures are now in sync, offering a clearer view of labor market conditions. While we continue to monitor the narrowing breadth of job gains, the labor market remains tight and maintains strong momentum.

Disclaimer: This publication has been prepared for informational purposes only and is not intended as a recommendation offer or solicitation with respect to the purchase or sale of any security or other financial product nor does it constitute investment advice.
February 7, 2025
Mark Vitner, Chief Economist
(704) 458-4000
mark.vitner@piedmontcrescentcapital.com
An Inauspicious Start to the New Year
Rough Start, Rough Year?
- The New Year got off to an inauspicious start, with an individual inspired by ISIS driving a car through a crowd of New Year’s revelers on New Orleans’ iconic Bourbon Street. This attack was followed by an explosion involving a Tesla Cybertruck at the Trump Hotel in Las Vegas, which was later determined to be a suicide incident rather than a terrorist act. Shortly thereafter a spate of horrendous wildfires broke out across Los Angeles that will have far-reaching consequences.
- The financial markets also got off to a rough start, with stronger economic growth and heightened inflation concerns driving the 10-year bond yield to their highest levels in more than a year. The jump in interest rates, further erased any remaining post-election gains in the stock market.
- Inflation concerns are tied to the surprisingly resilient U.S. economy, which began the New Year with strong momentum. While the ISM manufacturing survey shows the goods sector remains under pressure, the services side of the economy remains buoyant, and employers continue to add jobs in large numbers. Nonfarm payrolls ended 2024 on a strong note, with employers adding 256,000 net new jobs and the unemployment falling back to 4.1%. The latest Atlanta Fed GDPNow forecast pegs Q4 real GDP growth at a 2.7% pace.
- The prospect of higher tariffs is clearly impacting businesses and consumers. The University of Michigan’s Consumer Sentiment Survey showed a significant rise in near- and medium-term inflation expectations. Some evidence suggests preemptive buying ahead of potential tariff increases. However, we expect the tariff concerns to have limited impact, with consumer prices rising only 0.3 percentage points higher than otherwise this year.
- Stronger economic growth and rising inflation concerns are expected to keep interest rates elevated this year. After December's stronger-than-expected jobs report, the expected timing for the Fed's next rate cut shifted to September. However, this shift seems premature. The underlying jobs data were weaker than the headlines suggest, with gains concentrated in lower-paying, hard-to-fill roles. Additionally, upcoming annual revisions are likely to reveal that 2024 job growth was overstated.
- The geopolitical landscape under Trump 2.0 is marked by renegotiation on multiple fronts. Talks about Greenland, Canada, and the Panama Canal seem to be trial balloons or strategic diversions. Trump's immediate priority is assembling his cabinet, followed by focusing on immigration and trade, with hopes of securing a deal alongside an extension of his first-term tax cuts.
The start of the New Year was marred by a series of tragic events, casting a pall over the nation’s hopes for a more peaceful and prosperous year. New Year festivities in New Orleans were abruptly shattered when an individual inspired by ISIS drove a vehicle into a crowd of revelers on Bourbon Street, leaving a trail of devastation in its wake. This act of violence, reminiscent of similar attacks in other parts of the world, served as a stark reminder of the ongoing threat of terrorism and raised questions about whether the world will see a revival of ISIS, particularly in the wake of the collapse of the Assad government in Syria.
Following this horrific incident, another shocking event unfolded in Las Vegas, where an explosion involving a Tesla Cybertruck at the Trump Hotel which injured several people and caused minor damage to the entry area of the hotel. While later investigations revealed the explosion to be a suicide rather than a terrorist act, the incident further heightened anxieties and underscored the fragility of safety and security in public spaces. These incidents also raise the prospect of more federal resources going toward combating terrorism at a time that the incoming Trump Administration would like to find ways to trim the federal budget and reduce the deficit.
President-elect Trump’s 2024 election victory was certified by congress without issue on January 6. Recently, Trump has garnered attention with proposals to purchase Greenland, reclaim the Panama Canal, and redefine relations with Canada. While his ambitions regarding Greenland appear grounded in strategic considerations, his positions on Panama and Canada seem aimed at enhancing negotiating leverage. These initiatives reflect a broader focus on countering the growing influence of China and Russia in the Arctic and addressing China’s dominance over key global shipping choke points.
Just as events appeared to be shifting to a more positive track, a series of devastating wildfires erupted across Los Angeles, wreaking havoc on the region. The infernos raged out of control, causing widespread destruction, displacing thousands of residents, and leaving behind a trail of devastation. The latest estimates show at least 24 people have died and more than 12,000 homes, businesses and public structures have been destroyed. Early estimates put the monetary damages at more than $90 billion, only a portion of which is insured. The impact of these fires will undoubtedly be far-reaching, affecting much more than the local economy and families impacted. Part of the runup in bond yields and selloff in the stock market is likely in anticipation of the billions of dollars insurance companies and governments will need to raise to fund recovery and rebuilding efforts.
Despite the inauspicious start to the year, the economy continues to display a great deal of resilience. Early January reports show robust service sector activity, solid holiday spending, and a strong labor market, with 256,000 jobs added in December and unemployment falling to 4.1%. The Atlanta Fed GDPNow projects 2.7% Q4 GDP growth. Our own forecast for Q4 growth is a touch softer at 2.5%.
The December jobs report appears stronger at first glance than it is beneath the surface. The data reflects a resilient but moderating labor market. While nonfarm payrolls surged by 256,000, significantly exceeding expectations, underlying trends suggest employment conditions are decelerating, albeit less sharply than anticipated. The labor market remains tight but is gradually rebalancing.
Payroll growth, though strong and technically broad-based, remains concentrated in just a few sectors. The 1-month diffusion index, measuring the share of industries adding jobs, fell 2.6 points in December to 56.4. While this still indicates broad gains, most job growth stems from health care, social services, leisure and hospitality, retail, restaurants, bars, and government. A sizable proportion of these roles, such as home health aides, staff at medical offices, hospital workers, social workers, restaurant employees, retail clerks, bus drivers, sanitation workers, and maintenance staff, are lower-paying, on-site positions. These essential roles have been difficult to fill, particularly when higher-paying jobs with more flexible work arrangements were more abundant.
The unemployment rate fell to 4.1% from 4.2%, while the underemployment rate also decreased, signaling a tightening labor market. Household employment increased by 478,000 in December, but when adjusted to the same standard as nonfarm payrolls, the rise was only 106,000. The labor force participation rate remained unchanged at 62.5%. Wage growth was modest, rising 0.3% month-over-month and just 3.9% year-over-year. These modest gains reflect compositional shifts, with bulk new jobs in lower-paying occupations, which dampened average hourly earnings. Alternative measures show slightly greater wage pressure.
The market reacted strongly to the unexpectedly robust jobs report, with the 10-Year Treasury yield surging and expectations for a Fed rate cut pushed back to September. We believe this reaction overstates the labor market’s strength. The annual payroll employment revisions will be released with January’s employment report on February 7. We expect these revisions to show about 600,000 fewer jobs added last year than currently reported, based on QCEW and state employment data. However, the revisions primarily affect data from March 2023 to March 2024 and influence estimates for the remainder of the year. Stronger immigration this past year, including the use of temporary work visas, may lead to a smaller revision than expected. If that proves to be the case, the recent tightening in immigration suggests a lower potential growth rate moving forward.
The financial markets were further unnerved by unexpectedly poor results from the early January University of Michigan Consumer Sentiment Survey. Consumer sentiment dipped slightly, falling to 73.2 from 74.0 in December, which was only modestly worse than expected. The decline was entirely driven by the expectations component, which fell 3.1 points to its lowest level in six months, reflecting increased concerns over future economic conditions and inflation. In contrast, the current conditions index rose 2.8 points, as low gasoline prices and solid employment conditions continued to bolster perceptions of personal finances.
The divergence between the two indices highlights consumers’ growing worries about inflation and some trepidation about the incoming Trump administration, which promises to unleash significant changes. While earlier progress in slowing inflation had brought some relief, concerns about future price increases—exacerbated by uncertainty surrounding tariffs—dampened sentiment. Year-ahead inflation expectations surged to 3.3%, up from 2.8% in December, marking the highest level since May 2024. Long-term inflation expectations also increased, climbing 0.3 percentage points to 3.3%, the largest monthly increase since May 2021 and the highest level since June 2008.
While the surprisingly large jump in inflation expectations is unnerving, it is important to note that the preliminary Consumer Sentiment data, particularly the inflation components, are often misleading. The more comprehensive data reported at end of the month often reverse early-month swings in inflation expectations entirely. That said, there are ample reasons to believe the uptick in inflation expectations is more genuine than in the past. Progress on reducing inflation has stalled in recent months, and the Fed has acknowledged that the path back to its 2% inflation target is likely to be longer and more uneven than previously anticipated.
Heightened concern about inflation likely reflects recent price hikes at grocery stores, particularly for frequently purchased items such as eggs. The UMich notes that the rise in inflation concerns is evident across various demographic groups, with particularly strong increases among lower-income households and politically Independent-leaning individuals. Combined with added inflationary risks from tariffs, inflation expectations may remain elevated in the near term, giving the Federal Reserve further reason to remain cautious. The Fed places significant emphasis on keeping inflation expectations anchored and will work to discourage consumers from accelerating purchases to stay ahead of anticipated price increases.
Long-term interest rates have risen steadily since the Fed began reducing its federal funds rate target last September. Initially, the Fed’s half-point rate cut signaled a pivot toward supporting economic growth, even if it meant a longer timeline for achieving its 2% inflation target. While that approach seemed appropriate at the time, stronger employment data and slightly higher-than-expected inflation since the September meeting have complicated the narrative. To address this, the Fed revised its Summary of Economic Projections (SEP), clarifying that it would proceed cautiously with future rate cuts and likely refrain from lowering rates at the January FOMC meeting.
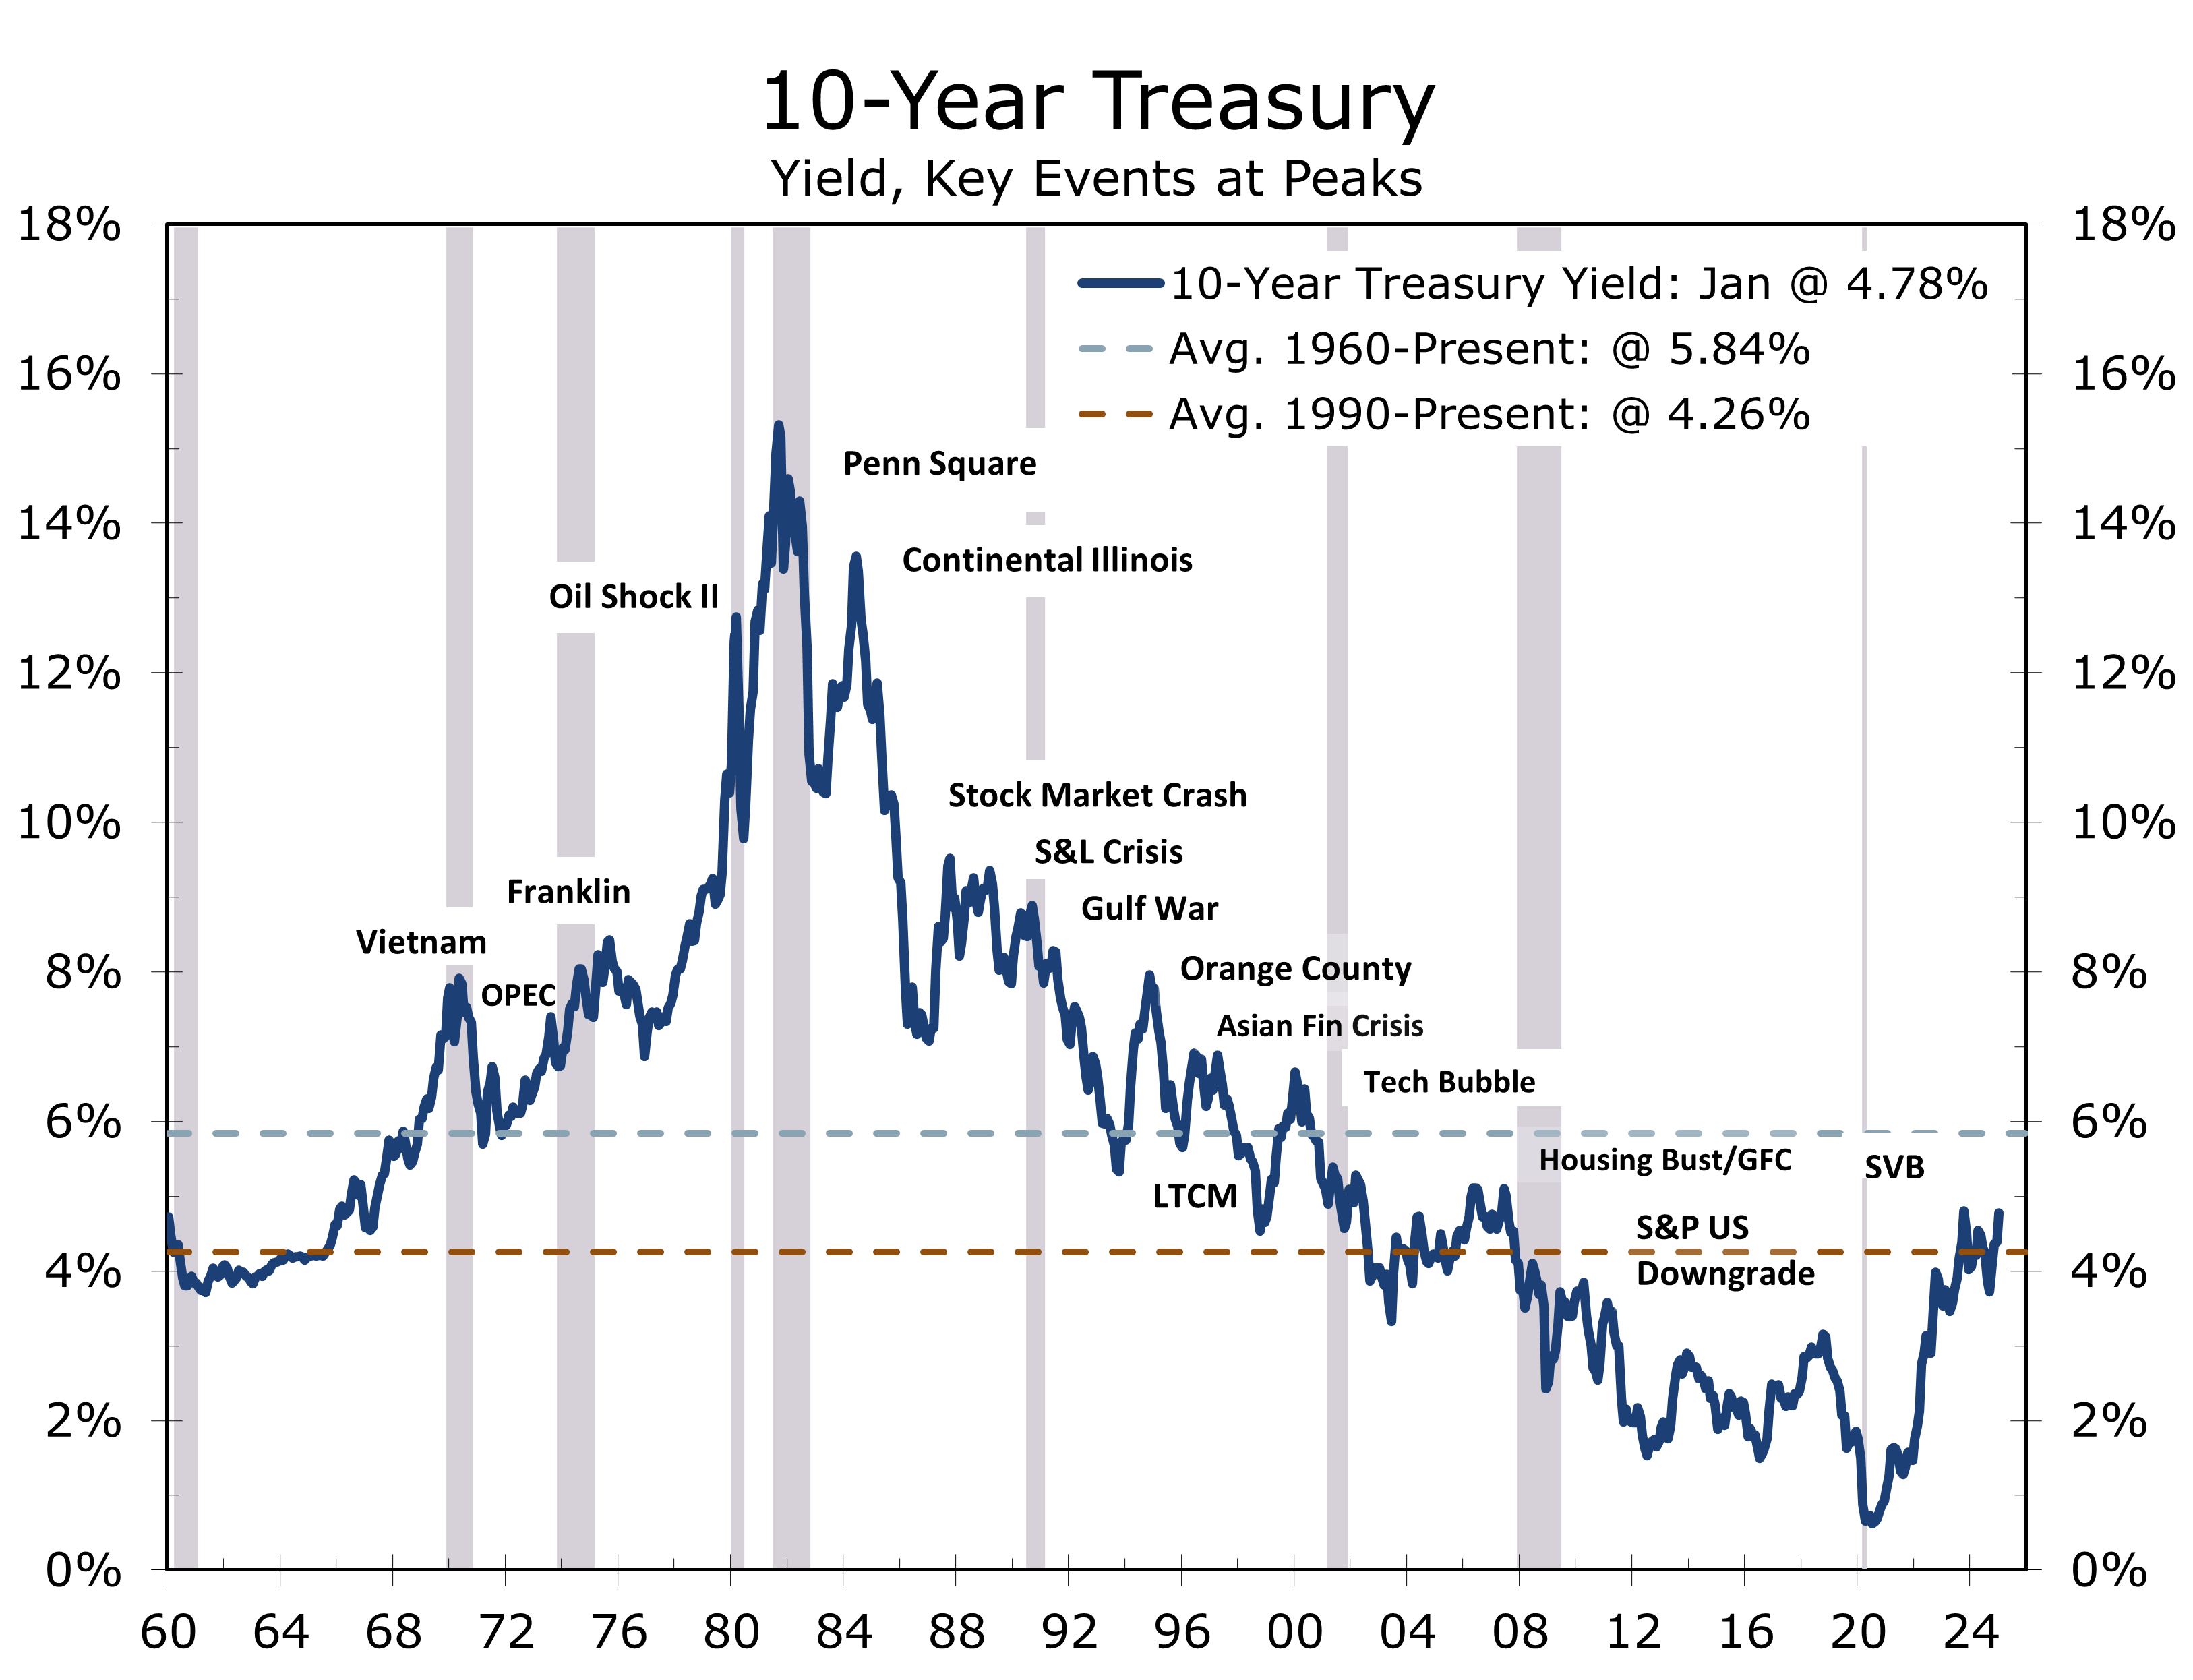
The climb in long-term interest rate accelerated following the stronger than expected employment report, rising to 4.78% – their highest level since November 2023. The yield curve has steepened, with the spread between the 10-Year and 2-Year Treasury widening to 39 basis points. Long-term rates are rising in other developed economies as well, most notably France, the U.K. and Japan, where they threaten to produce an even greater drag on these slower growth economies. The rise in long-term rates is primarily attributed to an increase in the term premium. This premium, which is the compensation investors require for the increased risk associated with holding longer-term bonds, reflects growing concerns about persistent inflation as well as the potential for future economic volatility.
The rise in long-term interest rates has disrupted the stock market rally, particularly for high-growth tech stocks with elevated or infinite price-to-earnings ratios, a trend that became evident when the 10-year Treasury yield surpassed 4.50%. While earnings season may provide temporary support, the Nasdaq—home to many high P/E stocks—will likely remain under pressure until the yield falls below 4.50%, which we expect by spring. Sharp increases in long-term rates typically slow economic activity, prompting rates to retreat.
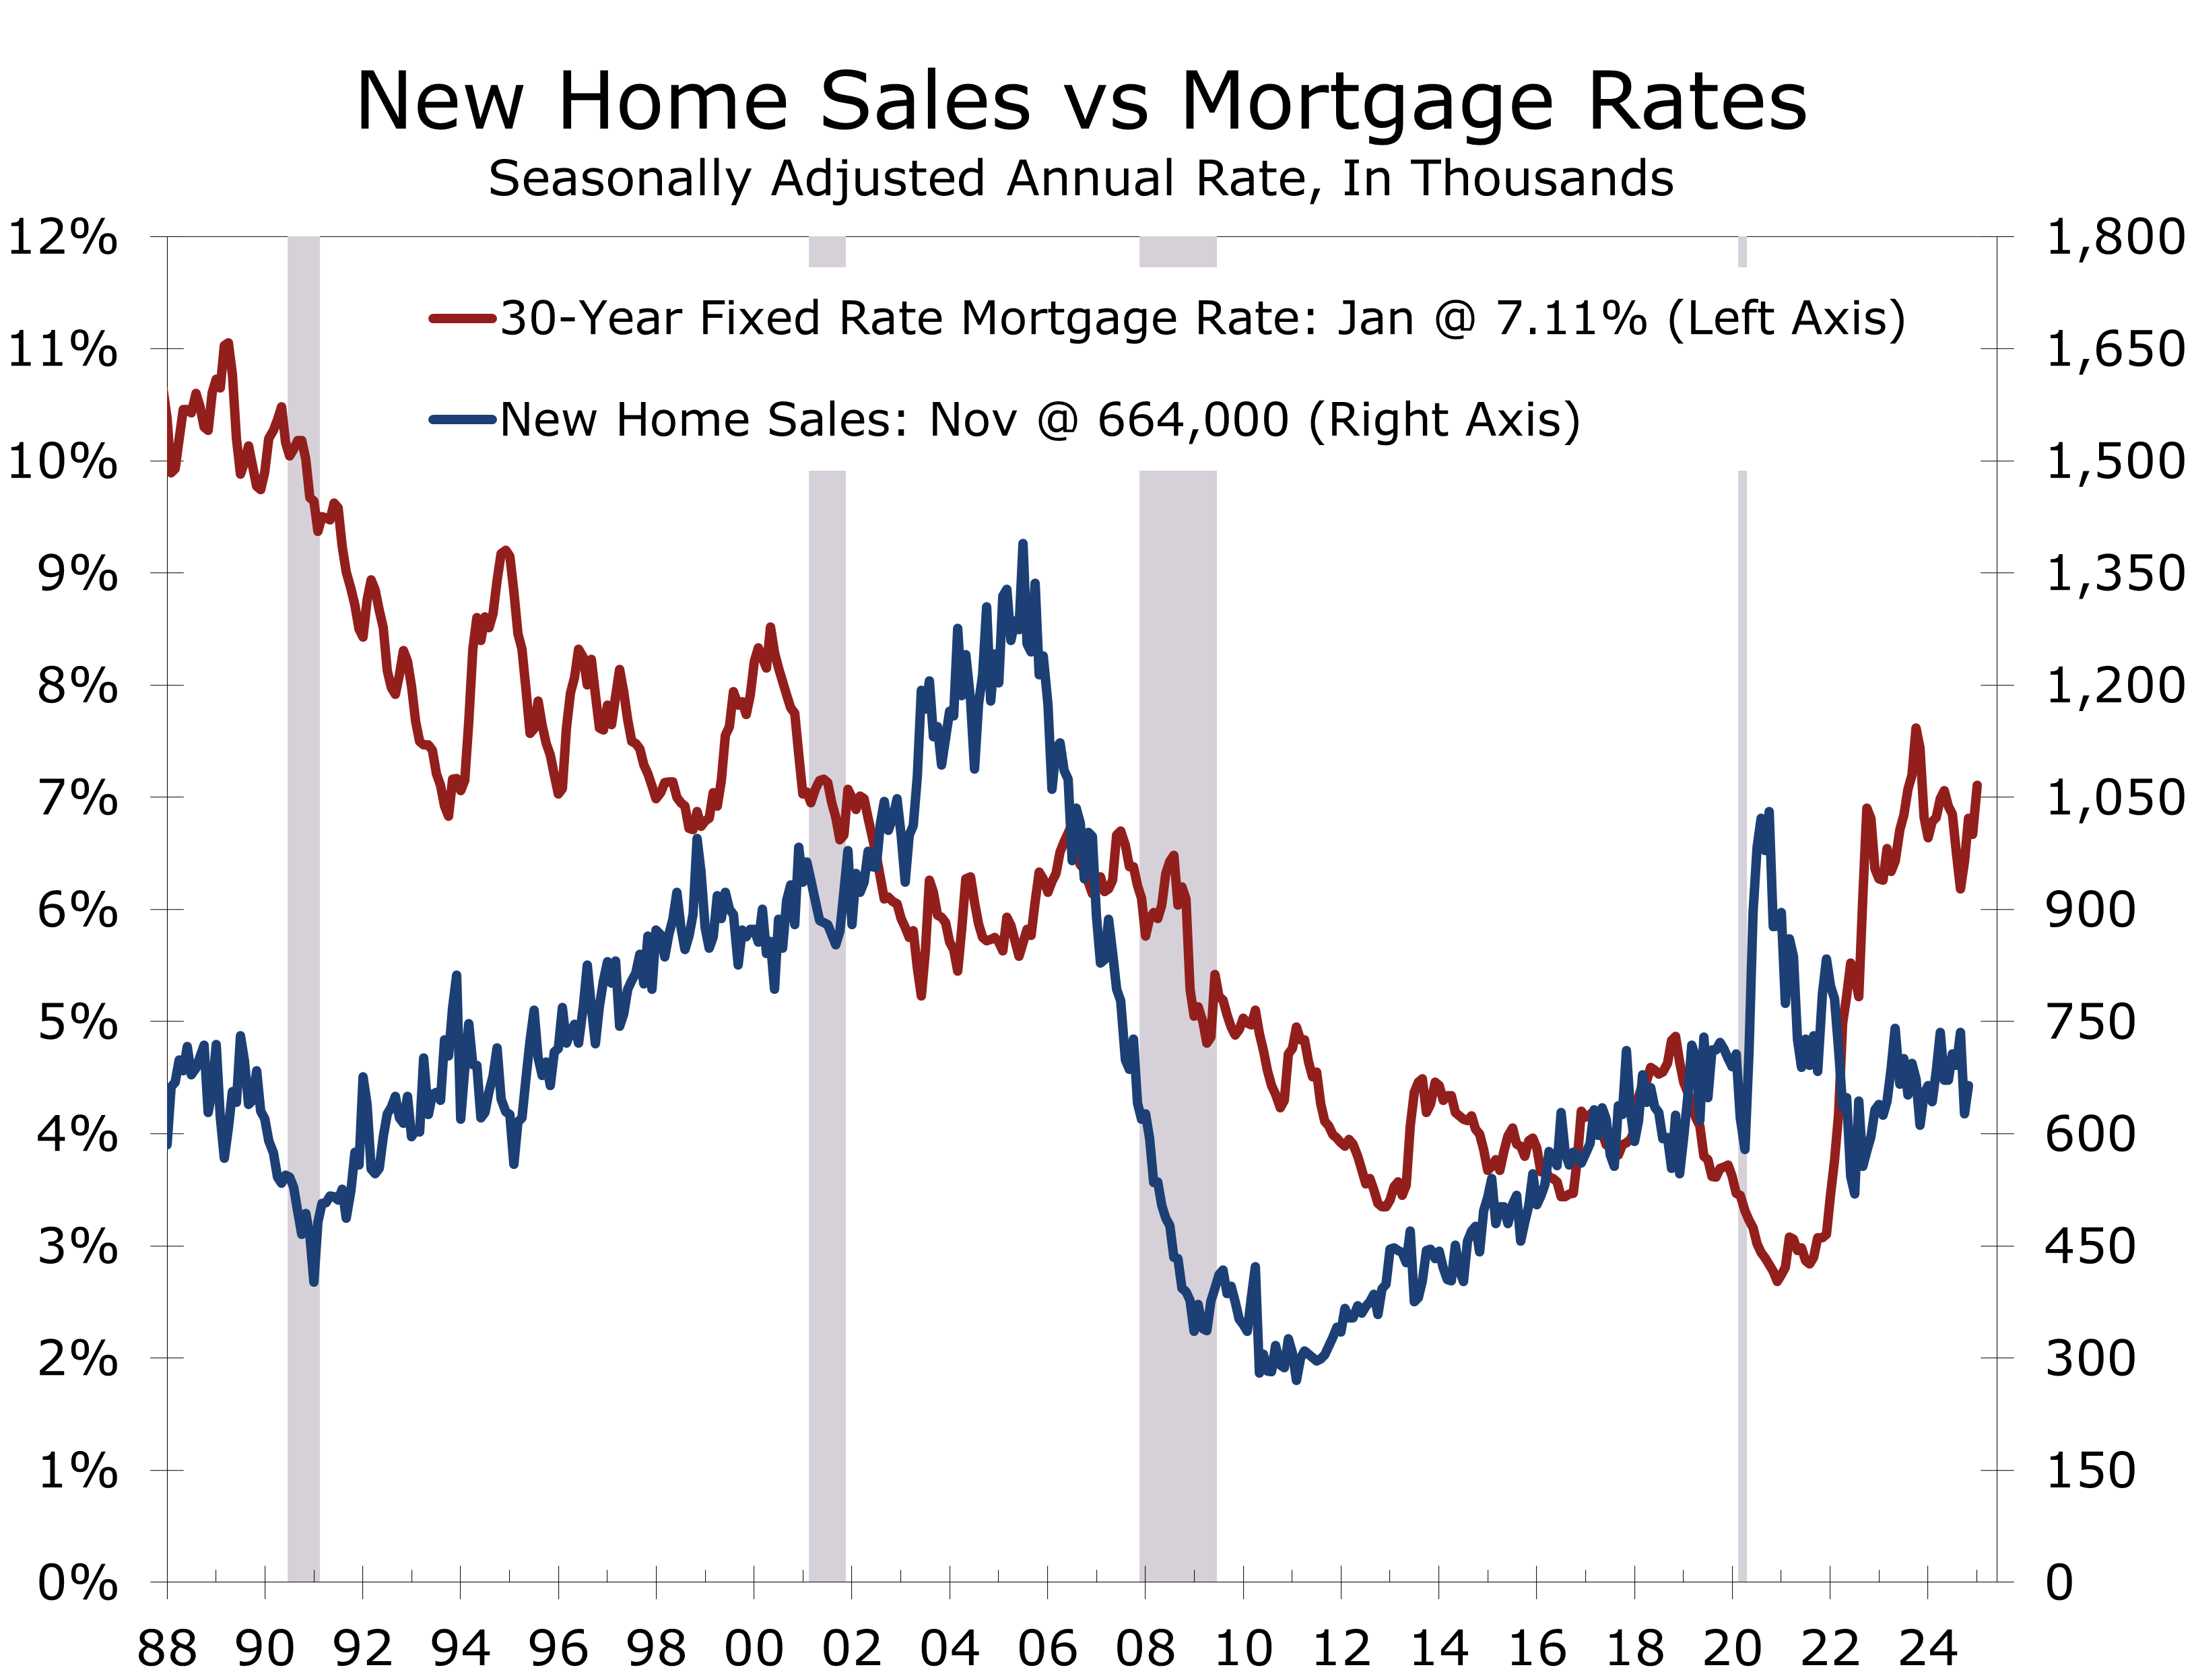
Higher interest rates are already significantly affecting the most rate-sensitive sector of the economy: housing. Mortgage rates above 7% have dampened demand, which was already constrained by limited inventory. However, new home inventories are rising, particularly in the South. The weakness in housing is reverberating throughout the economy, reducing demand for furniture, home furnishings, appliances, and other household-related services. We look for mortgage rates to pull back this spring as banks increase mortgage lending efforts.
The steady rise in long-term interest rates has become an early defining economic theme this year, driven by heightened uncertainty and rising term premiums. Much of this uncertainty stems from Donald Trump’s political return and his disruptive rhetoric, including post-election threats of steep tariffs on allies and competitors. His use of tariffs as leverage for trade, immigration, and security negotiations adds tension, particularly with global responses remaining unclear.
At the time of writing, there are credible reports promising negotiations involving the Biden Administration, Trump’s team, Hamas, and Israel to resolve the conflict and secure hostage releases. A successful resolution could enhance Trump’s credibility and pave the way for a Ukraine deal. However, any deal with Russia must include credible security guarantees—such as EU and NATO membership for Ukraine—to prevent future aggression. Weak agreements risk emboldening adversaries like China, Russia, Iran, and non-state actors.
Global conflicts are not the primary force behind rising bond yields. In the U.S., yields have climbed as the Fed prioritizes labor market support over a swift return to its 2% inflation target. A soft landing seems unlikely given ongoing fiscal stimulus from the IRA, CHIPS Act, and Infrastructure Bill. Rebuilding efforts in the South after this past fall’s hurricanes and in Southern California following the ongoing wildfires will further strain federal budgets, raising concerns about persistent deficits.
The prospect of new governments in Canada, the U.K., Germany, France, and Australia introduces additional global uncertainty. Policy changes in these nations are likely to mirror U.S. trends, as leaders aim to ensure workers receive a greater share of economic gains amid globalization and advancements in technologies like AI.
Long-term rates are settling into a new normal. Since 1990, the 10-year Treasury yield has averaged 4.26%, reflecting periods of quantitative easing and ultra-low rates, while the broader average since 1960 is 5.84%, influenced by past inflationary spikes. Policymakers are unlikely to repeat the mistakes of the 1970s, but rates are expected to stay within this range (4.26% to 5.84%) as long as inflation exceeds 2% and the economy maintains solid growth. Upside risks could materialize in 2025, driven by a surge in mergers and acquisitions alongside the Treasury’s need to refinance trillions in debt.
We have raised our estimate for fourth-quarter real GDP growth, reflecting stronger-than-expected economic data. Hiring accelerated in Q4, and holiday sales exceeded consensus estimates. However, higher interest rates continue to weigh on the economy, particularly in the already stretched housing market, where mortgage rates have climbed above 7%. Recent natural disasters, including Hurricane Helene in the Florida, Georgia and the Carolinas and wildfires in Southern California, will exacerbate housing pressures. Asheville, which already had one of the nation’s tightest housing markets, and Southern California are expected to see increased demand for residential rentals as displaced residents and firms seek housing. This rental pressure, especially in major markets like Los Angeles, presents another obstacle to the Fed achieving its 2% inflation target.
The disasters are also expected to dampen U.S. economic activity in the near term. Los Angeles County, home to 9.6 million people, and would rank as the 11th most populous state. Los Angeles accounts for 25% of California’s GDP and 3.5% of national GDP. Its $800 billion economy driven by high-value industries like aerospace, pharmaceuticals, IT, and entertainment, would rank as the 5th largest U.S. state by GDP, behind California, Texas, Florida and Illinois. While hurricanes and wildfires will weigh on growth in early 2025, rebuilding efforts are projected to boost economic activity in the second half of 2025 and into 2026.
We also anticipate the economy will gradually adapt to higher interest rates. The incoming Trump Administration will likely usher in a new wave of deregulation, make prior tax cuts permanent, and ease the state and local tax deduction cap. The creation of the Department of Government Efficiency (DOGE) is expected to achieve meaningful discretionary spending cuts over the next two years. These efforts, though limited without entitlement reform, may enable broader progress at addressing the budget deficit in later years.
Disclaimer: This publication has been prepared for informational purposes only and is not intended as a recommendation offer or solicitation with respect to the purchase or sale of any security or other financial product nor does it constitute investment advice. Any forward-looking statements or forecasts are not guaranteed and are subject to change at any time. Information from external sources have not been verified but are generally considered reliable..
Consumer Prices Rise in Line With Expectations
Markets Find Comfort in Softer Inflation Data
- The headline CPI increased by 0.4%, driven by energy (+2.6%) and food prices (+0.3%).
- The core CPI rose 0.2%, with year-over-year core inflation easing to 3.24%.
- Year-over-year headline CPI fell to 2.9%, its lowest since March 2021, while core CPI rose 3.2%.
- Rent and owners’ equivalent rent rose 0.3%, remaining the main contributors to core inflation.
- Core goods prices edged 0.1% higher but declined 0.5% over the past year.
- New (+0.5%) and used vehicle prices (+1.2%) increased, reflecting replacement demand from recent hurricanes.
- Motor vehicle insurance rebounded 0.4% after slowing the prior two month and remains up 11.3% year-over-year.
- Despite the market's positive reaction, the inflation report met rather than exceeded expectations. Inflation continues to pressure middle- and lower-income households, with persistent price increases in food, energy, rents, used cars, and motor vehicle insurance.
Financial markets breathed a sigh of relief as the December Consumer Price Index (CPI) report came in largely in line with expectations. The headline index rose 0.4%, driven by rebounds in gasoline and food prices, while the core index rose 0.2%. This largely anticipated outcome initially sparked a rally in stock prices and a partial unwinding of the recent surge in bond yields. The reaction looks a bit overdone, but the markets have had a rough few weeks and have traded poorly on both good and bad news and were primed for a relief rally.
It is important to note that the December inflation data were not necessarily better than expected; they simply weren’t as bad as many feared. The headline number rose from 2.7% year-to-year to 2.9%, while the core CPI remained stubbornly elevated at 3.2%. The path to the Fed’s 2% target is not any shorter, reinforcing the Fed’s recently adopted more cautious stance.
Top of Form
December’s CPI was not better than expected, it simply was not worse than the markets feared.
The underlying data presented a mixed picture. Energy prices rose 2.6%, driven by a 4.4% surge in gasoline prices. Gasoline prices typically decline in December. This year’s smaller-than-usual drop, however, led to a large seasonally adjusted increase. In contrast, the rise in food costs was more straightforward, with both grocery store and restaurant prices increasing by 0.3%.

The continued strength in core inflation remains a significant concern, with shelter costs—particularly rent and owners’ equivalent rent—persisting as key drivers, albeit at a slightly slower pace. The persistent pressure on housing costs stems from factors such as limited for-sale housing turnover, robust apartment demand, and a higher-than-normal rate of lease renewals. Although asking rents have softened due to a wave of apartment completions, renewal lease rates continue to rise by 3.5% to 4%.
Rent and owners’ equivalent rent remain problematic, despite a wave of new apartments.
Outside of housing, core CPI showed more stability. Core goods prices edged up 0.1% in December but are down 0.5% year-over-year, primarily due to declines in used (-3.3%) and new (-0.4%) vehicle prices. However, both categories saw increases in December, rising 1.2% and 0.5%, respectively, likely driven by replacement demand after the Southeast’s devastating hurricanes. Replacement demand is also expected to rise in the aftermath of the Los Angeles wildfires.
The Los Angeles wildfires may have broader inflationary effects. Rents in the city’s already tight apartment market are likely to face additional upward pressure, further driving shelter costs. Additionally, insurance costs are expected to remain elevated due to the astounding losses faced by insurers.
The December CPI report highlights the challenges the Federal Reserve faces. While headline inflation has eased, many households, particularly middle- and lower-middle-income families, continue to grapple with inflation fatigue. Grocery prices remain significantly higher than pre-pandemic levels, impacting staples like meat, poultry, dairy, and bakery products. These elevated costs, combined with higher expenses for rent, used cars, and insurance, are straining household finances.
The Fed must navigate this complex environment while acknowledging a softening labor market. Job growth has slowed, with a noticeable shift towards lower-paying roles in healthcare, leisure, and hospitality and local government. This concentrated growth may be masking slower growth in other sectors, making it difficult to assess the true state of the labor market.
The upcoming release of annual revisions to employment data on February 7 will be crucial. If these revisions reveal significantly slower job growth than is currently reported, a March rate cut may be back on the table. Conversely, stronger-than-expected job growth would allow the Fed to proceed more cautiously with rate cuts.
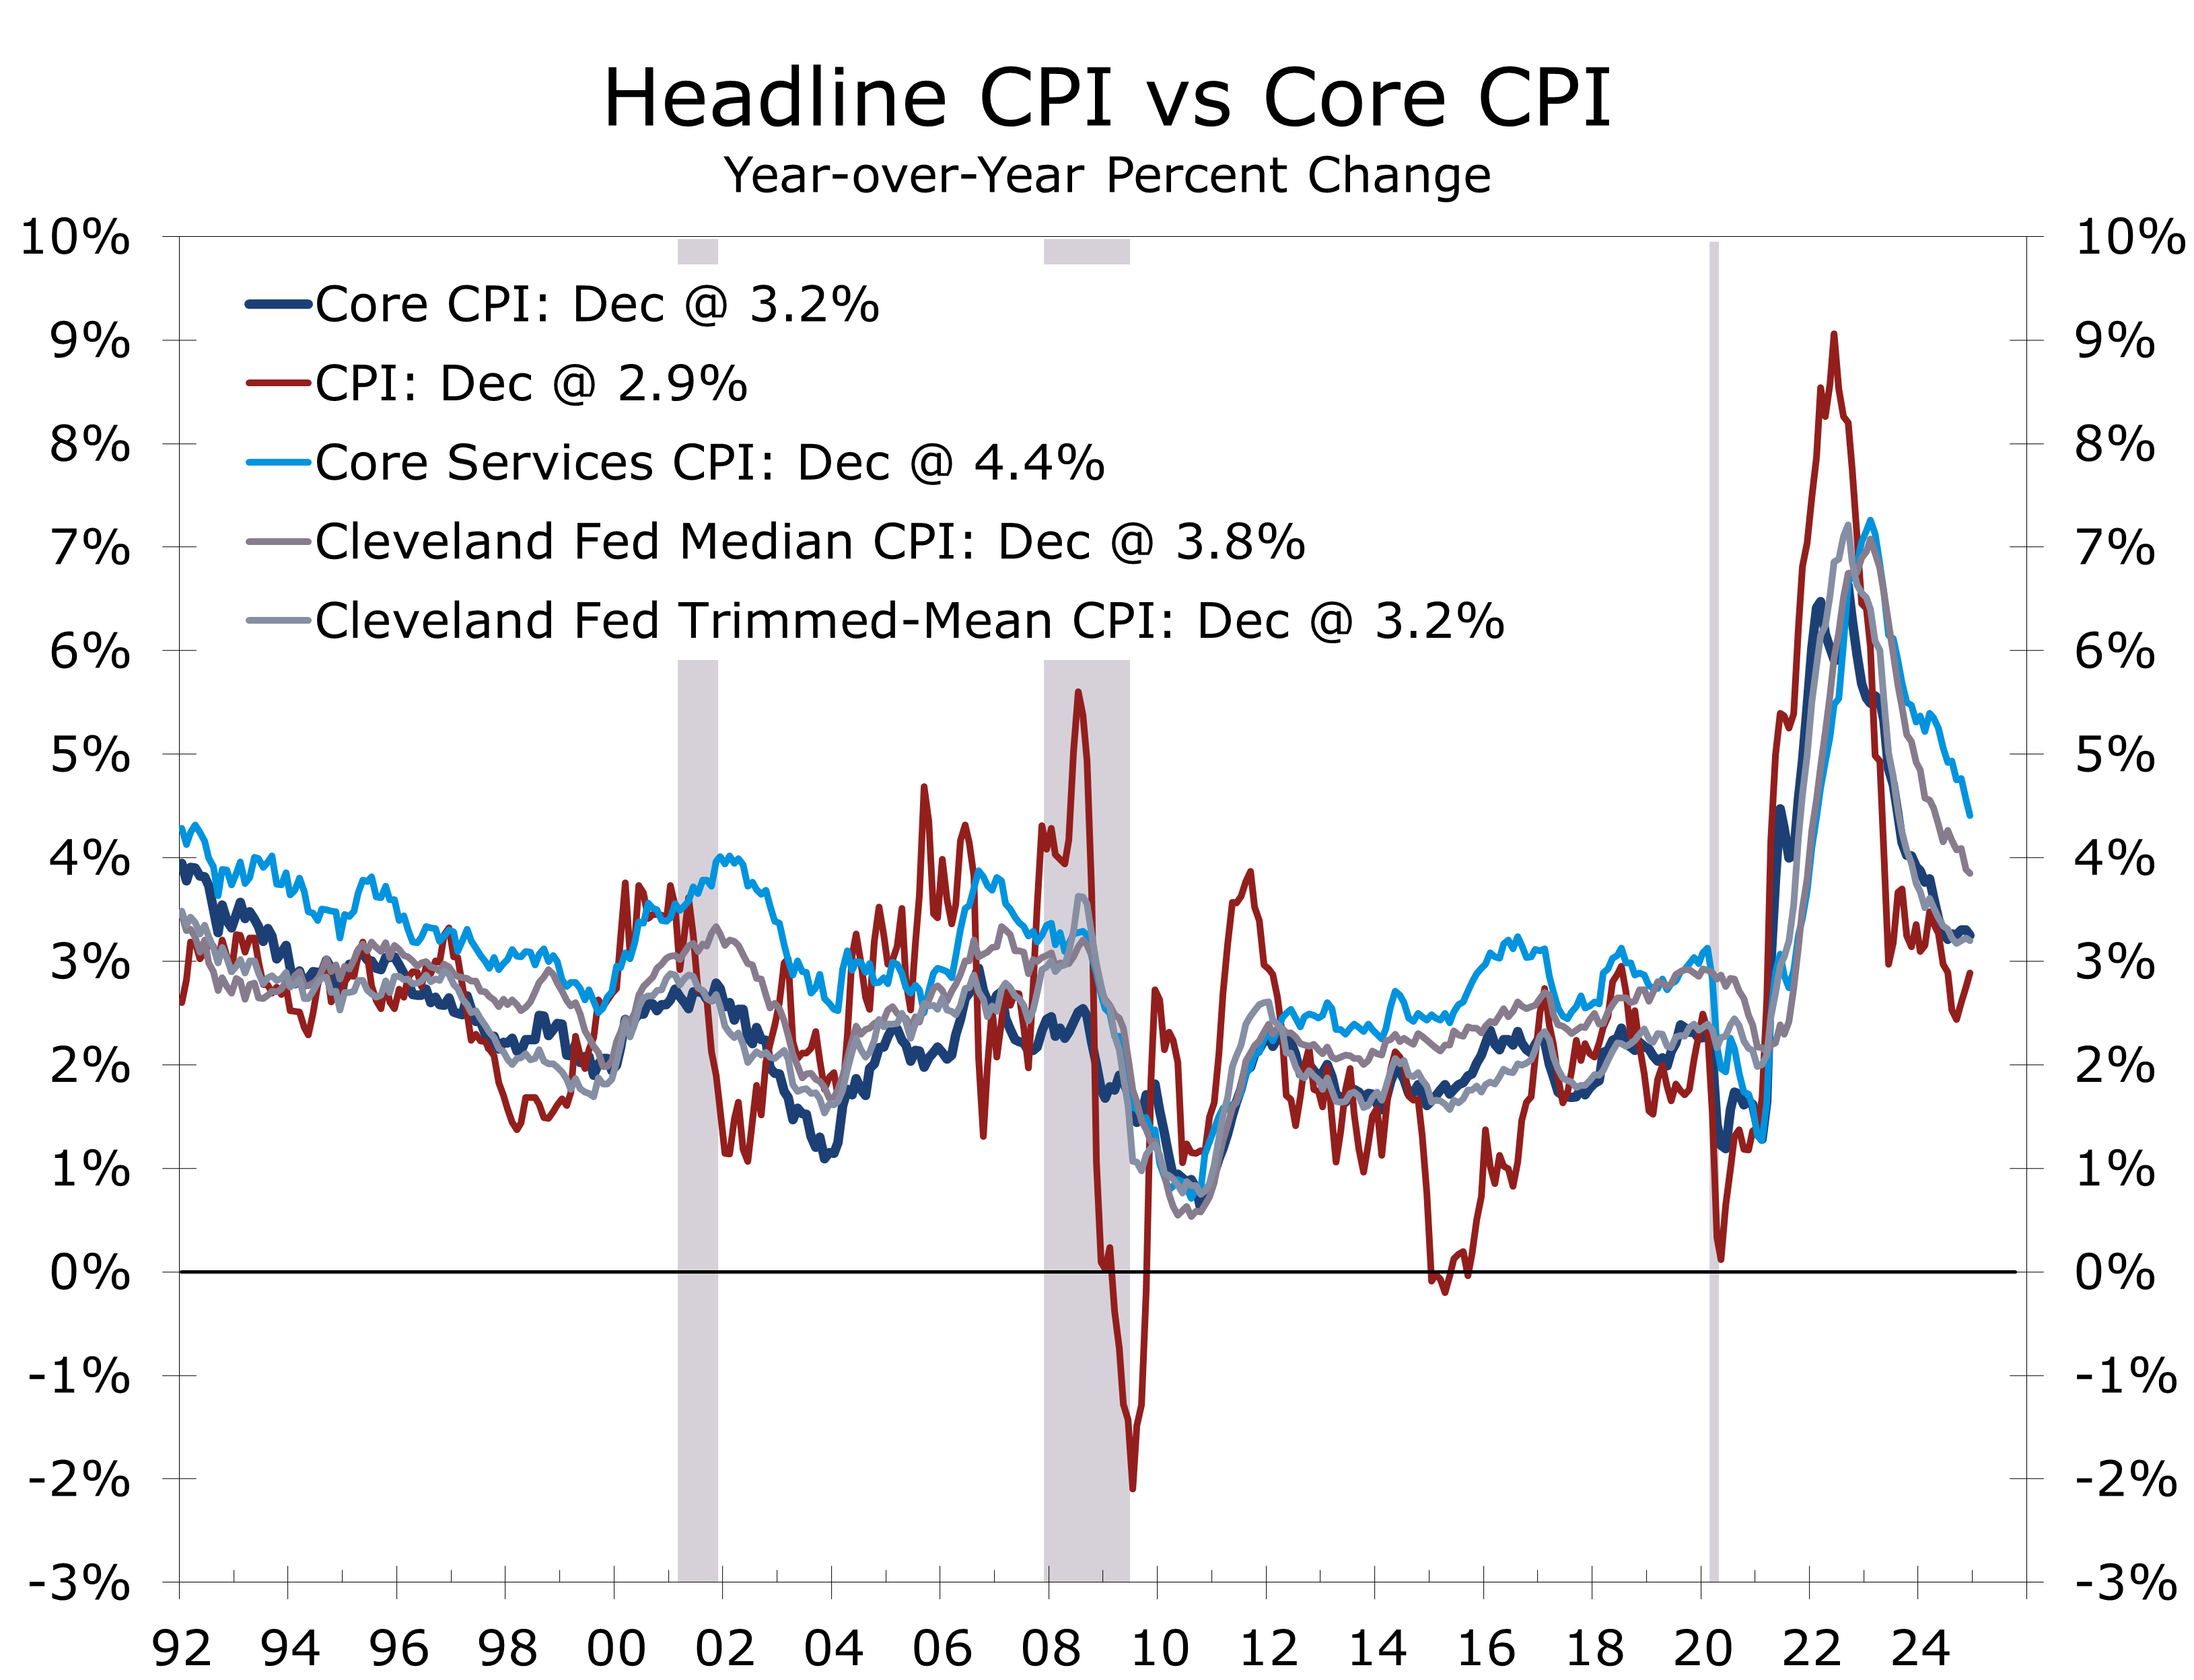
Disclaimer: This publication has been prepared for informational purposes only and is not intended as a recommendation offer or solicitation with respect to the purchase or sale of any security or other financial product nor does it constitute investment advice.
January 15, 2025
Mark Vitner, Chief Economist
(704) 458-4000
International Migration Boosts U.S. Population Growth
The South Remains the Top Destination
- U.S. population grew by nearly 1.0% from 2023 and 2024, the fastest rate since 2001, reaching over 340 million residents.
- Net international migration accounted for 84% of the 3.3 million population increase, with a net gain of 2.8 million people.
- The South remains the fastest-growing region, contributing 54% of total national population gains.
- Texas had the largest numeric increase (+562,941), while the District of Columbia experienced the fastest growth rate (2.2%).
- Net state-to-state migration has slowed, reflecting fewer opportunities to capitalize on arbitraging high housing prices.
- Births outnumbered deaths nationwide by 519,000, though natural increase remains well below historical levels.
- Positive net international migration occurred in all states, with Florida, California, and Texas leading in gains.
- The latest state population data include a major revision to international migration. The updated data confirm immigration has been significantly stronger than previously reported, substantially increasing population totals in many states.
The U.S. population grew nearly 1.0% between 2023 and 2024, marking the fastest annual growth rate since 2001. The nation’s population surpassed 340 million residents, driven primarily by a resurgence in net international migration. A net increase of 2.8 million migrants accounted for 84% of 2024 total population growth of 3.3 million. The most recent data reflects improved integration of federal data sources and a more comprehensive understanding of migration.
Natural increase, or the difference between births and deaths, contributed 519,000 to population growth, an improvement from the historic low of 146,000 in 2021 but still below prior decades. The most recent data reflect a partial recovery from the Covid 19 Pandemic, as well as the impact ongoing economic challenges faced by American families.
The South remains the leader, adding 1.8 million residents last year and 6.2 million since 2020.
The South remains the leader, adding nearly 1.8 million residents between 2023 and 2024—a 1.4% increase. The region accounted for over half of the nation’s total population gain, driven by net international migration (+1.1 million), domestic migration (+411,004), and natural increase (+218,567). Texas and Florida led the way, with population increases of 562,941 and 467,347, respectively, while the District of Columbia posted the fastest growth rate at 2.2%. Since 2020, the South has added 6.2 million residents, representing 72.5% of the nation’s total population growth.

The West followed with a population increase of 688,000 (0.9%), driven by significant net international migration (+667,794) and natural increase (+187,986), offsetting a domestic migration loss of 170,000. California led numeric gains in the region, while Utah and Nevada recorded the highest growth rates.
The Northeast added 435,000 residents (0.76%) as domestic outmigration slowed. Net international migration (+567,420) is the primary growth driver. The Midwest experienced modest growth of 410,000 residents (0.6%), with Illinois and Ohio leading the way.
Net domestic migration slowed significantly, reflecting a drop in affordability-driven moves.
Net domestic migration has slowed nationwide, likely due to narrowing housing price gaps between origin and destination states. Texas (+85,267), North Carolina (+82,288), and South Carolina (+68,043) saw the largest gains, while California (-239,575), New York (-120,917), and Illinois (-56,235) experienced the biggest losses in 2023-2024.
Florida’s net domestic migration has slowed sharply, with gains falling to 64,017 in 2024, down from 185,067 in 2023 and 314,467 in 2022. This decline reflects fewer people moving in and more residents leaving, driven by rising crowding, higher insurance costs, and declining affordability. Many who might have moved to Florida are now opting for the Carolinas, Tennessee, or Alabama.

Net international migration was positive for all 50 states and the District of Columbia, with Florida (411,322), California (361,057), and Texas (319,569) seeing the largest gains.
While net international migration has long played a larger role in California and Texas, its growing importance in Florida is a more recent development, particularly outside of South Florida. The Sunshine State added 411,322 residents from other countries and Puerto Rico, which is categorized as international migration. Florida has become the top destination for Puerto Ricans relocating to the continental U.S. Since 2020, international migration has brought 1.05 million new residents to Florida, making up 59.4% of its population growth, primarily from Latin America.
Net international migration has been much stronger than previously reported.
Nationally, international migration has accounted for 84% of population growth since 2020. The latest Census data significantly increase net international migration estimates for the two previous years, with 2022 growth now 69.5% higher and 2023 net international migration 101.7% higher than previously reported. The influx has boosted populations in California, Texas, and many states in the Northeast and Midwest, which otherwise would have lost population.

Disclaimer: This publication has been prepared for informational purposes only and is not intended as a recommendation offer or solicitation with respect to the purchase or sale of any security or other financial product nor does it constitute investment advice.
December 23, 2024
Mark Vitner, Chief Economist
(704) 458-4000