Price Plans Surge as Uncertainty Eases
Price Plans Reach Their Highest Level Since July 2022 and More Owners Pay Higher Rates, While Uncertainty Falls to Its Lowest Since December and Hiring Plans Edge Up
Early Signal
- Optimism slipped to 97.8, 0.1 point lower and just under the 53-year average of 98.0 for a second month. Four of the ten components rose, five fell and one held flat.
- Price plans jumped to a net 37%, up 6 points and the highest since July 2022. A net 33% of owners raised selling prices, up 2 points, against a long-run average of 14%.
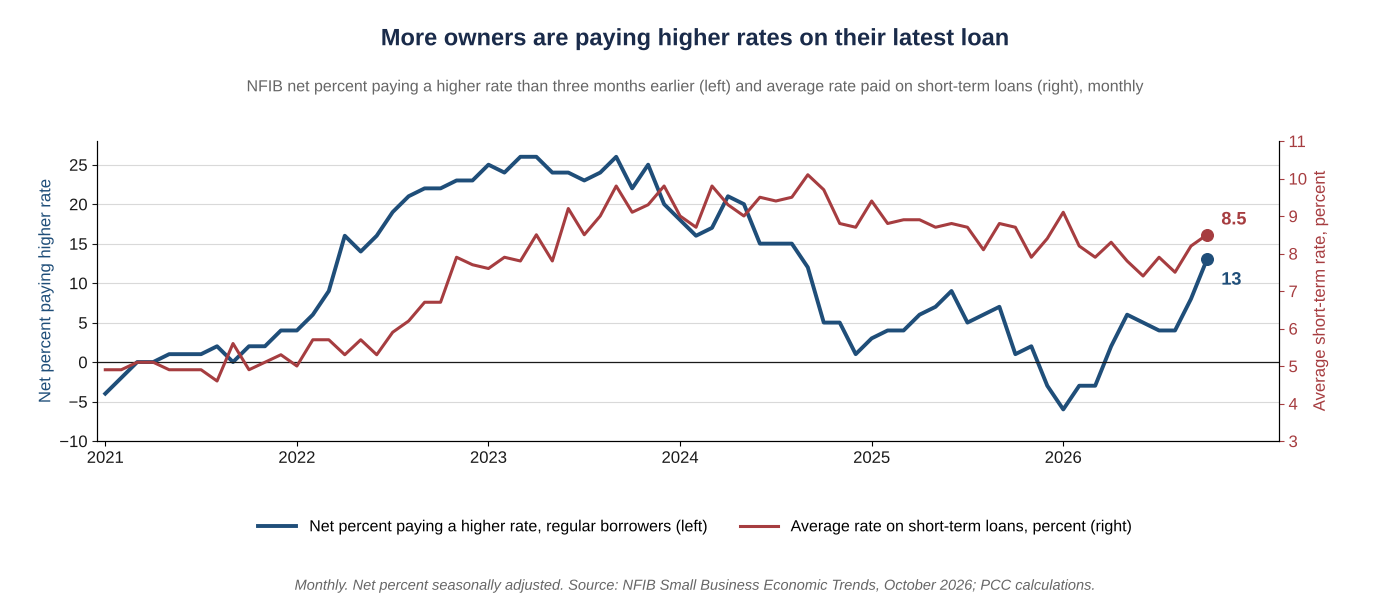
- Borrowing costs are rising again. A net 13% of owners paid a higher rate on their latest loan, up 5 points and the most since August 2024, and the average short-term rate rose 0.3 point to 8.5%.
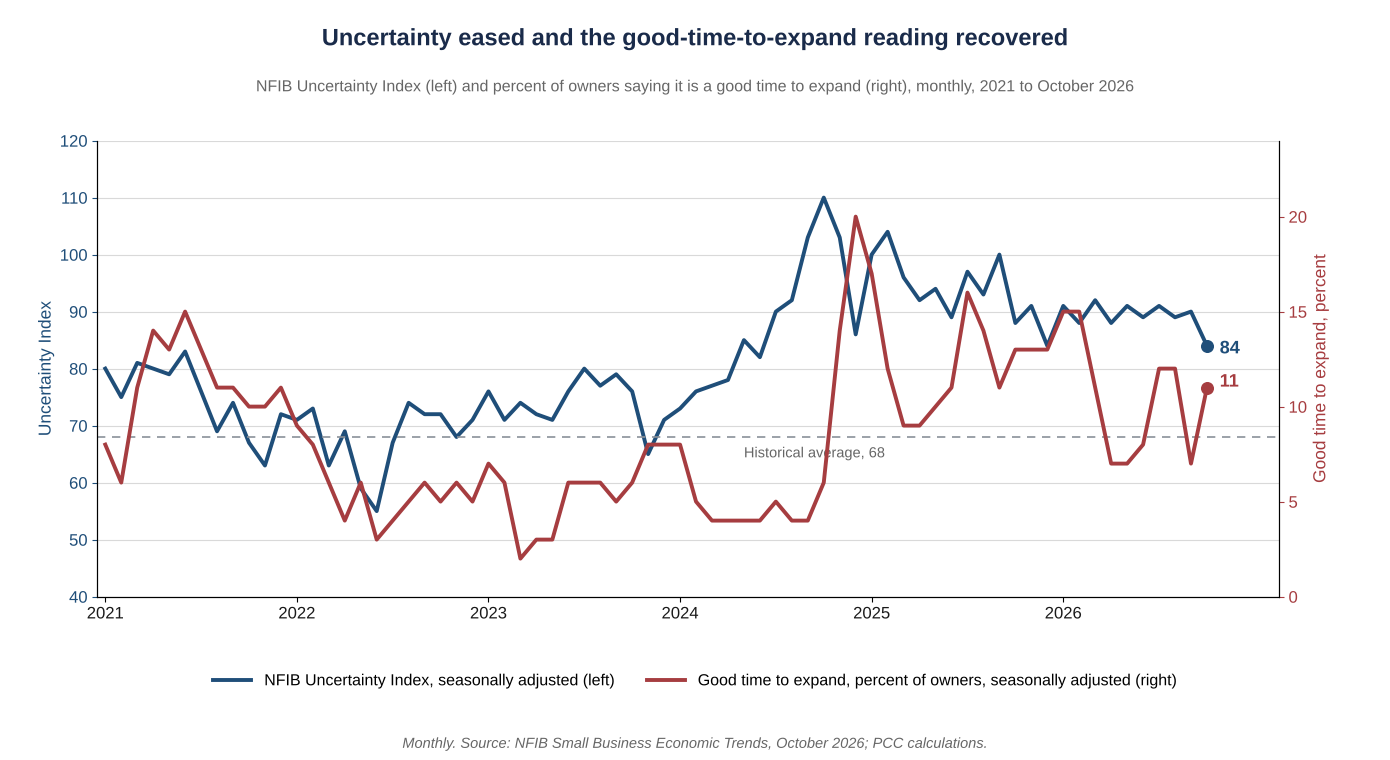
- Uncertainty fell 6 points to 84, the lowest since December. The share saying it is a good time to expand rose 4 points to 11%, and expected business conditions improved 2 points to a net 8%.
- Hiring improved at the margin. Hiring plans rose 1 point to a net 18%, job openings rose 4 points to 36% and the share hiring or trying to hire rose 5 points to 56%. A net 4% of owners cut employment, from 7% in September.
- Taxes and earnings are the pressure points. Taxes jumped 10 points to 21% of owners’ single most important problem, the highest since May 2021, and earnings trends fell to a net negative 23%, the lowest since March.
Little Change in the Index, More Movement Underneath
The Small Business Optimism Index slipped 0.1 point to 97.8 in October, a second consecutive month just below its 53-year average of 98.0. It stands 0.4 point below a year ago and 2.0 points below July’s 99.8. Four of the ten components rose, five fell and one held flat. NFIB builds its indexes from net shares of owners, so they measure the breadth of owners reporting improvement and not the size of the improvement.
The gains came from the forward-looking questions. Job openings rose 4 points to 36%, the good-time-to-expand reading rose 4 points to 11%, expected business conditions rose 2 points to a net 8% and hiring plans rose 1 point to a net 18%. The declines were in the inventory measures (current inventory fell 3 points to a net negative 3% and inventory plans fell 3 points to a net negative 1%), earnings trends (down 3 points to a net negative 23%), expected credit conditions (down 2 points to a net negative 5%) and capital outlay plans (down 1 point to 21%). Expected real sales volume held at a net 9%. The Uncertainty Index fell 6 points to 84, still well above its norm near 68 but 4 points below a year ago. NFIB attributes the decline to fewer owners who were unsure whether it is a good time to expand or what sales will do.
Timing matters for reading this survey. NFIB collects responses through the month, so the October survey predates the November 3 midterm elections and the October Employment Situation released November 6. NFIB’s own commentary notes that the elections have concluded, though the implications for tax, regulatory and economic policy will take time to unfold. With 759 usable responses and a response rate of 7.8%, a move of less than 1 point is within the noise, and the components carry more information than the headline.
Hiring Improves at the Margin While Qualified Workers Stay Scarce
Hiring plans rose 1 point to a net 18%, 7 points above their long-run average of 11%. Actual hiring activity improved by more. The share of owners hiring or trying to hire rose 5 points to 56%, and a net 4% of owners cut employment over the past three months, from 7% in September. The Employment Index rose 0.2 point to 100.8, below its 2025 average of 101.2 but above its historical average of 100.0.
The October Employment Situation, released November 6, shows the same improvement. BLS reported payroll gains of 165,000, revised August and September up by a combined 84,000 and put the unemployment rate at 4.1%, from 4.2%. The three-month average is 137,000. That narrows a gap we noted in September, when NFIB hiring plans of a net 17% sat beside a first-reported payroll gain of just 29,000. September is now revised to 60,000.
Part of the constraint is supply. Job openings that owners could not fill rose to 36%, 12 points above the historical average. Forty-eight percent of all owners, and 86% of those hiring or trying to hire, reported few or no qualified applicants, up 3 points. Labor quality or availability is the top problem for a fourth consecutive month at 25%, 13 points above its average of 12%, while labor cost is cited by 7%. Compensation measures rose, with a net 29% of owners raising pay, up 1 point, and a net 24% planning to, up 4 points and the highest since December 2025. Both remain above their historical averages.
Pricing Power Is Building Again
A net 33% of owners raised average selling prices in October, up 2 points from September and 12 points above a year ago, against a long-run average of 14%. Unadjusted, 41% raised prices and 10% lowered them. Planned increases rose 6 points to a net 37%, the highest since July 2022 and 15 points above the 22% average. Inflation fell 3 points as a single most important problem to 17%, though that is still against 12% a year ago and an average of 7%, and 65% of owners said supply chain disruptions affected their business, the highest since June.
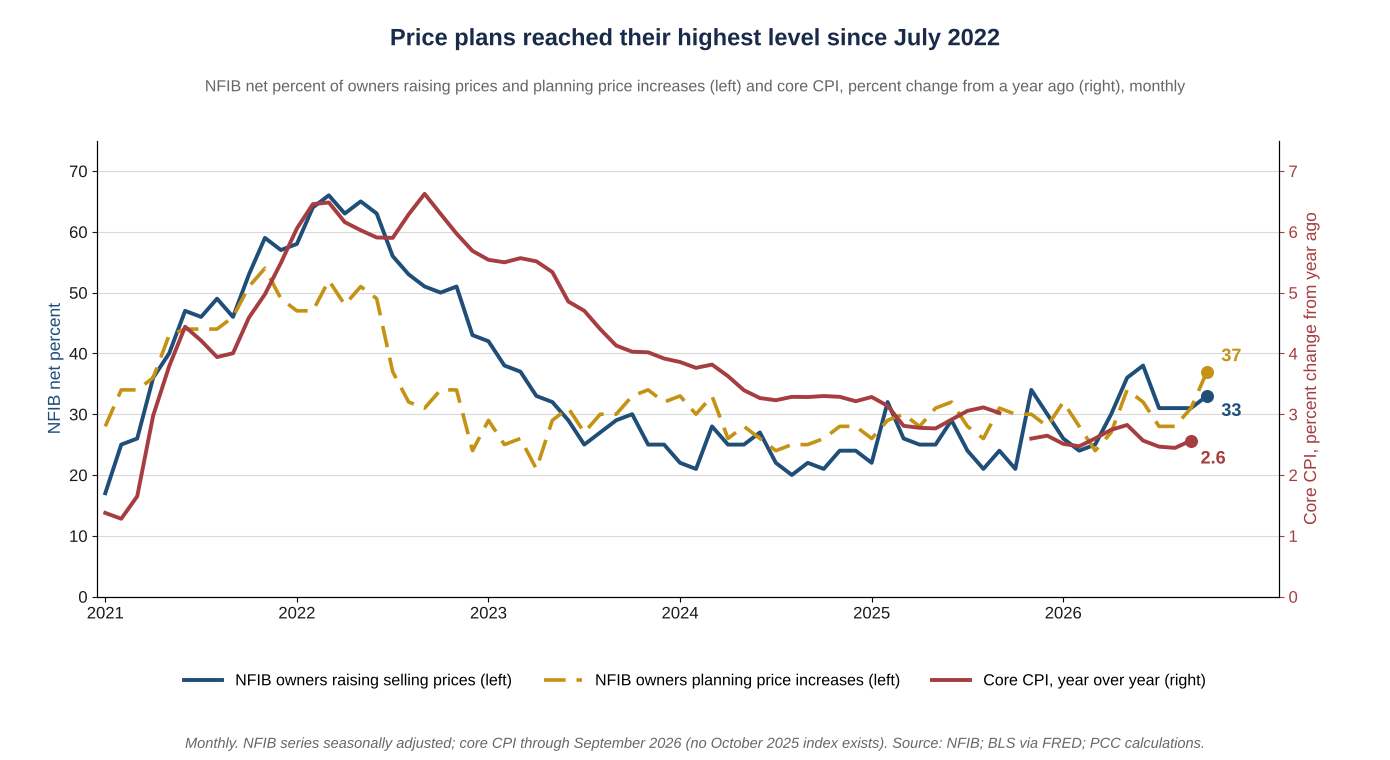
NFIB selling prices turned up ahead of core CPI in 2021 and led the decline that followed, at the major turning points of this cycle, though the series has no shelter component and is best read as a signal on goods and services margins. Core CPI rose 2.6% from a year ago in September, up from 2.4% in August, while the NFIB selling-price series has held between 31% and 38% since May. Price plans are now moving up again.
October CPI, released at 8:30 this morning, rose 0.4% for the headline and 0.3% for core, against a consensus near 0.3% and 0.2%. Core rose 0.3% for a third consecutive month. Shelter rose 0.3% and accounted for more than 30% of the increase, energy rose 0.7% after a 5.2% jump in September and food rose 0.5%. BLS did not publish 12-month changes because no October 2025 index was collected during the shutdown. A core gain of 0.3% above consensus is the kind of reading NFIB price plans were indicating, and it shows that part of the pressure owners report is reaching consumers.
The Fed Held, and Main Street Borrowing Costs Are Rising
The FOMC held the target range at 3.75% to 4.00% on October 28 in a 10-2 vote, with Lisa Cook and Beth Hammack dissenting in favor of a quarter-point increase. Small borrowers had already seen higher rates. A net 13% of owners paid a higher rate on their most recent loan, up 5 points and the most since August 2024, and the average rate on short-term loans rose 0.3 point to 8.5%. That is below the 8.7% of a year ago and near the long-run average of 8.3%, so borrowing costs are close to normal for this survey. Only 25% of owners borrow regularly, against a historical average of 34%, which limits how many are exposed. A net 4% said their last loan was harder to obtain, up 1 point, and expected credit conditions slipped 2 points to a net negative 5%.
Investment plans are softening. Capital outlay plans fell 1 point to 21%, the third consecutive monthly decline from July’s 25%, even as 52% of owners made outlays over the past six months, up 1 point. Of those making outlays, 35% bought equipment, up 3 points.
Sales Improve, but Earnings and Taxes Are the Pressure Points
Owners ranked their problems with a new second place. Labor quality leads at 25%, taxes rose 10 points to 21% and the highest since May 2021, and inflation is third at 17%. Government regulation, the cost of labor and the cost or availability of insurance are each at 7%. Poor sales fell 5 points to 6%, the lowest since November 2024, the first decline in five months.
A net negative 4% of owners reported higher nominal sales over the past three months, up 4 points, and a net 9% expect higher real sales volumes, unchanged. Earnings are not following. The earnings trend fell 3 points to a net negative 23%, with 32% of owners reporting lower profits blaming weaker sales, down 2 points, and 20% citing rising material costs, down 4 points. Owners’ view of their own health improved. A total of 69% rated their business excellent or good, up from 61% in September, and the share calling it fair fell 9 points to 26%.
NFIB’s own commentary expects continued strength in consumer spending to support growth, with persistent inflation, labor shortages and policy risks weighing on the outlook. With taxes rising sharply as a concern, tax policy will be closely watched. Sales are improving, earnings are not, and owners appear to be raising prices to protect margins.
What It Means for the Fed
The October survey adds to the case for a December increase. Price plans at their highest since July 2022, rising borrowing costs and a labor market that BLS shows is adding jobs well ahead of its breakeven pace all point in the same direction, and lower uncertainty with a higher good-time-to-expand reading suggests small businesses can absorb it. This morning’s CPI supports that view, with core up 0.3% against a consensus of 0.2%. Ceteris paribus, that leaves a December 9 increase on track.
Our Call · December 9 Increase, March to Follow
A quarter-point increase on December 9 remains our call, with March to follow. We hold our forecast: a quarter-point increase on December 9, to 4.00% to 4.25%, a hold in January and a second quarter-point increase in March, to 4.25% to 4.50%, with June a toss-up. Price plans at a net 37% and rising borrowing costs fit that path. This morning’s CPI supports it, with core up 0.3% for a third consecutive month against a consensus of 0.2%, and it adds to the risk that the second increase comes before March. We will closely watch the releases over the next few months to see whether core inflation eases back toward 0.2% a month as price plans cool. Right now we are holding our forecast.
Bottom Line
The October NFIB survey is little changed at the headline, and the details moved in two directions. Price plans reached their highest level since July 2022 and more owners are paying higher rates, while uncertainty fell to its lowest since December and openings, hiring plans and the good-time-to-expand reading all improved. Earnings trends fell to a net negative 23% and taxes rose to the second-ranked concern at 21%. With BLS reporting 165,000 new payroll jobs in October and core CPI up 0.3% for a third month, the survey describes owners who are hiring and expanding more willingly while still passing along higher costs. We would change our view if net price plans fell toward their 22% average in the November survey while core CPI held at or below 0.2%.
What We Are Watching
| Series | The test |
|---|---|
| October CPI and core inflation | Core CPI rose 0.3% in October, above the 0.2% consensus and the third 0.3% in a row. What we are watching is how much of the price pressure owners have reported is being passed on to end consumers and how much is showing up in core CPI, since a net 33% of owners raised prices and a net 37% plan to. |
| NFIB price plans and selling prices | Whether the net 37% and net 33% readings ease in November, the first sign that small business pricing power is fading. |
| Borrowing costs | Whether the net 13% paying higher rates and the 8.5% average short-term rate keep climbing ahead of the December 9 FOMC meeting. |
| Hiring plans and openings | Whether the net 18% hiring plans and 36% job openings turn into payroll gains in the November Employment Situation, due in early December. |
| Taxes and uncertainty | Whether the 21% of owners naming taxes as their top problem and the Uncertainty Index at 84 ease in the November survey, due December 8. |
Mark P. Vitner – Chief Economist, Piedmont Crescent Capital
mark.vitner@piedmontcrescentcapital.com · (704) 458-4000
Sources: NFIB Research Center, Small Business Economic Trends, October 2026 (released November 10, 2026) and prior issues; U.S. Bureau of Labor Statistics, Employment Situation, October 2026, and core CPI via FRED (CPILFESL); Board of Governors of the Federal Reserve System, FOMC statement of October 28, 2026; U.S. Bureau of Labor Statistics, Consumer Price Index, October 2026 (released November 10, 2026); investingLive and Kiplinger, consensus forecasts for October CPI. Historical series and chart calculations by Piedmont Crescent Capital.
Disclaimer: This report is provided for informational purposes only and does not constitute investment, legal, tax, or accounting advice, nor an offer or solicitation to buy or sell any security. Information is drawn from sources believed to be reliable, but its accuracy and completeness are not guaranteed. Views expressed are those of the author as of the date of publication and are subject to change without notice. Past performance is not indicative of future results.