
What the Midterms Changed, and What They Did Not
Midterm Mayhem: A Week of Violent Moves in Stocks and Bonds
Democrats took the House and the Senate, chips fell 12% in a day and payrolls rose 165,000. Approvals for new data centers will be harder to secure, even in friendly states, the Fed still has a December hike to deliver and the 10-year Treasury yield has pulled back 47 basis points from its October peak.
This issue covers the midterm results, Thursday’s chip selloff, the pullback in the 10-year Treasury yield, the October jobs report, third-quarter productivity and the week’s central banks. Friday yields, oil and gold are wire quotes, labeled as such, and the House and Senate counts are still incomplete.
MARKET DASHBOARD
(as of Friday, November 6, unless noted)
| Rates, Credit & Data | Equities & Commodities | ||
|---|---|---|---|
| Fed funds target range | 3.75%-4.00% (held Oct. 28, 10-2 vote) | S&P 500 | 7,376.86 (+0.31% Fri.; -2.68% wk.) |
| 2-yr Treasury | 4.51% (Fri. wire quote) | Dow Jones | 51,285.73 (-0.46% Fri.; -0.94% wk.) |
| 10-yr Treasury | 4.86% (Fri. quote; 4.84% Thu. close) | Nasdaq Composite | 24,579.42 (+1.09% Fri.; -3.37% wk.) |
| 2s-10s spread | 35 bp (our calculation, Fri. quotes) | Russell 2000 | 2,754.11 (+0.89% Fri.; -2.05% wk.) |
| Dec. 9 hike odds (futures) | about 76% (CME FedWatch) | Philadelphia Semiconductor | 9,011.14 (-12.25% Thu.) |
| Nonfarm payrolls (Oct.) | +165,000 (Aug. 186,000; Sept. 60,000) | VIX | 25.64 (+32% wk.) |
| Unemployment rate (Oct.) | 4.1% | Brent crude (January) | about $98.3 (-13.3% wk.) |
| Average hourly earnings (Oct.) | +0.4% m/m; +3.1% y/y | WTI crude | about $90.8 |
| Productivity (Q3, prelim.) | +3.6% annual rate (2.1% y/y) | Gold (Dec. Comex) | $4,079.50 (+4.6% wk.) |
| Initial jobless claims | 189,000 (4-wk avg. 194,750) | Dollar index (DXY) | 102.28 (+0.72% Fri.) |
| UMich sentiment (Nov., prelim.) | 51.0 (from 48.0) | High-yield spread (OAS) | 340 bp (widest since May 2025) |
Note: Equity closes for Friday, November 6 are from The Closing Print; Thursday’s Philadelphia Semiconductor level is from Reuters and TradingKey. Treasury yields, oil, gold and the dollar are Friday wire quotes, not official closes; the Treasury’s par yield curve for Friday posts on the next business day. Brent is the January contract, and its weekly change compares January with January. Hike odds and the futures path are CME FedWatch probabilities retrieved November 8, based on Friday’s futures prices. The spread is our calculation.
SUMMARY
Democrats flipped the House and the Senate on Tuesday, and since then we have fielded a myriad of questions from clients in our presentations this week across Virginia and the Carolinas. They cluster around five: whether a Democratic Congress ends the AI buildout, whether the Fed still raises rates, what happens to tariffs, taxes and spending at the December deadlines, what the president does now, and whether the new Congress will simply roll out endless investigations into the president, his family, his cabinet and his supporters. Our short answers are no, yes, a series of fights that mostly end in deals, a pivot toward immigration reform and Social Security, and, on investigations and hearings, a 2027 event with the larger economic risk in 2028. The most important change from the election is that approvals for new data centers will be harder to secure, even in some of the most data center friendly states, now that Virginia, Texas, Georgia and Ohio have Democratic governors and Democrats appear to have gained ground in state legislatures and other statewide offices.
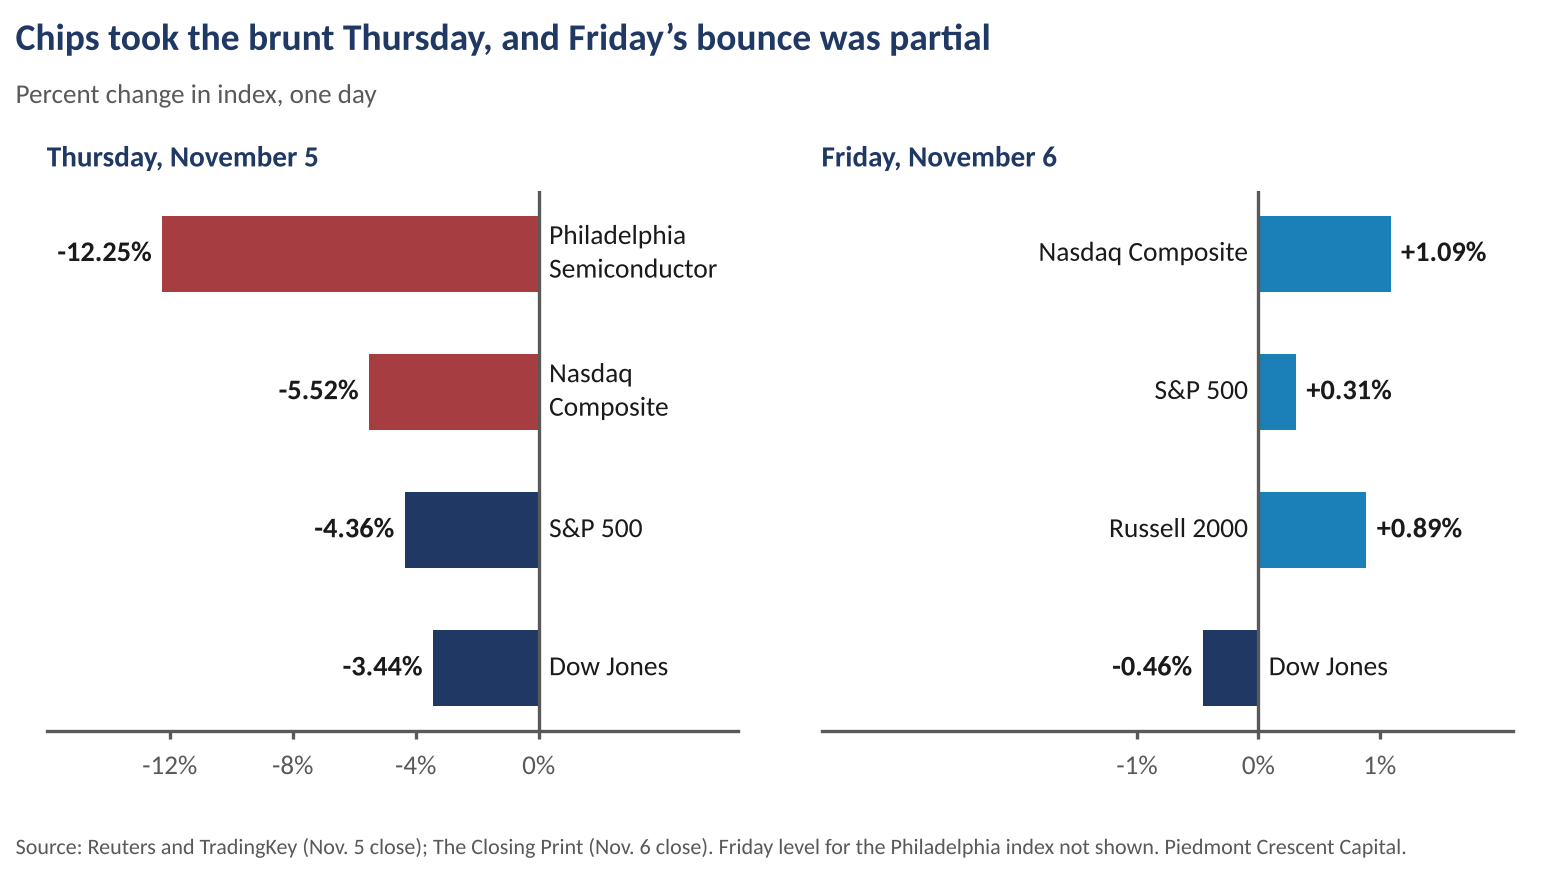
Markets reacted sharply before anyone had answers. The Philadelphia Semiconductor Index fell 12.25% on Thursday, its second-largest one-day drop on record, the Nasdaq fell 5.52% into correction territory and the S&P 500 fell 4.36%, its worst day since April 2025. Friday brought only a partial bounce, with the S&P 500 up 0.31% for a weekly loss of 2.68% and the VIX at 25.64. Meanwhile Treasury yields fell, with the 10-year closing at 4.84% on Thursday, 47 basis points below its October 5 peak of 5.31%, before drifting back to 4.86% on Friday.
The economic data were solid. October payrolls rose 165,000 with upward revisions to August and September, unemployment held at 4.1%, third-quarter productivity grew 3.6%, jobless claims fell to 189,000 and the ISM manufacturing index was 55.5. We expect a quarter-point hike on December 9, with futures near 76%, and our 4.60% tripwire on the 10-year has not been touched. We read the pullback in the 10-year as a partial correction of an overdone run-up in yields, and we see no change in the outlook for growth, inflation or deficits. We take it up in its own section below. This issue also introduces a standing scorecard for our seven themes, because the election changes the political exposure of each.
THE WEEK’S KEY INSIGHT
Approvals for new data centers will be harder to secure, even in the friendliest states
Democrats won the House, where the Associated Press has called 254 seats for them with 19 races uncalled and CBS News projects about 256, a gain of about 42. The Senate flipped as well, with Democrats holding at least 54 seats while Mississippi and Alaska remain uncalled. The seven pickups were Texas, North Carolina, Ohio, Maine, Iowa, Kansas and South Carolina. Democrats also won governorships in Iowa, Texas, Georgia and Ohio. The questions we heard in our presentations across Virginia and the Carolinas this week were about what the new arithmetic means for local decisions, and they fell into five groups.
- Does a Democratic Congress end the AI buildout? We think not. The binding constraint is approvals for new projects, which will be harder to secure in even some of the most data center friendly states now that Virginia, Texas, Georgia and Ohio have Democratic governors (the last three take office in January) and Democrats appear to have gained ground in state legislatures and other statewide offices. In NBC’s exit poll, 76% of voters opposed new data centers in their own communities, and 41 local measures were on ballots. Some slowdown in these states appears assured, since the new governors campaigned on protecting households from higher power bills, but other areas are likely to pick up some of these projects, and the Carolinas, Alabama and Arkansas could be big winners in this shift. Charlotte’s own pause on new approvals, which runs to October 18, 2027, shows that even friendly jurisdictions can pause. We expect most projects to be delayed by a quarter or two.
- Does the Fed still raise rates? Yes, ceteris paribus. Payrolls, wages and claims all argue against the growth scare that Thursday’s bond rally briefly priced, and the futures market still sees about 76% odds of a December 9 hike.
- What happens to tariffs, taxes and spending? We expect the December deadlines to produce fights that mostly end in deals. Funding under the infrastructure law runs out December 11, a shutdown is possible in mid-December, the White House wants $350 billion for defense in a lame-duck reconciliation bill, and the U.S.-China truce expires January 10. Democrats will try to roll back selected tariffs and reverse spending cuts, and the effective tariff rate is about 10%. Congress is likely to be reluctant to withhold funding for the troops, and the decision on Iran still rests with the president, who leads the conduct of foreign policy, so we expect limits on the war to be difficult to impose. The patience of the American public and of a Democratic Congress is limited, however, which raises the odds of a settlement.
- What does the president do now? Our best guess is a pivot toward issues where he can work with Democrats: immigration reform, including further enforcement reforms, and Social Security reforms, perhaps appointing a bipartisan commission. BCA Research’s GeoMacro team expects a pivot as well, and puts a 33% probability on a rogue turn that would mean a larger oil shock. We take up the history, and the harder question of how divided the Democrats are, in this week’s Perspective.
- Will the new Congress simply roll out endless investigations? Hearings and subpoenas are a 2027 event, not a December one, since the new Congress is not seated until January and the current one has the December deadlines to handle. We see the impact on the economy as more of a risk to 2028 than to 2027, and the channel is more likely to be delay and uncertainty than spending. Leader Hakeem Jeffries has signaled that Democrats will pursue Secretary Pete Hegseth over the Iran war once they hold the majority, and Representative Thomas Massie, a Republican, has filed articles of his own. Only two cabinet secretaries have ever been impeached, William Belknap in 1876 and Alejandro Mayorkas in 2024, and none has been removed, because conviction takes 67 Senate votes.
Thursday showed how quickly markets react to the prospect of slower approvals. Philadelphia semiconductors fell 12.25%, Micron lost 17.5%, SanDisk 22% and Nvidia about 9%, and Reuters put the market value erased across U.S. stocks near $2 trillion (Exhibit 1). Our view is that the pullback in chips and AI buildout-related stocks was a combination of forced liquidation and positioning. Investors also feel that the AI buildout is close to peaking and that profit margins may be near their widest, which led them to reassess their risk allocations. The arithmetic of the build itself is less alarming. Our July construction forecast, which we have not changed, calls for data center construction spending to rise 31.6% in 2026 and 25.0% in 2027, to about $68 billion from $41 billion in 2025. The AIA Consensus Construction Forecast, to which we contribute, is nearly identical at 33.0% and 24.7% (Exhibit 2), and it attributes almost all of its upgrade to commercial construction to data centers: without them, the panel would see commercial spending down 1% in 2026 and up 1% in 2027. Data center construction rose 8.6% in September and is up 75% so far this year. Our November 8 forecast table also raises growth in nonresidential fixed investment to 7.2% in 2027 from 4.6% in our November 1 vintage.
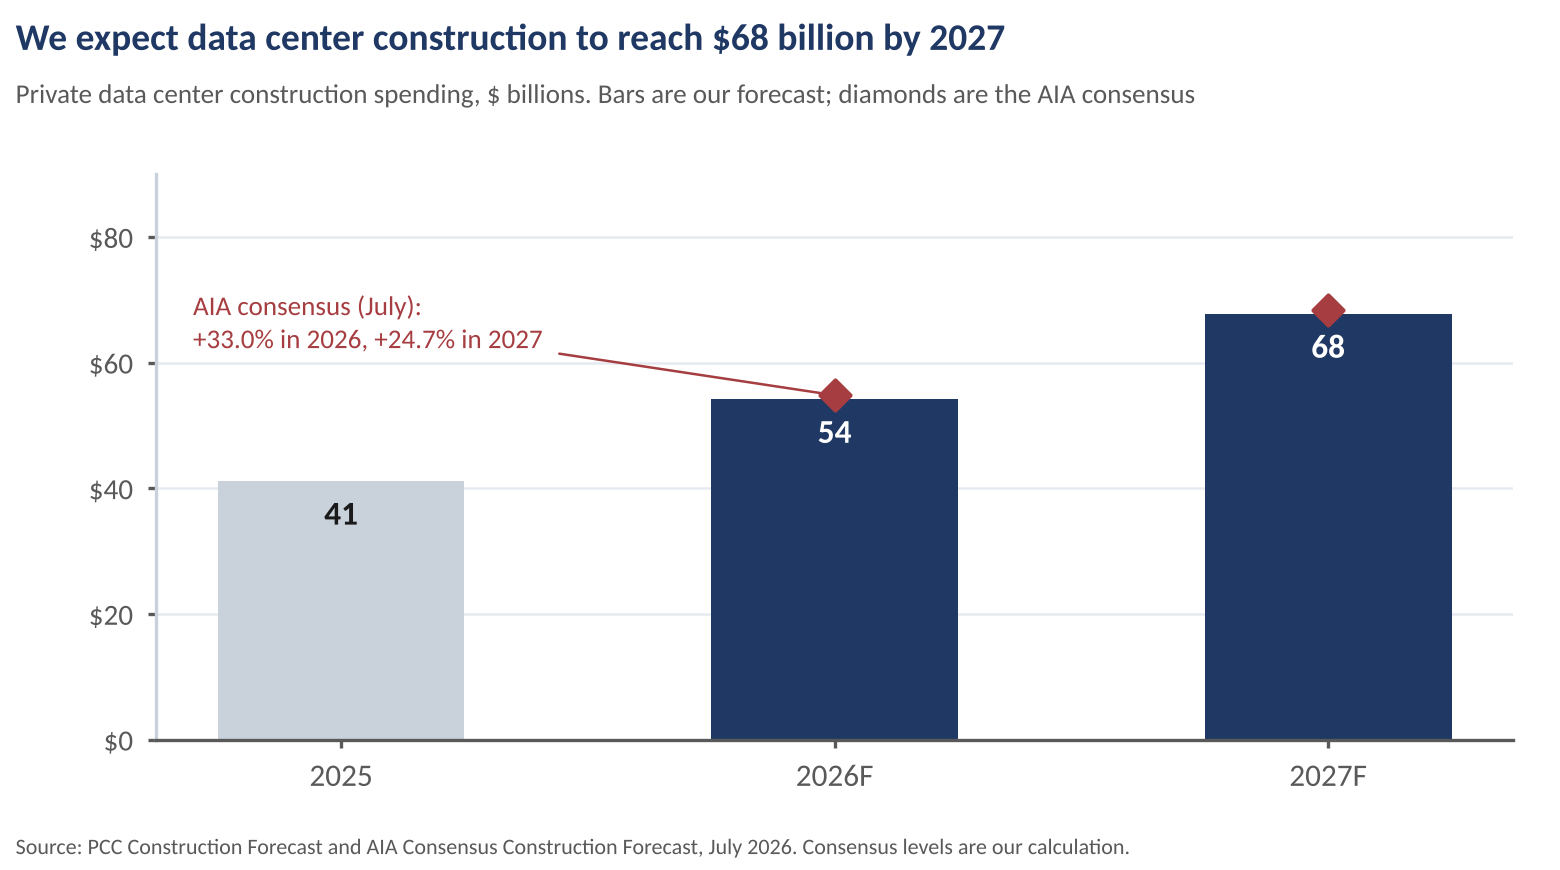
The market is pricing an earlier peak for the AI buildout, but we expect activity to stay close to peak levels for a year or more before it slowly tapers. The constraints are physical: the order backlog for natural gas turbines is exceptionally long, the electricity grid has only begun to be upgraded, and no small modular nuclear reactor is yet operating. A moratorium in one county sends a project to another one, or delays it by a quarter or two. The real risk to the buildout is that equipment makers, which have only begun to scale up, overdo it and cause a broader pullback at some later date.
We would change our mind if two or more large states adopted moratoria that outlasted a quarter, or if a major hyperscaler cut its capital spending guidance. Neither has happened. In the meantime the next test is cost: the 10-year at 4.86% still prices capital higher than it was in the 2010s, and last week’s View argued that this is the issue the market was repricing. Voters see the cost in their power bills, and where researchers have been able to measure it, retail electricity prices rose about 5% after a data center arrived.
MIDTERM MAYHEM: THE PULLBACK IN THE 10-YEAR YIELD
The run-up in yields was overdone, and the pullback is mostly a correction
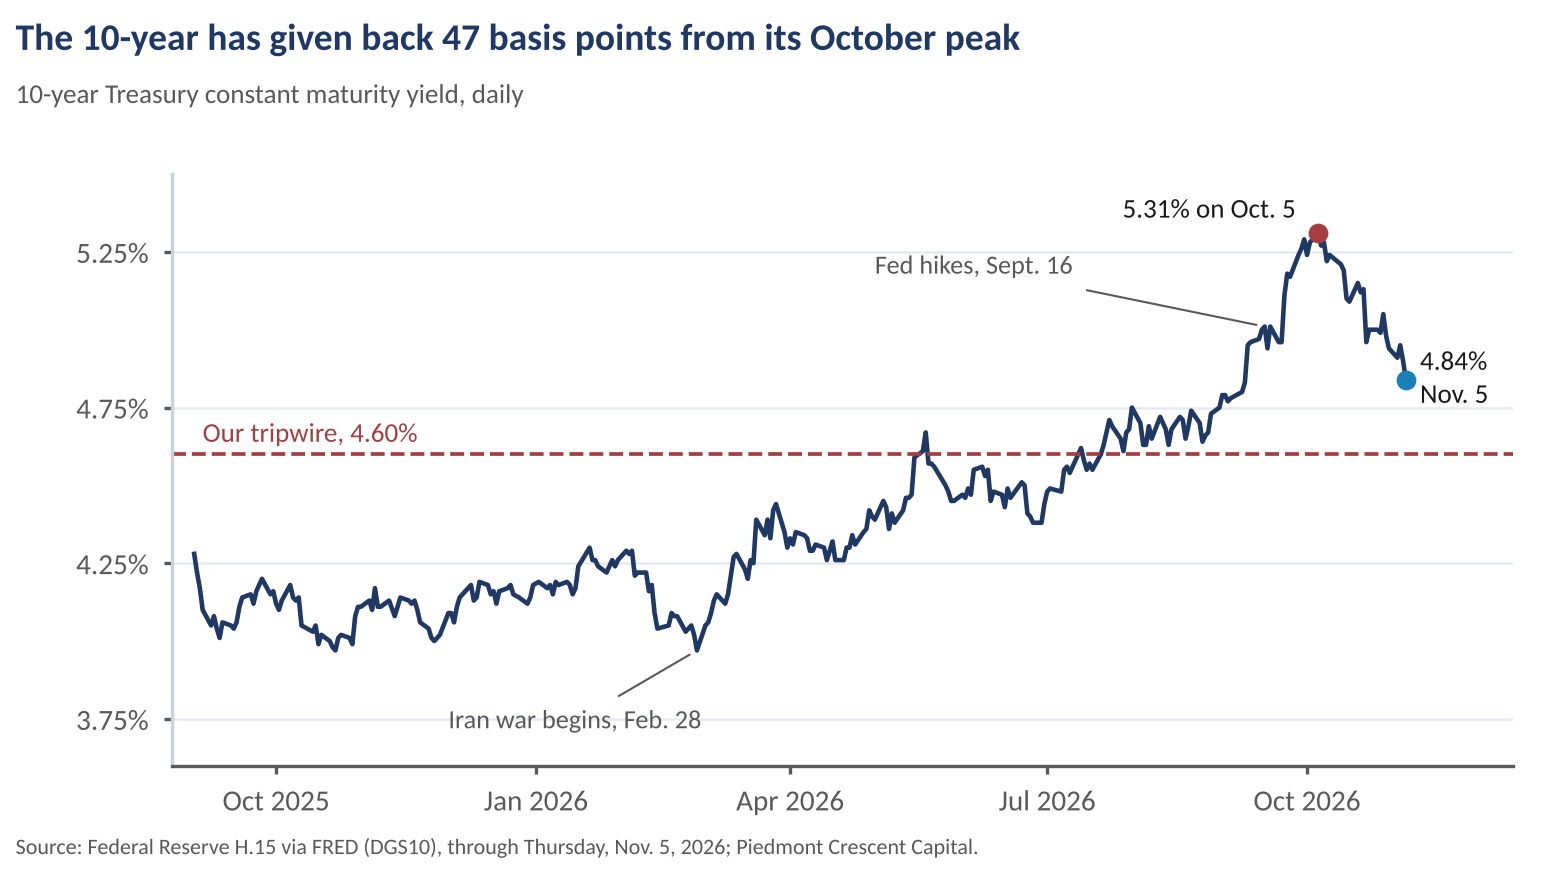
The 10-year Treasury yield closed at 4.84% on Thursday and was near 4.86% on Friday, 45 to 47 basis points below its October 5 peak of 5.31% and about 8 basis points lower on the week (Exhibit 3). We think the run-up to 5.31% was a bit overdone, and our forecast already had the 10-year ending the year at 5.10%, below that peak, so some retreat was in the plan. What surprised us was the speed. Friday’s level is about 24 basis points below the year-end figure in our table, and the market has gone further than we expected in a week.
Three things that matter for yields have not changed. Growth is likely to remain unabated in the near term: payrolls rose 165,000, claims fell to 189,000, ISM manufacturing was 55.5 and productivity grew 3.6%. Inflation does not look any better over the near to intermediate term, with ISM prices paid at 75.2, gasoline about 41% above a year ago, year-ahead inflation expectations at 4.3% in the Michigan survey, and our estimate that the AI buildout adds somewhere between 0.2 and 0.5 percentage points to core inflation. And deficits will remain large in the United States and in other developed economies. Goldman puts the U.S. general government deficit at 8.5% of GDP and sees no consolidation among the major economies in 2027, and it finds the U.S. 10-year term premium, at 134 basis points, below France (215), the United Kingdom (178) and Italy (267). The United States is not an outlier, and the Treasury’s refunding, with about $620 billion of borrowing in the fourth quarter and $800 billion in the first, confirms that supply is not going away.
What did change is the demand for capital. The most important change from the election for the bond market is that data center construction, or really new approvals, will slow, and that will dampen the demand for capital. Projects already under way will be built, as our forecast shows, but fewer new approvals mean fewer future projects competing for funds. Tariffs are likely to be reduced as well, which will improve the inflation outlook for 2028 more than for 2027, because rollbacks will take time and the effective rate is only about 10%. An Iran settlement is also closer, although it may require some intensification in the near term, because the patience of the American public and of a Democratic Congress is limited. The weekend news fits that pattern: Qatar is mediating toward a comprehensive agreement and Iran is reviewing its proposals, while the United States carried out limited strikes on an Iranian air defense system on Friday and Trump has said he is weighing a new wave of strikes after the election. Brent fell about 13% on the week to $98 on the January contract after Iran sent its proposal through Qatar, which suggests the oil market sees a settlement as more likely.
We forecast 5.10% at year-end and 4.80% at the end of 2027. We see little reason for the rally to extend much further when growth, inflation and deficits are unchanged and the Fed is about to raise rates. Our tripwire stays at 4.60%: a close below it before December 9 would tell us the market has moved from pricing scarce capital to pricing a growth scare.
OUR SEVEN THEMES: THIS WEEK’S SCORECARD
Our seven themes are the investments and demographic shifts that are responsible for the economy’s above-average growth, and the election changes the political exposure of each. Fresh evidence arrived this week for all seven, though for some it is announcements and not yet data. We say which is which.
| Theme | This week’s evidence | Midterm exposure and our read |
|---|---|---|
| The AI Buildout | Data center construction up 8.6% in September and 75% this year; AI-related imports up 135%; chips down 12.25% Thursday. | State and local approvals; 76% opposed locally. We expect delays of a quarter or two. |
| Electric Grid Upgrade | Mitsubishi Power will invest $490 million to expand its Savannah, Georgia plant that makes gas turbine parts, adding 220 jobs. Turbine backlogs remain long. | State utility commissions are the gate. Power is what local opponents target. |
| Defense Replenishment | Neros plans a $615 million drone factory expansion with a Pentagon conditional loan of up to $450 million; Hanwha won a $269 million landing ship contract in Philadelphia; the White House seeks $350 billion for defense. | Democrats may use the December deadlines to limit the war but not the funding. |
| Aerospace and Next Generation Defense | Stoke Space received a $150 million conditional loan for a second launchpad at Cape Canaveral. | Same lame-duck bill; programs with bipartisan support are the safest. |
| Reshoring of Critical Industries and Materials | ISM manufacturing 55.5 with production 59.0 and prices paid 75.2; factory jobs up 19,000; factory orders up 1.8%. Denmark and Finland signed investment and critical minerals agreements with the State Department. | Tariffs at about 10% effective; some may be rolled back; the truce expires January 10. |
| Pharmaceutical and Medtech Buildout | Pfizer plans $650 million for a manufacturing center in Groton, Connecticut; Lonza is buying five U.S. contract manufacturing sites from Merck KGaA; Antheia received an $80 million conditional loan for generic drug ingredients. | Drug pricing is a likely House priority, in our expectation. |
| Peak 65 (Senior Housing, Condos, and Longevity & Functional Health) | Health care added about 41,600 jobs; residential construction down 5.5% in September; builder sentiment at a 14-year low. | Social Security is a possible bipartisan opening. Construction finance is the constraint. |
Source: Piedmont Crescent Capital, BLS, ISM, Oxford Economics, Goldman Sachs, NBC News exit poll.
Three themes, the AI buildout, the grid and defense, face their principal political risks at the state level or in the lame-duck session, and none of the seven showed a break in the data this week. Announcements keep coming, and our reading from the Japan-SEUS conference in Nashville is that a surge of Japanese investment is headed here, similar to what we are seeing from South Korea and Taiwan. These projects are capital-intensive and hire modestly once built, so the payoff comes mainly through construction, suppliers and the tax base.
BEHIND THE NUMBERS
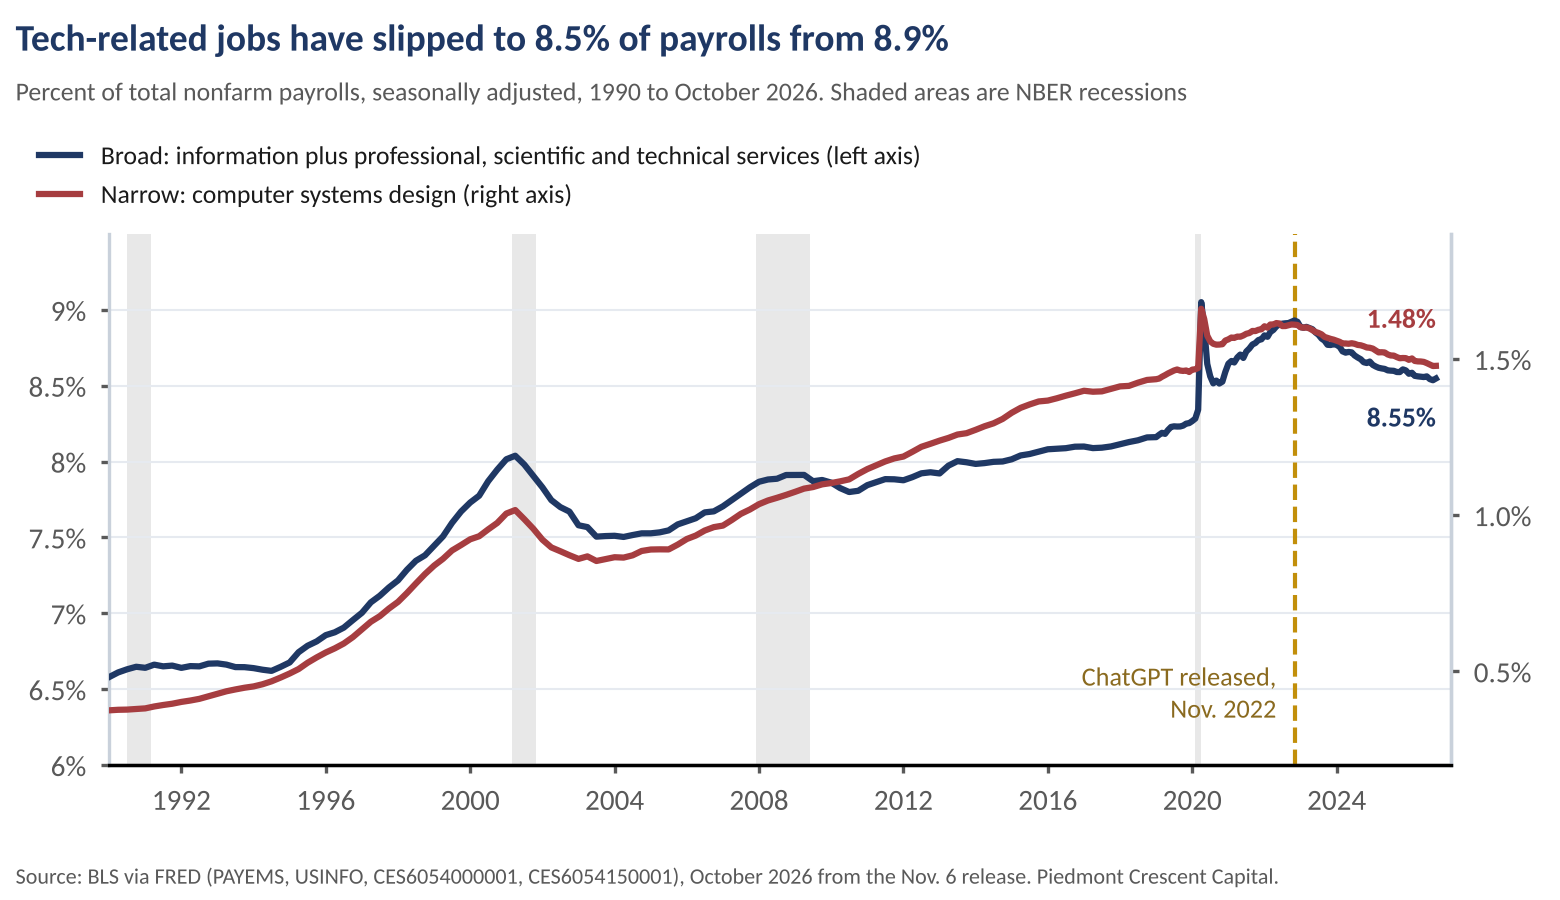
Jobs. Payrolls rose 165,000 in October, and the revisions were as notable as the headline: August was raised to 186,000 from 133,000 and September to 60,000 from 29,000, so the three-month average is about 137,000, our calculation. The unemployment rate held at 4.1% and average hourly earnings rose 0.4% for the month and 3.1% for the year. Health care added about 41,600 jobs and professional and business services about 70,000, while manufacturing added 19,000. Health care and social assistance together with professional and business services made up 75% of 2026 job gains, with information and finance shedding jobs, possibly tied to AI. The evidence so far points to thinner entry-level hiring in exposed office occupations, with little sign of broad layoffs. Information employment is down 381,000, or 12%, since ChatGPT launched in November 2022 and computer systems design is down 129,000, while professional, scientific and technical services as a whole are up 222,000, so tech-related jobs have slipped to 8.5% of payrolls from 8.9% (Exhibit 4). Our October Employment Report put the break-even pace at zero to 50,000 a month, edging toward about 80,000 in 2027, so 165,000 is well above it. Claims fell to 189,000, with the four-week average at 194,750, the lowest since 1969. This is a low-hire, low-fire market that just got a good month. One change we see coming is that lighter post-election immigration enforcement should allow more legal immigrants to return to the labor force. The variable to watch is foreign-born labor force and employment growth. The foreign-born labor force stood at 33.1 million in October, up from 32.3 million in September and 32.1 million in September 2025, though these survey figures are not seasonally adjusted and a one-month gain that large is mostly noise.
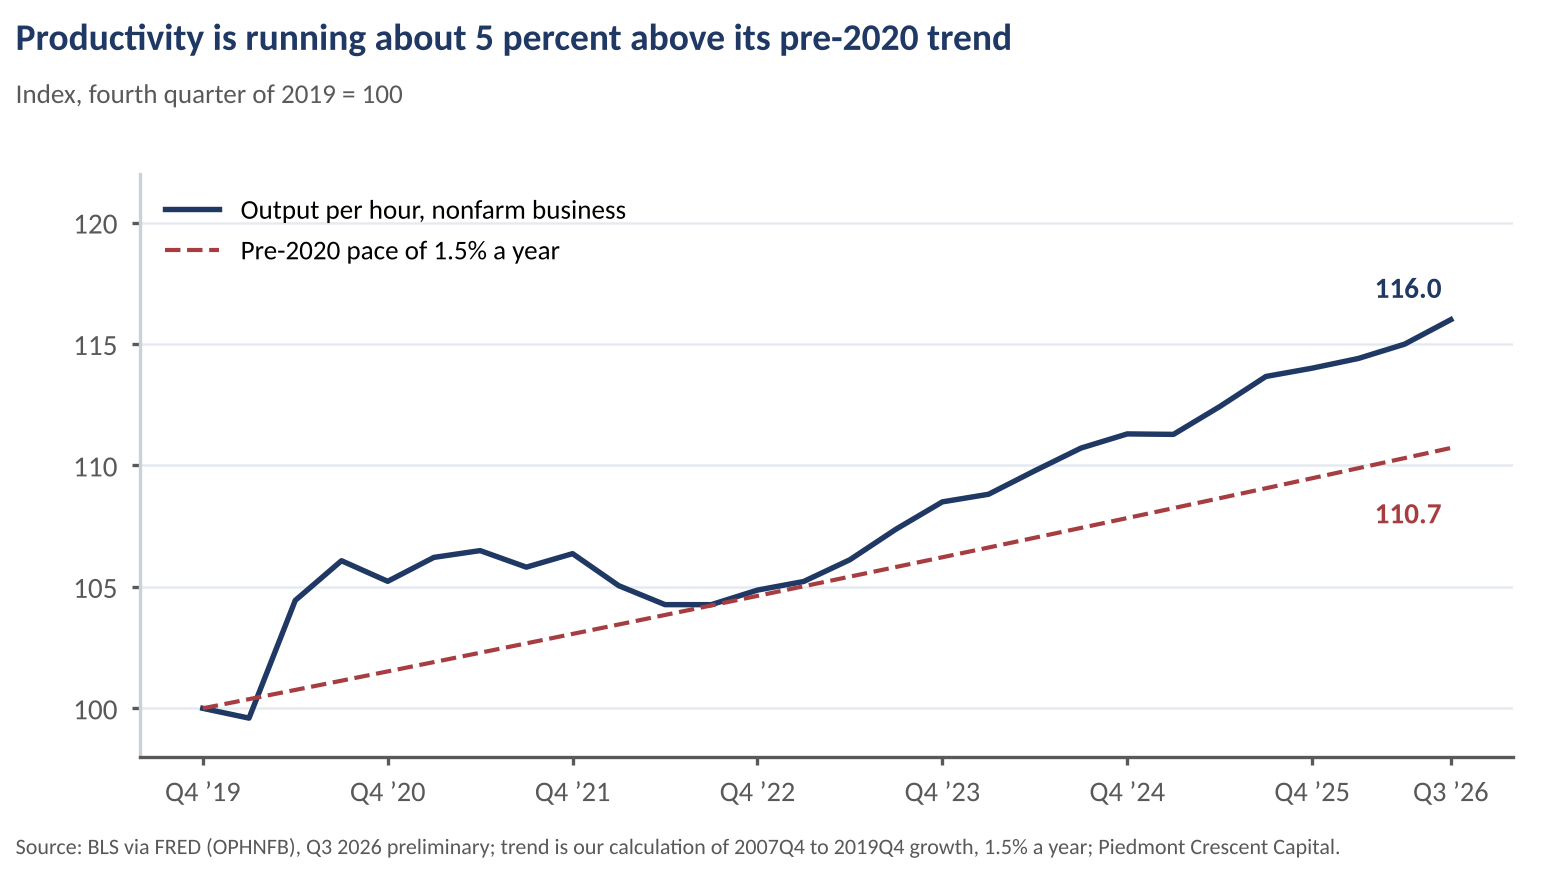
Productivity. We were asked to test whether AI is already lifting productivity in services, and the data are supportive but cannot settle it. Preliminary third-quarter output per hour rose 3.6% at an annual rate against a 2.7% consensus, and the index sits about 5% above its pre-2020 trend (Exhibit 5). Unit labor costs fell 0.7%. Three details point toward services: professional and business services added about 70,000 jobs while information and finance shed jobs, so output is growing where hours are not; nonfinancial corporate productivity has risen 3.7% over the year through the second quarter, ahead of the nonfarm business measure; and Census’s business survey found 87% of AI-using firms leaving headcount unchanged, with 6.6% adding and 2.5% cutting. Stronger demand is also behind part of the third-quarter gain, driven by AI investment, so aggregate productivity cannot tell the two apart. The industries that have embraced AI, including information, professional, scientific and technical services, financial services and advanced manufacturing, have seen little or no employment growth while output has risen. Since November 2022 employment is down 12% in information, 0.6% in financial activities and 1.7% in manufacturing and up only 2.1% in professional, scientific and technical services, against 3.3% for payrolls overall, while the share of GDP produced by information rose to 5.9% in the second quarter from 5.3% at the end of 2022 and the share from finance and insurance rose to 9.0% from 7.7%. By contrast, a disproportionate share of job growth has come from health care and social assistance, an area with notoriously low productivity, which accounted for 61% of the net gain in payrolls since November 2022 and 48% of this year’s. What would settle it is industry-level output per hour for information, finance and professional services, which was not available this week. Our own estimate is that AI adds about half a percentage point to productivity this year, and 0.5 to 1.0 points next year. We hold it as an estimate.
Prices and households. Michigan’s preliminary November sentiment index rose to 51.0 from 48.0, but 57% of respondents cited eroded living standards, up from 46% in February, and year-ahead inflation expectations were 4.3%. There is a notable split within the average: sentiment among high-income households fell about 5% while low- and middle-income households improved, and the middle 60% of the income distribution accounted for 53% of new vehicle spending, up from 38% in 2024. Gasoline prices were up about 41% from a year ago in October, with regular gasoline averaging $4.31 a gallon against $3.06 a year earlier, according to the Energy Department. Light vehicle sales fell to 15.5 million, the lowest since January. October CPI arrives Tuesday, with consensus at +0.3% for the headline and +0.2% to +0.3% for core. Our forecast is roughly consistent with the consensus for October.
Factories and the grid. The ISM manufacturing index was 55.5 in our October report, with production at 59.0 and prices paid at 75.2, a reading that explains why the Fed is not looking through the energy shock. Factory orders rose 1.8% in September. Capital goods imports excluding AI were up 22% from a year ago, the strongest since September 2021, and AI-related imports were up 135% in September, so the buildout is broadening beyond chips. Some of the broader gain may be AI-related too, such as HVAC equipment and other electrical equipment that is in short supply domestically. Residential construction fell 5.5% in September, home improvement spending is about 20% below a year ago and builder sentiment is at a 14-year low. Nonresidential construction is strong, with many workers employed building plants for the AI buildout, aerospace, the reshoring of critical industries and pharmaceuticals.
Rates and the Fed. Treasuries rallied hard on Thursday and the curve steepened, and many traders were blindsided by the size of the Blue Wave, which exaggerated the moves. The Treasury left coupon auction sizes unchanged at its November 4 refunding, dropped the phrase “at least” from its guidance, and its advisory committee saw no absorption constraint from AI. The size of the swing also means the political pressure to produce results in what was an affordability election is great. Futures put the odds of a December 9 hike at about 76%, and they are slower than we are after that. They give 47% odds that the range after the March 17 meeting is still 4.00%-4.25%, against 41% for 4.25%-4.50% or higher, and the most likely range does not reach 4.25%-4.50% until June (38%). By December 2027 futures see that range as most likely, at 36%, which is where our forecast has the funds rate from March on, and New York Fed President John Williams said in October that the Fed may not have to hike in 2027. Our call is a hike on December 9 and another in March, so we are ahead of futures on timing and in line with them on where the funds rate ends 2027. After the second or third hike, we expect the Fed to hold rates steady until it sees credible evidence that core inflation is moderating back toward trend, and that wait will likely weigh on growth in 2028. Auctions this week are $58 billion of 3-year notes Monday, $42 billion of 10-year notes Tuesday and $25 billion of 30-year bonds Thursday.
Credit. The high-yield spread widened to 340 basis points, the widest since May 2025, and the CCC index spread to 1,089. Even so, issuers had a window: more than $95 billion of corporate bonds were sold this week, including $15 billion from Meta, $10 billion from Oracle and $7.5 billion from Apple. Our test for the growth scare we carry at 10% is credit, and credit has widened without breaking.
Central banks. The Bank of England raised its rate a quarter point to 4.00% on an 8-1 vote, with Mann wanting 50 basis points, and projected inflation near 5% by mid-2027, mostly from energy. The Reserve Bank of Australia is at 4.85% after a 6-3 vote, the Riksbank held at 2.0%, the Bank of Japan held at 1.25% and the ECB held in October. Banxico cut 25 basis points to 6.25%, against expectations of a hold. The global composite PMI was 53.2, and the dollar index rose 0.72% on Friday.
BOTTOM LINE
We expect the Fed to raise the funds rate a quarter point to 4.00%-4.25% on December 9, hold in January and raise it again in March to 4.25%-4.50%. Payrolls of 165,000 with upward revisions, claims at multi-decade lows and ISM prices paid at 75.2 support that call, and two voters already dissented in favor of a hike in October. A 12% drop in chip stocks and a Nasdaq correction trim the wealth effect, but they do not move a Fed that is facing inflation near 3.6%. Our call is ceteris paribus, as it is every week, and less is holding still than usual: the Iran talks, the lame-duck session and Tuesday’s CPI can each move it.
We would change our mind if selling shifted to credit. Wider high-yield spreads that turn into failed issues, or a rise in the unemployment rate to 4.4% or higher, would move our growth-scare scenario closer to the center. On the other side, a disorderly Treasury auction this week, with $42 billion of 10-year notes on Tuesday, would push the 10-year toward the 5.50%-6.25% term-premium range, to which we assign a 20% probability. A June hike looks less likely now, but June is a long way off and we expect economic activity and job growth to surprise to the upside.
Our tripwire is unchanged at 4.60% on the 10-year Treasury. A close below that level on any day before the December 9 meeting would tell us the market has shifted from pricing scarce capital to pricing a growth scare, and we would cut our December hike probability to even odds. The 10-year closed at 4.84% on Thursday and was near 4.86% on Friday, so the tripwire is about 25 basis points away and has not been triggered.
CFO AND TREASURERS CORNER
- Trace every data center dependency to its approval path. If your revenue, land, power contract or receivables depend on data center projects, list each one by state and county and note where a moratorium, zoning vote or utility commission case could slow it. A delay of one or two quarters is the likely outcome, and your covenants and payment terms should be able to absorb it.
- Lock part of your fixed-rate needs while the 10-year is 47 basis points off its peak. The 10-year closed at 4.84% on Thursday against a peak of 5.31% on October 5, and we expect a hike in December. Fund in tranches: take a third of 2027 maturities now and keep the rest for dates after Tuesday’s CPI and the December 9 meeting. We expect Treasury coupon sizes to rise from August 2027, which adds to supply later.
- Use the credit window, but price in wider spreads for weaker names. More than $95 billion of corporate bonds sold this week, so the window is open for investment-grade issuers. High-yield spreads are the widest since May 2025 and the CCC spread is 1,089 basis points, so lower-rated borrowers should expect to pay for access and should line up bank commitments before they need them.
- Hedge energy in layers. Brent near $98 is about 13% below last Friday on the January contract, on a proposal from Iran through Qatar, and Hormuz flows are still below 60% of normal, with tankers reported hitting mines this week and new U.S. strikes on Friday. Add to first-half 2027 fuel and freight hedges on a schedule, in equal pieces, and keep part of the budget open in case a deal sticks.
- Plan for wages and hiring in a low-hire, low-fire market. Hourly earnings are up 3.1% over the year, claims are at multi-decade lows and payrolls had a good month, but information and finance are shedding jobs. Budget for retention in roles where turnover would cost you most, and expect entry-level hiring to stay thin.
- Put the December 11 and January 10 dates in your calendar. The infrastructure funding deadline of December 11, a possible mid-December shutdown and the expiry of the U.S.-China truce on January 10 all fall within your next planning cycle. If you bid on transit, utility or federal work, ask whether your backlog depends on an extension or on the BUILD America 250 Act.
PIEDMONT PERSPECTIVE
What Wave Elections Left Behind: Six Deals in Ten Big Midterms
Our look back at the ten largest midterm House losses since 1946, and where 2026 might lead
The size of this week’s swing is still being counted. Decision Desk HQ and CBS News both project a Democratic gain of about 42 House seats, which would rank seventh on our list of the largest postwar midterm losses, with some races still uncalled (Exhibit 6). Our model had pointed to a loss of 35 House seats and 8 Senate seats, and we discounted it because we did not believe there were that many competitive races. Democrats have gained at least seven Senate seats, and a win in both Mississippi and Alaska would make it nine. Some of the individual losses are extraordinary, with seemingly secure Republican incumbents defeated. The question for clients is what follows the swing, and the record is more constructive than the word gridlock suggests.
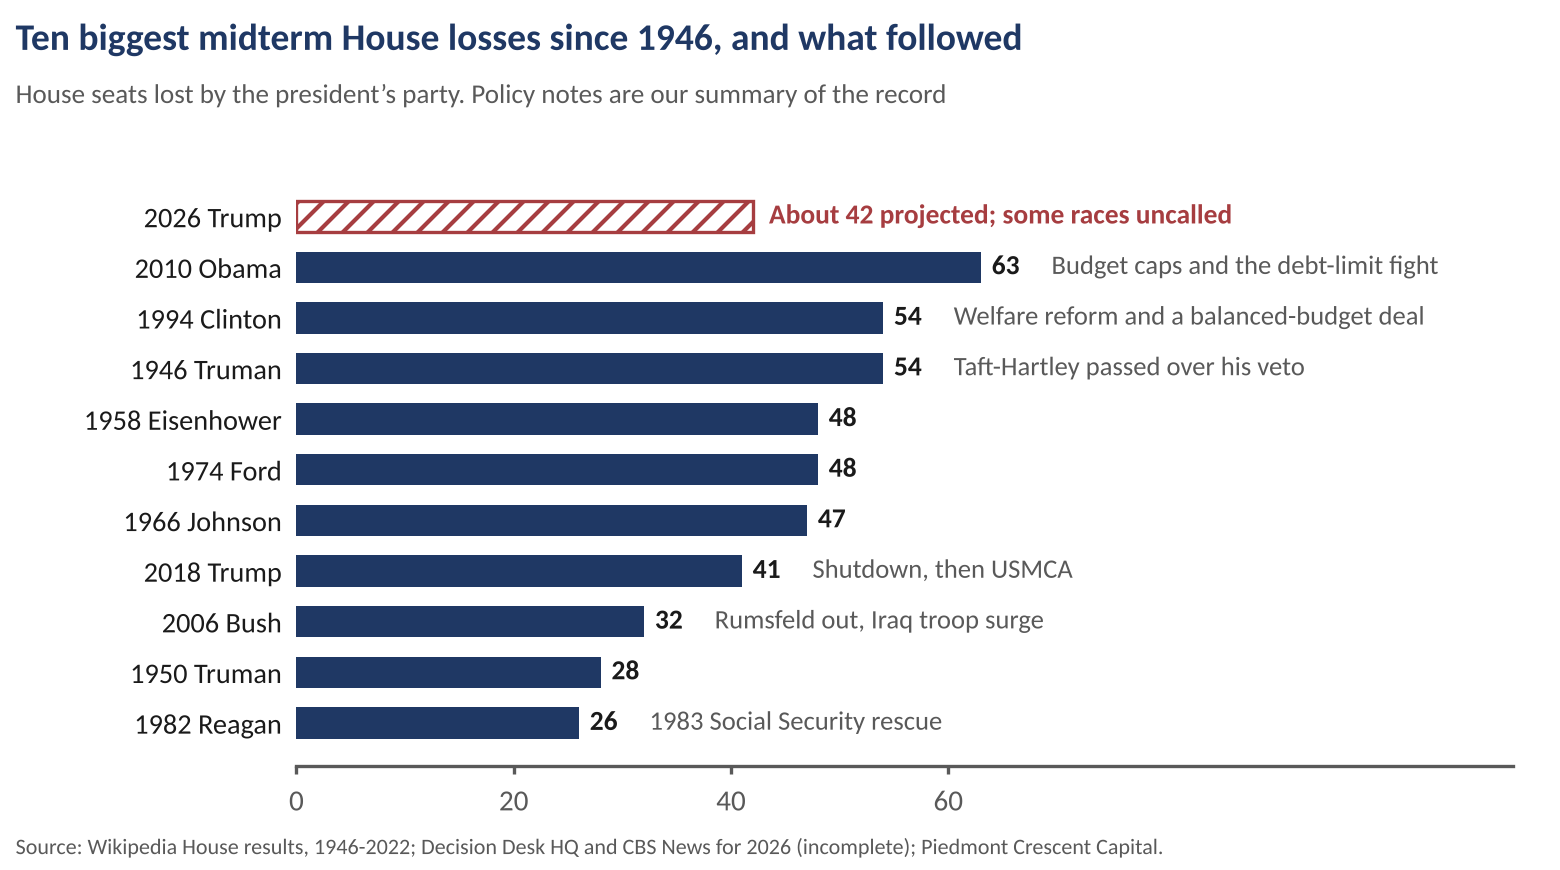
In six of the ten biggest midterm losses since the war, the next two years produced a defined policy result. Truman lost 54 seats in 1946 and then saw the Taft-Hartley Act passed over his veto. Reagan lost 26 in 1982 and signed the 1983 Social Security rescue. Clinton lost 54 in 1994, declared that the era of big government was over and then worked with the Republican Congress on welfare reform and a balanced-budget deal, and Newt Gingrich was named Time’s Person of the Year because the question shifted from whether the budget could be balanced to when. Bush lost 32 in 2006 and replaced Rumsfeld and sent more troops to Iraq. Obama lost 63 in 2010 and the Budget Control Act followed after the debt-limit fight. Trump lost 41 in 2018 and shut the government down before signing the USMCA. Not every deal was a happy one, and the ones that came out of confrontation, 2010 and 2018, took a shutdown or a debt-limit standoff to reach.
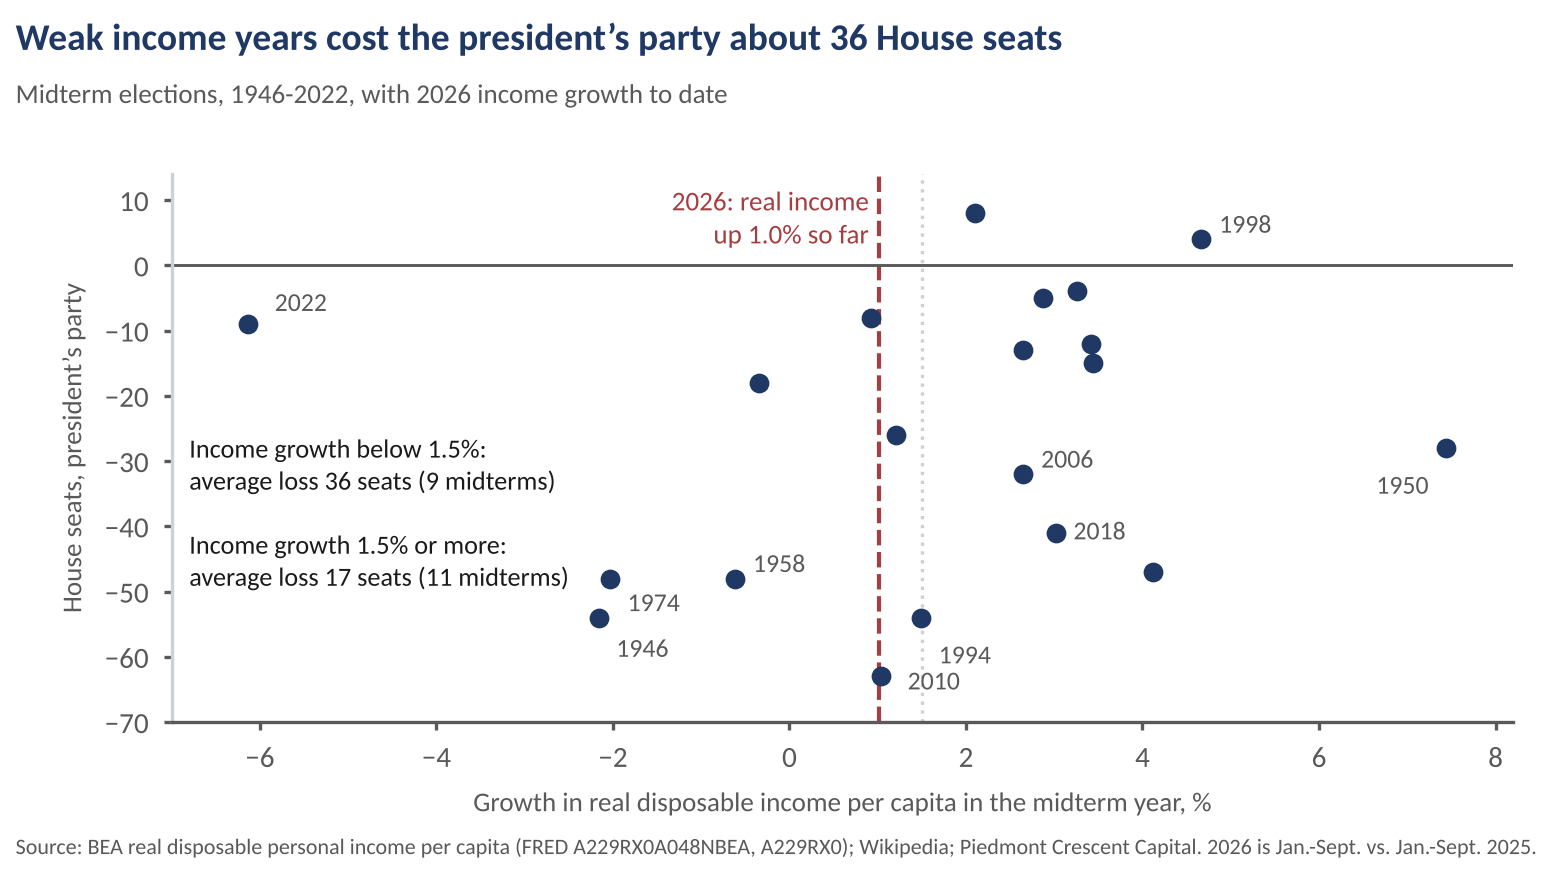
What drives the size of a loss? Our framework reads a midterm as a referendum on the incumbent’s economy through real after-tax income per person. The record supports it with qualifications (Exhibit 7). In the nine midterms since 1946 when real disposable income per person grew less than 1.5%, the president’s party lost an average of 36 House seats, and in the 11 when it grew 1.5% or more, it lost an average of 17. This year’s income growth is about 1.0% so far, which falls in the first group. The relationship is looser than a simple rule, however: across all 20 midterms the correlation between income growth and seats is weak, at about 0.2, and about 0.4 if we exclude 2022, when incomes fell sharply as pandemic transfers ended and Democrats still lost only nine seats. Incomes help explain the size of the losses, though not by enough to predict them.
Where could President Trump pivot? Our best guess is immigration reform, including enforcement, a subject on which his 2015 pledge to put a “big beautiful door” in his border wall for lawful immigrants gave him credibility with both sides, and Social Security, where Reagan’s 1983 rescue is the model. BCA’s GeoMacro team reaches a similar view, that the median voter is now constraining policy and that the president will pivot, and adds that he is likely to conduct face-saving strikes against Iran and then withdraw, since low gasoline inventories prevent a prolonged war. A pivot of that kind would lower oil prices and favor non-U.S. assets, and a rogue turn, which BCA puts at 33%, would raise the odds of a global recession.
The harder question is the Democrats. They feel emboldened, and they appear divided on how to use the new majority. Democratic governors in Texas, Georgia and Michigan are weighing conditional data center moratoria which may prove short-lived, although we think approvals will be harder to secure in any case, and the party has not settled whether to use the December deadlines to limit the Iran war, roll back tariffs or reverse spending cuts, or all three. Clinton’s 1997 budget deal was possible because both sides wanted the same outcome. Whether this Congress finds a common outcome is what we will be watching, and we take no side.
A practical conclusion for clients is to plan around deals that are likely and the timeline for them: December 11, mid-December and January 10 are the dates on which compromises are made or missed. Our seven themes are affected differently by the same deadlines, and the scorecard above this Perspective sets out how, theme by theme.
THE WEEK AHEAD
Monday: The Treasury sells $58 billion of 3-year notes. What would move us: a weak auction on top of Thursday’s volatility would push the 10-year back toward 5.00%.
Tuesday: October CPI and the NFIB small business survey, plus $42 billion of 10-year notes. Consensus is +0.3% for the headline and +0.2% to +0.3% for core. What would move us: a core reading at +0.4% or higher would push the odds of a December hike above 80%, while +0.2% would ease the pressure on the Fed.
Wednesday: Veterans Day. U.S. bond markets are closed and stock markets are open, so a gap in Treasury pricing could show up on Thursday.
Thursday: Jobless claims, existing home sales (consensus 3.85 million), the Treasury budget statement and $25 billion of 30-year bonds. What would move us: a move back above 230,000 would be the first sign that last week’s labor market strength is fading.
Friday: October producer prices, with consensus at +0.4% for the headline and +0.3% for core. What would move us: pipeline price pressure that adds to the ISM prices-paid reading of 75.2.
Watch also for Iran’s response to the Qatari proposals and whether Trump follows through on the strikes he says he is weighing, the lame-duck session’s first moves on funding and defense, and any announcement by Democratic governors on data center moratoria. On the remaining races, Mississippi’s late mail ballots must arrive by Tuesday, Alaska’s ranked-choice count begins November 18, and Colorado’s 4th District, where Representative Lauren Boebert trails, is due to finish counting by November 13. These could change the counts in this issue.
U.S. ECONOMIC AND FINANCIAL OUTLOOK
This is our November 8 vintage. Relative to November 1, we raised nonresidential fixed investment for 2027 to 7.2% growth from 4.6%, lifted payroll growth to an average of 85,000 a month in the fourth quarter from 62,000 and 86,000 in 2027 from 76,000, trimmed fourth-quarter CPI inflation to 3.8% from 3.9%, and widened the fourth-quarter drag from net exports to 0.97 percentage points from 0.73. The funds-rate path keeps the December and March hikes. We left our fourth-quarter growth forecast at 3.1% and trimmed first-quarter 2027 growth to 2.0%, which takes 2027 growth to 2.6%.
U.S. Economic & Financial Outlook
Piedmont Crescent Capital · November 8, 2026 vintage; Q3-26 GDP is the BEA advance estimate
| Indicator | Units | 2024 | 2025 | 2026F | 2027F | Q1-26 | Q2-26 | Q3-26 | Q4-26F | Q1-27F | Q2-27F | Q3-27F | Q4-27F |
|---|---|---|---|---|---|---|---|---|---|---|---|---|---|
| Output | |||||||||||||
| Real GDP | % q/q SAAR | 3.0 | 2.3 | 2.3 | 2.6 | 2.5 | 2.2 | 3.4 | 3.1 | 2.0 | 2.7 | 3.0 | 2.9 |
| 4th Qtr-to-4th Qtr Change, Yr/Yr Chg for Qtly Data | % YoY | 2.6 | 2.0 | 2.8 | 2.7 | 2.6 | 2.2 | 2.1 | 2.8 | 2.7 | 2.8 | 2.7 | 2.7 |
| Final Sales to Private Domestic Purchasers | % q/q SAAR | 3.1 | 2.8 | 2.9 | 3.7 | 1.8 | 4.6 | 4.9 | 3.6 | 2.8 | 3.1 | 3.0 | 2.8 |
| Consumer Spending | % q/q SAAR | 2.9 | 2.6 | 2.5 | 2.0 | 0.7 | 3.8 | 3.8 | 2.8 | 1.8 | 2.2 | 2.1 | 2.0 |
| Nonresidential Fixed Investment | % q/q SAAR | 3.9 | 5.4 | 6.2 | 7.2 | 9.9 | 9.0 | 12.7 | 9.0 | 8.0 | 7.4 | 7.0 | 5.4 |
| Residential Investment | % q/q SAAR | 3.2 | -2.7 | -1.8 | -1.1 | -7.6 | 0.0 | -3.3 | -4.0 | -3.5 | -2.0 | 0.5 | 0.8 |
| Industrial Production, Manufacturing | % YoY | -0.9 | 1.0 | 1.7 | 2.9 | 1.0 | 1.7 | 1.3 | 3.0 | 3.2 | 2.5 | 2.9 | 3.1 |
| Light Vehicle Sales | Mil. units, SAAR | 15.9 | 16.3 | 16.0 | 16.3 | 15.5 | 16.5 | 16.2 | 15.9 | 16.1 | 16.2 | 16.4 | 16.4 |
| Labor Market | |||||||||||||
| Unemployment Rate | % | 4.0 | 4.3 | 4.2 | 4.0 | 4.3 | 4.3 | 4.1 | 4.1 | 4.1 | 4.0 | 4.0 | 3.9 |
| Nonfarm Payrolls | Avg. mo. chg, thous. | 150 | 62 | 79 | 86 | 73 | 81 | 79 | 85 | 80 | 85 | 90 | 90 |
| Employment Cost Index | % YoY | 3.9 | 3.5 | 3.4 | 3.5 | 3.4 | 3.4 | 3.4 | 3.4 | 3.5 | 3.4 | 3.5 | 3.5 |
| Housing Market | |||||||||||||
| Housing Starts | Thous. units, SAAR | 1,370 | 1,356 | 1,345 | 1,370 | 1,418 | 1,345 | 1,293 | 1,340 | 1,330 | 1,350 | 1,360 | 1,360 |
| New Home Sales | Thous. units, SAAR | 684 | 679 | 645.5 | 637.5 | 622 | 652 | 668 | 640 | 630 | 630 | 640 | 650 |
| Existing Home Sales | Thous. units, SAAR | 4,060 | 4,060 | 4,014 | 4,010 | 4,043 | 4,120 | 3,993 | 3,900 | 3,950 | 4,000 | 4,030 | 4,060 |
| Case-Shiller National Home Prices | % YoY | 5.1 | 2.2 | 1.5 | 2.2 | 0.9 | 1.3 | 2.0 | 1.8 | 2.1 | 2.3 | 2.5 | 2.6 |
| Inflation | |||||||||||||
| Consumer Price Index (CPI) | % YoY | 3.0 | 2.6 | 3.4 | 2.6 | 2.7 | 3.8 | 3.5 | 3.8 | 3.5 | 2.4 | 2.6 | 2.6 |
| Core CPI | % YoY | 3.4 | 2.8 | 2.6 | 2.4 | 2.5 | 2.7 | 2.5 | 2.8 | 2.7 | 2.3 | 2.8 | 2.8 |
| PCE Deflator | % YoY | 2.6 | 2.6 | 3.4 | 2.9 | 3.0 | 3.6 | 3.5 | 3.6 | 3.2 | 2.9 | 2.7 | 2.7 |
| Core PCE Deflator | % YoY | 2.9 | 2.8 | 3.1 | 2.7 | 3.0 | 3.1 | 3.1 | 3.2 | 2.9 | 2.6 | 2.6 | 2.6 |
| Interest Rates & Markets | |||||||||||||
| Fed Funds Target Range | Avg / Range, % EOP | 5.14 | 4.21 | 3.62 | 4.06 | 3.5-3.75 | 3.5-3.75 | 3.75-4 | 4-4.25 | 4.25-4.5 | 4.25-4.5 | 4.25-4.5 | 4.25-4.5 |
| 2-Year Treasury | % (period end) | 4.37 | 3.81 | 3.92 | 4.06 | 3.78 | 4.14 | 4.88 | 4.75 | 4.60 | 4.50 | 4.40 | 4.38 |
| 10-Year Treasury | % (period end) | 4.21 | 4.29 | 4.79 | 4.92 | 4.35 | 4.44 | 5.29 | 5.10 | 5.10 | 4.95 | 4.85 | 4.80 |
| 30-Year Mortgage Rate | % (period end) | 6.72 | 6.60 | 6.71 | 6.95 | 6.10 | 6.49 | 7.03 | 7.20 | 7.10 | 7.00 | 6.90 | 6.80 |
| Brent Crude | $/bbl, period avg | 79.91 | 68.32 | 93.62 | 87.67 | 78.00 | 100.20 | 91.27 | 105.00 | 91.67 | 88.00 | 86.00 | 85.00 |
| Trade-Weighted Dollar Index | period average | 122.9 | 122.7 | 119.9 | 122.9 | 119.1 | 119.3 | 119.6 | 121.8 | 122.0 | 122.6 | 123.3 | 123.6 |
| % chg, period | % chg, period | 1.7 | -0.1 | -2.3 | 2.4 | -1.4 | 0.2 | 0.2 | 1.9 | 0.2 | 0.4 | 0.5 | 0.2 |
| Government, Trade & Inventories | |||||||||||||
| Government | % q/q SAAR | 4.5 | 1.6 | 0.1 | 1.1 | 4.7 | -0.1 | 5.3 | 2.4 | 0.8 | 1.1 | 1.2 | 1.2 |
| Net Exports (percentage point impact) | Percentage points | -0.54 | 0.30 | -0.10 | -0.76 | -0.04 | -1.10 | -3.32 | -0.97 | -1.44 | -0.96 | -0.63 | 0.00 |
| Inventories (percentage point impact) | Percentage points | -0.20 | -0.20 | -0.13 | 0.03 | 0.18 | -0.53 | 1.61 | 0.35 | 0.21 | 0.00 | -0.08 | 0.00 |
Source: Piedmont Crescent Capital, BLS, BEA, Census, Federal Reserve, EIA. Forecast values are shaded.
Mark P. Vitner
President & Chief Economist, Piedmont Crescent Capital
mark.vitner@piedmontcrescentcapital.com · 704-458-4000
SOURCES AND NOTES
Sources. Bureau of Labor Statistics (Employment Situation, October 2026, November 6, 2026; Productivity and Costs, third quarter 2026 preliminary, November 5, 2026; JOLTS, September 2026); Institute for Supply Management (Manufacturing and Services PMI, October 2026, as reported in our weekly reports); Federal Reserve (FOMC statement, October 28, 2026); University of Michigan (preliminary November survey); Freddie Mac (Primary Mortgage Market Survey, November 5, via StockTitan); U.S. Treasury (quarterly refunding, November 4, 2026); Reuters via investing.com (Thursday selloff); TradingKey; The Closing Print (Friday market close); NPR, Newsweek and Wikipedia (election results and historical House results); NBC News (exit poll); Census Bureau (Business Trends and Outlook Survey, November 1); FRED, St. Louis Fed (DGS10, A229RX0 and A229RX0A048NBEA, OPHNFB); Goldman Sachs Global Investment Research (strategy, rates, currency and economics publications, November 2 to 6, 2026); AIA Consensus Construction Forecast (July 2026) and our July 2026 Construction Forecast; Oxford Economics (U.S. publications, November 2 to 6, 2026, including nonfinancial corporate productivity); Associated Press, CBS News and Decision Desk HQ (House and Senate counts and projections, November 3 to 8); Manufacturing Dive (reshoring announcements, November 6); The Week (August 7, 2015, on the “big beautiful door”); U.S. Energy Information Administration via FRED (GASREGM); BLS Current Population Survey and Current Employment Statistics via FRED (LNU01073395, PAYEMS, USINFO, USFIRE, MANEMP, CES6054000001, CES6054150001, CES6562000001); BCA Research (Daily Insights); CME FedWatch (futures-implied meeting probabilities, retrieved November 8); Bureau of Economic Analysis value added by industry via FRED (VAPGDPI, VAPGDPFI); and our October Employment Report and October ISM Manufacturing Report.
Market data. Equity index closes for Thursday, November 5 are from Reuters and TradingKey and for Friday, November 6 from The Closing Print. Treasury yields, oil, gold and the dollar are Friday wire quotes and not official closes, except for the 10-year yield of 4.84% on November 5, which is the Federal Reserve’s H.15 series via FRED. Brent is the January 2027 contract, and its weekly decline of 13.3% compares January with January; some reports show a decline above 16% by comparing with the expired December contract. The 30-year mortgage rate of 7.18% is the Freddie Mac survey released November 5.
Calculations. The three-month payroll average, the 2s-10s spread, the 47 basis-point decline in the 10-year from the October 5 peak, the grouping of midterms by income growth (below and above 1.5%) and the correlations between income growth and House seats, the changes in industry employment since November 2022 and the shares of net job growth are our calculations. House seat losses before 2026 are from a Wikipedia compilation, and sources differ by one or two seats for 1946, 2010 and 2018. The 2026 count is incomplete. Real disposable income growth for 2026 compares January to September with the same months in 2025.