
October Employment Report: The Trend Was Higher All Along
Payrolls Rose 165,000 and the Two Prior Months Were Revised Up by a Combined 84,000, Taking the Three-Month Average to 137,000 Against a Breakeven of Zero to 50,000. Hiring Broadened, Factory Payrolls Kept Rising and the Unemployment Rate Slipped Back to 4.1%. The Labor Market Has Tightened, and the Case for a December Rate Hike Is Even Stronger.
Early Signal
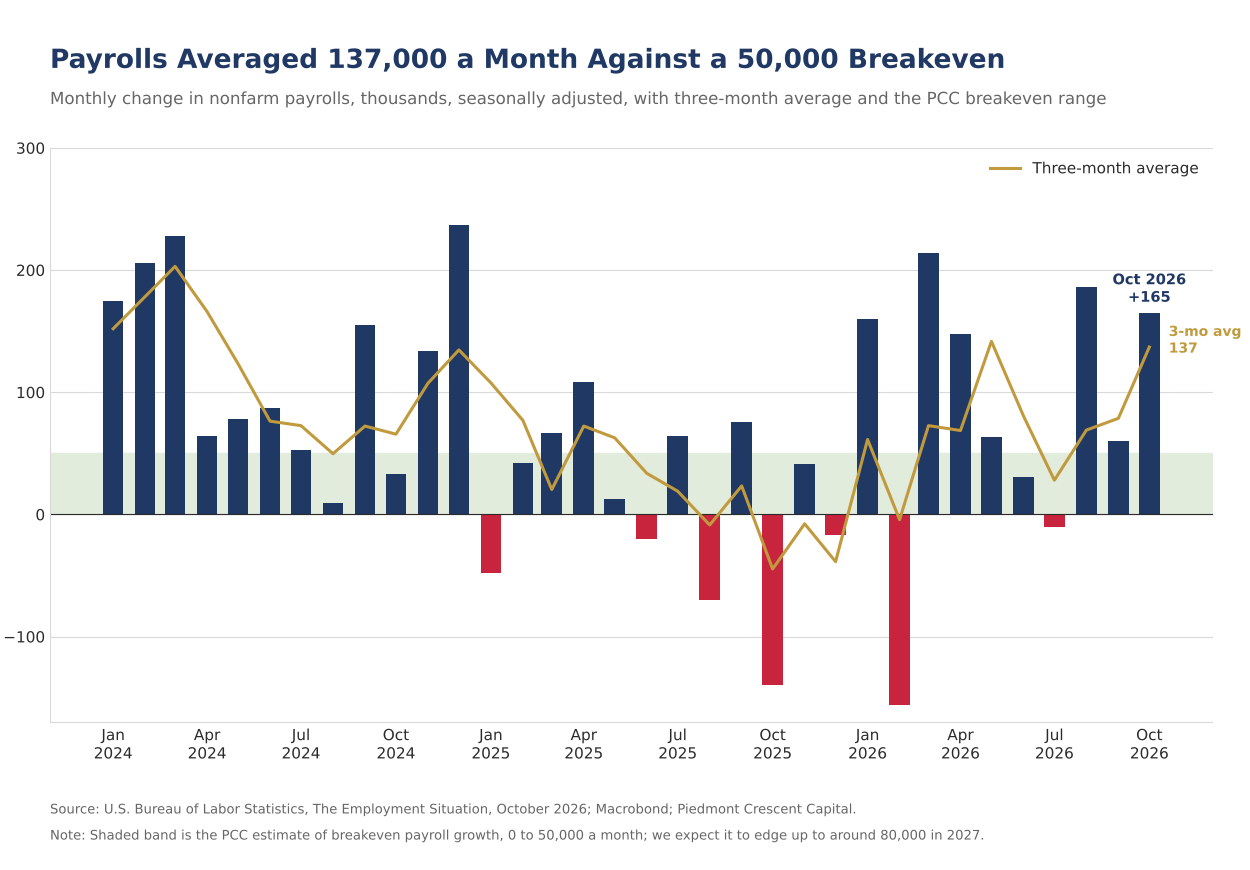
- Nonfarm payrolls rose 165,000 in October, roughly three times the consensus call near 55,000, and the two prior months were revised up a combined 84,000. August now shows a gain of 186,000, from 133,000, and September 60,000, from 29,000, so the stall that the September report appeared to describe has been revised away. The three-month average is 137,000, from 51,000 a month ago, and the average over the twelve months through September is 48,000. Private payrolls added 159,000 and government 6,000.
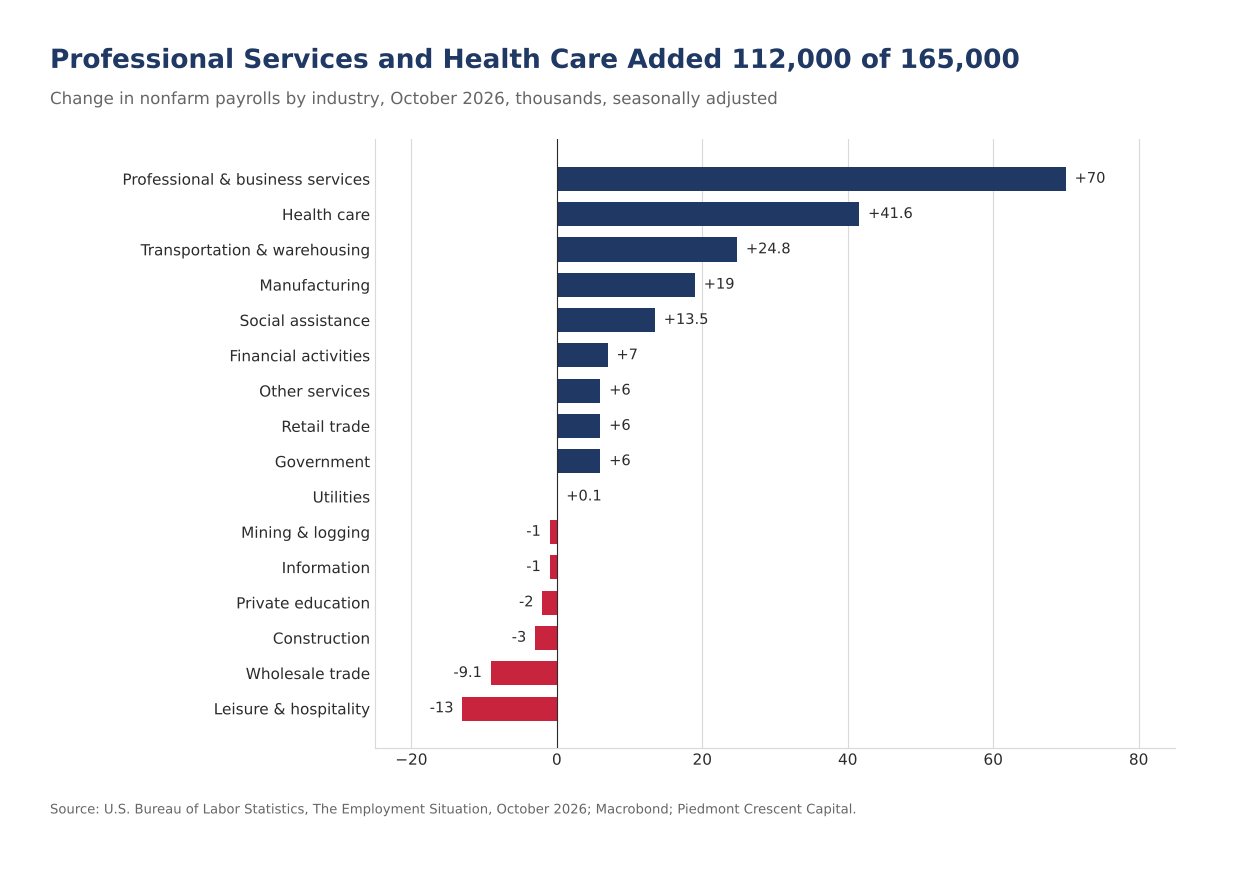
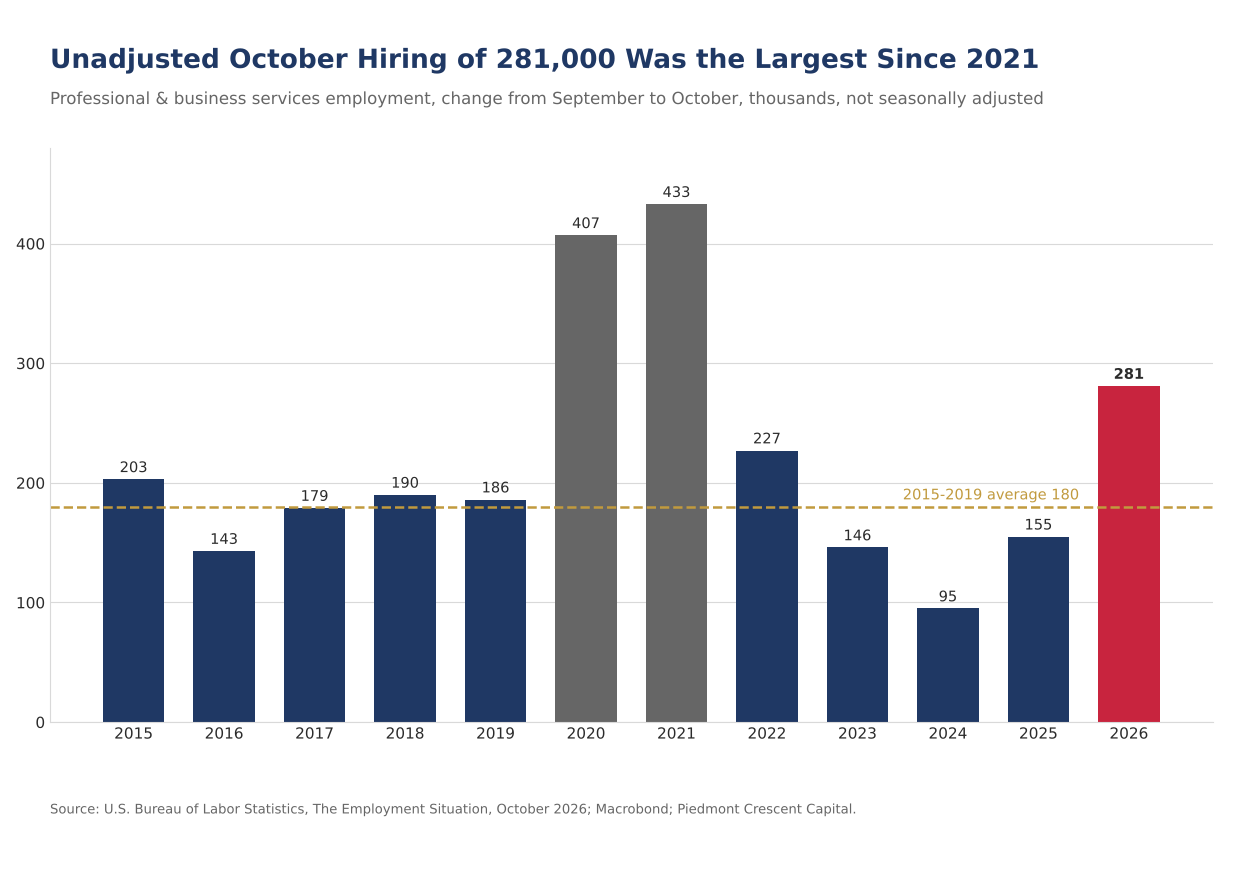
- Professional & business services carried the month with a gain of 70,000, the largest since early 2022. Professional, scientific & technical services added 32,900, management and technical consulting 17,300 and temporary help 18,600. Before seasonal adjustment the sector added 281,000 workers between September and October, against 155,000 last year, 95,000 in 2024 and 146,000 in 2023. The adjusted gain reflects an unusually large October hiring round and not the seasonal factors.
- Health care added 41,600, back near its 33,000 twelve-month average after two soft months, and transportation & warehousing added 24,800. Ambulatory care added 19,400 and hospitals 16,000, and social assistance added 13,500. Couriers and messengers added 17,400 as holiday delivery hiring arrived, and general merchandise retailers added 18,300. Information was flat after two months of losses, with computing infrastructure unchanged and computer systems design up 3,200.
- Manufacturing payrolls rose 19,000 and the one-month factory diffusion index jumped to 62.5 from 51.4, so roughly six of every ten factory industries added workers. Durable goods added 25,000, led by computer & electronic products (+6,700), fabricated metals (+5,900), motor vehicles & parts (+4,100) and machinery (+3,900), while nondurables lost 6,000. Factory payrolls are roughly 100,000 above December’s low. Construction lost 3,000 as residential specialty trades shed 15,200 against gains at nonresidential specialty trades (+7,900), nonresidential building (+2,900) and heavy & civil engineering (+2,500).
- The unemployment rate slipped to 4.1% from 4.2% as household employment rose 463,000 and the labor force grew 421,000. The participation rate rose a tenth to 61.9% and the employment-to-population ratio to 59.3%. Employment among workers 55 and over rose 245,000 and among 16-to-24-year-olds 150,000, while prime-age employment rose 60,000. The number working part time for economic reasons rose 339,000 to 4.84 million, however, with the slack-work component up 356,000, and U-6 rose to 7.9% from 7.6%.
- Average hourly earnings rose 14 cents, or 0.4%, to $38.00 and are up 3.1% over the past year, from 3.0% in September. Production and nonsupervisory pay rose 12 cents to $32.75. The workweek held at 34.4 hours for a fifth month, the index of aggregate weekly hours rose 0.1% after 0.4% and 0.1% in August and September, and aggregate weekly payrolls rose 0.5%. The production-worker factory week eased a tenth to 41.8 hours with overtime back up to 4.1.
- Layoffs are still low, with initial claims at 189,000 in the week ended October 31 and continuing claims at 1.72 million in the week ended October 24, the lowest since the spring. Job losers fell 34,000 to 3.17 million.
- Measured against a breakeven of zero to 50,000 a month, October’s hiring ran well ahead of the 62,000 fourth-quarter average in our November 1 forecast. Futures had cut the odds of a December 9 increase to about 67% from 83% during this week’s equity selloff, and the report moved them back to roughly 75%. The 2-year yield rose to about 4.50% and the 10-year rose about 6 basis points to just above 4.90% after the release, leaving the 2s-10s spread near 40 basis points. The strong third-quarter productivity numbers suggest the Fed only needs to make some minor adjustments to interest rates, even with the recent run of stronger job gains, and the quarter-point steps we carry for December and March are minor adjustments.
The Trend Was Higher All Along
October’s employment report ran roughly three times the consensus, and the revisions add an exclamation point to that headline. Nonfarm payrolls rose 165,000 against a consensus near 55,000, and August and September were revised up a combined 84,000, with September’s first print of 29,000 now a gain of 60,000 and August’s 133,000 now 186,000. The three-month average now stands at 137,000, from 51,000 a month ago, and the twelve-month average at 48,000 through September, the window BLS uses. Private payrolls added 159,000 and government 6,000, with federal payrolls down 1,000 and state government up 8,000. A month ago the question was whether hiring had stalled. The revised data say it never did. The summer’s weakness was shallower than first reported and the fall’s hiring stronger.
The bar this print had to clear was zero to 50,000 a month, and October cleared it by more than 100,000. The preliminary benchmark revision published August 28 took March 2026 payrolls down 79,000, and applied to the published data it put the underlying pace of hiring over the revision year between 11,000 and 16,000 jobs a month. We put breakeven payroll growth, the pace that holds the unemployment rate steady, at zero to 50,000 a month this past year, and expect it to edge slightly higher to around 80,000 a month in 2027 as immigration enforcement eases somewhat and workers with legal work status return to the labor market. A three-month average of 137,000 on that bar means the labor market has tightened, and the unemployment rate slipped back to 4.1%, as the arithmetic says it should. The benchmark itself does not enter the published series until February.
Hiring breadth widened, with the private diffusion index at 57.6, the number we said on October 2 would decide how to read the headline. The one-month diffusion index for private industries rose to 57.6 from 54.2 in September, which was itself revised up from the sub-50 reading first reported, and the manufacturing index jumped to 62.5 from 51.4. Health care added 41,600 against a twelve-month average near 33,000, so it carried about a quarter of the month’s gain, and hiring outside health care, the part that responds to demand, widened to professional services, consulting, delivery, retail and factories. At 57.6, the index says nearly six of every ten private industries added workers in October.
Where the Month Was Made
Professional & business services added 70,000 jobs, its largest gain since early 2022, and the unadjusted data say it was hiring and not the factors. Unadjusted, the sector added 281,000 workers from September to October, nearly double last year’s 155,000 and ahead of 95,000 in 2024 and 146,000 in 2023, so October’s hiring round ran well ahead of a normal fall. Professional, scientific & technical services added 32,900, management and technical consulting 17,300 and temporary help services 18,600, its largest gain of the year. Computer systems design, which had been shedding workers since the summer, added 3,200. A 70,000 gain will likely not repeat, but a sector that had lost 9,000 jobs in September and now shows a 281,000 unadjusted fall hiring round is not one that has stopped hiring white-collar workers.
The summer’s calendar distortions have washed out of leisure & hospitality, and the industry gave back 13,000 jobs. Before seasonal adjustment the industry shed 150,000 workers between September and October, against 106,000 last year, 146,000 in 2024 and 98,000 in 2023, so the end-of-season exit ran a little larger than usual and the factors turned it into a modest decline. Food services & drinking places lost 7,200 seasonally adjusted, accommodation 3,400 and arts, entertainment & recreation 2,600. Over the three months since July the industry has added 42,000 jobs, close to its underlying pace and the figure we would carry. Local government education added 4,800 after its August and September swings and is 5,900 smaller than in September 2025 on an adjusted basis.
Transportation & warehousing, retail and health care added 24,800, 6,000 and 41,600, and the tech-centric weakness paused. Transportation & warehousing added 24,800, with couriers and messengers up 17,400 as holiday delivery hiring arrived, and general merchandise retailers added 18,300 within a 6,000 gain for retail. Health care added 41,600, with ambulatory care up 19,400 and hospitals 16,000, and social assistance added 13,500. Information lost 1,000 after losing 21,000 in August and 11,000 in September, with computing infrastructure and data processing unchanged and publishing down 4,100, and financial activities added 7,000 after three months of declines, though insurance carriers lost another 5,500 and the sector is still 122,000 below its May 2025 peak.
The Factory Sector
Manufacturing payrolls rose 19,000 in October after gains of 21,000 in August and 13,000 in September, both revised up, and are roughly 100,000 above December’s low. Durable goods added 25,000 and nondurables lost 6,000. Computer & electronic products added 6,700, fabricated metals 5,900, motor vehicles & parts 4,100 and machinery 3,900, with transportation equipment up 3,800 in total, so the balance in aerospace and other transportation equipment slipped. The one-month manufacturing diffusion index jumped to 62.5 from 51.4, so roughly six of every ten factory industries added workers, the breadth we have been tracking since the summer and the widest reading since August.
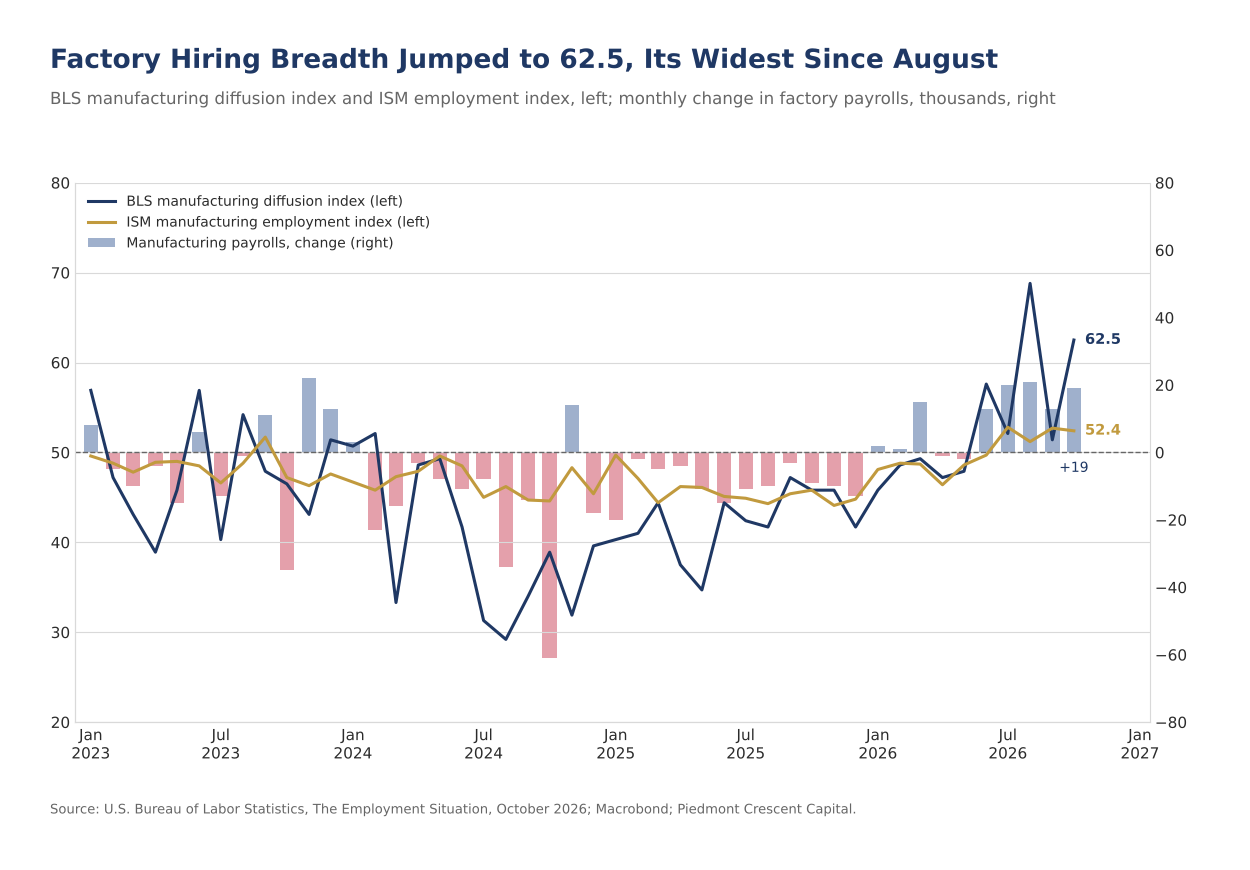
The ISM employment index printed 52.4 in October, against the 50.3 threshold ISM associates with rising factory payrolls, and new orders held at 55.5, so the survey pointed to a small gain and the payroll data delivered a larger and broader one. Hiring follows orders with a lag of several months, so an order book still in the mid-50s points to further hiring into the first quarter. The factory workweek for production workers eased a tenth to 41.8 hours from 41.9, with overtime back up to 4.1 hours, so firms are still stretching hours ahead of adding workers, and the all-employee factory week held at 40.5. Manufacturing strengthening through 2027 on low inventories and capital spending is the house view, with our forecast carrying factory output growth of 2.9% next year, and this week’s ISM report put production at 59.0, its highest since November 2021. October’s payroll data support that view.
Construction lost 3,000 jobs, and the split inside the number is the same one the data have shown all year. Residential specialty trades shed 15,200 and are 35,800 below a year ago, and residential building lost 1,200, while nonresidential specialty trades added 7,900, nonresidential building 2,900 and heavy & civil engineering 2,500. Over the past year the nonresidential side of construction has added roughly 165,000 jobs while the residential side has lost 40,000. The data center and power buildout and factory projects are driving hiring in these categories. Residential investment is forecast to subtract through the fourth quarter and at least into the first half of next year, with the 30-year mortgage rate above 7% and September housing starts at 1.221 million, so this split should persist.
The Labor Force Is Still the Story
The unemployment rate slipped to 4.1% from 4.2%, and the household survey agreed with the payroll count. Household employment rose 463,000 and the labor force grew 421,000, and the rate fell on flows in the right direction. The number of people not in the labor force fell 293,000. The rate has held between 4.1% and 4.3% since March, and with the October 2025 household data never collected because of last year’s shutdown there is no year-over-year comparison for the household series this month, so we would read the rate against its own range. Household components are rounded independently, so the pieces do not sum exactly.
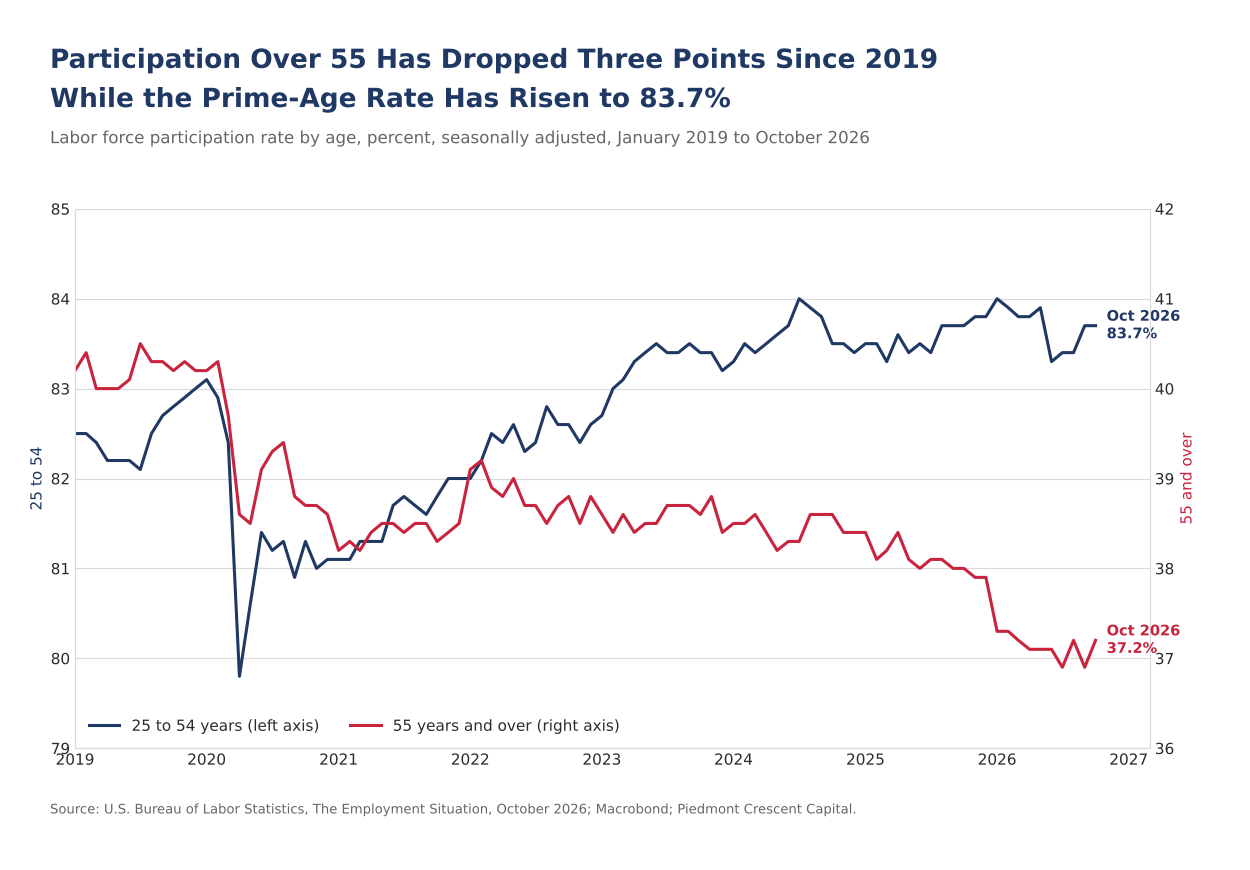
The participation rate rose a tenth to 61.9%, and the age split still points to older workers coming and going rather than to discouragement. Employment among workers 55 and over rose 245,000 in October after a 60,000 decline in September, employment among 16-to-24-year-olds rose 150,000, and prime-age employment rose 60,000. The participation rate for workers 55 and over rose to 37.2% from 36.9%, and the prime-age rate held at 83.7%, so the month’s gain in participation came from the older cohort. Peak 65 moves roughly 4.1 million people a year past 65 through 2027, and a cohort with a participation rate of 37.2% keeps taking a larger share of the adult population from a prime-age cohort at 83.7%, so the aggregate rate moves with that cohort’s comings and goings. The foreign-born participation rate was 66.5% in October with an unemployment rate of 3.2%, both unadjusted, against 66.4% and 4.4% in August of last year.
The broader measures cut against the headline this month, with U-6 up to 7.9% from 7.6% as the number working part time for economic reasons rose 339,000 to 4.84 million, with the slack work or business conditions component up 356,000 and the other reasons down, and the number marginally attached to the labor force rose 171,000. The long-term unemployed were 1.96 million, or 27.6% of the unemployed. Multiple jobholders fell back to 8.8 million. Continuing claims cover roughly one unemployed worker in four, so the 4.1% rate carries less information than it used to, and we continue to read these measures beside it. A rise in involuntary part-time work in a month of strong hiring is the soft spot in the household survey, and we would want to see it reverse in November before reading much into it.
Wages, Hours and the Fed
Wage growth firmed to 0.4% in October, and the workweek held at 34.4 hours. Average hourly earnings rose 14 cents, or 0.4%, to $38.00, 3.1% over the past year after 3.0% in September and 3.1% in August, and production and nonsupervisory pay rose 12 cents, or 0.4%, to $32.75. With nonfarm business productivity up 2.1% over the year through the third quarter, and 3.6% at an annual rate in the quarter itself, hourly earnings growth of 3.1% leaves labor costs per unit of output rising near 1%, and unit labor costs are what firms pass through to prices. Against the PCE price index at 3.6% and core PCE at 3.1% in September, real wages are still falling, the sixth month in which pay has risen more slowly than prices and the reason we told treasurers last week to budget wages for retention. The workweek held at 34.4 hours for a fifth month, the index of aggregate weekly hours rose 0.1% and aggregate weekly payrolls 0.5%. October hours sit 0.3% above the third-quarter average, and our GDP proxy, hours growth plus productivity, puts fourth-quarter output tracking near 3%, in line with the 3.1% in our forecast.
The report landed nine days after a Committee that held 10 to 2 and called the pause observational, and a week after the Nasdaq entered a correction. Chairman Warsh declined to pre-commit to December, described the weeks ahead as data-rich, and said financial conditions are tighter but not tight, while Governor Cook and President Hammack dissented in favor of a quarter-point increase. The statement upgraded activity from solid to strong and kept the line that inflation remains elevated. Futures had cut the odds of a December 9 increase to about 67% from 83% during this week’s equity selloff, and within half an hour of the release they stood near 75%. The 2-year yield rose to about 4.50% and the 10-year rose about 6 basis points to just above 4.90%, back near its 4.92% close on October 30, leaving the 2s-10s spread near 40 basis points. The hawks have the headline, the revisions and the 0.4% wage gain, and the doves have U-6 and involuntary part-time work, a thinner case. The bond market has been pricing a growth scare that the data have not delivered, and this report clearly does not give it one. Third-quarter GDP grew 3.4% at an annual rate with real final sales to private domestic purchasers up 4.9%, and the September CPI showed the core measures we follow accelerating, which told us the Committee has more work to do. The October CPI on November 10 matters for December as well, but this report has removed any hesitation to hold off over labor-market concerns.
Our Call · December Is the Base Case, and March Follows
Yields rose after the release and the odds of a December increase moved back to roughly 75%. Payrolls rose 165,000 in October against a breakeven we put at zero to 50,000 a month, edging higher in 2027, and with the prior two months revised up 84,000 the three-month average is 137,000. The unemployment rate slipped to 4.1% on a labor force that grew 421,000. A labor market that adds jobs at nearly three times the top of its breakeven range for three months is a labor market that has tightened, and the rise in involuntary part-time work is the only soft note in the report. Nothing here changes our forecast.
We continue to look for a quarter-point increase on December 9, to 4.00% to 4.25%, a hold in January and a second quarter-point increase in March, to 4.25% to 4.50%, with June a toss-up. Two more hikes appear assured to us, and one or two additional increases may prove necessary depending on how resilient the economy and financial markets prove to be and how quickly the recent acceleration in inflation can be arrested. Our November 1 forecast carries payroll growth averaging 62,000 a month in the fourth quarter, 67,000 for 2026 and 76,000 for 2027, an unemployment rate of 4.2% this year and 4.0% next, the 10-year at 5.10% at year-end and 4.80% at the end of 2027 and fourth-quarter growth of 3.1%. October leaves the fourth-quarter payroll figure looking low. We set the test for this report on October 2: payrolls between 20,000 and 80,000 with the private diffusion index back above 50 keep the December call on track, and a negative print with the index still below 50 would weaken it. October printed 165,000 with the index at 57.6, so the test is met with room to spare. We also said a print above 100,000 would argue that breakeven job growth is higher than the zero to 50,000 we are using and would support an earlier second hike. We are holding the breakeven range for now, and the risk to our path is that the second increase comes in January, ahead of the March meeting we carry. The condition that would move us is on the inflation side: core services outside of shelter and the core measures we follow continuing to run above a pace consistent with 2%, and the first of those readings arrives with the October CPI on November 10.
Mark P. Vitner – Chief Economist, Piedmont Crescent Capital
mark.vitner@piedmontcrescentcapital.com · (704) 458-4000
Sources: U.S. Bureau of Labor Statistics, The Employment Situation, October 2026, Current Employment Statistics preliminary benchmark revision, Productivity and Costs; U.S. Department of Labor, Unemployment Insurance Weekly Claims; Institute for Supply Management; U.S. Bureau of Economic Analysis; Board of Governors of the Federal Reserve System, FOMC statement and press conference, October 28, 2026; CME Group. Disclaimer: This report is provided for informational purposes only and does not constitute investment, legal, tax, or accounting advice, nor an offer or solicitation to buy or sell any security. Information is drawn from sources believed to be reliable, but its accuracy and completeness are not guaranteed. Views expressed are those of the author as of the date of publication and are subject to change without notice. Past performance is not indicative of future results.