
Consumer Confidence Report: Confidence Rebounds to 91.7
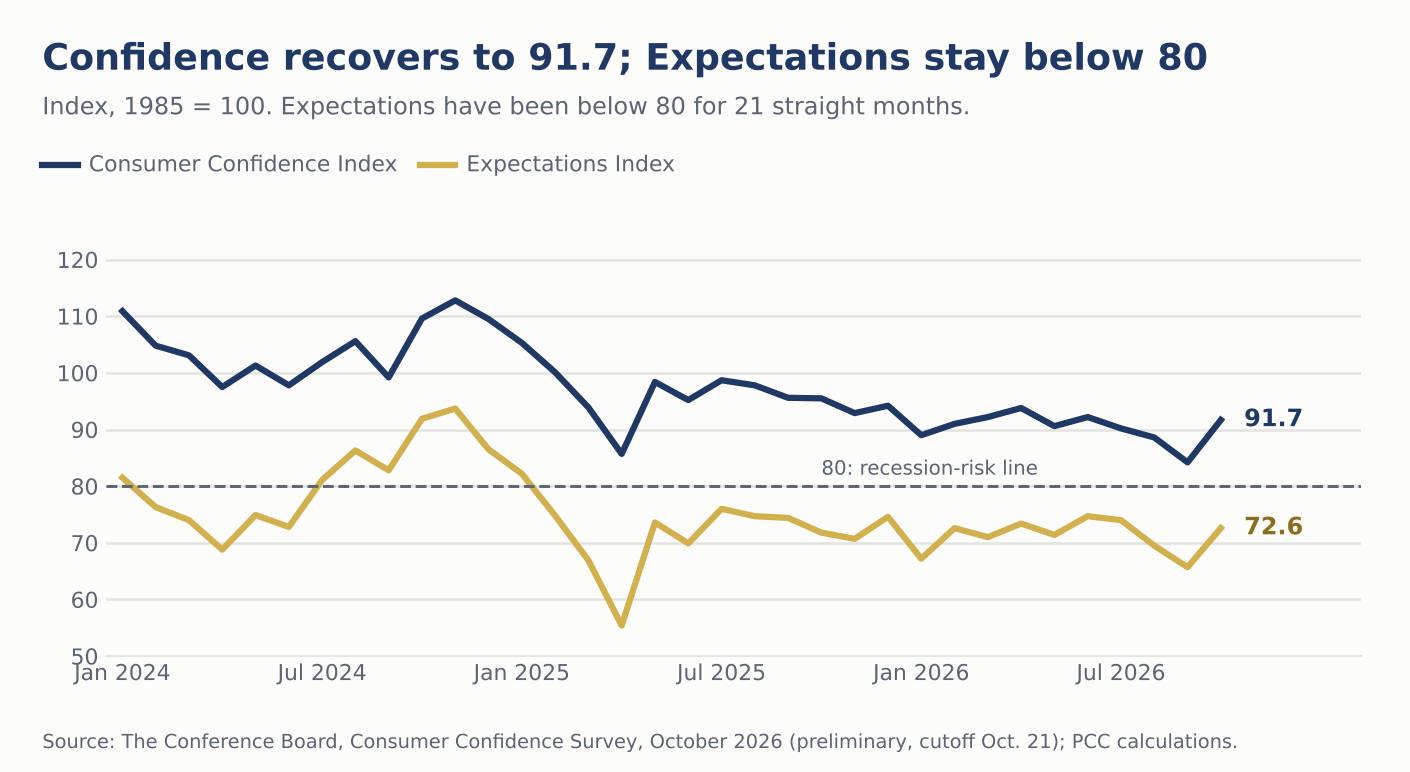
The Conference Board index rose 7.5 points to 91.7, its highest since June, as fewer households gave unfavorable answers and the labor differential recovered.
Early Signals
- Confidence rose 7.5 points to 91.7. The index was 84.2 in September, revised up 2.3 points from the preliminary 81.9. October is the highest reading since June.
- Both sub-indexes rose, to 120.4 and 72.6. The Present Situation Index gained 8.6 points and the Expectations Index gained 6.9 points, which partly reverses three straight declines. Expectations has been below 80 for 21 months.
- Current business conditions turned net positive, at +3.6%. The net balance rose 4.8 points from -1.2% as the share of households calling conditions bad fell to 17.8% from 20.0%.
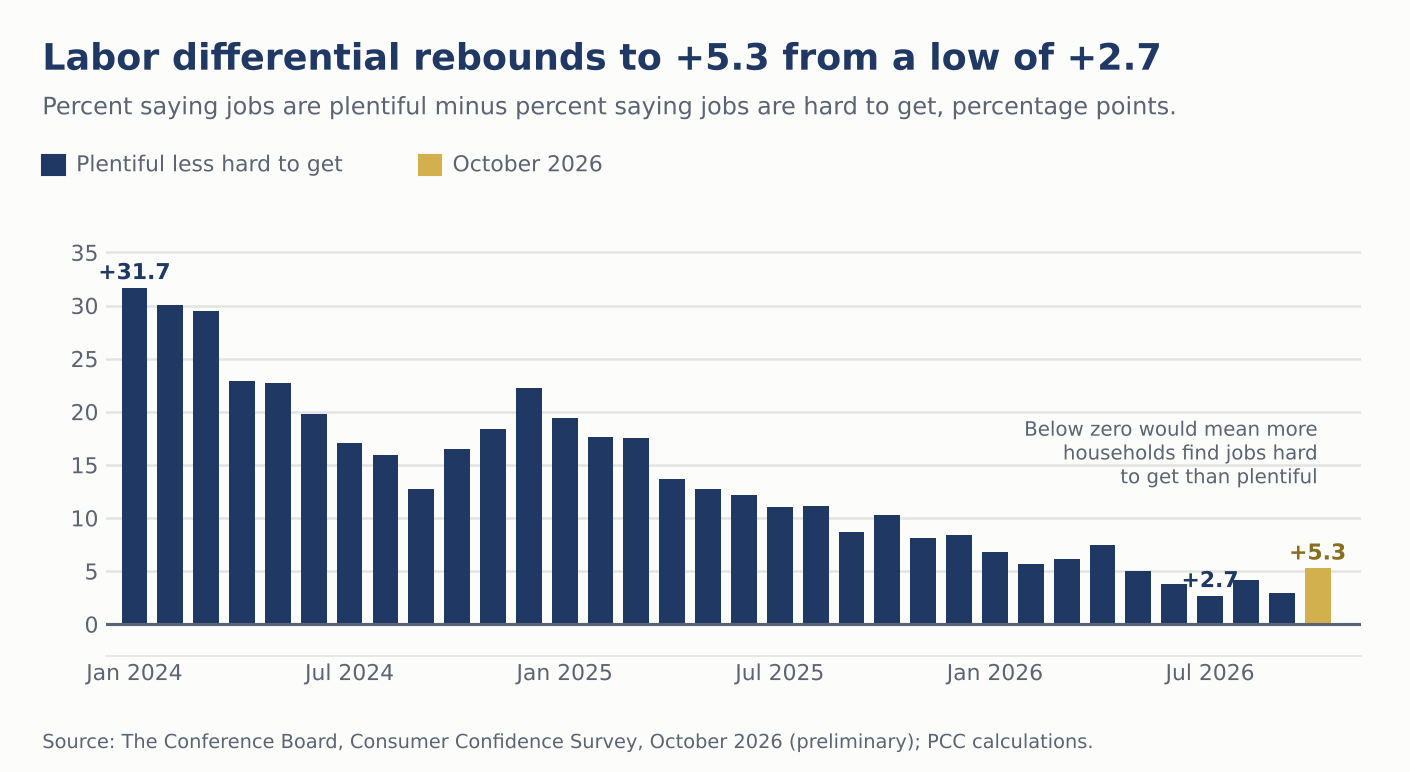
- The labor market differential recovered to +5.3%, from +2.9%. It stayed above zero, the line we set in September for keeping our consumer spending forecast. The low since early 2024 was +2.7% in July.
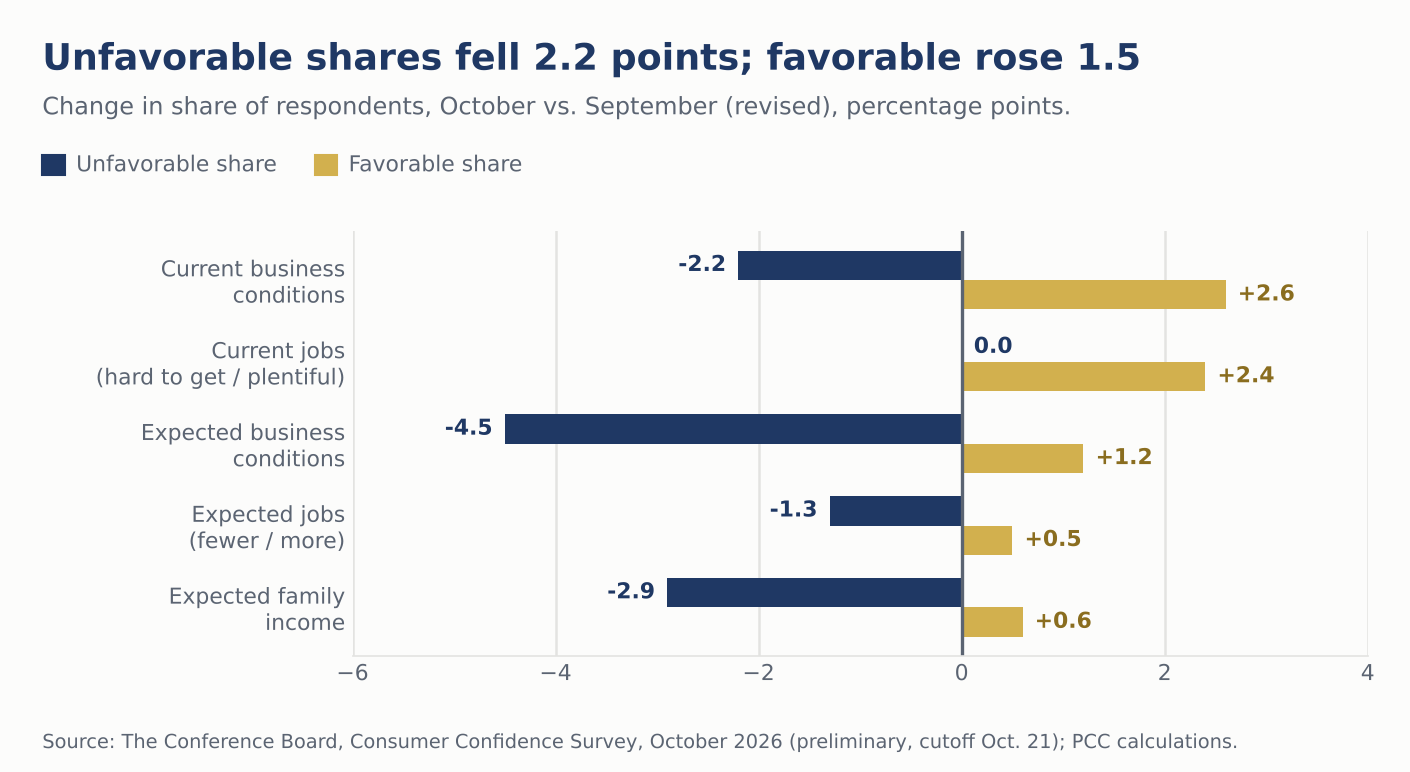
- Unfavorable answers fell in four of five components and held in the fifth. The unfavorable share fell 2.2 points on average and the favorable share rose 1.5 points.
- Inflation expectations eased to 5.8%. The average 12-month expectation was 6.0% in September, and households still expect higher interest rates over the next year.
- The index is 11.7 points above 80. Our research shows that a reading below 80 has typically preceded outsized midterm losses for the incumbent party, which is one rare piece of good news for Republicans this year. The next report arrives after the November 3 election.
Overview
The Conference Board's Consumer Confidence Index rose 7.5 points to 91.7 in October, from 84.2 in September. The Present Situation Index rose 8.6 points to 120.4 and the Expectations Index rose 6.9 points to 72.6. September was revised up from the 81.9 we reported, so households surveyed after the September 23 cutoff were more positive than the preliminary sample.
A quick reminder about what these numbers measure. Every component is built from the share of households giving a favorable, unfavorable or neutral answer, so the index reports breadth and not intensity, and we reserve words like growth and spending for the hard data. The rebound recovered most of September's decline, but the index is still 3.8 points below a year ago.
The Present Situation
Current business conditions turned net positive again. The share calling conditions good rose to 21.4% from 18.8% and the share calling them bad fell to 17.8% from 20.0%. The net balance rose 4.8 points to +3.6%, reversing September's move into negative territory, the first since September 2024.
The labor market differential recovered to +5.3%, from +2.9% in September (revised from +1.7%). Households saying jobs are plentiful rose to 26.7% from 24.3%, and the share saying jobs are hard to get was unchanged at 21.4%. The series is well below the +10.3% of a year ago and only 2.6 points above the July low (Chart 2), which fits the stable but modest hiring outlook we described in the October 26 A View from the Piedmont.
Expectations
Households are less pessimistic about the next six months, but the Expectations Index at 72.6 is still 7.4 points below 80. All three components improved. The net balance for business conditions rose 5.7 points to -3.0%, with 17.7% expecting conditions to improve (from 16.5%) and 20.7% expecting them to worsen (from 25.2%). The net balance for jobs rose 1.8 points to -11.1%, with 15.2% expecting more jobs and 26.3% expecting fewer. Income is the only expectations component with a positive balance, and it rose 3.5 points to +6.7%, with 18.7% expecting their income to rise and 12.0% expecting it to fall.
The shares show where the rebound came from. In four of the five components the larger part of the move was fewer households giving an unfavorable answer. Unfavorable shares fell by an average of 2.2 points, while favorable shares rose by an average of 1.5 points (Chart 3). The one exception is current jobs, where the share saying jobs are hard to get did not change and the gain came from more households saying jobs are plentiful. The pattern is the reverse of September, when unfavorable shares rose by an average of 2.2 points and favorable shares fell by 0.8 point.
Prices, Rates and Family Finances
Prices still dominate what households write in. The Conference Board reports that references to prices, the high cost of food and groceries and oil and diesel prices all rose in October. Diesel, at $6.28 a gallon, has held between $6.18 and $6.53 for six weeks. Comments about war and conflict eased for a second straight month but remain elevated, and mentions of jobs and employment ticked up, though by less.
The Conference Board links the rebound to easing gasoline prices. The EIA weekly readings support the direction. Regular gasoline rose to a peak of $4.478 in the week of September 21 and eased to $4.269 by October 26, although the day-weighted average was higher over the October survey window ($4.36) than over September's ($4.23). Households answered in October while prices were falling and in September while they were rising.
Inflation expectations eased. The average 12-month expectation fell to 5.8%, from 6.0% in September (revised) and 6.1% in the preliminary report. That puts it inside the 5.4% to 6.2% range of the past 14 months. Households still expect higher interest rates over the next 12 months, which is consistent with a Fed that raised rates on September 16 and meets today. We expect a hold on October 28 and a second quarter-point increase on December 9, with the 30-year mortgage rate at 7.32% in the week ended October 22, the first decline in nine weeks. More households also expect stock prices to rise than to fall over the next year.
Family finances improved. Consumers felt better about their family's current financial situation after two weak months, and their view of their family's financial situation six months ahead stayed optimistic. Asked about the likelihood of a recession in the next 12 months, "somewhat likely" remained the most common answer. These series sit outside the index, and they moved the same way as the components inside it.
The 80 line matters for the November 3 midterms. Our research shows that a headline Consumer Confidence reading below 80 has typically preceded outsized losses for the incumbent party, which fits our framework of reading midterms through real after-tax per capita income growth. At 91.7, October's reading is 11.7 points above the line, so this marker is not flashing a warning, though the index is still below its level of a year ago.
The University of Michigan's final October sentiment index was 48.0, far below the Conference Board's 91.7, but the two levels are not comparable. They use different questions, base periods and samples, with the Conference Board's built from business conditions and jobs and Michigan's from personal finances and buying conditions.
Spending Plans and Who Is Feeling It
Spending plans softened even as sentiment improved. On a six-month moving average basis, plans to purchase autos and homes both declined slightly, and planned spending on durable goods fell across the board. Expected purchases of electronics such as smartphones, computers and tablets fell by more than 1%. Expected spending on services was generally lower, except for movies, theater, live entertainment and sporting events. The top five services categories were restaurants, bars and take-out; streaming, internet and mobile services; utilities; health care; and beauty and personal care, which fell from third to fifth. Plans for hotels and airfare moderated, and 43.3% of households plan a vacation in the next six months, down from an upwardly revised 44.2% in September. The Conference Board attributes the pullback to higher price levels and persistent inflation eroding purchasing power.
The divide between groups widened. On a six-month moving average basis, only households under age 35 and households with income of $100,000 or more reported an increase in confidence. Generation X, Baby Boomers and the Silent Generation continued to trail Generation Z and Millennials by a wide margin, extending a generational gap that has emerged over the past two years. It fits the K-shaped split we describe in A View from the Piedmont, between higher-income and younger households and the rest. In October confidence improved across all political affiliations, but much more for Republicans.
Our Call
October's rebound looks like relief as fuel prices eased and not a change in the spending outlook. The labor market differential held above zero at +5.3%, which was the condition we set in September for keeping our consumer spending forecast, and the October flash composite PMI of 57.6 is near its five-year high. We hold our forecast for real consumer spending growth of 2.5% in 2026 and 2.0% in 2027 (October 16 vintage), and we leave the Fed call unchanged: a hold at the October 27-28 meeting, a second quarter-point increase on December 9 to 4.00%-4.25% and at least one more in 2027.
We will watch the next few reports. We will closely watch the releases over the next few months to see whether confidence holds the rebound or gives it back. Right now we are holding our forecast. If the labor market differential falls back to its July low of +2.7% or below, or the headline index returns to the low 80s, we will take our consumer spending forecast lower. If the index stays near 90 and the differential stays above +5%, we keep the forecast where it is. We will revisit the full forecast after Thursday's GDP release.
Bottom Line
Confidence rebounded sharply in October as fewer households gave unfavorable answers, and the labor market differential recovered from its July low. The rebound reverses most of September's decline. The index is still below its level of a year ago, expectations have been below 80 for 21 months, and spending plans for durable goods and most services softened. The hard data on spending will show whether households act on the improvement. Our forecasts for consumer spending and the Fed path stand, and the November 24 report will show whether the rebound lasts.
What We Are Watching
- Labor market differential: the +5.3% reading is 2.6 points above the July low of +2.7%. A return to that low or below on November 24 would change our consumer spending forecast.
- Fuel prices: gasoline was $4.269 on October 26, 4.7% below its September 21 peak, and diesel was $6.276 on October 19. A renewed rise would test the rebound.
- Thursday's GDP and PCE reports: third-quarter GDP has a consensus of 3.0% against 3.4% in our forecast, the Atlanta Fed GDPNow estimate is now 3.4% following today's releases, and core PCE has a consensus of +0.3% on the month and 3.1% on the year. Both will show whether spending followed the mood.
- The November 24 report: the next reading comes three weeks after the November 3 election and two weeks after the October CPI on November 10.
Mark P. Vitner – Chief Economist, Piedmont Crescent Capital
mark.vitner@piedmontcrescentcapital.com · (704) 458-4000
Sources: The Conference Board, Consumer Confidence Survey, October 2026 (preliminary results, cutoff October 21, conducted by Toluna) and September 2026 (revised); University of Michigan, Surveys of Consumers, final October 2026; U.S. Energy Information Administration, weekly retail gasoline and diesel prices (FRED, GASREGW); Freddie Mac, Primary Mortgage Market Survey, week ended October 22; S&P Global, flash U.S. PMI, October 2026; Piedmont Crescent Capital, A View from the Piedmont, October 26, 2026, and forecast vintage of October 16, 2026.
Disclaimer: This report is provided for informational purposes only and does not constitute investment, legal, tax, or accounting advice, nor an offer or solicitation to buy or sell any security. Information is drawn from sources believed to be reliable, including The Conference Board, the University of Michigan, the U.S. Energy Information Administration and Freddie Mac, but its accuracy and completeness are not guaranteed. Views expressed are those of the author as of the date of publication and are subject to change without notice. Past performance is not indicative of future results.