
New Home Sales Report: September Held Up Before Rates Rose
Sales of 676,000 beat our third-quarter forecast, but they were signed before the mortgage rate averaged 7.35% in October, and unstarted homes for sale are rising.
Early Signals
- New home sales were 676,000 in September. Sales were 0.6% below August's revised 680,000 and 5.3% below September 2025. Neither change is statistically significant, as the confidence interval in new home sales is extremely wide and revisions are often quite large.
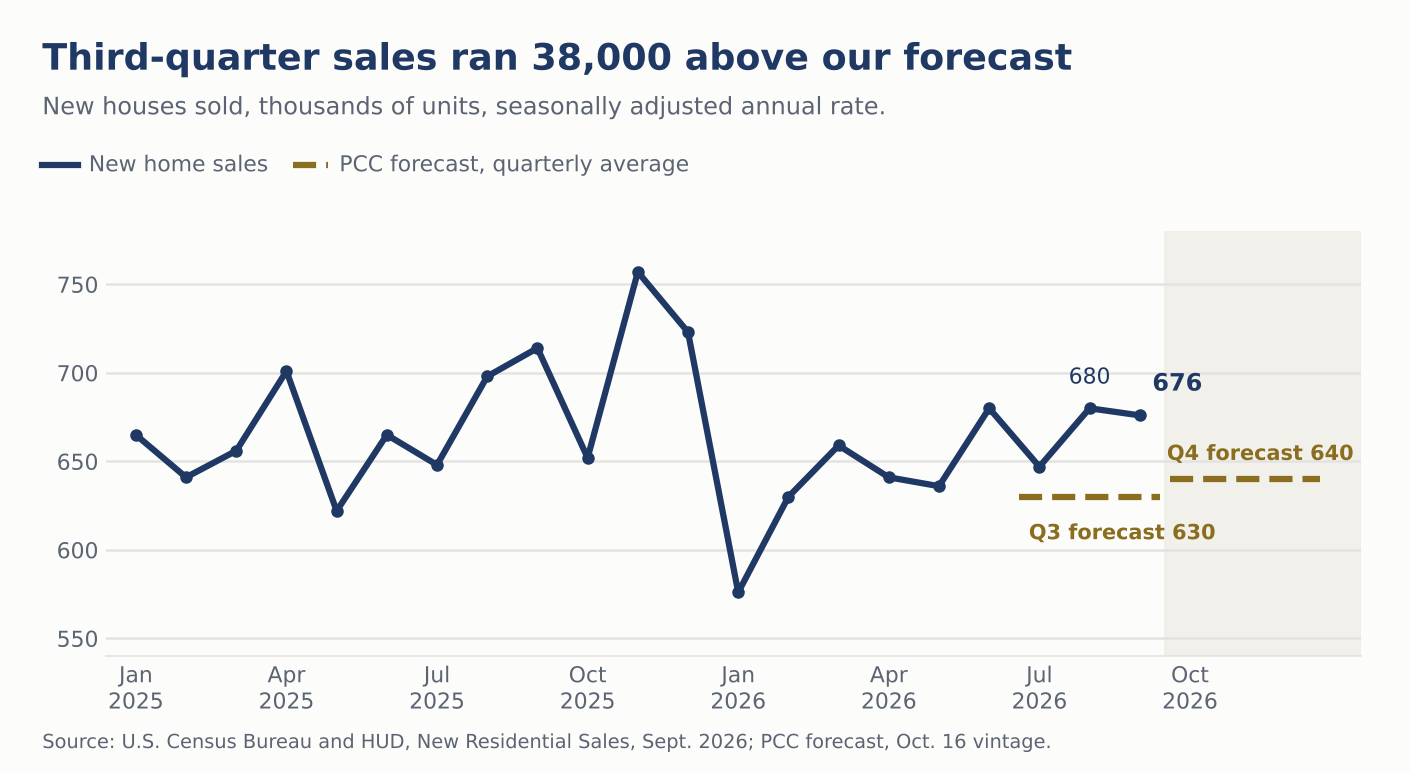
- Third-quarter sales averaged 668,000, 38,000 above the 630,000 in our previous forecast. The last four months average 671,000, against 642,000 for the four months before them.
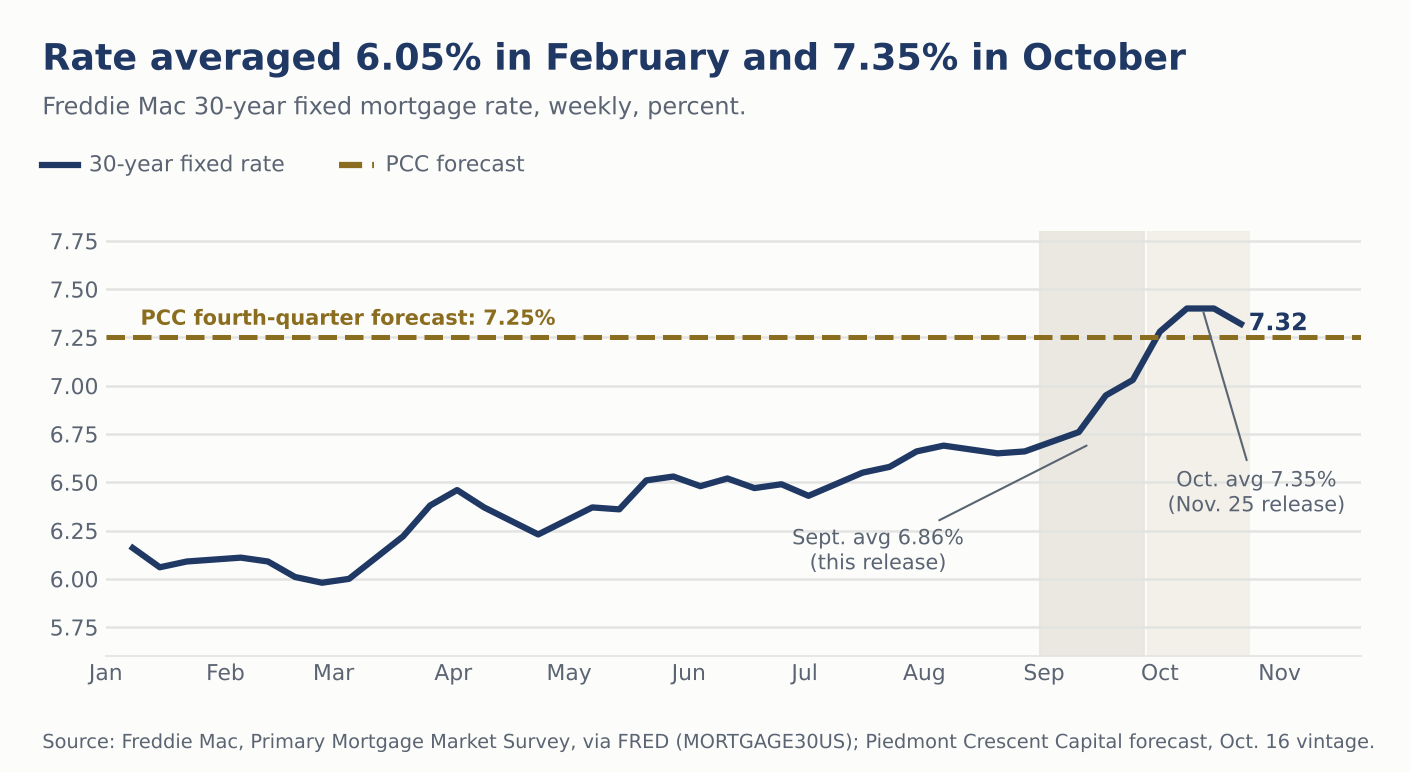
- The sales were signed before the mortgage rate rose 49 basis points. The 30-year mortgage rate averaged 6.86% in September and 7.35% in October, and Census counts a sale when a deposit is taken or an agreement is signed. October and November will show whether buyers followed through on those purchase agreements.
- Homes not yet started are 115,000 of the 476,000 for sale, the most since at least 2019. Completed homes for sale fell to 111,000, 9.0% below a year ago.
- Total months' supply is 8.4, against about 5.8 in 2019. The bulk of the excess sits in homes that are not yet finished.
Overview
Sales of new single-family houses were 676,000 at a seasonally adjusted annual rate in September, 0.6% below August's revised 680,000 and 5.3% below the September 2025 rate of 714,000. Census cautions that it takes four months to establish a trend for new houses sold, and on that yardstick sales are trending higher, with the last four months averaging 671,000 against 642,000 for February through May.
A sale in this survey is a deposit taken or a sales agreement signed, so the September count reflects decisions made mostly before the rate move. The preliminary figure is revised by 6.7% on average, and August was revised to 680,000 from 684,000. Only two of the ten changes in Table 1 are statistically significant.
| Measure | Sept. 2026 | Aug. 2026 (r) | Sept. 2025 | Month | Year |
|---|---|---|---|---|---|
| Houses sold (thousands, SAAR) | 676 | 680 | 714 | -0.6% | -5.3% |
| Houses for sale (thousands) | 476 | 481 | 487 | -1.0%* | -2.3% |
| Months' supply | 8.4 | 8.5 | 8.2 | -1.2% | +2.4% |
| Median sales price | $400,400 | $385,400 | $416,800 | +3.9% | -3.9% |
| Average sales price | $472,800 | $470,800 | $506,800 | +0.4% | -6.7%* |
Table 1. New residential sales. An asterisk marks a change that is significant at the 90% level. (r) is revised.
Our forecast carried 630,000 for the third quarter, the level we named in the October 26 A View from the Piedmont as the one below which the housing downgrade case would strengthen. The quarter averaged 668,000 on revised prior data (Chart 1). The first two quarters landed at 622,000 and 650,000 homes. We might slightly increase our Q4 forecast to reflect the current higher base level of sales.
Rates and Affordability
The 30-year mortgage rate has risen every month since February, from 6.05% to 6.86% in September and 7.35% in October (Chart 2). The rate fell to 7.32% in the week ended October 22, the first decline in nine weeks, which is still above the 7.25% we are projecting for the end of the fourth quarter. Sales held between 636,000 and 680,000 through that climb because builders used price and incentives to offset the rising interest rates.
That offset is only partial. We estimate the principal and interest payment on the median new house with 20% down at $2,075 a month in September 2025, when the median price was $416,800 and the rate averaged 6.35%. At September's median of $400,400 and rate of 6.86% the payment is $2,101, and at October's 7.35% average it is $2,207, which is 6.4% above a year ago even with a median price that is 3.9% lower. Lower prices have offset about two-fifths of the rate increase. The median price is not a like-for-like comparison, because the mix of houses sold changes.
The price data show a market that is selling less expensive houses. The median price was $400,400, up 3.9% from August's revised $385,400 and down 3.9% from a year ago, and neither move is statistically significant. The average price of $472,800 is down 6.7% from a year ago, which is significant. The distribution tilted lower, with 51% of September sales under $400,000, against 46% a year ago, and 4% at $1 million or more, against 6%. The survey's standard errors on those shares are three to four points, so we treat the shift as a tilt.
The forward indicators point the same way. The National Association of Realtors' pending home sales index fell 7.3% in September to 66.0, the lowest on record, and the NAHB/Wells Fargo Housing Market Index fell to 29 in October, with buyer traffic at 18. Those surveys cover a different corner of the market, but they describe the buyers who compete with new construction for the same households. September's new home sales do not yet show it, and October's report on November 25 is the first that should.
Inventory and the Pipeline
Houses for sale fell 1.0% to 476,000, which is statistically significant, and months' supply eased to 8.4 from 8.5. Builders still have a lot of homes in the pipeline, which is where the bulk of new home inventory sits today: 365,000 of the 476,000 houses for sale, or 77%, are not yet started or are still under construction. The mix has shifted as builders slowed construction amid weak buyer traffic. Homes for sale that have not been started rose 12% to 115,000, the highest since our data begin in 2019, from 103,000 a year ago, while completed homes fell 9% to 111,000, from 122,000. Homes under construction fell to 250,000, from 262,000 (Chart 3).
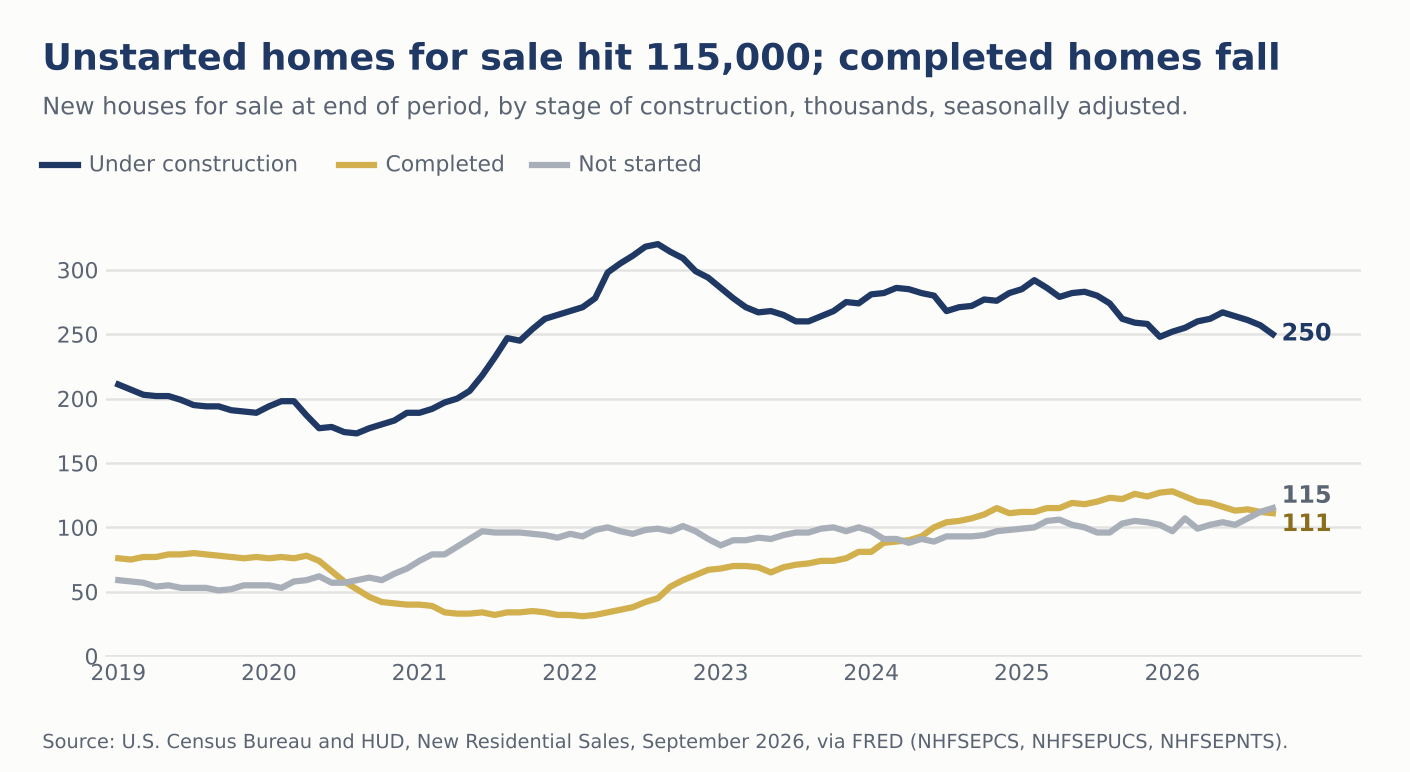
Measured against 2019, finished homes are back to normal. Completed homes for sale represent 3.5 months of completed-home sales, equal to the 2019 average, because builders now sell far more finished homes, 380,000 at an annual rate against about 265,000 in 2019. Total months' supply is 8.4, against about 5.8 in 2019, because the 365,000 homes that are unstarted or under construction have to be completed and sold into a market with a 7% mortgage rate. Unstarted homes are the part of supply builders can still cut quickly, and we will watch whether they pull it back or keep adding.
Regions
The regional monthly figures are noisy. Their average relative standard errors range from 10% in the South to 32% in the Northeast, which is why the West rose 21.4% in September and the Northeast 28.0% without either move being significant. Year to date, sales are 506,000 against 521,000 for the first nine months of 2025, a decline of 2.9% (±4.8%) that is also not statistically significant. The West is the weakest region at -9.2% (±13.4%), and the South, which accounts for 62% of sales, is down 1.3% (±5.0%).
Our Call
September gave us a stronger third quarter than we forecast, but not yet a reason to materially change the fourth. Third-quarter sales averaged 668,000 against 630,000 in our latest forecast, and the four-month trend is higher. Those sales were signed before the 30-year rate moved to 7.35%. We hold our 2027 forecast of 665,000 (October 16 vintage) and will revisit the fourth quarter in our forecast after the October 29 GDP release.
We hold the fourth quarter for now. We will closely watch the releases over the next two months to see whether sales take a step down. If October and November average below 620,000, we will lower the fourth quarter and revisit 2027, because that would indicate that the move to 7.35% is reaching contracts. If sales stay above 660,000 with the rate above 7%, we will take the fourth quarter up, because price and incentives would be holding demand. We will judge each month on its revised figure. Small misses at this level look large on a percentage basis, but new home sales are exceptionally low.
Bottom Line
September's new home sales were better than we expected, but they reflect agreements signed before the mortgage rate averaged 7.35% in October. Builders are cutting price, selling less expensive houses and slowing construction amid weak buyer traffic, so most of the inventory is still in the pipeline, and total months' supply stays well above its 2019 level even though finished homes are back to normal. The data that matter are the October and November reports, which are the first to fall inside the higher-rate regime. Our forecast stands.
What We Are Watching
- October new home sales, November 25: the first full month at a 7% mortgage rate. Below 620,000 on an October and November average would lower our fourth-quarter forecast, and above 660,000 would raise it.
- Mortgage rates: the 30-year rate was 7.32% on October 22, against our fourth-quarter forecast of 7.25%. A move toward 7.0% would support the fourth-quarter forecast, and a rate that stays above 7.25% would put it at risk.
- Unstarted inventory: 115,000 homes for sale have not been started. A further rise alongside falling completed inventory would mean builders are adding to supply they may have to discount.
- Thursday's GDP report: third-quarter GDP has a consensus of 3.0%, and the Atlanta Fed GDPNow estimate is now 3.4% following today's releases. Residential investment will show how the housing slowdown is feeding into growth.
Mark P. Vitner – Chief Economist, Piedmont Crescent Capital
mark.vitner@piedmontcrescentcapital.com · (704) 458-4000
Sources: U.S. Census Bureau and U.S. Department of Housing and Urban Development, New Residential Sales, September 2026 (released October 27, 2026), national and regional tables for sales, inventory by stage of construction and sales price, via FRED (NHFSEPCS, NHFSEPUCS, NHFSEPNTS); Freddie Mac, Primary Mortgage Market Survey, monthly averages and week ended October 22, via FRED (MORTGAGE30US); National Association of Realtors, Pending Home Sales Index, September 2026; National Association of Home Builders/Wells Fargo, Housing Market Index, October 2026; Piedmont Crescent Capital, A View from the Piedmont, October 26, 2026, and forecast vintage of October 16, 2026. Payment estimates are principal and interest on a 30-year loan with 20% down at the stated rate and median price.
Disclaimer: This report is provided for informational purposes only and does not constitute investment, legal, tax, or accounting advice, nor an offer or solicitation to buy or sell any security. Information is drawn from sources believed to be reliable, including the U.S. Census Bureau, the U.S. Department of Housing and Urban Development, Freddie Mac, the National Association of Realtors and the National Association of Home Builders, but its accuracy and completeness are not guaranteed. Views expressed are those of the author as of the date of publication and are subject to change without notice. Past performance is not indicative of future results.