
The Great Decoupling
The Piedmont Perspective | A Companion to A View from the Piedmont
The post-pandemic boom is giving way to an economy with a slower speed limit, a higher price of capital and divides that run well beyond asset owners and wage earners: AI against everything else, technology against the rest of the market, sectors that borrow against sectors that do not, and the young against the old. It is not going back to the 2010s or to the Great Moderation.
Our call at a glance
Our call. The 10-year Treasury, which closed at 5.00 percent on October 23, stays between 4.75 and 5.50 percent through the first quarter of 2027 (we put 50 percent on that range). The Fed pauses on October 28, raises the funds rate a quarter point to 4.00 to 4.25 percent on December 9 and again in March to 4.25 to 4.50 percent, with June on the fence, and the long end is set by supply and the price of capital, not by the funds rate. The economy is neither overheating nor breaking. It is splitting, and the split, not the average, determines who earns, who hires and who votes how.
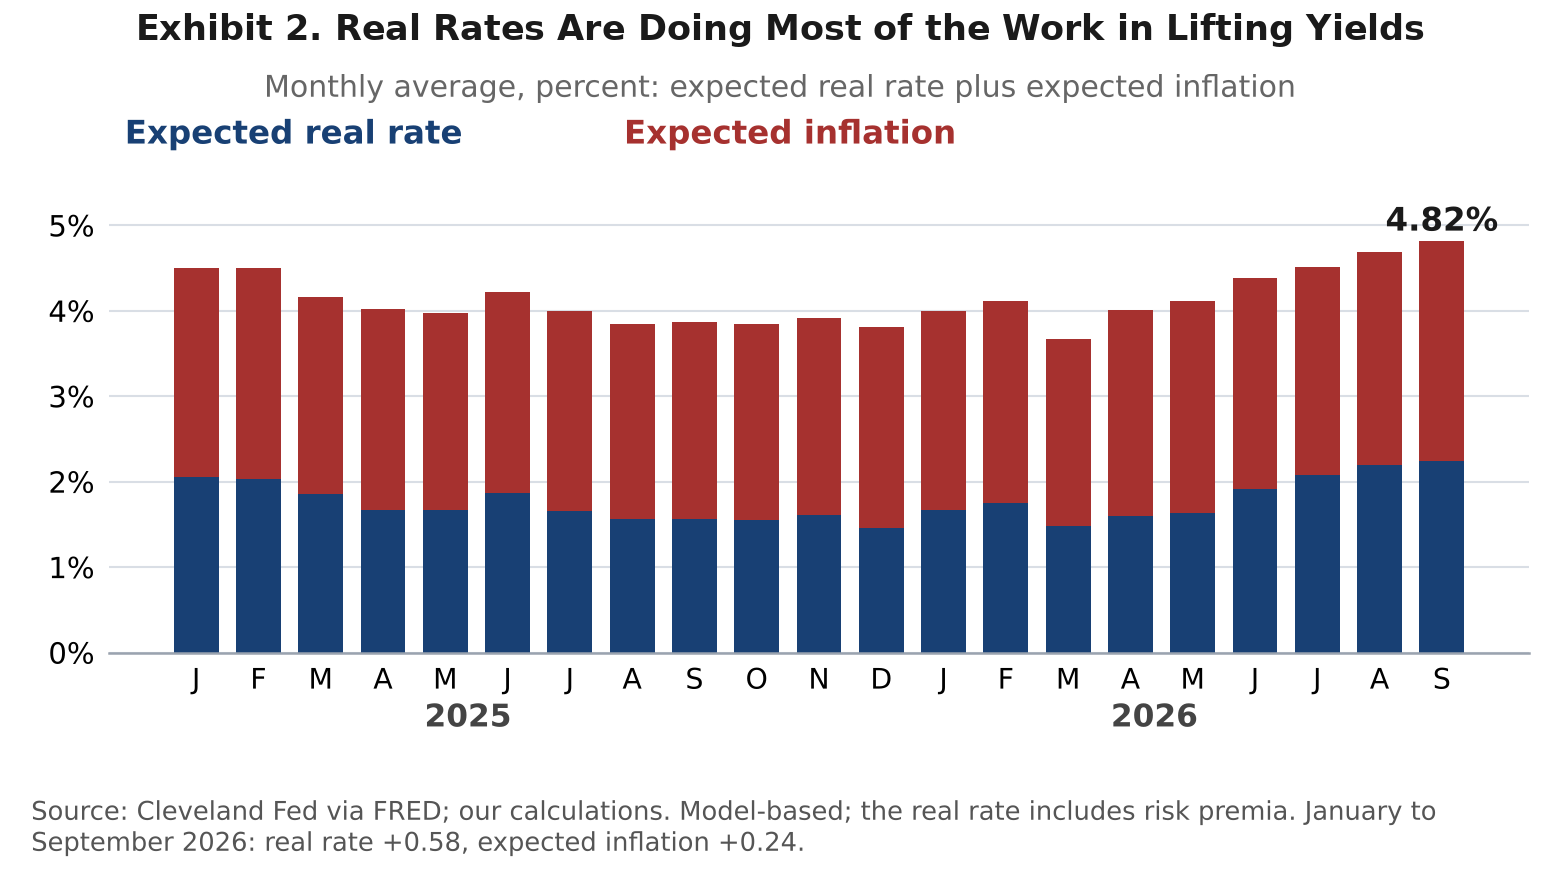
- The price of capital has reset. The model-based expected real 10-year yield is 2.2 percent, above every January reading since 2002, and about 71 percent of this year’s rise in the 10-year yield is real rate, not inflation expectations (Exhibits 2 and 3). Real yields now roughly equal real GDP growth, so the arithmetic of low-cost debt that held for the last 15 years has ended.
- The speed limit is lower, but the labor market is not weaker. Retirements and slower immigration have cut break-even job growth to between zero and about 50,000 a month. Payrolls near 41,000 are roughly balanced, and the strain falls on entry-level workers.
- The gains are going to capital. Workers’ share of national income is the lowest in our data, which start in 1980, and capital’s is the highest, while hourly pay trails productivity.
- The divide is wider than a K. The economy is splitting along six lines at once: capital against labor, high-income households against low-income ones, AI against everything else, technology against the rest of the stock market, sectors that borrow against sectors that do not, and the young against the old. Data center construction is up 73 percent from a year ago while private residential construction is down 5 percent and factory construction is down 20 percent, and homeownership is 78.6 percent for households 65 and older against 35.2 percent for those under 35. Seven themes, not the economy at large, are producing the above-average growth (Exhibits 6 through 10).
- The implications are about dispersion, not direction. The S&P 500 trades at 19.0 times forward earnings, just under its five-year average of 19.8, on expected third-quarter earnings growth of 29.0 percent, and futures already price a December increase. The question is less where the index goes than who pays for a high price of capital: rate-sensitive sectors and younger households, against the builders of the buildout (Exhibit 11).
What we are watching. Israel’s election on October 27, the Fed decisions on October 28 and December 9, the advance estimate of third-quarter GDP on October 29, the midterm elections on November 3, which will shape how Washington handles the choices in Part Seven, and the October jobs report on November 6 and CPI on November 10 (Exhibit 13).
At a Glance: Five Relationships That Have Come Apart
Latest readings, with the argument for each in Part Four
| Relationship | Latest evidence | What it means |
|---|---|---|
| Growth and jobs | Real GDP growth a little over 2%; payrolls average 41,000 a month | Capital-intensive growth is employment-light |
| Policy rates and long yields | Funds rate target 3.75% to 4.00%; 10-year Treasury 5.09% | The long end is set by supply, not by the Fed |
| Paychecks and prices | Average hourly earnings +3.0% against CPI inflation of 3.7% | Real wages are shrinking while spending holds |
| Workers and jobs, by age | Hires rate 3.3%, quits rate 1.9%; recent-graduate unemployment 5.6% | Experienced workers stay; the entry-level rung bears the cost |
| Markets and moods | S&P 500 at 7,659, about 2% below its record; Michigan sentiment 46.3 | Owners of capital and payers of prices read the same economy differently |
Source: BLS, BEA, Treasury, University of Michigan and market closes through October 16, 2026; see Part Four and the source notes.
The question we hear most from clients is when things will go back to normal. We think the question has no good answer, because none of the available normals is a likely outcome.
There are three candidates. The first is the Great Moderation, roughly 1984 to 2007, when growth was steady, inflation drifted lower and long-term rates fell for two decades. The second is the post-crisis decade of 2010 to 2019, with slow growth, low inflation and near-zero policy rates. The third is the pandemic recovery, with its hot labor market, large fiscal transfers and a stock market that more than doubled. Each is a reasonable thing to remember fondly, and each was the product of conditions that no longer exist.
Our argument is that the post-pandemic boom is ending and the economy has not landed in either of the older worlds. The 10-year Treasury yield closed Friday, October 16, at 5.09 percent, down from 5.24 percent a week earlier and from 5.36 percent on Wednesday, October 7, the highest since 2002, and it closed at 5.00 percent on October 23. Payrolls have averaged 41,000 a month over the last year, about what a labor force that has stopped growing needs. Real GDP grew 2.2 percent at an annual rate in the second quarter and is up 2.2 percent over the past year. Long-term rates look like the early 2000s, hiring looks like a low-speed-limit economy, and the split of income looks like nothing since at least 1980. No earlier era produced that combination.
We would give this new era two names, because it has two faces. The first is the Great Decoupling. Relationships that held for a generation have come loose: growth from hiring, policy rates from long-term yields, paychecks from prices, markets from the mood of the people who live in them, and an aging workforce from the jobs on offer to the young. Brynjolfsson and McAfee used the phrase for the split between productivity and median pay, and we are borrowing it and widening it. The second is the Great Divide, which is how the decoupling shows up in households and companies: one economy running fast, another running slow, and a widening gap between the owners of capital and the people who work for pay. The divide is wider than the K-shaped economy that most commentary stops at: it separates AI from nearly everything else, technology stocks from the rest of the market, and sectors that borrow from sectors that do not, and the young from the old.
We do not expect a label to stick before the history is written. Stock and Watson documented the decline in macroeconomic volatility in 2002, and Bernanke gave it the name Great Moderation in 2004, when it was already twenty years old. The names matter less than the habit they are meant to break, which is waiting for a return to something familiar.
PART ONE: THREE NORMALS, AND WHAT EACH ONE NEEDED
The Great Moderation needed falling inflation and a credible central bank
Between 1984 and 2007, CPI inflation averaged 3.1 percent a year, unemployment averaged 5.7 percent, and the 10-year yield fell from 11.7 percent to 4.8 percent (Exhibit 1). The defining feature was not the level of any one series. It was how little they moved. The standard deviation of annual CPI inflation over those 24 years was 0.9 percent. Expected real yields averaged 3.3 percent.
A falling rate path is a form of stimulus, and it flatters every valuation and every budget. It had help: the Volcker disinflation had been won and the Fed’s credibility with it, China, Eastern Europe and India joined the world’s supply chains, and energy was inexpensive for much of the stretch. Take any of those away and the arithmetic changes.
The post-crisis decade needed slack and a flood of savings
Between 2010 and 2019, inflation averaged 1.8 percent and the 10-year Treasury averaged 2.6 percent. Unemployment started the decade at 9.6 percent and ended it at 3.7 percent, and the yield barely noticed. That is a world with a global savings glut, central bank balance sheets that absorbed long-term debt, restrained public spending after 2011, and almost no inflation pressure anywhere. Low inflation made low rates safe, and low rates made high debt affordable.
The pandemic recovery needed money and a reopening
From 2021 to 2024, inflation averaged 4.9 percent and peaked at 8.0 percent in 2022, while unemployment averaged 4.2 percent and held between 3.6 and 4.0 percent from 2022 through 2024. Long-term yields did not keep up. The Cleveland Fed’s expected real 10-year yield stood at minus 0.2 percent in January 2021 and 0.3 percent in January 2022, then climbed. That recovery was powered by a set of one-time forces: fiscal transfers, household savings built up during lockdowns, pent-up demand for services, and a policy rate that stayed near zero long after the economy needed it. Each of those was a stock being spent down, not a flow that renews itself.
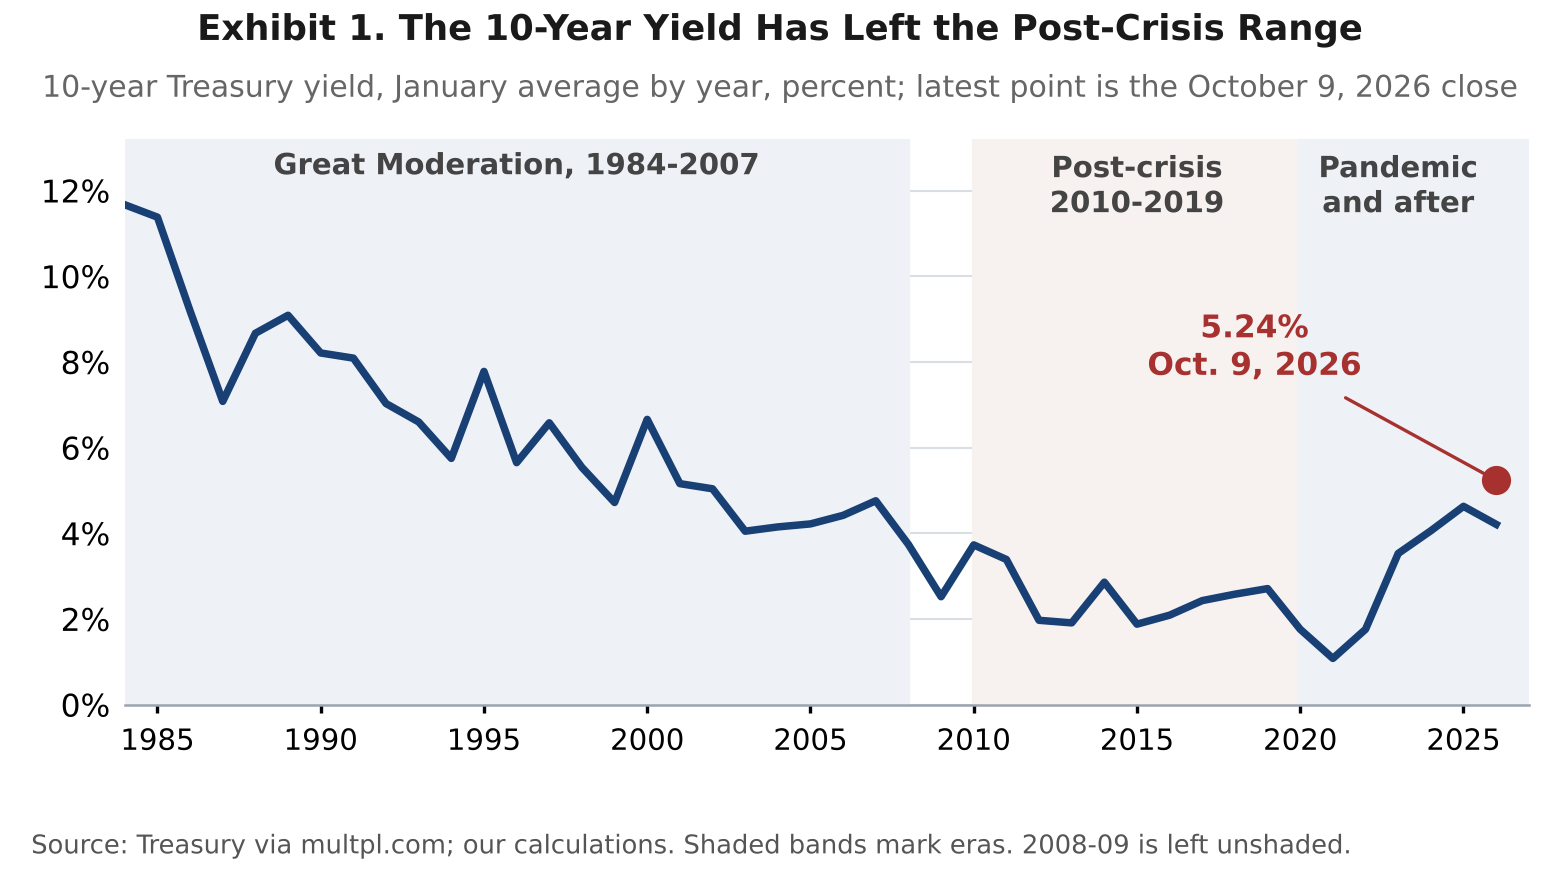
Exhibit 1 shows the point. The yield has left the range of the post-crisis decade and the pandemic years. It has not returned to the levels of the Great Moderation either, although it is now within reach of its final years. Each normal was a particular configuration of rates, inflation, savings and policy, and none of the configurations is present today. Exhibit 1 ends at the October 9 close of 5.24 percent. The yield has since eased to 5.09 percent, which does not change the comparison.
PART TWO: THE BOOM IS ENDING BECAUSE ITS SUPPORTS ARE
What the expansion looked like
On BEA’s annual figures, real GDP grew 2.9, 3.0 and 2.3 percent in 2023, 2024 and 2025, and 2.5 and 2.2 percent at annual rates in the first two quarters of this year. Unemployment stayed between 3.6 and 4.0 percent from 2022 through 2024. Inflation came down without a recession, which many forecasters did not expect. The stock market gained 119 percent over a bull market that turned four years old this month. By almost any standard, the economy outperformed expectations.
What is giving way
We want to be precise about what is fading, because it is not the health of the labor market. Payrolls rose 29,000 in September against a consensus near 90,000, and July and August were revised down by 60,000 combined. The three-, six- and twelve-month averages are 51,000, 66,000 and 41,000. Our own break-even range (needed to keep the unemployment rate stable) is zero to 40,000 a month, and Oxford Economics puts it near 50,000, down from more than 200,000 in 2022 and 2023 and 125,000 to 150,000 before 2025. Unemployment is 4.2 percent and has not risen. Hiring at the current pace is roughly what the economy needs. What has faded is the speed limit. The 2023 and 2024 pace of 150,000 to 200,000 jobs a month came with a surge in immigration and a rebound in participation, and neither is repeating. We still expect some improvement from here, as we wrote in this past week’s weekly, because the household survey shows the labor force growing again.
Households are spending without the paychecks to match. Personal spending rose 0.9 percent in August, yet wages are rising more slowly than prices, and the University of Michigan’s preliminary October sentiment reading of 46.3 is the lowest since May. We read that as spending carried by asset wealth and, for some households, by the remaining savings cushion. Neither lasts indefinitely. September retail sales rose 0.8 percent against a consensus of 0.3 percent, but gasoline stations supplied much of the gain, up 6.4 percent. Excluding gasoline, sales rose 0.2 percent, and the control group that feeds GDP rose just 0.1 percent against 0.3 percent expected.
Policy has stopped helping. The Fed raised the funds rate to 3.75 to 4.00 percent on September 16 with unanimous support, and the minutes show most participants expect another increase by year end. Fed Chair Warsh said in Bangkok on October 15 that he does not prejudge meetings and that price pressures remain “uncomfortably elevated,” and he described central bank tightening as synchronous across most of the world and warned that the AI transition could be very bumpy. Fed funds futures now put the odds of a pause on October 28 at 85 percent, up from about 72 percent the day before, and the odds of a December 9 increase at about 89 percent (CME FedWatch). Meanwhile CBO puts the FY2026 deficit at $2.0 trillion, $218 billion more than last year, and federal interest outlays reached $970 billion in fiscal 2025, up from $352 billion in 2021. The support that carried the economy through 2021 and 2022 was monetary and fiscal at once, and neither lever is available in the same form.
The services economy is cooling at the margin. The ISM Services business activity index fell 5.2 points to 56.5 in September, and the prices index rose to 74.0, the highest since 2022. Slower real activity alongside faster prices is what an energy and capital shock looks like.
PART THREE: WHY NEITHER OLDER ERA COMES BACK
The price of capital has reset, and most of the move is real
The yield is carrying three loads that the 2010s did not. The first is demand for capital. The four largest hyperscalers plan about $725 billion of capital spending this year at the high end of guidance, and Nvidia’s chief financial officer has put broader hyperscaler spending above $800 billion in 2026 and $1.3 trillion in 2027. A capital-intensive expansion needs capital, and it competes for the same savings as everyone else.
The second is government borrowing. Fitch estimates developed-market government debt at 104 percent of GDP this year, against 68 percent in 2006, and has the U.S. deficit near 7.8 percent of GDP. CBO’s September letter has debt rising from 101 percent of GDP in 2026 to 175 percent in 2056, and to 222 percent if rates run one point higher. The 10-year auction on October 7 cleared at 5.30 percent, the highest since November 2000, and it still drew strong demand. The bond market is taking the supply and charging a price for it.
The third is the security premium. The war with Iran began on February 28, Brent closed Friday, October 16, at about $110 and $116.72 a week later, and on-highway diesel was $6.20 a gallon in the week ended October 16, $2.49 more than a year earlier, and $6.28 a week later. Iran widened its campaign against shipping earlier this month as Hurricane Isaias shut in about 63 percent of Gulf oil output. That is two energy shocks in one week. The long end sold off, and the auction still drew strong demand.
We can test the capital argument against the yield itself. The Cleveland Fed’s model splits the 10-year yield into an expected real rate and expected inflation. Between January and September of this year the model-based 10-year yield rose 0.82 points, and the real rate accounts for 0.58 of that, or about 71 percent (Exhibit 2). That is what a scarcity of capital looks like. Expected inflation did rise, to 2.57 percent, the highest of any month we examined since January 2002, so the war and diesel are in the data. The model’s real rate includes risk premia, so it is not a pure measure of expected real returns, and we would like to confirm the split with a term premium series.
Real yields now roughly equal growth, and that ends the era of low-cost debt
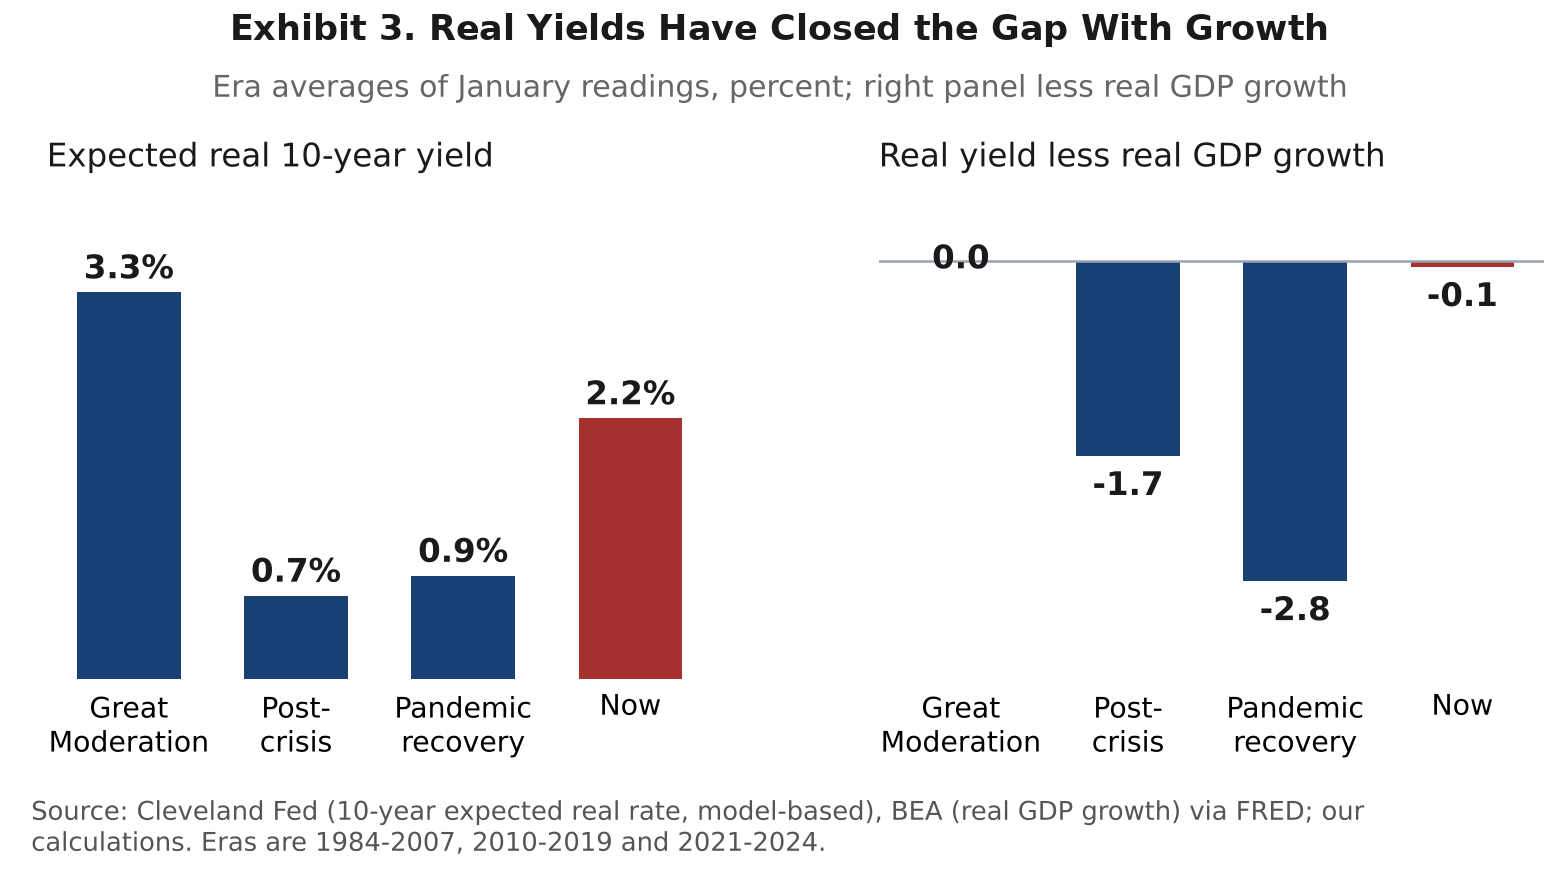
Exhibit 3 gives the shortest summary. The expected real 10-year yield averaged 3.3 percent over the January readings of the Great Moderation, 0.7 percent in the post-crisis decade and 0.9 percent in the pandemic recovery. It is 2.2 percent today, above every January reading since 2002. That is neither the low-cost money of the 2010s nor the expensive money of the 1990s. It sits just above the roughly 2 percent potential growth rate that CBO uses, which is the threshold we have been watching.
The right panel is the one that matters for debt. Subtract average real GDP growth from the real yield. In the Great Moderation the gap averaged about zero. It was minus 1.7 in the post-crisis decade and minus 2.8 in the pandemic recovery, when growth ran at 3.7 percent and rates did not follow. Today it is about minus 0.1, using 2025 growth of 2.3 percent. A government pays less on its debt than the economy grows only when this gap is negative, which is Blanchard’s argument that public debt is affordable to carry when r is below g. With the gap near zero, the debt ratio no longer shrinks on its own, and CBO’s baseline of 101 percent of GDP in 2026 rising to 175 percent in 2056 becomes the working assumption, not the pessimistic case.
Volatility is the other thing that is missing. The standard deviation of annual CPI inflation was 0.9 percent in the Great Moderation and 0.8 percent in the post-crisis decade. It was 1.9 percent from 2021 to 2024. A period is not moderate when inflation can run from 1.2 to 8.0 percent in two years. The Great Moderation was an era in which shocks were absorbed. This is an era in which they accumulate.
What the literature would say about this
Our argument sits between several established ones, and we should state where. Stock and Watson and Bernanke explain the Great Moderation as some mix of better policy, smaller shocks and structural change, and the debate over how much was luck matters, because luck can run out. Summers revived secular stagnation to explain the post-crisis decade, and the Holston-Laubach-Williams estimates of the neutral rate fell through the 2010s. Goodhart and Pradhan argue that aging reverses the disinflationary demographic tailwind, which fits both our break-even and our real-yield findings. Blanchard supplies the r-versus-g framework. For the labor share, Karabarbounis and Neiman document a global decline, and Autor, Dorn, Katz, Patterson and Van Reenen tie it to the rise of superstar firms. We are not offering a new theory. We are saying that the conditions behind the older ones have changed, and that the evidence now points toward a higher neutral rate, an aging labor force and a larger capital share.
PART FOUR: THE GREAT DECOUPLING, IN FIVE RELATIONSHIPS
Growth and jobs have come apart, partly because the labor force has stopped growing. Real GDP is growing at a little over 2 percent while payrolls average 41,000 a month. Output is being produced with fewer workers and more equipment, and much of the new equipment is for data centers, not for hiring. A capital-intensive expansion is an employment-light expansion, and that is a break from the 2010s, when growth near 2 percent came with payroll gains well above 100,000 a month. Part of the gap is demographic and part may be measurement. We argued on August 30 that the payroll and unemployment instruments miss a growing share of American work, and that argument has not changed.
Policy rates and long-term yields have come apart. The funds rate target is 3.75 to 4.00 percent and the 10-year yield is 5.09 percent, below its October 7 peak of 5.36 percent. Outside the U.S., the 10-year gilt yields about 5.4 percent and the 30-year about 6 percent, last seen in 1998. Japan’s 10-year yield crossed 3 percent in September for the first time since 1996, and France’s 10-year reached 4.96 percent, a 2002 high. In the Great Moderation, the policy rate was the anchor and long-term yields followed it. Today the long end is being set by supply, and a central bank can raise or hold its policy rate without changing that.
The Fed’s guidance has changed along with its rates. In the Great Moderation, policy was opaque but predictable: the Fed said little, and markets learned to read it from the data. After the global financial crisis it was historically easy and stated plainly, with explicit pledges and rate paths. Today the Fed is trying to be something in between. Chair Warsh said he does not prejudge meetings and does not believe in signaling what the Fed might do at upcoming meetings this year. With less guidance, the data carry more of the weight, and market pricing moves with them: futures put the odds of an October pause at about 72 percent one day and 85 percent the next. That is one more reason the long end, not the funds rate, is where the price of capital is set, and it is why the calendar in Exhibit 13 carries more weight than a Fed statement would have a decade ago.
Paychecks and prices have come apart. Average hourly earnings are up 3.0 percent from a year ago against CPI inflation of 3.7 percent in September, up from 3.4 percent in August. Headline CPI rose 0.6 percent in the month as energy prices jumped 5.2 percent, and gasoline is up 34.2 percent from a year ago. Core CPI rose 0.3 percent in the month and 2.6 percent over the year, a notch above the consensus forecast. Real wages are shrinking, and that sits uneasily with consumer spending that has not slowed. Producer prices show the pipeline is not clearing: the PPI for final demand rose 1.3 percent in September and 6.3 percent over the year, the largest 12-month increase since December 2022, and the index excluding food, energy and trade services rose 0.5 percent in the month and 5.0 percent over the year. The gap between pay and prices widened in September.
Workers and jobs have come apart by age. The baby boom is retiring in numbers that neither the United States nor Europe has seen, and the people still working are staying where they are. In the U.S., the participation rate for workers 55 and older is nearly 3 points below its December 2019 level, and the Atlanta Fed expects another 1.6 point decline by 2030, mostly from aging. The European Commission’s July demography report has the EU working-age population shrinking by an average of 1.2 million a year from 2025 to 2050. Shrinking labor supply is why payrolls can average 41,000 a month with unemployment at 4.2 percent. The break-even pace of job growth is far lower than it was in the 2010s, and a soft payroll number no longer carries the message it used to. Oxford Economics expects it to reach zero in 2027.
The other side of that is a market with almost no churn. August JOLTS shows 7.1 million openings, a hires rate of 3.3 percent, a quits rate of 1.9 percent and a layoff rate of 1.0 percent. Employers are not firing and workers are not leaving. Those more experienced workers are boosting productivity growth. But the other side of the equation has people trying to start out with the fewer openings. The New York Fed puts unemployment for recent college graduates at 5.6 percent in March, above the national rate, which has run 4.1 to 4.2 percent in recent months, and for young workers without a degree at 7.2 percent. We cannot cleanly separate artificial intelligence from ordinary caution as the cause, and we would not try. The result is the same: employers have settled into a workforce of experienced people who stay, and the entry-level rung is where the cost of that choice lands.
Markets and moods have come apart. The S&P 500 closed Friday, October 16, at 7,659.44, down 1.9 percent on the week and its worst week since June, as the Nasdaq Composite fell 4.5 percent on worries about the AI buildout. A week earlier the index was just below its record at 7,811.54, with the VIX at 14.84. The University of Michigan’s sentiment index is at 46.3. Investors and households are looking at the same economy and reaching opposite conclusions, and both can be right: investors own the capital that is being deployed, and households are paying the prices that deployment and the war are raising. On valuation, FactSet puts the forward price-earnings ratio at 19.0, just below its five-year average of 19.8, with third-quarter earnings growth expected at 29.0 percent and energy leading at 127.6 percent. With about 9 percent of companies reporting, 84 percent have beaten earnings estimates.
PART FIVE: THE GREAT DIVIDE, MUCH MORE THAN A K-SHAPED ECONOMY
The decoupling is an aggregate story or macro. The divide is what it feels like from inside, the micro, and it starts with who gets paid. It does not end there. The K-shaped economy is the divide that most commentary stops at, and it is the one the data support least clearly. We count six: capital against labor, high-income households against low-income ones, AI against everything else, technology against the rest of the stock market, sectors that borrow against sectors that do not, and the young against the old. They fall into three groups: who owns (capital against labor, and the K), where the money goes (AI, and technology against the rest) and who has to borrow (rate-sensitive sectors, and the young against the old). They overlap, and they point the same way.
Capital is taking a rising share of what the economy produces
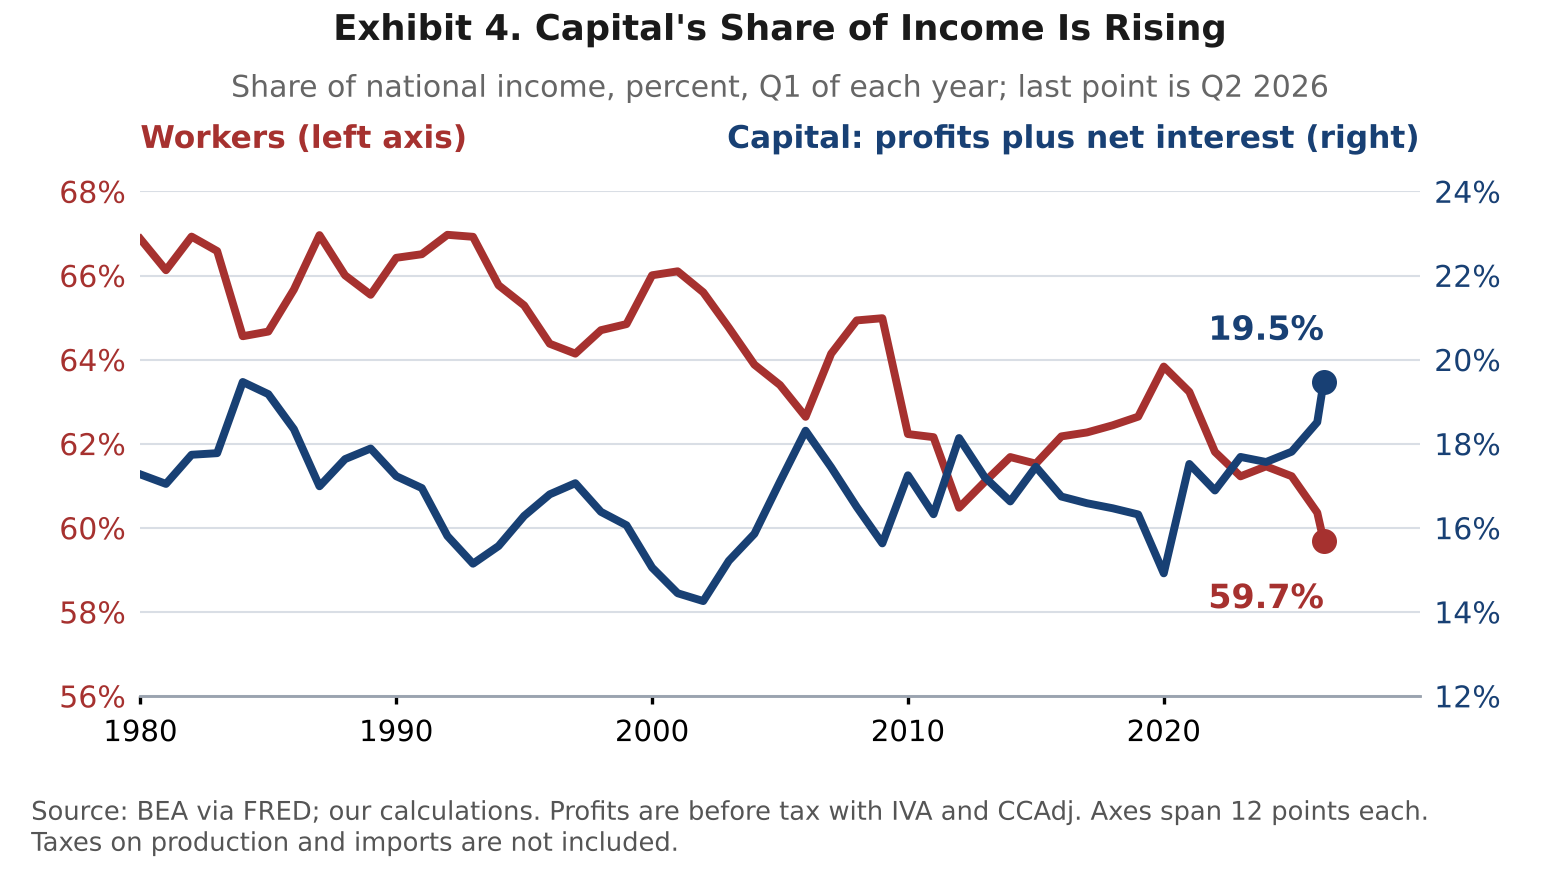
Workers’ compensation fell to 59.7 percent of national income in the second quarter, the lowest in our data, which start in 1980 (Exhibit 4). It was 66.0 percent in the first quarter of 2000 and 66.9 percent in 1980. Over the same period, corporate profits plus net interest rose from 17.3 percent of national income to 19.5 percent, the highest in our data. The two lines tell one story from opposite sides: output is rising, and a larger share of it is going to the owners of capital and a smaller share to the people who work for pay.
We count interest as a return to capital, along with profits. Net interest is what borrowers pay lenders, and it has risen with the level of rates and the stock of debt. Profits in the national accounts are measured before tax, so the corporate income tax is already inside the capital line. We have not included taxes on production and imports, which we could not retrieve for this edition, and they would raise the combined share going to capital and government and lower the share going to workers by whatever they are. The BLS series for the nonfarm business sector, which uses a narrower definition, fell to 52.8 percent in the second quarter, also the lowest on record, from 53.6 percent in the first and 63.8 percent in the first quarter of 2000.
This is the capital-intensive expansion seen from the income side. Output is rising, little of it is going to new hires, and the capital doing the work earns the return. A saver can now buy a 10-year Treasury yielding 5.09 percent, while the average hourly wage is rising 3.0 percent. A higher capital share is partly the arithmetic of a more capital-intensive economy and does not by itself prove that workers are being squeezed. It does mean that the gains of this expansion are going to people who own things.
Capital is also out-earning labor on returns
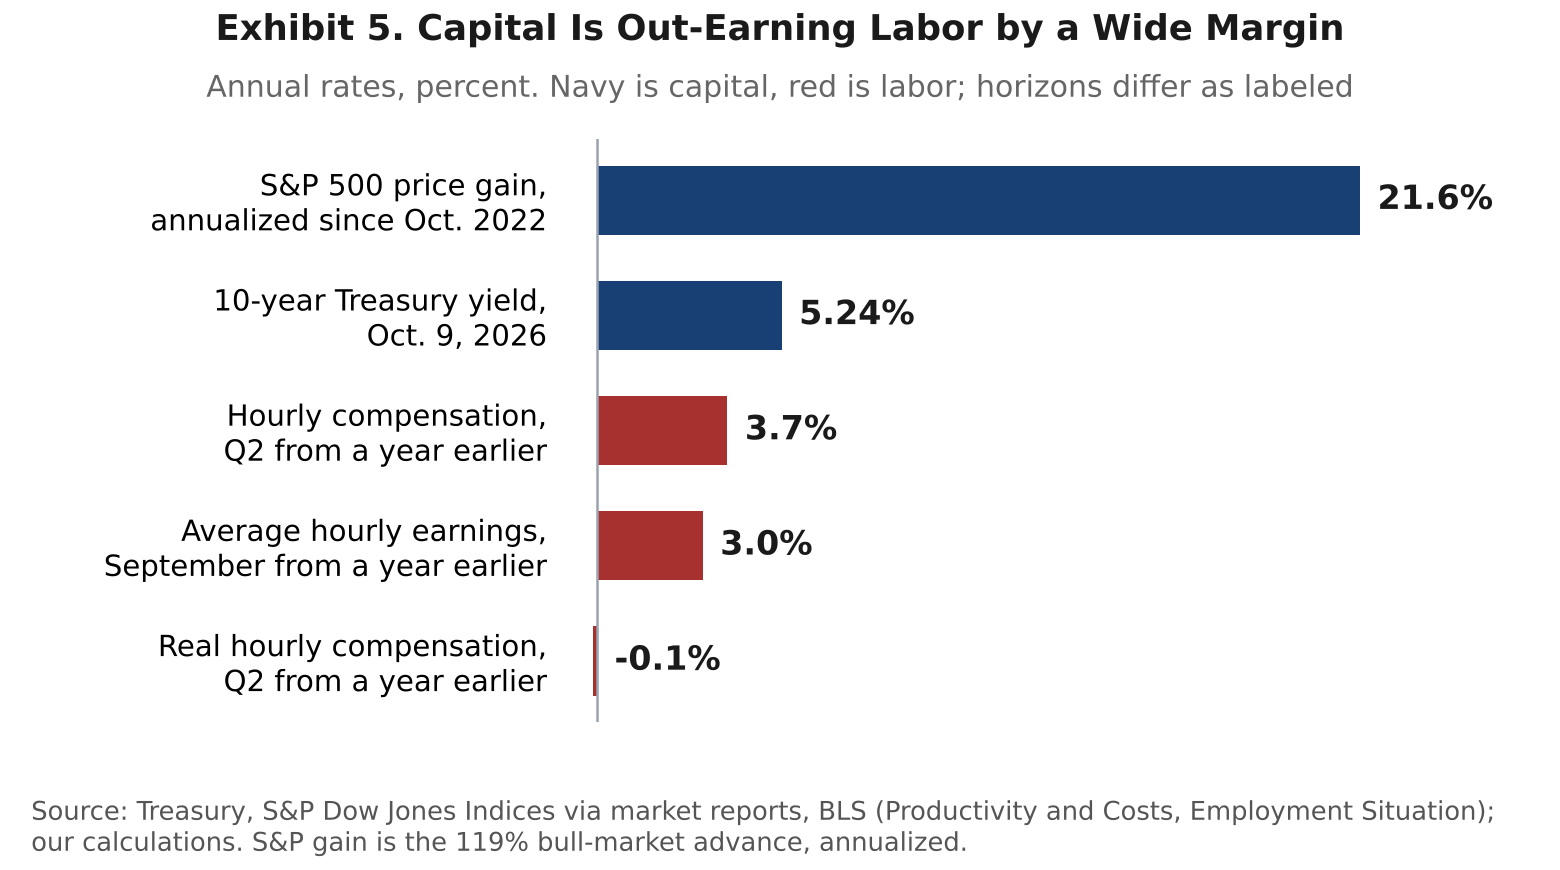
Exhibit 5 puts the returns side by side. Through October 9, the S&P 500’s 119 percent advance since the October 2022 low works out to roughly 22 percent a year, and the 10-year Treasury yielded 5.24 percent. The index has since given back 1.9 percent and the yield has eased to 5.09 percent. Hourly compensation in the nonfarm business sector rose 3.7 percent from a year earlier in the second quarter, and average hourly earnings are up 3.0 percent. Productivity rose 2.2 percent over the same year, and real hourly compensation fell 0.1 percent. Output per hour is growing and the pay that accompanies it is not, which is the original Great Decoupling, back in force. BEA reports that profits from current production rose $384 billion in the second quarter after $63 billion in the first. The complaint is not new. Stephen Roach of Morgan Stanley made it in June 1998, at the height of the dot-com boom, when he wrote that worker pay had lagged worker productivity since the early 1980s and that a political backlash was only a matter of time.
We would use the comparison with care. The horizons differ, equity returns are volatile and can reverse, and the S&P 500 is a narrow slice of the capital stock. But the direction is not in doubt, and it matches the labor share: the owners of capital are being paid more for waiting, and the people who work for pay are being paid more slowly.
The K-shaped economy is real in some places and contested in others
The K shows up most clearly where capital, hiring and wages are concerned, and less clearly in aggregate spending. Moody’s Analytics estimates that the top 10 percent of households account for more than 45 percent of consumer spending, and that their spending grew 62 percent from the third quarter of 2020 to the third quarter of 2025. The Minneapolis Fed’s review of the evidence finds the picture less clear. The New York Fed’s data show cumulative nominal spending growth since 2020 of 29 percent for low-income households and 36 percent for high-income ones, and the BLS consumer expenditure surveys show no consistent K through 2024. We read the spending data as showing a modest gap, and the capital, hiring and sentiment data as showing a large one.
The pattern across the last two weeks of data is consistent: the parts of the economy that own, build or borrow on favorable terms are running fast, and the parts that earn wages, borrow at today’s rates or buy at today’s prices are running slow. Large companies with access to capital markets are financing data centers. Smaller companies face a 5 percent long-term rate and a $6 diesel price. Delta cut its 2026 guidance on October 9, citing a $6 billion higher annual fuel bill. The Russell 2000 fell 3.0 percent in the week ended October 16 and the S&P 500 fell 1.9 percent, while the Dow rose 0.7 percent. One week proves nothing. It illustrates what the quarter has looked like.
The labor market is where the divide meets the fear, and the young feel it first. Information payrolls fell 10,000 and professional and business services fell 9,000 in September, while healthcare, construction and leisure added jobs. We would not attribute those losses to artificial intelligence on one month’s data. But the worry is rational. Workers see record capital spending on technology, flat hiring and prices that rise faster than pay, and they are asking where they fit. The graduate who cannot find a first job and the 50-year-old who will not leave a good one are asking the same question from opposite ends of a career.
AI against everything else
The oldest of the newer divides is between artificial intelligence and nearly everything else, and it has reached the national accounts. ING estimates that AI technology and data centers, net of imports, supplied about 36 percent of the year-over-year growth in real GDP in the second quarter, and Wells Fargo puts AI spending at about a quarter of growth over the past year. The methods differ and the answers are close. One category of spending is providing between a quarter and a third of the growth in an economy that is expanding a little over 2 percent.
Construction spending shows the split most clearly (Exhibit 6). The Census Bureau puts data center construction at a record $85.0 billion annual rate in August, up 73.2 percent from a year earlier, and power construction is up 9.7 percent. Private residential construction is down 4.8 percent, manufacturing construction is down 19.8 percent, and total construction spending is down 1.7 percent. The Federal Reserve’s September Beige Book describes the same pattern: residential construction declined, nonresidential construction rose on balance, and several districts said much of that activity was concentrated in data center projects.
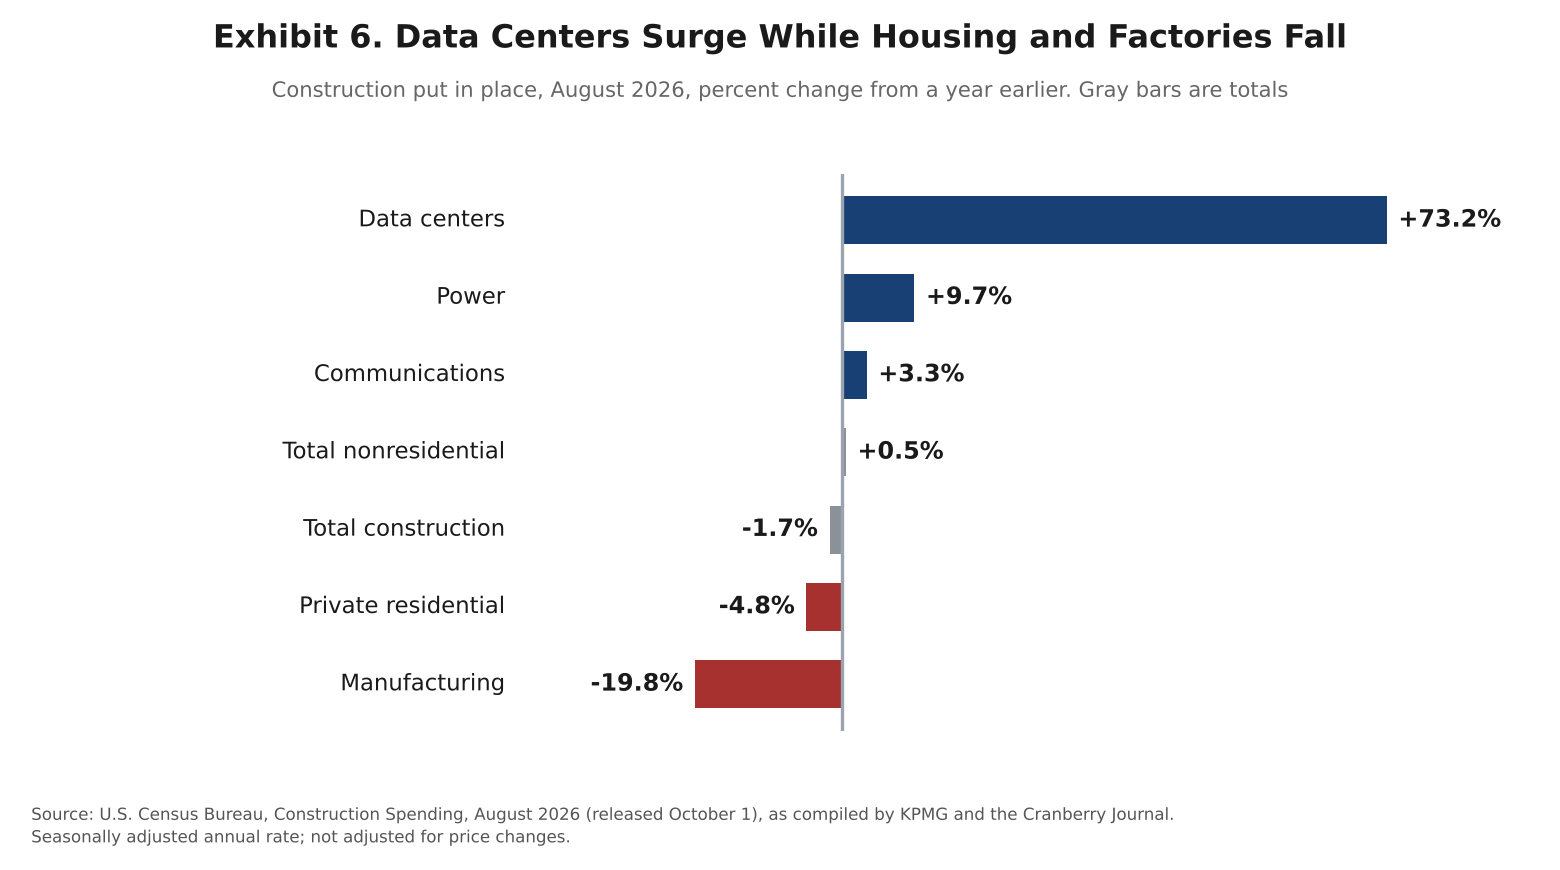
Factory construction is the telling case. It is 32 percent below its September 2024 peak, and construction of computer, electronic and electrical plants, the category that holds the chip fabs, is 59 percent below its June 2024 peak. Most of the decline is the wind down of CHIPS Act and electric vehicle projects, and excluding computer, electronic and electrical plants, factory construction was down just 2.1 percent in the first seven months of the year. The pipeline is growing again: Dodge Construction Network’s manufacturing starts for the 12 months ended September were up 3.4 percent from the prior 12 months, after a 1.5 percent decline in the 12 months ended July, and the pharmaceutical projects described below have yet to show up fully in spending. The structures-to-equipment rotation we described in our construction spending notes is also under way, and core capital goods shipments were up 11.4 percent from a year earlier in August.
Technology against the rest of the stock market
The second divide is inside the stock market, and it is old enough that it no longer surprises anyone. Information technology is 39.9 percent of the S&P 500 at the end of September, according to S&P Dow Jones Indices, against about 17 percent of the equal-weight version of the index. Technology is up 27 percent this year and energy is up 53 percent, against 11.9 percent for the S&P 500 (Exhibit 7). Technology was up 32 percent a week earlier. It fell 7.7 percent in the week ended October 16 as chip stocks sold off on concerns about the AI buildout, while energy, health care and consumer staples rose 3 to 5 percent. A sector that is roughly 40 percent of the index and up 27 percent still explains most of the index’s gain.
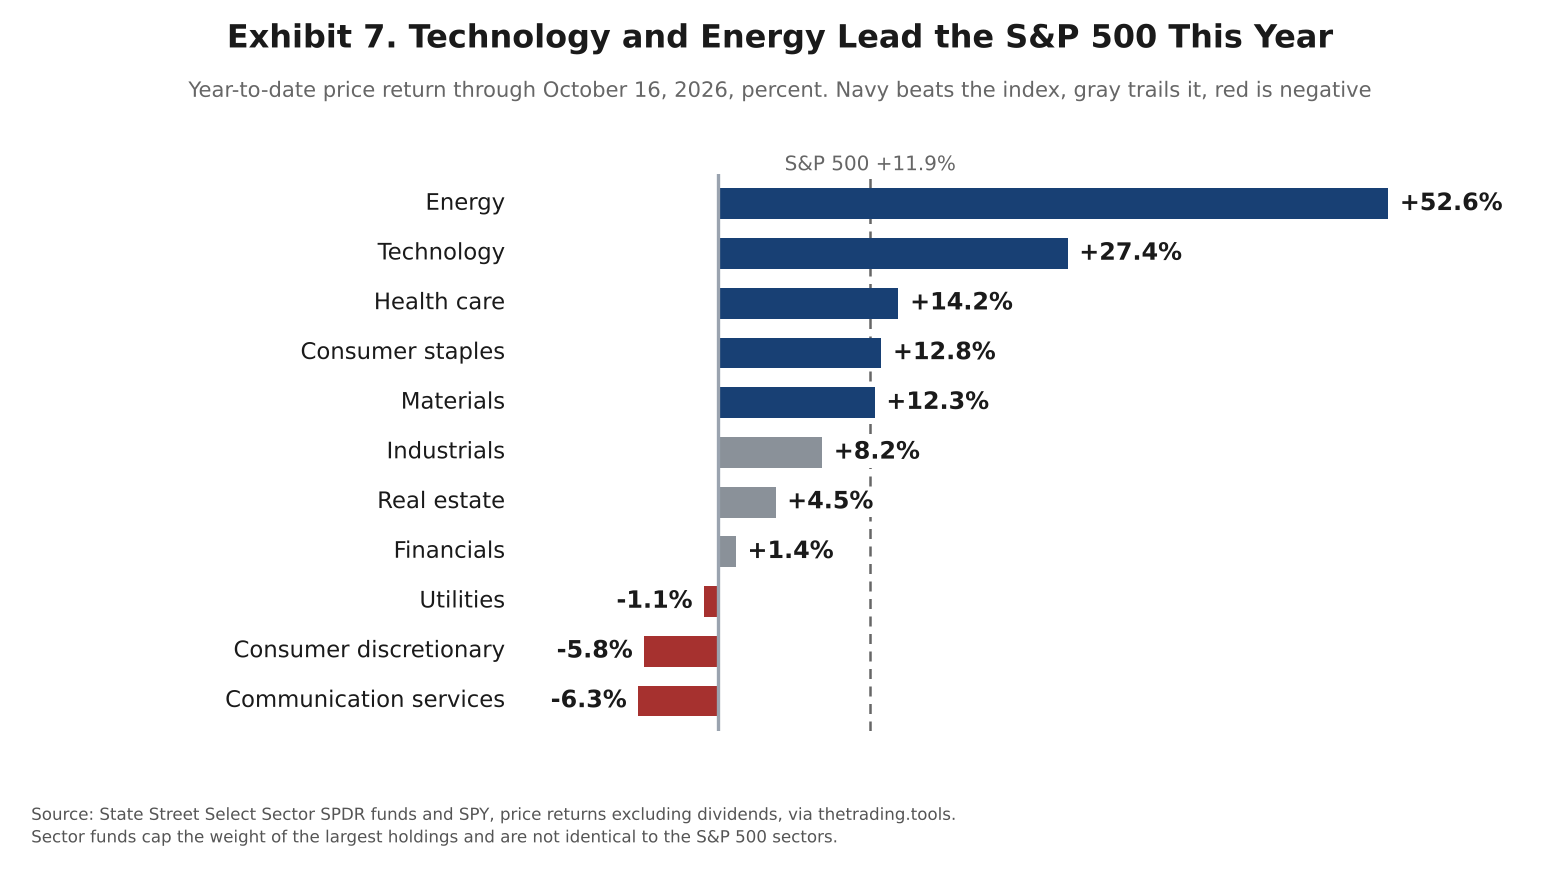
The split is also between the sellers of AI and some of its buyers. The sector that holds the chip and software companies is up 27 percent. Communication services and consumer discretionary, which hold several of the largest companies doing the spending, are down 6.3 and 5.8 percent. Utilities are down 1.1 percent, financials are up 1.4 percent and real estate is up 4.5 percent. That is the pattern of an early capital cycle, in which the market pays the equipment sellers first.
The earnings gap is smaller than the gap in market value. FactSet’s July 20 count had the Magnificent 7 growing second-quarter earnings 31.1 percent from a year earlier against 22.8 percent for the other 493 companies, and without Micron and Nvidia the index’s blended growth would have been 16.8 percent instead of 24.7 percent. Two companies account for about eight points of the index’s earnings growth, so the concentration of profits is as notable as the concentration of market value.
Sectors that borrow against sectors that do not
The newest divide runs along sensitivity to interest rates, and the rise in long-term rates is what opened it. The 30-year mortgage rate averaged 7.40 percent in Freddie Mac’s October 8 survey, against about 6.3 percent a year earlier. Existing-home sales fell 2.2 percent from a year ago in September and were lower in all four regions, and the NAHB builder confidence index dropped to 32 in September, the lowest in a year, with 38 percent of builders cutting prices. The NFIB reports that small businesses paid an average of 8.2 percent on short-term loans in September, up 0.7 point in a month, and its optimism index slipped to 97.9. The Beige Book says auto sales were subdued, weighed down by weak confidence, high fuel prices and rising financing costs.
The parts of the economy whose customers are not households borrowing at 7.4 percent look very different (Exhibit 8). Data center construction, defense production and business equipment are all growing at double-digit rates. Core capital goods shipments rose 11.4 percent from a year earlier in August and defense shipments rose 28.0 percent, according to the Census Bureau. The Federal Reserve’s September industrial production report shows the same split inside factories: high-technology output is up 17.5 percent from a year earlier and utilities output is up 8.7 percent, while motor vehicles and parts are down 0.8 percent and total manufacturing is up 1.1 percent. Regional surveys agree. The New York Fed’s Empire State index jumped 18 points to 25.5 in October, the highest since December 2021, and the Philadelphia Fed’s index was 20.9, below September’s 37.8 but still firmly in expansion territory. The stock market draws the same line: technology and energy lead the index, while real estate is up 4.5 percent, financials are up 1.4 percent, utilities are down 1.1 percent and consumer discretionary is down 5.8 percent.
Utilities are the clearest case of a sector caught between the two halves. Their demand story is as strong as any in the market, with power construction up 9.7 percent and the members of the Edison Electric Institute planning $1.1 trillion of capital spending from 2025 through 2029, against $1.3 trillion over the whole of 2015 to 2024. Yet the sector is down 1.1 percent this year. A stock held for its dividend competes with a 5.09 percent Treasury, and for now the Treasury is winning.
The split also changes how the Fed’s tightening works. A higher funds rate reaches the households and firms that borrow, and those are the sectors that are already slow. It reaches a hyperscaler’s capital budget, a defense contractor’s order book and a government’s appropriations less directly. We think the Fed has more work to do, with two more increases appearing assured and a third possible, and this is where that work will land first: housing, small business and autos.
Exhibit 8. The Economy Splits Along Sensitivity to Interest Rates
Latest available readings, August to October 2026
| Not rate-sensitive | Rate-sensitive | |
|---|---|---|
| Construction | Data centers: $85.0 billion annual rate in August, up 73.2% from a year earlier | Private residential: down 4.8% from a year earlier; builder index 32, with 38% of builders cutting prices |
| Orders and credit | Core capital goods shipments up 11.4% and defense shipments up 28.0% from a year earlier in August | 30-year mortgage 7.40% against about 6.3% a year ago; small-business short-term loans 8.2% |
| Consumers | Solid high-end purchases and strong airline demand despite higher fares (Beige Book) | Existing-home sales down 2.2% from a year earlier in September; auto sales subdued on financing costs (Beige Book) |
| Stocks, year to date | Energy up 52.6%, technology up 27.4% | Real estate up 4.5%, financials up 1.4%, utilities down 1.1%, consumer discretionary down 5.8% |
Source: Census Bureau, Freddie Mac, NAR, NAHB, NFIB, Federal Reserve Beige Book (September 2) and State Street Select Sector SPDR funds (October 16); see source notes. Sorting each item into rate-sensitive or not is our judgment.
Young against old
The sixth divide runs between the young and the old, and housing is where it shows. The Census Bureau’s Housing Vacancy Survey puts homeownership at 78.6 percent for households 65 and older in the second quarter and at 35.2 percent for households under 35, down from 36.4 percent a year earlier (Exhibit 9). The Bureau of Labor Statistics’ Consumer Expenditure Survey finds that 54 percent of households headed by someone 65 or older own a home with no mortgage at all. Younger households are also the ones facing the weakest entry-level hiring in Part Four, so the squeeze on them has two sides.
A low-rate mortgage is a second asset, and the old hold most of them. Federal Reserve Governor Barr said on September 23 that about half of all mortgages still carry a rate of 4 percent or lower and that nearly 80 percent carry less than 6 percent, citing Federal Reserve staff calculations from the National Mortgage Database. A new buyer faces 7.40 percent. On a $400,000 loan, principal and interest comes to about $2,770 a month at 7.40 percent and about $1,910 at 4 percent, which is 45 percent more for the same house. This is the rate-sensitive divide with a birth date attached: the households that borrowed before 2022 are insulated from today’s rates, and the households trying to borrow now are not.
The two sides of the housing market are increasingly the same people. The National Association of Realtors reports that the median first-time buyer is 40 years old and that first-time buyers were 21 percent of purchases, the lowest share since the series began in 1981, while baby boomers were 42 percent of buyers and 55 percent of sellers. Homes are changing hands mostly among households that already own one, and the young are the exception, not the rule.
Housing costs are where the divide meets the ballot box. In CNBC’s All-America Economic Survey, conducted July 8 to 12, housing was the top issue for voters 18 to 34 and the second issue for voters 35 to 49, while for all voters it ranked fourth, tied with health care and behind food, protecting democracy and immigration. The frustration is concentrated by age, so it can look modest in a poll of everyone. We will learn how wide the split is, and how consequential it has become, from the midterm elections on November 3. We would watch whether the age gap in the House vote widens from 2022, and whether it is widest where housing costs are highest.
Exhibit 9. Housing Splits the Country by Age
Latest available readings, 2024 to October 2026
| Older households | Younger households | |
|---|---|---|
| Owning | Homeownership 78.6% for households 65 and over (second quarter 2026) | Homeownership 35.2% for households under 35, down from 36.4% a year earlier |
| Mortgages | 54% of households 65 and over own with no mortgage; about half of all mortgages carry 4% or less | A new buyer pays 7.40% on a 30-year loan, about 45% more per month than at 4% |
| Buying and selling | Baby boomers were 42% of buyers and 55% of sellers (NAR, 2026) | First-time buyers were 21% of purchases, a record low; their median age is 40 |
| Voters | Housing is fourth among issues for all voters (CNBC, July) | Housing is the top issue for voters 18 to 34 |
Source: Census Bureau (Housing Vacancy Survey, second quarter 2026), BLS Consumer Expenditure Survey (2024), Federal Reserve Governor Barr (September 23), Freddie Mac (October 8), NAR 2026 generational trends report and CNBC All-America Economic Survey (July 8 to 12); see source notes. The payment comparison is our arithmetic.
Seven themes are producing the above-average growth
The parts of the economy that are growing faster than average are concentrated in seven themes. They are the AI Buildout, the Electric Grid Upgrade, Defense Replenishment, Aerospace and Next Generation Defense, the Reshoring of Critical Industries and Materials, the Pharmaceutical and Medtech Buildout, and Peak 65, which covers senior housing, condominiums, and longevity and functional health. Real GDP is up 2.2 percent over the past year, a little above the roughly 2 percent growth rate CBO uses for potential, and we believe these themes account for much of the extra. Exhibit 10 pairs each theme with the latest hard data.
Exhibit 10. Seven Themes Are Producing the Above-Average Growth
Latest data for each of the seven themes
| Theme | Latest evidence |
|---|---|
| AI Buildout | Data center construction a record $85.0 billion annual rate in August, up 73.2% from a year earlier. The four largest hyperscalers plan about $725 billion of 2026 capital spending. AI technology and data centers supplied about a quarter to a third of GDP growth over the past year (Wells Fargo, ING). |
| Electric Grid Upgrade | Power construction up 9.7% from a year earlier in August. Investor-owned utilities plan $1.1 trillion of capital spending from 2025 to 2029 (EEI), against $1.3 trillion for all of 2015 to 2024. |
| Defense Replenishment | Defense shipments up 28.0% from a year earlier in August. The FY2027 request is $1.5 trillion, 42% above FY2026, including $66 billion for 18 Navy warships. |
| Aerospace and Next Generation Defense | Boeing delivered 161 commercial airplanes in the third quarter and 475 so far this year. The FY2027 request includes $75 billion for space launches, GPS satellites and missile warning. |
| Reshoring of Critical Industries and Materials | Manufacturing payrolls up 72,000 since a December 2025 low (BLS). Core capital goods shipments up 11.4%. Factory construction is down 19.8% from a year earlier and 32% from its September 2024 peak, but computer, electronic and electrical plants, which hold the chip fabs and battery plants built under CHIPS and the EV push, account for about 95% of the decline in the first seven months, and the rest of factory construction was down just 2.1%. The pipeline is growing again: Dodge’s manufacturing starts for the 12 months ended September were up 3.4% from the prior 12 months, after a 1.5% decline in the 12 months ended July. |
| Pharmaceutical and Medtech Buildout | Lilly has announced 10 new U.S. sites since 2020 as part of a push of more than $50 billion and broke ground on a $5 billion Virginia plant on October 22. AstraZeneca has pledged $50 billion through 2030 and broke ground on a $4.5 billion plant near Charlottesville in October 2025. Johnson & Johnson plans $55 billion over four years, including a $2 billion biologics plant in Wilson, North Carolina, under construction since March 2025. Merck plans more than $70 billion, opened a $1 billion vaccine plant in Durham, North Carolina, in March 2025 and has plants in Virginia ($3 billion), Delaware ($1 billion) and Kansas ($895 million) under construction. Pfizer has pledged $70 billion for U.S. research and capital projects, and Roche, Bristol Myers Squibb, GSK, Novartis and Sanofi have each announced $20 billion to $50 billion. Commitments are announcements, and part of each is research, so spending put in place will lag. |
| Peak 65 | Health care payrolls averaged +33,000 a month in the 12 months before September, against +45,000 for all payrolls (BLS). Senior housing occupancy was 89.9% in the second quarter, with occupied units at a record and inventory growth below 1% (NIC MAP). |
Source: Census Bureau (construction spending and durable goods, August), BLS (Employment Situation, September), Boeing, Edison Electric Institute, NIC MAP, Association for Advancing Automation, Dodge Construction Network, company announcements, Scripps News; see source notes. Budget figures are the administration’s FY2027 request, not enacted appropriations.
What the seven share is as important as what they are. Six are capital-intensive, and defense and the grid depend on a federal budget or a regulated rate base more than on a household’s credit. Only Peak 65 is labor-intensive, and it is where the jobs are: in the 12 months before September, health care added an average of 33,000 jobs a month against 45,000 for all payrolls, according to BLS. That is how an economy can grow above 2 percent with payrolls near 41,000 a month, and why the growth feels so uneven. Few of the seven depend on a household taking out a 7.4 percent mortgage, and the condominium part of Peak 65 is the piece to watch.
The pharmaceutical buildout is the least visible of the seven in the monthly data and one of the most concrete in the field. Eli Lilly has announced 10 new U.S. manufacturing sites since 2020, five for active ingredients, four for injectables and devices and one for genetic medicines, and it broke ground on a $5 billion Virginia plant on October 22. AstraZeneca, Johnson & Johnson, Merck and Pfizer have each pledged $50 billion to $70 billion in the United States, and several plants are already built or under construction, including Merck’s $1 billion vaccine plant in Durham, North Carolina, which opened in March 2025, Johnson & Johnson’s $2 billion biologics plant in Wilson, North Carolina, and AstraZeneca’s $4.5 billion plant near Charlottesville. Part of each pledge is research and not plants, and several came alongside the threat of pharmaceutical tariffs, so spending put in place will trail the announcements. It still matters for the divide. These projects are capital-intensive, they add relatively few permanent jobs per dollar, and they do not depend on a household taking out a mortgage.
Three themes we may have been missing
We would add three candidates to the list. None of them replaces one of the seven, and the third belongs on a watch list for now.
Skilled trades and technical labor. The workers in shortest supply are the ones who build and run the buildout. The Beige Book reports that skilled trades and technical workers were hard to find and that the largest wage increases went to skilled construction and manufacturing workers. BLS shows the same split in September: construction added 11,000 jobs, with nonresidential specialty trade contractors adding 12,000, while information lost 10,000 and professional and business services lost 9,000. These are small monthly changes and we would not lean on one month, but the direction matches the Beige Book. This is a divide inside the labor market, and it is also a constraint on every one of the seven themes.
Energy production and exports. The war has done two things at once. It has pushed energy prices up for consumers, with the CPI energy index up 20.4 percent and gasoline up 34.2 percent from a year earlier, and it has made the United States a larger supplier to the rest of the world. The Energy Information Administration’s September outlook has liquefied natural gas exports rising from a record 15.1 billion cubic feet a day in 2025 to 17.4 in 2026 and 18.6 in 2027, with natural gas production at a record 111.7 billion cubic feet a day this year. Energy is the best-performing sector in the S&P 500, up 53 percent. Part of that is a price effect that would fade with the war, so this is a theme with a caveat, but we think the export build outlasts it. It is also another divide: the same shock that lifts a producer’s earnings raises a trucker’s diesel bill.
Automation and robotics. A labor force that has stopped growing is a reason to substitute capital for labor, which is the logic of the capital-intensive expansion. The evidence is early. North American robot orders rose 2.0 percent in units and 6.6 percent in value in the first half, according to the Association for Advancing Automation, with unit orders up 35 percent from semiconductor and electronics customers while orders from automakers fell 25 percent. Core capital goods shipments, up 11.4 percent from a year ago, are the broader signal. We would put automation on the watch list.
All three reinforce the pattern. Demand is strongest where the customer is a business, a government or a high-income household, and weakest where the customer is a borrower at today’s rates.
Noah Kahan’s song “The Great Divide” is about longing for a simpler time and place that has drifted out of reach, and that pull sits behind much of the anxiety in an economy splitting into two speeds, as AI makes many workers wonder where they fit. The economy does not run backward, so the task is to build a way to get across.
PART SIX: IS CHINA NOW AN INFLATIONARY SHOCK?
China was the great disinflationary shock of the Great Moderation, and that shock is over. Congress granted China permanent normal trade relations in 2000 and China joined the World Trade Organization in December 2001. That brought hundreds of millions of workers into the supply of tradable goods, held down the price of what the United States imported and, in our view, pulled down labor’s share of income in the rich economies. We argued in August that the shock already happened: the labor supply arrived, the price adjustment was made and the mechanism does not repeat. Part One noted that the Great Moderation had help from China, Eastern Europe and India. That help has gone.
The data now show China exporting price increases, not price declines. Import prices from China rose 0.7 percent in September, the largest monthly gain since December 2021, and are up 3.1 percent from a year ago. China’s own producer prices rose 5.0 percent from a year earlier, the fastest pace since mid-2022, with producer goods up 6.5 percent while consumer goods were down 0.1 percent. That split matters. Factory input costs are rising while finished consumer goods are still flat, so margins are being squeezed and we expect more of the increase to reach Western shelves before it stops.
The tariffs are the second force, and they are smaller and less settled than the headlines suggest. The legal basis has changed three times this year. The Supreme Court struck down the emergency tariffs in February, a temporary 10 percent global duty followed under Section 122, and on July 24 a Section 301 action put an additional 12.5 percent tariff on goods from China and other trading partners over alleged forced-labor imports. The Yale Budget Lab puts the average statutory rate at 11.1 percent as of July 24, rising to 11.8 percent by year-end under current law. The truce with China, which was due to expire on November 10, has been extended through January 10, and disputes over chip export controls remain.
A tariff raises the price level once, but a rebuilt supply chain raises it for longer. Strictly, a tariff is a step up in prices and not a rate of inflation unless it keeps being raised. What sets the response to China apart is that tariffs are paired with reshoring, export controls and diversification, which replace the lowest-cost supplier with a more expensive and safer one. China 1.0 lowered the cost of making goods by moving production to the lowest-cost place. The response moves production for reasons other than cost. We would expect that to show up as a higher floor under goods prices, not a spiral.
Today’s inflation is mostly an energy shock, and we would not credit it to China. Fuel import prices are up 34.5 percent from a year ago and nonfuel import prices are up 6.0 percent, so energy explains the headline while tariffs, freight and currency must explain part of the rest. We have not separated them. Imported consumer goods excluding autos are up 2.7 percent, which is the clearest sign that the goods side is no longer pulling inflation down. The pipeline is the producer price index, up 6.3 percent over the year for final demand (Part Four).
The caveat is that the first China shock was hard to see in industry data. Autor, Dorn, Katz, Patterson and Van Reenen found in 2020 that industries with more exposure to Chinese imports did not account for most of the fall in labor’s share across industries, and Grossman and Oberfield reach a similar conclusion. The answer is general equilibrium: the shock worked through the whole economy’s supply of labor and capital, not one industry at a time. The same limit applies to the reversal. We cannot measure it industry by industry, and it should not be expected to appear in a single series.
The implication for our call is a higher floor for inflation and a higher neutral rate, not a different forecast. For two decades falling goods prices offset rising services prices and let the Fed run low inflation at a low funds rate. If goods prices stop falling, that offset goes away, which is one more reason we treat 2 percent as a goal and not a base rate (Part Eight). The labor-share corollary is that if the supply shock is finished, labor’s share should stop falling for this reason. What has taken it to 59.7 percent (Exhibit 4) in recent years is, we think, capital deepening more than China, and that is the divide in Part Five. We would revisit the argument if import prices from China turn negative from a year earlier once oil fades, or if Chinese consumer goods prices stay below zero while input prices keep rising, which would mean Chinese firms are absorbing the cost and the pipeline is not passing through.
PART SEVEN: THE DIVIDE REACHES THE BALLOT BOX
Europe: the same squeeze with less room to maneuver
The French protests belong in this argument because they are the Great Divide showing up as politics. They began in mid-September over conditions in schools in Paris’s northern suburbs and became a revolt over fuel, energy and food prices. About 550,000 people marched across France on October 17, more than 2,500 were arrested over the weekend and curfews were imposed in Paris, Lyon and parts of the Nord department. Cost-of-living protests have also been reported in Spain, Belgium, Italy and Portugal. Spain’s prime minister called an election for November 29 after housing protests and a parliamentary deadlock.
What separates France from the United States is the price of capital. Its government pays more in debt service than it spends on defense or education, and its 10-year yield is near 5 percent, about 170 basis points over Germany and the widest gap since 2011. That leaves little room to cushion a fuel price shock with spending. The proposals already in the campaign, such as Marine Le Pen’s call for a large cut in the fuel VAT, would widen a deficit that bond markets are pricing, and the presidential election is due next April.
The pattern is the one in Parts Four and Five, with a political edge. A high price of capital squeezes governments and borrowers, an energy shock squeezes everyone who buys fuel, and the young carry more of both. We would not claim the price of capital caused the protests, since the trigger was local and the grievance is living costs. We would argue that governments with little fiscal room are less able to answer that grievance, which is why Europe’s long-term yields and its politics are now linked.
The midterms after Brazil
Brazil’s runoff is a caution about reading first rounds, and a weaker guide to the United States than it looks. Luiz Inácio Lula da Silva won the October 25 runoff with 51.8 percent of the vote, a lead of about 4.4 million votes, after trailing Flávio Bolsonaro 47.0 to 45.2 percent in the first round. Bolsonaro has refused to concede and has asked that the result be annulled after problems at some polling places. A sitting president survived a year of high prices, but Brazil is a net oil exporter, so the energy shock reached its voters differently than it reaches Americans. We would not stretch the comparison.
The U.S. numbers point the other way, and our income framework agrees. We treat a midterm as a referendum on the incumbent’s economy, read through real after-tax income per person in the year before the election. Real disposable personal income per capita was $53,674 in August, 1.1 percent above a year ago and just 0.9 percent above April. In that framework weak gains point to larger House losses for the president’s party. The polls agree: Reuters/Ipsos has President Trump’s approval at 31 percent, with 68 percent disapproving of his handling of the economy, including 37 percent of Republicans, and a generic ballot of 47 to 35 for Democrats. The RealClearPolling average is Democrats 50.5 and Republicans 42.4, an 8.1-point lead.
The House is already priced, so the information is in the Senate and in the size of the swing. Kalshi and Polymarket average 92 percent for a Democratic House and 67 percent for the Senate. At 92 percent the surprise would be a Republican hold, not a Democratic win. The Senate is where the national mood and our income framework are least decisive, because the seats up for election matter more than the national mood. These are market odds and not our seat forecast. We would also watch the age split in the House vote described in Part Five.
The election matters here because every problem in this paper is one that policy has to deal with. Markets and the economy will not close these gaps on their own. A deficit near 7.8 percent of GDP, energy and power supply that have not kept up with demand, a housing shortage that has locked out the young, slower labor force growth and a tariff regime that has changed three times this year are all matters for lawmakers. The results on November 3 will help determine which of them Washington takes up, in what order and with what votes. Divided government usually means fewer large changes and more standoffs, while unified control can move faster but owns the outcome. We take no side in the election. Our forecast assumes no major policy change on these fronts in the next several months, and a result that made one more likely would change the outlook for rates, prices and the divides described above.
For markets, the question is what a divided Congress does to the price of capital. Gridlock makes a new tax or spending package less likely, which helps the deficit at the margin, but it raises the odds of a standoff over funding the government. With the deficit at 7.8 percent of GDP and a Treasury refunding announcement on November 4, we do not expect the election alone to take the 10-year back below 4.75 percent. The Section 301 tariffs are an executive action that a Democratic House cannot repeal on its own, so we would expect hearings and not a change in the tariff rate.
PART EIGHT: WHAT IT MEANS FOR MARKETS AND DECISIONS
Forecasters should stop anchoring to averages from a single era. A 2 percent inflation target is a goal, not a base rate, and a 2.5 percent 10-year yield is a memory. We would use wider ranges around every central estimate and treat the neutral rate as higher than it was in the 2010s. We would also lower the payroll number that counts as a healthy month and watch the unemployment rate and the quits rate instead. Our own forecast follows from that: a pause on October 27 to 28, quarter-point increases in December and March, and long-term yields that stay elevated even after the Fed stops.
What the data show, what is priced and what would change it
The index is a poor guide to any of this, because it averages two economies. Exhibit 11 sets out, for six areas, what the latest data show, what current prices and futures already assume, and what would change the picture. A lower index level is not a signal that the divide has closed.
Exhibit 11. What the Data Show, What Is Priced and What Would Change It
Latest available readings, October 2026
| Area | What the data show | What is priced | What would change the picture |
|---|---|---|---|
| Builders of the buildout (data centers, grid, defense, factories) | Data center construction +73.2% and power +9.7% from a year earlier; core capital goods shipments +11.4%; the big four hyperscalers plan about $725 billion of 2026 capital spending | S&P 500 at 19.0 times forward earnings against a five-year average of 19.8; technology +27.4% year to date | A 10-year yield above 5.50%, or a cut to hyperscaler spending plans (the Nasdaq fell 4.5% in the week ended October 16 on that worry) |
| Energy | Energy +52.6% year to date, the best sector; gasoline +34.2% from a year earlier | FactSet expects third-quarter energy earnings growth of 127.6%, the largest of any sector | Brent below $80 and staying there, which would also ease the long end |
| Housing and other rate-sensitive sectors | 30-year mortgage 7.40%; private residential construction -4.8%; existing-home sales -2.2%; consumer discretionary -5.8% year to date | Little relief: futures put about 89% on a December hike | Our relief scenario (20%): the 10-year at 4.25% to 4.75% with Brent below $85 |
| Long-term Treasuries | 10-year 5.09%, 30-year 5.43%, 2s-10s about 33 basis points; term premium 0.81% (October 14); 10-year breakeven 2.32% | Futures: 85% pause on October 28, 89% hike on December 9 | A weak auction or a non-U.S. bond selloff (term-premium shock, 20%: 10-year at 5.50% to 6.25%) |
| The index and its dispersion | Technology is 39.9% of the S&P 500; technology, communication services and consumer discretionary produced about 75% of earnings growth in each of the first two quarters (State Street) | The index sits about 2% below its record; 84% of reporters have beaten earnings estimates | Narrower beats or stalling estimates; State Street frames the third quarter as the test of whether strength was durable or concentrated |
| Labor-intensive growth (health care and Peak 65) | Health care added 33,000 jobs a month against 45,000 for all payrolls; health care +14.2% year to date | Second-quarter health care earnings growth was negative, the only sector (State Street) | Condominium demand, which depends on the mortgage rate |
Source: Census Bureau, BLS, FactSet Earnings Insight (October 16), State Street Global Advisors (October 12), CME FedWatch via Invezz (October 16), Treasury yields and term premium via SigroResearch, State Street Select Sector SPDR funds; see source notes. The table describes evidence and market assumptions. It is not a recommendation to buy or sell any security and does not reflect any investor’s circumstances.
Scenarios through the first quarter of 2027
We would hold the following scenarios, and the probabilities are our judgment, not model output.
Exhibit 12. Four Scenarios Through the First Quarter of 2027
Probabilities are our judgment, not model output
| Scenario | Probability | 10-year yield | Fed funds | What has to happen |
|---|---|---|---|---|
| Higher for longer (base) | 50% | 4.75% to 5.50% | Pause Oct. 28, hikes Dec. 9 and March to 4.25-4.50% | Oil stays $95 to $110; supply keeps pressure on the long end |
| Relief | 20% | 4.25% to 4.75% | Pause; no December hike | Hormuz traffic recovers, Brent below $85, soft CPI prints |
| Term-premium shock | 20% | 5.50% to 6.25% | Hold or hike; cost of funds rises | Weak auction, wider shipping war or a gilt or JGB selloff |
| Growth scare | 10% | 3.75% to 4.50% | Cuts priced for 2027 | Payrolls turn negative, equities and credit sell off |
The first row is our base forecast. The scenarios assume the real yield stays near its September level in the base case and that expected inflation stays between 2.3 and 2.8 percent. The asymmetry is the point: the relief scenario needs oil and policy to cooperate, and the term-premium scenario needs only a bad auction.
Catalysts
Four dates matter most: the October 28 and December 9 Fed decisions, the November 3 midterm elections and the November 6 jobs report. The rest of the calendar tests the pieces of the argument one at a time.
Exhibit 13. Calendar of Catalysts, October 2026 to January 2027
Release times are 8:30 a.m. Eastern; FOMC decisions are at 2:00 p.m.
| Date | Event | What we are looking for |
|---|---|---|
| Wed, Oct. 28 | FOMC decision (meeting October 27 to 28) | We expect a pause, and futures put 85 percent on one. Look for any signal on December; Chair Warsh has declined to preview the decision. |
| Thu, Oct. 29 | Third-quarter GDP, advance estimate; personal income and outlays, September | Whether equipment and data center investment is carrying growth while consumer spending slows, and whether the PCE price index confirms the pipeline. |
| Tue, Nov. 3 | Midterm elections | The first national test of how wide the age split is and how much housing costs matter to it, and a guide to how much policy change Washington can deliver on the deficit, energy and housing. |
| Wed, Nov. 4 | Treasury quarterly refunding announcement | How much new issuance goes to longer maturities with the 10-year near 5 percent. |
| Fri, Nov. 6 | Employment Situation, October | Payrolls against a break-even pace of zero to about 50,000, and entry-level unemployment. |
| Tue, Nov. 10 | Consumer Price Index, October | Whether headline inflation holds near 3.7 percent with core near 2.6 percent. |
| Fri, Dec. 4 | Employment Situation, November | Confirm or break the October reading before the Fed meets. |
| Wed, Dec. 9 | FOMC decision with new projections (meeting December 8 to 9) | Our base case is a quarter-point increase, which futures put near 89 percent. The projections show where participants see the neutral rate. |
| Thu, Dec. 10 | Consumer Price Index, November | The first inflation reading after the December decision. |
| Wed, Jan. 27, 2027 | FOMC decision (meeting January 26 to 27) | We expect a hold. Our second increase comes at the March 16 to 17 meeting, with June 8 to 9 on the fence. |
Source: BLS, BEA and Federal Reserve release calendars as compiled by FedRateCalc and Eco3min and the Federal Reserve’s 2027 meeting calendar; our judgment.
What this means for decisions
Treasurers and CFOs should plan for capital that costs what it cost in the 2000s, not the 2010s. We would term out debt ahead of a long end that stays elevated, assume borrowing is expensive abroad too, and budget diesel separately from crude. The refinancing assumptions in many plans were written in the post-crisis decade and have not been updated.
Employers face an unusual bargain. Experienced staff are staying and entry-level candidates are plentiful. We would still hire at the bottom, because the retirement wave will not wait and the people who learn the work now are the supervisors of 2030. A firm that skips two classes of entry-level hires will find the gap when its oldest cohort finally leaves.
Policymakers face the hardest version of the problem. The Fed can slow demand, but it cannot add oil, build power plants or close a 7.8 percent deficit, and each of the three is pushing yields in the same direction. A central bank that treats a supply-driven rise in long-term rates as an overheating signal risks tightening into a slowdown.
WHAT WE MIGHT BE MISSING
As comprehensive as this report is, we know we are likely missing something significant.
First, the evidence is descriptive. We compare era averages and decompose one model-based yield. We have not estimated a structural model, tested for a break in the real-rate series, or compared our scenario probabilities with market-implied distributions. A sell-side desk would, and we intend to. The Cleveland Fed decomposition is also model-based, and a different model could split the move differently.
Second, eras are drawn with hindsight, and this one may be a transition. The Great Moderation was named after it was already two decades old. If the energy shock fades and the war ends, a good part of what we call a new era may look in a year like an unusually bad six months. We have not proved that the present configuration lasts. We have argued that the conditions behind the earlier ones have gone.
Third, the comparisons rest on choices we made. Era boundaries drive the averages. The 10-year yields in Exhibit 1 and the real yields in Exhibit 3 use January readings, which understate how fast yields rose in 2022 and 2023. The post-crisis decade includes a slow recovery from 9.6 percent unemployment that would not look the same if we started in 2013. A different set of boundaries would move the numbers, and we think it would leave the direction of the argument unchanged, but we have not shown that.
Fourth, an AI productivity boom could rescue the older pattern. If the capital now being built raises output per worker meaningfully, growth rises, deficits shrink and the capital pays for itself. CBO’s April work found that a 0.1 point faster rate of productivity growth trims cumulative 2027 to 2036 deficits by about $317 billion, which is real but small against $24.4 trillion. A larger gain is plausible, and we have no way of ruling it out. Stephen Roach raised the same identification problem in 1998, asking whether the technology spending of the dot-com boom reflected a lasting rise in trend productivity or a series of one-off cost cuts, and noting that the evidence could not yet tell the two apart. That question took years to settle, and we cannot settle it for AI today.
Fifth, the capital share is partly structural, and the K-shaped spending data are contested. A more capital-intensive economy will show a higher capital share and a lower labor share even if no one’s bargaining power has changed. The Minneapolis Fed review finds that only Moody’s and part of the Bank of America data show a sharp divergence in spending, while the New York Fed and BLS series do not. We have relied on income shares, returns, hiring and sentiment for the K, and we would not lean on the spending data alone.
Sixth, three smaller limits apply. Part of the decoupling is measurement, because the gap between growth and jobs may narrow if the benchmark revision or the self-employed data tell a different story. Demography was visible in the 2010s and can explain low payroll growth without any new era, and the evidence tying young-worker unemployment to artificial intelligence is circumstantial. The divide itself is not new, since wealth and income gaps widened through the 2010s; our claim is that it now shows up in hiring, borrowing costs and prices, and we have shown that over months, not across a full cycle. The seven themes are a framework, not an estimate: we have not measured how much growth each supplies, and announced investment is not spending put in place.
Seventh, the stock market divide is narrower than the sector table suggests. Sector funds are cap-weighted, so a few mega-cap companies dominate each one, and the equal-weight S&P 500 fund was ahead of the cap-weighted fund by about 3.6 points through August 26. The earnings gap is smaller than the price gap, and the estimates of AI’s share of growth run from about a quarter to more than a third, depending on the method. We rely on the direction, which is consistent across the sources, and not on any one figure. Technology’s 7.7 percent drop in the week ended October 16 is a reminder that the gap can narrow quickly, and we would not read one good or bad week as the end of the divide.
Eighth, the age divide is partly a wealth divide and partly a rate-lock effect, and neither is permanent. Age is a proxy for wealth, tenure and income, and we have not separated them. The advantage of an old mortgage fades as loans are paid off or sold, and if rates fall the young face lower costs. A midterm exit poll can show how people of different ages voted but not why, and housing is one grievance among several, with food, protecting democracy and immigration ahead of it for all voters in CNBC’s survey. We would treat the midterms as a test of the divide, not a measurement of it.
WHAT WOULD CHANGE OUR MIND
We would revise this view on any of the following.
- The expected real 10-year yield falls back below 1 percent while inflation drifts toward 2 percent. That would mean the post-crisis pattern is returning and the present is a spike. We would also revise if the term premium, once we add it, explains most of the rise.
- Three-month average payroll growth recovers above 100,000 while real GDP growth stays near 2 percent. That would mean growth and jobs have recoupled.
- Annual CPI inflation stays inside a 2 to 3 percent band for two years. That would mean volatility has returned to Great Moderation levels.
- Workers’ share of national income rises back above 62 percent while hiring and real wages recover. That would mean the gains of the expansion are being shared again.
- The quits rate rises back toward 2.3 percent and recent-graduate unemployment falls below the national rate. That would mean the labor market is churning again and the entry-level squeeze was a phase.
- Brent falls below $80 and stays there while long-term yields stay above 5 percent. That would point to capital demand and government borrowing as the cause, which strengthens our argument. If yields fall with oil, the cause was energy, and the new-era claim weakens.
- Private residential construction spending turns positive from a year earlier while the 30-year mortgage rate stays above 7 percent. That would mean the rate-sensitive half has adapted to the price of capital. The divide would then be closing from below, not from above.
- Midterm exit polls show voters under 35 and over 65 splitting no differently than they did in 2022. That would mean the housing frustration has not become a political divide. The age divide would then be an economic fact with little political weight.
CONCLUDING THOUGHTS
The economy did not return to normal after the pandemic. It had a strong run that was powered by forces (fiscal and monetary stimulus, as well as pent-up demand for experiences) that are now largely spent, and it is arriving somewhere that none of the earlier eras prepared us for.
Long-term rates are back at the level of the late 1990s while inflation swings are wider than they were then. Hiring has slowed while output keeps growing. The Fed is tightening and the long end has stopped following it. The average has stopped being a guide, because the average economy is the sum of different ones, and the lines between them run through capital and labor, technology and everything else, the sectors that borrow and the sectors that do not, and the young and the old.
We do not think the right response is nostalgia, and we do not think it is alarm. A capital-intensive expansion is pulling in more capital than the world has to spare at the old price, and governments are asking for the same money. That sets the price of capital, and the price of capital sets a good deal else. How Washington deals with it, from the deficit to energy and housing supply, will be shaped by the November 3 elections. The task for forecasters, treasurers and investors is to build plans around the economy that exists and to stop waiting for the one that used to.
Mark P. Vitner
President & Chief Economist, Piedmont Crescent Capital
mark.vitner@piedmontcrescentcapital.com · 704-458-4000
Important disclosures. A View from the Piedmont and the Piedmont Perspective are published by Piedmont Crescent Capital, LLC for informational and educational purposes only. Nothing in this report is investment, legal, tax or accounting advice, a recommendation to buy or sell any security or other financial instrument, or an offer or solicitation of any kind. It does not take into account the objectives, financial situation or needs of any person, and readers should consult their own advisors before acting. The report relies on data and sources we believe are reliable, including the secondary reports named in the source notes, but we do not guarantee their accuracy or completeness. Forecasts, scenario probabilities and views are our judgment as of the date of publication. They are forward-looking, uncertain and subject to change without notice, and they may prove wrong. Past performance is not a guide to future results. Piedmont Crescent Capital has no obligation to update this report. The views are those of the author and do not necessarily reflect those of any other firm or organization.
SOURCE NOTES
Exhibits. Exhibit 1: Treasury 10-year constant-maturity yield, January average by year, via multpl.com; latest point is the October 9, 2026 close. Exhibit 2: Cleveland Fed 10-year real interest rate and 10-year expected inflation (EXPINF10YR), monthly, via FRED. Exhibit 3: Cleveland Fed 10-year real interest rate (REAINTRATREARAT10Y, model-based) and BEA real GDP growth (A191RL1A225NBEA), both via FRED; January readings and September 2026; our calculations. Exhibit 4: BEA via FRED, national income, compensation of employees, corporate profits with inventory valuation and capital consumption adjustments, and net interest and miscellaneous payments, first quarter of each year 1980 to 2026 and second quarter 2026; our calculations. The BLS labor share of nonfarm business output (Productivity and Costs, second quarter 2026) is cited in the text. Exhibit 5: Treasury; S&P 500 bull-market gain of 119% since October 2022 as reported in our October 10 scan, annualized by us; BLS Productivity and Costs, Q2 2026 (revised, September 3), and Employment Situation, September 2026. Exhibit 6: U.S. Census Bureau, Construction Spending, August 2026 (released October 1), year-over-year changes in value put in place, as compiled by KPMG and the Cranberry Journal. Exhibit 7: State Street Select Sector SPDR funds and SPY, price returns year to date through October 16, 2026, via thetrading.tools. Exhibit 8: Census Bureau construction spending and durable goods (August); Federal Reserve industrial production, September; Freddie Mac Primary Mortgage Market Survey, October 8; NAR existing-home sales for September; NAHB/Wells Fargo Housing Market Index for September; NFIB Small Business Economic Trends for September; Federal Reserve Beige Book of September 2; sector fund returns as in Exhibit 7. Exhibit 9: Census Bureau Housing Vacancy Survey, second quarter 2026, as reported by NAHB; BLS Consumer Expenditure Survey, percent of consumer units age 65 or over who are homeowners without a mortgage, 2024, via FRED; Federal Reserve Governor Barr, September 23, 2026, citing Federal Reserve staff calculations from the National Mortgage Database; Freddie Mac Primary Mortgage Market Survey, October 8; NAR 2026 Home Buyers and Sellers Generational Trends report, as reported by Fortune; CNBC All-America Economic Survey, July 8 to 12, 2026. Exhibit 10: sources listed beneath the exhibit. Exhibit 11: Census Bureau, BLS, Federal Reserve and Freddie Mac series as in Exhibits 6 through 10; FactSet Earnings Insight, October 16, 2026; State Street Global Advisors, Mind on the Market, October 12, 2026; CME FedWatch probabilities as reported by Invezz (October 16); 10-year, 30-year, 2s-10s, breakeven and term premium readings of October 14 and 15 via SigroResearch. Exhibit 12: our judgment. Exhibit 13: release calendars as noted beneath the exhibit.
Official statistics. BLS Employment Situation, September 2026 (released October 2) · FRED, federal outlays on interest (FYOINT), fiscal years 1984 to 2025 · Oxford Economics break-even payroll estimate (late July 2026), as reported by Fortune · BLS JOLTS, August 2026 (released September 29) · BLS The Economics Daily, “Labor share at its lowest level, 52.8 percent, in second quarter 2026” · Minneapolis Fed, “Have U.S. consumers gone K-shaped? A review of the data,” 2026, citing Moody’s Analytics, the New York Fed’s Economic Heterogeneity Indicators and BLS consumer expenditure surveys · Federal Reserve Bank of New York, labor market for recent college graduates, March 2026 data, as reported by Bloomberg Law · Atlanta Fed Macroblog, “Aftermath of the Pandemic Retirement Boom,” November 20, 2025 (data through May 2025) · European Commission, third demography report, July 14, 2026, as reported by EU Perspectives · BEA, personal income and outlays for August and third estimate of second-quarter GDP (September 30), including the annual update · ISM Services PMI, September 2026 · University of Michigan Surveys of Consumers, preliminary October 2026 · Federal Reserve minutes of the September FOMC meeting, released October 7 · Congressional Budget Office letter of September 24, 2026, October 8 reports on higher interest rate scenarios and the Monthly Budget Review, and April 21 sensitivity analysis · U.S. Treasury 10-year auction results, October 7, via Wolf Street · BLS Consumer Price Index, September 2026 (released October 14) · BEA, GDP third estimate for the second quarter (September 30), and real GDP (GDPC1) via FRED, second quarter 2026 against second quarter 2025 · U.S. Census Bureau, Construction Spending, August 2026 (October 1), as compiled by KPMG and the Cranberry Journal · U.S. Census Bureau, Advance Durable Goods Report, August 2026, via First Trust · Federal Reserve, Beige Book, September 2, 2026 · NFIB, Small Business Economic Trends, September 2026 (October 13) · National Association of Realtors, existing-home sales, September 2026, via RISMedia · NAHB/Wells Fargo Housing Market Index, September 2026, via Trading Economics · Freddie Mac, Primary Mortgage Market Survey, October 8, 2026, via Mortgage News Daily · U.S. Energy Information Administration, Short-Term Energy Outlook, September 2026, as reported by OilPrice.com · NIC MAP, senior housing, second quarter 2026 · S&P Dow Jones Indices, U.S. Sector Dashboard, September 30, 2026 · Boeing, third-quarter 2026 deliveries, October 13 · Census Bureau, Advance Monthly Retail Trade, September 2026 (October 15), via Haver Analytics · BLS Producer Price Index, September 2026 (October 15) · Federal Reserve, Industrial Production and Capacity Utilization, September 2026 (G.17, October 16) · Federal Reserve Bank of New York, Empire State Manufacturing Survey, October 2026 · Federal Reserve Bank of Philadelphia, Manufacturing Business Outlook Survey, October 2026 (October 15), via Trading Economics · stock market closes of October 15 and 16, via Yahoo Finance and The Market Breakdown · Fed Chair Warsh remarks of October 15, via Trading Economics · U.S. Census Bureau, Housing Vacancy Survey, second quarter 2026, via NAHB Eye on Housing · BLS Consumer Expenditure Survey via FRED (CXU980240LB0407M) · Federal Reserve Governor Barr remarks of September 23, via The Money Overview · NAR generational trends report, 2026, via Fortune (April 17) · CNBC All-America Economic Survey, July 2026, via The MortgagePoint. Added in the October 18 revision: FactSet Earnings Insight, October 16, 2026 · State Street Global Advisors, Mind on the Market, October 12, 2026 · CME FedWatch probabilities via Invezz, October 16 · Briefs Finance report on Chair Warsh’s remarks, October 16 · SigroResearch daily rates summary, October 15 · FedRateCalc and Eco3min economic calendars. Added in the October 26 revision: BLS, U.S. Import and Export Price Indexes, September 2026 · National Bureau of Statistics of China, Industrial Producer Price Indexes, September 2026 (October 15) · Yale Budget Lab, The State of U.S. Tariffs, July 24, 2026 · Reuters on the U.S.-China tariff truce, September 21, 2026, and Treasury Secretary Bessent on the extension to January 10 · BEA, real disposable personal income per capita, August 2026 · Reuters/Ipsos poll closed October 19 · RealClearPolling generic ballot average · Kalshi and Polymarket odds for the House and Senate · Israel Hayom, October 20, on the French protests · Treasury 10-year yield, October 23 close · CBS News on the Brazilian runoff, October 26 · The National on Spain’s election call, October 5 · Reuters/Ipsos poll as reported by KTVU, October 20 · Dodge Construction Network, Construction Starts, July and September 2026.
Research and commentary. Roach, “Global Restructuring: Lessons, Myths, and Challenges,” Morgan Stanley Dean Witter Special Economic Study, June 12, 1998 · Stock and Watson, “Has the Business Cycle Changed and Why?” NBER Macroeconomics Annual, 2002 · Bernanke, “The Great Moderation,” remarks at the Eastern Economic Association, February 20, 2004 · Blanchard, “Public Debt and Low Interest Rates,” American Economic Review, 2019 · Summers on secular stagnation, 2013 and 2014 · Holston, Laubach and Williams, “Measuring the Natural Rate of Interest,” 2017 · Goodhart and Pradhan, The Great Demographic Reversal, 2020 · Karabarbounis and Neiman, “The Global Decline of the Labor Share,” Quarterly Journal of Economics, 2014 · Autor, Dorn, Katz, Patterson and Van Reenen, “The Fall of the Labor Share and the Rise of Superstar Firms,” Quarterly Journal of Economics, 2020 · Brynjolfsson and McAfee on the decoupling of productivity and median pay, Race Against the Machine, 2011, and The Second Machine Age, 2014 · Fitch Ratings sovereign debt report, July 23, 2026, via Hellenic Shipping News · company capital spending guidance via Yahoo Finance · Nvidia chief financial officer remarks on hyperscaler spending, as recorded in our August 28 scan · fxmacrodata.com and Reuters (via Vantage Markets) for non-U.S. yields · Euronews, gCaptain and Insurance Business for the energy and storm material · ING Think, “How much is AI contributing to US economic growth?” August 20, 2026 · Wells Fargo estimate of AI’s share of GDP growth, as reported by Marketplace, September 30, 2026 · FactSet Earnings Insight, July 20, 2026 · Yahoo Finance on equal-weight and cap-weighted S&P 500 funds, August 28, 2026 · Edison Electric Institute capital expenditure projections, as reported by Latitude Media, October 2025 · Association for Advancing Automation, North American robot orders, second quarter 2026 · company announcements and reports on U.S. pharmaceutical manufacturing commitments: Eli Lilly (October 22, 2026), AstraZeneca (October 9, 2025), Johnson & Johnson (March 21, 2025), Merck (company pages and BioPharma Dive, March 2025 and October 2026) and Pfizer (September 30, 2025), via Fierce Pharma, BioSpace and Reuters · Scripps News on the FY2027 defense budget request, April 21, 2026 · Grossman and Oberfield, “The Elusive Explanation for the Declining Labor Share,” Annual Review of Economics, 2022 · Piedmont Perspective of August 2026, “The Shock That Already Happened.”
Cautions carried in the text rather than in a footnote. Several figures (the third-quarter move in yields, the Nvidia remark, non-U.S. yield levels, the New York Fed and European Commission figures, and the construction, durable goods, housing and sector figures in Part Five) were read through the secondary reports named above, not the original releases. This edition does not include 5-year 5-year forward breakevens, the New York Fed neutral-rate estimate or consensus forecasts. The term premium, the Treasury curve and the futures-implied rate odds were read through the secondary reports named above. The scenario probabilities are our judgment. The September CPI release of October 14 and the PPI and retail sales releases of October 15 are reflected in the text and do not change the exhibits; the Brazil, Reuters/Ipsos, prediction-market and French protest figures in Part Seven were read through the press reports named above, which no longer use trailing CPI. Exhibits 1 and 5 end at the October 9 close, and the text says so where the figures have since moved. Unless a date is given, figures in Parts One through Five and the exhibits are as of October 16; the October 23 readings for the 10-year yield, Brent and diesel appear where the text gives them, and Parts Six and Seven use data through October 26.
METHODOLOGICAL APPENDIX
Every figure below is either published or is arithmetic on published figures, and we identify which.
1. Era definitions. Great Moderation 1984 to 2007, following Stock and Watson and Bernanke. Post-crisis 2010 to 2019, excluding 2008 and 2009. Pandemic recovery 2021 to 2024, excluding 2020, the year of the shutdown. The choices matter and we have said where.
| Measure | 1984-2007 | 2010-2019 | 2021-2024 | Now |
|---|---|---|---|---|
| CPI inflation, average | 3.1% | 1.8% | 4.9% | 3.7% (Sept.) |
| Unemployment rate, average | 5.7% | 6.2% | 4.2% | 4.2% (Sept.) |
| Real GDP growth, average | 3.3% | 2.4% | 3.7% | 2.3% (2025) |
| 10-year yield, January average | 6.7% | 2.6% | 2.6% | 5.24% (Oct. 9) |
| Expected real 10-year yield, January | 3.3% | 0.7% | 0.9% | 2.2% (Sept.) |
| Expected real yield less real GDP growth | 0.0 | -1.7 | -2.8 | -0.1 |
| Standard deviation, annual CPI | 0.9 | 0.8 | 1.9 | n.a. |
2. The yield series. Exhibit 1 and the nominal yield averages use the January monthly average for each year, taken from the multpl.com series for the 10-year constant-maturity Treasury. These understate how far yields rose during 2022 and 2023, because the January readings predate most of the increase. The “Now” figure is the October 9 close.
3. The real rate and expected inflation. Exhibits 2 and 3 use the Cleveland Fed’s model-based 10-year expected real interest rate and expected inflation. Their sum is a model-based 10-year yield that differs from the market yield, 4.82 percent for the September average against 5.24 percent on October 9. We use the series for decomposition and era comparison, not as a forecast of the market yield. The real rate includes risk premia. In version 1 of this piece we subtracted trailing CPI inflation from the nominal yield, which showed a real yield of minus 2.3 percent in the pandemic recovery. That overstated how negative real rates were ex ante, and we replaced it.
4. Real GDP growth. BEA annual percent change in real GDP, via FRED, for 1984 to 2025. The pandemic recovery average is raised by 6.3 percent in 2021. The “Now” figure uses 2025 growth of 2.3 percent because the full-year 2026 figure is not available. The 2.2 percent change over the past year is real GDP (GDPC1) in the second quarter of 2026 against the second quarter of 2025, our calculation.
5. Break-even payrolls. The zero to 40,000 range is our own estimate. The Oxford Economics estimate near 50,000 and its history are as reported by Fortune on August 1, 2026, and we have not seen the underlying report.
6. Income shares. Exhibit 4 divides compensation of employees, and separately corporate profits (with inventory valuation and capital consumption adjustments) plus net interest and miscellaneous payments, by national income, using the first quarter of each year and the second quarter of 2026. The remaining shares, proprietors’ income, rental income and taxes on production and imports less subsidies, are not shown. Proprietors’ income mixes labor and capital, and we did not try to split it. The national income compensation share differs from the BLS labor share, which covers only the nonfarm business sector, so the two levels are not comparable.
7. Scenario probabilities. The probabilities in Part Eight are our judgment. We have not calibrated them against market-implied distributions, options-implied yield distributions or consensus forecasts.
8. Sector returns and construction. Exhibit 7 uses year-to-date price returns, which exclude dividends, for the Select Sector SPDR funds and SPY through October 16. The funds cap the weight of the largest holdings, so they are not identical to the S&P 500 sectors, and they understate the performance of smaller companies inside each sector. Exhibit 6 uses year-over-year changes in seasonally adjusted annual-rate value put in place for August 2026, not adjusted for price changes. The subcategory figures were read from the Census release as compiled by KPMG and the Cranberry Journal.
9. Technology weights. The 39.9 percent technology weight in the S&P 500 is the Select Sector Indices weight at September 30 from the S&P Dow Jones Indices sector dashboard. The 17 percent equal-weight figure is as of August 25, from Yahoo Finance, so the two dates differ.
10. The age divide. The homeownership rates are the Census Bureau’s for the second quarter of 2026, as reported by NAHB. The 54 percent mortgage-free figure is the BLS share of all households headed by someone 65 or older, renters included, so the share among owners alone is higher. The payment comparison is our arithmetic for a $400,000 30-year fixed-rate loan, principal and interest only, at 7.40 percent (Freddie Mac, October 8) and at 4.00 percent, which gives about $2,770 and $1,910 a month. The NAR and CNBC figures are survey results as reported by the secondary sources named above.
11. What we did not do. We have not estimated a neutral rate for the new era, we have not added taxes on production and imports to the capital side, we have not decomposed the 10-year yield with a term premium series, we have not tested whether the volatility measure is statistically different across eras, and we have not measured how much of the growth above average each of the seven themes supplies. Each is doable and none is done here.