Higher Mortgage Rates Cut into New Home Sales
New Home Sales Weaken in October
- New home sales declined 5.6% to a 679,000 unit pace. Sales for the prior month were also revised significantly lower.
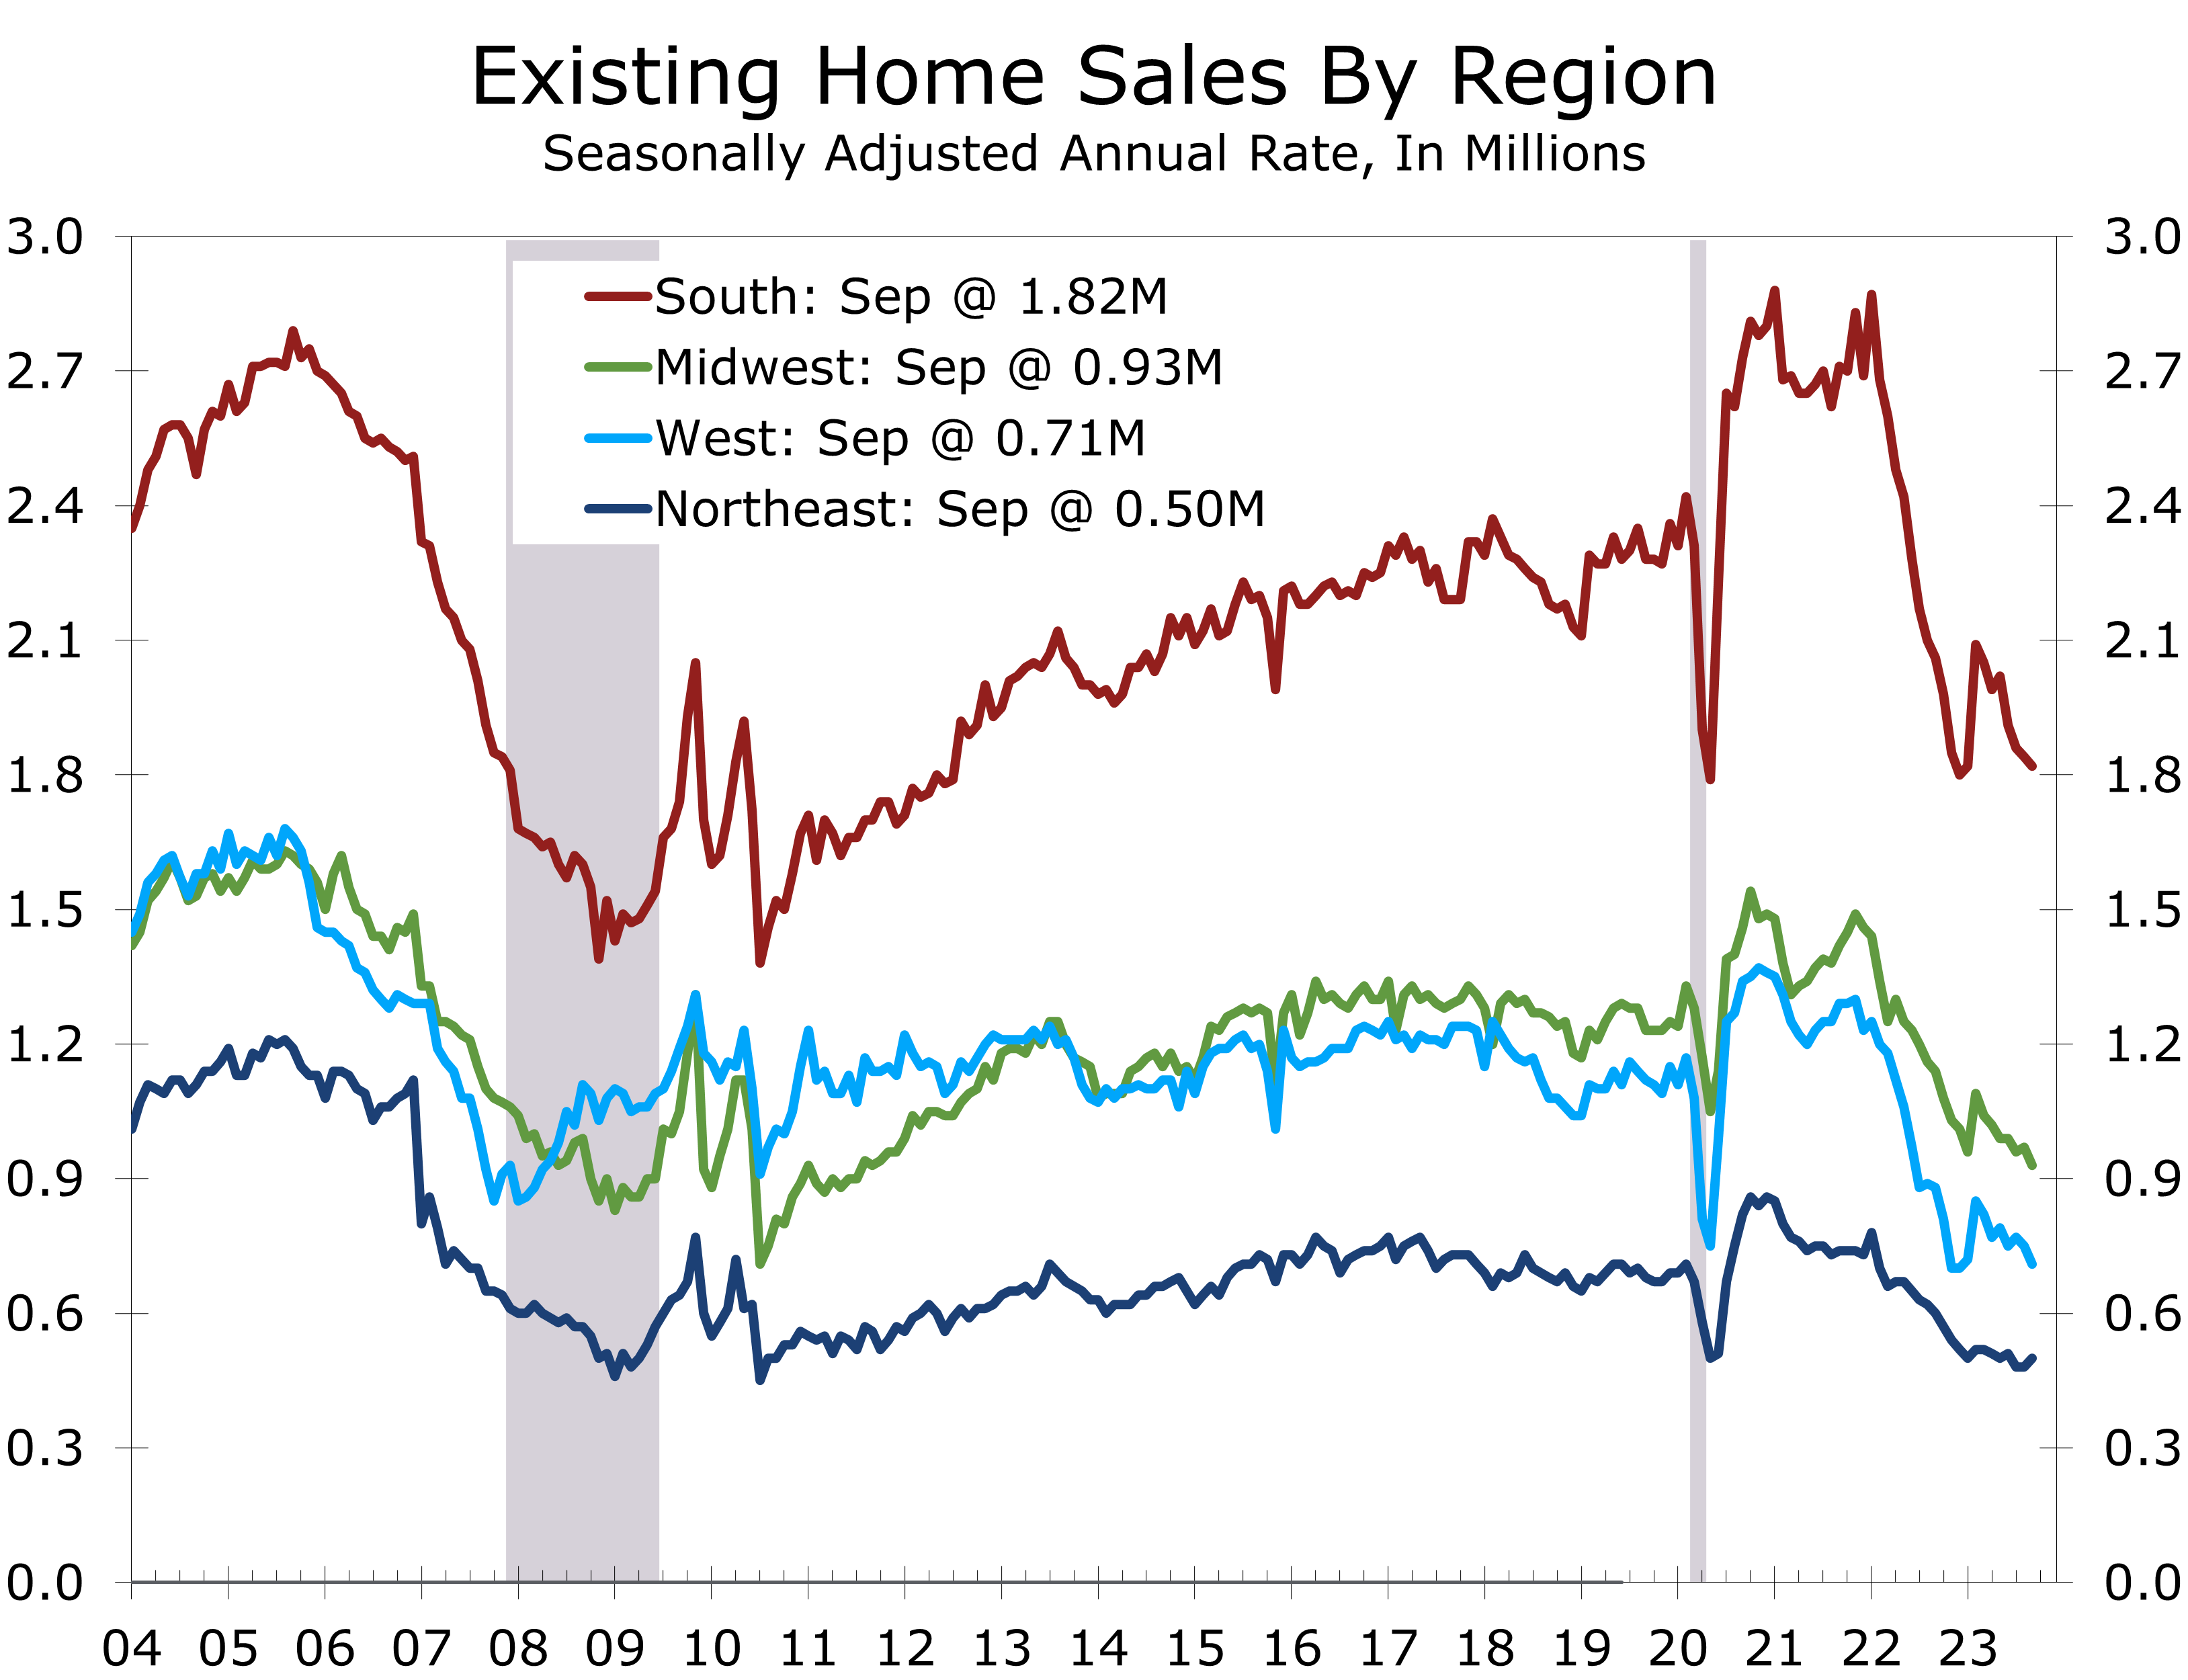
- Sales rose in the Northeast (+13.2%) and the South (+2.1%) during October but fell sharply in the West (-23.3%) and Midwest (-16.4%).
- The inventory of new homes rose slightly to 439,000, which translates into a 7.8-months’ supply at October’s slower sales pace.
- The median price of a new home fell 3.1% to $409,300 in October and is a whopping 17.6% below its year ago level.
- The sharp decline in home prices over the past year reflects both increased discounting by home builders and an increased focus on building lower-priced homes.
- New home sales continue to benefit from the paucity of existing homes for sale. New home sales are up 17.7% year-to-year, while existing home sales have fallen 14.6%.
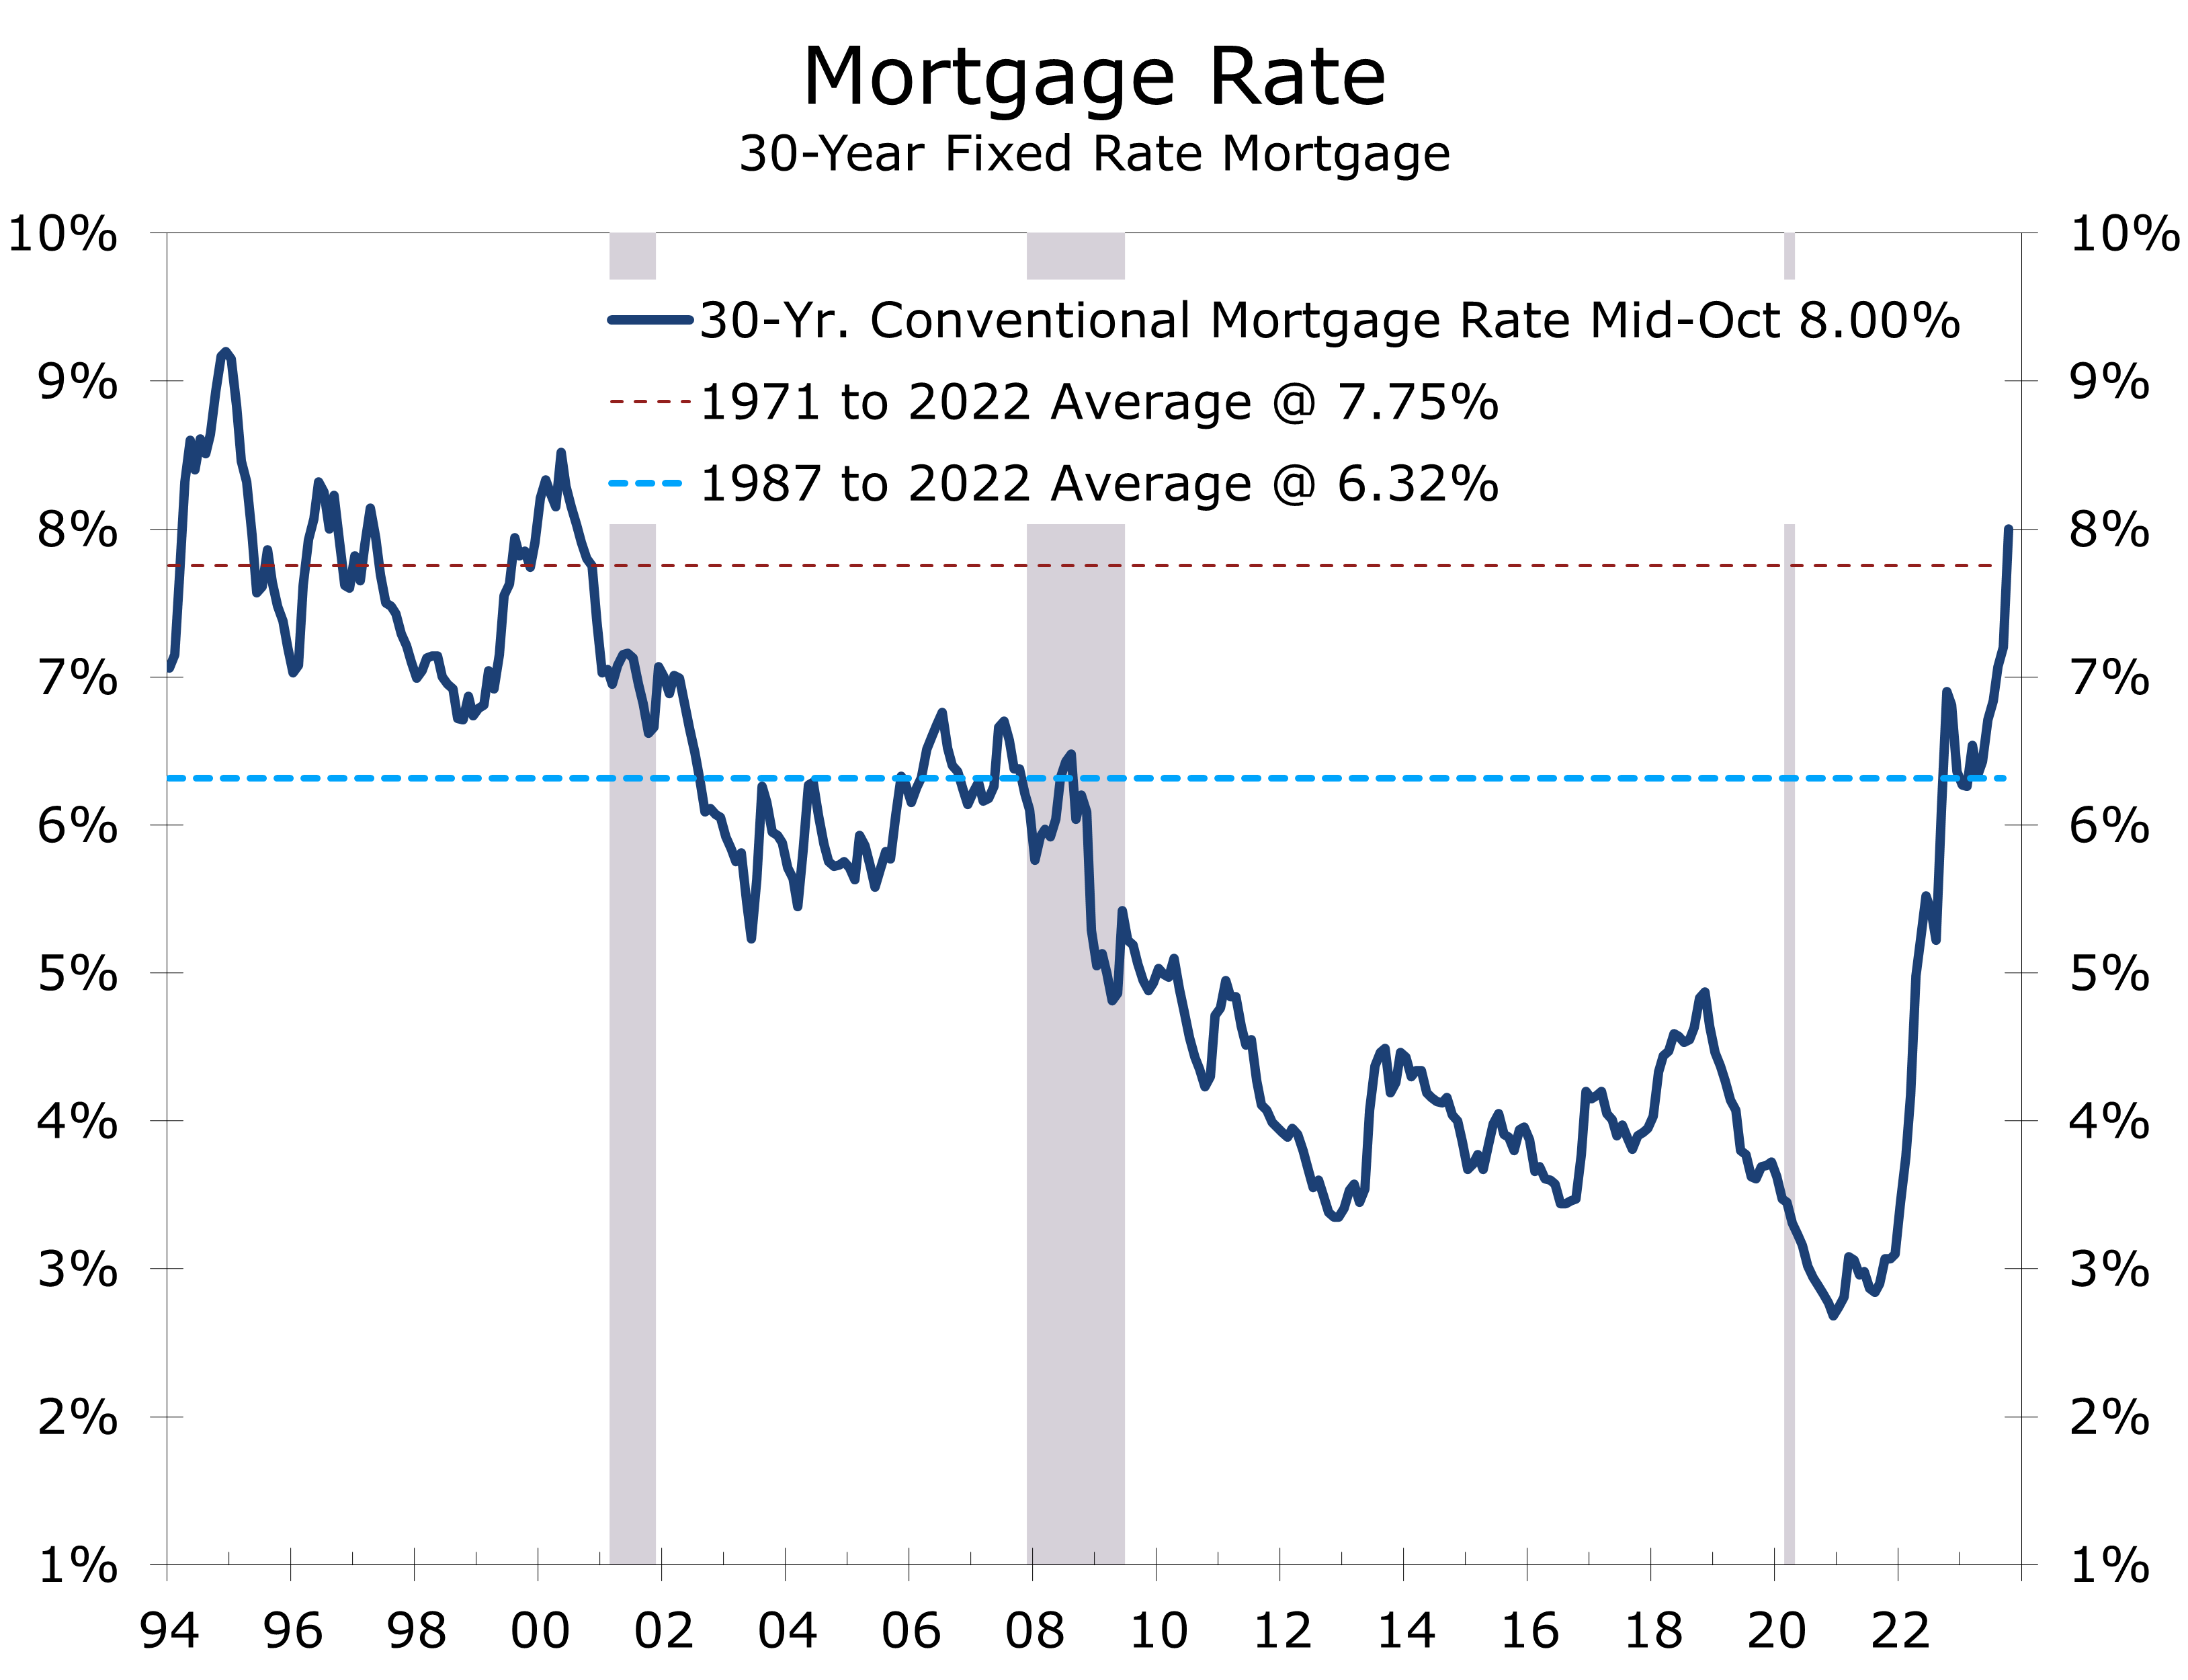
- Mortgage rates spiked to their highest level in 23 years during mid-October, which likely priced out many would-be buyers. Mortgage rates have since fallen back to below 7.5% in the past month, which might bring some of those buyers back in November.
New home sales fell 5.6% to a 679,000-unit pace in October and sales for the prior two months were also revised lower. The slower sales pace is not surprising given the spike in mortgage rates, which saw rates peak just under 8% in late October. We suspect that spike in rates was too much for many buyers and likely led to some contract cancellations as well. Rates have since fallen about a half percentage point to just under 7.5%, which should bring some buyers back to the market in the normally seasonally slow months of November and December.
The pullback in new home sales has allowed inventories to increase, with overall inventories climbing by 6,000 to 439,000 homes at the end of October. That translates into a 7.8-months’ supply of homes at October’s sales rate, which is a bit high from a historic standpoint but not all that concerning given the historically low levels of existing home inventories.
New home buyers stepped back from the market as mortgage rates approached 8%.
Home builders continue to benefit from the lack of existing homes, which has sent more buyers to the new home market. New homes accounted for 16.7% of overall single-family home sales in October, compared to 12.7% a year ago. New home sales are also proving more resilient to rising mortgage rates, as home builders are able to buy down mortgage rates to help reduce the sting of rising interest rates.

The median price of a new home fell 3.1% to $409,300 in October and has fallen 17.6% over the past year. That marks one of the sharpest pullbacks in the median price of a new home on record. Part of the drop reflects the increased use of discounts and incentives. Builders are also shifting their mix of offering to smaller and more affordable homes, many of which are aimed at first-time home buyers.
The use of incentives has become commonplace. The latest NAHB survey shows that 60% of builders offered incentives in November, which was down from 62% in October. Mortgage rate buydowns are the most commonly offered incentive, which makes homes more affordable and also protects community home values. Price discounts are also becoming more prevalent, however, with 36% of builders reducing price in November, which marks a high for the cycle.
Home prices have fallen sharply, reflecting price cuts and a shift toward lower priced homes.
Builders have some room to offer discounts because building material prices have stabilized somewhat. Most incentives, however, come out of an existing incentives budget. Buyers are simply choosing to use incentives to reduce their mortgage rate or reduce their purchase price rather than upgrade their countertops or appliances.
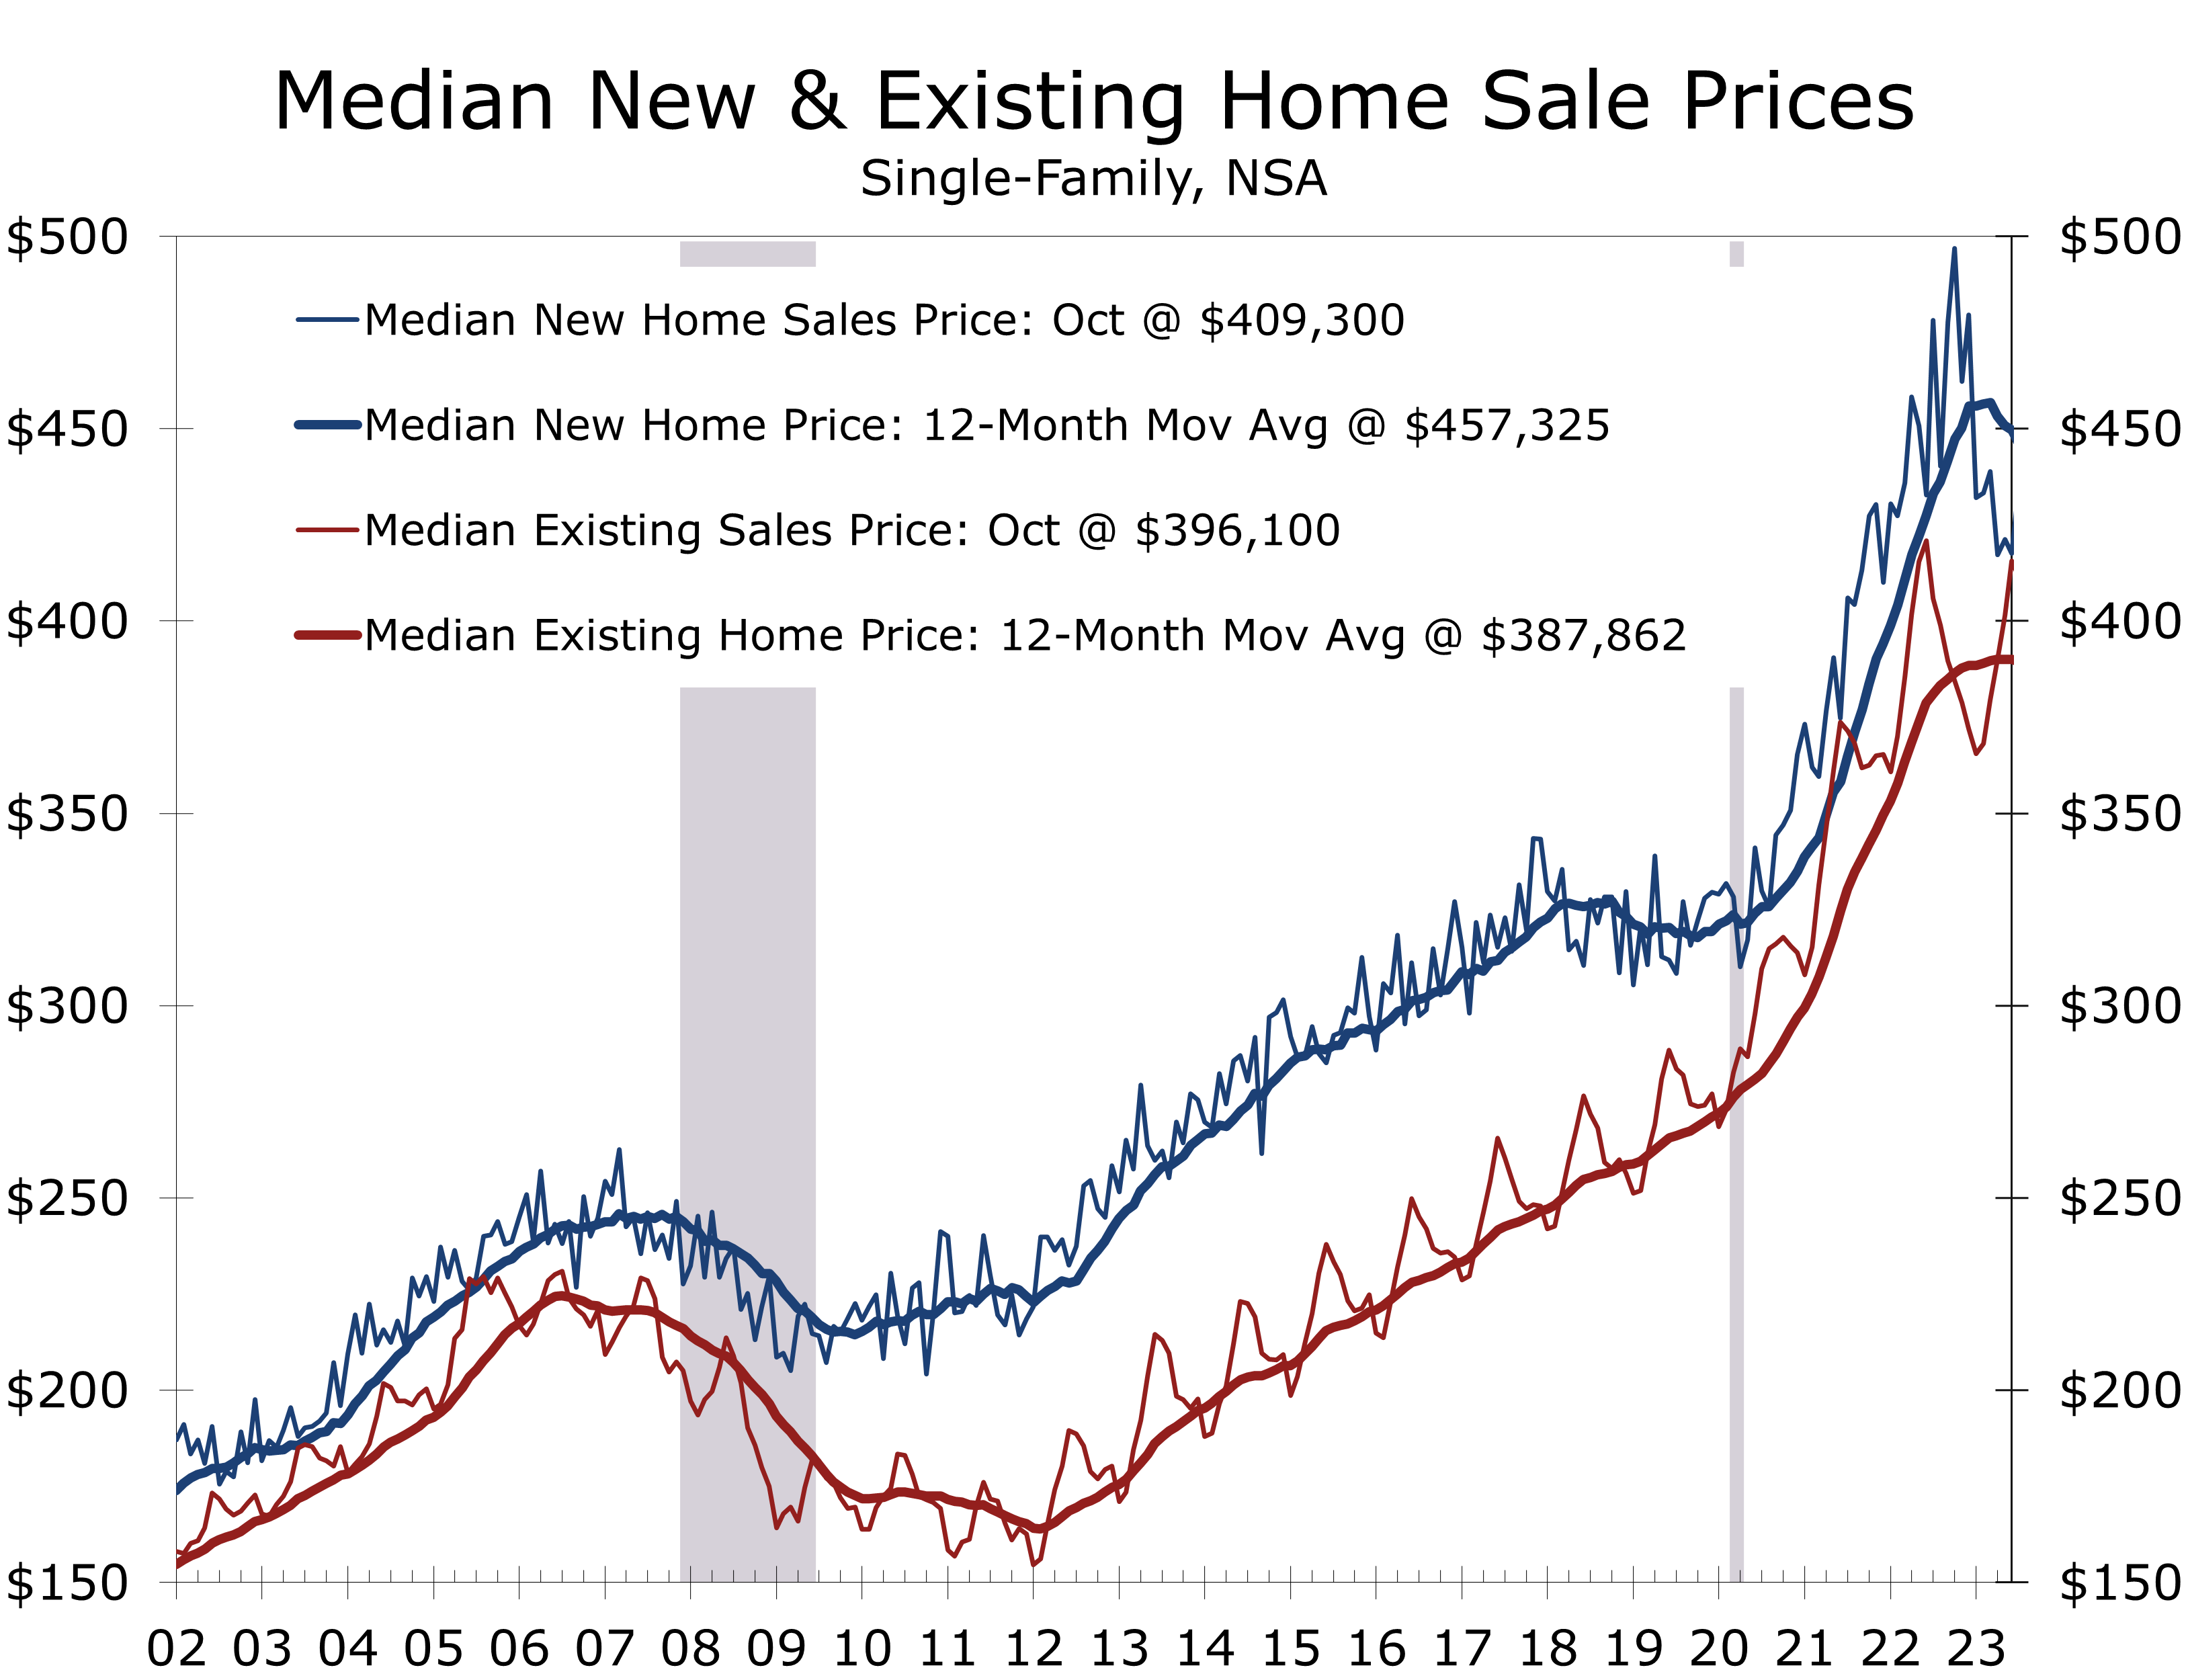
The sharp decline in the median price of a new home has significantly narrowed the gap between the median price of new and existing single-family homes. New homes have typically sold a premium to existing homes. The gap, which averaged $68,216 in the five years prior to the pandemic, has now narrowed to just $13,200 or 3.2%. The narrower premium for new homes means more home buyers are likely to opt for a new home versus an existing home, particularly if the builder can provide below market financing.
The narrower new home price premium means more home buyers will likely opt for new homes.
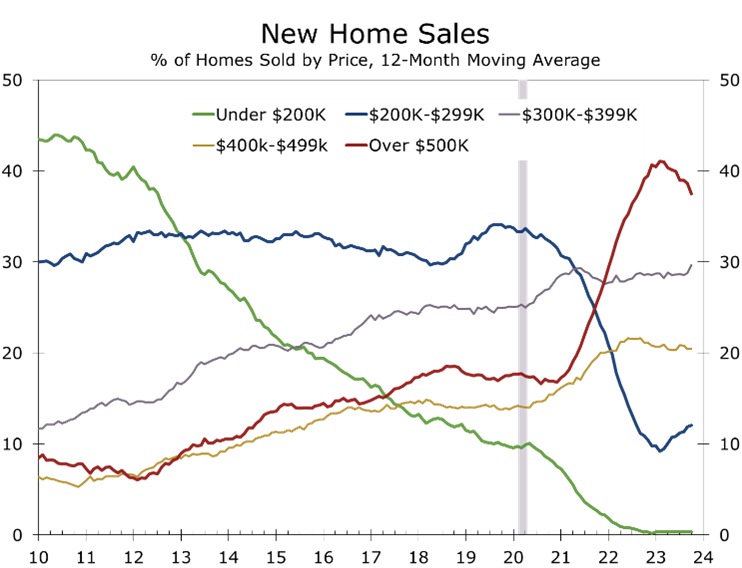
The improved market position new homes have relative to existing homes is likely to continue, as more than half of existing homeowners that have a mortgage have one locked in at a rate of 5% or less. With existing inventories remaining lean, home builders are responding by building smaller and more affordable homes. The share of new homes sold at prices below $300,000 has risen over the past year, while the proportion of new homes sold at more than $500,000 has fallen slightly.
Disclaimer: This publication has been prepared for informational purposes only and is not intended as a recommendation offer or solicitation with respect to the purchase or sale of any security or other financial product nor does it constitute investment advice.
Housing Starts Remain Resilient
Housing Starts Edged Higher in October
- Housing starts rose 1.9% to a 1.372-million-unit pace in October. Starts for the prior month were revised slightly lower, however.
- The rise was led by multifamily units, which saw starts rise 6.3%. By contrast, single-family starts edged just 0.2% higher.
- Permits rose 1.1% to a 1.487-million unit pace, with single-family permits rising 0.5% and multi-family permits rising 2.2%.
- The Midwest (+28.4%) and West (+12.5%) both posted strong gains in October, while starts fell 14.5% in the Northeast and slipped 6.8% in the South.
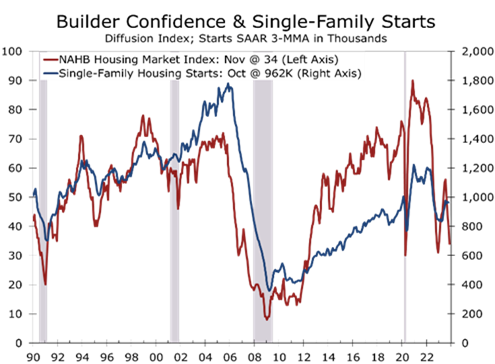
- Home builder confidence fell 6 points to 34 in November, reaching is lowest level since last December. The present sales (-6) expected sales (-5) and prospective buyer traffic (-5) indices all fell decisively.
- Home building remains surprising resilient amidst sharply higher interest rates and tightening credit. Some leading indicators for housing, however, continue to flash warning signals, suggesting activity will slow.
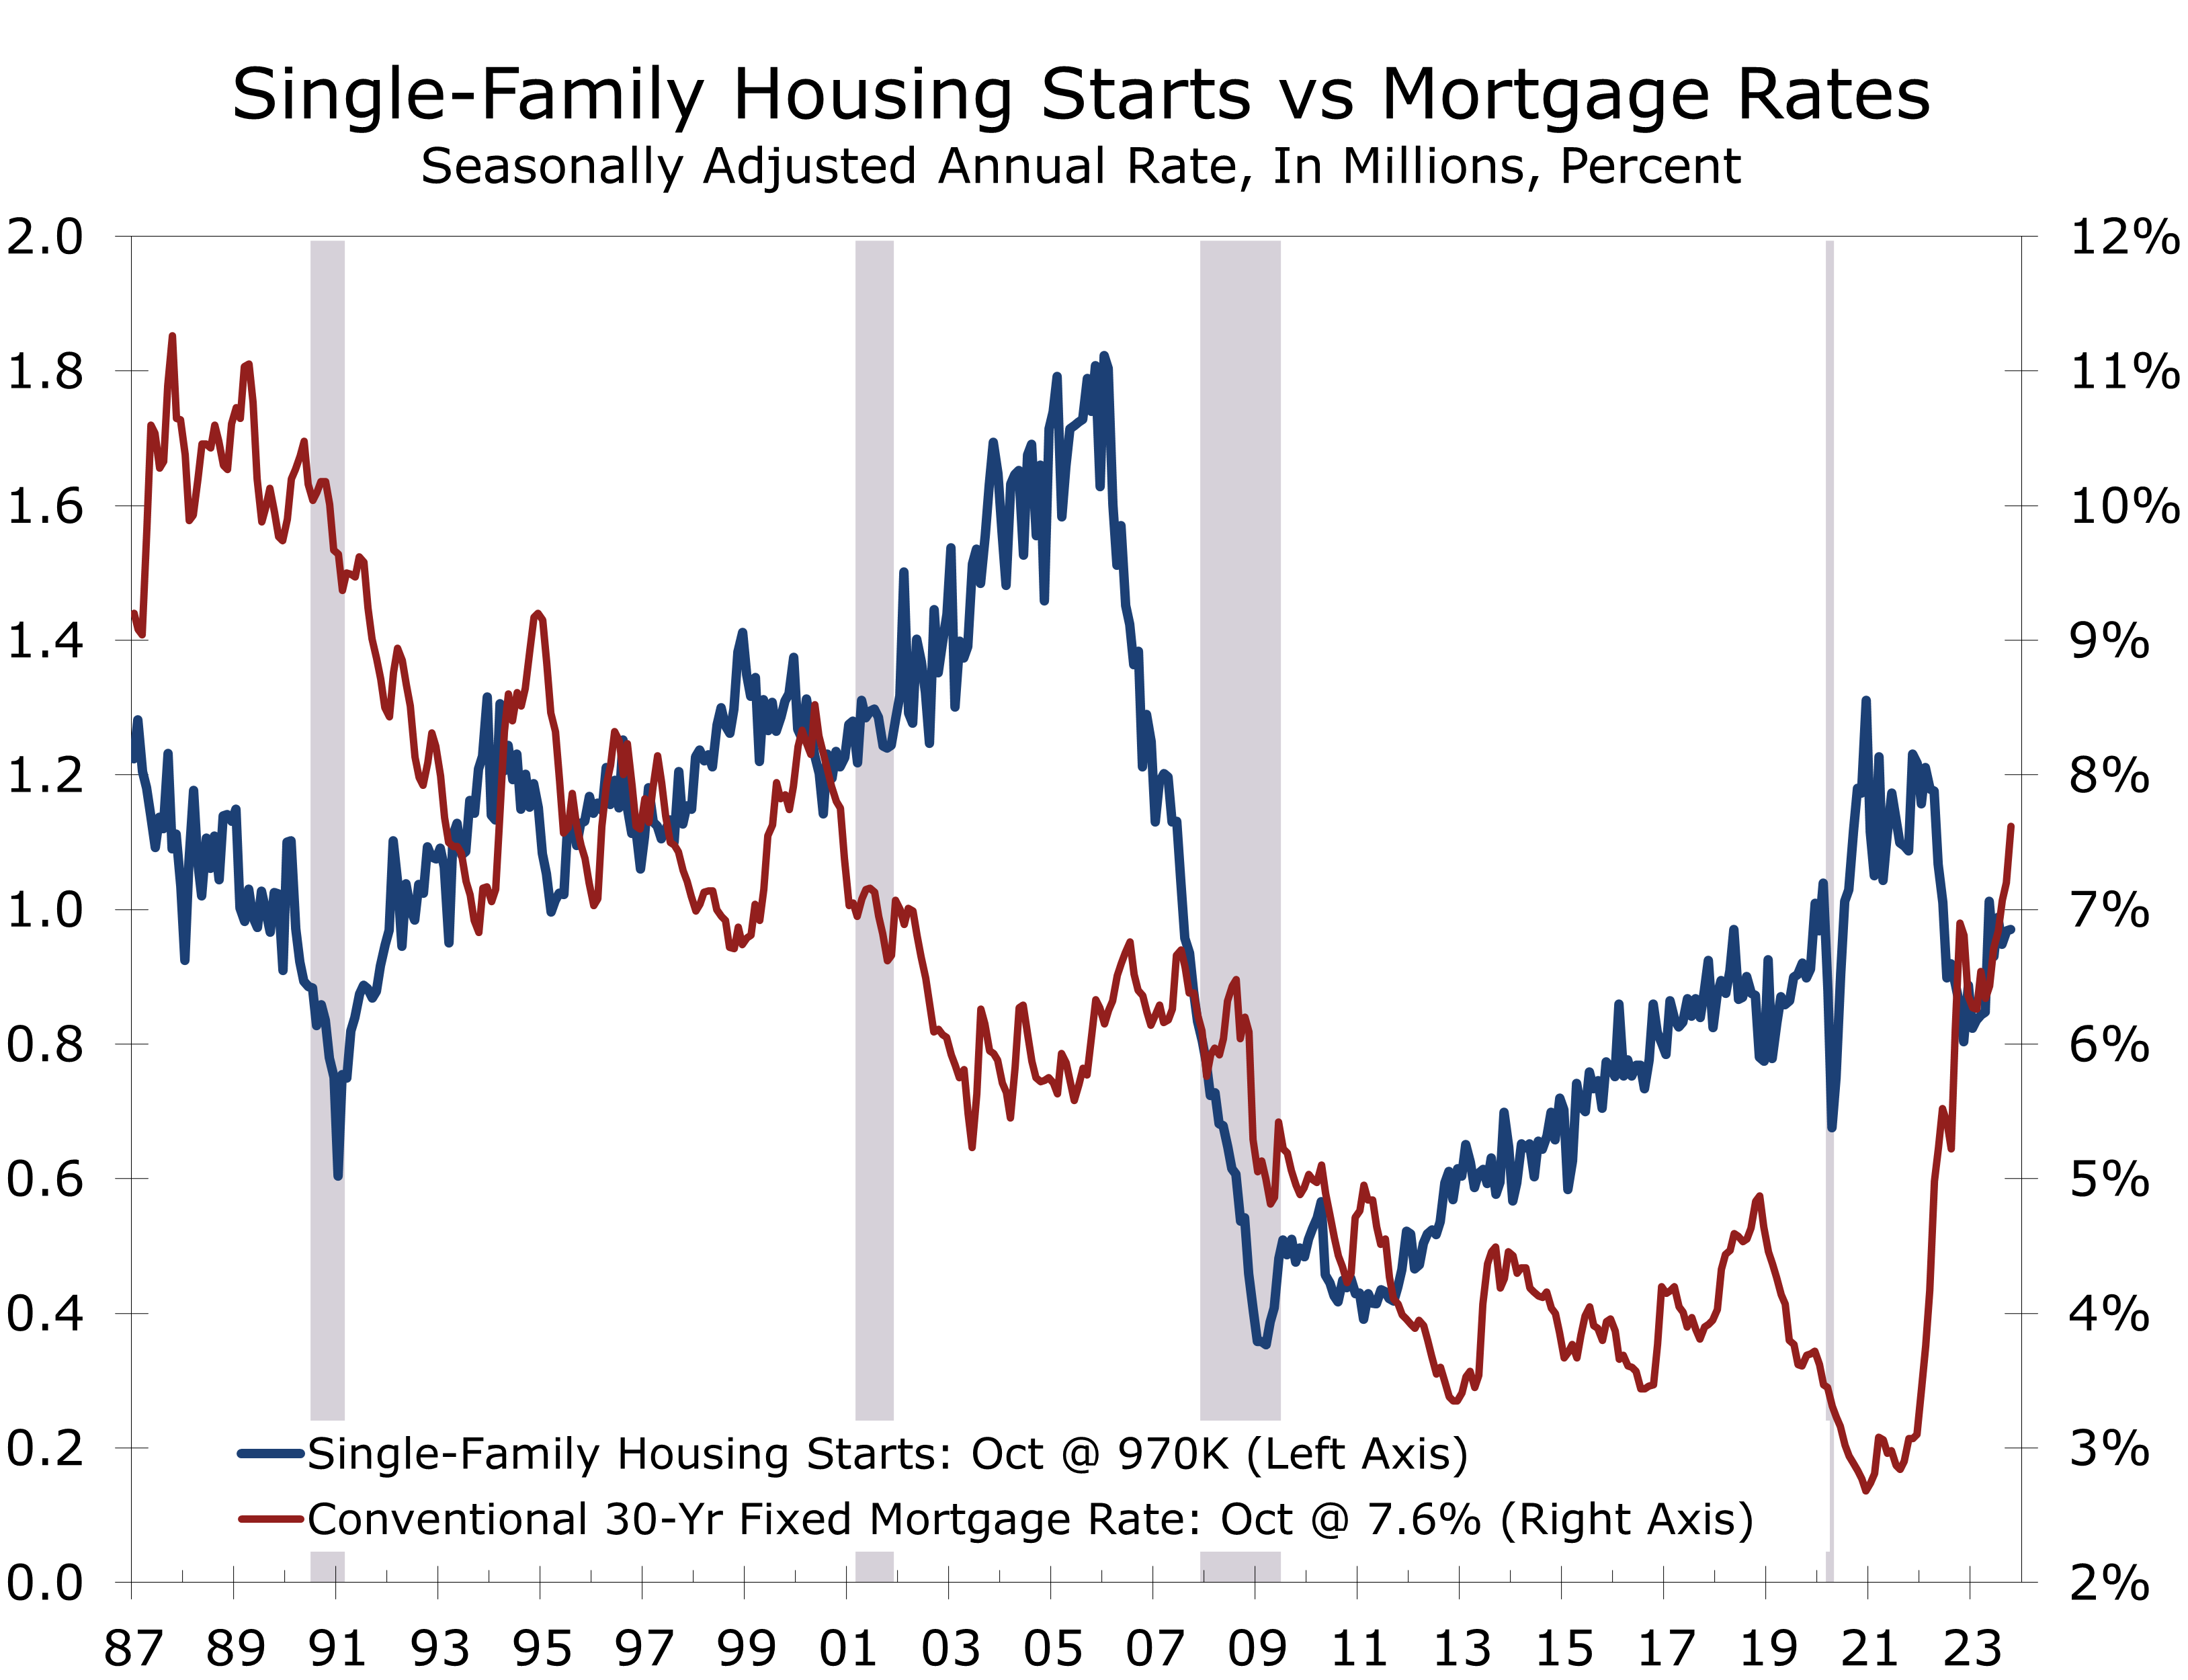
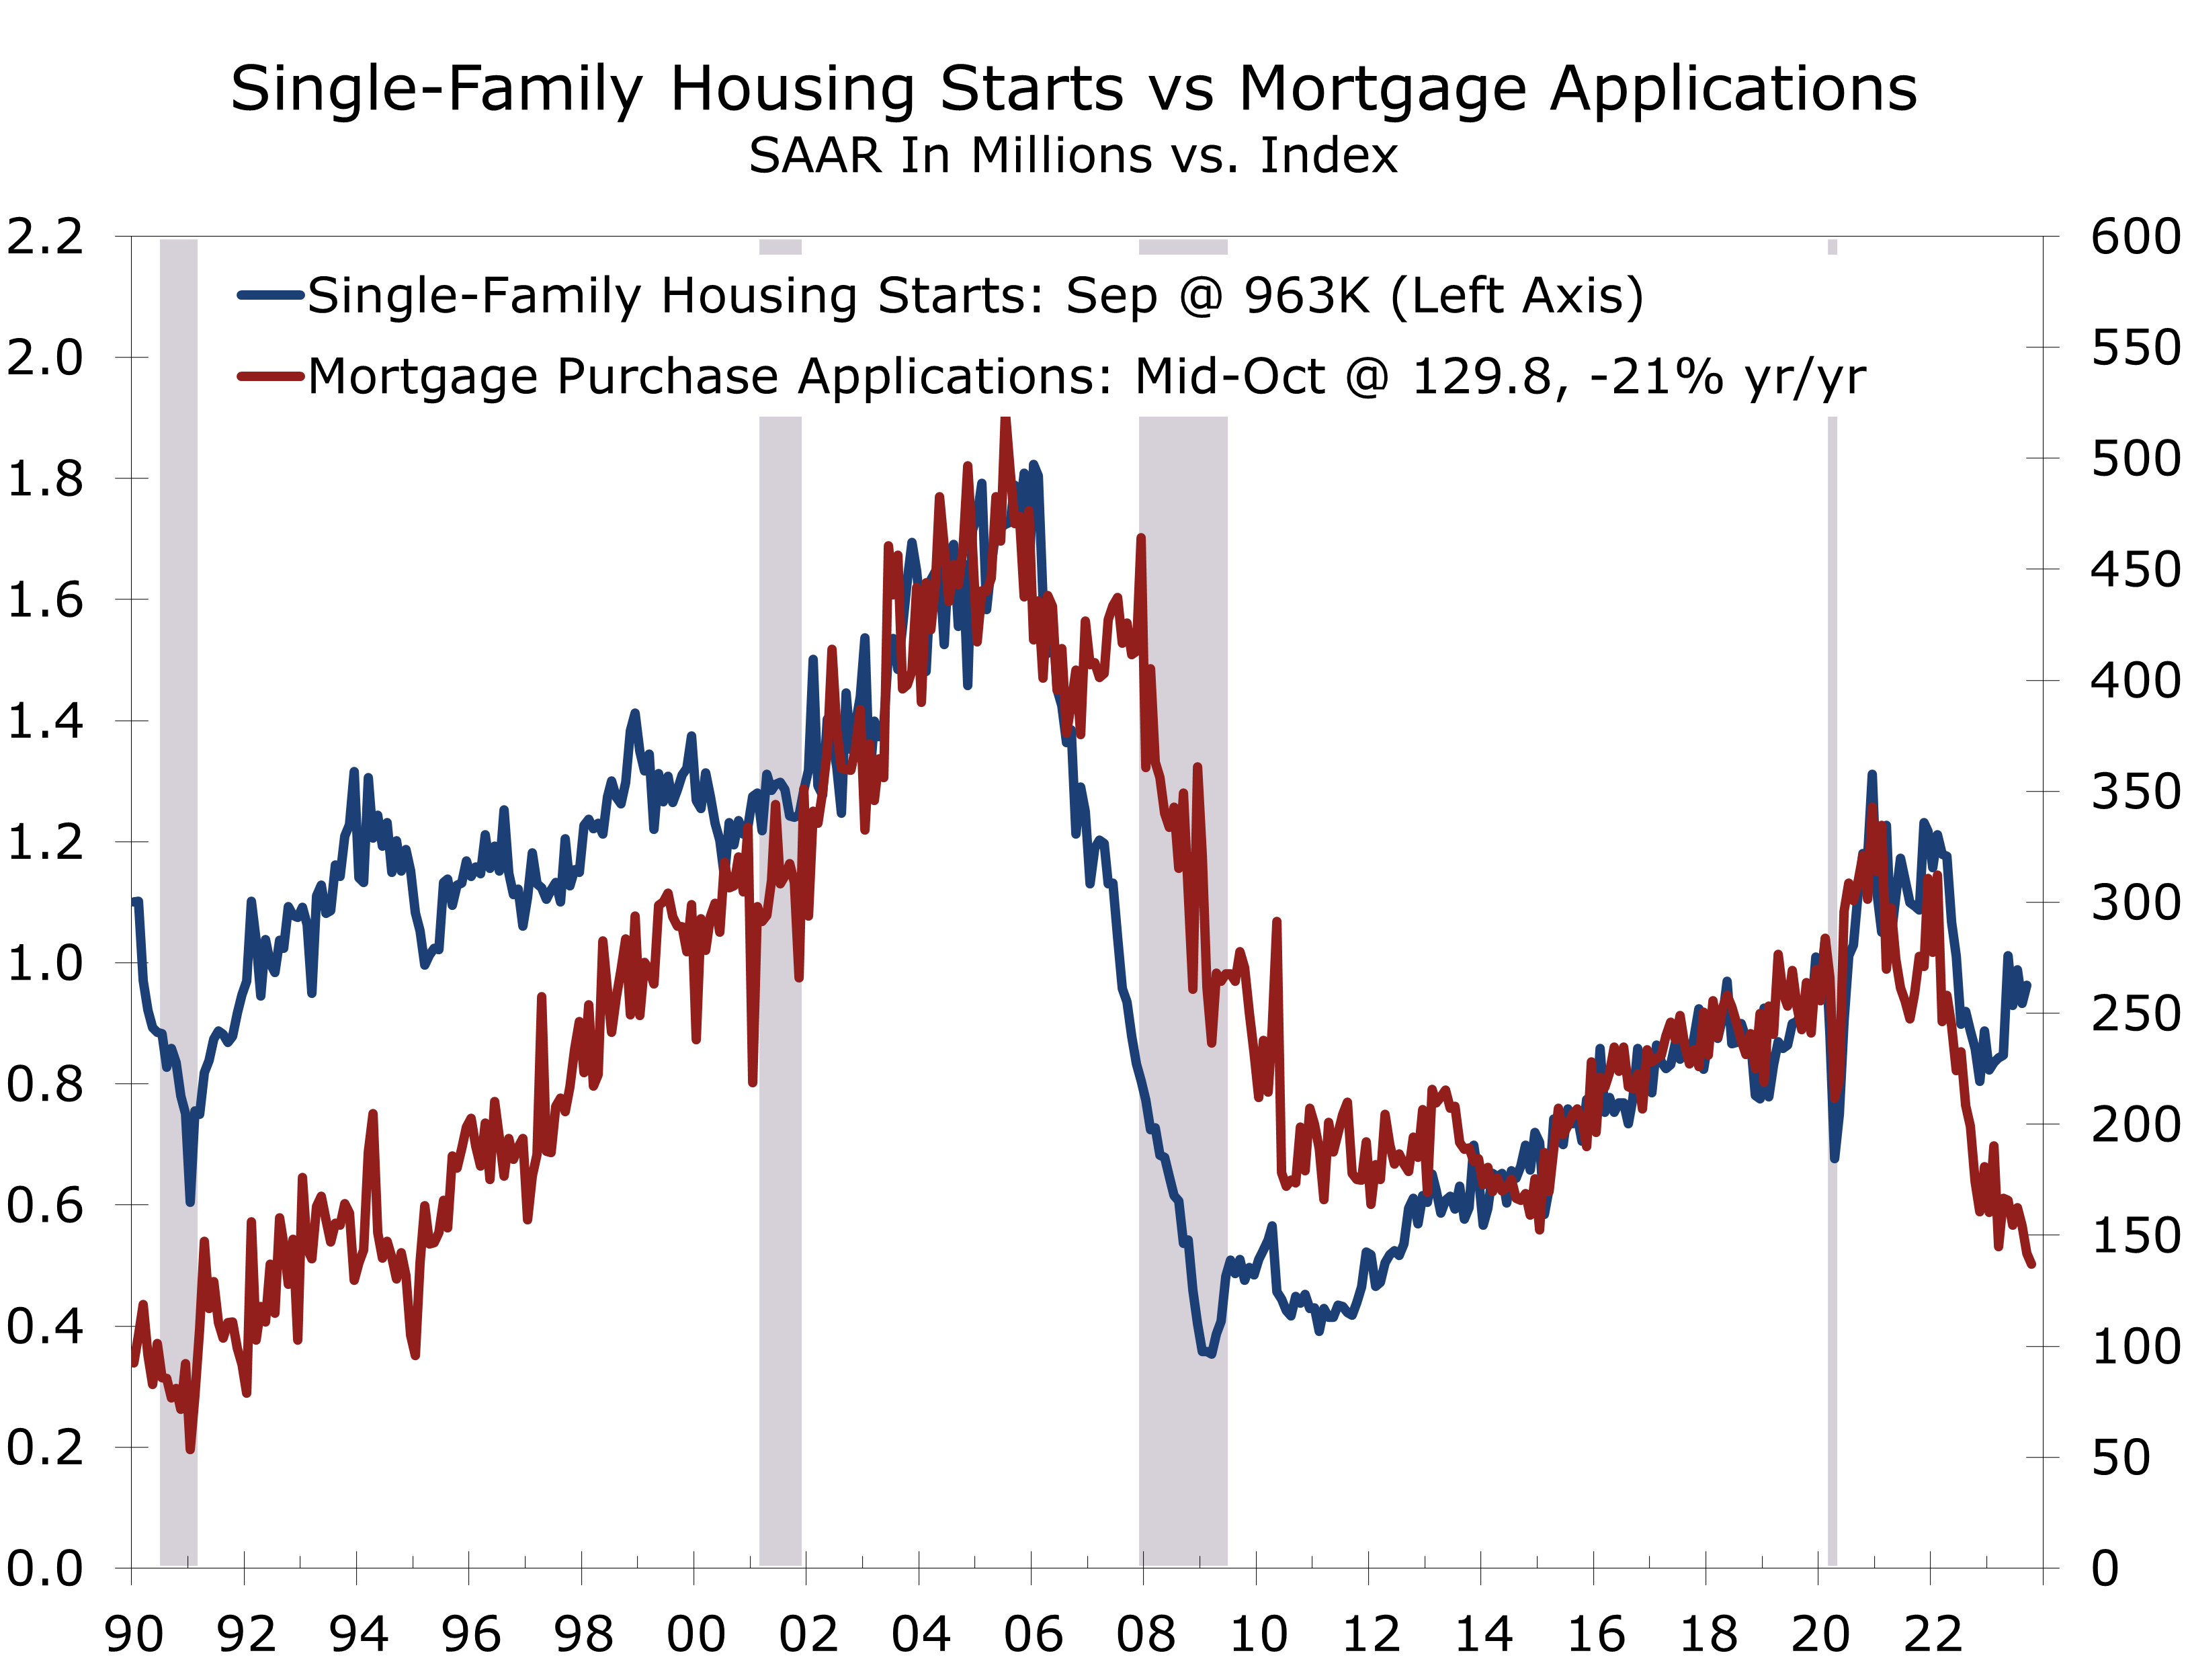
Housing starts once again topped expectations in October, rising 1.9% to a 1.372 million unit pace. The majority of the increase was in multi-family starts, mainly apartments, which climbed 2.2%. Single-family starts inched up 0.2% to a 970,000-unit pace. The increase comes despite surging mortgage rates and historically low housing affordability.
Home building appears to be in a race against time. Home builders are racing to take advantage of the shortage of homes available for sale, due to the lock-in effect for many existing homeowners. Of those homeowners that have mortgage, most have locked rates well below the current 7.40%, and are not interested in parting with their current mortgage.
Given the lack of existing homes for sale, more buyers are shifting to new homes.
With fewer existing homes on the market, more buyers are turning to new homes. Mortgage applications for the purchase of a new home rose 6% in October (not seasonally adjusted) and are up a whopping 39.7% over the past year. Much of the increase is coming from first-time home buyers.
Builders are making new home purchases more affordable through various incentives. In November, 36% reduced prices, the highest share this cycle, with an average reduction of 6%. Furthermore, 60% offered incentives, primarily mortgage rate buydowns. The effectiveness of these incentives is what is giving builders the confidence to continue to build in the face of soaring mortgage rates.
How much longer builders will be able to seemingly defy gravity remains to be seen. November saw a six-point drop in home builder confidence to 34, marking the fourth consecutive decline. The NAHB/Wells Fargo Housing Market Index (HMI) has plummeted 22 points since July, nearing the lows observed in December and during the pandemic lockdown.
Home builder sentiment has tumbled as interest rates have increased and credit has tightened.
All three major HMI components declined sharply in November. The current sales index fell six points to 40, builders’ expectations for sales over the next six months fell five points to 39 and the gauge measuring traffic of prospective buyers dipped five points to 21, which is the lowest since last December.
The HMI dropped eight points in both the South and West to 35 and 28, respectively, marking their lowest readings since last December. These regions accounted for 81% of the nation’s single-family starts this year. The HMI fell five points to 32 in the Midwest, while it rose seven points to 52 in the Northeast. The Northeast, however, accounts for just 6% of the nation’s single-family starts this year.
Most HMI survey responses were submitted before the better-than-expected October CPI data were released. Since then, bond yields and mortgage rates have fallen, potentially boosting builder confidence in December.
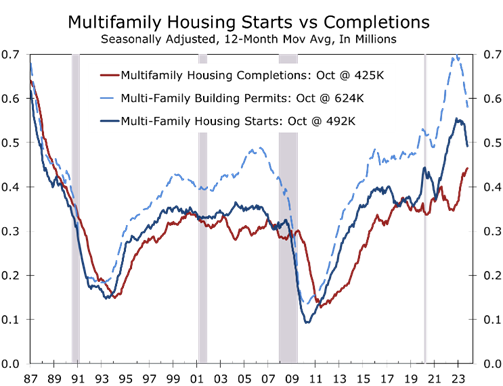
Apartment developers are also in a race against time. Overall multi-family starts rose 6.3% to a 402,000-unit pace in October and starts of projects with five units or more, mostly apartments, rose 4.9%. Permits also increased, rising 2.2% to a 519,000-unit pace.
There are close to a record 1 million apartments currently under construction and the pipeline of projects is just beginning to clear. On a 12-month moving average basis, the number of multi-family permits topped out at around a 705,000-unit annual rate last October and is down 17.5% over of the past year. Multi-family starts topped out at around a 550,000-unit pace and are down 9.5% over the past year. Completions are continuing to trend higher.
The hurdles for financing new apartment projects have risen substantially.
The large gap between permits and starts likely reflects the difficulty apartment developers are having securing financing. With fewer lenders offering apartment loans and stricter equity requirements, we anticipate a roughly 50% drop in multi-family permits and starts over the coming year.
Disclaimer: This publication has been prepared for informational purposes only and is not intended as a recommendation offer or solicitation with respect to the purchase or sale of any security or other financial product nor does it constitute investment advice.
Veterans & the US Economy
Veterans Play an Outsized Role in the US Economy
- November is National Veterans and Military Families Month, which recognizes and honors veterans, active-duty military members and their families.
- There are 18.4 million U.S. veterans, which represents roughly 7.2% of the adult population. There are 1.3 million persons currently serving in the U.S. military and another 800,000 reservists. Roughly half of military personal are married and around 40% have children.
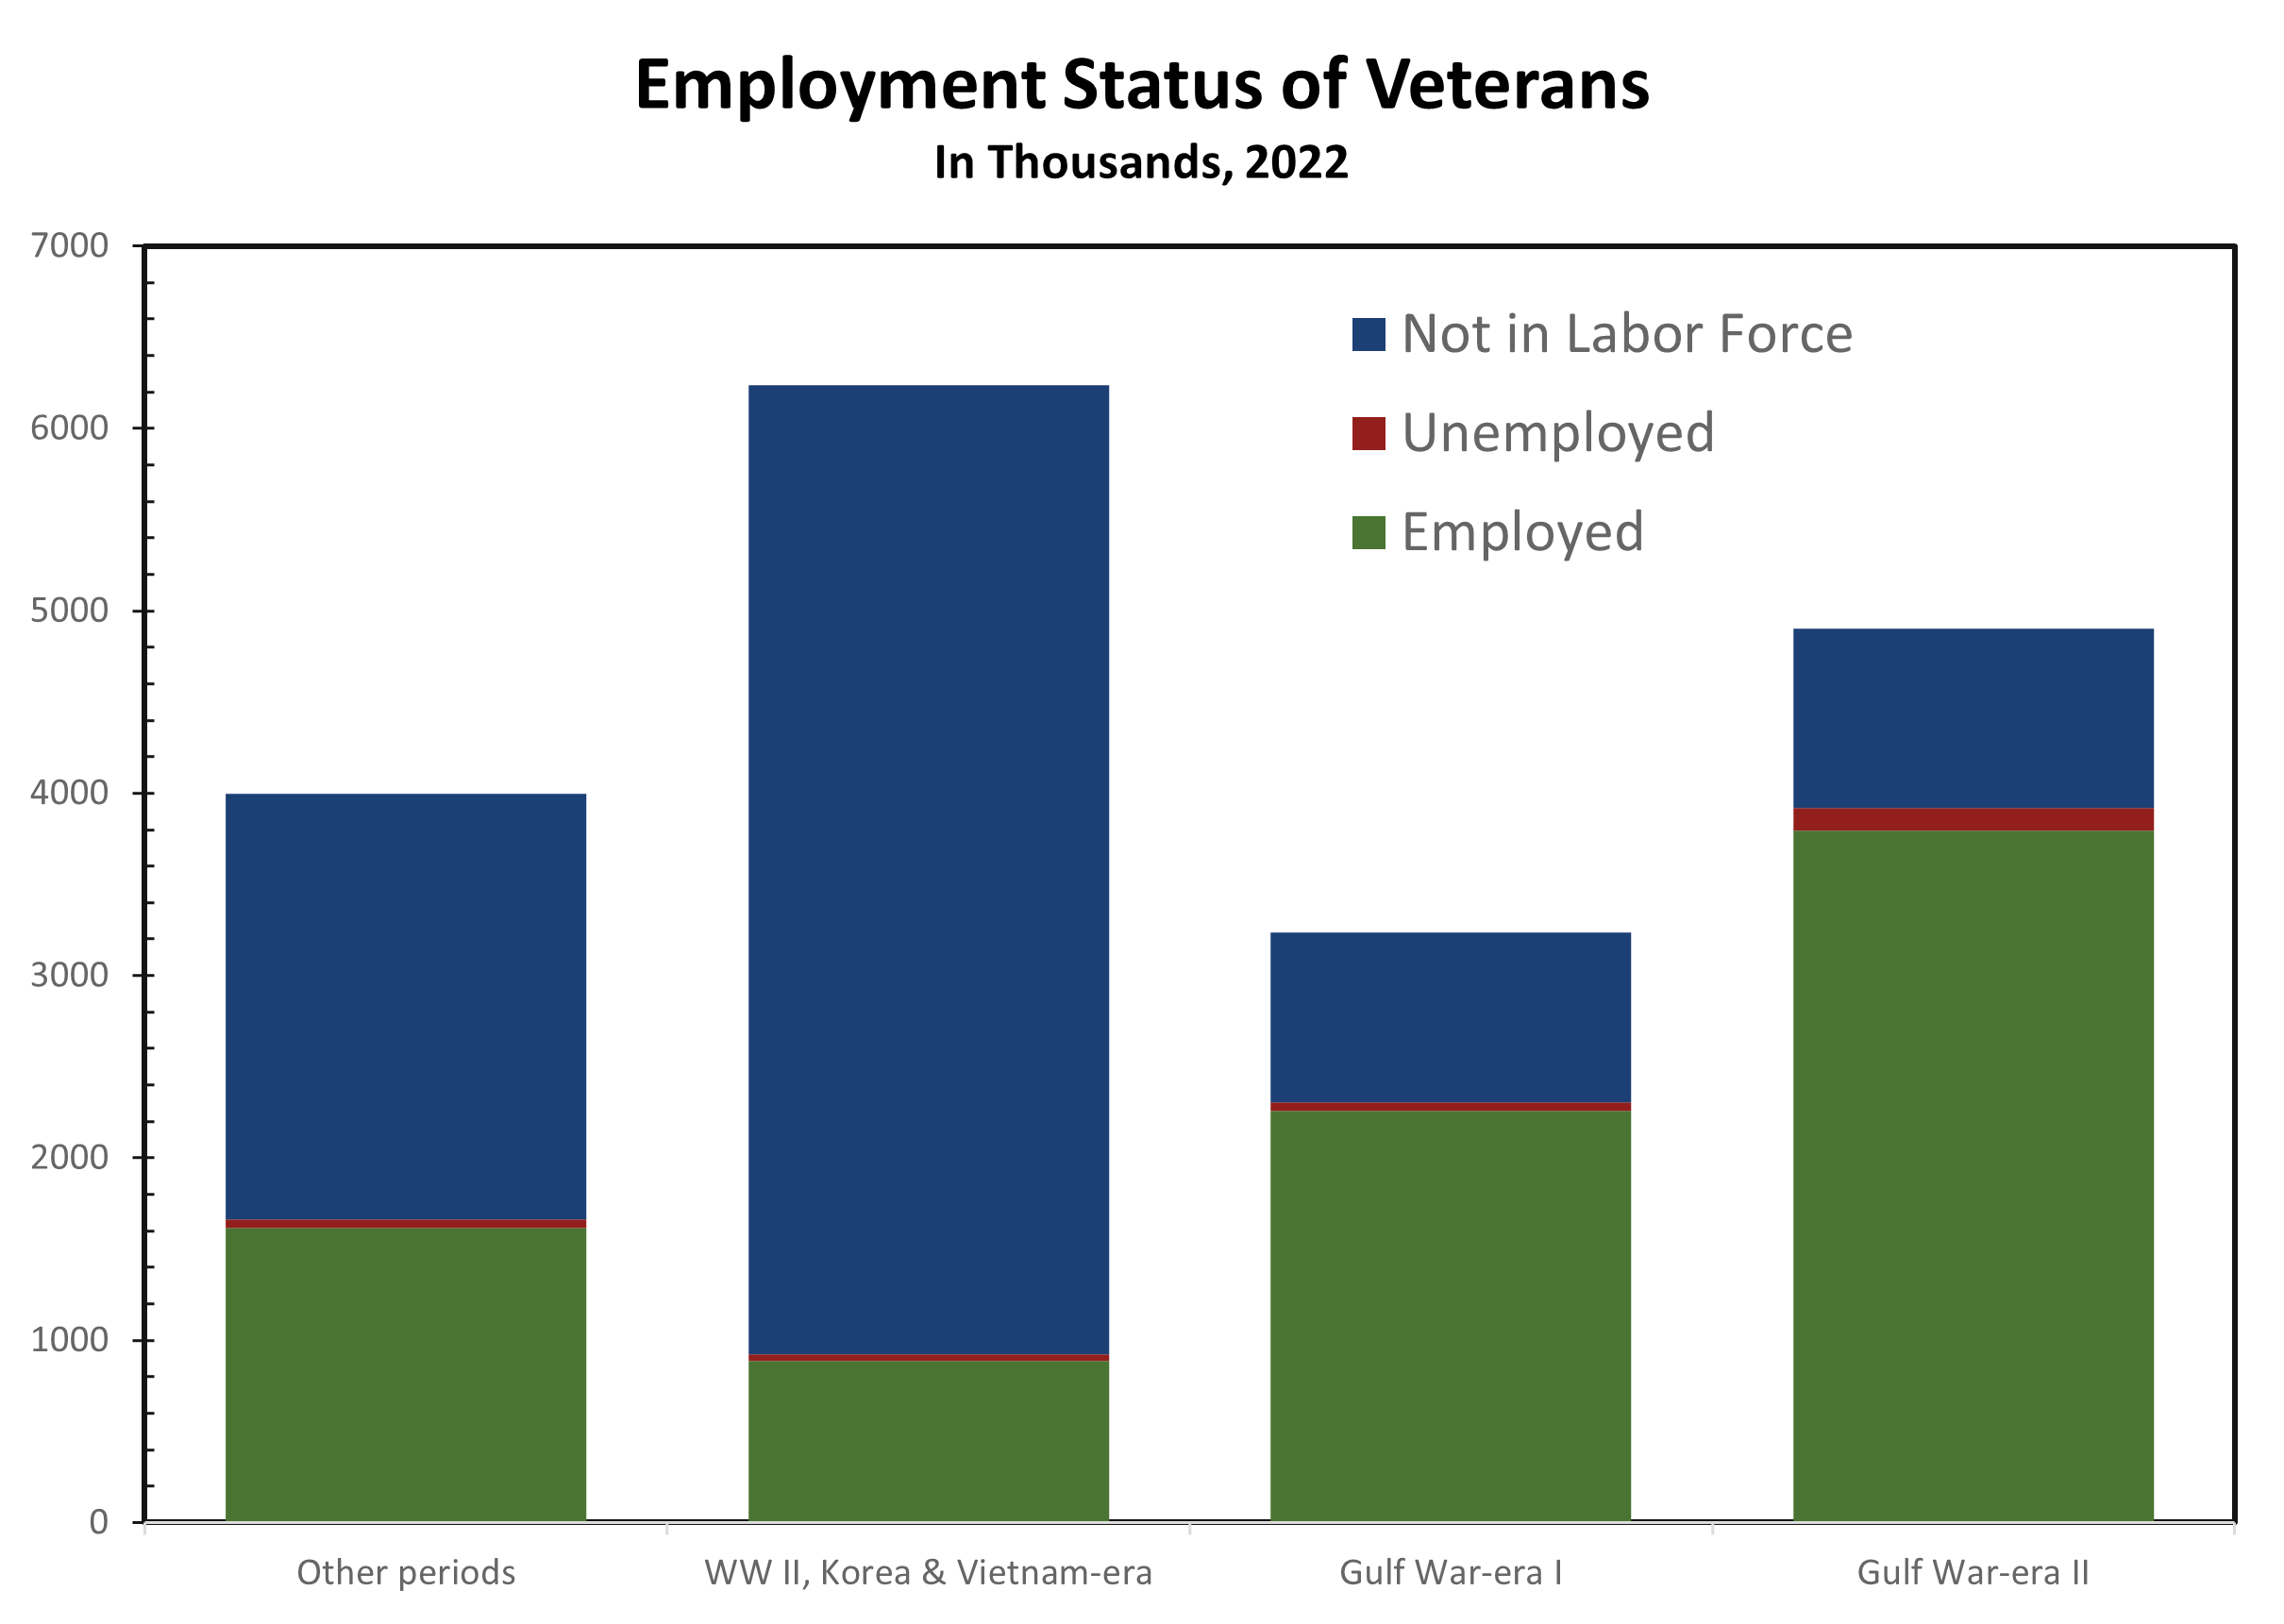
- Gulf War-era veterans now account for the largest share of all U.S. veterans, having surpassed Vietnam-era veterans in 2016. The median age of male veterans still skews older, however, and is approximately 65, while the median age for female veterans is 41.
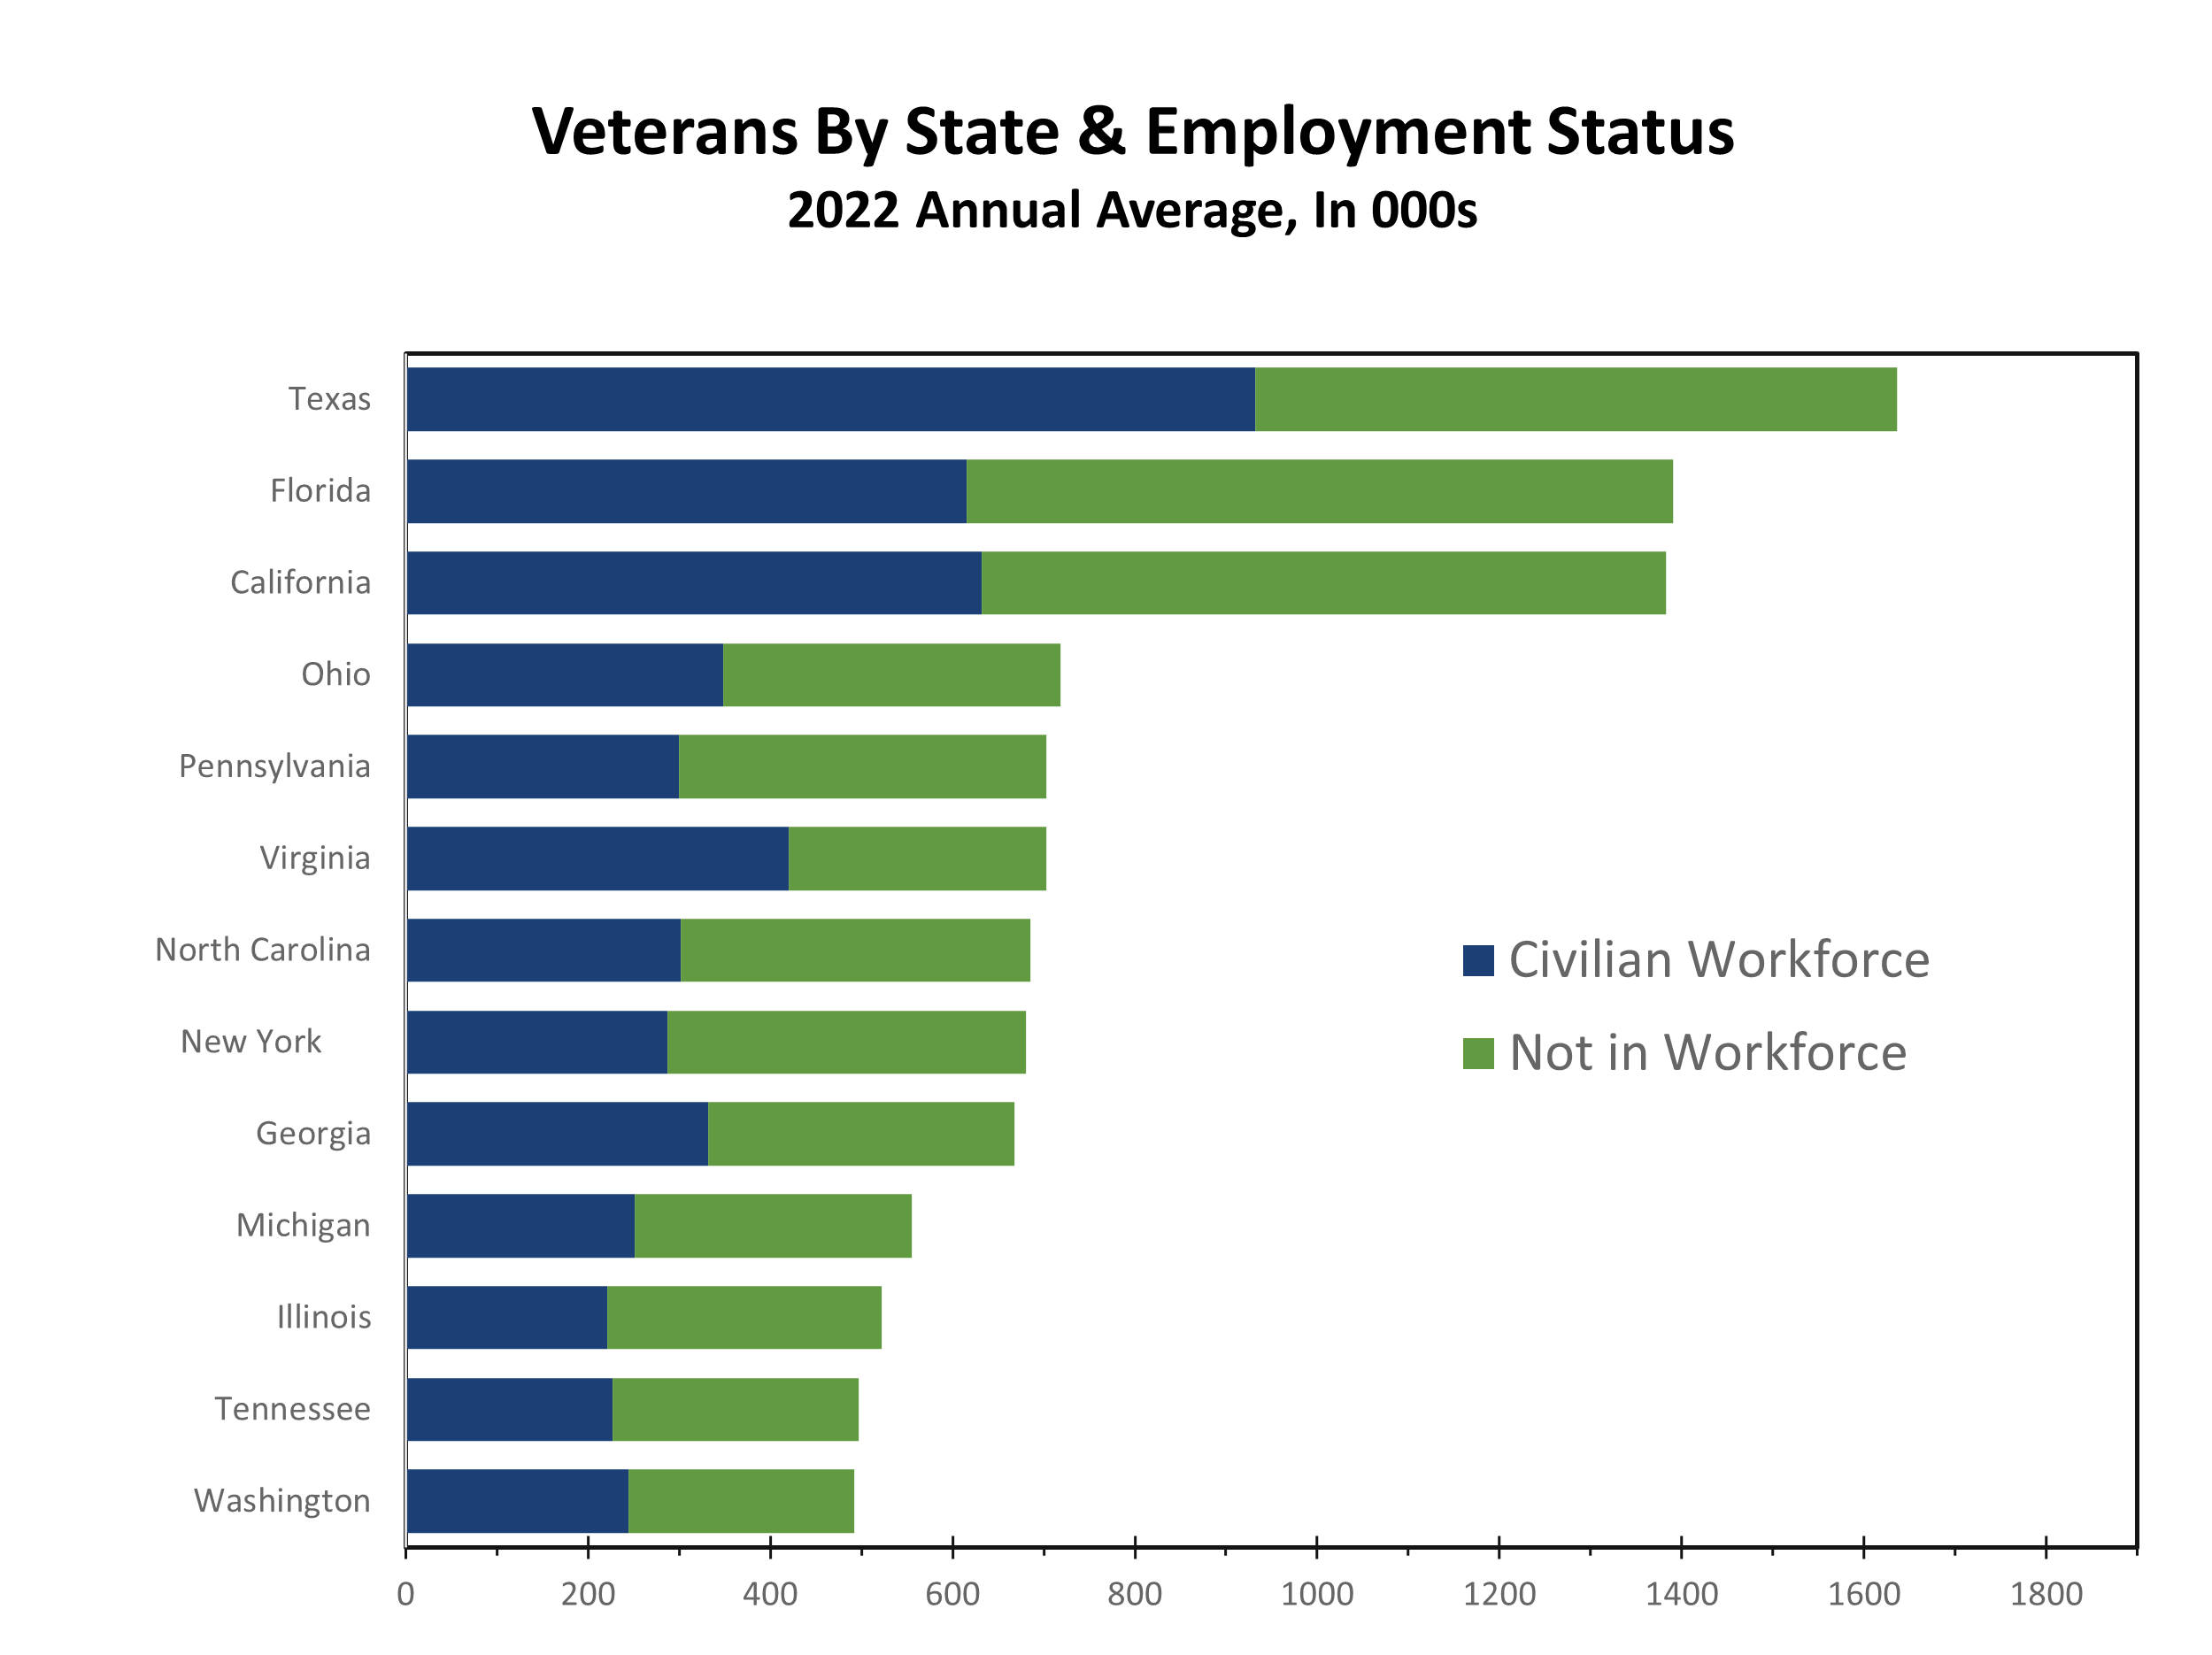
- Given the higher median age of veterans, a large proportion are retired and out of the workforce. A disproportionate share of these retirees resides in states that are home to a large military presence, including Florida, Texas, California, Georgia, Virginia, and the Carolinas.
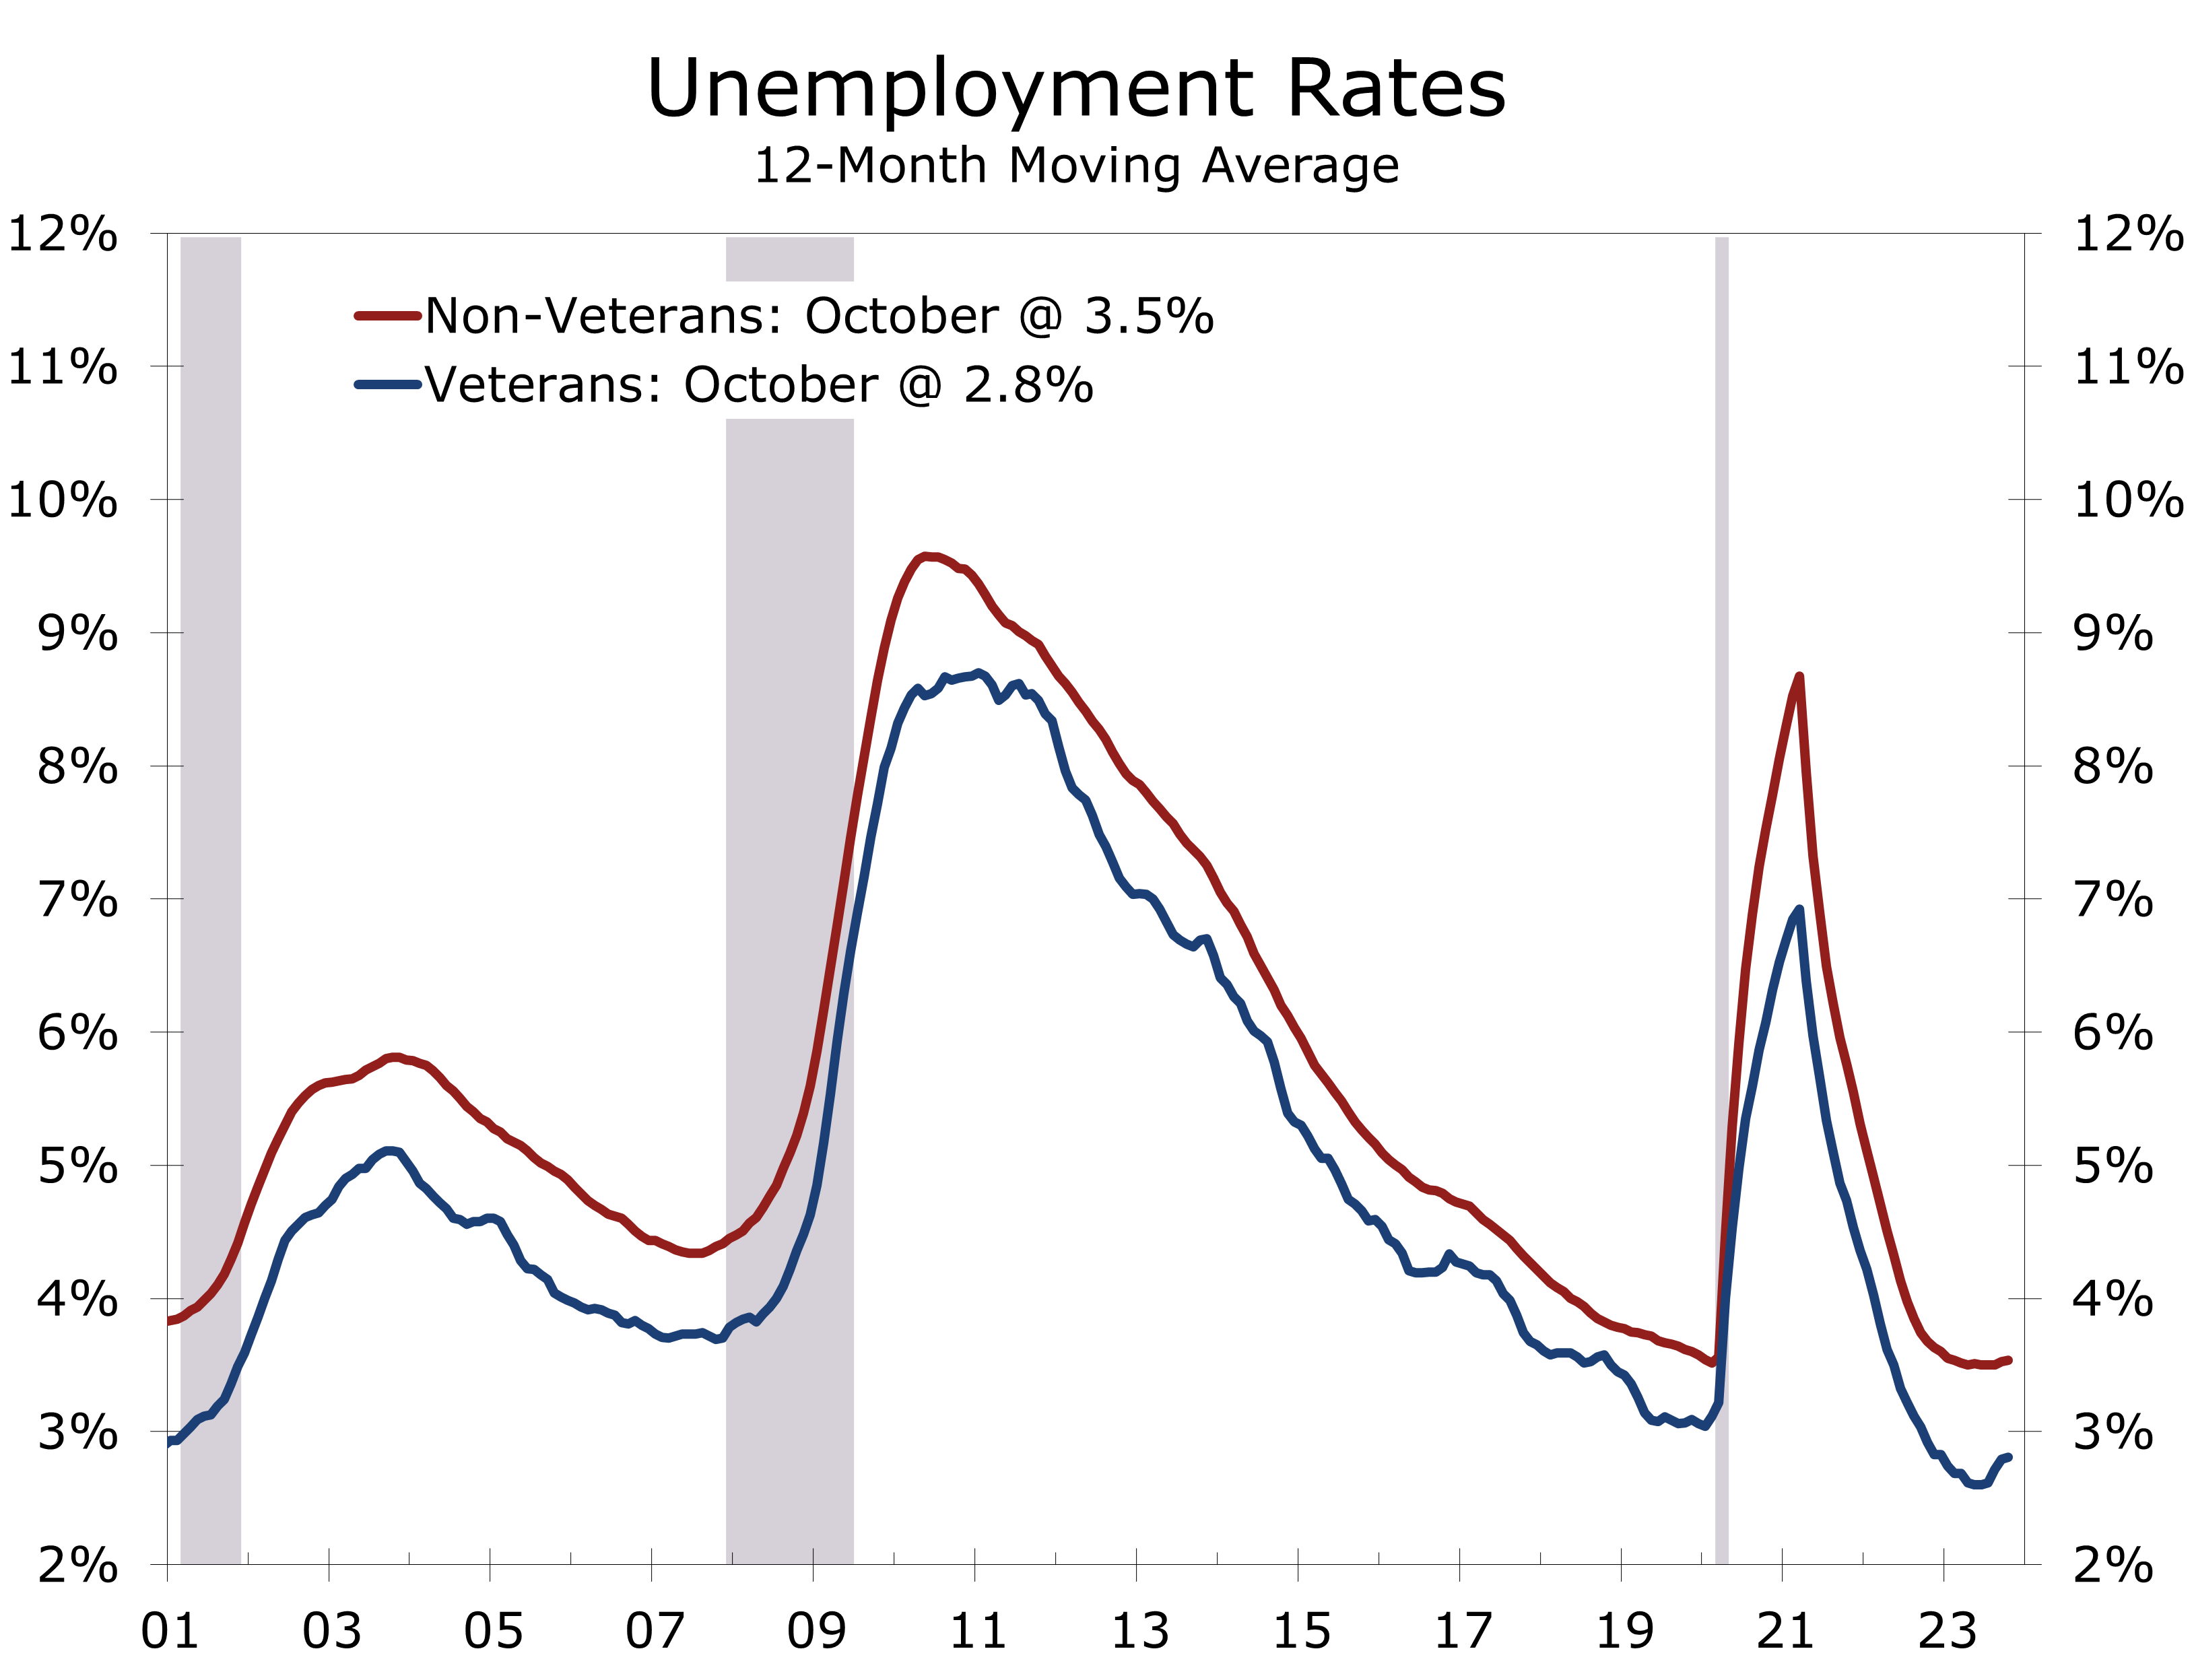
- Veterans have consistently experienced an unemployment rate approximately one percentage point lower than the non-military population. The gap tends to narrow as the labor market tightens. Wages and salaries for prime-working age male veterans are roughly even with men who have not served, while female veterans earn about 12% more than non-military women.
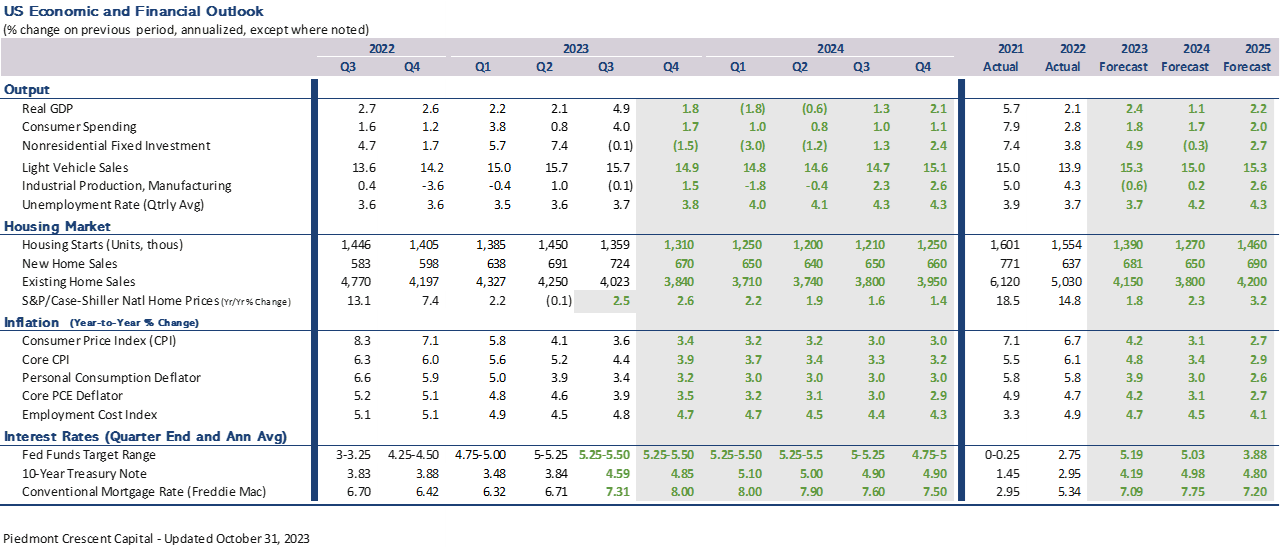
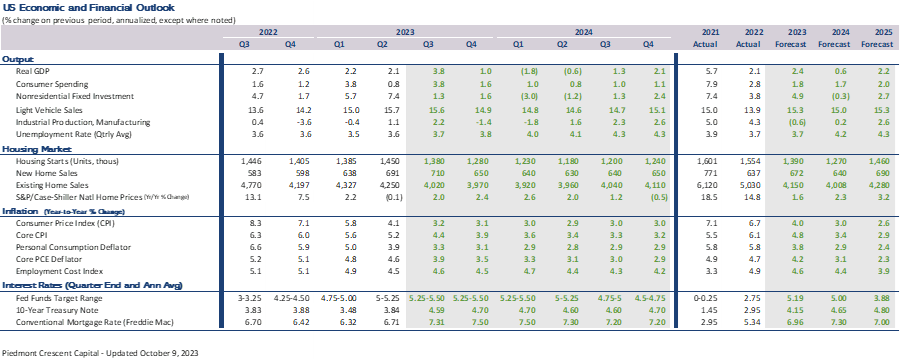
- While this report focuses on the economic contributions of veterans and military families, we include our monthly forecast. Real GDP growth is expected to moderate from its strong Q3 pace but remain solidly positive in the current quarter. The Fed is expected to hold rates steady through the middle of 2024, with higher bond yields doing much of the Fed’s work for them.
November is National Veterans and Military Families Month, which recognizes and honors veterans, active-duty military members and their families. The month marks the continuing evolution of Veterans Day, which initially honored service personal that served in wartime. Today Veterans Day honors all former service members and Military Families Month honors the sacrifices military families make each year that are particularly noteworthy around the holidays.
The origins of Veterans Day date back to the Armistice that ended hostilities in World War I at 11 am on November 11, 1918 – the eleventh hour of the 11th day of the 11th month. Armistice Day was honored one year later, with ceremonies and parades that continued informally. Congress passed a resolution in 1926 proclaiming that the “recurring anniversary of [November 11, 1918] should be commemorated with thanksgiving and prayer and exercises designed to perpetuate peace through good will and mutual understanding between nations” and asked that the president issue a proclamation each year calling for observance of Armistice Day. The Day did not become a national holiday, however, until June 1, 1938.
The ranks of veterans swelled tremendously following the massive mobilization of troops to fight World War II, more than 16 million, and the Korean War, around 5.7 million people. Soon afterward, veterans’ groups lobbied congress to amend the 1938 Act to replace the word Armistice with Veterans. President Eisenhower signed this legislation into law on June 1, 1954. Veterans Day then honored veterans of all wars.
Congress passed the Uniform Monday Holiday Act in 1968, which moved four federal holidays (Washington’s Birthday, Memorial Day, Veterans Day, and Columbus Day) to Mondays. The move was designed to provide federal employees with three-day weekends and encourage travel and tourism. Many states objected to the change, however, as Veterans Day was supposed to commemorate a particular day, and hour for that matter. In 1975, President Ford signed legislation moving Veterans Day back to November 11 beginning in 1978. From that point on Veterans Day honored all veterans, whether they served in wartime or peacetime.
Military Family Appreciation Month, initiated by the Armed Services YMCA in 1996, serves to honor the sacrifices of military families. Since then, the United States government has consistently recognized this occasion, with the President signing a proclamation each year, officially designating November as Military Family Month. This month is dedicated to acknowledging the daily sacrifices made by military families, who confront distinctive challenges such as enduring extended deployments, frequent relocations, and managing long-term physical and emotional challenges.
The nation currently has 18.4 million veterans and 1.3 million active-duty service members. In addition, 800,000 people currently serve in the reserves. Gulf War-era veterans now account for the largest share of all U.S. veterans, having surpassed Vietnam-era veterans back in 2016. As of 2022, Gulf War-era veterans include 3.2 million veterans that served from August 1990 to August 2021 (Gulf War-era I) and 4.9 million that served from September 2021 to present (Gulf War-era II).
The unemployment rate for veterans has consistently remained between one-half and a full percentage point below the unemployment rate for persons that did not serve in the military. Unemployment rates for White and Black veterans were lower than for their nonveteran counterparts in 2022, while the jobless rate for Asian and Hispanic veterans was not statistically different from their nonveteran counterparts.
There are a variety of reasons why the unemployment rate is lower for veterans. For starters, a disproportionate share of veterans are employed by the federal government, a sector less vulnerable to swings in the business cycle. Veterans also tend to be older than the general population, which translates into less turnover. The skills learned in the military are also more valuable to private sector, particularly for older vets.
Demographics also explain a large part of the lower unemployment rate. This largely reflects the still large population of World War II, Korean War and Vietnam-era Vets, which numbered just over 6.2 million in 2022, all of which are age 65 or over. Most Vets from this era are no longer in the workforce, and many have retired to warmer climates that have an abundance of military facilities that can be used by Vets. With so many veterans out of the workforce, the overall labor force participation rate, which is the proportion of the civilian population that is either working of looking for work (47.9%), is nearly 17 points lower than it is for nonveterans.
The unemployment rate for younger veterans is higher than for nonveterans. The jobless rate for veterans aged 18 to 24 in 2022 was 8.8%, a full percentage point higher than for their nonveteran counterparts. The unemployment rate for veterans aged 25 to 34 was 4.0%, roughly even with those that did not serve in that age group. Among prime working age persons, the unemployment rate for veterans is lower than for their nonveteran counterparts even though labor force participation is higher. The jobless rates for veterans aged 35 to 44 (2.3%), 45 to 54 (2.2%) and 55 to 64 (2.3%) are all below their nonveteran counterparts.
The lower unemployment rates for prime working age veterans is even more striking as it has come along with higher labor force participation. The labor force participation rate for prime working age veterans (age 25 to 54) was 83.2% in 2022, compared to 82.4% for nonveterans. Labor force participation for Vets aged 65 and over was just 15.3% in 2022, 4.6 percentage points lower than for their nonveteran counterparts.
Military retirement benefits earned by veterans undoubtedly contribute to the lower labor force participate rates for older veterans. Many have retired to states in warmer climates that also maintain a large military presence, including Florida, Texas, California, Georgia, Virginia, and the Carolinas. Florida and Texas do not have an income tax, which allows retirement dollars to go further. The Northeast and Midwest are also home to a large contingent of veterans, many of which are now retired.
The influx of military retirees is a stabilizing influence for local economies. Military retirement payments continue both in good and bad economic times. Veterans also provide local economies with valuable skill sets that are put to use in the labor force or in volunteer work. The benefits of military retirees have prompted many states to exempt military retirement pay from state income tax, hoping to put their states on a better footing to compete with Texas and Florida for the large pool of military retirees. Among the 42 states that have an income tax, 26 do not tax military retirement pay and 9 others only partially tax military pay.
Avoiding taxes is not the only reason veterans locate in one state or another. The climate, availability of resources provided to veterans and cost of living are also important variables. Prime working-age veterans also tend to locate where they have a relative abundance of job opportunities. Virginia, Maryland, Alabama, and North Dakota are notable standouts on this front. All four states boast unemployment rates for veterans that are below 2%, despite having significantly higher labor force participation rates for veterans. North Dakota had the lowest unemployment rate for veterans in 2022 at just 0.7%, with 55.5% of veterans in the workforce. Virginia has the highest share of veterans in the workforce, at 59.7%, which is more than 10 percentage points higher than the national average of 47.9%.
One thing all four states have in common is that the federal government is a major employer in the state. Veterans are much more likely to work for the federal government than nonveterans, with 10.8% of veterans working for the federal government in 2022, more than five times more than nonveterans (2.1%).
Employment of veterans at other levels of government is similar to nonveterans, with 4.6% (the same as nonveterans) working in state government and 7.4% (1 percentage point more than nonveterans) working in local government.
The prevalence of veterans in government is due to the unique skill sets veterans bring to the job. While workers in combat specialty positions may have few direct skills transferable to the private sector, the ability to follow instructions, complete a mission and be accountable is valuable in nearly every occupation. The military employs large number of workers in professional, scientific, and professional roles that are particularly sought out by federal government contractors that proliferate the areas surrounding Virginia and Maryland suburbs surrounding Washington D.C. and Alabama.
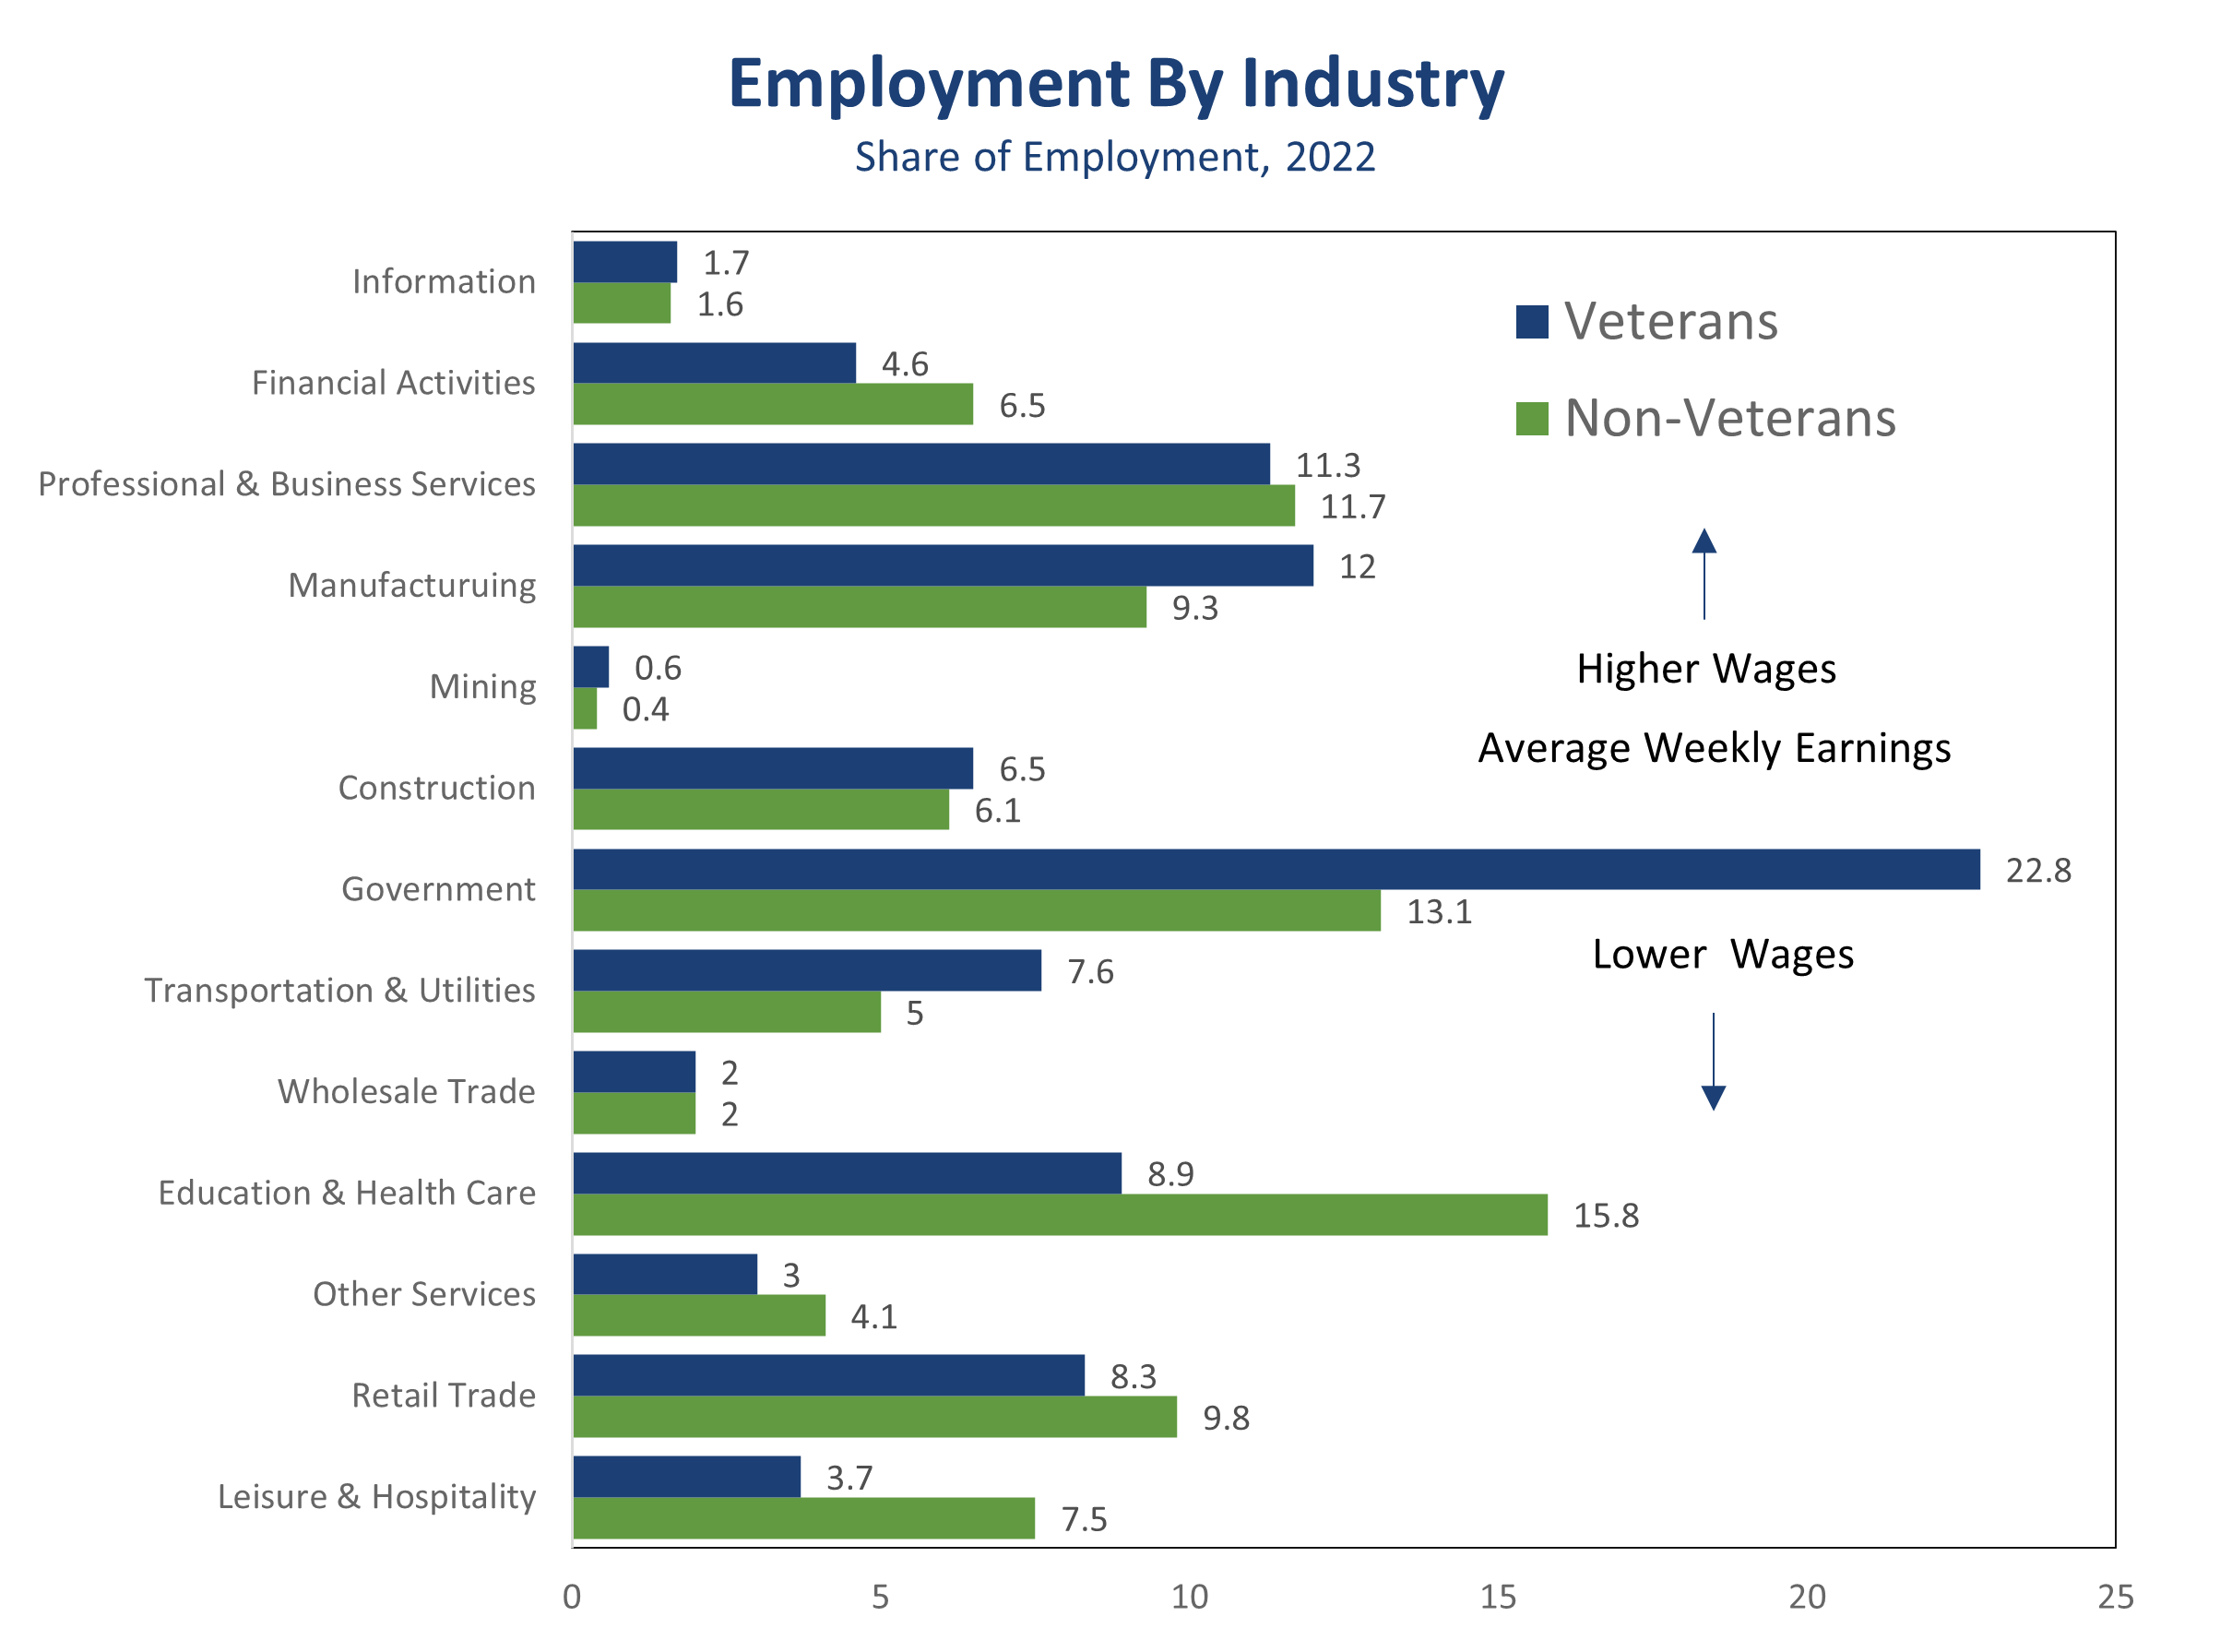
Other occupations military personal perform that develop skills easily transferable to the private sector include vehicle and machinery mechanics, transportation and materials handling, electrical and electronic equipment repair, health care, protective services, and construction. The skill set veterans bring to the workforce is weighted toward higher paying occupations. A higher share of veterans work in manufacturing, construction, and mining. In addition, an outsized share of veterans work in transportation and logistics and at utilities. Veterans are generally underrepresented in lower paying occupations, such as food services, retail trade, personal services and administrative positions in health care and private education.
The mix of jobs means working veterans earn slightly more than nonveterans. Nearly all the discrepancy is with women. Female veterans earn approximately 12% more than nonveterans, as fewer female veterans work in lower-paying occupations that tend to predominantly employ women, including many occupations in food service, retail trade, and lower paying occupations in health care and social services, such as childcare. Earnings for prime working-age veterans are slightly higher than nonveterans, primarily due to the larger proportion of workers in manufacturing, construction, mining, and government. Veterans working in transportation and logistics and at utilities also tend to be older and more highly skilled and experienced, which means they are more likely to work in more highly compensated occupations in these sectors.
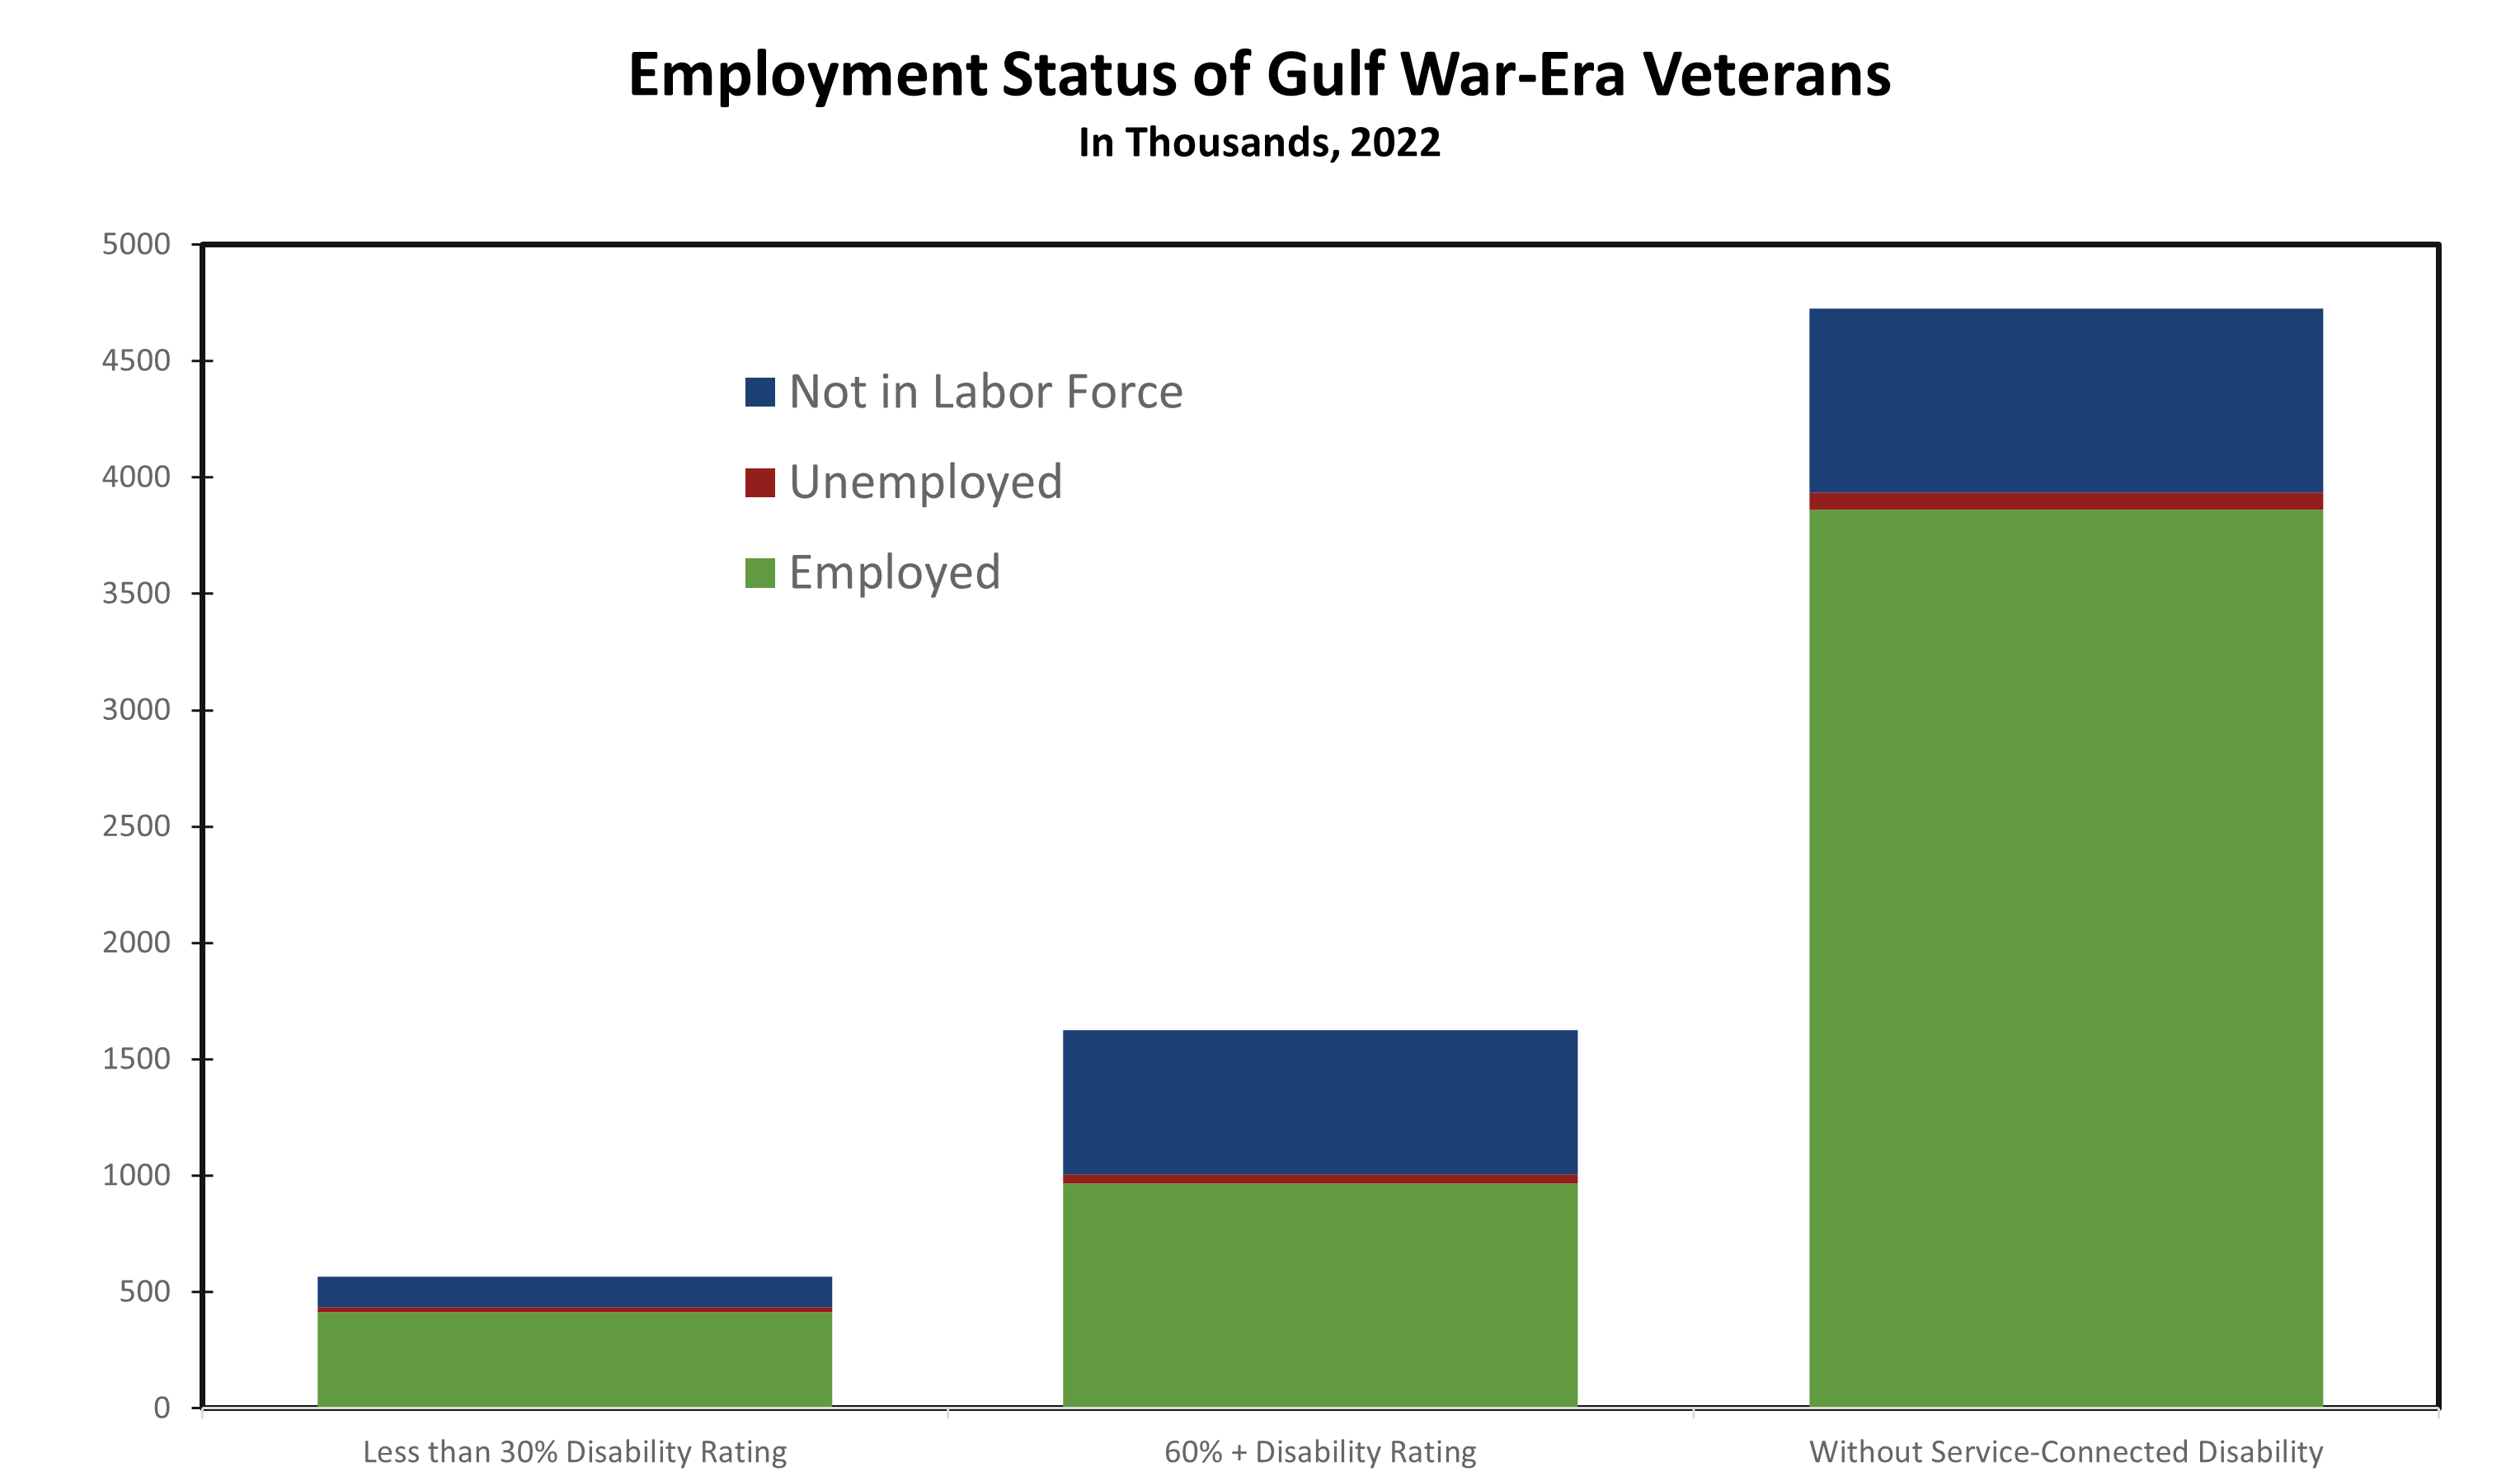
Just over 2.9 million Gulf War-era veterans have a service-connected disability, accounting for slightly over 60% of veterans with a service disability. Veterans with a service-connected disability are assigned a disability rating by the U.S. Department of Veteran Affairs or the Department of Defense ranging from 0 to 100 percent in increments of 10 percentage points. Among veterans with a service-connected disability, 23% reported a disability rating of less than 30%, while 50% reported a disability rating of 60% or more. The numbers are slightly different for Gulf War-era veterans, with 19% reporting a disability rating less than 30% and a larger 55% reporting a disability rating of 60% or more.
Labor force participation for veterans with a disability rating of less than 30% is roughly equivalent to that of veterans overall, at around 77%, but well below the share of Gulf-War-era veterans without a service-connected disability (83.3%). The unemployment rate for Gulf War-era veterans with a service-connected disability is 3.6%, which is notably higher than for Gulf War-era veterans without a disability (1.9%). Gulf War-era veterans with a disability rating of less than 30% have a higher unemployment rate (4.7%) than those with veterans with a disability rating above 60%, which was 4%. The reason for the lower unemployment rate is that a larger share of veterans with a disability rating of 60% or more are not in the labor force.
The military contributes mightily to the American labor market, with 1.3 million people serving in the active military and another 800,000 serving in the reserves. Moreover, the military employs some 730,000 civilian workers and about 500,000 civilian contractors. These numbers have come down considerably in recent years as U.S. involvement in wars has drawn down in the Middle East and Central Asia. Given the state of the world, we suspect the military will remain at its current size in coming years. In addition to the contribution of military personnel, approximately half of veterans are married and 40% have children. Military families make enormous sacrifices, dealing with frequent relocations and deployments, which are particularly notable around the holidays. Military spouses also endure higher unemployment and lower earnings on average. We honor that commitment and sacrifice in National Military Family Month.
Veterans also contribute significantly to the labor market, by adding a large number of skilled workers that are sorely needed in a variety of occupations. Prime working-age veterans participate in the labor force in roughly the same proportion or more than those that have not served in the military and tend to earn slightly more. The gap largely reflects the older average age and greater work experience of veterans as well as the prevalence of employment in higher paying occupations. Most of the pay differential is for female vets, a much lower share of which work in lower paying occupations than non-vets. Gulf War-era veterans with a service-connected disability also continue to contribute to the labor market, with those with a disability rating of less than 30% participating in the labor force at the same rate as veterans overall, and 61.8% of Gul-War-era veterans with a disability ratio 60% or more either working or actively looking for working.
The number of veterans will decline from 18.4 million today to around 12.5 million over the next 25 years, reflecting the passing of World War II, Korean War and Vietnam-era veterans, as well as the smaller size of the U.S. military. Vietnam-era veterans are all currently over 65. The share of female veterans will increase over the next 25 years, rising from its current 11% to around 17.5%.
We have updated our forecast to include the latest GDP data. Real GDP growth topped most estimates during the third quarter, with consumer spending rising at a 4.0% annual rate. The increase reflects a surge in spending for travel and leisure, which is unlikely to carry forward in the current quarter. Overall growth is expected to moderate in the current quarter and decline modestly during the first half of 2024. Slower economic growth will keep the Fed on hold, even though inflation will remain above the Fed’s 2% target.
Disclaimer: This publication has been prepared for informational purposes only and is not intended as a recommendation offer or solicitation with respect to the purchase or sale of any security or other financial product nor does it constitute investment advice. Any forward-looking statements or forecasts are not guaranteed and are subject to change at any time. Information from external sources have not been verified but are generally considered reliable.
© 2023 CAVU Securities, LLC
Consumer Spending Takes a Breather
Retail Sales Declined Slightly in October
- Retail sales declined 0.1% in October, following a 0.9% rise the prior month.
- Sales at motor vehicle dealers fell 1.0% and lower gasoline prices helped pull gasoline station sales down 0.3.
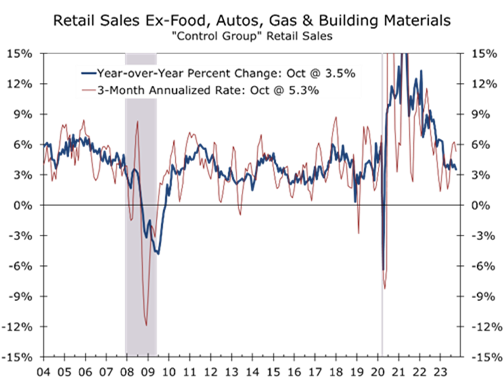
- Sales excluding motor vehicles and gasoline rose 0.1%. Core retail sales, which also exclude sales at home improvement centers and grocery stores, rose 0.2% and are now up just 3.5% year-to-year.
- After adjusting for the better inflation news, including this morning’s 0.5% drop in the PPI, we calculate real retail sales fell 0.2%, while real core retail sales rose 0.1%
- Only a handful of core retail categories posted gains, however, led by health and personal care (+1.1%), electronics and appliance stores (+0.6%), and non-store retailers (+0.3%).
- Retail sales are yet another data point suggesting economic growth downshifted in October. Sales in many credit-driven sectors was particularly weak, including furniture & home furnishings (-2.0%) and autos (-1.1%).
October appears to have been a transformation month for the U.S. economy. Real economic growth appears to have downshifted amidst higher interest rates and tightening credit. We expect spending to remain soft going into the holiday season and see holiday retail sales rising 3.2% from their prior year’s level, which would be toward the lower end of the forecast issued earlier by the National Retail Federation. Sales are struggling the most in credit-dependent sectors and those areas that cater to middle-income households.
Even though retail sales fell in October, they outperformed expectations. Gasoline prices were reported to have fallen 5% in October, which was expected to produce a larger drag on the headline retail sales figure. Instead, gasoline prices fell by an inconsequential 0.3%. Sales excluding gasoline, fell 0.1%, which was the same as overall sales.
Retail sales were weaker in October but still more in line with a soft landing than a recession.
While retail sales are volatile on a monthly basis and prone to substantial revisions, October’s data exceeded expectations. Core retail sales rose 0.2% in nominal terms and 0.1% in real terms. Real personal consumption expenditures are likely to rise at around a 2.5% annual rate in the current quarter.
Although spending remains solid, it is losing momentum. Only five of the thirteen major categories saw sales rise in October. Clothing stores were unchanged, while the seven remaining categories posted declines. Auto dealers led the drop (-1.0%), followed by furniture stores (-2.0%) and gasoline stations (-0.3%).
While weaker, retail sales are still more in line with a soft landing than a recession. On the plus side, spending rose 1.1% at health and personal care stores, 0.6% at electronics and appliance stores and 0.3% at non-store retailers, most of which are online retailers.
October, positioned between back-to-school and holiday sales, is a transitional period for retailers. Stores are increasingly launching holiday promotions earlier, however, with many displaying holiday items before Halloween. In October, sales at general merchandise stores fell 0.2%, department stores saw a more substantial 1.2% drop, while sales at clothing shops were unchanged, following a 0.8% drop in September.
Higher interest rates and tighter credit are dampening credit-dependent spending.
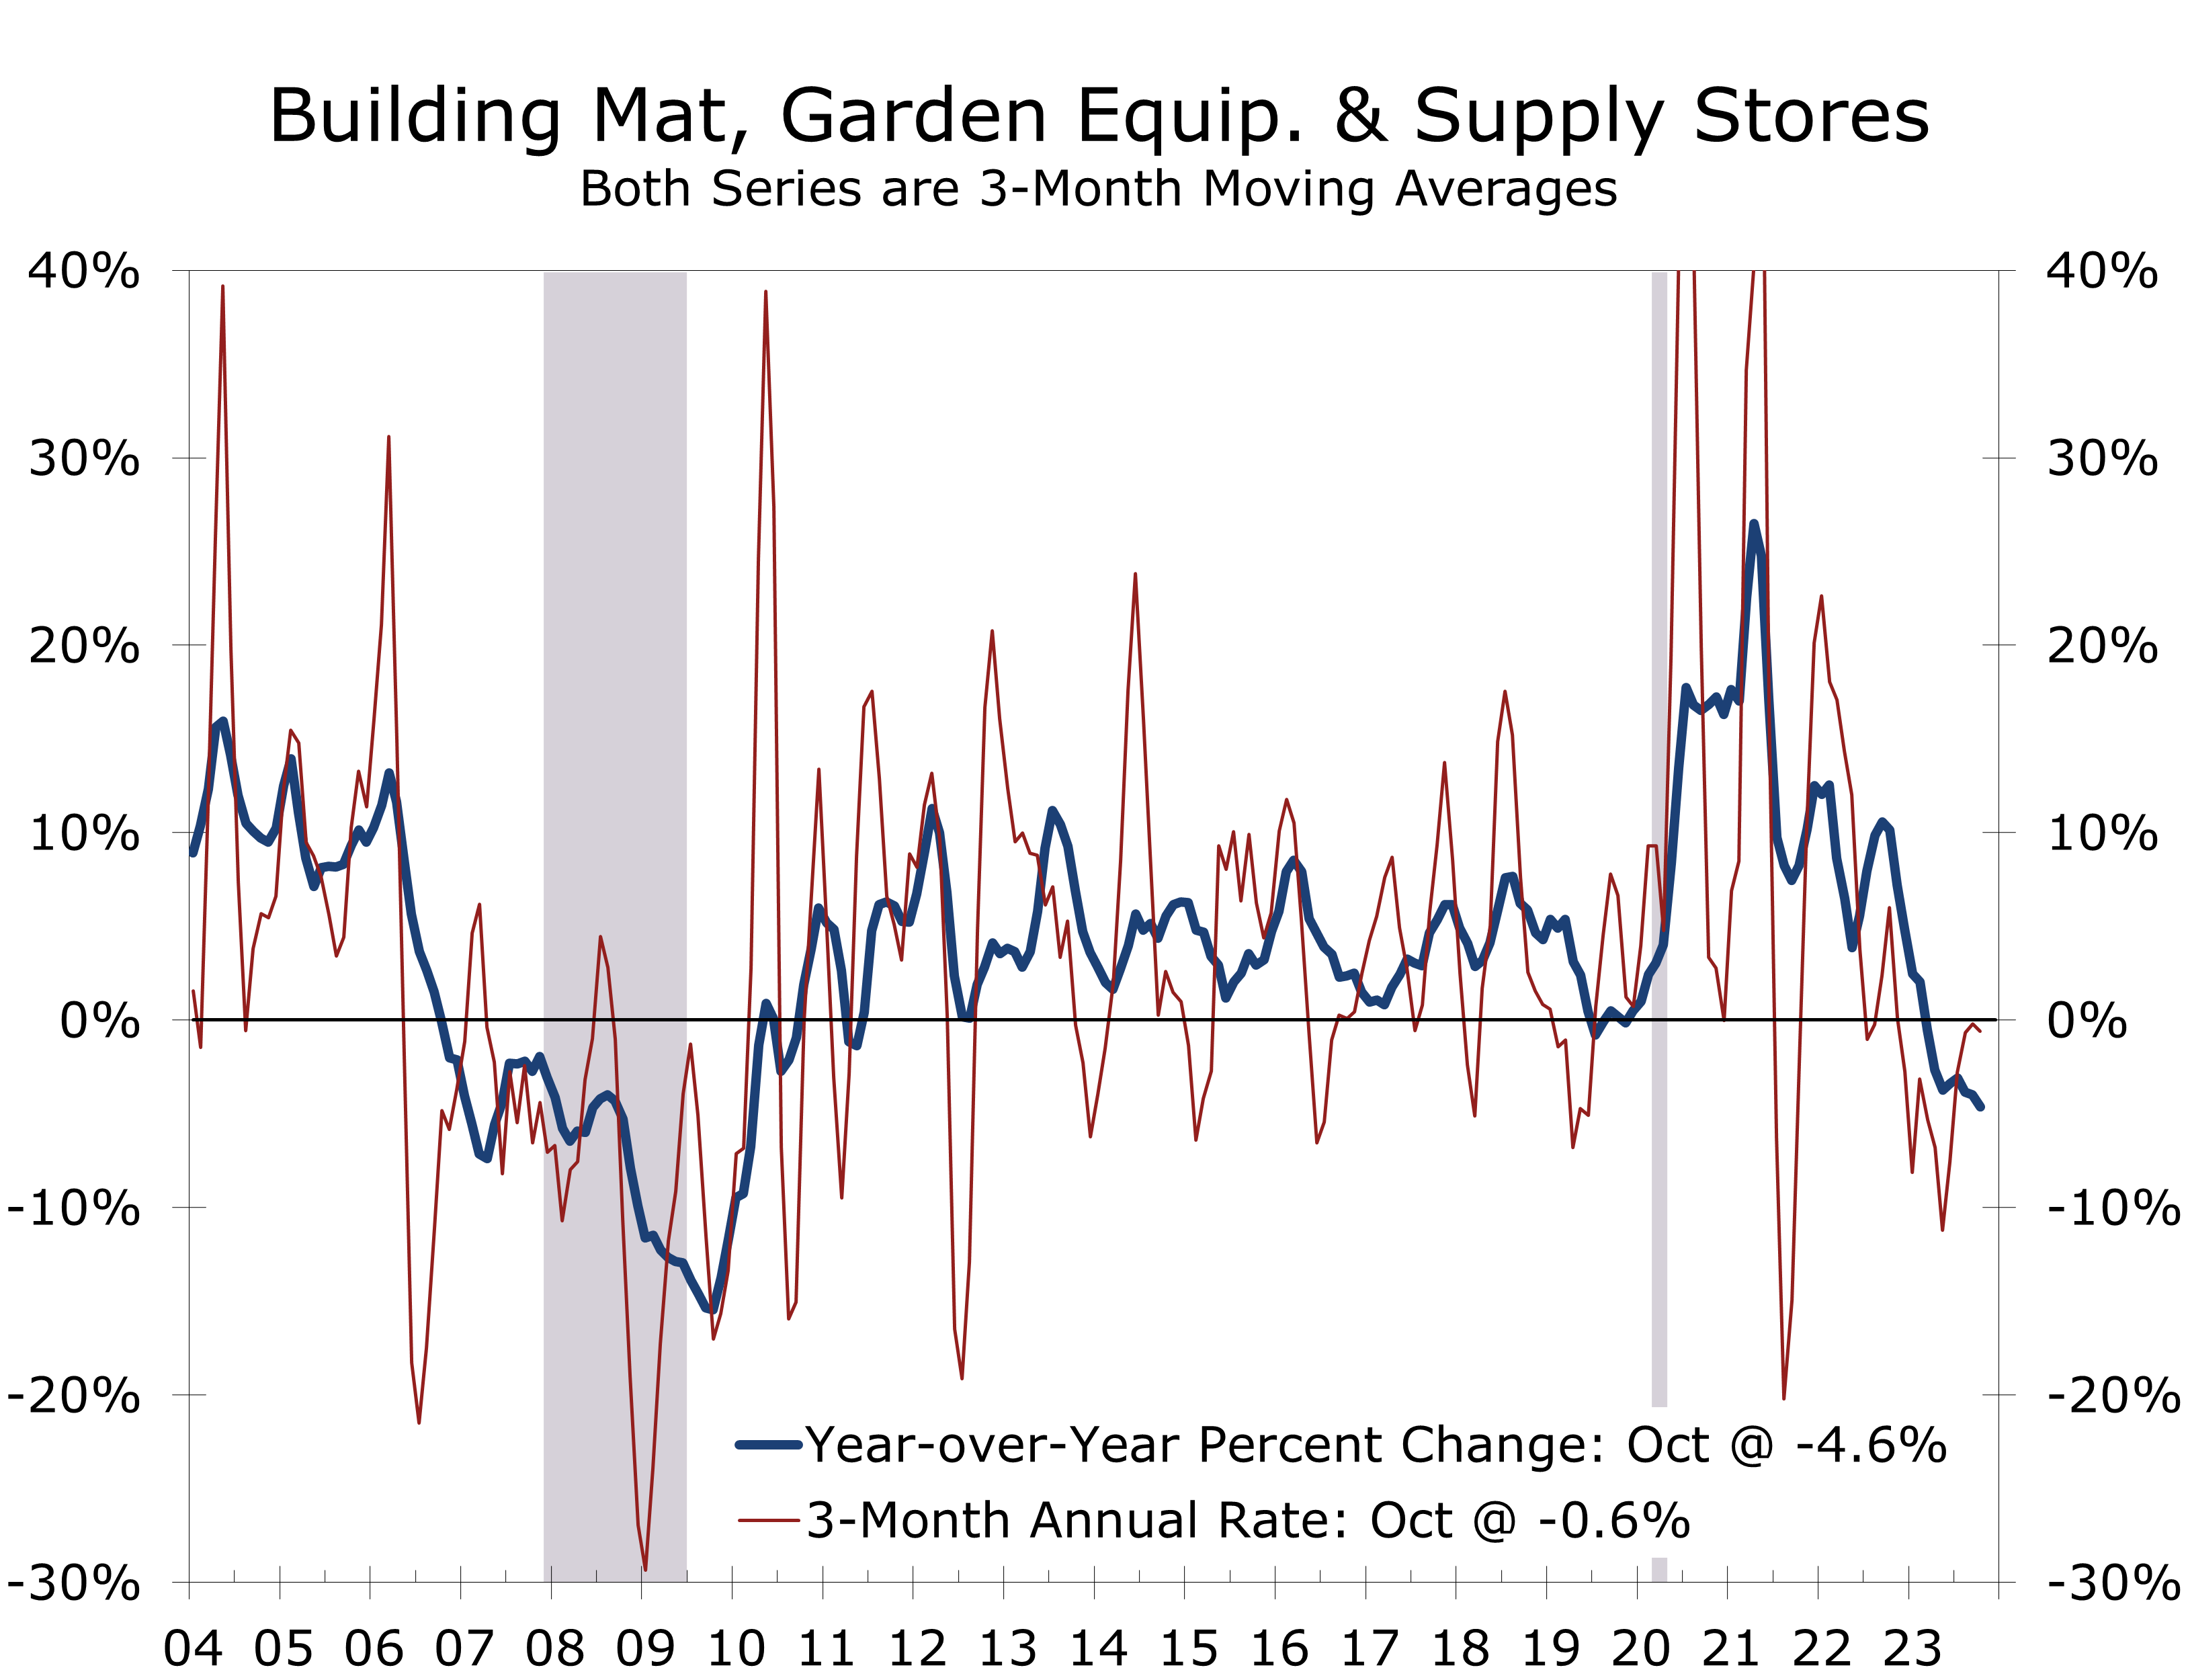
The ongoing decline in existing home sales remains a formidable headwind for home improvement stores. Spending at building material, garden, and home improvement stores fell 0.3% in October and is down 5.6% over the past year. This spending is closely tied to existing home sales, as homeowners tend to make improvements before selling, and buyers often upgrade and customize their new homes.
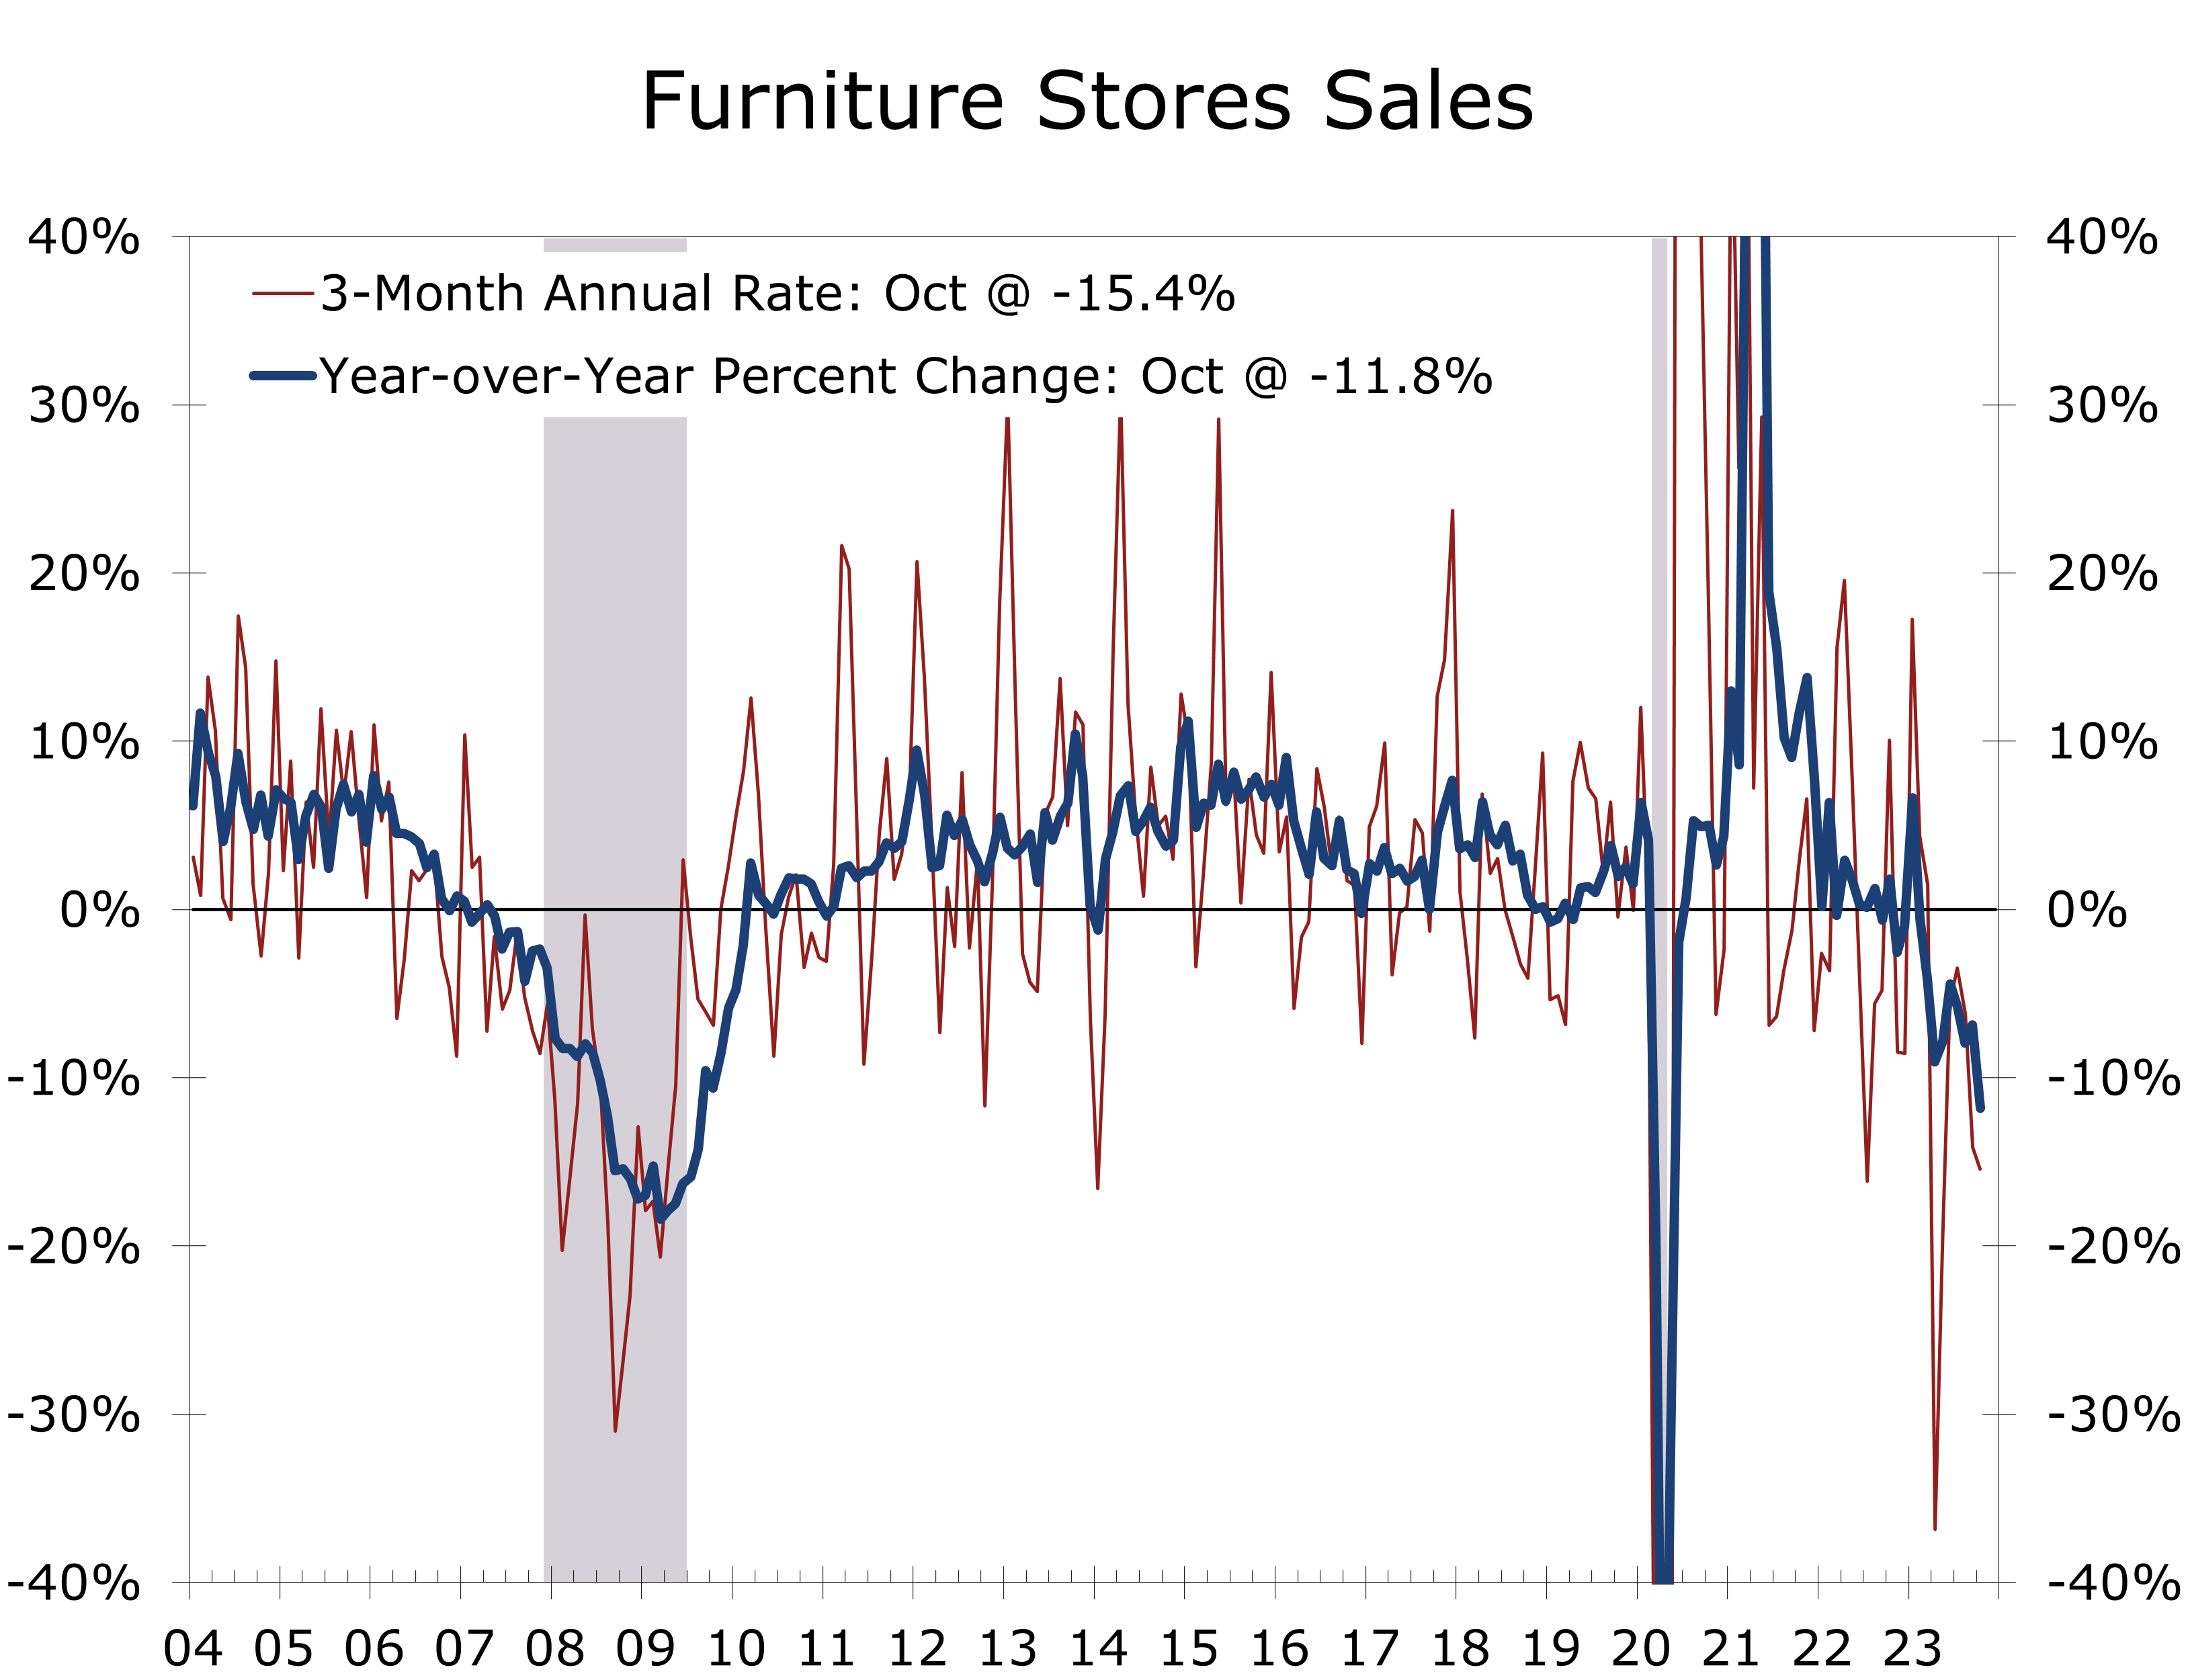
Furniture sales also remain under pressures. Sales at furniture stores fell 2% in October and are down nearly 12% over the past year.
The persistent weakness in furniture sales reflects some payback from the pandemic when consumers purchased furniture to accommodate remote work and remote learning. The weakness in furniture sales has fallen back on manufacturers, leading to a handful of plant closures and bankruptcies.
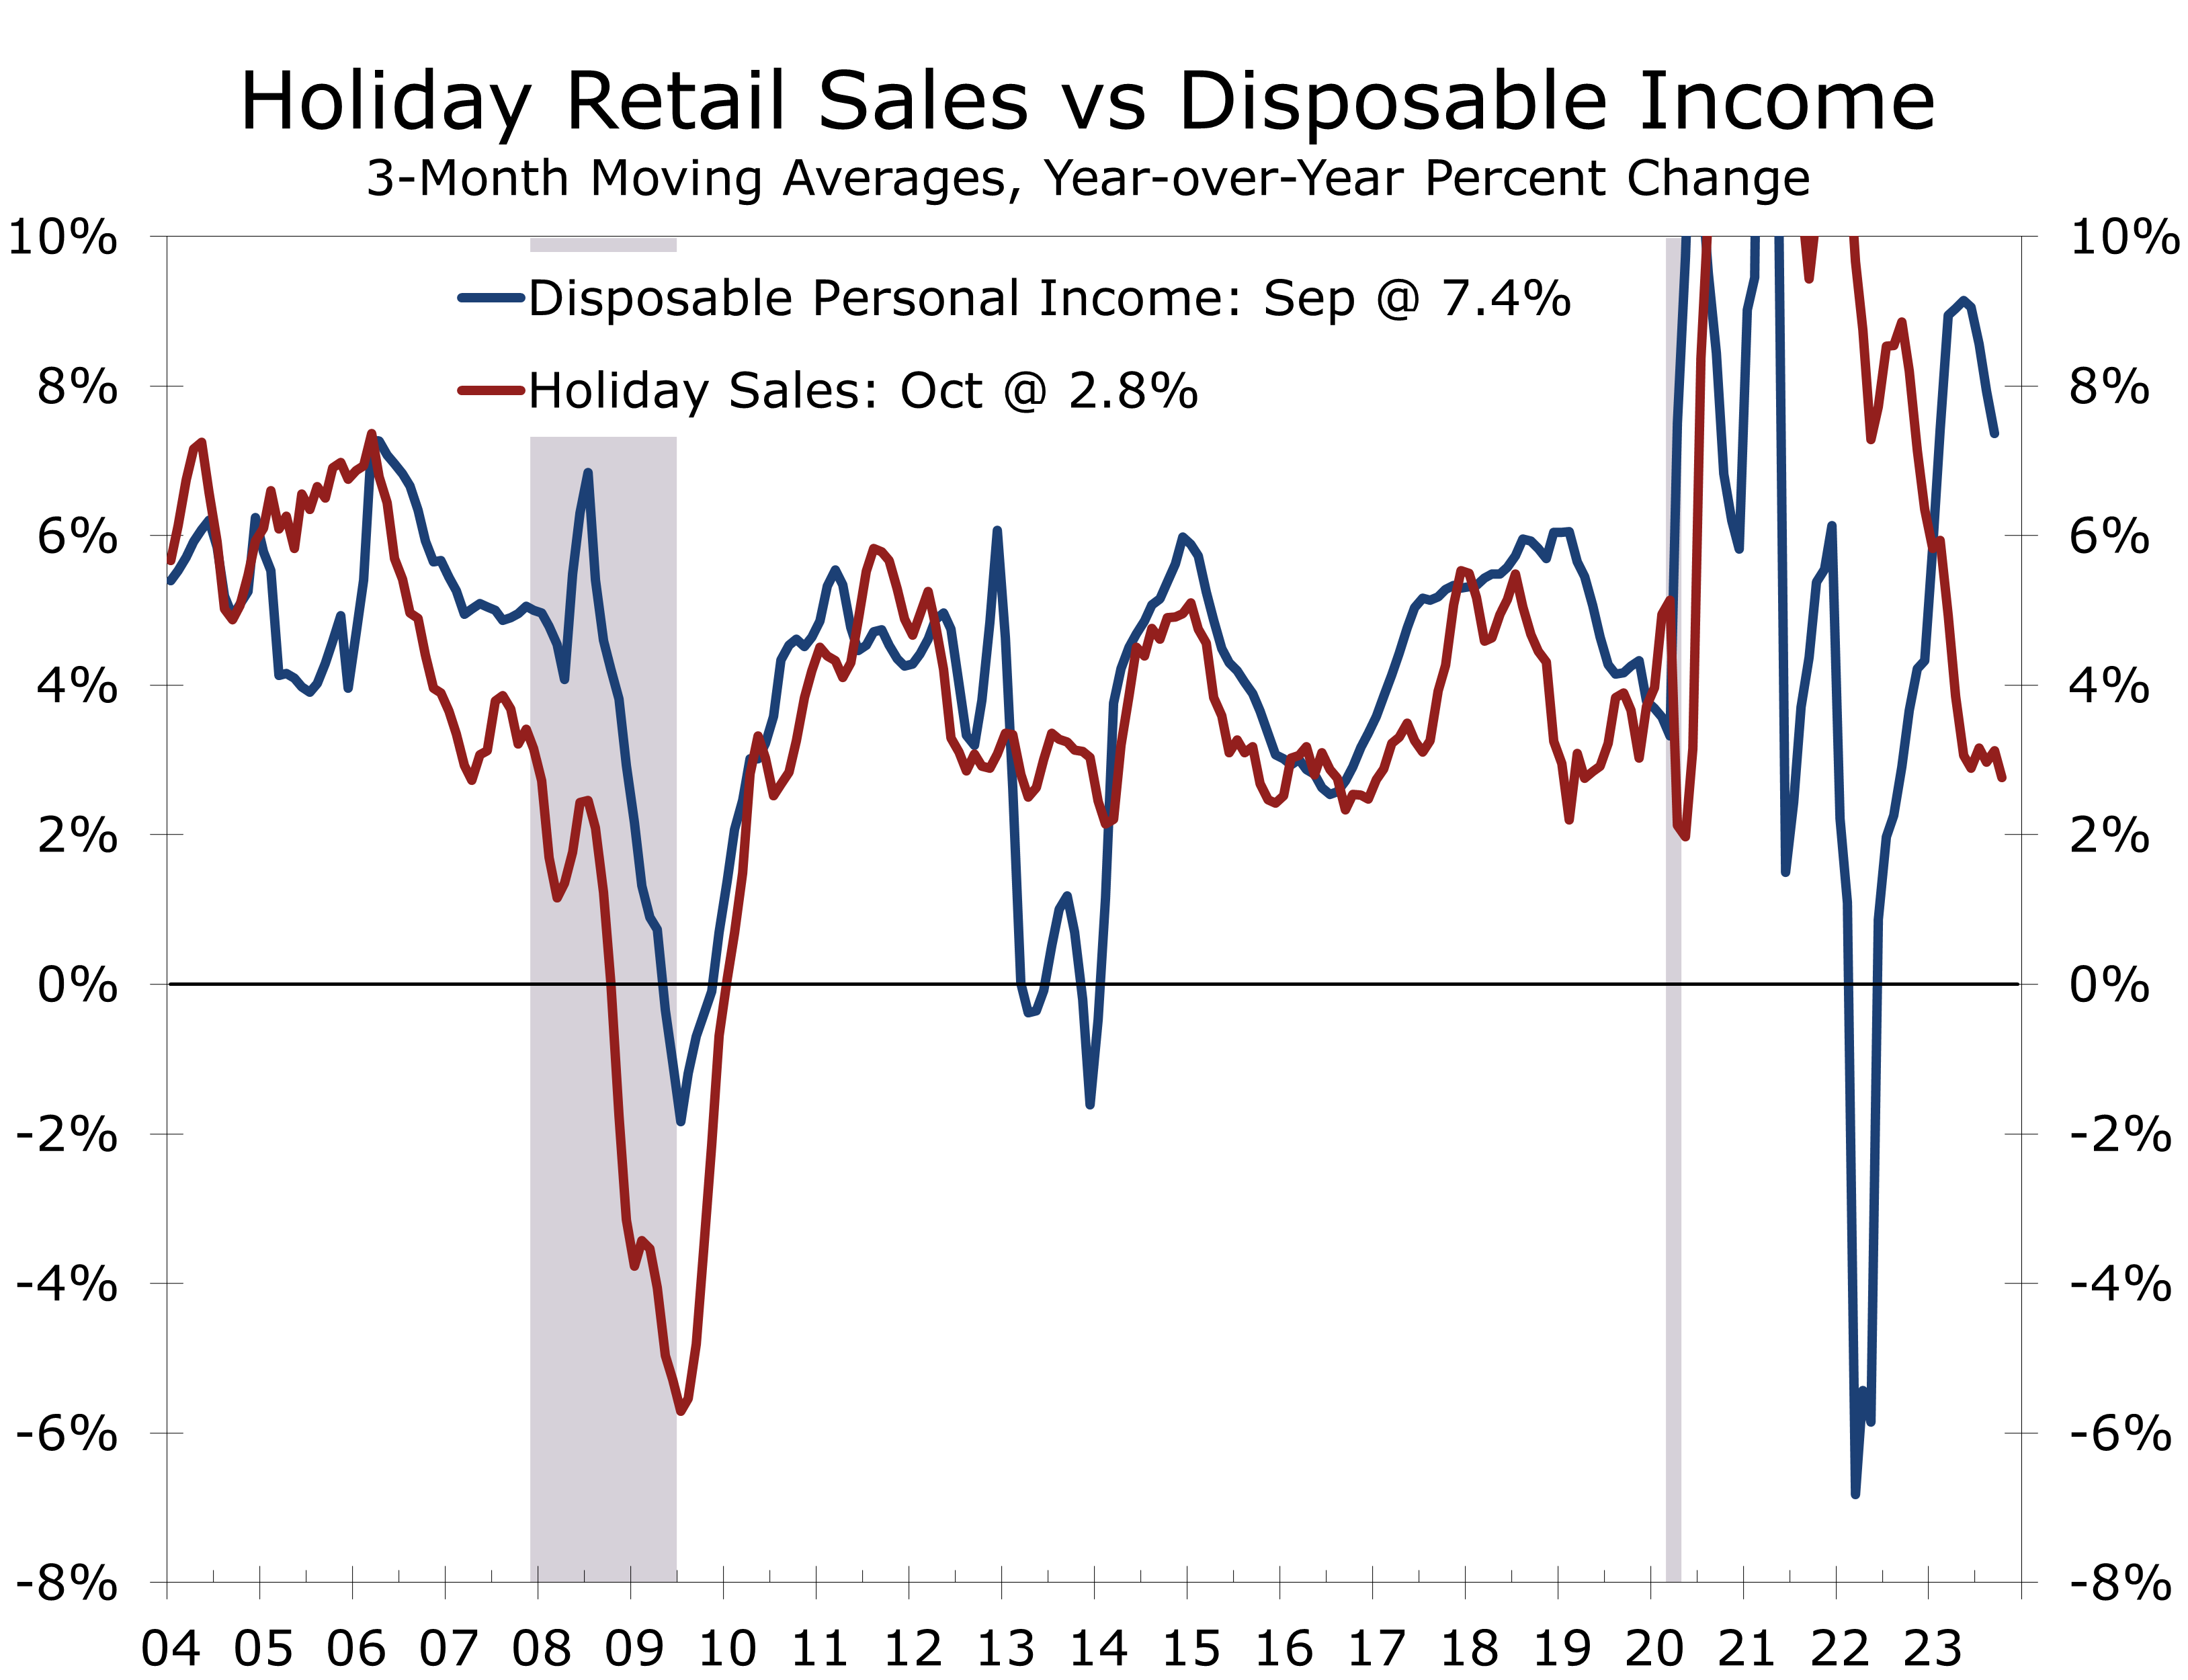
We are looking for only modest gains in holiday retail sales, reflecting slowing income growth.
The latest retail sales figures are likely to be scrutinized for any clues about the upcoming holiday season. Aside from recession periods, holiday sales rise nearly every year. This year should be no exception, with sales expected to rise 3.2% from the prior year. That increase is toward the lower end of the forecast from the National Retail Federation, which called for holiday retail sales to rise between 3% and 4% this year. The average gain from 2010 to 2019 was 3.6%.
October’s soft retail sales report is more consistent with a soft landing than a recession. Consumers have become frugal, however, and are cutting back on credit-dependent purchases, such as furniture, and spending at home improvement stores, which is closely tied to sagging existing home sales.
Disclaimer: This publication has been prepared for informational purposes only and is not intended as a recommendation offer or solicitation with respect to the purchase or sale of any security or other financial product nor does it constitute investment advice.
Inflation Cooled More Than Expected in October
The Inflation Fever May Have Finally Broken
- The Consumer Price Index was unchanged in October and is now up just 3.2% year-to-year.
- Both headline and core inflation came in 0.1 percentage point below the consensus.
- Headline inflation was held in check by a 5.0% drop in gasoline prices. Food prices rose 0.3%, which is slightly larger than in recent months.
- Prices excluding food and energy items rose 0.2%, the smallest rise since September 2021.
- Core inflation was held back by another large drop in used car prices, which fell for the 5th consecutive month.
- Core goods prices fell 0.1%, while core services prices rose 0.3%.
- Shelter prices moderated, mostly due to a huge 2.5% drop in lodging costs.
- Bottom line: October's better-than-expected CPI report sparked a huge rally in the financial markets, which had feared an upside surprise. While the latest data may overstate the extent of the improvement, the moderation in price increases was broad-based.
October continues to shape up as a transformation month. The month began with a weaker ISM manufacturing report that was followed by surprisingly soft employment gains. Today’s data show inflation moderating across most key areas. Headline inflation was held in check by a 5.0% plunge in gasoline prices, while core inflation was held back by price declines for used cars and trucks, new vehicles, hotel rooms and airline fares. Moreover, a much discussed rebound in health insurance costs proved to be far less menacing than was widely feared.
The overall CPI rose 0.045% in October, or roughly unchanged. This marks the best reading for the CPI since July 2022 and brought the year-to-year gain back down to 3.2%. The CPI peaked at 9.1% in June 2022.
Prices excluding food and energy items rose 0.2% and are now up just 4.0% year-to-year, the smallest rise since August 2022. The core CPI was restrained by declines in prices for lodging (-2.5%), used car and truck prices (-0.8%), and airline fares (-0.9%).
Despite the better headlines, prices continue to rise sharply for a handful of items, including motor vehicle insurance (+1.9%), health insurance (+1.1%) and admissions to sporting events (+3.6%). The latter follows a 7.7% rise in September and puts sporting event ticket prices up a whopping 25.1% year-to-year.
The easiest part of bringing inflation back down to the Fed’s 2% target is likely behind us.
Prices for core services (services less energy) rose 0.3% in October. Rent of primary residence rose 0.5% and owners’ equivalent rent rose 0.4%, which remains well ahead more recent market measures of housing costs.

While it is always dangerous to make too much out of any single report, we believe October’s better than expected CPI report will prove to be a harbinger of a more benign inflationary environment going forward. Price increases are moderating broadly, which is evident in the smaller gains in Cleveland Fed’s median and trimmed-mean CPI measures. The moderation also coincides with a whole host of reports suggesting economic growth throttled back in October.
Slower economic growth is driving down commodity prices, with marked declines in oil and other key industrial and agricultural commodities over the past month. This reduction in commodity prices is expected to contribute to a continued deceleration in overall inflation and further restrain core goods prices, leading to additional improvement in the core CPI.
Further reducing core service prices will be the harder part in returning inflation to the Fed’s 2% target. Services excluding energy services account for 58.5% of consumer spending and have moderated only slightly since peaking at 7.3% in March. Prices are moderating, however, and should continue to do so.
Labor costs, a significant component of core services prices, remain a notable headwind. The substantial wage gains won from the UAW strike and a few others will add to the challenge. The broader labor market is cooling, however, indicated by a declining quits rate and smaller gains in average hourly earnings.

Housing is another area where prices have only begun to moderate. Shelter costs rose 6.7% over the past year, accounting for over 70% of the total increase in the core CPI. Rent of primary residence and owners’ equivalent rent rose just slightly more than that, climbing 6.8%. Both peaked 6 months ago and are now trending lower. Private measures of home prices and apartment rents peaked about 18 months ago and have decelerated much more significantly.
The housing costs measure in the CPI tends to lag at least a year behind market measures.
Housing cost will likely moderate further in 2024. Apartment developers are set to deliver a slew of new apartments across the country, which will further depress apartment rents.
Fed Chair Jerome Powell has repeatedly said the Fed’s next move is more likely to raise interest rates rather than lower them. Powell is basically talking the Fed’s book, hoping the financial markets will do the Fed’s work for them. October’s softer economic data and lower inflation print suggest a shift to a neutral bias at the December FOMC meeting, putting the Fed on a trajectory to cut rates around the middle of next year.

Disclaimer: This publication has been prepared for informational purposes only and is not intended as a recommendation offer or solicitation with respect to the purchase or sale of any security or other financial product nor does it constitute investment advice.
Stronger Q3 GDP Growth Produces Less Cheer and More Concern
Real GDP Surges at a 4.9% Annual Rate in Q3
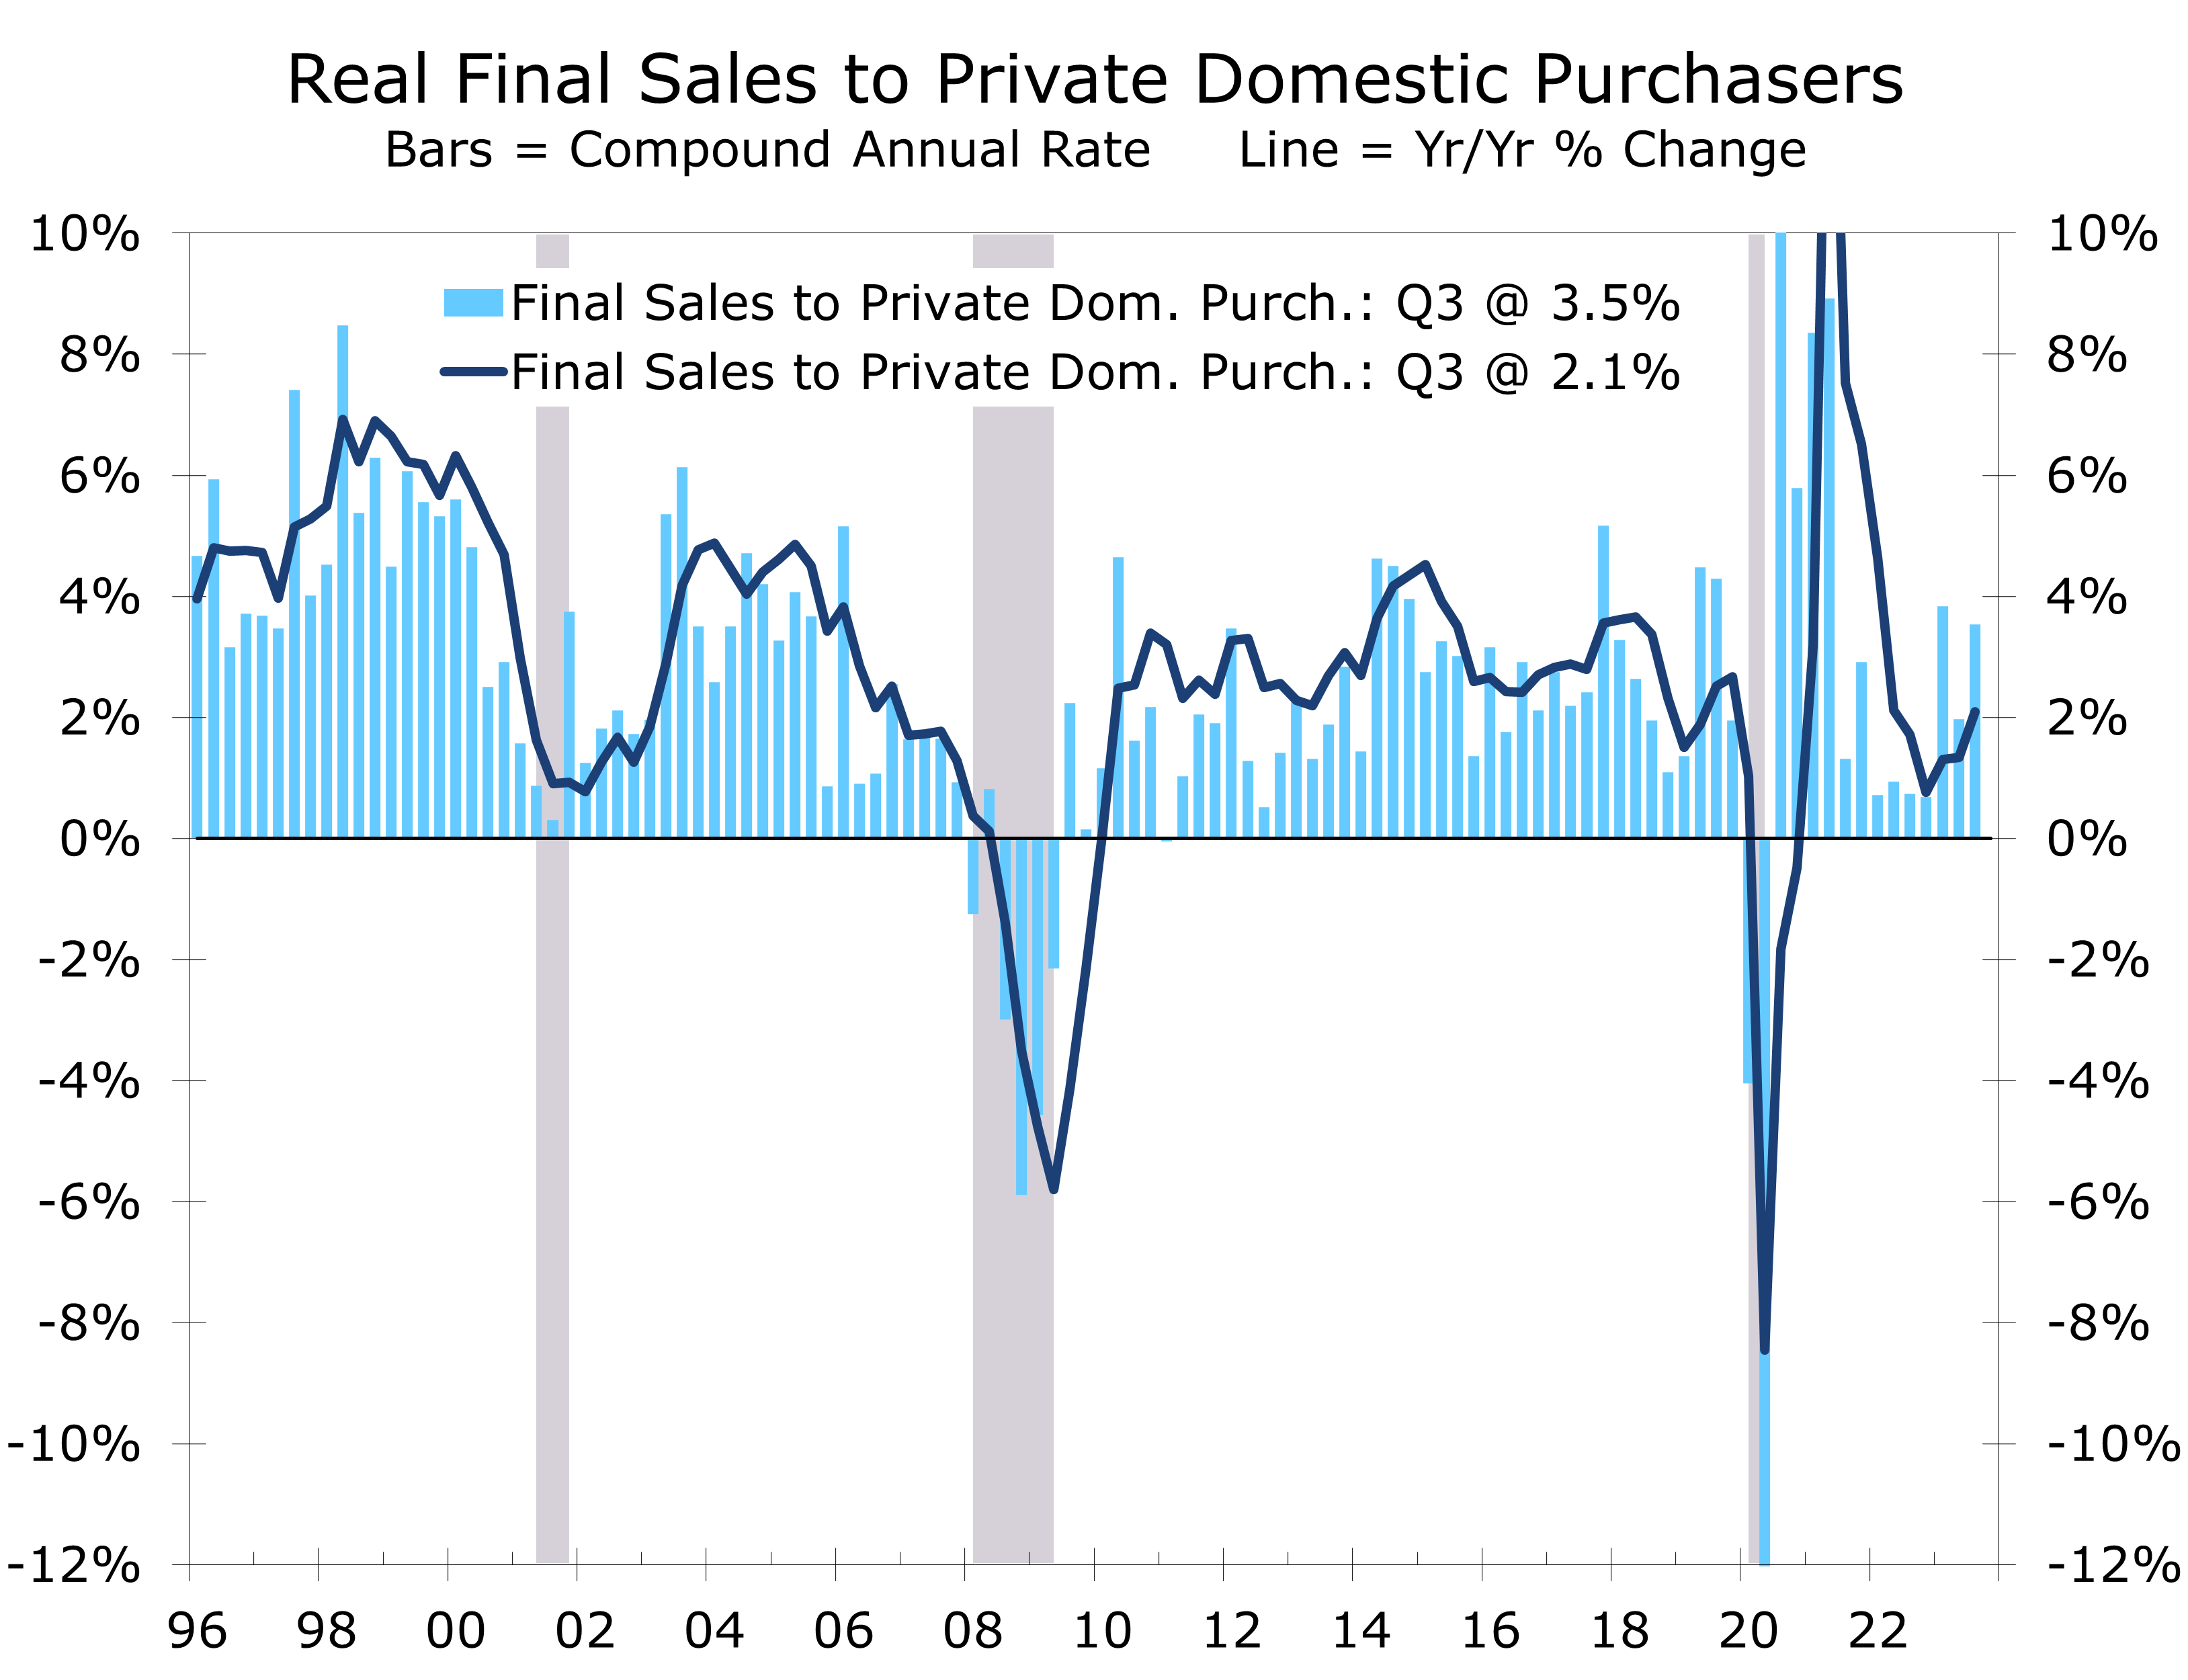
- Real GDP grew at a 4.9% annual rate during the third quarter, with strength evident across the board.
- Consumer spending rose at 4.0% annual rate, with spending up solidly for both goods (+4.0%) and services (+3.6%).
- Business investment in new equipment was a rare soft spot, declining at a 3.8% pace, but outlays for structures (+1.6%) and intellectual property (+2.6%) both increased.
- Residential investment rose at a 3.9% pace, marking its first increase since Q1 2021.
- Inventories added 1.3 points to Q3 growth, partly reflecting efforts by car dealers to build inventories ahead of the UAW strike.
- Government spending rose at a 4.6% annual rate, led by an 8% surge in defense outlays, as well as solid gains in nondefense outlays and state and local government spending.
- There is decidedly less enthusiasm surrounding the robust 4.9% real GDP growth reported for the third quarter. The economy’s remarkable resilience will pull interest rates higher, adding to the building headwinds facing the economy in coming quarters.
Real GDP growth soared at a 4.9% annual rate during the third quarter, marking the strongest quarterly growth since Q4 2021 when stimulus payments were still in full force. The rise was widely expected, following a string of stronger reports showing consumer spending grew solidly this past summer. Inventory building ahead of the UAW strike and defense spending also added meaningfully to growth.
There is decidedly less enthusiasm surrounding the blowout third quarter GDP report. While strength was evident across the board, the report adds to concerns that the economy’s resilience will pull interest rates even higher and cause rates to remain higher for a longer. Higher interest rates will add to the growing litany of concerns ranging from the resumption of student loan payments, tightening financial conditions, fights over persistent budget deficits, and ongoing wars in Europe and the Middle East.
While Q3 growth slightly topped consensus estimates, it hardly came as a surprise. Consumer spending was incredibly strong this past summer, driven by outlays for experiences like concerts and travel. Spending for services grew at a 3.6% annual rate, the strongest since the 2021 pandemic recovery.
Spending for goods also rose solidly, with spending for durable goods jumping at a 7.6% pace and spending for nondurables climbing at a 3.3% pace. The spending spree largely came out of savings, however, as real after-tax income declined at a 1.0% annual rate in Q3 and saving rate fell from 5.2% to 3.8%.

The strength in consumer spending likely carried into the current quarter, as evidenced by strong ‘core’ retail sales in September. We expect consumer spending to rise at a more modest 2.5% pace in Q4, which should be enough to ensure solid overall growth for the quarter. While concerns about the toll the resumption of student loan payments, slowing income growth and tightening credit conditions are valid, the impact will not be immediate and become more evident next year.
Home building made a positive contribution to third quarter growth, with residential investment climbing at a 3.9% annual rate. The gains is the first rise since the first quarter of 2021 and likely reflects efforts by home builders to speed up deliveries of homes under construction to take advantage of the shortage of existing homes for sale.
Rising interest rates and tightening credit are taking a toll on business fixed investment.
Business fixed investment slowed sharply during the third quarter. Spending for new equipment declined at a 3.8% annual rate and reflects a broader slowdown in goods production as well as the impact on rising interest rates and tightening credit conditions on small businesses. Outlays for nonresidential structures continue to increase, climbing at a 1.6% pace, which is well off the pace of recent quarters.
Spending for nonresidential structures has benefitted from the incredibly generous benefits provided by the CHIPS & Science Act and Inflation Reduction Act, which have significantly boosted construction of semiconductor plants and EV plants, predominantly in Midwest and South.
Government spending rose at a 4.6% annual rate during the third quarter. The rise reflects healthy gains in both defense and nondefense outlays. Defense spending jumped at an 8% annual rate in Q3, reflecting replenishment of supplies provided to Ukraine. Nondefense outlays rose at a 3.9% pace. State and local government spending grew at a 3.7% pace.
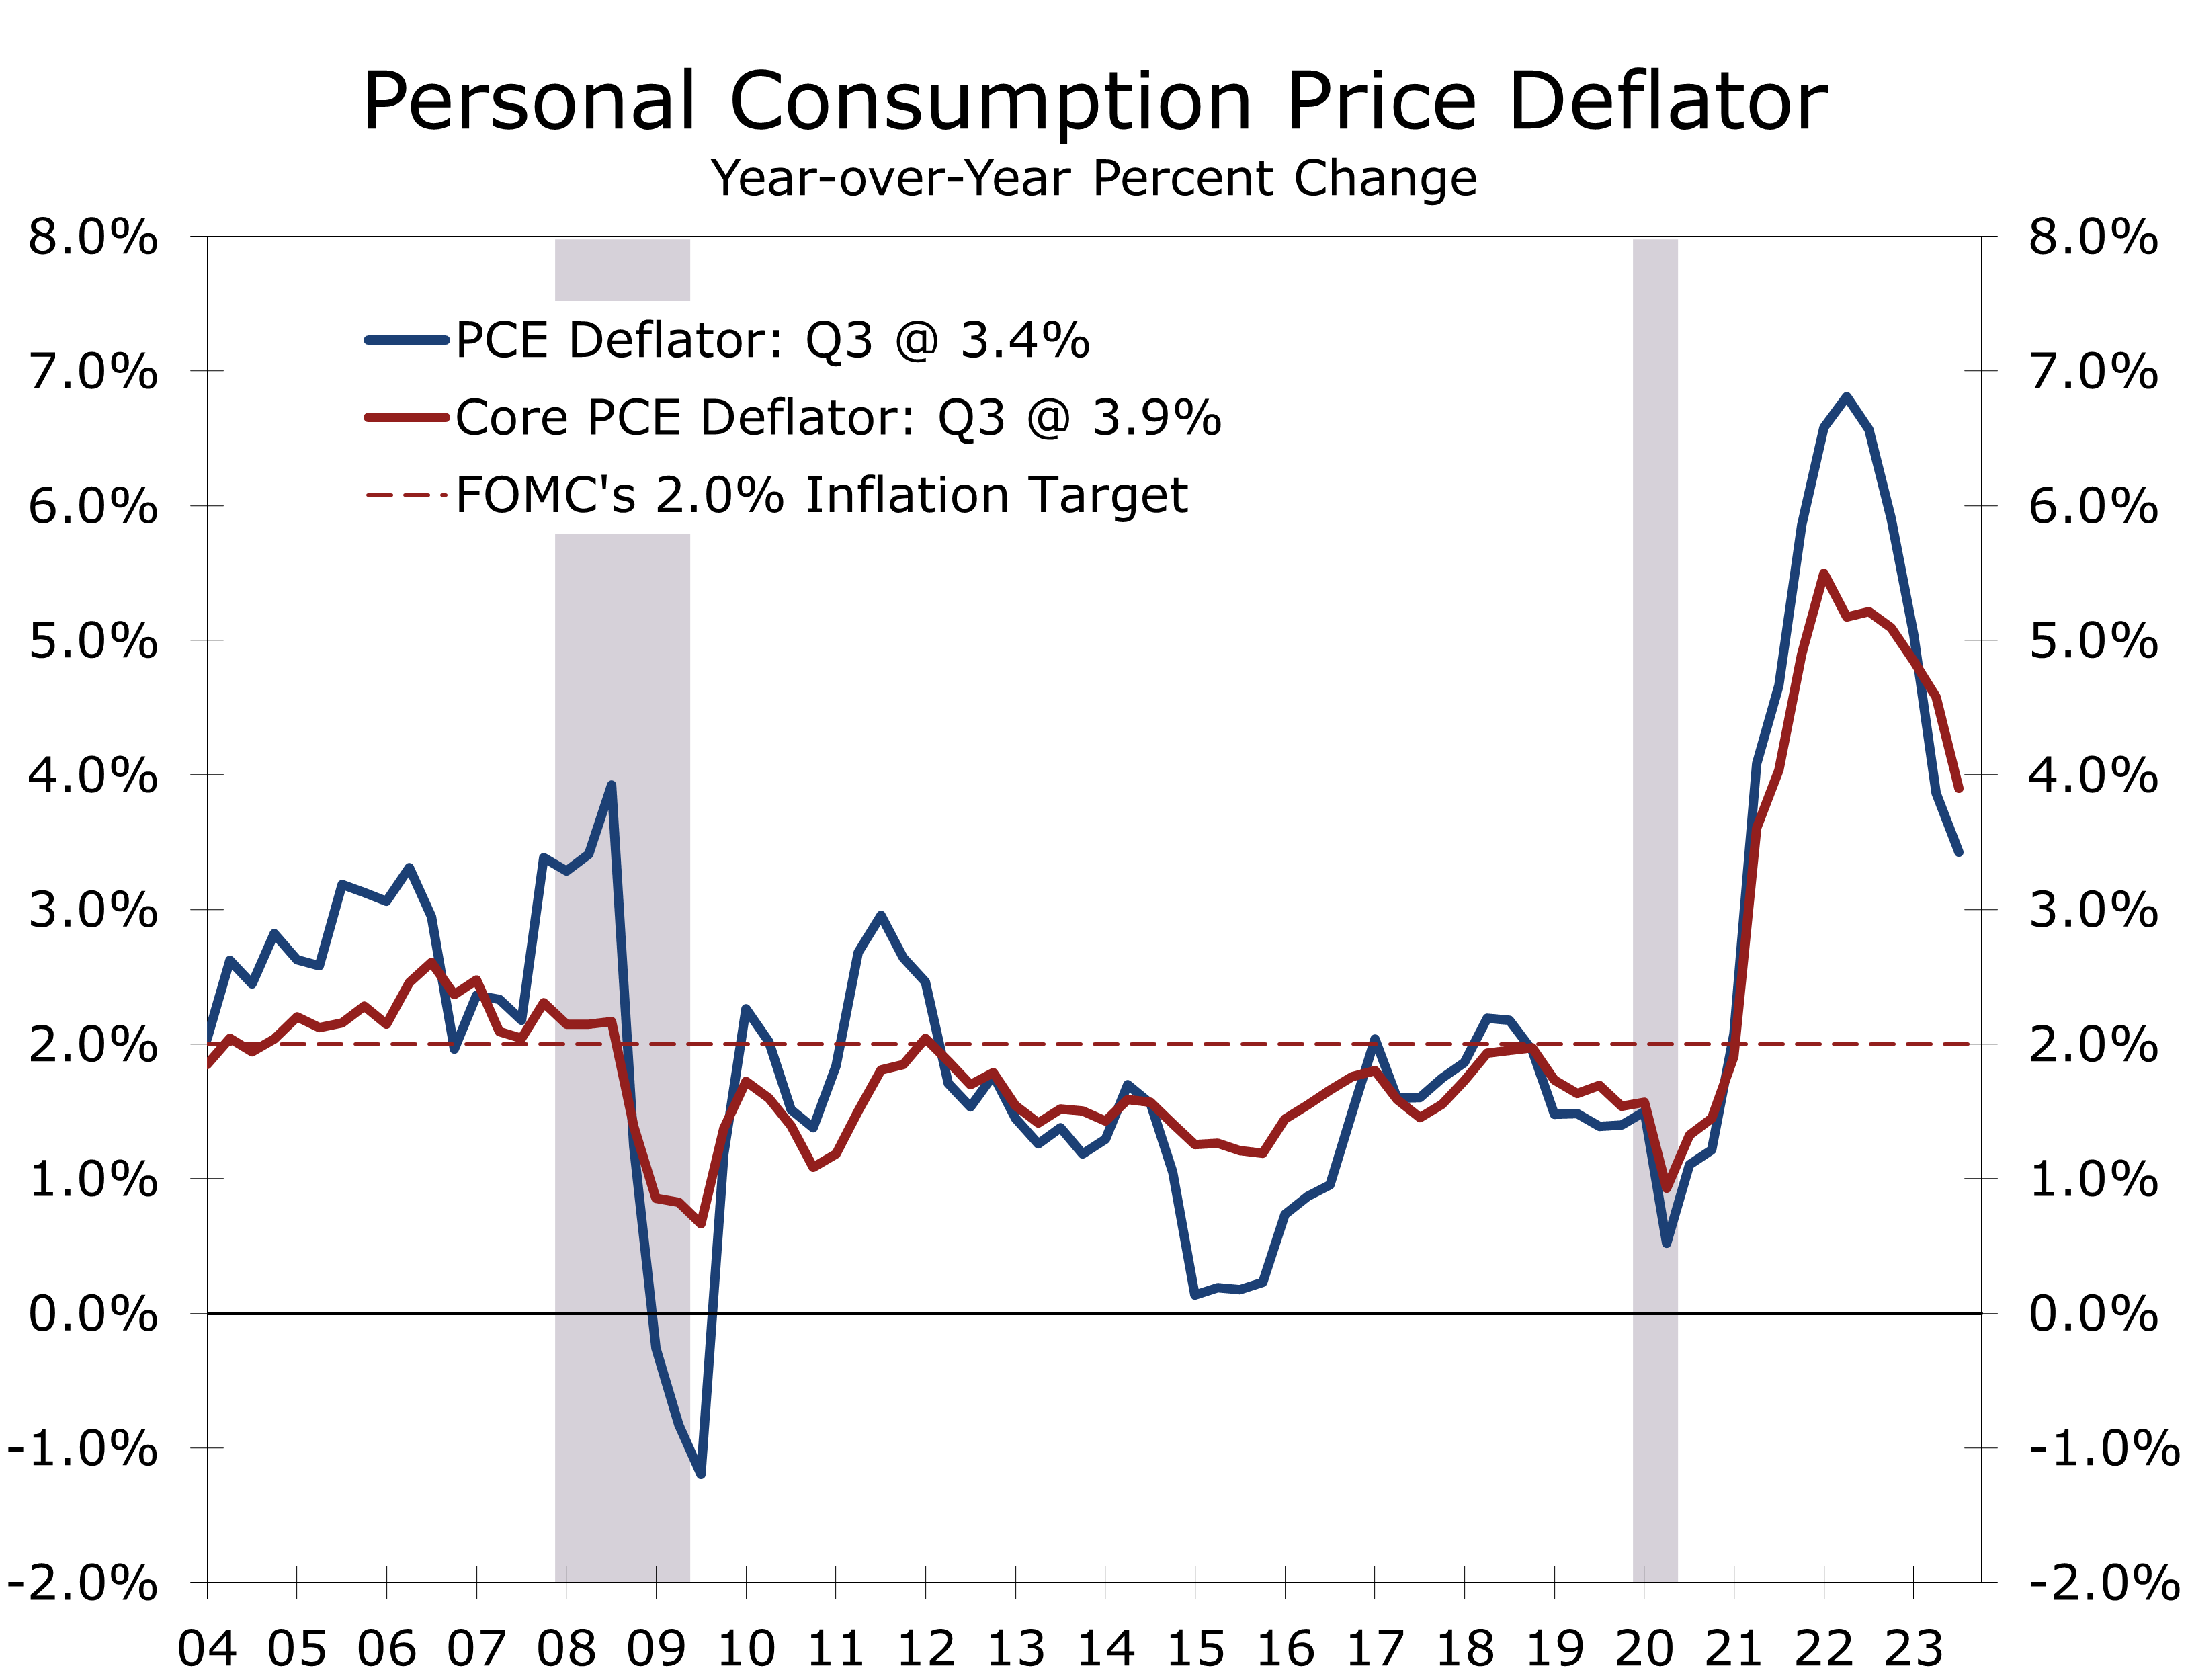
Inflation continues to cool off but remains well above the Fed’s 2% target.
Increased government spending contributed to a larger than expected 3.5% annual rate increase in the GDP Deflator. The more closely watched core PCE deflator was better behaved, however, climbing at just a 2.4% pace and slowing to 3.9% year-to-year. Ongoing wars are expected to drive defense spending higher, posing further challenges for controlling the deficit and bringing inflation back down to the Fed’s 2% target.
Disclaimer: This publication has been prepared for informational purposes only and is not intended as a recommendation offer or solicitation with respect to the purchase or sale of any security or other financial product nor does it constitute investment advice.
Existing Home Sales Continue to Grind Lower
Existing Home Sales Fall Further in September
- Existing home sales fell 2.0% in September to a 3.96-million-unit pace, a new cycle low.
- Sales have fallen 15.4% over the past year, while inventories are down 8.1%. Inventories remain tight at just a 3.4-month supply.
- Sales of existing single-family homes fell 1.9% in September, while sales of condominiums and co-ops fell 2.3%.
- Homes are taking slightly longer to sell, remaining on the market for 21 days, up from 20 days in August and 19 a year ago.
- The median price of an existing homes fell 2.4% in September, marking the third consecutive monthly drop. Prices remain up 2.8% year-to-year, however. Prices for single-family homes have risen 2.5% over the past year to $399,200, while prices for condos and co-ops rose 6.8% to $353,800.
- Sales fell in every region but the Northeast, falling 5.3% in the West, 4.1% in the Midwest, and 1.1% in the South.
- The housing market remains the primary transmission mechanism for the Fed’s interest rate hikes. Sales of existing homes have now fallen to a new cycle low, which will have meaningful knock-on effects in 2024.
The housing market is one area where the Fed’s tightening monetary policy is making an impact. Sales of existing homes have fallen in 19 of the past 22 months, including a 2.0% drop in September. Sales are now running at their slowest pace since October 2010 and are 3.2% below their pandemic-era low hit when the economy was largely shut down.
Existing home sales are being impacted by a myriad of headwinds. The most obvious is higher mortgage rates, which topped 8% this morning. The combination of higher interest rates and higher home prices have made housing much less affordable. As of August, a family earning the median income that purchased a home at the median price with a 20% down payment would need to devote a record 27.3% of their gross income to make the $2,234 monthly principal and interest payment. The long-term average is around 19%, or about $675 a month less.
Rising interest rates and higher home prices continue to sap housing affordability.
Ordinarily rising interest rates would set off a correction, with declining home sales slowing home price appreciation and leading to a broader economic deceleration. But with so many homeowners either owning their home outright (42% of homeowners) or having locked in generationally low mortgage rates (more than 80% of mortgages are fixed at less than 5%, and more than 60% or below 4%), homeowners are less impacted by rising interest rates than in the past.

At 8%, mortgage rates are now above their average for the past 50 years. If rates remain at this level, they will meaningfully cut further into existing home sales. Existing home sales reflect closings on contracts signed 1 to 2 months prior, which means homes closed in September were likely put under contract in July and August, when mortgage rates were closer to 7%.
Pending homes, which track purchase contracts, plunged 7.1% in August and are running 18.9% below their year ago level. The decline in pending home sales suggests existing home sales have further to fall. We expect existing home sales to fall 4.3% in the fourth quarter to a 3.8-million-unit pace and likely fall even further during the first half of 2024.
Housing is one of the primary transmission mechanisms for monetary policy to influence the broader economy. Falling home sales not only cut into commission income for realtors and mortgage lenders but also reduce knock-on effects from spending on home improvements, furniture, and home furnishings.
Further declines in home sales will have an impact but they will not be devastating by any means. Spending on home improvements and furniture have both weakened along with existing home sales and will likely slow even further in coming months. Home prices, however, are likely to remain resilient as even fewer homeowners are likely to put their homes up for sale.
The median price of an existing home fell 2.4% in September, marking the third consecutive monthly decline on a non-seasonally adjusted basis. The price of a single-family home fell 2.7%, while the price for condominiums and co-ops fell 0.1%. The recent declines are not unusual, as home prices usually decline in late summer and fall. Prices remain up 2.8% year-to-year and will likely remain up through the end of this year. Prices may dip slightly for a short period of time in 2024 but are unlikely to decline significantly as the supply of homes for sale will remain tight.
The National Association of Realtors also noted that the share of all-cash purchases rose to 29% of transactions in September, up from 27% in August and 22% in September 2022. Individual investors and second-home buyers, which typically account for the bulk of all-cash sales, accounted for 18% of home purchases in September, up from 16% in August and 15% last September.
The rise in all-cash purchases likely reflects the ongoing migration of home buyers from high cost housing markets in the West and Northeast to lower-price housing markets in the South and Midwest. Investors appear to be shying away from home purchases.
Disclaimer: This publication has been prepared for informational purposes only and is not intended as a recommendation offer or solicitation with respect to the purchase or sale of any security or other financial product nor does it constitute investment advice.
An Underwhelming Rebound in Housing Starts
Housing Starts Rebound Less Than Expected
- Housing starts rebounded 7% in September to a 1.358-million-pace but starts were revised lower for both August and July.
- Permits fell 4.4% to a 1.473-million unit pace, with single-family permits rising 1.8% and multi-family permits falling 14.3%.
- Single-family permits are running roughly even with starts, while multi-family permits are running about 115K ahead of starts.
- Housing starts rose in every region except the Northeast (-24.5%). The Midwest was an outlier, with starts surging 35.3%. Starts rose 6.5% in the South and 5.6% in the West.
- Leading indicators for the housing market all point to softening conditions, with mortgage applications plunging 11.7% over the past 4 weeks and home builder confidence falling in each of the past three months.
- The slide in mortgage applications comes is consistent with the most recent data from the NAHB survey. Builders report slowing sales, diminishing buyer traffic, and have lowered expectations for sales over the next six months. With short-term rates up, builders are also slowing new construction.
Housing starts rose 7% in September to a 1.358-million unit pace. Both single-family (+3.2%) and multi-family starts (+17.6%) rose in September and starts increased in every region except the Northeast. Despite the increase, home building is clearly losing momentum. Building permits fell 6.4% and other leading indicators, such as mortgage applications and home builders’ confidence also declined.
Single-family starts rose 3.2% in September to a 963,000-unit pace. Starts rose in every region except the Northeast, where they fell 19%. The Northeast is the smallest region for single-family home building and monthly changes are often extremely volatile. Single-family starts rose solidly in the Midwest (+14.2%) and also rose solidly in the West (+5.2%) and South (+2.8%).
Permits for new single-family homes also increased, edging up 1.8% to a 965,000-unit pace. All of September’s increase came in the South, which is by far the largest region for new home construction. The South accounts for just over 61% of single-family home building, reflecting the region’s strong population growth and lower land costs.
While single-family starts and permits increased in September, we expect home building to slow. The latest NAHB Home Builders’ Survey reported home builder confidence fell 4 points in October to 40 and has declined 16 points over the past three months. Mortgage applications also continue to trend lower, with purchase applications falling 6% this past week and falling 21% over the past year.
Single-family housing starts averaged a 961,000-unit pace over the past three months, while permits averaged a slightly lower 947,000-unit pace. We expect single-family starts to decline over the next few months and average a 930,000-unit pace in Q4 and 860,000 unit pace during the first half of 2024. Relative to past cycles, this would mark a soft landing for single-family home building, which remains chronically undersupplied. The primary challenge is affordability, which will not meaningfully improve until mortgage rates decline back in line with their long-run norms.
Completions of single-family homes rose 5.3% in September and have been running ahead of starts the past the past 15 months. With completions outpacing starts, the backlog of single-family homes under construction has been significantly reduced.
Completions of single-family homes have outpaced starts for the past 15 months.
Prior to the pandemic, single-family starts took roughly six months to complete, which kept a tight relationship between starts and completions. Widespread building materials and labor shortages caused cycle times to lengthen, however, lifting starts well above completions throughout 2021 and the first half of 2022. Completions have been running ahead of starts since then, however, as builders looked to take advantage of the shortage of existing homes for sale.

The backlog of multi-family projects under construction has finally begun to decline, with completions of apartments running slightly ahead of starts the past two months. There are still roughly 1 million multi-family homes currently under construction, most of which are rental apartments. Completions of multi-family projects rose 9.6% in September to a 455,000-unit pace, compared to 395,000 multi-family starts.
The housing market is one area where the Fed’s rate hikes are cooling demand.
Permits for multi-family homes fell 14.3% in September to a 508,000-unit pace but are still running well ahead of starts. We suspect apartment developers are rushing to begin projects before credit tightens further. Starts are increasingly being delayed and many projects will likely be put on hold until interest rates decline and credit eases up.
We are looking for a harder landing for apartment construction in 2024, with starts declining 32% to around 310,000 units. The slide in starts should allow builders to make significant headway in clearing what had been a record backlog of projects.

Disclaimer: This publication has been prepared for informational purposes only and is not intended as a recommendation offer or solicitation with respect to the purchase or sale of any security or other financial product nor does it constitute investment advice.
Exorcising Spirits from the Pandemic
Ghosts From Past Crises Continue to Wreak Havoc
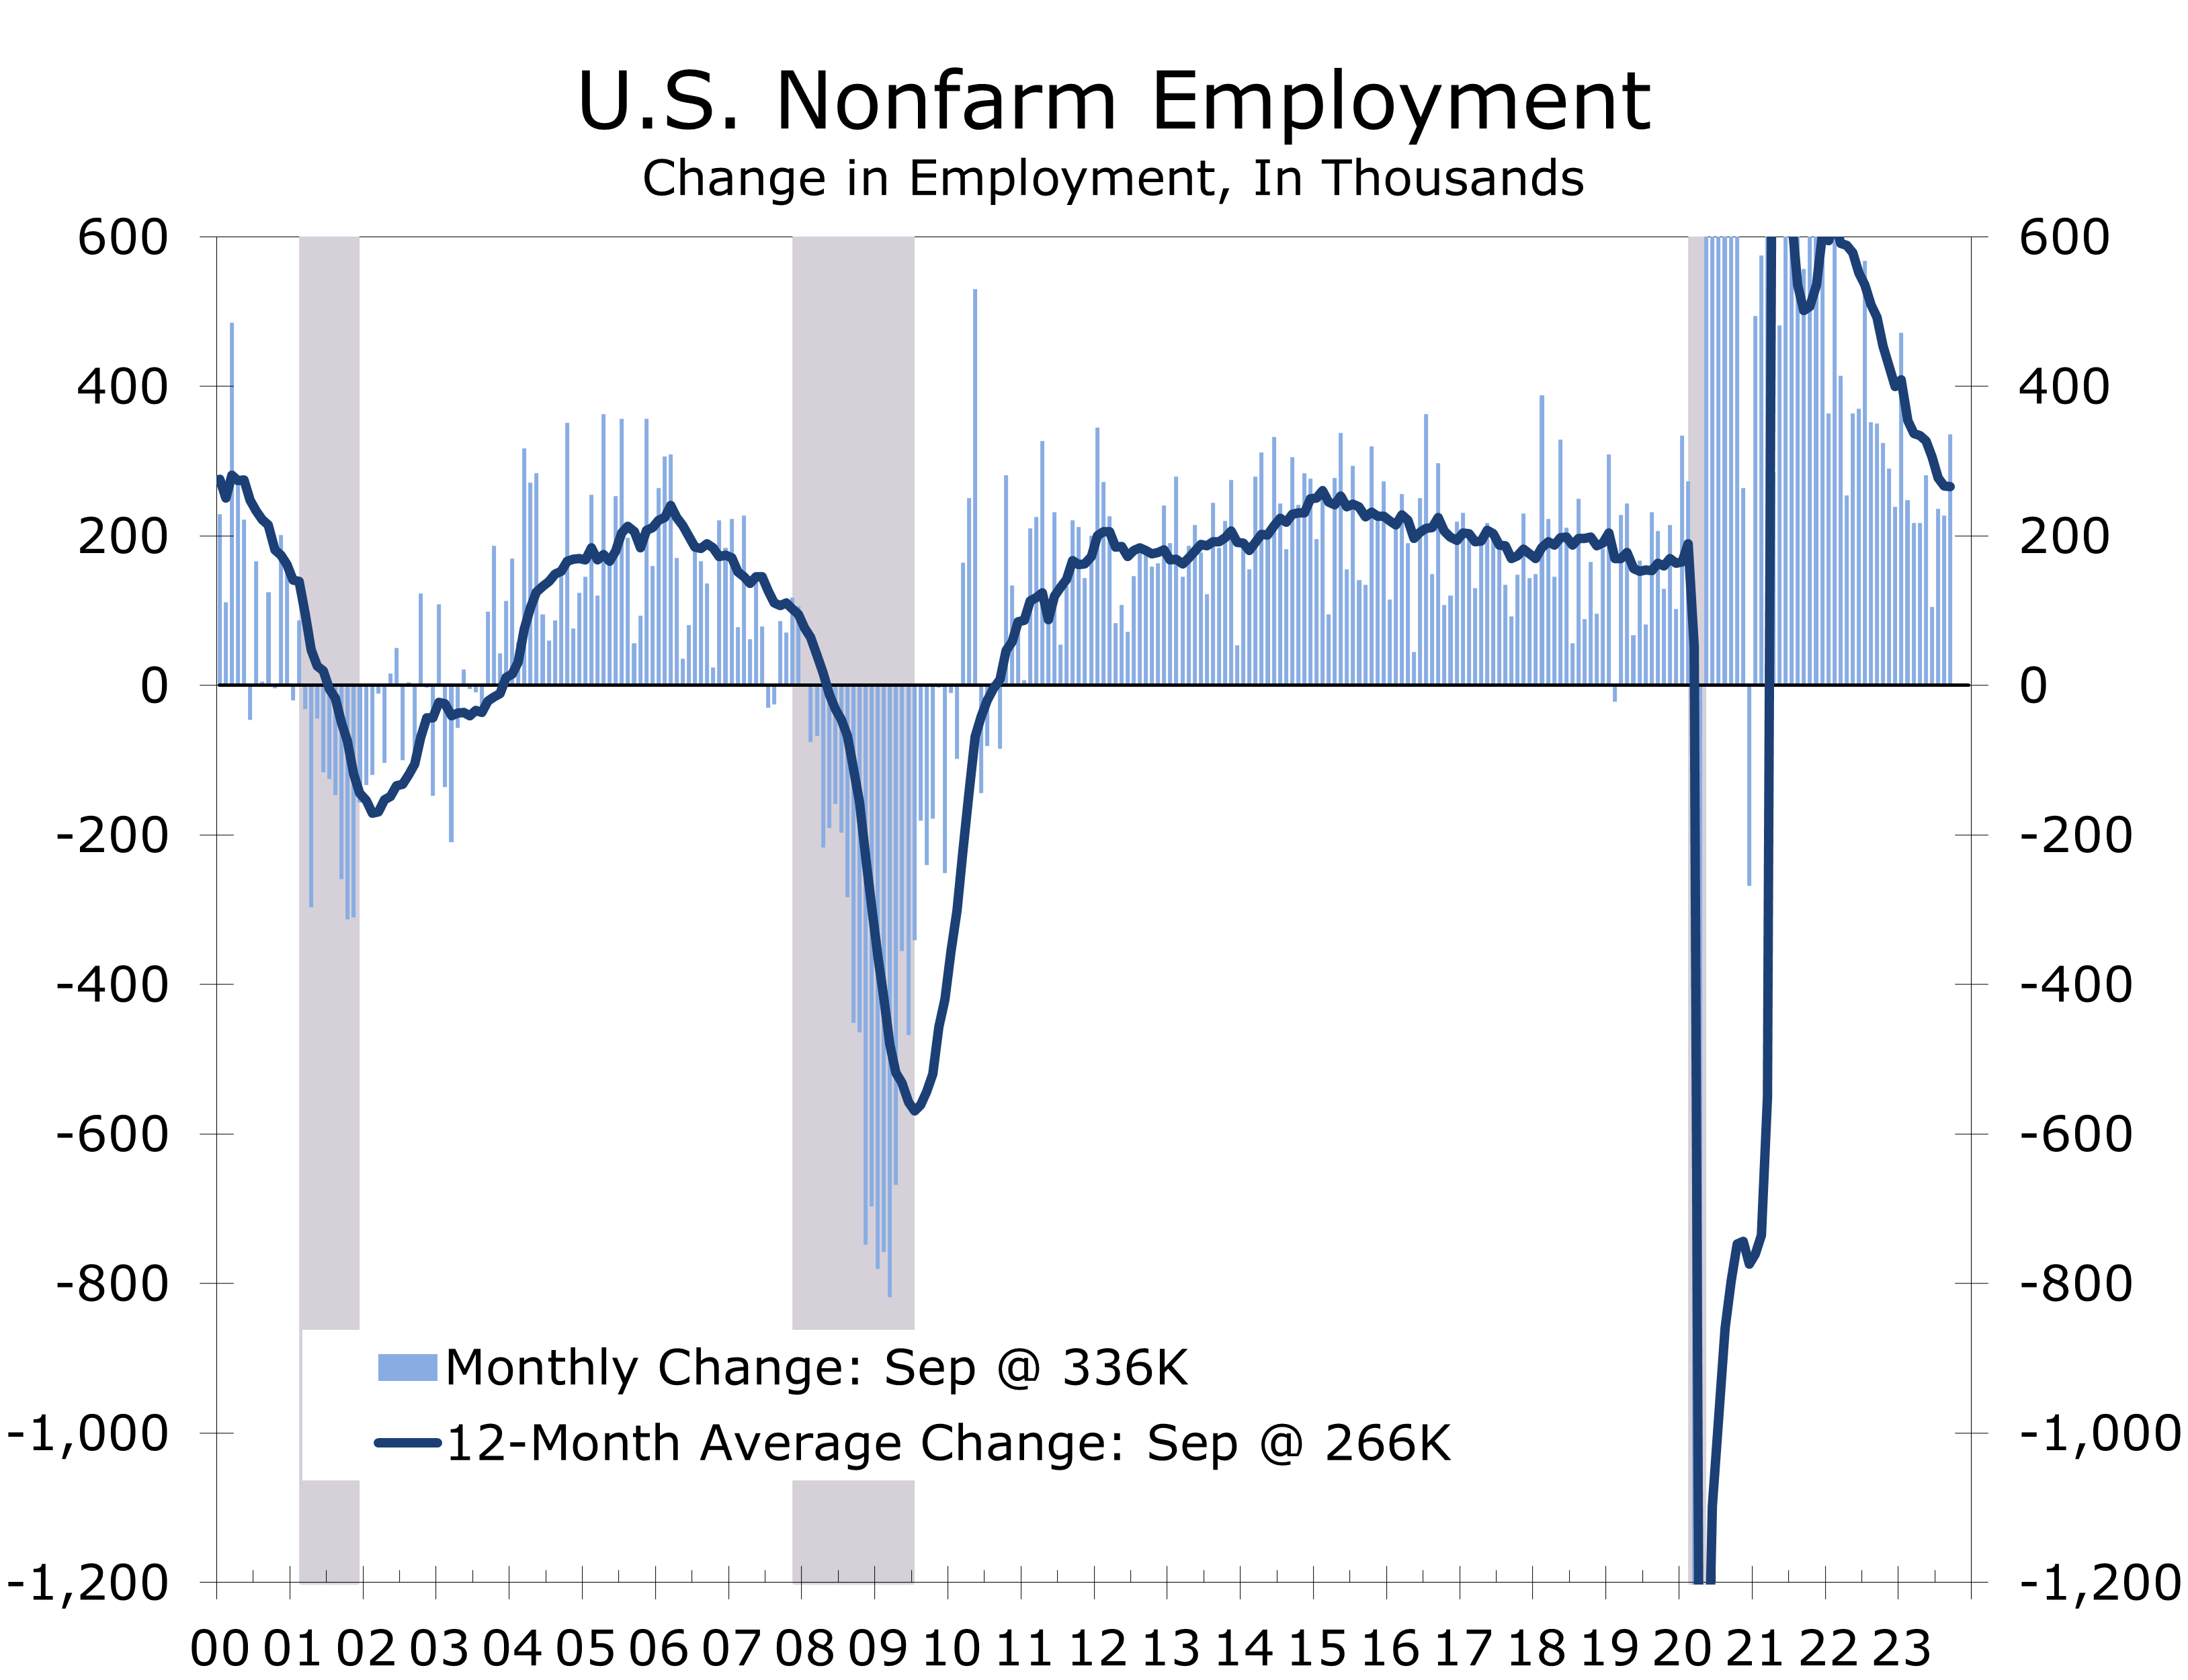
- The third quarter ended on a strong note, with nonfarm employers adding 336,000 jobs in September. Factory orders, output and consumer spending also remain remarkably resilient.
- Job growth continues to be fueled by industries striving to bring payrolls back up to their pre-pandemic trend, such as leisure and hospitality and health care. Job growth is likely to remain strong even as economic growth slows.
- Economic growth continues to be fueled by pandemic-era stimulus and initiatives enacted afterward to accelerate the shift to electric vehicles and lessen the nation’s dependence on imported high-end semiconductors and other critical goods.
- While stimulus has helped drive strong economic growth, the bills are coming due. The persistence of large budget deficits is pulling interest rates higher and rattling the stock market.
- The near-term impact of tightening financial conditions has been blunted by all the financing locked up by households and businesses when short-term interest rates were near zero.
- The winding down of pandemic income support programs and the resumption of student loan repayments will modestly restrain consumer spending at the lower end of income spectrum.
- The attacks on Israel raise the specter of a broader war in the Middle East, which will boost energy prices and increase market volatility. The further tightening in financial conditions is an additional headwind heading into what already looked like a period of slower economic growth.
The third quarter ended on a strong note, with employers adding 336,000 jobs in September and hiring during the prior two months revised higher by 119,000 jobs. Data on consumer spending, factory orders, and output all continue to show remarkable resiliency, given higher interest rates and tightening credit conditions. We have slightly raised our estimate for Q3 real GDP growth to 3.8% and the risks are weighted toward the upside. Our first look at third quarter GDP will come just ahead of the October 31-November 1 FOMC meeting.
At first blush, the unexpected surge in September job growth diminishes chances of a soft landing, or any landing, and increases the odds of another hike in the federal funds rate. Prior to the September jobs data, Fed officials had been arguing that labor market conditions were cooling off, fueling hopes of a soft landing.
The 119,000-job upward revision to the July and August employment data ended a string of downward revisions to the initially reported overall job figures for every month this year. The downward revisions helped feed the Fed’s narrative that the labor market was losing momentum. At first blush, September’s stronger jobs data came as an unpleasant surprise to the financial markets, particularly following reports of a sharp rise in job openings in the August JOLTS data and continued low readings for weekly first-time unemployment claims.

Upon closer inspection, September’s jobs report was not quite as strong as the headline rise suggests. While job gains were broad based, the bulk of job growth continues to come from industries still striving to bring their payrolls back to their pre-pandemic trend. Leisure and hospitality accounted for the largest block of jobs added in September, with hiring at restaurants and bars finally getting back to its February 2020 pre-pandemic level. Many restaurants remain chronically understaffed, however, and industry employment is about 450,000 jobs shy of where it would be today if it had continued to grow at its pre-pandemic pace.
Employment in health care and social services also lags considerably behind its pre-pandemic trend and continues to account for a disproportionate share of monthly job growth. Many of these are doctors’ offices and outpatient care facilities. Nursing homes, home health care agencies and hospitals are also adding staff.
Hospitality and health care employment tends to lean heavily toward women, and the recent strength in hiring in these two sectors helps explain the recent strength in female labor force participation. Many of the jobs being created at restaurants and health care are relatively low paid, however, which is one reason why average hourly earnings have moderated in recent months. The heavier mix of lower paid jobs means stronger overall jobs gains will provide less of a boost to income and spending.
State and local government is another sector where employment is still playing catch up. All the upward revision to the July and August payroll figures was due to more jobs being created than first reported by state and local governments, many of which were in education. We suspect the wide swings in education payrolls during the normally light summer months are due to pandemic-related distortions to seasonal adjustment. Some of the growth, however, reflects the rehiring of administrative positions and support staff, both of which remain historically understaffed. Private-sector payroll growth was revised modestly lower in July and August and has been revised lower every month this year.
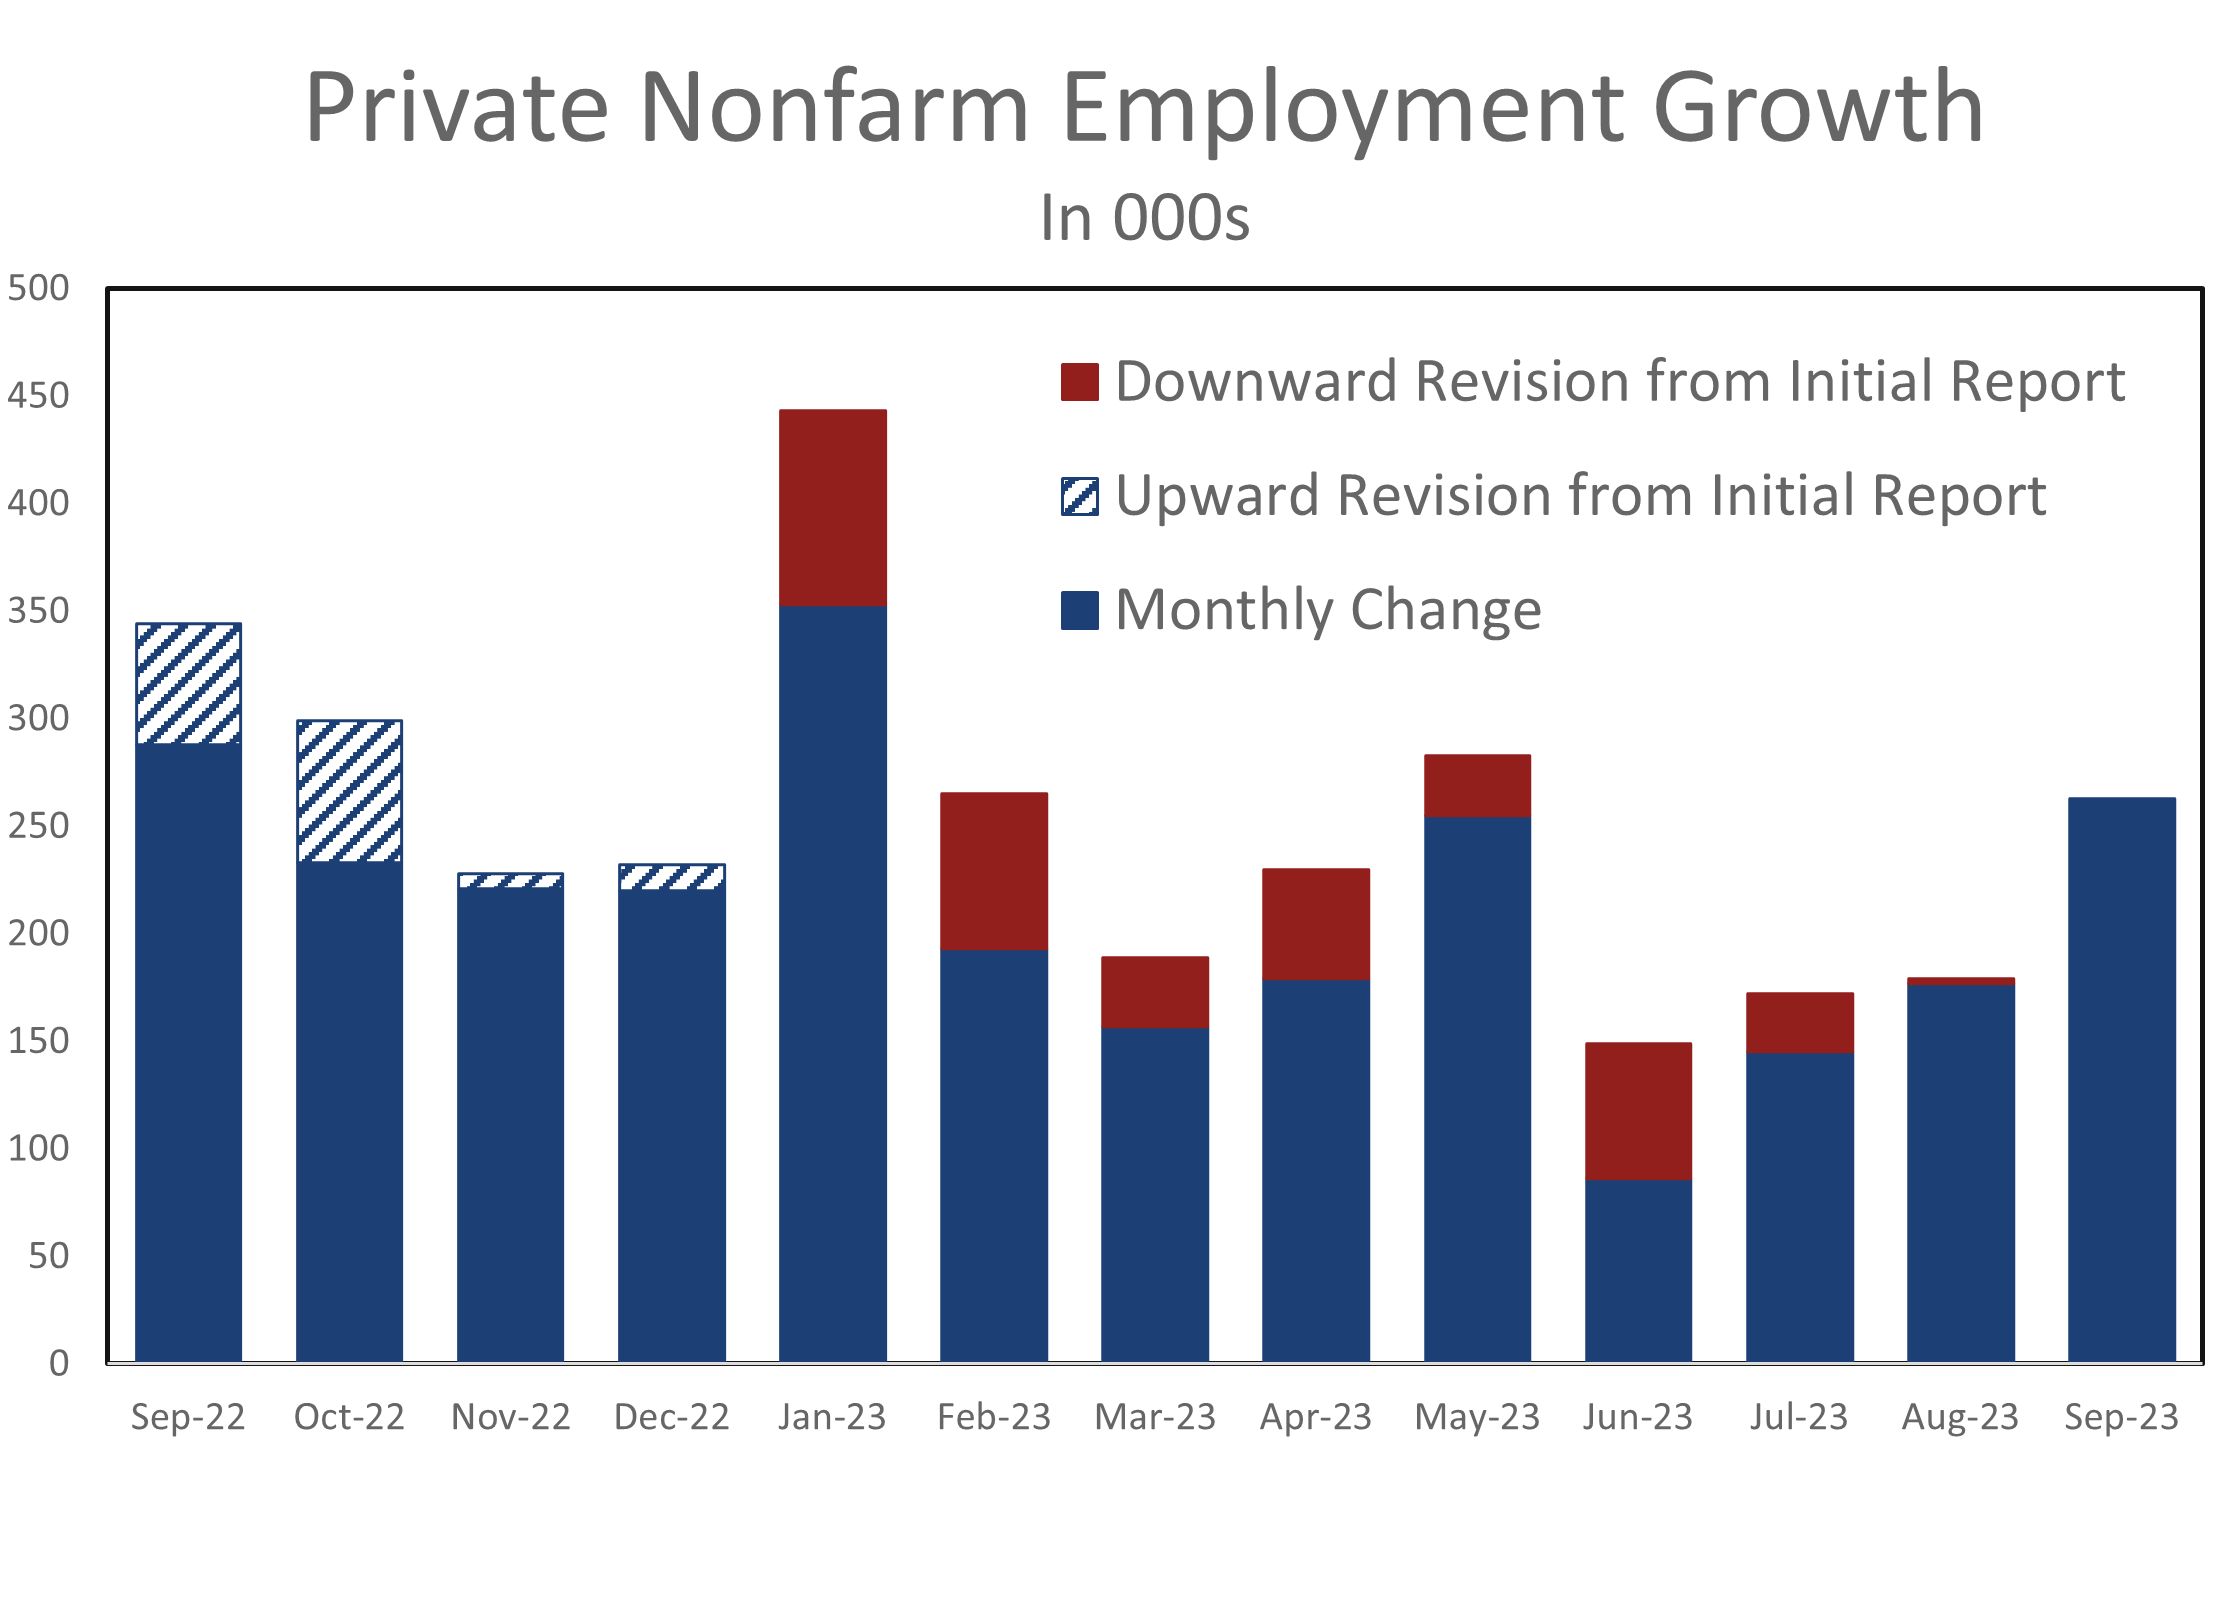
There are likely more downward revisions to come. The Bureau of Labor Statistics released the Quarterly Census of Employment and Wages data in August that is the source data for the annual benchmark revisions reported early each year with the January jobs data. We estimate job growth from April 2022 to March 2023 will be revised down by about 310,000 jobs. By contrast, job growth was revised up by more than 500,000 jobs when the annual revisions were released in February.
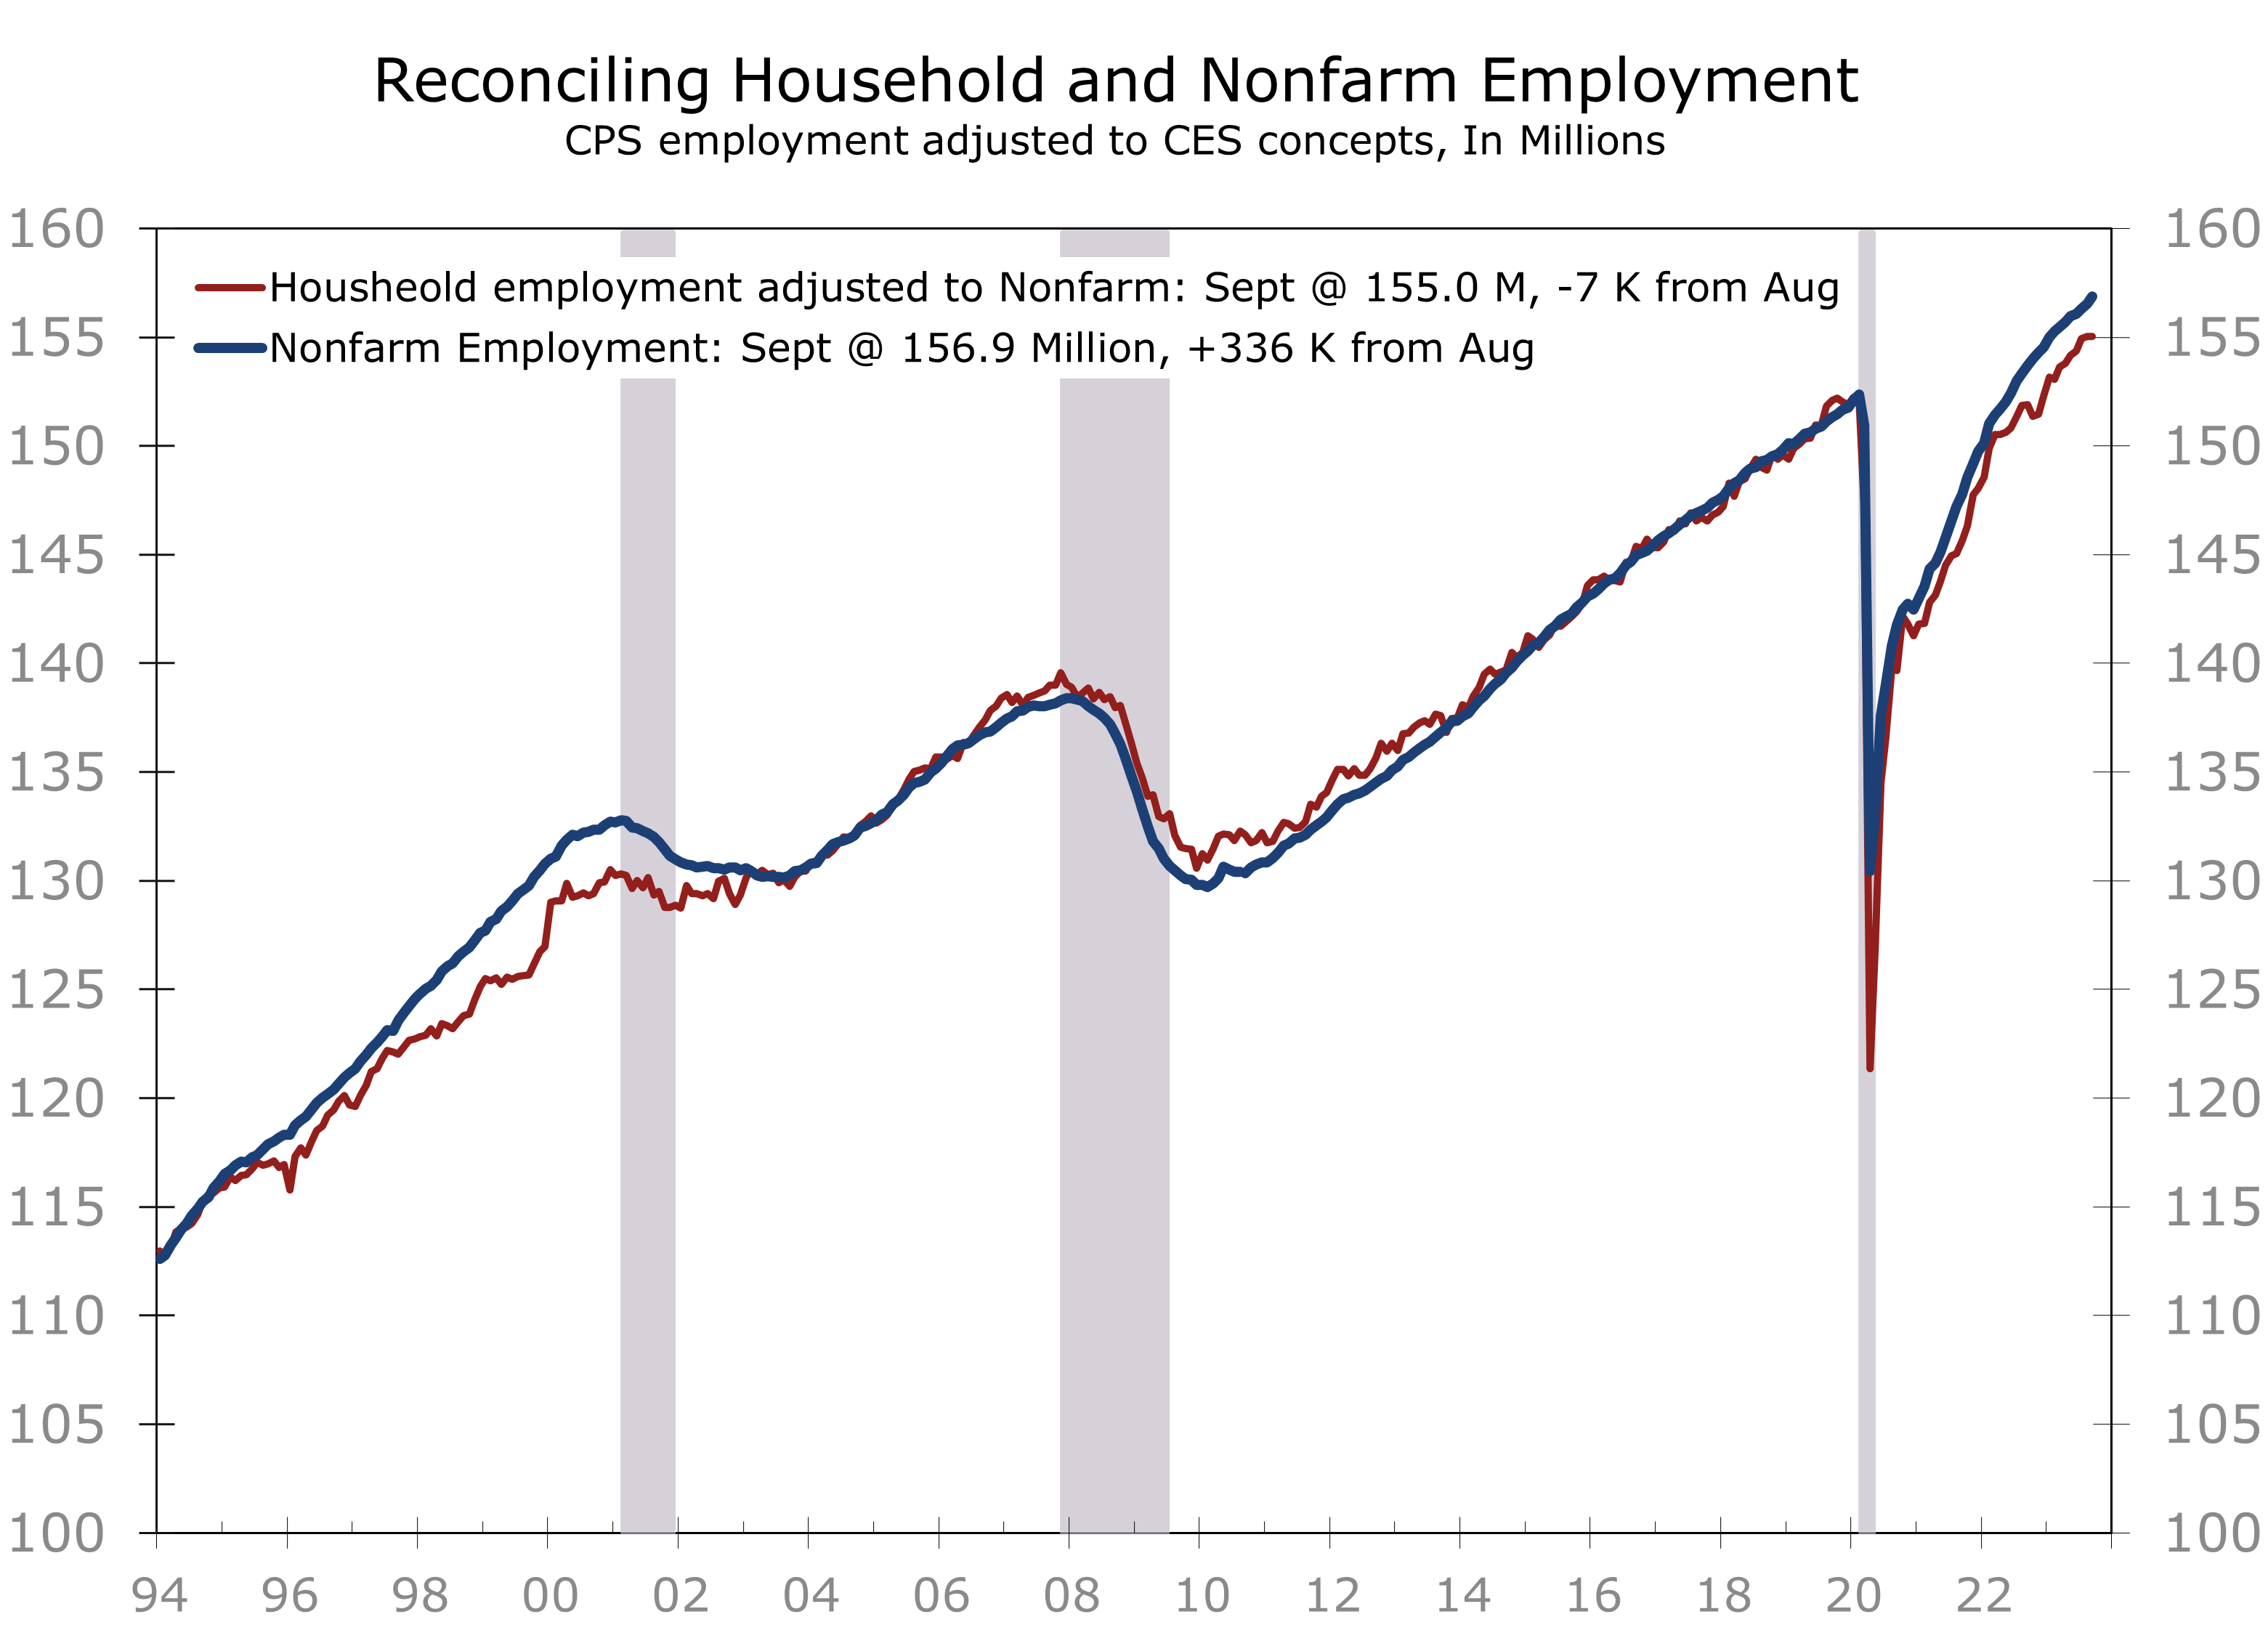
While the impeding revisions data only cover the period up to March 2023, we suspect job growth has slowed further since then. The weaker trend is consistent with both the string of recent downward revisions to the preliminary employment data as well as data from the Labor Department’s Household Survey, which is used to compute the unemployment rate. The BLS publishes a series that reconciles the differences between nonfarm employment, which comes from a survey of employers, and the household survey, which comes from a smaller and sometimes more volatile survey of households.
The adjusted household employment data show hiring has been more modest than has been reported by the nonfarm employment series. Moreover, adjusted household employment declined slightly in September. Once the nonfarm data are fully revised, the two series have generally tracked one another very closely. The bottom line is job growth has likely not been as strong as has been reported and is still losing momentum, despite the strong headline-grabbing September job gain reported in early October.
Even after thoroughly dissecting the jobs data, there is no denying the economy grew strongly during the third quarter. Our point estimate calls for real GDP to rise at a 3.8% annual rate during the third quarter, which would mark the strongest gain in more than a year. The risk is clearly to the upside. The Atlanta Fed GDPNow has Q3 real GDP rising at a 4.9% pace. Consumer spending clearly grew solidly, rising at a 3.8% pace or better. Business fixed investment also grew solidly, and the nation’s trade deficit improved as imports slowed. Government spending also likely grew more rapidly, given the large upward revision to government payrolls.
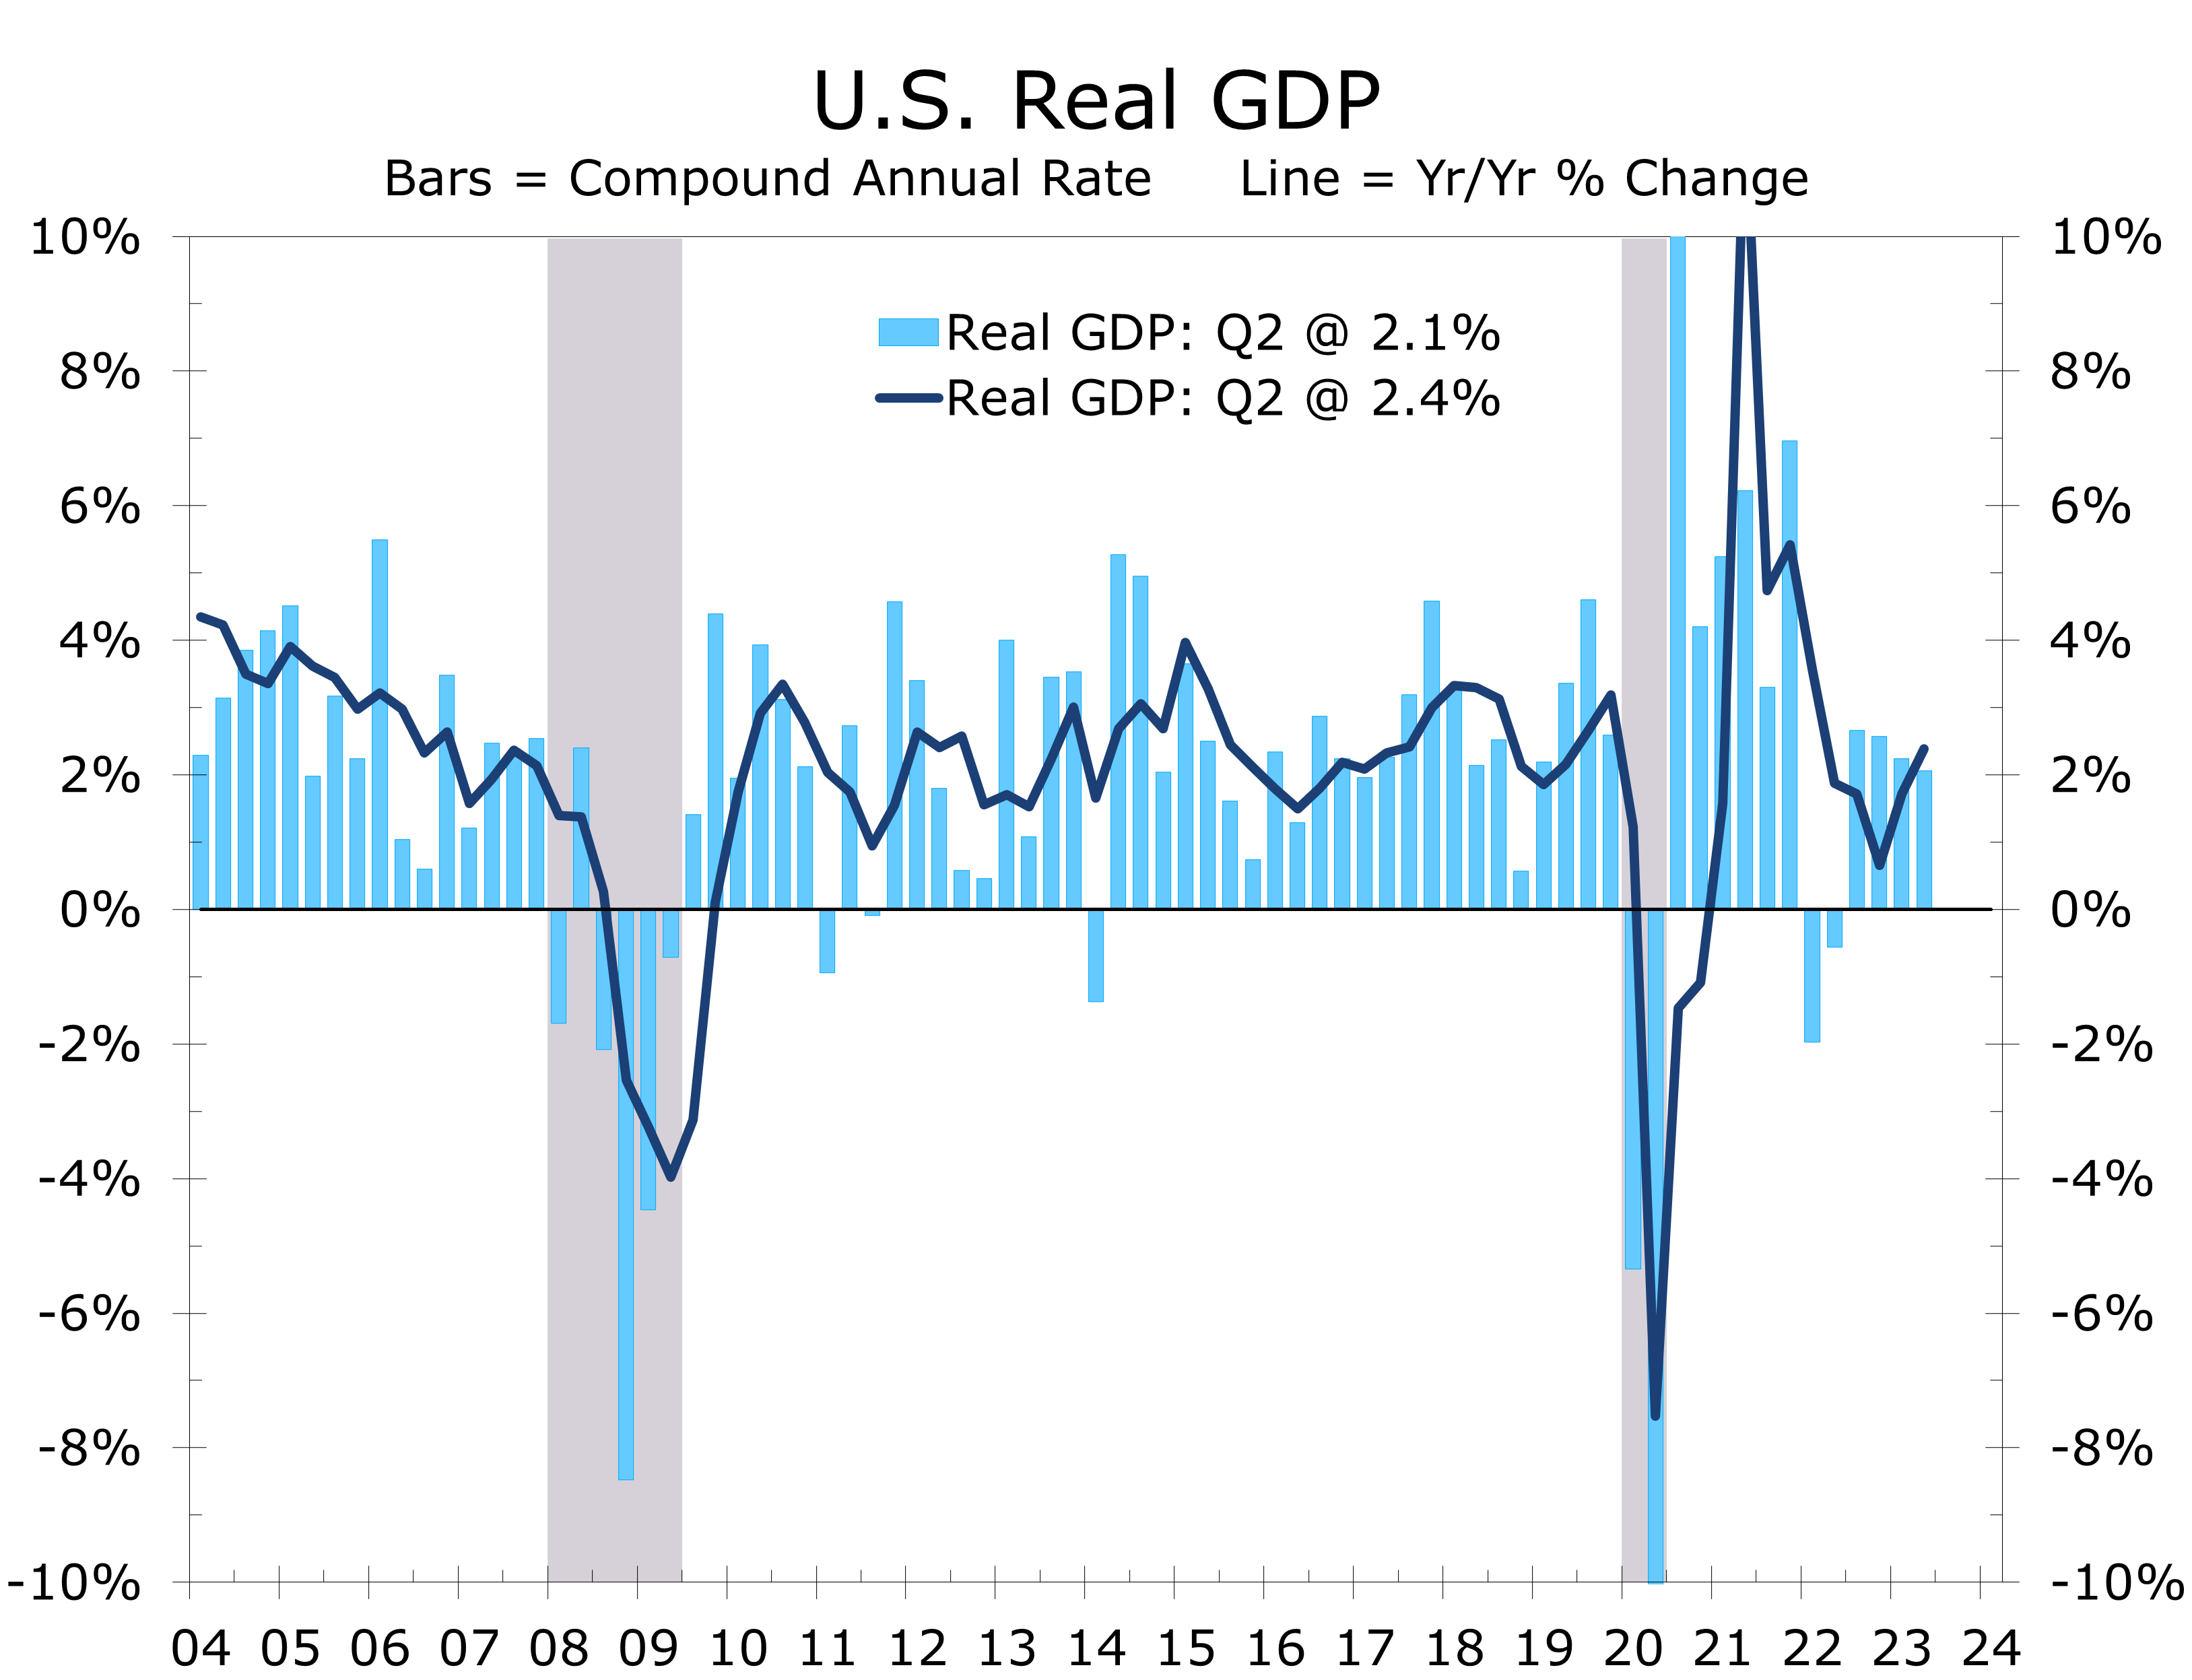
While third quarter real GDP growth is widely expected to have been remarkably strong, most of the strength appears to have been at the start of the quarter. Expectations for current quarter economic growth are much more modest, with the consensus estimate for Q4 real GDP growth centered at a 1% annual rate.
Economic headwinds were widely expected to intensify in the fourth quarter of this year, even before the shocking attacks on Israel. One long running issue is how consumers will react to the restart of student loan repayments, which is likely to impact as much of 10% of all consumers. Higher interest rates are also likely to produce more of a direct drag on growth, as fewer consumers qualify for mortgages and car loans and more businesses have trouble securing financing or rolling over debt.
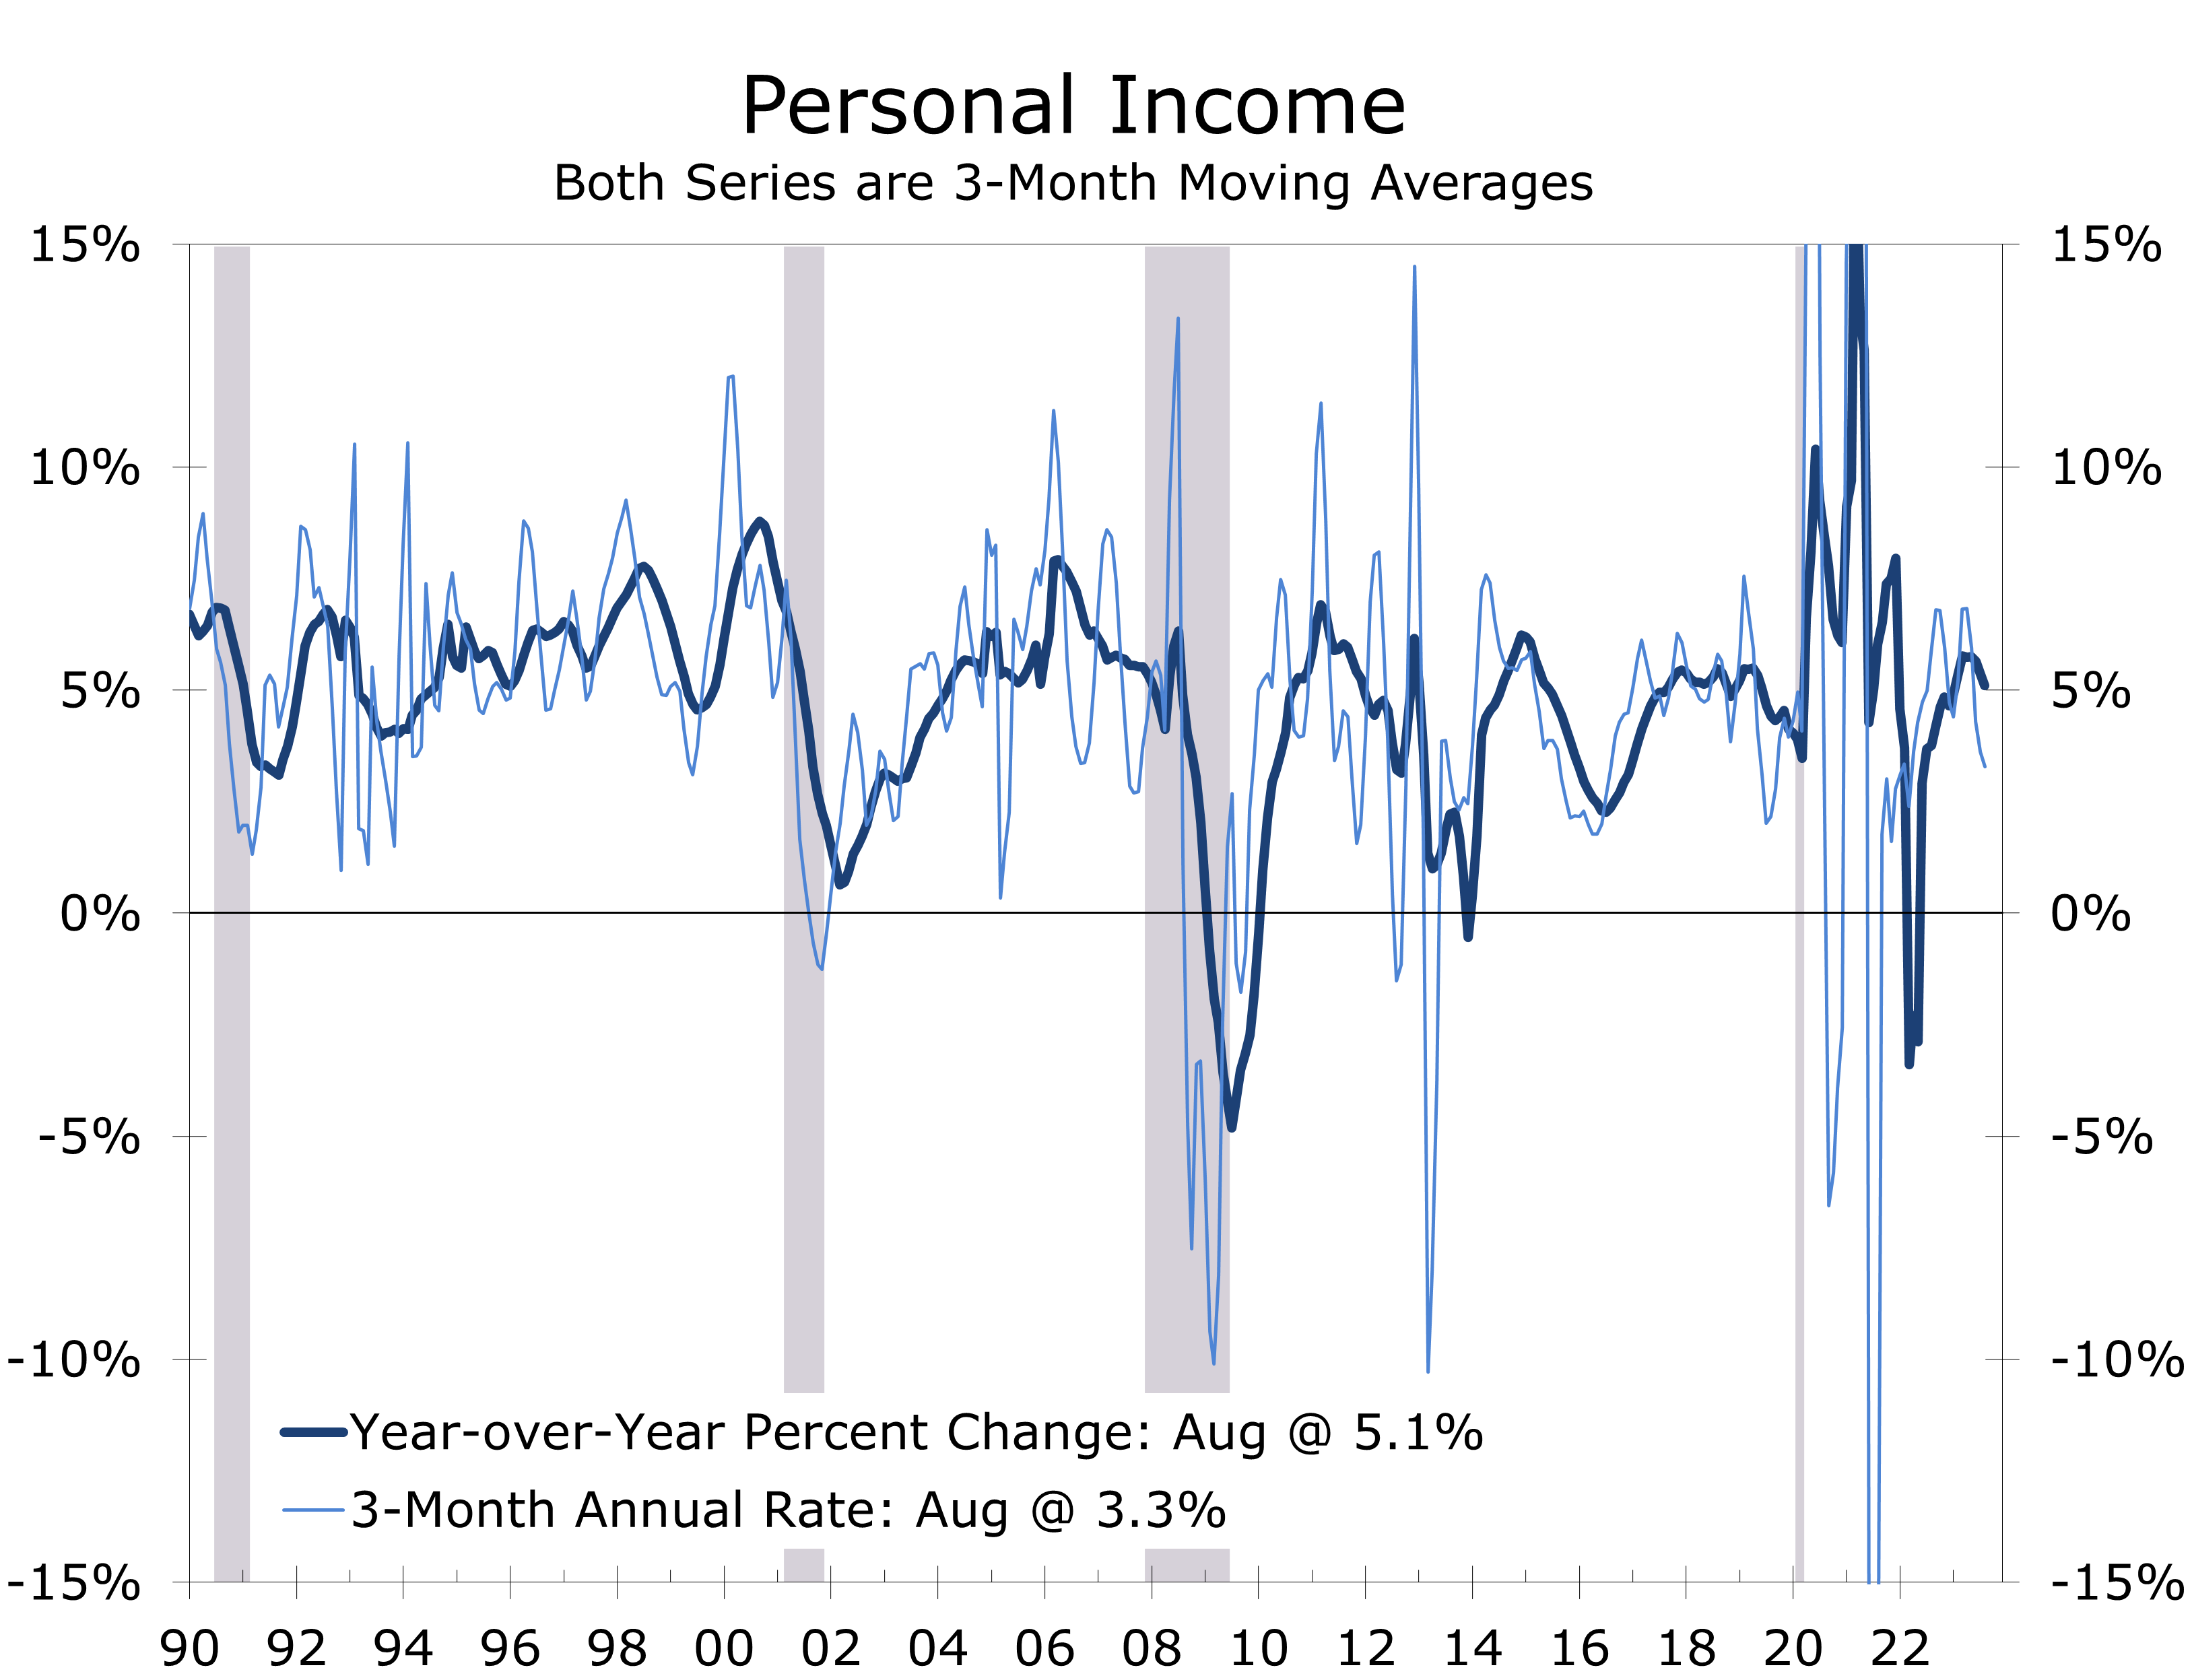
One thing we have learned in following the economy over recent decades is to never underestimate the US consumer. Consumers should have the wherewithal to weather economic headwinds. Personal income grew strongly during the third quarter and revisions to the previously reported data show consumers, overall, still have considerable pandemic-era savings remaining.
While we are optimistic about consumer spending, we have a few concerns. For starters, most of the remaining pandemic-era savings are at upper-income households, who tend to spend a smaller proportion of their incomes. Savings for families earning the median income or less, which is half the households in the country, have largely depleted any savings built up during the pandemic and are now facing the winding down of pandemic-era income support programs. These families are also being impacted more significantly by higher food and energy prices, which has led to increased credit use. Credit conditions are now tightening, as delinquency rates for auto loans and credit cards have risen back above their pre-pandemic levels for younger households and sub-prime borrowers.
Somewhat surprisingly, the resumption of student loans is not at the top of our list of concerns. We expect repayments to surge initially, as higher income borrowers repay their loans to avoid accumulated interest charges. For the bulk of borrowers, however, repayments will be more closely tied to annual incomes and be more manageable. The income diverted to student loan repayments will come from savings and some pull back in discretionary purchases, such as restaurant dining, concerts, sporting events and travel.
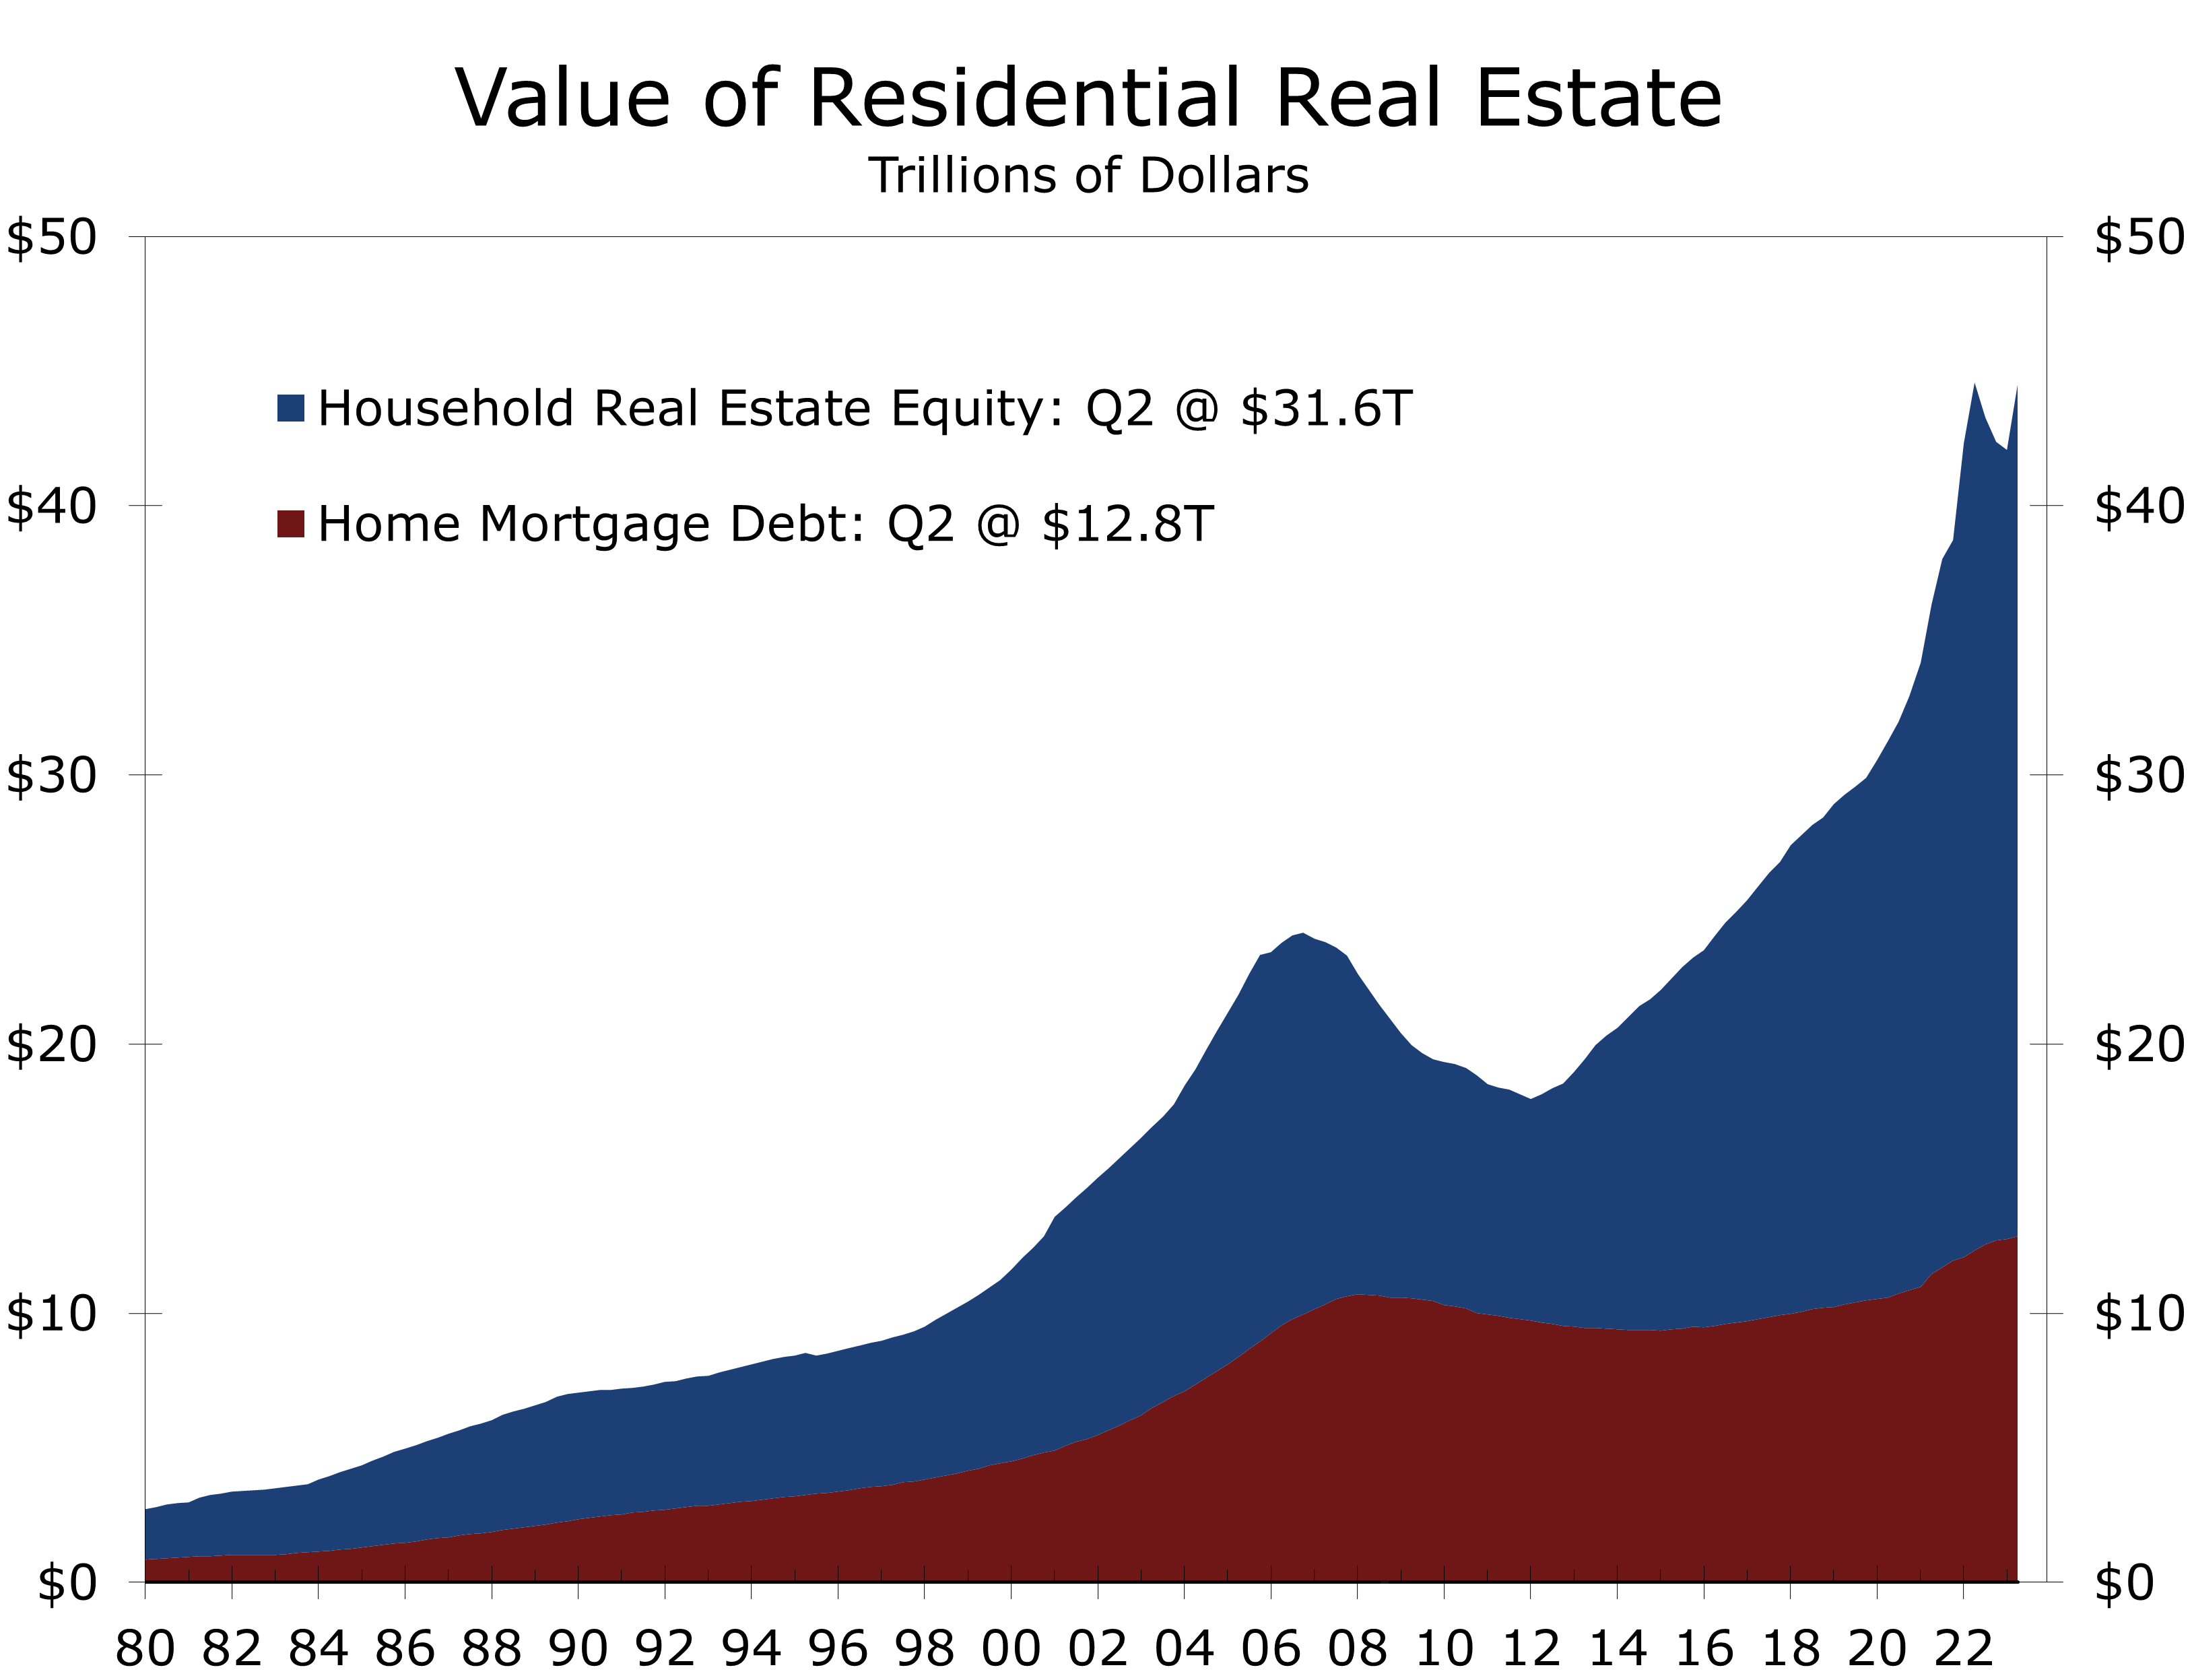
Higher interest rates are less of an immediate threat than they have been in the past. To be certain, higher interest rates will further restrain home sales. Mortgage rates surged to nearly 8% this past month, triggering a spike in contract cancelations for new and existing homes, as many would-be buyers no longer qualify for a mortgage or simply cannot make the numbers work. For homeowners that already own a home, however, rising mortgage rates are less of an immediate concern. Just over 42% of homeowners own their home outright and have no mortgage, while more than 80% of homeowners with a mortgage have a mortgage rate that is fixed below 5%. Another 60% of homeowners with a mortgage have a mortgage rate fixed below 4% or and more than 22% have a mortgage rate below 3%.
The preponderance of low-rate mortgages is one of the reasons households accumulated so much home equity during the decade leading up to the pandemic. Households have built up a near-record $31.6 trillion in equity through the second quarter of this year, the second highest total ever. Much of that equity was built up prior to pandemic and the more recent surge in home prices. The Global Financial Crisis led to a slew of mortgage refinancing at between 3% and 4%, many of which were 15-year fixed rate loans refinanced under the HARP program in 2010 and 2011. Many of those loans are now approaching maturity, which will add significantly to the share of homeowners that own their homes outright.
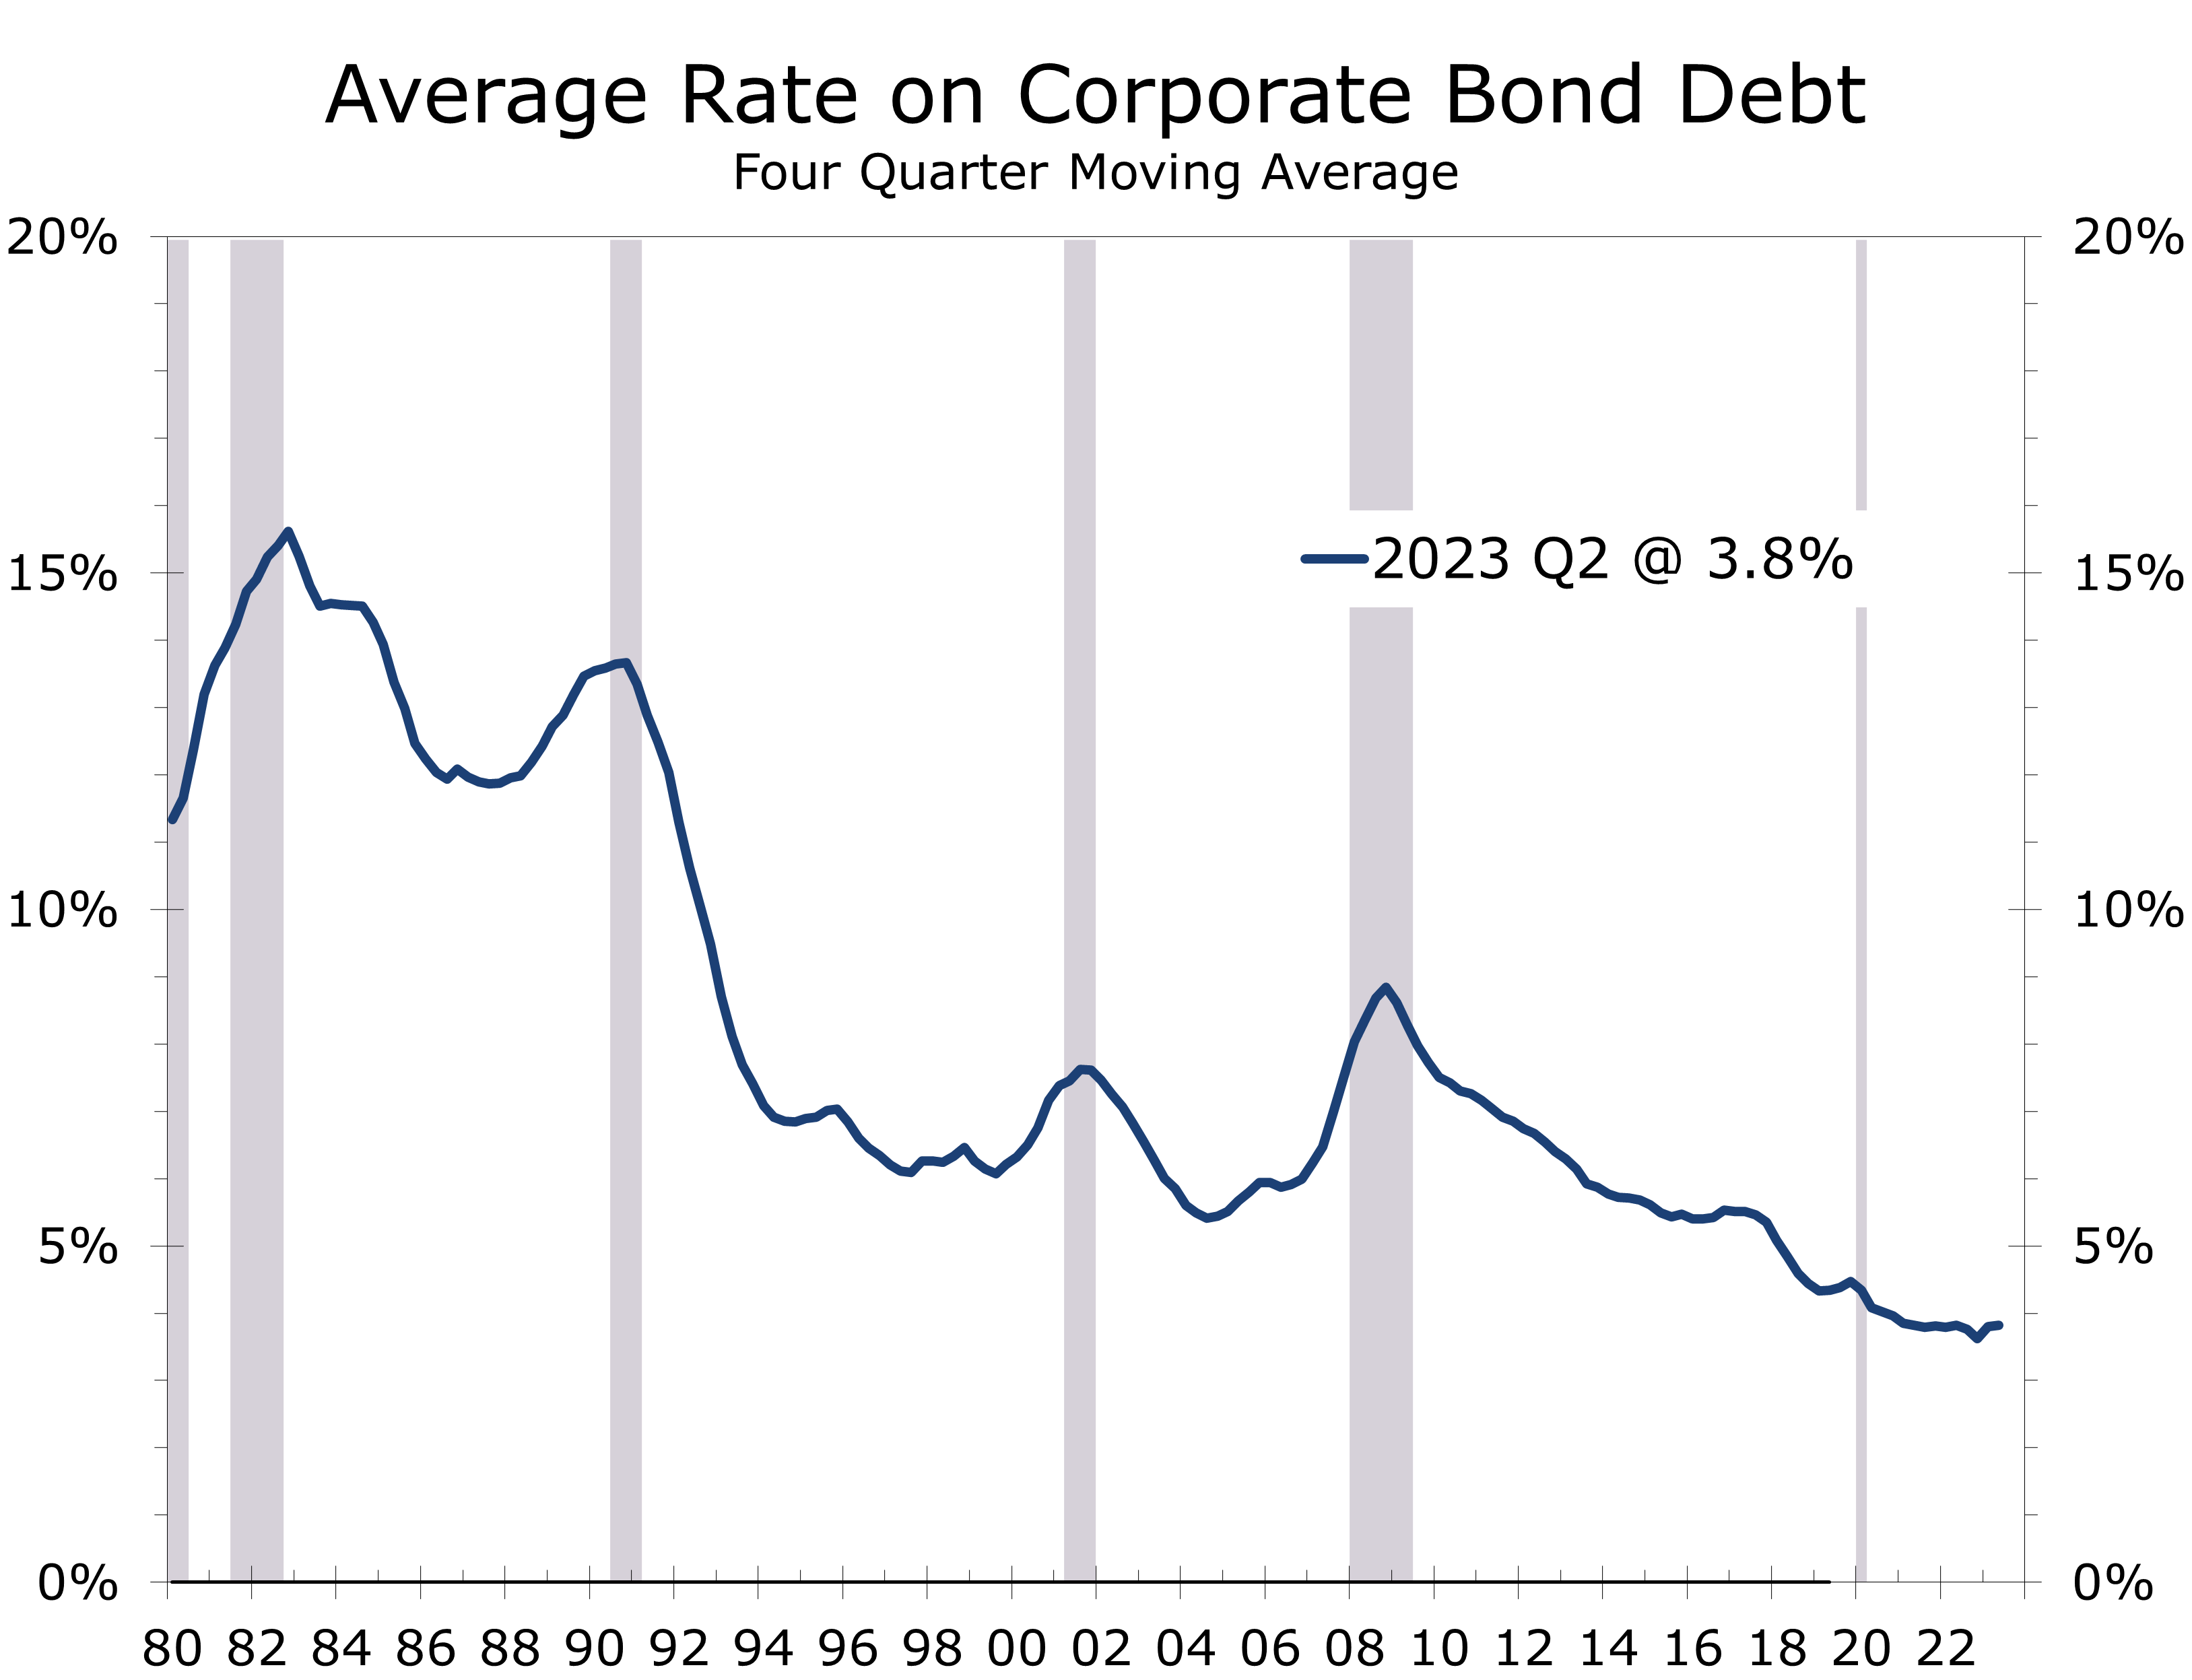
Many businesses are also insulated from higher interest rates, at least in the short term. Many firms were able to lock in financing when short-term interest rates were near zero and the Fed was providing extra liquidity to the bond market during the height of the pandemic. While debt maturities will begin to ramp up next year, much of this debt carries low rates and will not mature until 2025 or later. The average rate on corporate bond debt is currently around 4%.
Given the economy’s surprising resilience this summer, the Fed might be inclined to raise interest rates a bit more. Heightened geopolitical uncertainty in the wake of the horrific attacks on Israel, however, will likely keep them on the sidelines, even if the economic data come in stronger ahead of the November FOMC meeting. We are concerned the inflation numbers might come in hotter than expected due to the recent rise in food and energy prices, as well as some catch-up in core services prices, which were suppressed by seasonal adjustment this past summer. Third quarter GDP growth could also easily top already lofty expectations. If September personal consumption also comes in strong, expectations for fourth quarter economic growth would increase, which might force the Fed’s hand in November.
We doubt the Fed will hike interest rates any more this year unless a rate hike is already priced into the bond market. Yields have come down in the wake of comments from Fed officials discussing the uncertainty about whether the lags between interest rate increases and their impact on the economy have lengthened, or possibly even weakened, due to the preponderance of fixed-rate debt locked in by households and businesses when interest rates were near zero. That low fixed rate debt is what contributed to losses in the banking sector earlier this year and even at the Federal Reserve, which were a big part of the initial drag on Gross Domestic Income. Higher interest rates are transferring wealth from lenders, who are holding fixed-rate mortgages and mortgage-backed securities, to borrowers that locked in ultra-low rates. This transfer of wealth appears to be insulating a substantial share of households and businesses from higher interest rates.
We see economic growth slowing over the next three quarters and envision a scenario somewhere between a soft landing and mild recession. Higher interest rates are having an impact on the most interest rate sensitive parts of the economy. Sales of new and existing homes are expected to decline modestly over the next 6 to 9 months, as the combination of higher prices and higher interest rates further reduces affordability. New apartment starts are expected to fall sharply, however, accounting for most of the drop in overall housing starts and apartment starts are likely to remain restrained through 2025 due to rising vacancy rates.
Consumer spending will slow but continue to increase on an overall basis. Slower job growth and tightening conditions will reduce big-ticket purchases, with light vehicle sales declining by about 1 million units. We see job growth remaining modestly positive, which is why we are reluctant to label the back-to-back declines in real GDP expected at the start of 2024 as a recession. Even construction employment should hold up reasonably well, due to the unusually large number of homes currently under construction.
Higher interest rates are also making it more difficult for startups and companies that have a long or uncertain path to profitability to raise capital, slowing business fixed investment. Overall nonfarm payroll growth is expected to decelerate to just under 100,000 jobs a month, which will nudge the unemployment rate up to 4.3%. This resiliency will make it harder to bring inflation back down to the Fed’s 2% target. Wages are rising at around a 4.5% pace, which translates into 3% inflation if productivity growth gets back to 1.5%. As a result, the Fed will be slow to cut interest rates even as economic activity slows.
Disclaimer: This publication has been prepared for informational purposes only and is not intended as a recommendation offer or solicitation with respect to the purchase or sale of any security or other financial product nor does it constitute investment advice.
Job Growth Remains Exceptionally Strong
Hiring Surged in September
- Employers added 336,000 jobs in September, roughly twice the consensus estimate.
- The unemployment rate was unchanged at 3.8%, as the labor force and employed persons rose by roughly the same amount.
- Payroll gains were broadly based and were not affected by the UAW strike.
- September payroll data are often impacted by crosscurrents including the winding down of summertime jobs and teachers and professors returning to the classroom.
- Leisure and hospitality added 96,000 jobs this past month and government added 73,000 jobs, with more than half in education.
- Health care and social assistance added 65,900 jobs, and manufacturing (+17k), construction (+11k) and mining (+1k) all posted modest gains.
- Revisions lifted job growth in the two prior months by a combined 119,000 jobs, which adds an exclamation point to September’s strong jobs report. Underlying data in the jobs report suggest industrial production rose modestly in September and point to continued strong income growth. The data are consistent with our 3.6% Q3 GDP forecast.
September’s outsized nonfarm payroll growth initially set off fears the Fed had more work to do. On closer inspection, however, the job report is not as unsettling as the headline 336,000-job gain suggests. Most of the increase, as well as the upward revision to prior data, was in industries still striving to bring payrolls back to their pre-pandemic trend.
Leisure and hospitality continues to account for a disproportionate share of job gains, with restaurants and bars adding 61,000 jobs in September. With the increase, restaurant and bar payrolls are now back at their pre-pandemic level. Restaurants are still understaffed, however, with industry payrolls roughly 450,000 jobs below their pre-pandemic trend. Hotels added back 16,000 jobs in September, but payrolls remain 217,000 jobs, or 10.3%, below their pre-pandemic level.
Job growth continues to be driven by industries striving to regain their pre-pandemic trend.
Health care added 40,900 jobs in September, which is well under the average gain of 53,000 jobs added over the past year. Despite adding 625,800 jobs over the past year, health care remains chronically understaffed. While overall employment in health services is now 525,000 jobs above its pre-pandemic level, we estimate health care providers are still understaffed by at least 400,000 workers based on the pre-pandemic hiring pace.
Social services and state and local government are two other areas struggling to bring payrolls back to their pre-pandemic trend. Taken together, leisure and hospitality, health care and social services, and state and local governments accounted for more than two-thirds of September’s job growth. Moreover, most of the revision to the July and August data came from large upward revisions to state and local government payrolls. Private sector employment growth was revised slightly lower, and now shows gains of just 145,000 jobs in July and 177,000 jobs in August.
Large upward revisions to state and local government boosted July and August payrolls.
Private payroll growth picked up in September, with businesses adding 263,000 jobs. Hiring was broad based, with the diffusion index rising 2 points to an eight-month high 64.8 in September. As noted earlier, most of the job gain was in industries that remain chronically understaffed. But hiring rose modestly in most industries, including professional and business services (+21K), retail trade (+20K), manufacturing (+17K), construction (+11K) and mining (+1k).
Somewhat lost in the shock of September’s huge nonfarm payroll gain, the household survey was surprisingly weak. The unemployment rate was unchanged at 3.8%, as the labor force rose 90,000 and household employment rose by just 86,000.

The data look even weaker after adjusting household employment to the nonfarm payroll methodology. On this basis, household employment fell 7,000 in September. This employment measure has historically done a good job of picking up inflection points in the nonfarm employment data well before they become evident in the monthly data. The recent trend in adjusted household employment is well payrolls and is consistent with BLS data released in August that point to a sizeable downward revision to nonfarm employment when the annual revisions are reported early next year.
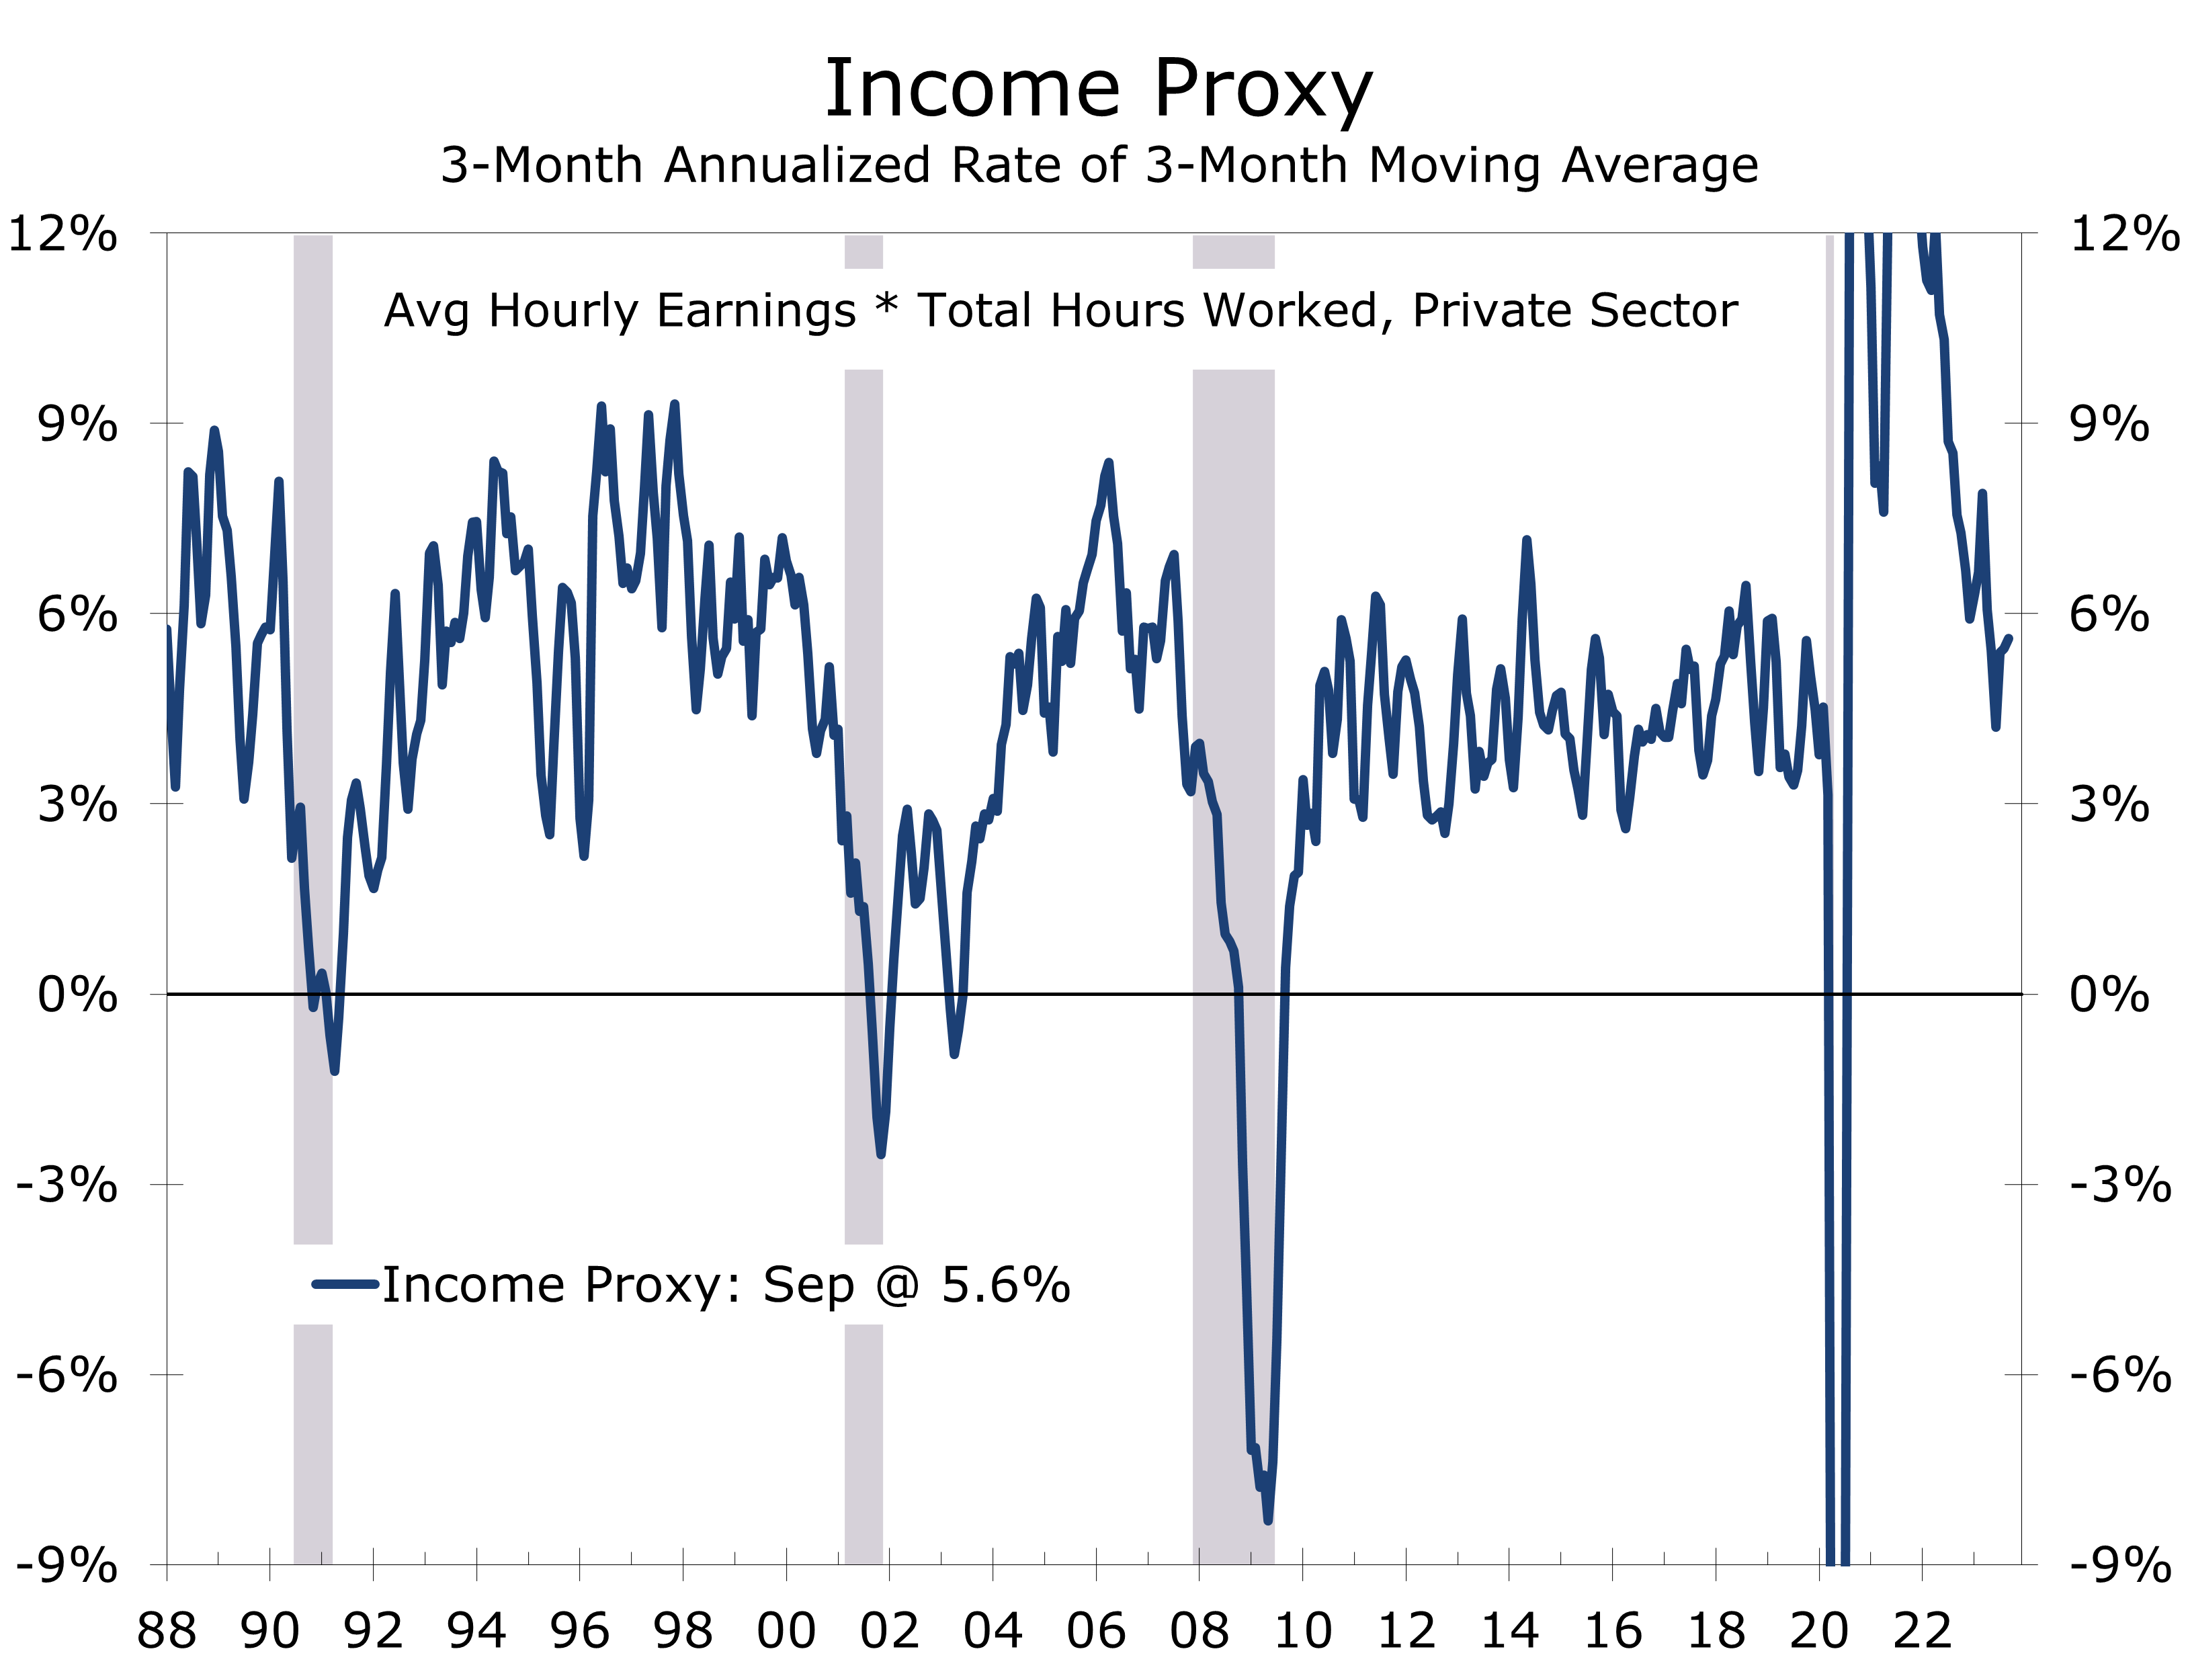
Strong job growth is bolstering incomes, which is why consumer spending is holding up so well.
While we see some potential soft spots, the economy has considerable momentum. Real GDP growth should rise at a 3.6% pace in Q3, driven by strong gains in consumer spending. Our income proxy grew at a 5.6% pace in Q3 and should rise solidly this quarter as well.
September’s stronger payroll growth should not alter the Fed’s stance on interest rates. The September CPI data will be more important and fear we may see some reacceleration in core services prices, excluding housing. While that may make the November rate decision a tough call, we expect the Fed to stand pat.
Disclaimer: This publication has been prepared for informational purposes only and is not intended as a recommendation offer or solicitation with respect to the purchase or sale of any security or other financial product nor does it constitute investment advice.