Economic Growth Once Again Tops Expectations
Economic Growth Once Again Tops Expectations
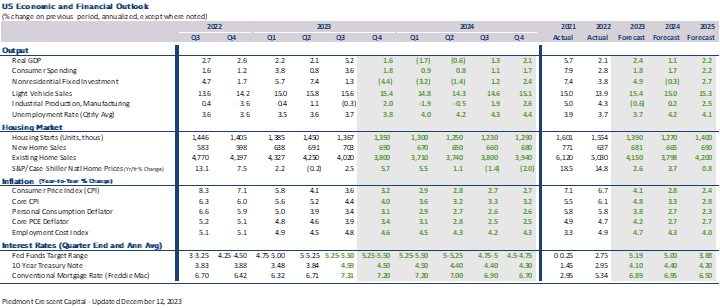
- Real GDP grew at a 3.3% annual rate in the fourth quarter, easily topping expectations that were centered around a 2% pace.
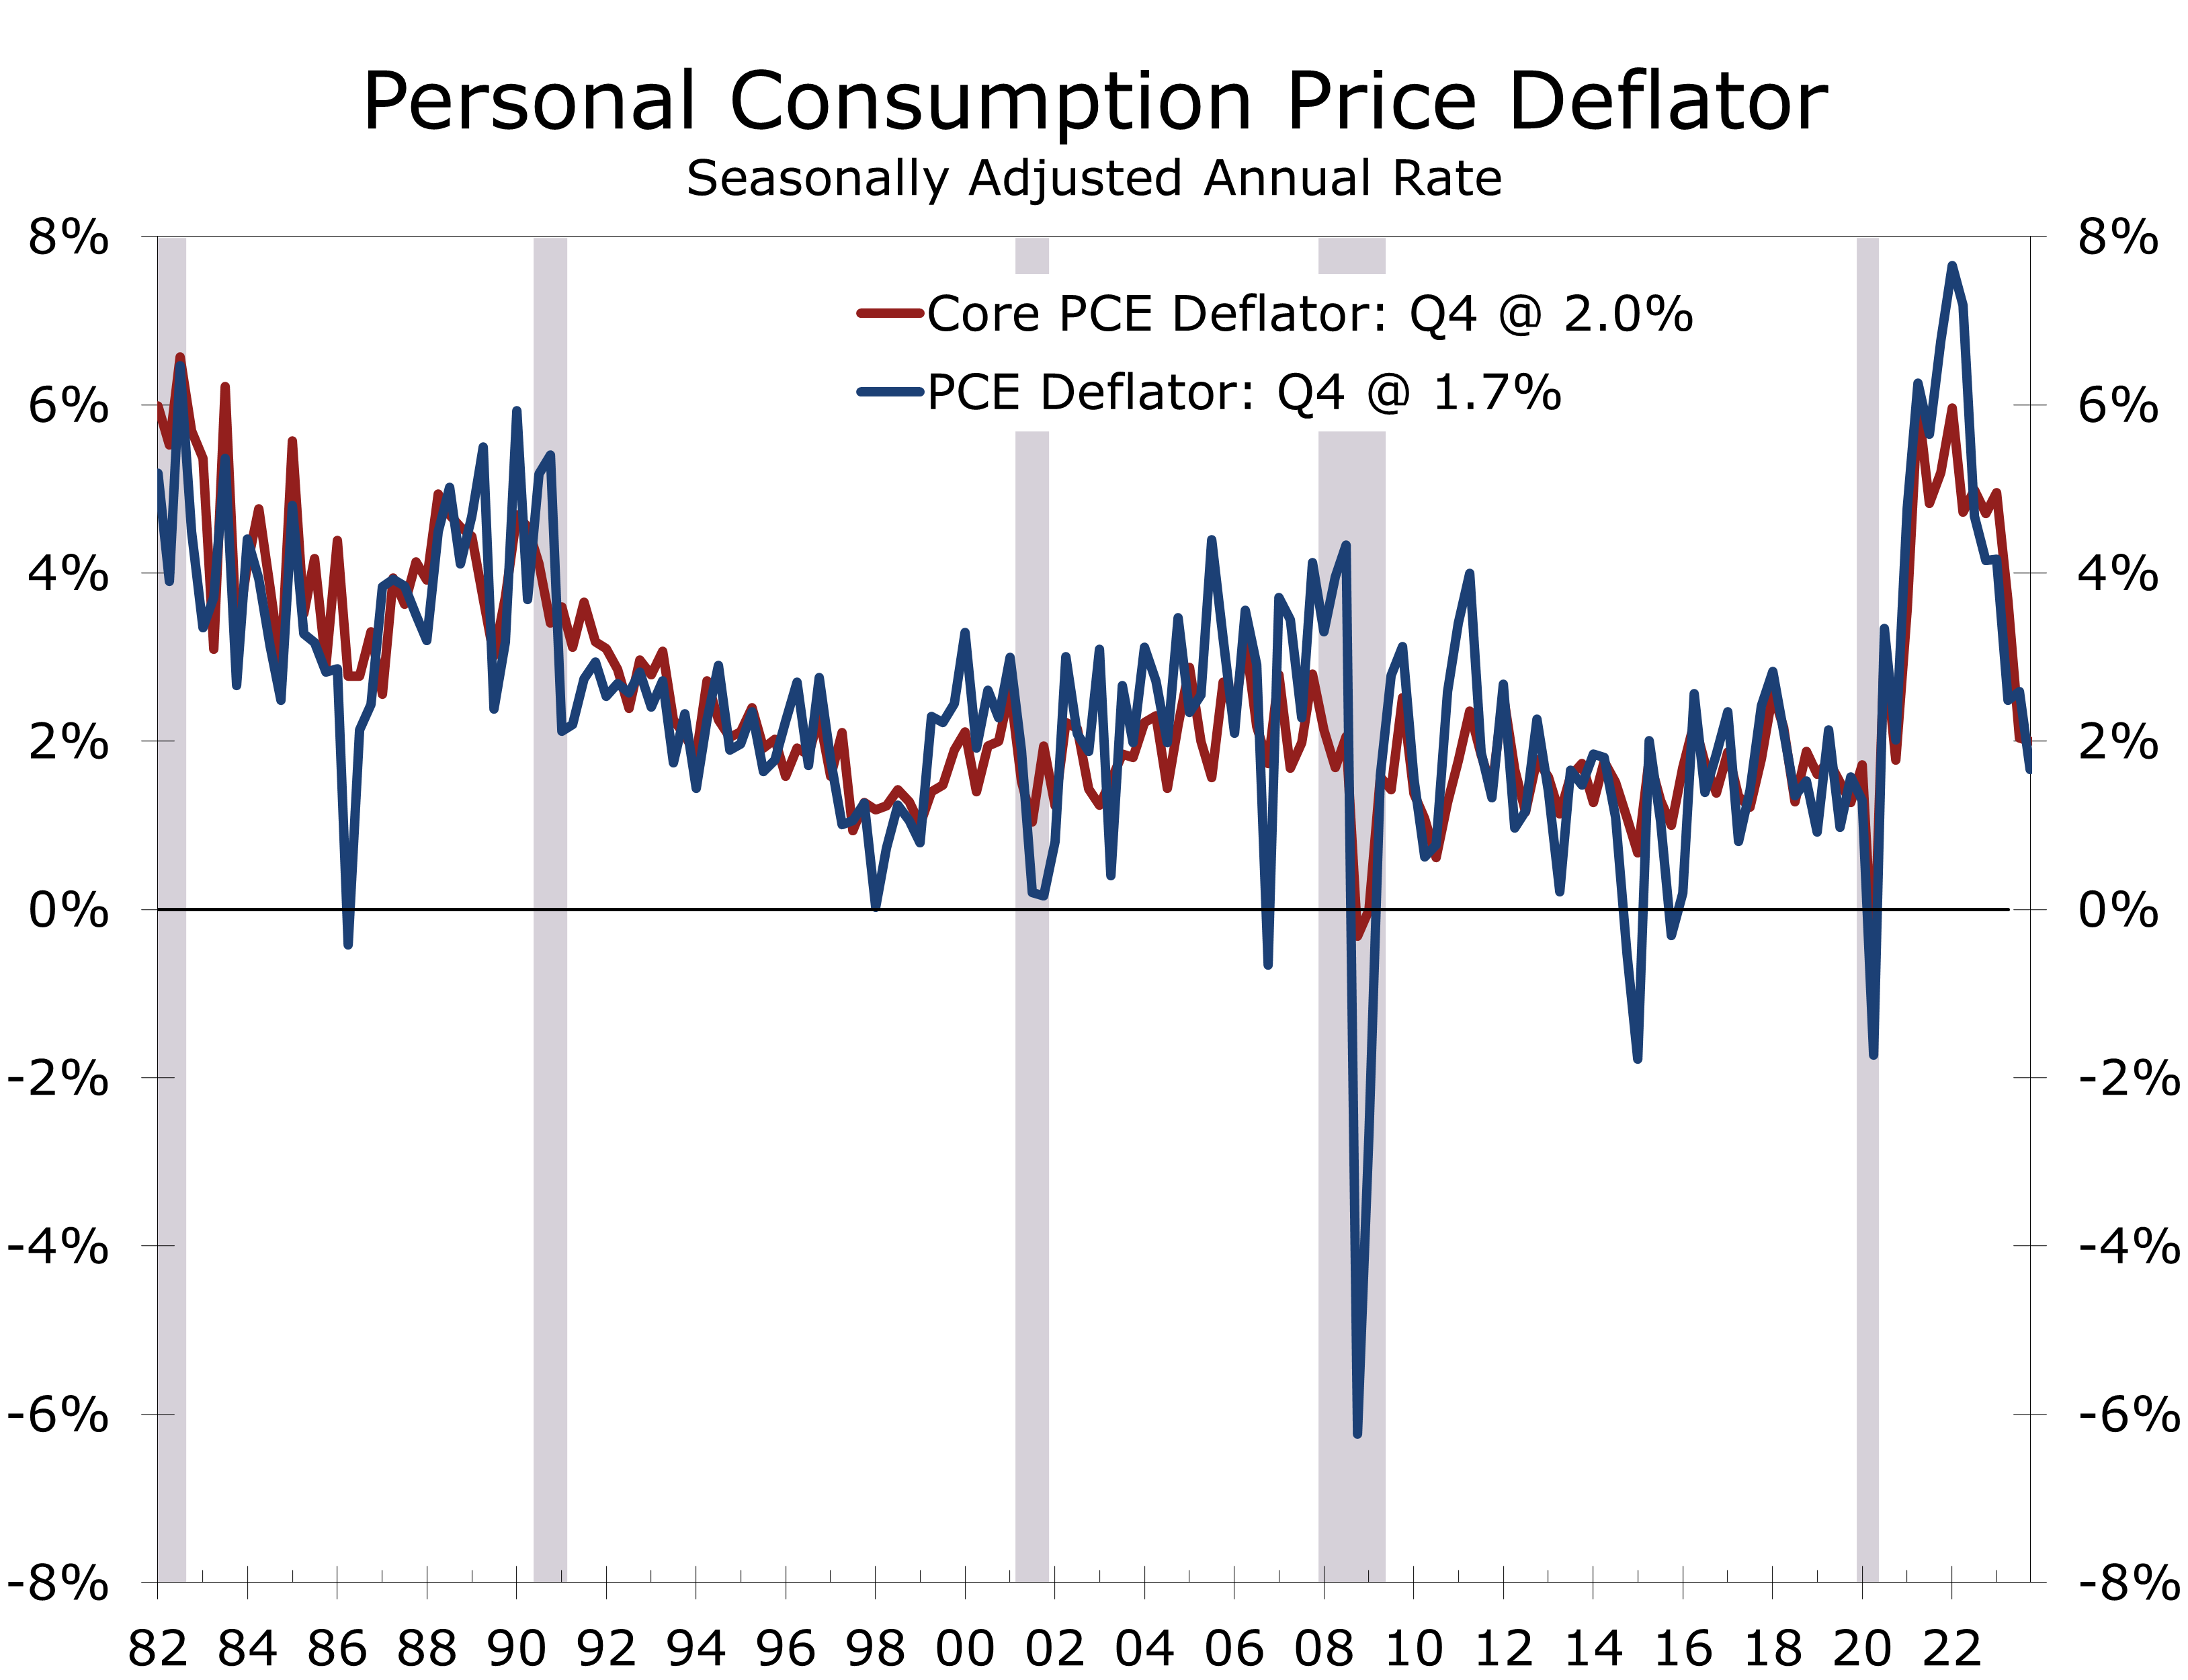
- While growth topped expectations, inflation came in lower, with the core PCE deflator rising at a 2% annual rate in Q4.
- Q4 growth was solid, with consumer spending rising at a 2.8% pace and business fixed investment climbing at a 1.7% pace.
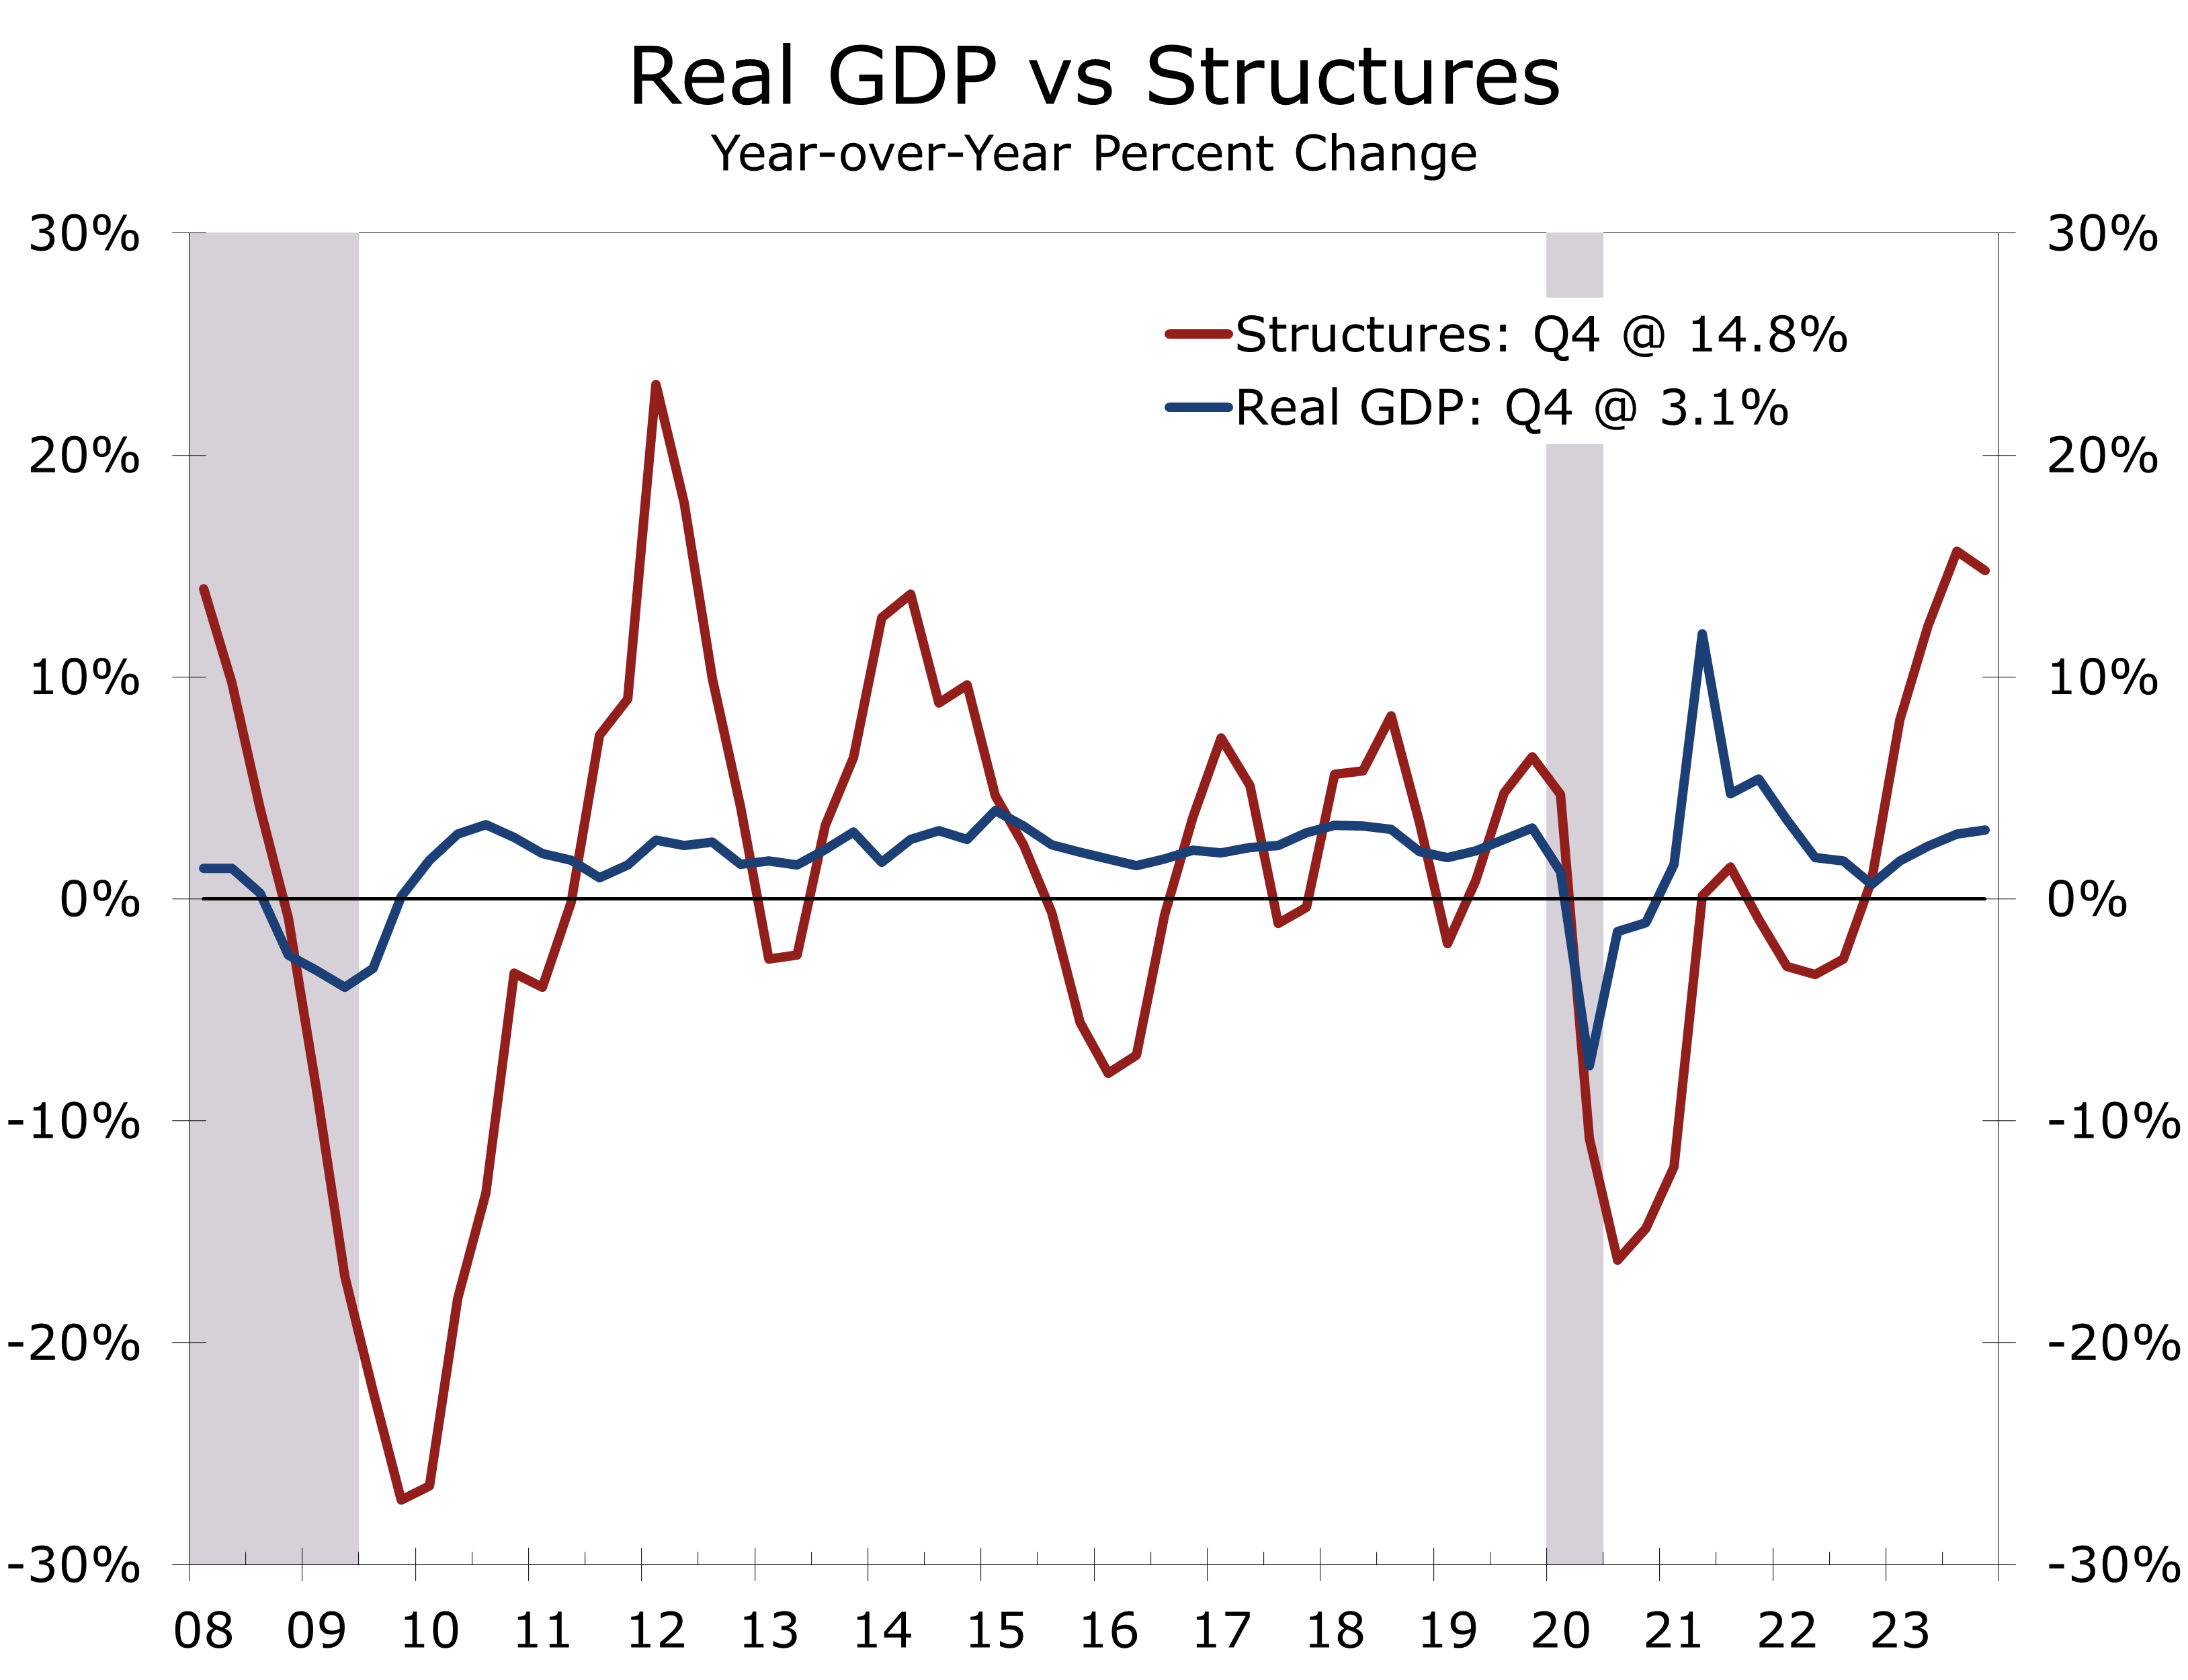
- Both nonresidential and residential construction rose, climbing at a 3.2% and 1.1% pace, respectively. The gain reflects the large pipeline of projects underway.
- International trade was a major surprise, with a narrowing trade deficit adding 0.4 percentage points to Q4 GDP growth.
- Inventories came in stronger than expected, adding 0.1 percentage point to headline GDP growth.
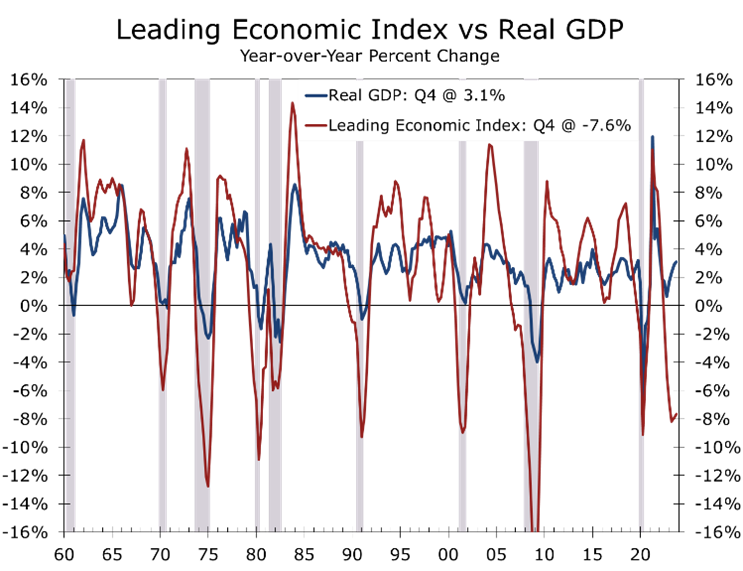
- Economic growth continues to come in well above expectations, defying an anticipated slowdown indicated by measures like the Leading Economic Index. The unexpected strength is likely due to lingering stimulus and the still historic construction backlog of factories, apartments, and homes.
The economy ended the year on a strong note. Real GDP grew at an impressive 3.3% annual rate during the fourth quarter, easily surpassing market expectations that were centered around 2%. Growth was broad based, with every major component posting gains. The strength remains at odds with other leading and coincident measures of economic activity, including the Leading Economic Index and the ISM surveys.
Consumer spending rose at a 2.8% pace in Q4. Durable goods outlays particularly stood out, surging at a 4.6% annual rate, while nondurables climbed at a 3.4% pace. The strength in durable goods is surprising, considering the lingering effects of the United Auto Workers Strike depressed sales of cars and SUVs. All of the growth in durables came outside the automotive sector.
Spending on nondurable goods was fueled by outlays for pharmaceuticals and might reflect demand for new appetite suppression drugs. Continued growth in travel and leisure and a rebound in health care outlays drove growth in services.
The strength in GDP appears at odds with other key measures of aggregate economic activity.
The Conference Board’s Leading Economic Index has declined for 21 straight months, and both the ISM manufacturing and services surveys for December were weaker than expected. This divergence between these key measures is unusual is one reason why consensus estimates for Q4 GDP were so low.
The gap between real GDP growth and other economic indicators likely stems from volatile shifts during the Pandemic. The sudden reopening post-vaccines disrupted supply chains, inflating the Leading Economic Index and ISM surveys. Now that supply chains are normalizing, the decrease in order backlogs and faster deliveries are exaggerating the slowdown.
While growth is moderating, there is still plenty of stimulus in the pipeline. Real GDP grew 3.1% on a fourth quarter to fourth quarter basis, led by a 4.3% spike in government outlays. Most of that was at state and local governments, which continue to benefit from the American Rescue Plan. Hiring at state and local government has also increased, as public schools, universities and municipalities look to replace workers displaced during the pandemic.
Stimulus is also spurring growth in nonresidential construction, particularly new manufacturing facilities. The Inflation Reduction Act and CHIPS and Science Act are driving construction of EV and microchip plants nationwide, leading to a 14.8% surge in nonresidential structures outlays this past year.
Investment outlays grew at a more modest 1.7% pace in Q4, with the AI boom lifting investment in software and IT equipment. Purchases of transportation equipment were a notable soft spot, reflecting some hangover from the UAW strike as well as last year’s slowdown in transportation and shipping.
International trade and inventories were positive surprises in Q4. The narrower trade gap contributed 0.4 percentage points to growth, fueled by a 6.3% rebound in exports and a 1.9% rise in imports. Given the weakness in global growth, particularly in Europe, Q4 exports might have been bolstered by supply chain issues resulting from the Red Sea shipping disruptions.
Inventories rose slightly in Q4, adding 0.1 percentage point to growth. Inventories were expected to subtract 0.1 percentage point from Q4 growth.
While economic growth exceeded expectations, inflation came in on the low side. The price index for gross domestic purchases rose at a 1.9% annual rate in Q4, down from 2.9% in the prior quarter. The core PCE deflator rose at a 2.0% pace, the same as in Q3. The subdued inflation data more than offset concerns that Q4 economic growth came in ahead of expectations.
Private sales to domestic purchasers, rose at a slightly less robust 2.6% pace in Q4, and rose just 1.8% in 2023, down from 2.3% the prior year. This is the part of the economy monetary policy has the most sway over and the moderation is a big reason inflation cooled off as much as it did this past year.
Disclaimer: This publication has been prepared for informational purposes only and is not intended as a recommendation offer or solicitation with respect to the purchase or sale of any security or other financial product nor does it constitute investment advice.
The Economic Outlook for the Presidential Election Year
The 2024 Election Year Economic Outlook
- Most forecasters now expect the Federal Reserve to pull off a near-perfect soft landing in 2024, with economic growth slowing enough to allow inflation to ease further but not so much as to push unemployment higher. Our outlook remains slightly below the consensus, with economic activity expected to be just a touch softer than a traditional soft landing.
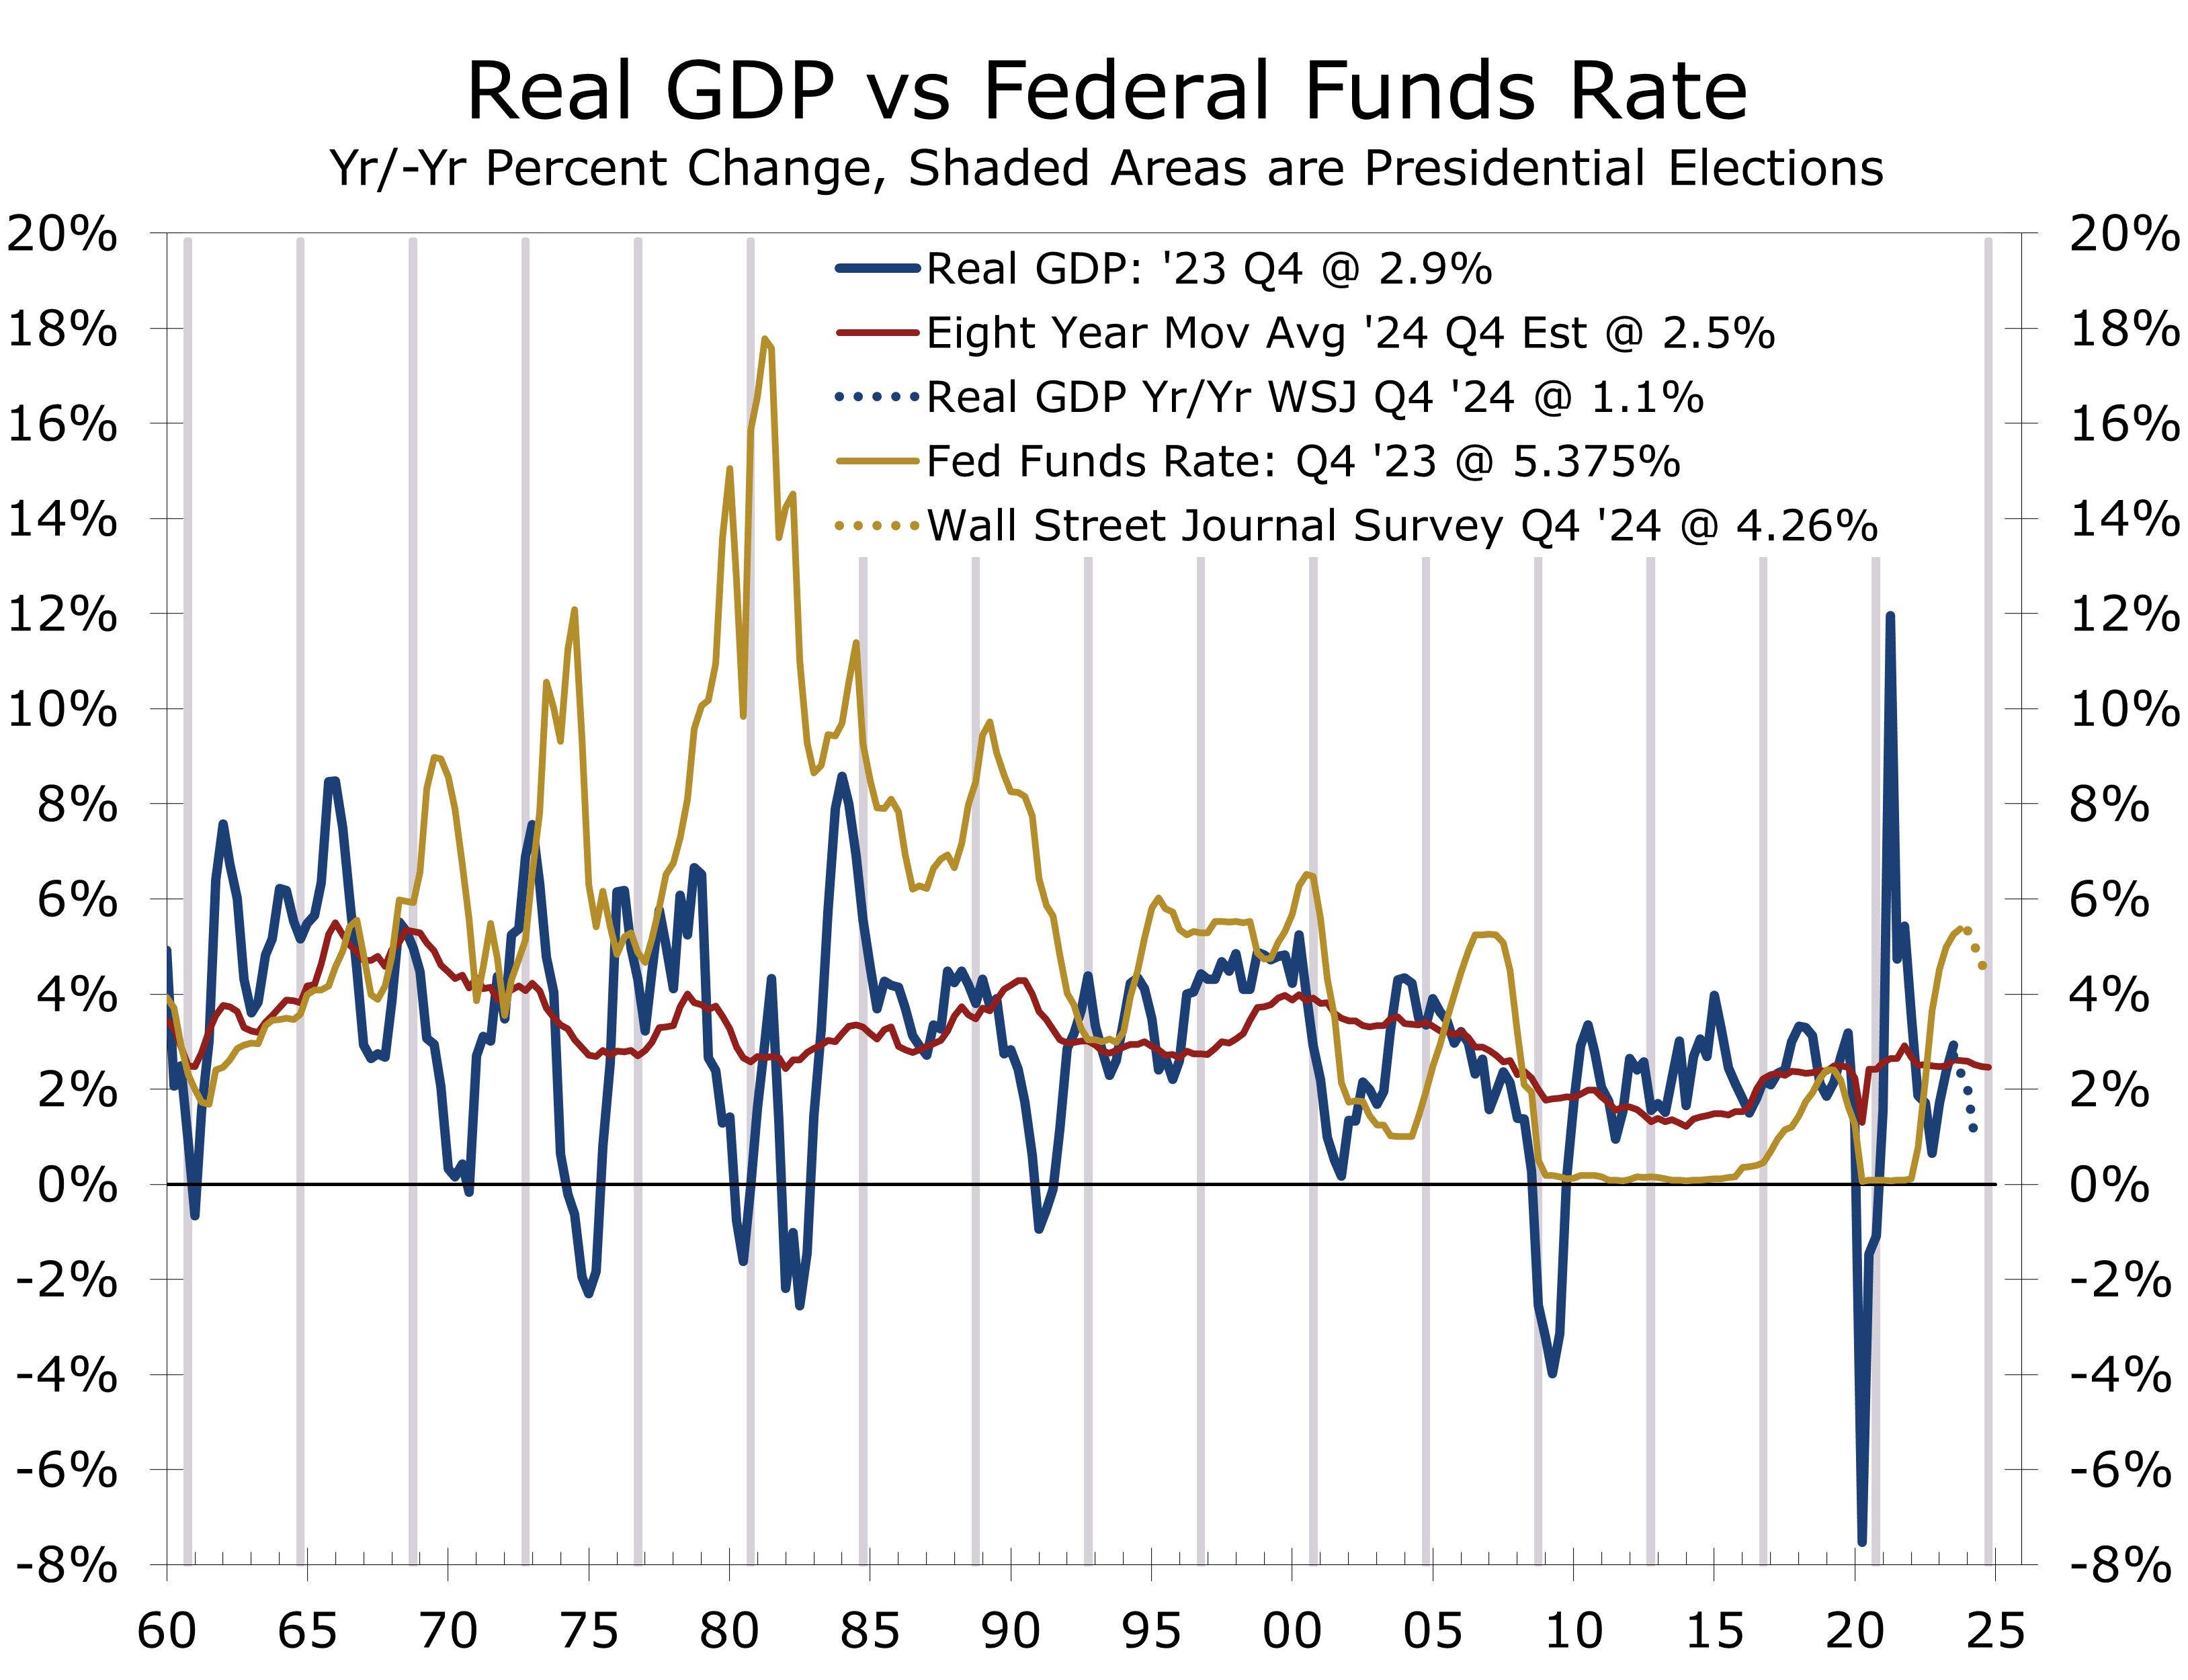
- The primary season is now underway, and the election is on the minds of business leaders, households, and policymakers. Presidential election years are generally thought to be good years for the economy. The record is far from definitive, however, with real GDP just rising 0.1 percentage points faster in presidential election years than its rolling 8-year average. We chose that period as it is roughly equivalent to the prior two presidential terms.
- The economy has had a decisive role in determining who wins or loses presidential elections. Over the past 16 presidential elections, dating back to 1960, the incumbent party has lost 7 of the 8 elections where the economy has grown less than its trailing 8-year average during the year leading up to the election and gone on to win 6 of 8 of the elections where real GDP growth in the year preceding the election was stronger than the previous 8 years. This measure has worked 81.25% of the time
- The current forecast for a soft landing puts the incumbent Biden Administration in a tough spot. If the economy achieves a soft landing, growth will trail its trailing 8-year average, signaling a likely loss. If growth comes in stronger than a soft landing, inflation will likely re-accelerate.
- We continue to look for real GDP growth to be just a touch softer than a soft landing, which should allow inflation to continue to decelerate and give the Fed the green light to cut interest rates. We also examine some traditional election year benchmarks, including the Misery Index, Real After-Tax Income Per Person, and Consumer Confidence.
The primary season is now underway, setting the stage for another critical presidential election year that captures the attention of business leaders, households, and policymakers alike. Traditionally, presidential election years are perceived as pivotal moments for the economy. Upon closer examination, however, the relationship between economic growth and election cycles is more nuanced.
Real GDP, our best measure of aggregate economic growth, has risen a modest increase of just 0.1 percentage points faster in presidential election years compared to its rolling 8-year average dating back to 1960. This marginal difference challenges the commonly held belief that election years are significantly more prosperous for the economy, as incumbents pull out all the stops via tax cuts, increased spending, or promised handouts.
Rather than bolstering economic performance, incumbent presidents and their political parties are likely to be at the mercy of the economy’s most recent performance. Over the past 16 presidential elections, incumbent parties have typically struggled when real GDP grew less than its trailing 8-year average leading up to the election, resulting in losses in 7 out of 8 those instances. Conversely, when election-year economic growth outpaces the previous 8 years, the incumbent party has won 6 out of 8 times. This straightforward measure has been correct 81.25% of the time.
As the presidential election year progresses, the relationship between economic performance and political outcomes will take center stage. The delicate balance between economic growth, inflation, and key economic benchmarks such as the Misery Index, Real After-Tax Income Per Person, and Consumer Confidence will shape the election season’s narrative, influencing voters, business decisions, and policy choices. This issue of the CAVU Compass will briefly review these key concepts in the context of our latest economic forecast.
Real GDP is the most comprehensive measure of aggregate economic well-being. It quantifies the volume of goods and services produced by measuring aggregate purchases of finished goods and services on a net basis, encompassing consumers, businesses, governments, and international purchasers. Real GDP has risen 2.9% over the past year, primarily due to surprisingly strong growth in the third quarter of last year. The first look at Q4 GDP comes on January 25 and is expected to show growth decelerated to a 2.1% pace. We anticipate further
moderation this year, with real GDP rising at a 1.6% pace on a fourth-quarter to fourth-quarter basis.
The current consensus is the U.S. economy will narrowly avoid a recession this year. The latest Wall Street Journal Economic Forecast Survey has real GDP growing just 1% in 2024. Job growth is expected to slow further and the unemployment rate edge higher from its current 3.7% to 4.3%. Inflation is expected to slow to 2.3% by yearend. The Survey calls for the Fed to cut interest rates three or four times beginning sometime in the first half of the year. Thirty-nine percent of economists expect the economy to fall into recession in 2024, down from 48% in October and 61% one year ago.
The soft landing scenario envisioned by the majority of economists will likely have an impact on the presidential election. Voters tend to vote with their wallets and incumbents have typically run into trouble when the economy is struggling. The consensus calls for real GDP to rise just 1% during the year leading up to the election. Such a result would yield growth 1.5 percentage points slower than real GDP growth has averaged over the past 8 years. That gap is significantly larger than the 0.9 percentage point gap averaged in the 9 elections since 1960 where incumbent party candidates lost and is one of the largest deviations, excluding recession years.
Our own forecast is a little more optimistic than the Wall Street Journal consensus even though we continue to look for the economy to be just a touch softer than a traditional soft landing. We look for real GDP to rise 1.7 percent from the fourth quarter of 2023 to the fourth quarter of 2024 and look for nonfarm employment growth to decelerate to a pace that produces a net gain of 110,000 jobs per month. Such an outcome would produce a slightly smaller gap (0.8 percentage points weaker) between economic growth in the year leading up to the presidential election than has been averaged in the 9 elections when the incumbent party. By contrast, winning incumbents have on average enjoyed economic growth that was 1.2 percentage points stronger in the year leading up to the presidential election than in the preceding eight years.
Comparing economic growth to its recent average is a bit more complicated today due to the extreme volatility in most measures of economic growth surrounding the pandemic, as well as the burst in economic activity that followed three successive rounds of direct stimulus payments to households and businesses. The economy has a great deal of stimulus in the pipeline, including the Inflation Reduction Act, the Bipartisan Infrastructure Act, the CHIPS and Science Act, and the Rescue and Recovery Act.
Fiscal policy was often used to boost growth ahead of presidential elections. The onslaught of stimulus following the pandemic has bloated the federal budget deficit, however, and will likely make it more difficult to provide additional fiscal stimulus this year. The budget deficit is expected to decline slightly this year, but slower economic growth will likely reduce tax receipts, while increased defense and security needs will pull spending higher. We look for the federal budget deficit to remain around its current 1.8 trillion this fiscal year.

While the persistence of large budget deficits and periodic showdowns over continuing to fund the deficit generate a lot of headlines, the budget deficit itself has historically not been a major driver of election outcomes. The persistence of large budget deficits is not expected to have much of a direct influence on the 2024 election, although it will make it more difficult for policymakers to prime the pump before the election and might also exert some upward pressure on long-term interest rates.
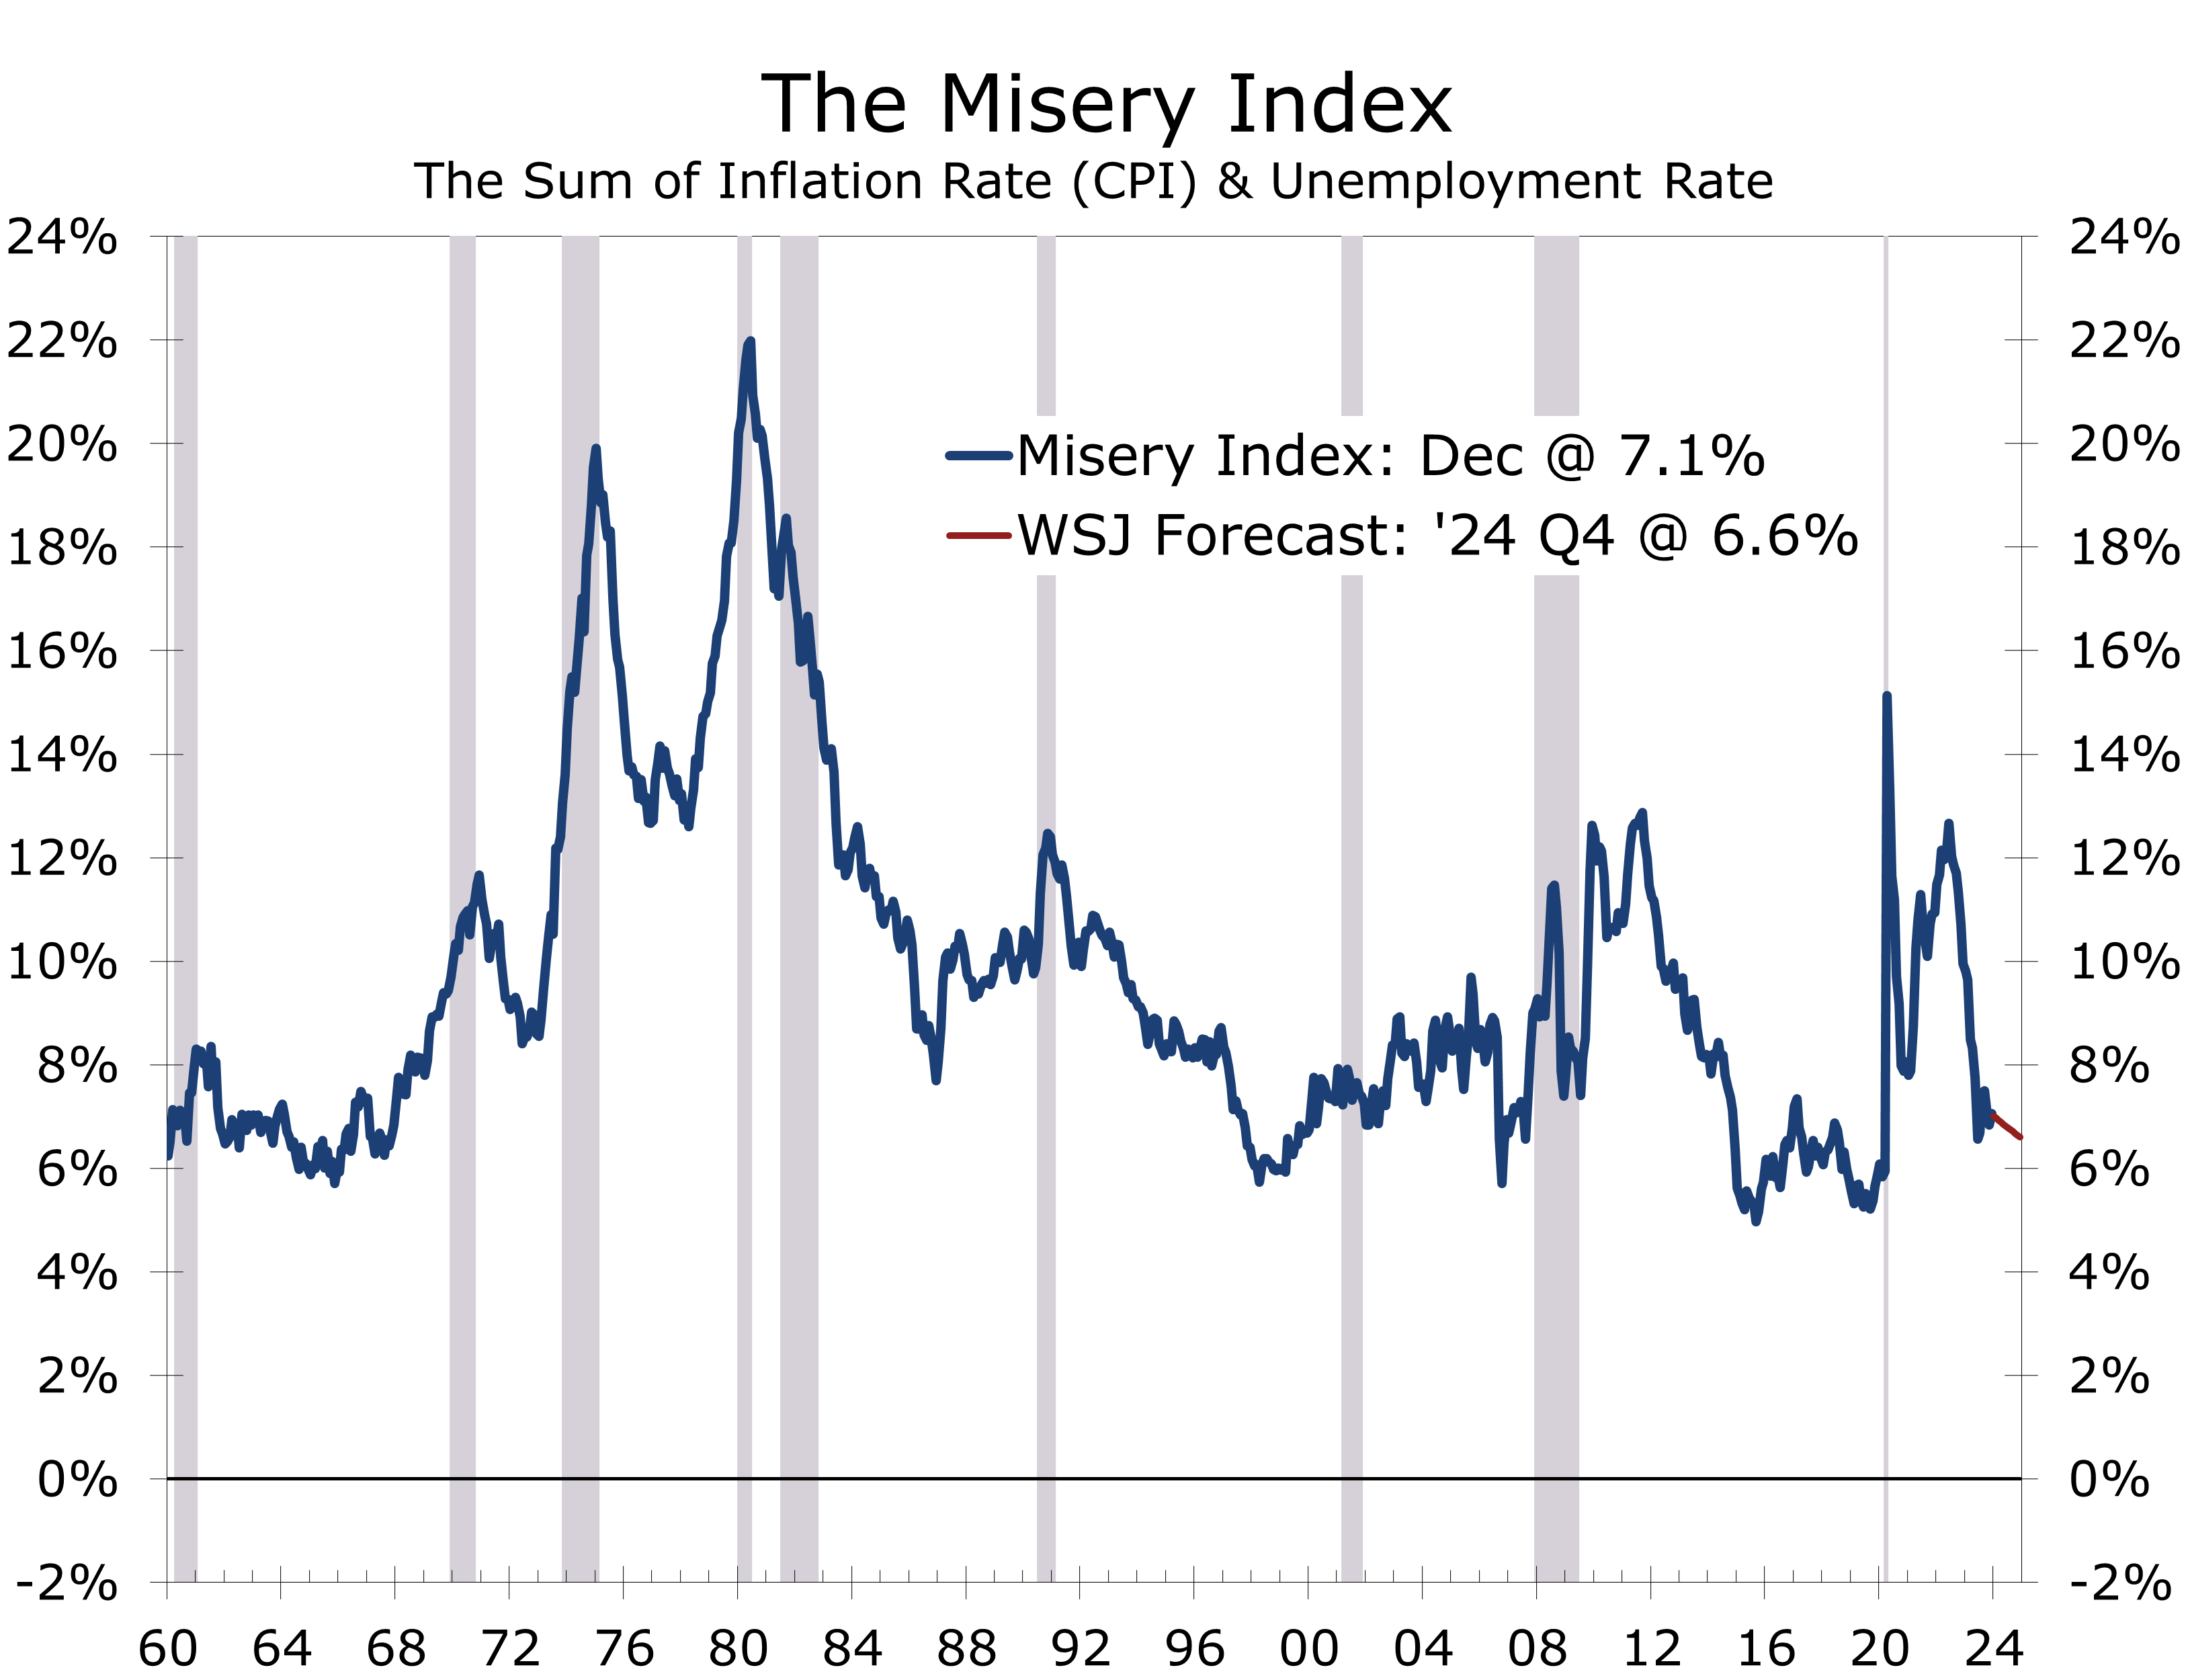
One of the most popular measures of economic well-being during election years is the Misery Index. The Misery Index, created by economist Arthur Okun, is a simple measure that combines the inflation rate and unemployment rate to gauge the overall economic well-being of a country. Okun, who was an economic advisor to President Kennedy, introduced the concept in the 1960s to provide a straightforward assessment of the economic conditions affecting the average citizen. The index is calculated by adding the inflation rate, calculated from the 12-month change in the CPI, to the unemployment rate, providing a quick synopsis of economic conditions that is easy to compare over time.
The trend in the Misery Index has historically been more predictive than the absolute level. The index improved during the Kennedy Administration, which came into office during a time of stagflation, falling from 7.5% when Kennedy was elected in 1960 to 6.1%. Nearly all the improvement came from a reduction in the unemployment rate, which fell from 6.1% to 4.8%. The inflation rate fell from 1.4% to 1.3% during this period.
The Misery Index performance during the Kennedy Administration is instructive on how the inflation-unemployment tradeoff plays out in Democrat and Republican administrations. Successful democratic administrations have mostly focused on reducing unemployment, while republican administrations have seen more success in reducing inflation. The index rose during the Johnson Administration, climbing from 6.1% when Lyndon Johnson was elected to 8.1% in November 1960, when his successor Hubert Humphrey lost to Richard Nixon. All of the increase came from higher inflation. The unemployment rate actually declined.
The Misery Index gained prominence in the 1970s when stagflation emerged as a major economic problem. However, the index is far from perfect in predicting a presidential winner. Nixon secured a historic landslide re-election in 1972, despite a 0.9 percentage point rise in the Misery Index, solely attributable to a higher unemployment rate. Inflation slightly decreased during Nixon’s first term.
Gerald Ford assumed the presidency after the Watergate Scandal led to Nixon’s resignation in August 1974. Ford inherited an economy grappling with both rising inflation and increasing unemployment.
Ford placed significant emphasis on combating inflation, introducing a program called Whip Inflation Now (WIN). Although inflation did decrease during his short presidency, the Misery Index still concluded his term 3.7 percentage points higher than when Nixon was re-elected in 1972 and 4.5 points higher than when Nixon was initially elected in 1968.
Jimmy Carter was quick to point out how much the Misery Index had risen in his successful bid for the White House in 1976. Unfortunately, containing inflation proved exceedingly difficult during Carter’s presidency, which saw the inflation rate rise by 7.8 percentage points to 12.6% in November 1980. The unemployment rate actually fell by 0.3 percentage points during Carter’s term but remained high at 7.5% on Election Day 1980. Reagan won the presidency in a historic landslide and famously reminded voters to ask themselves if they were better off now than they were four years ago? The Misery Index improved significantly under Reagan, mostly due to sharply lower inflation, and he was handily re-elected in 1984.
The Misery Index improved further during Reagan’s second term, paving the way for George Bush to win the presidency in 1988. However, the Misery worsened under his presidency, being 3 percentage points higher when he lost his re-election bid to Bill Clinton in 1992, with the entire increase attributed to a higher unemployment rate. The Misery Index improved during Clinton’s first term, leading to his easy re-election. The Index has been less instructive in every presidential election since, however, as a lower Misery Index failed to provide enough of a boost to secure victory for Al Gore against George W. Bush. Additionally, slight improvements or worsening in the Misery Index have incorrectly predicted every election since.
One reason why the Misery Index has lost some of its luster in recent elections is that inflation was consistently low from the mid-1990s to the pandemic, shifting more attention to the unemployment rate and
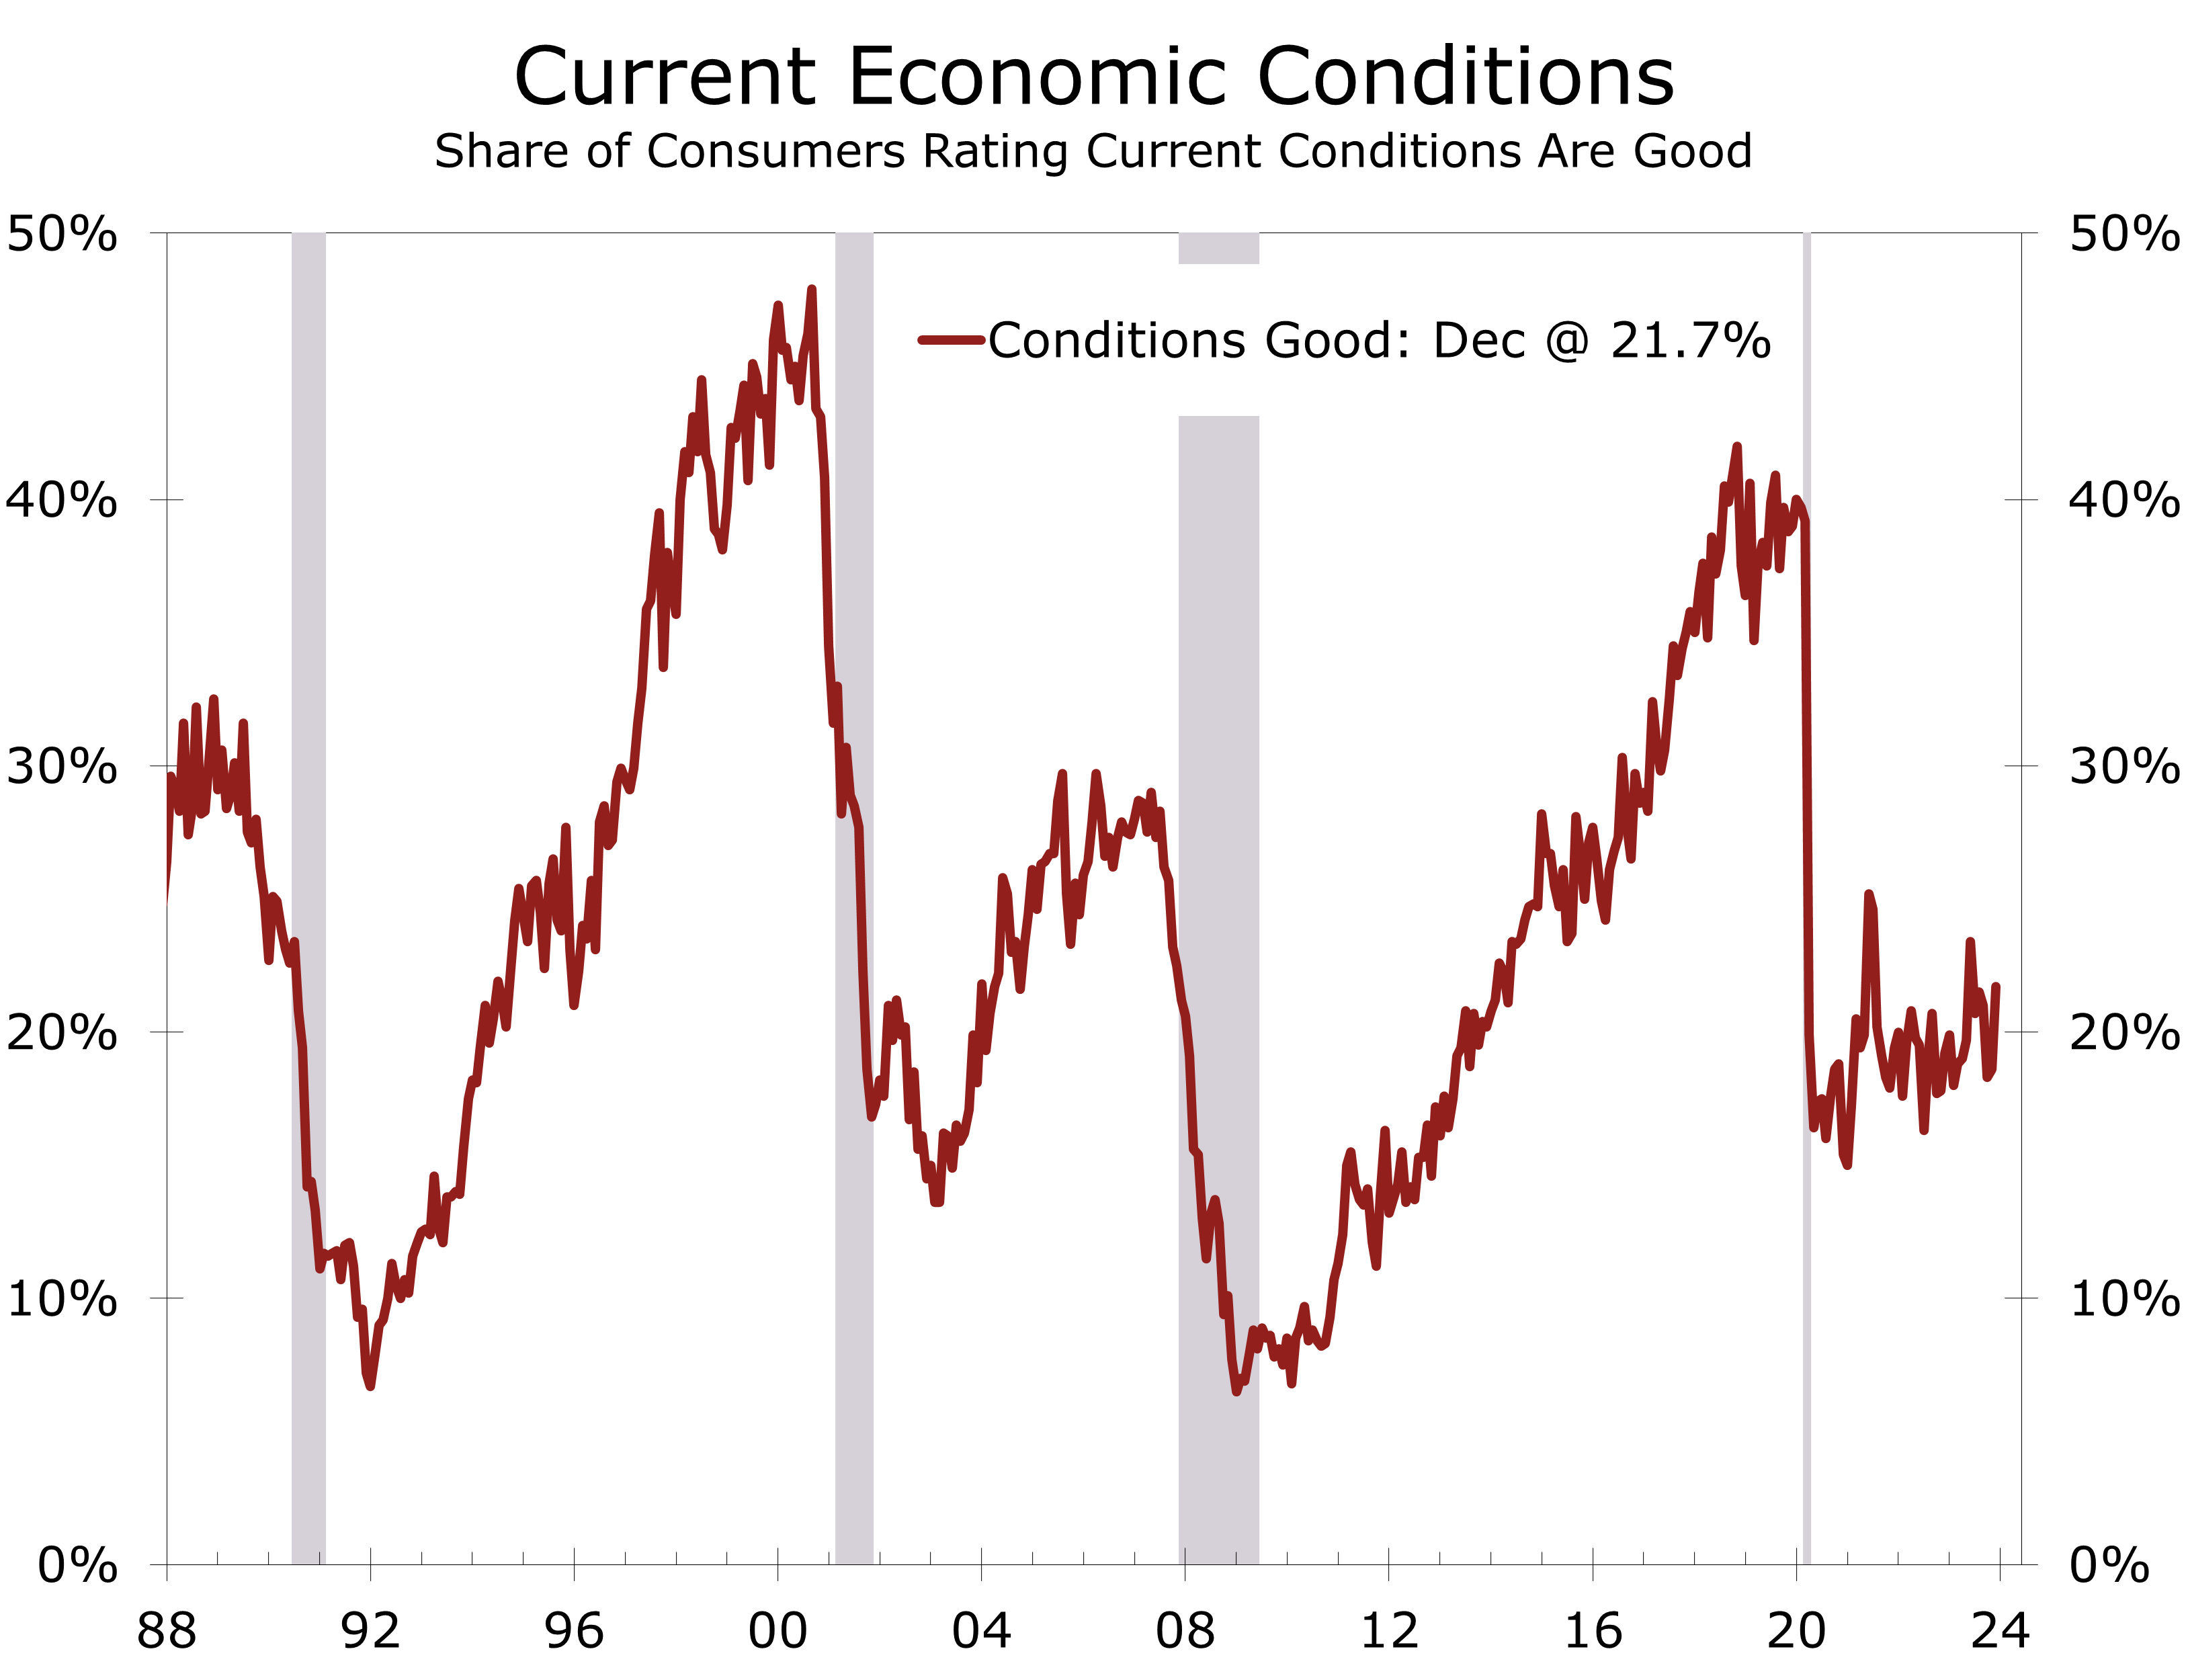
other issues. Of course, inflation spiked following the pandemic, and while it has been moderating recently, prices for groceries, housing, entertainment, and travel remain well above pre-pandemic levels. This may explain why such a small share of consumers currently rank current economic conditions as good.
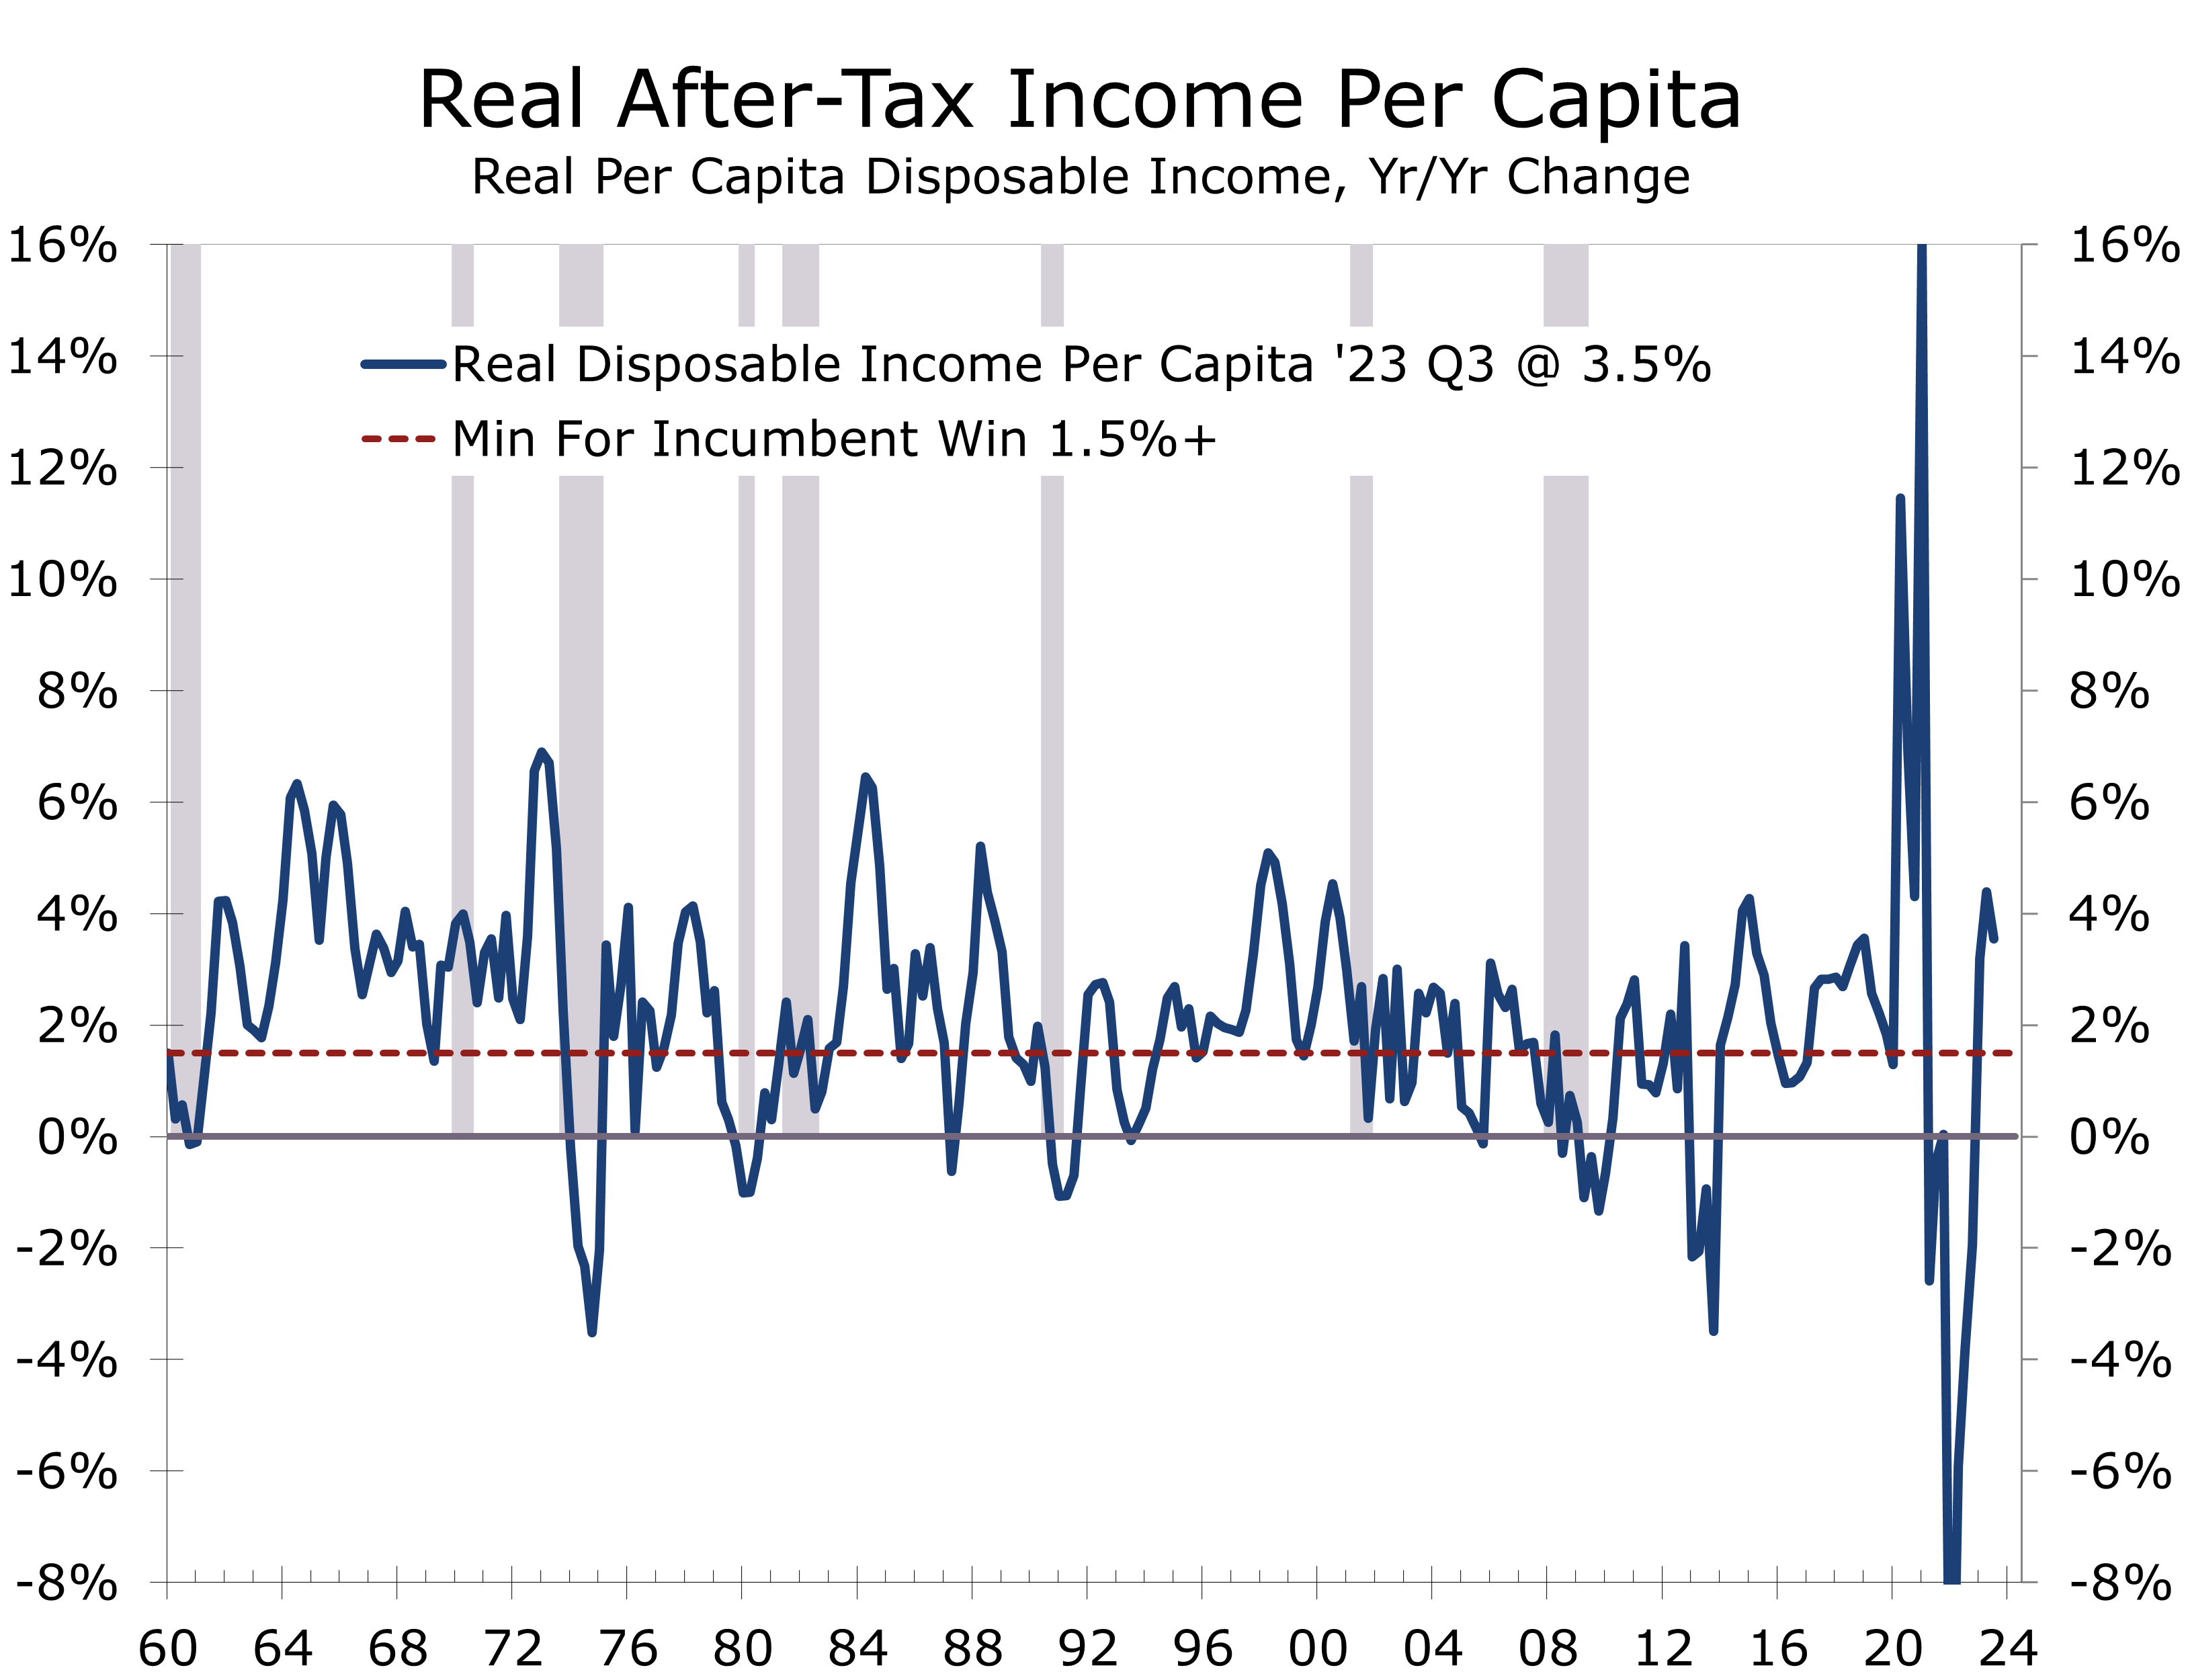
Another reliable measure of economic well-being that has correctly predicted the outcome of 10 of the past 16 presidential elections since 1960 is real after-tax income per person, which is also sometimes referred to as take-home pay minus inflation. The critical level in real per capita disposable income growth is 1.5% in the year preceding the presidential election. When take-home pay per person, minus inflation, rises by 1.5% or more in the year leading up to the presidential election, the incumbent or the person representing the party currently occupying the White House is almost always reelected.
Real after-tax disposable income is better than simply observing the change in the Misery Index and correctly projected Hillary Clinton would lose to Donald Trump in 2016. This measure has had some notable exceptions. Despite a 3.5% growth in real per capita disposable income in the year leading up to the 1968 election, Humphrey lost to Nixon, indicating economic factors alone did not secure victory. Humphrey’s defeat was likely fueled by the nation’s growing frustration with the Vietnam War, underscoring the influence of broader social and political issues on electoral outcomes.
Ford also experienced strong income gains in the year leading up to his 1976 reelection battle, with real take-home pay per capita rising by a solid 2.3%. Despite this economic boost, Ford lost, as simmering anger over the Watergate scandal overwhelmed the modest improvement in the economy. Similarly, Gore’s loss to George W. Bush was likely influenced by some residual anger over the Monica Lewinsky affair and the subsequent impeachment of Bill Clinton. More recently, Trump’s narrow victory over Hillary Clinton in 2016 was likely fueled by lingering angst about the frustratingly slow recovery from the Global Financial Crisis.
The 2020 election miss is beyond the scope of this report. While real take-home pay per person surged by 4.3% in the year preceding the election, the year was marred by the COVID-19 Pandemic and massive relief efforts to contain the resulting economic damage. The income series has been unusually volatile since the pandemic due to repeated stimulus programs. The 3.5% increase over the past year would appear to be good news for Joe Biden, but growth has slowed more recently, with real take-home pay falling at a 0.3% annual rate in the most recent quarter. With economic growth slowing, we expect real take-home pay to rise very close to the 1.5% threshold needed for incumbents to be reelected.
The three benchmarks we introduced suggest this election cycle is likely to be tough for incumbents. Real GDP is expected to grow 0.8 percentage points slower this year than its average for the past 8 years, which has typically signaled a loss for the incumbent party occupying the White House. On the plus side, the Misery Index is projected to be 1.1 percentage points lower than when Biden was elected, with all of the improvement coming from lower unemployment. While inflation is expected to moderate, the CPI should still rise more than twice as much in 2024 as it did in the year preceding the 2020 election, and prices for key necessities are much higher than they were four years ago. Along those lines, real after-tax income per capita is likely to rise by 1.5% at best during the year leading up to the 2024 election. Based on recent experience, incumbents would lose, meaning the leadership of the White House, Senate, and House of Representatives would all likely change parties.
Predicting election outcomes is even more perilous than predicting the economy. A host of non-economic issues could easily overwhelm concerns about the economy, including global affairs, social issues, and the personal attributes of the candidates. The outcome of the election will have significant consequences on everything from geopolitics, global trade, the composition of the Fed and various regulatory agencies, and fiscal policy.
Our economic outlook is slightly more upbeat than it was a month ago. Real GDP in the fourth quarter now looks like it grew at a 2.1% annual rate, thanks to continued strong consumer spending and the continued buildout of a multitude of industrial projects. State and local government spending also looks to have risen solidly, given the continued growth in state and local government payrolls. Inventories are expected to grow more slowly and be a drag on Q4 growth.
We have also raised our 2024 forecast and now see growth just a touch softer than a soft landing, with real GDP expected to rise by 1.7%. Nonfarm employment is anticipated to decelerate, with employers adding only 110,000 jobs per month. The unemployment rate is predicted to increase to 4.1% by the end of the year. We maintain concern regarding traditional warning signals, such as the inverted yield curve and a 21-month decline in the Leading Economic Index. While the risk of a recession remains elevated, the more likely scenario is a continuation of the rolling recessions that have been ongoing for the past year.
Inflation is expected to continue to moderate, allowing the Fed to begin to cut interest rates this spring. Our forecast includes three quarter-point cuts in the federal funds rate, with the first in May or June. Another cut is expected in September and then the Fed will likely hold rates steady through the November election, after which
a final cut is likely. Despite the bond market factoring in five or six quarter-point cuts this year, we do not foresee the economy weakening or inflation moderating enough to justify such extensive cuts. The 10-year Treasury is expected to rise back to 4.20%, which will keep mortgage rates in the 6.50% range through the end of the year.
Disclaimer: This publication has been prepared for informational purposes only and is not intended as a recommendation offer or solicitation with respect to the purchase or sale of any security or other financial product nor does it constitute investment advice. Any forward-looking statements or forecasts are not guaranteed and are subject to change at any time. Information from external sources have not been verified but are generally considered reliable.
© 2024 CAVU Securities, LLC
January 24, 2024
mark.vitner@piedmontcrescentcapital.com
Chief Economist (704) 458-4000
Small Business Optimism Rises at Yearend on Hopes for a Soft Landing
Small Business Confidence Improves Slightly
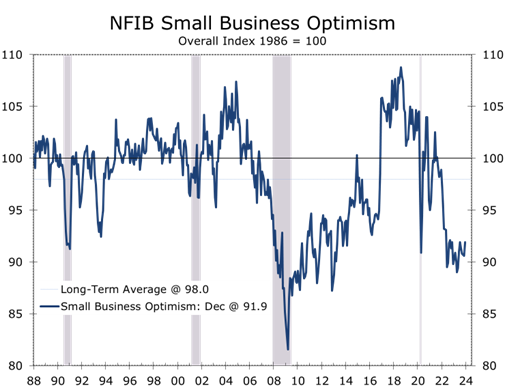
- The NFIB Small Business Optimism Index rose 1.3 points to 91.9 in December, its highest in the past five months.
- The improvement coincides with decline in interest rates and rise in stock price following the December 13 FOMC meeting.
- Five of the index’s 10 components rose in December, led by a 7-point improvement in earnings trends and share of business owners expect the economy to improve.
- Despite the recent improvement, earnings trends (-25%) and the net share expecting the economy to improve (-36%) remain extremely weak and near recession levels.
- Business owners remain concerned about inflation and hiring challenges, although these concerns have eased somewhat.
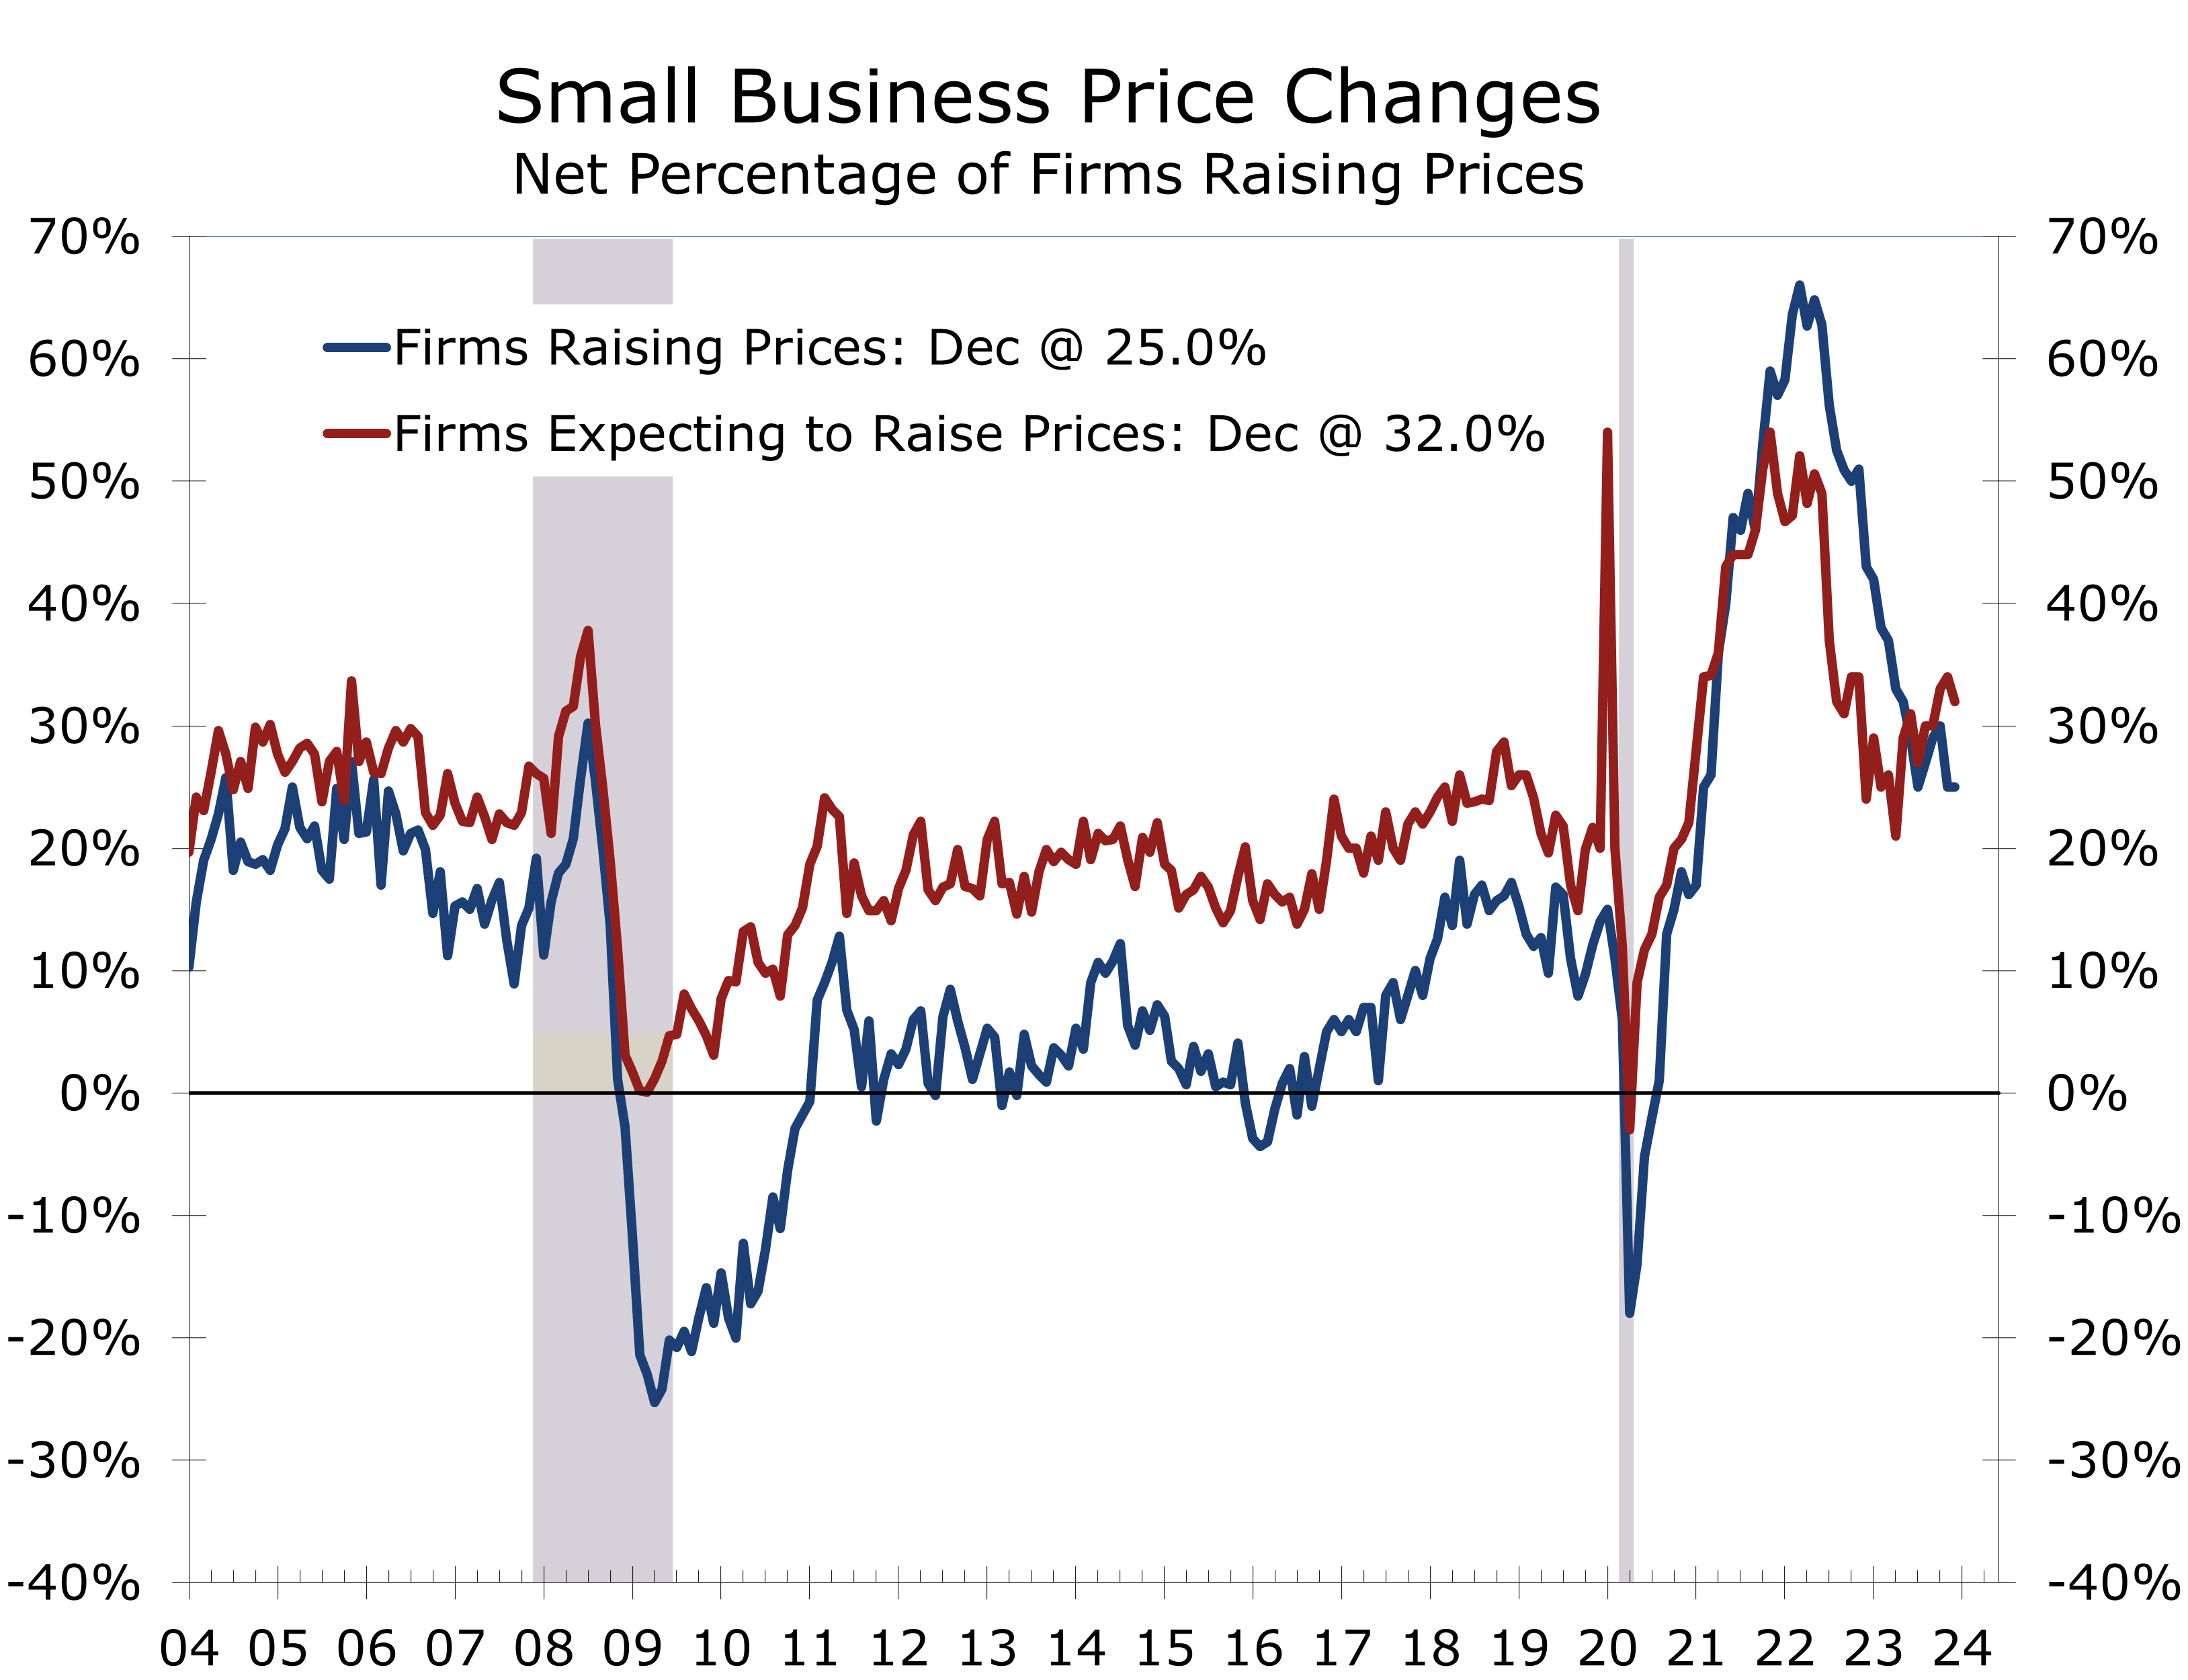
- Continued pressure from rising operating costs may push inflation higher.
- December's rise in Small Business Optimism further supports the growing consensus for a soft landing. While moderating final demand is limiting pricing power, rising wage pressures might still push inflation higher if the Fed eases too aggressively.
Small business confidence closed the year positively, with the NFIB Small Business Optimism Index rising 1.3 points to 91.9 in December, marking its highest level in five months. Despite this improvement, the index has remained below its 50-year average of 98 for the past 24 months. The index last reached or exceeded the average back in December 2021.
This boost in optimism corresponds to the substantial decline in interest rates and a subsequent rise in stock prices following the Federal Reserve’s FOMC meeting on December 13, where the Fed stated they had likely finished raising interest rates for this cycle and attention shifted toward rate cuts. The Santa Claus rally ended before New Year’s Day, however, and markets have experienced a partial retracement as bond yields rebounded.
Small business confidence got a boost from improved financial conditions during December.
Small business owners remain concerned about inflation and continue to face challenges hiring qualified staff, although both concerns have eased somewhat in recent months. Apprehension about sustaining profit margins amidst continually rising operating costs is also weighing on confidence, a challenge that likely intensified as the minimum wage rose across various states and municipalities at the start of the year. The capacity to offset these higher costs has diminished as demand has cooled.
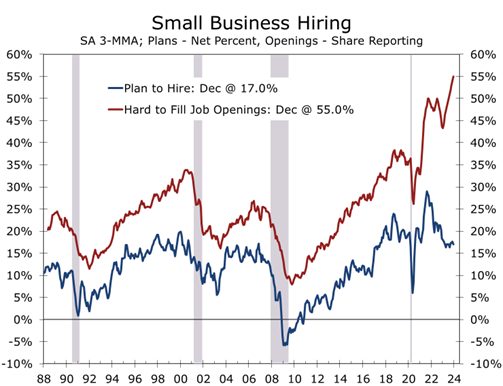
Small businesses are grappling with ongoing challenges in the labor market, as 40% of business owners report having unfilled job openings. This breakdown includes 33% seeking skilled workers and 14% seeking unskilled labor. Particularly noteworthy are the acute difficulties faced by construction firms and smaller trucking companies in filling positions.
Fifty-five percent of small businesses reported hiring or trying to hire in December, up 1 point from November. Forty-nine percent (89% of those hiring or trying to hire) of owners reported few or no qualified applicants for the positions they were trying to fill (down 1 point). Twenty-eight percent of owners reported few qualified applicants for their open positions (up 2 points) and 21 percent reported none (down 3 points).
Small business owners are less willing to compromise on qualifications and experience.
Given the cost constraints small businesses face, many owners seem to be choosing not to fill open positions unless there is a fully qualified applicant. There has been a steady decline in owners’ intentions to fill open positions in recent months, even as the share of businesses reporting they have open positions continues to rise. Additionally, businesses are paying more, with 36% of owners raising compensation and 29% planning to raise pay over the next three months.
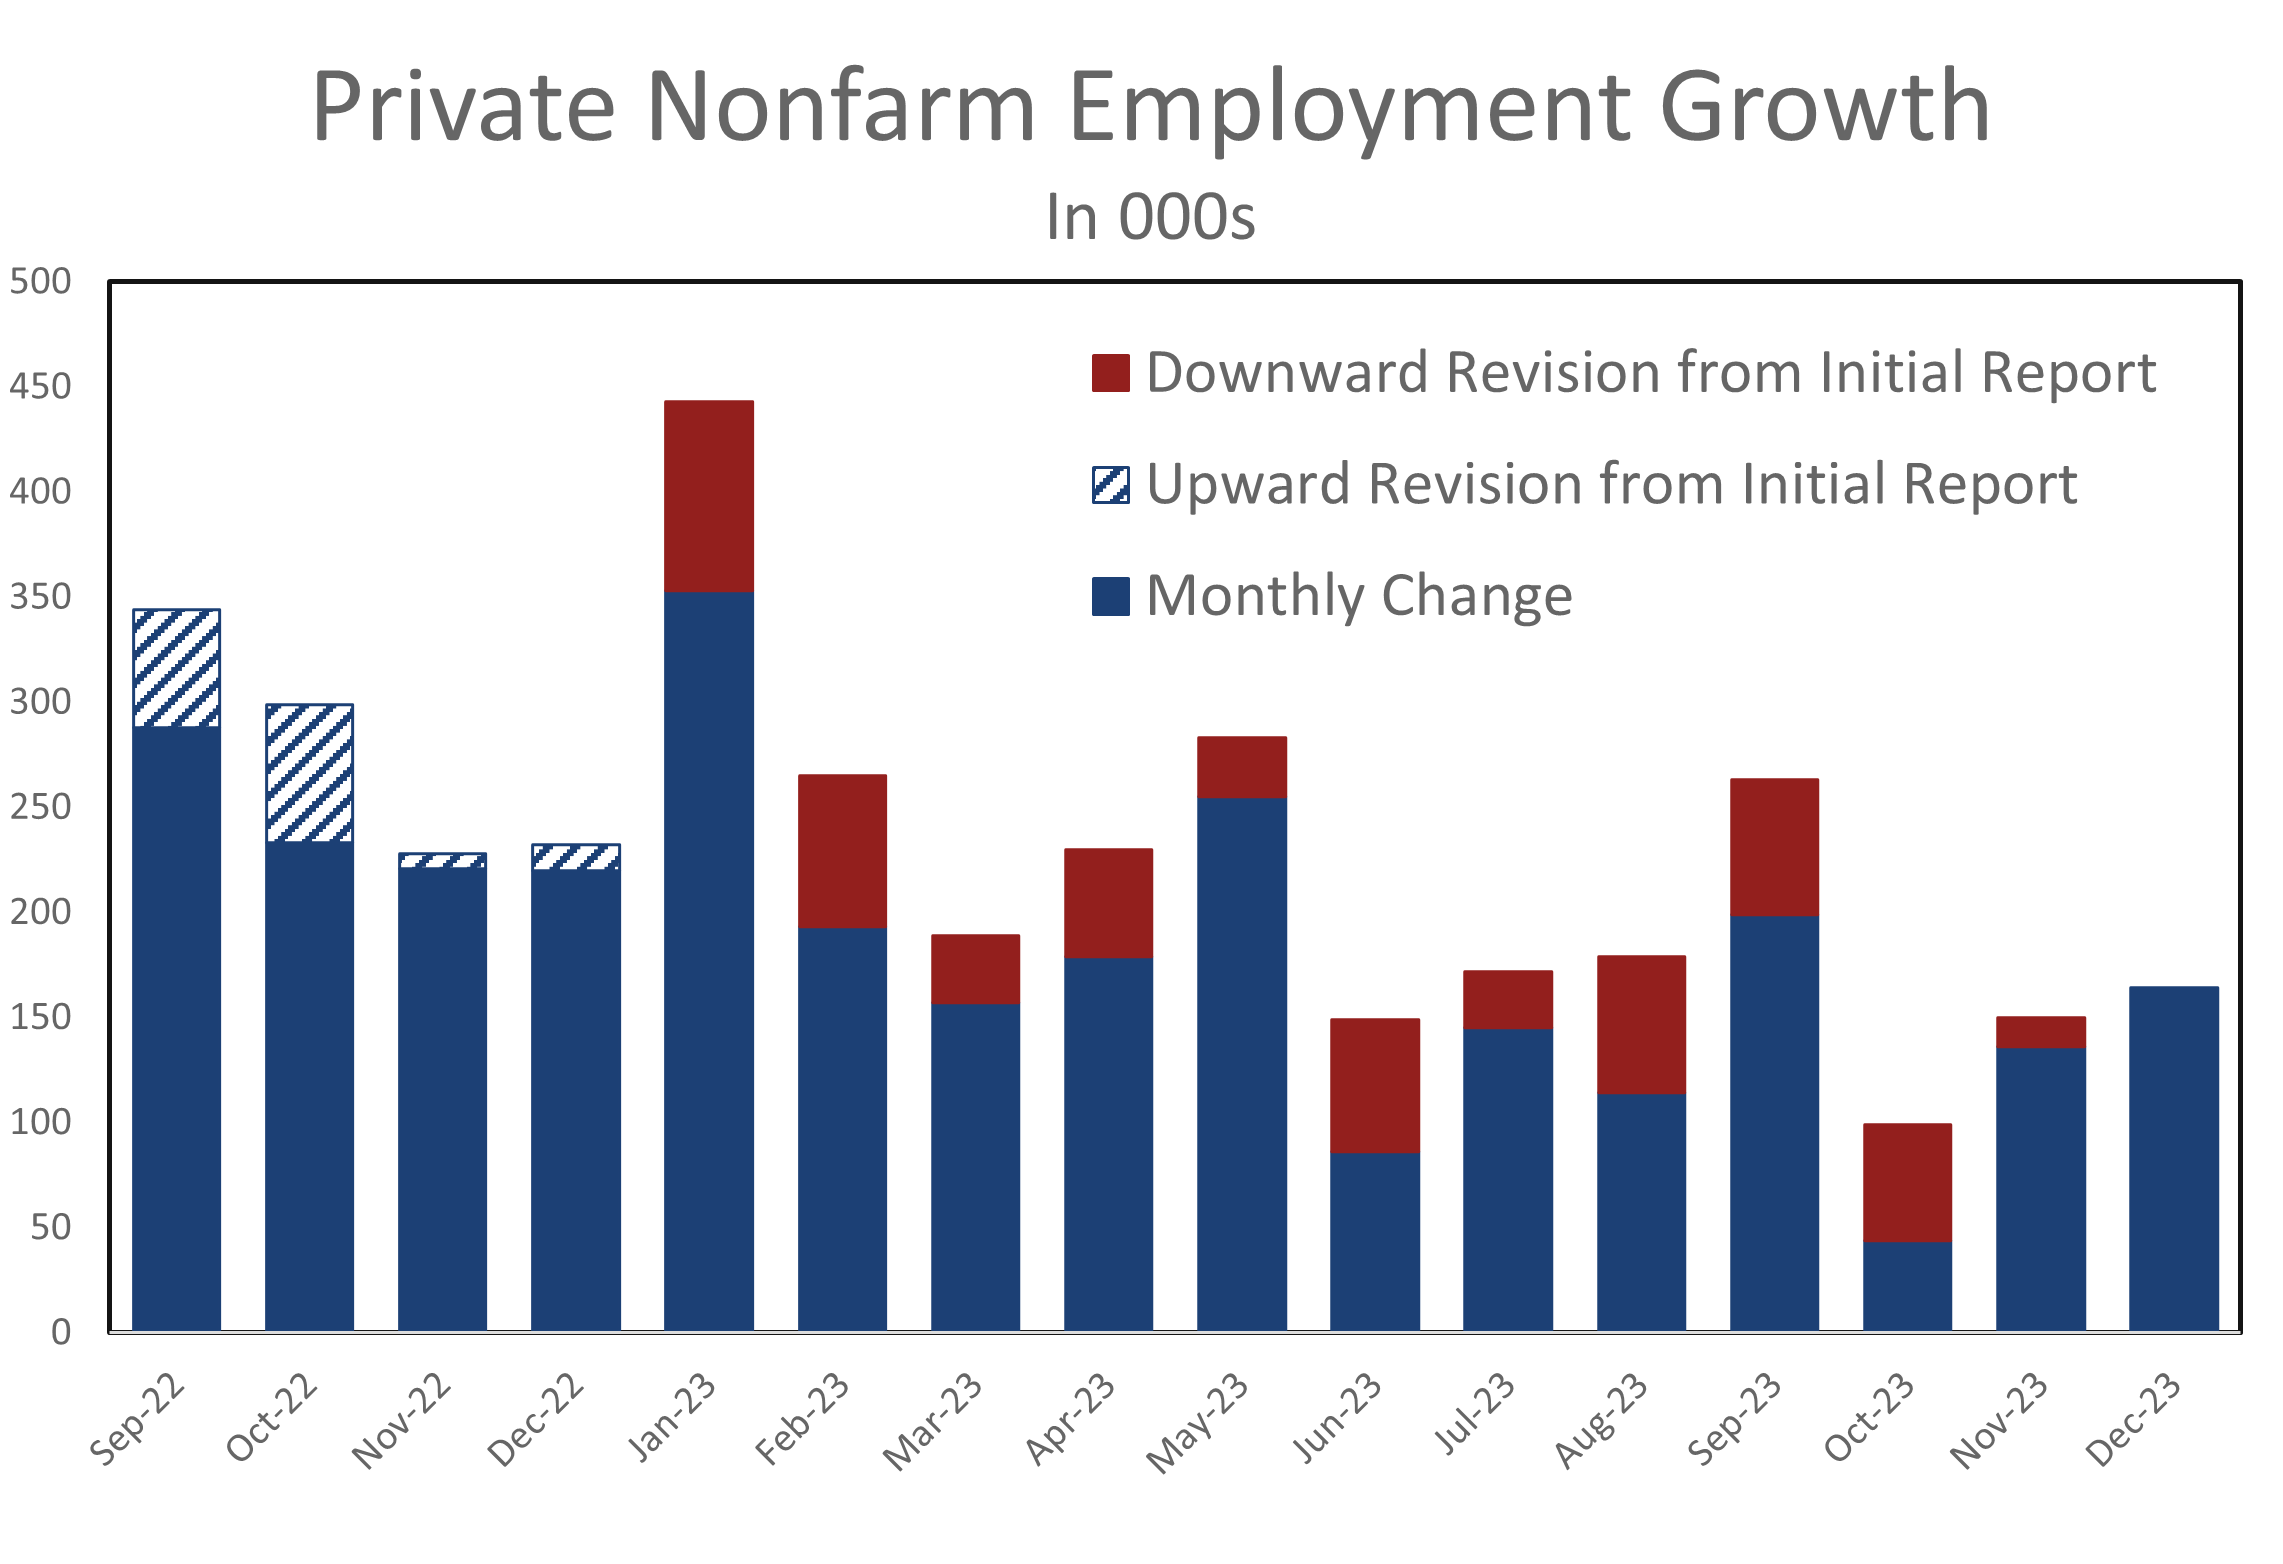
The reluctance small business owners show in adding staff comes at a time when labor markets are giving off mixed signals. Although the headline nonfarm employment numbers have exceeded expectations, job figures have consistently been revised lower. Other employment measures, including the household employment survey and ADP survey, suggest that hiring has been less robust. This gap will likely be reduced once the Bureau of Labor Statistics (BLS) releases their annual revisions along with the January employment data on February 2nd.
Small business owner have seen their pricing power diminish as economic growth has slowed.
Continued pressure from rising operating costs may push inflation higher. The proportion of firms expecting to raise prices is trending higher again, even as the share of those actually raising prices continues to trend lower. This split reflects the diminished pricing power that small businesses currently have. The divide is also a concern for policymakers. If the Fed cuts interest rates too aggressively, demand would likely strengthen to the point that businesses would once again pass their higher costs onto consumers.Top of Form
Disclaimer: This publication has been prepared for informational purposes only and is not intended as a recommendation offer or solicitation with respect to the purchase or sale of any security or other financial product nor does it constitute investment advice.
December Job Growth Tops Expectations
But Hiring Is Softer Than the Headline Suggests
- Employers added 216,000 jobs in December, surpassing the consensus forecast of 165,000.
- Hiring was not as strong as the headline suggests, as payrolls were revised lower for the preceding two months.
- Fewer industries are hiring aggressively, with the majority of job growth now coming from government (+52K), leisure and hospitality (+40K) and health care (37.7K).
- Hiring is strongest in lower-paying occupations where rehiring workers laid off during the pandemic has proved challenging.
- The unemployment rate remained unchanged at 3.7%, as both the labor force and household employment falling by roughly the same proportion.
- Average hourly earnings rose a larger-than-expected 0.44% in December and are up 4.1% from last December.
- Job growth remains solid but is concentrated in a handful of industries, with weak hiring in the goods sector and a slowdown in certain parts of the services sector. Revisions to previous months' data reinforce the decelerating trend. We anticipate three quarter-point interest rate cuts this year, which is half of the current consensus.
There is much to digest from the December employment data. Although the overall gain of 216,000 jobs exceeded expectations by 41,000 jobs, downward revisions to the previous two months’ data tempered the positive headline number. Job growth was also concentrated in just a few sectors, with government payrolls (+52k) and health care and social assistance (+58.9k) contributing to over half of December’s increase.
Warmer-than-usual weather likely boosted job gains, particularly in leisure hospitality (adding 40,000 jobs), and retail trade and construction (both adding 17,000 jobs). Hiring in most other sectors was less robust. Manufacturers added 6,000 jobs, financial services added 2,000 jobs (primarily in property management), and information services added 14,000 jobs, mainly in motion pictures, indicating a sustained recovery from the recent writers and screen actors’ strikes.
Temporary staffing jobs continues to decline, possibly presaging weaker overall job growth.
The AI boom appears to be bolstering hiring in the tech sector. IT services added 4,400 jobs in December, and professional, scientific, and technical services saw a gain of 25,300 job. Overall job growth in professional services, however, continues to be hindered by declines in temporary staffing jobs (-33.3k).

The unusually wide gap between temporary jobs and nonfarm employment is primarily due to increased hiring in the public sector. Government payrolls have surged by 2.9% this past year, with the bulk of the increase occurring at the state and local levels. Hiring has accelerated in various line positions that were challenging to fill following the pandemic lockdowns, such as bus drivers, sanitation workers, and within public school systems and other public works.
Outside of government hiring is losing momentum., Private sector rose just 1.5% over the past year and at a 1.0% annual rate over the last three months. Furthermore, the initial estimate for private sector payrolls has been consistently revised lower in each subsequent month throughout the year.
Private sector payrolls have consistently been revised downward each month this year.
The BLS will provide a comprehensive employment update next month when they releases their annual revisions along with the January employment data. The BLS noted earlier these revisions are expected to reduce job growth by about 0.2% points lower than previously reported and private-sector payrolls will be 0.3% lower. The benchmark revisions reflect hard data through March 2023 but should also incorporate improved estimates for months since then, which should further reduce previously reported job growth.
Average hourly earnings rose a larger than expected 0.44% in December and finished the year 4.1% higher than in December 2022. Wages for production and supervisory workers rose 0.34% but are up an even larger 4.3% over the past year. Aggregate hours worked fell 0.2% in December and rose at just an 0.8% annual rate during Q4, which is consistent with our expectation for Q4 real GDP to rise at a 2% annual rate.
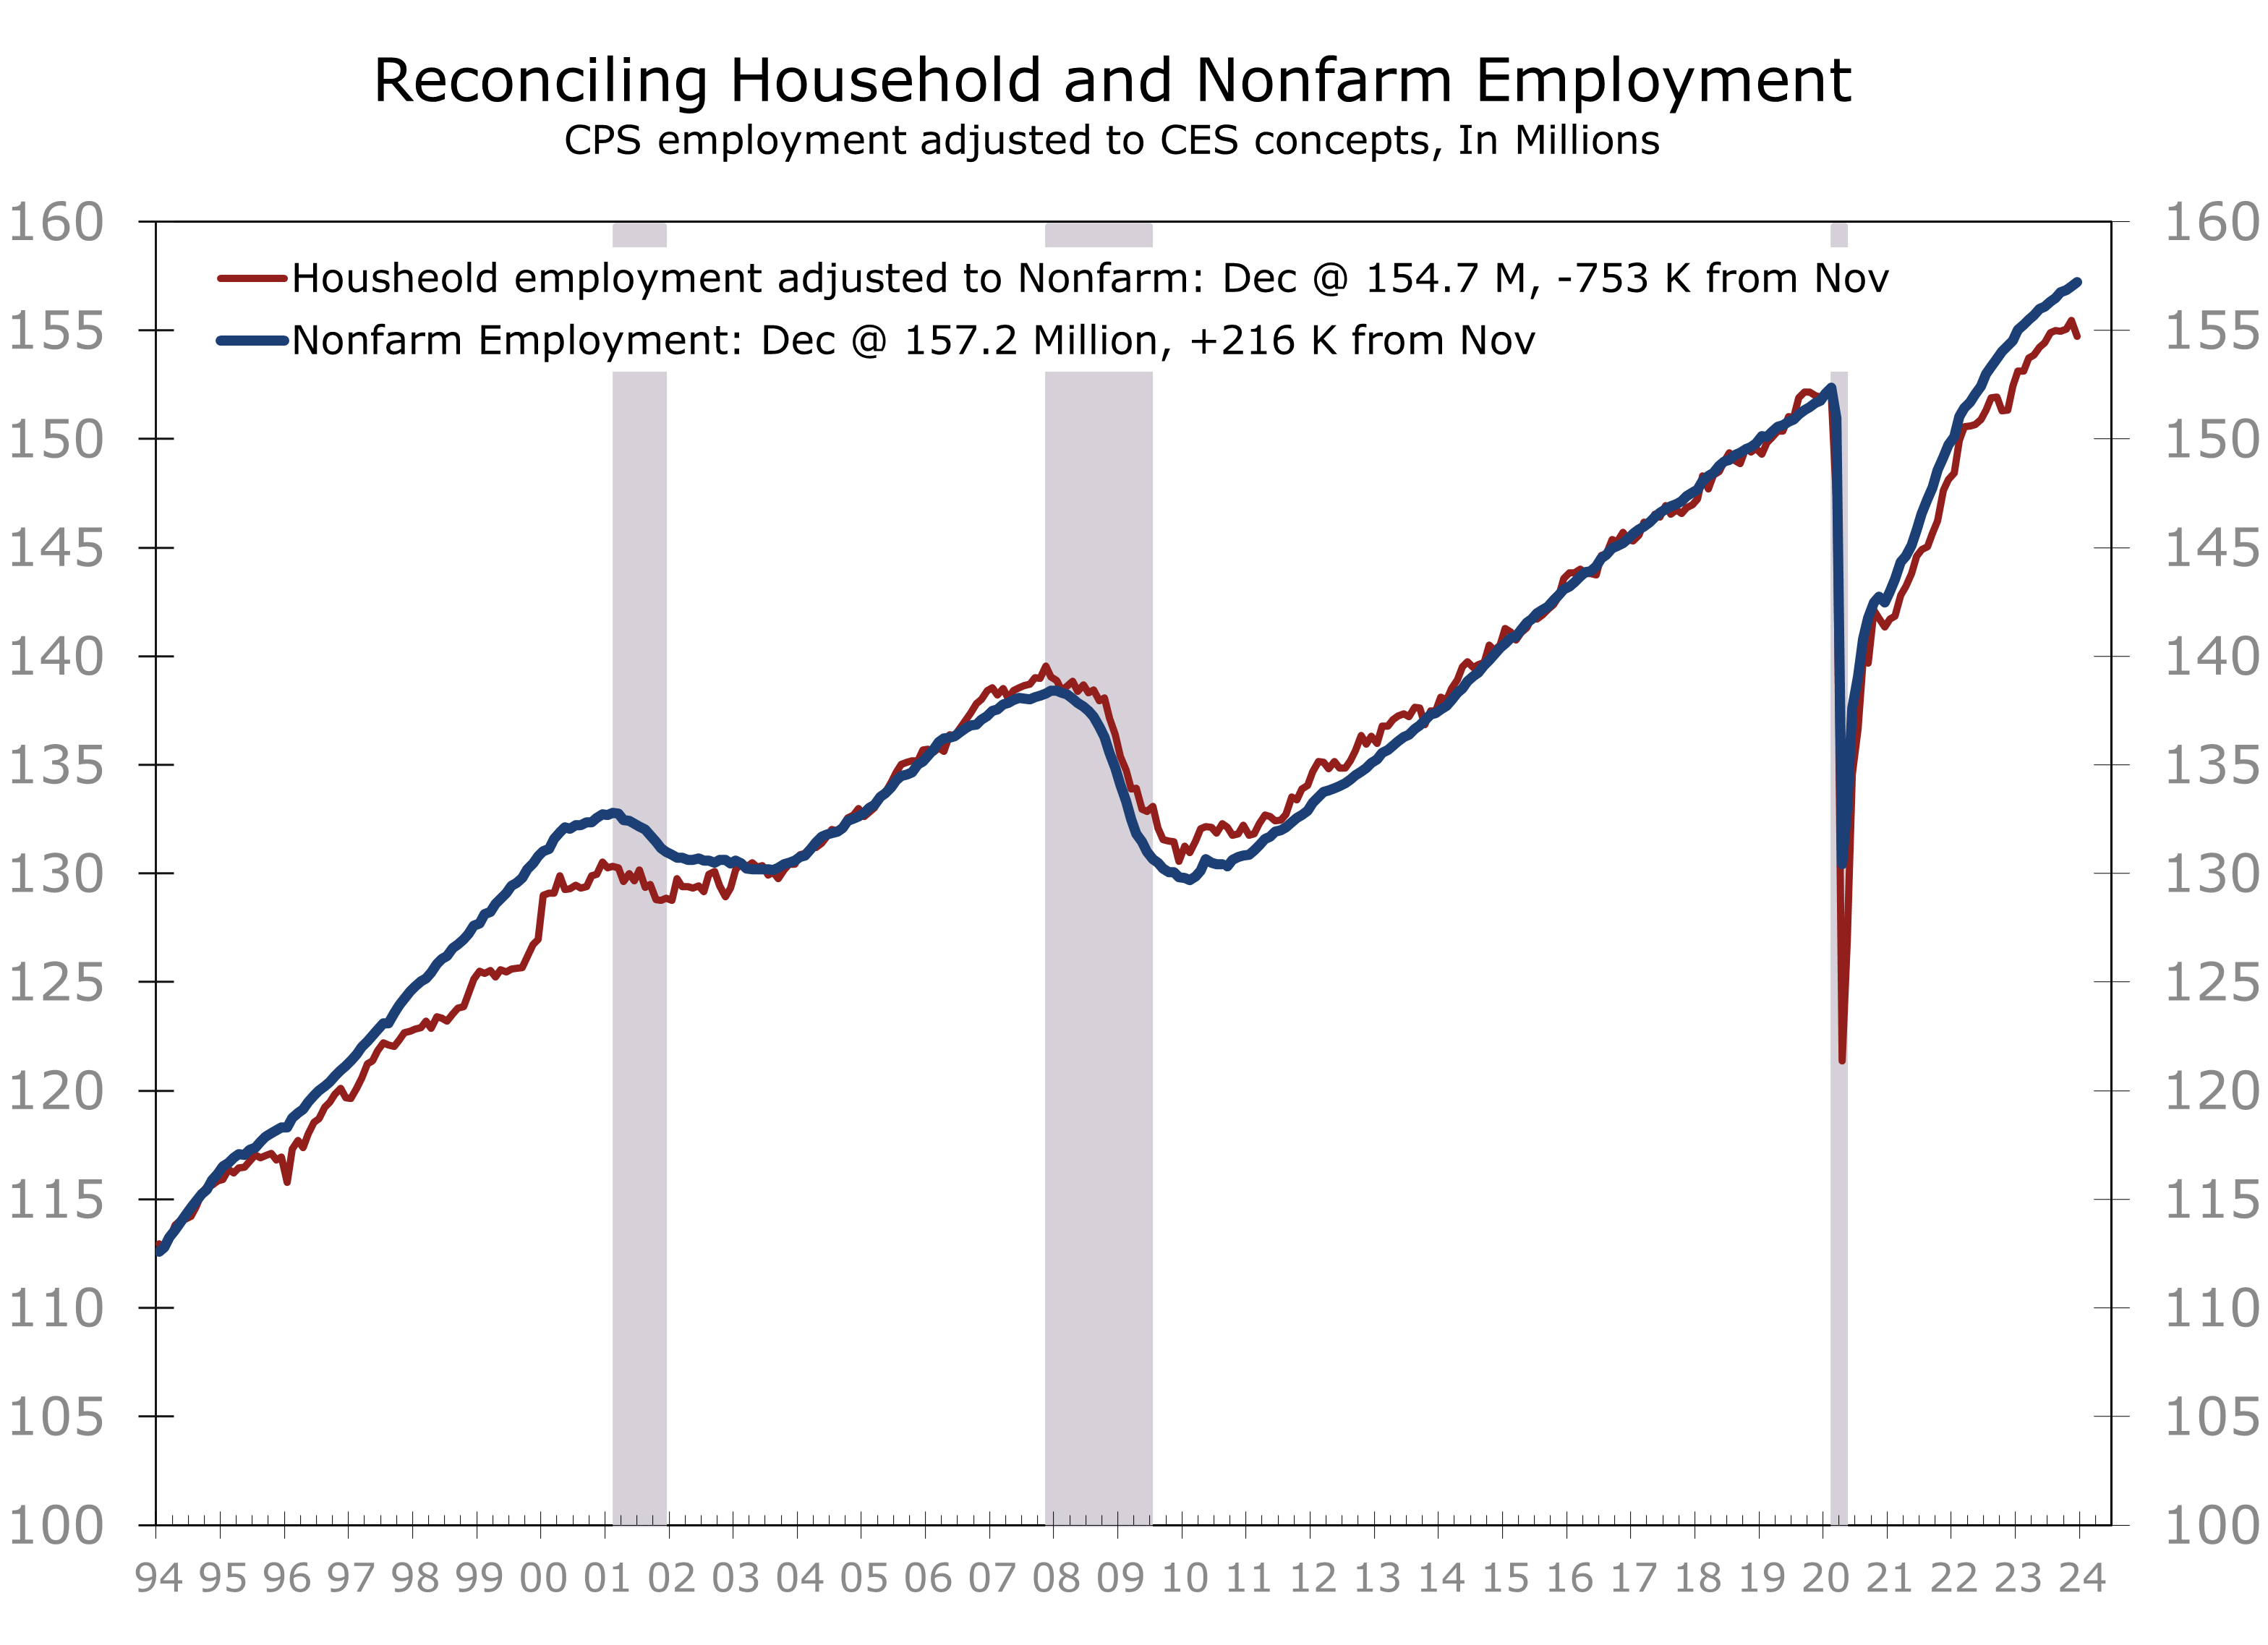
Nonfarm payrolls will likely be revised lower and more closely follow the household series.
The unemployment rate held steady at 3.7%, but the underlying data were unequivocally weak. Household employment dropped by 683k, offset by a 676k decline in the labor force. The labor force participation rate fell to 62.5%, reflecting declines in both men and women. Employment adjusted to the nonfarm employment methodology was even weaker, decreasing by 753k.
We expect nonfarm employment to be revised closer to the household series when the annual revisions are released next month. Despite the slower pace of job growth, we continue to believe the Fed will maintain a cautious approach to easing next year. We look for three quarter point cuts, most likely following the June, September, and December FOMC meetings.
Disclaimer: This publication has been prepared for informational purposes only and is not intended as a recommendation offer or solicitation with respect to the purchase or sale of any security or other financial product nor does it constitute investment advice.
Make Way for the Iowa Caucuses
The Iowa Caucuses Explained
- Caucus Process: Iowa Republicans kick off the primary season on January 15 with a caucus, involving small group meetings, speeches & debates among caucusgoers, and proportional delegate allocation.
- Top Issues: Economy (81%), Immigration & Border Security (80%), Government Spending/Deficit (72%) are top concerns for likely caucusgoers.
- Local Focus: Agricultural issues, particularly related to corn, eggs, pork, and ethanol, take center stage in the campaign.
- Policy Proposals: Candidates advocate relocating federal agencies to Iowa to amplify local voices in policymaking.
- Campaign Dynamics: Former President Trump highlights trade achievements, while Governor DeSantis emphasizes education reforms and school choice.
On January 15, the 2024 primary season will officially begin as Iowa Republicans meet to vote for their preferred presidential candidates. The caucus process works differently from a regular primary. Instead of casting a secret ballot, Iowa voters show up to their local caucusing precinct at 7 PM local time. The caucuses then begin with speeches from community leaders in favor of each candidate, after which attendees write the name of their preferred candidate on a blank piece of paper and give it to their precinct captain. After tallying the votes, the precinct captain reports the totals to the Iowa Republican Party. Delegates are then awarded proportionality to the candidates based on the totals. [1]
The economy is the most pressing issue to Iowa Republicans according to polling from the Des Moines Register. Eighty-one percent of likely caucusgoers feel the economy is extremely important. Immigration and border security is second at 80%, followed by government spending and the deficit at 72%. Other issues polled include the Israel-Hamas War, relations with China, and abortion restrictions. [2]
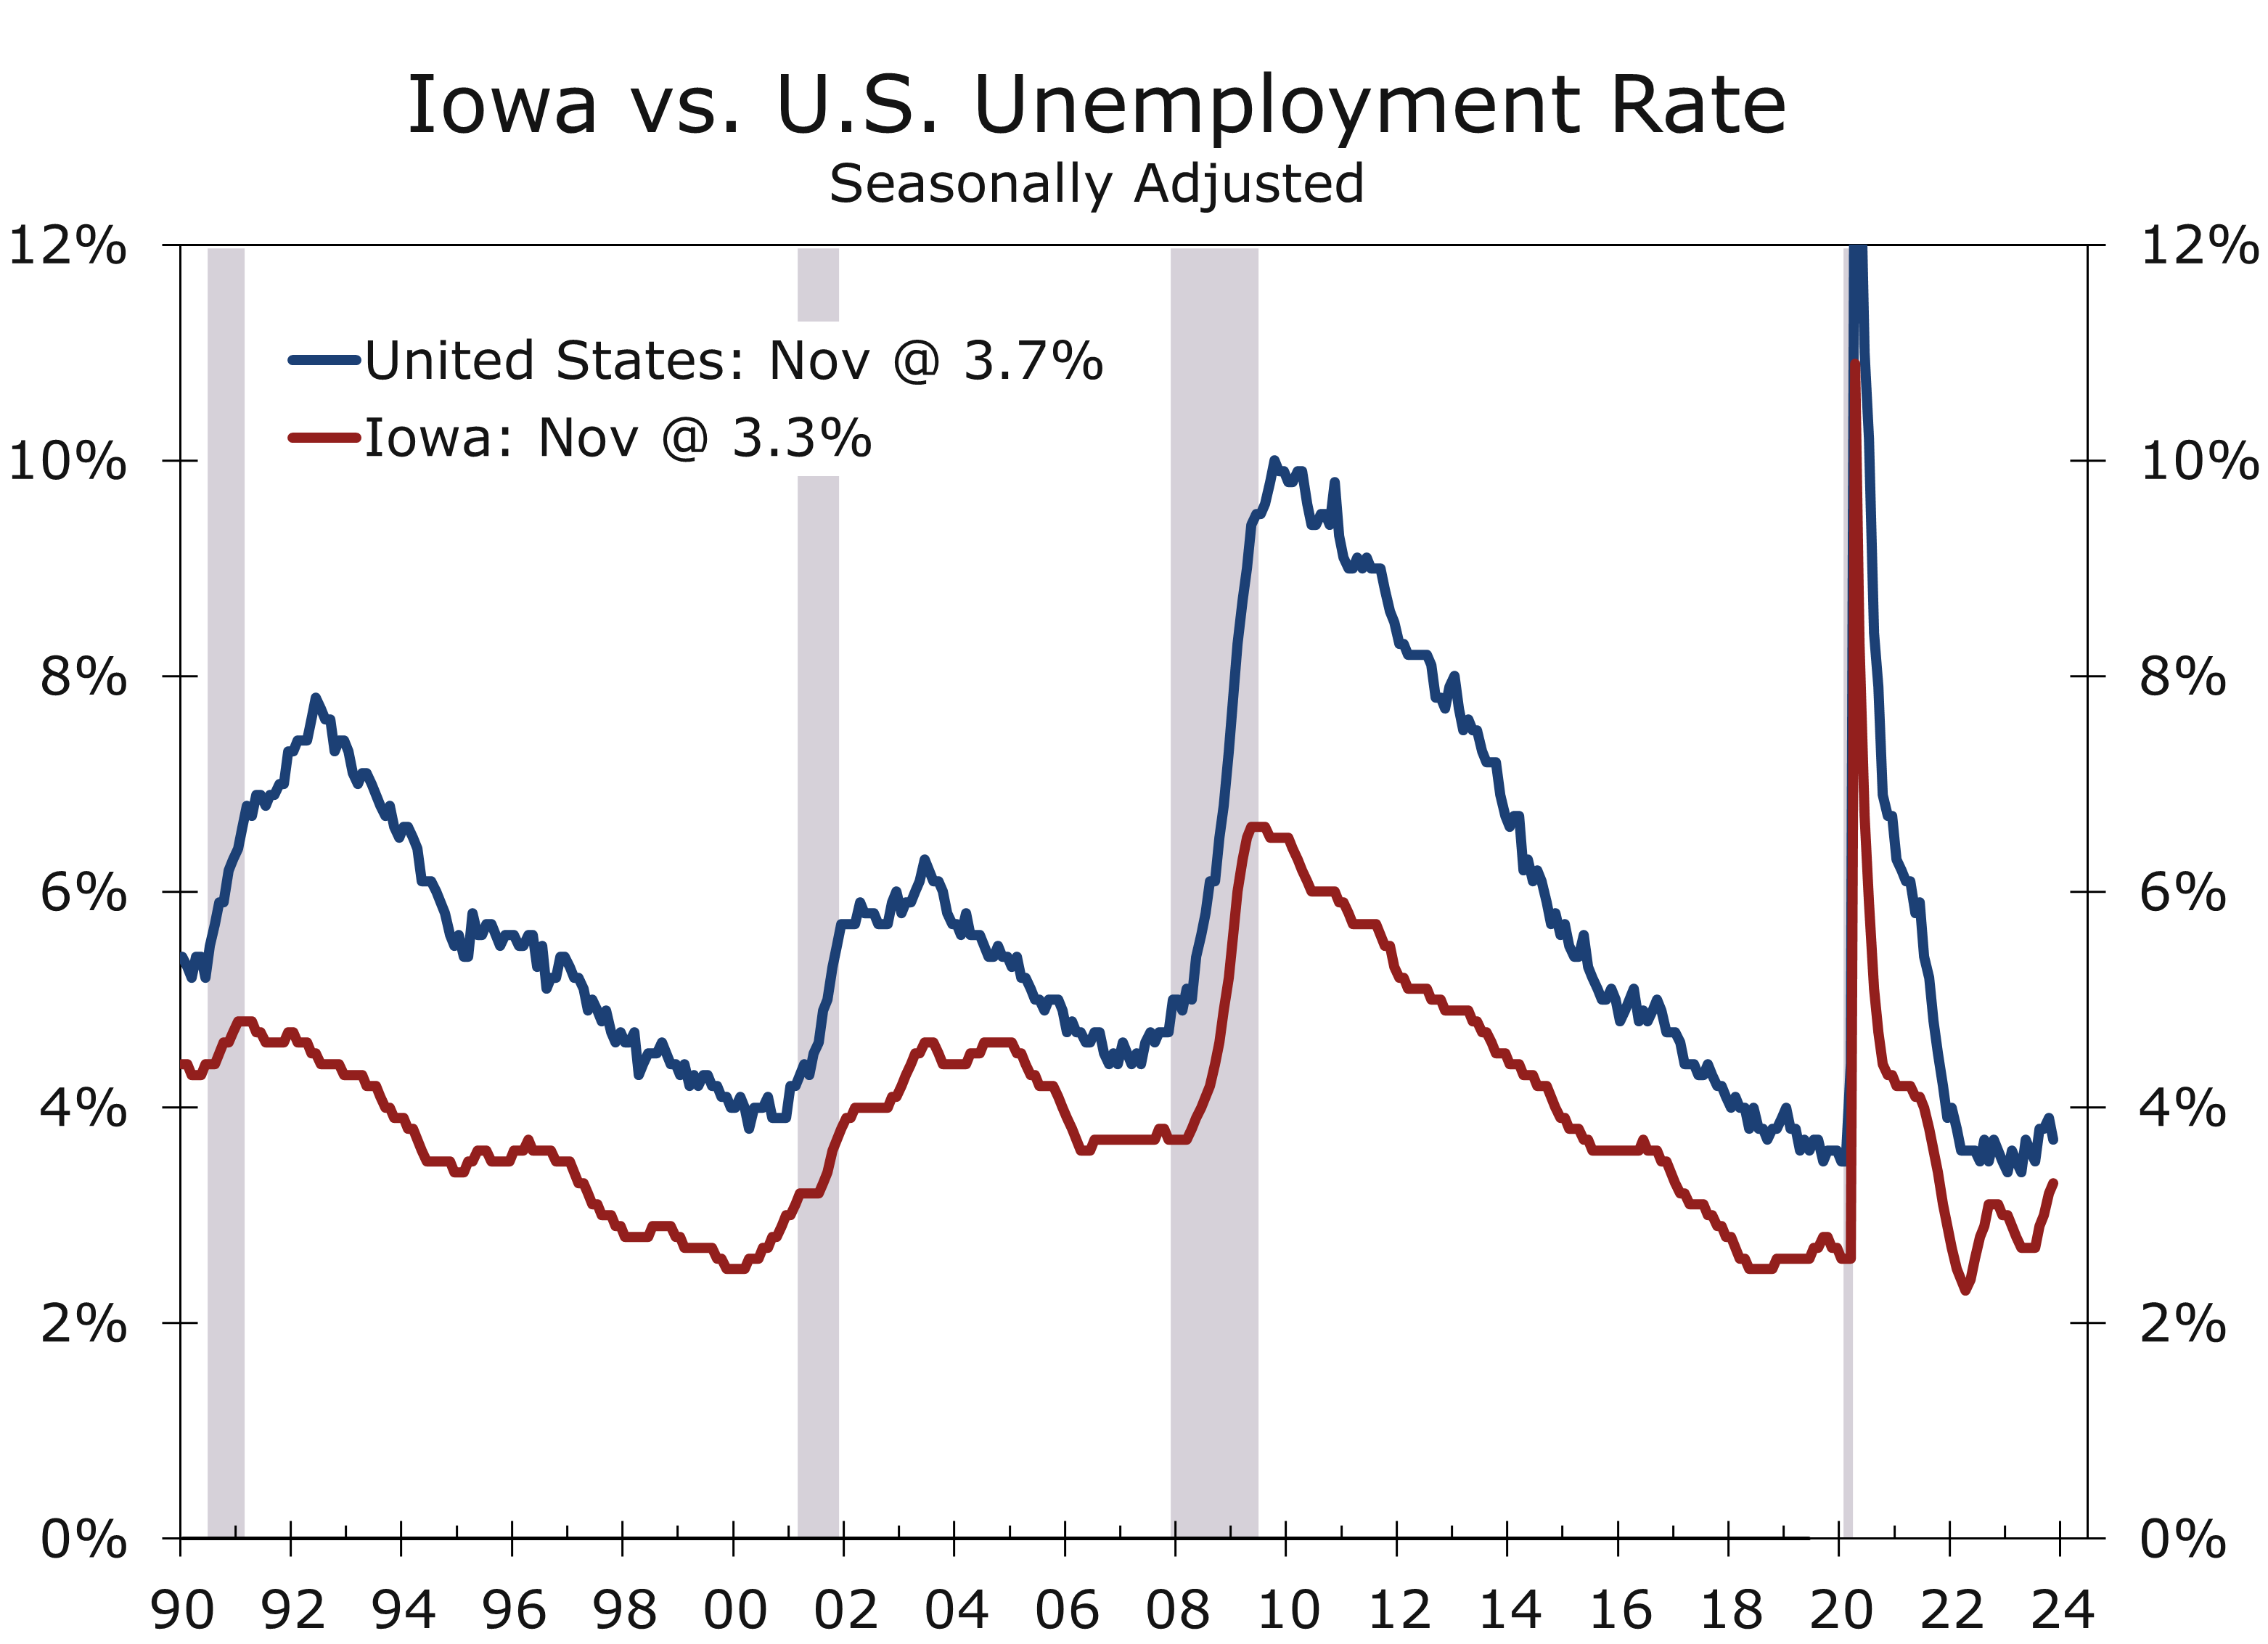
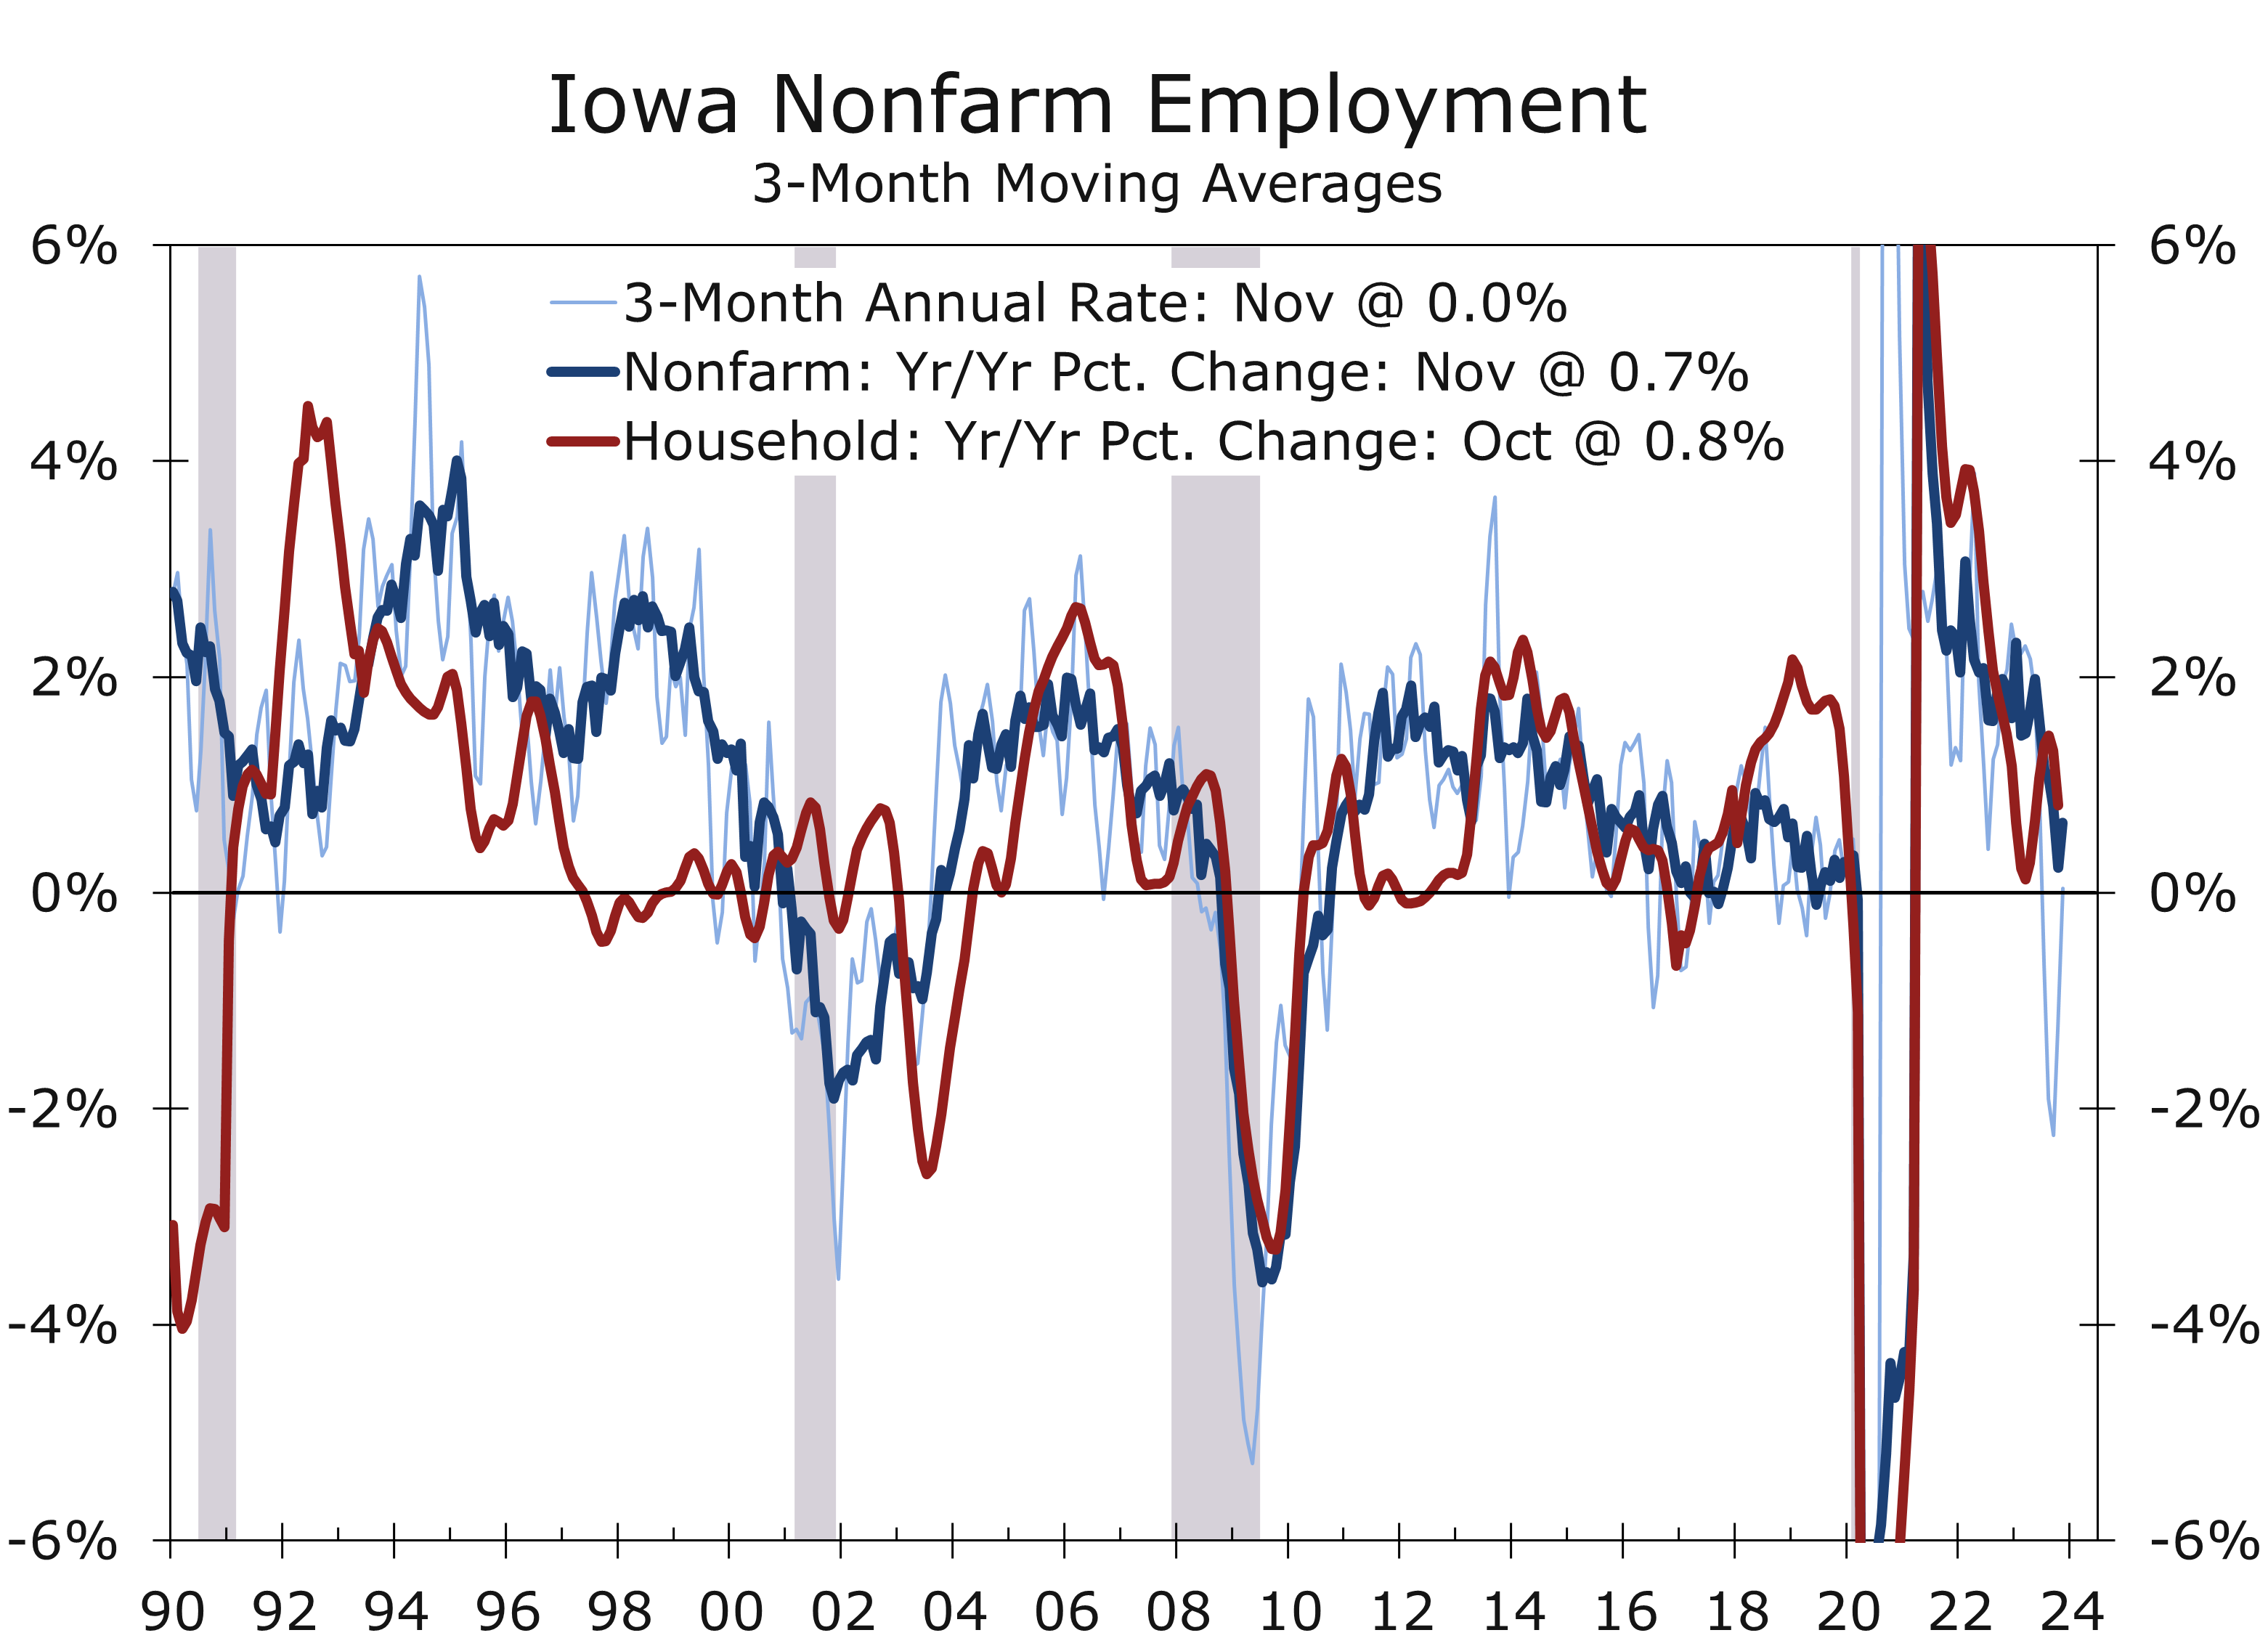
Iowa’s economy has slowed. Nonfarm employment dropped by 0.3% in the last seven months, resulting in a reduction of 5,100 jobs. The unemployment rate has risen slightly due to layoffs in the state’s large financial sector and a general slowdown in hiring.
[1] https://iowacapitaldispatch.com/2023/12/26/ethanol-is-a-key-iowa-issue-for-gop-presidential-contenders/
[2] https://iowacapitaldispatch.com/2023/12/26/ethanol-is-a-key-iowa-issue-for-gop-presidential-contenders/
While inflation has moderated, the higher cost of living remains a key concern. Housing costs have risen dramatically since the pandemic, with home prices rising 30% since the first quarter of 2021. Personal income surged when the stimulus checks were sent out in early 2021 but is up just 3.3% since then.
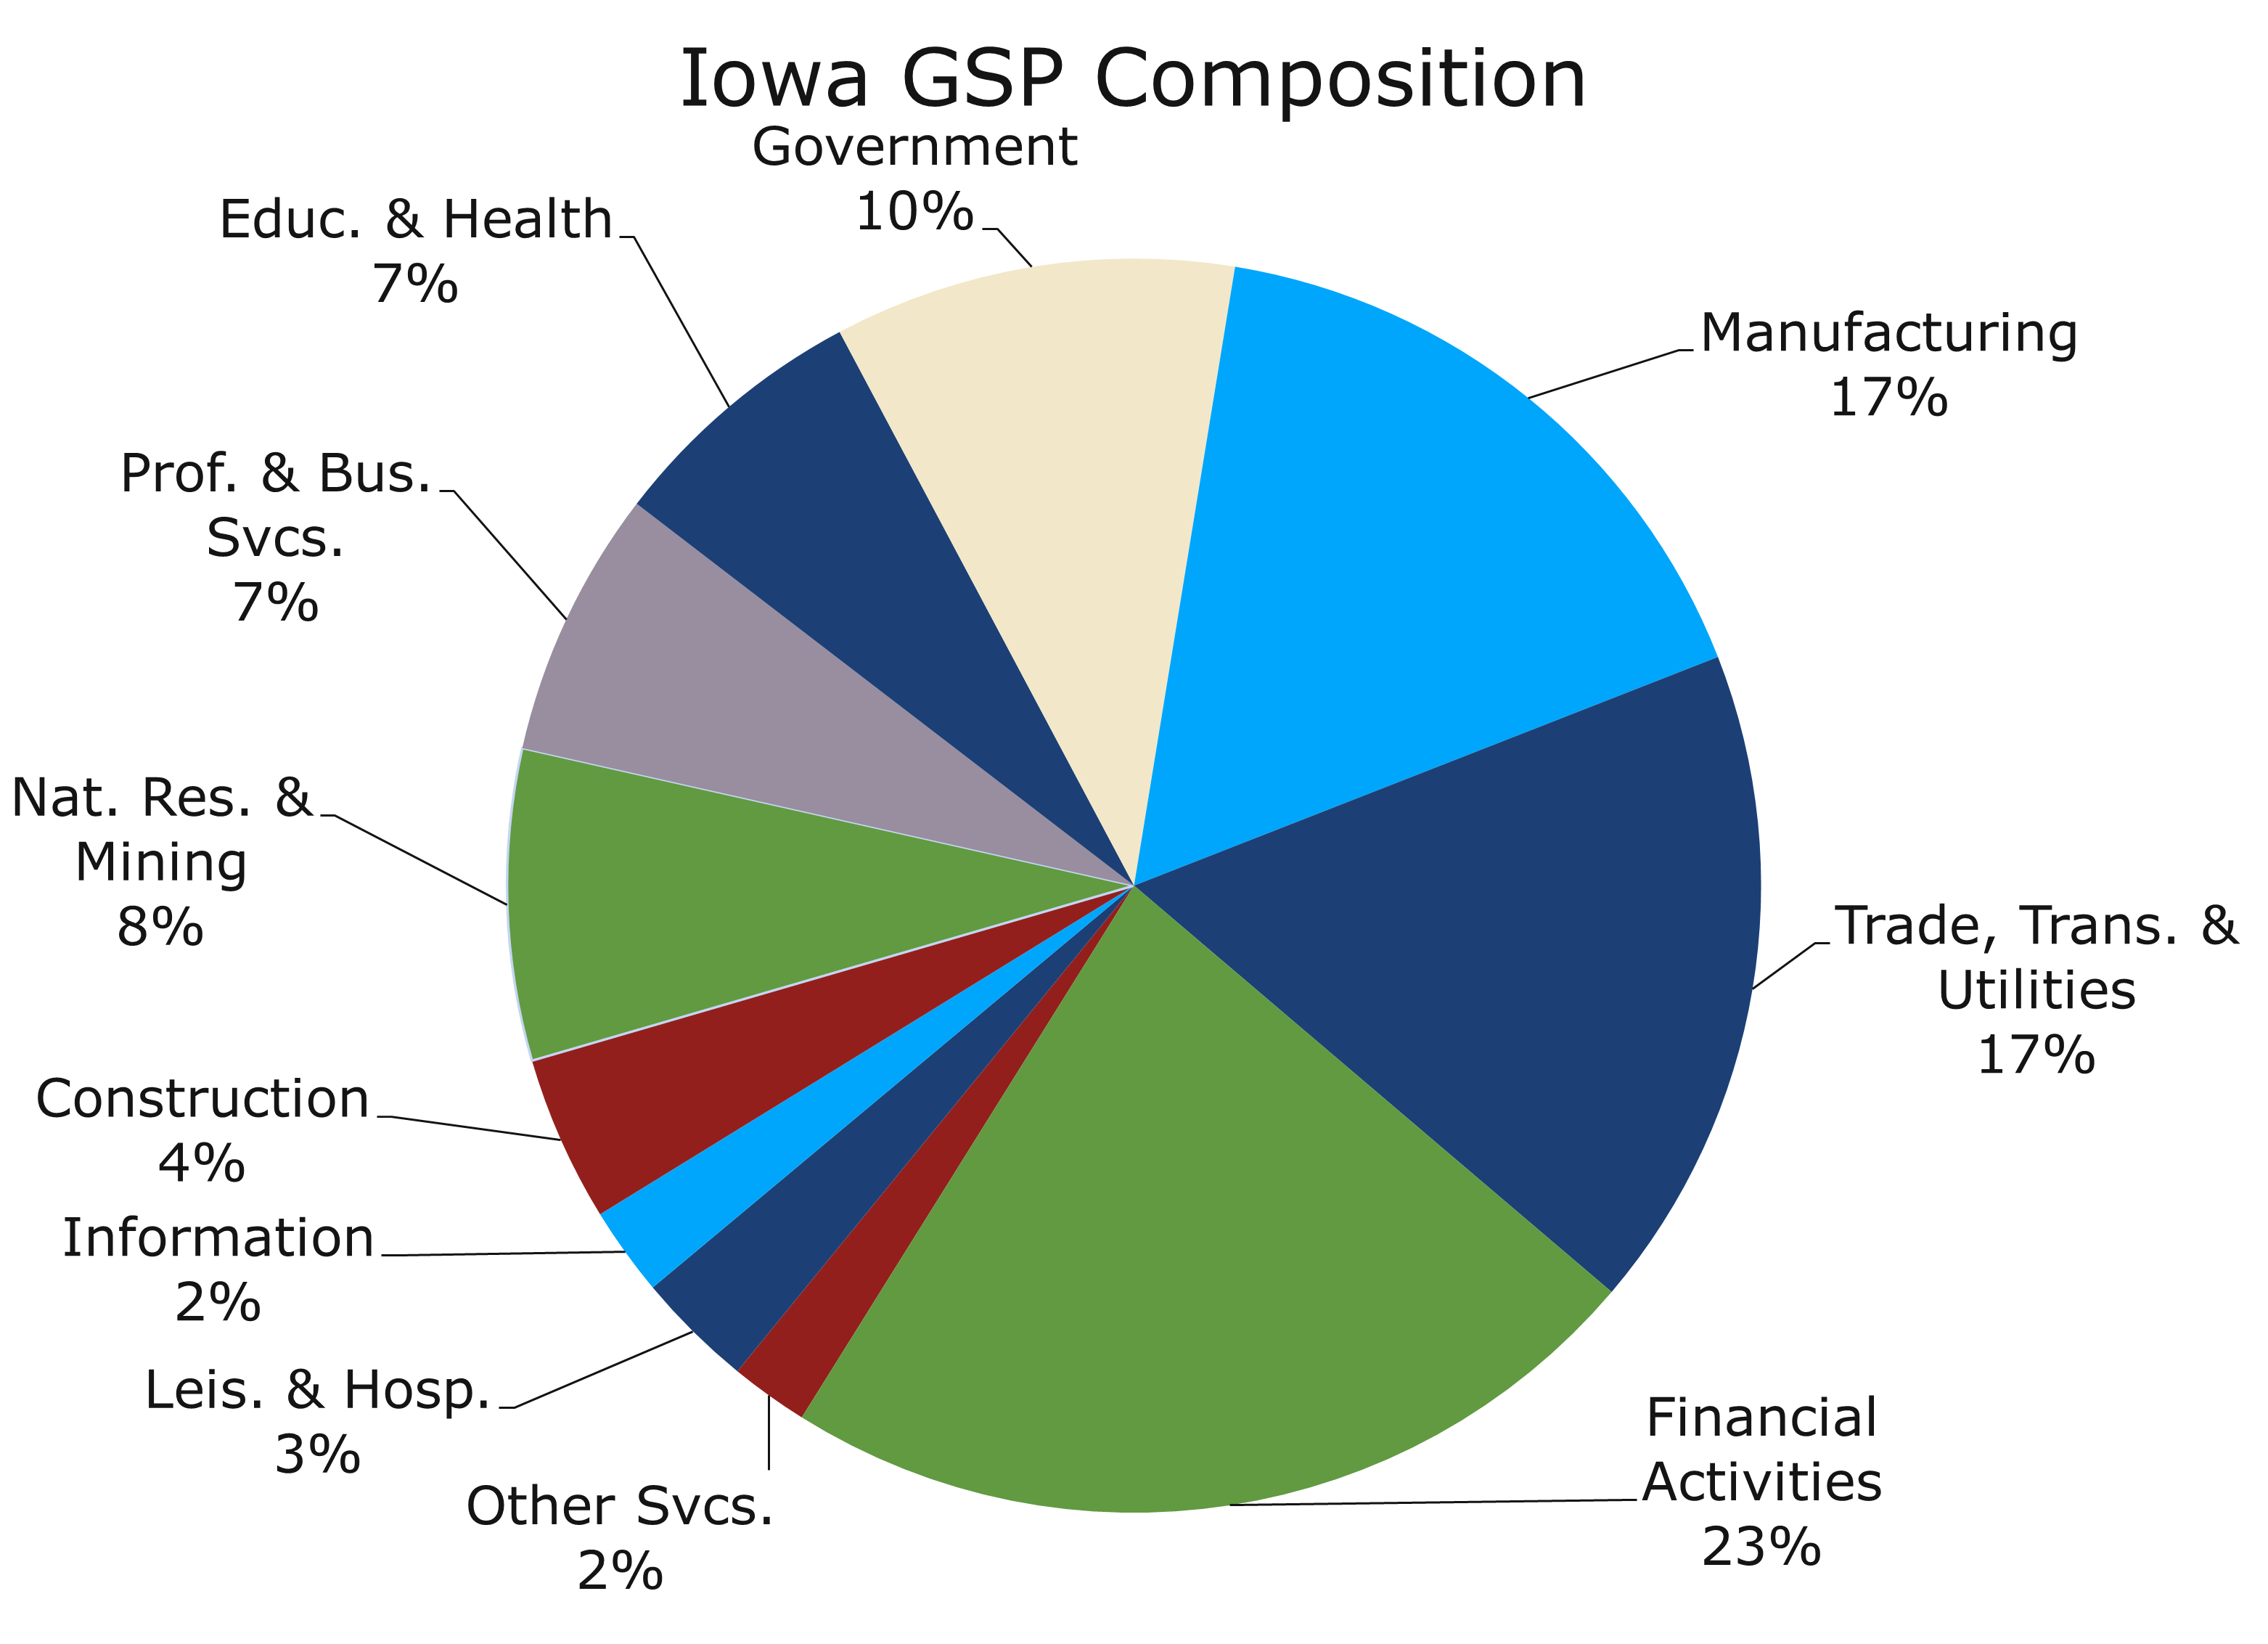
Iowa manufacturers have struggled of late. Business fixed investment has weakened in recent quarters, which is hurting capital goods producers. Exports have also struggled, reflecting weaker economies in Europe and China.
Even with inflation now moderating, the high cost of living remains a key concern.
Local concerns have been at the forefront of the campaign, particularly agricultural issues. Iowa is the nation’s largest producer of corn, eggs, and pork. Ethanol, a renewable fuel source from which most of Iowa’s corn is used to produce, has become a contentious source of debate during the campaign. Governor DeSantis came under attack from Trump for opposing the Renewable Fuel Standard during his time in Congress, a mandate that requires ethanol to be blended with gasoline. Vivek Ramaswamy was condemned by the Iowa Renewable Fuels Association for criticizing the use of eminent domain to build pipelines that would be used by ethanol producers.[1]
Candidates have made broader calls for deregulation and the removal of federal bureaucracy in the agricultural sector. Governor DeSantis pledged to move the U.S. Department of Agriculture to Iowa, an idea applauded by Iowa Governor Kim Reynolds. President Trump made a similar move in 2019 by relocating two Department of Agriculture research centers to Kansas City. Proponents of relocation laud the policy as giving local farming communities a larger voice in federal policymaking.[2]
[1] https://iowacapitaldispatch.com/2023/12/26/ethanol-is-a-key-iowa-issue-for-gop-presidential-contenders/
[2] https://www.desmoinesregister.com/story/news/elections/presidential/caucus/2023/12/02/gop-presidential-candidate-ron-desantis-completes-99-country-tour-during-iowa-caucuses-campaign/71718112007/
Former President Trump has invoked his record on trade during campaign rallies across the state. He discussed the reworking of NAFTA into the USMCA, and argued the benefits seen by farmers due to his tariffs on China.[1] Meanwhile, Governor DeSantis touted his own record in Florida. Education has been a key issue to the DeSantis campaign. Florida and Iowa have similar school voucher systems at the state level. DeSantis has campaigned alongside Governor Reynolds on the merits of school choice in their states while arguing for its implementation at the federal level.[2]
So how much do the Iowa Caucuses matter? The short answer is not as much as they used to. Over the past several election cycles, Iowa has provided a fairly poor predictor of overall success in the primaries. This holds especially true on the Republican side. Not since 2000 has a non-incumbent Republican won both the Iowa Caucuses and the presidential nomination.
[1] https://iowacapitaldispatch.com/2023/12/26/ethanol-is-a-key-iowa-issue-for-gop-presidential-contenders/
[2] https://www.kwqc.com/2023/12/19/iowa-gov-reynolds-joins-desantis-monday-bettendorf-campaign-event/
The Iowa Caucuses have been more predictive for the Democratic Party, predicting the nominee in 2004, 2008, and 2016. However, the famously chaotic 2020 Caucuses, in which President Biden placed fourth and no winner was declared for weeks, have led Democrats to question Iowa’s relevance. [1]
For the first time since 1972, Iowa will not be the first event on the DNC’s primary calendar. Instead, New Hampshire will be the first Democratic primary on January 23, followed by South Carolina on February 3. Iowa Democrats will forgo using a caucus altogether, although party leaders will still meet on the 15th. There will instead be an all-mail primary with the winner declared on Super Tuesday, March 5. [2]
The 2020 setback may have catalyzed change, but the DNC’s inevitable shifts were driven by Iowa’s electorate no longer mirroring the Democratic Party’s diverse support base. Iowa’s transformation from a swing state is evident, having leaned right since 2016. The 2022 midterms solidified Republican control over all congressional districts, the governorship, both senate seats, and nearly all statewide offices in Iowa, making it unlikely to be a competitive state in the 2024 general election. [3]
Despite Iowa’s flawed record, the caucuses hold significant importance for former President Trump’s primary challengers. Governor Ron DeSantis, especially, views the Iowa Caucuses as a critical test for his underwhelming campaign. Having toured all 99 Iowa counties with retail-style events, he garnered key endorsements from Governor Reynolds and numerous state legislators. [4] Governor DeSantis still faces one major hurdle, however; the polls. The governor continues to trail the former president in Iowa by over thirty percentage points, and endorsements have so far done little to reverse his fortunes. [5]
Governor DeSantis is no stranger to being the underdog. Polling underestimated him in both of his gubernatorial campaigns, something the governor often touts when questioned about the polls on the campaign trail. However, a thirty-point polling miss is virtually unheard of in national elections. There is also no guarantee the Florida governor will even finish second. Former South Carolina Governor Nikki Haley was enjoying solid upward momentum following multiple strong debate performances. She is now in a virtual tie with DeSantis in national polling and closing the gap in Iowa. A third-place finish in Iowa would likely spell the end of the DeSantis campaign, with Haley already well-ahead of the Florida governor in New Hampshire and South Carolina. [6]
Absent a significant surprise, the former president is highly likely to win the Iowa Caucuses. The margin of Trump’s expected win will be revealing. If the January 15 results align with the polls, the primaries could essentially be decided before they even officially begin. But a close second place finish from either DeSantis or Haley could keep the next few weeks interesting. If the GOP field hopes to have any chance of upending Trump, it will need to consolidate quickly. The second-place finisher in Iowa will likely emphasize this point after the caucuses, especially if the margin between them and Trump is closer than expected. Whether the other candidates heed such a call is another matter.
Of the remaining major candidates, only Governor DeSantis would probably drop out following a disappointing night in Iowa. Nikki Haley and Chris Christie are unlikely to call it quits before New Hampshire, the state where their poll numbers are strongest. Vivek Ramaswamy is somewhat of a wildcard. Though his chances of receiving the GOP nomination are near zero, he is a vocal disruptor who does not seem deterred by his low polling numbers. Indeed, his unwavering flattery of President Trump has led many to believe his run is not about winning rather than boosting his national profile for 2028 or beyond. In this case, he has an incentive to stay in the spotlight for as long as he can, after which he will most certainly endorse the former president.
[1] https://www.kwqc.com/2023/12/19/iowa-gov-reynolds-joins-desantis-monday-bettendorf-campaign-event/
[2] https://www.kwqc.com/2023/12/19/iowa-gov-reynolds-joins-desantis-monday-bettendorf-campaign-event/
[3] https://www.kwqc.com/2023/12/19/iowa-gov-reynolds-joins-desantis-monday-bettendorf-campaign-event/
[4] https://www.kwqc.com/2023/12/19/iowa-gov-reynolds-joins-desantis-monday-bettendorf-campaign-event/
[5] https://www.kwqc.com/2023/12/19/iowa-gov-reynolds-joins-desantis-monday-bettendorf-campaign-event/
[6] https://www.kwqc.com/2023/12/19/iowa-gov-reynolds-joins-desantis-monday-bettendorf-campaign-event/
Disclaimer: This publication has been prepared for informational purposes only and is not intended as a recommendation offer or solicitation with respect to the purchase or sale of any security or other financial product nor does it constitute investment advice.
The South Once Again Accounts for the Bulk of the Nation’s Population Growth
Migration Trends Continue to Favor the South
- The US added 1.6 million people in 2023, with population growing by 0.5% to reach 334,914,895 residents.
- Population trends are still returning to their pre-pandemic norms, with fewer deaths and more typical migration patterns.
- Although births remain well below their pre-pandemic norms, a substantial increase in immigration resulted in the nation’s largest population gain since 2018.
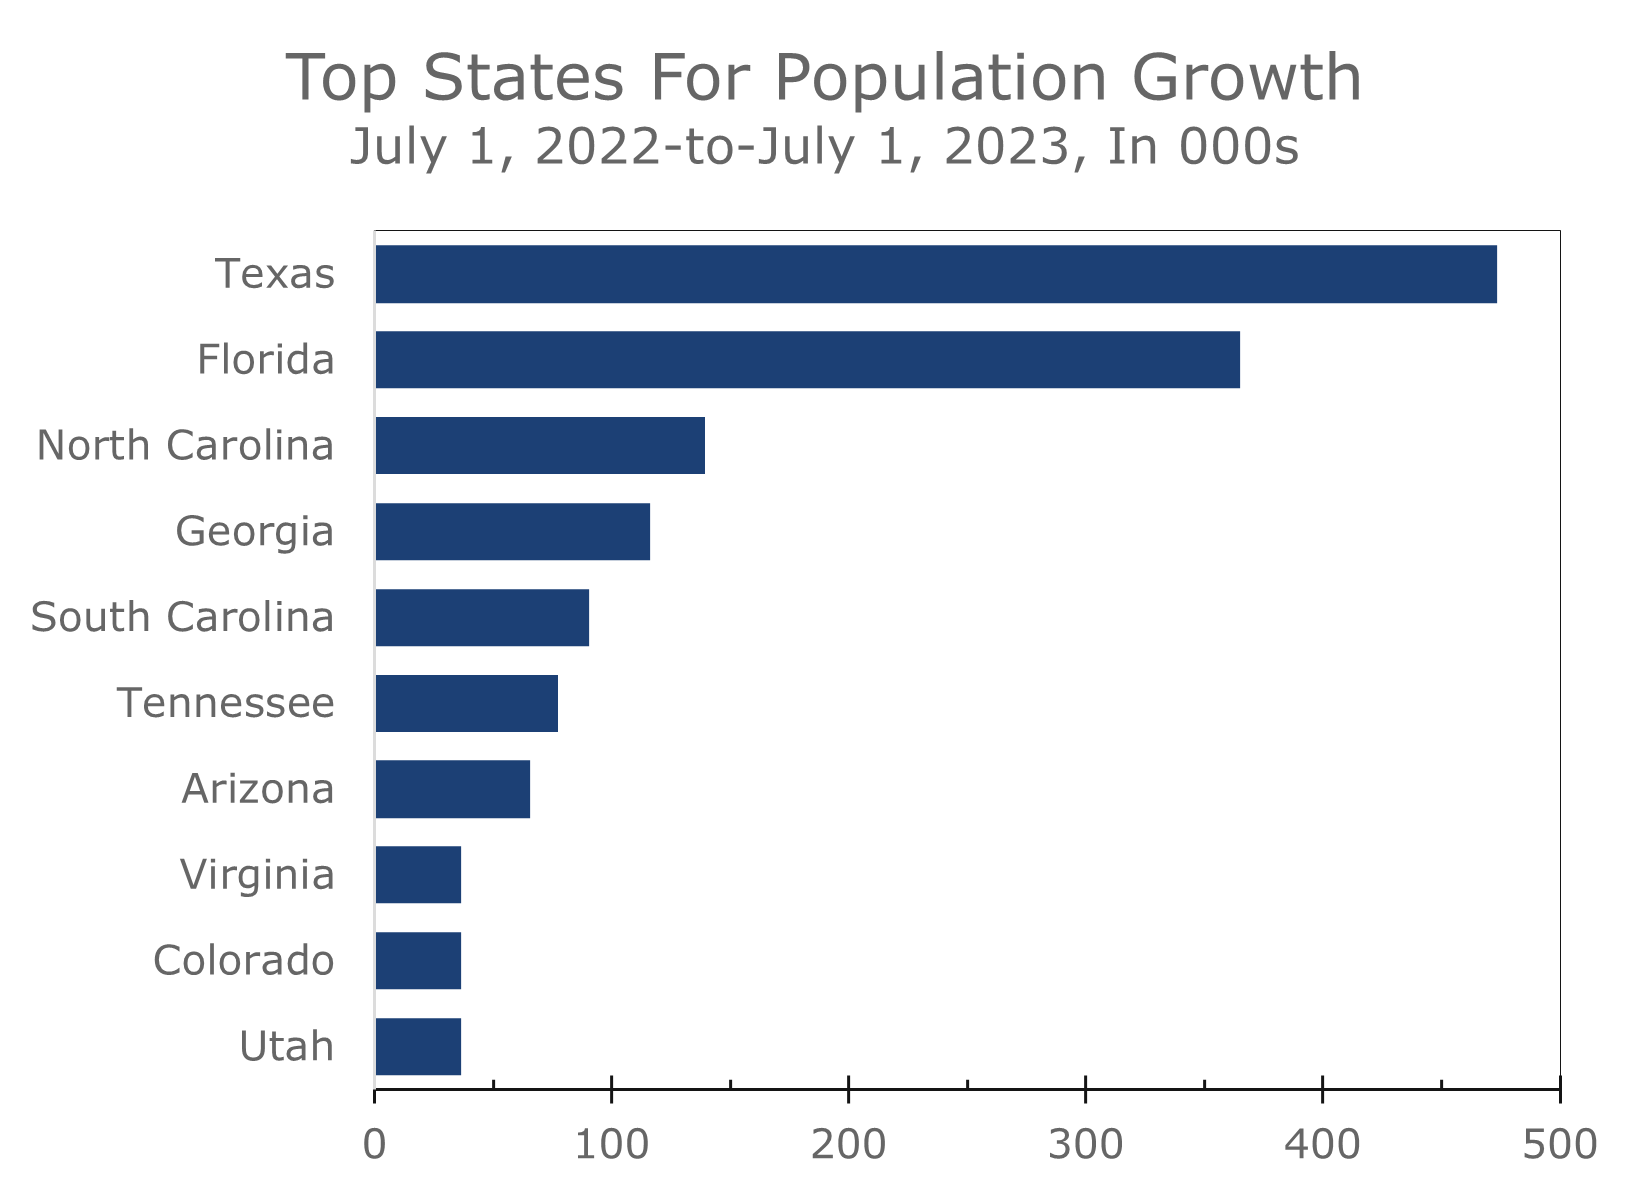
- The South continues to attract new residents both from other states and other nations, accounting for 87% of the nation’s population growth in 2023.
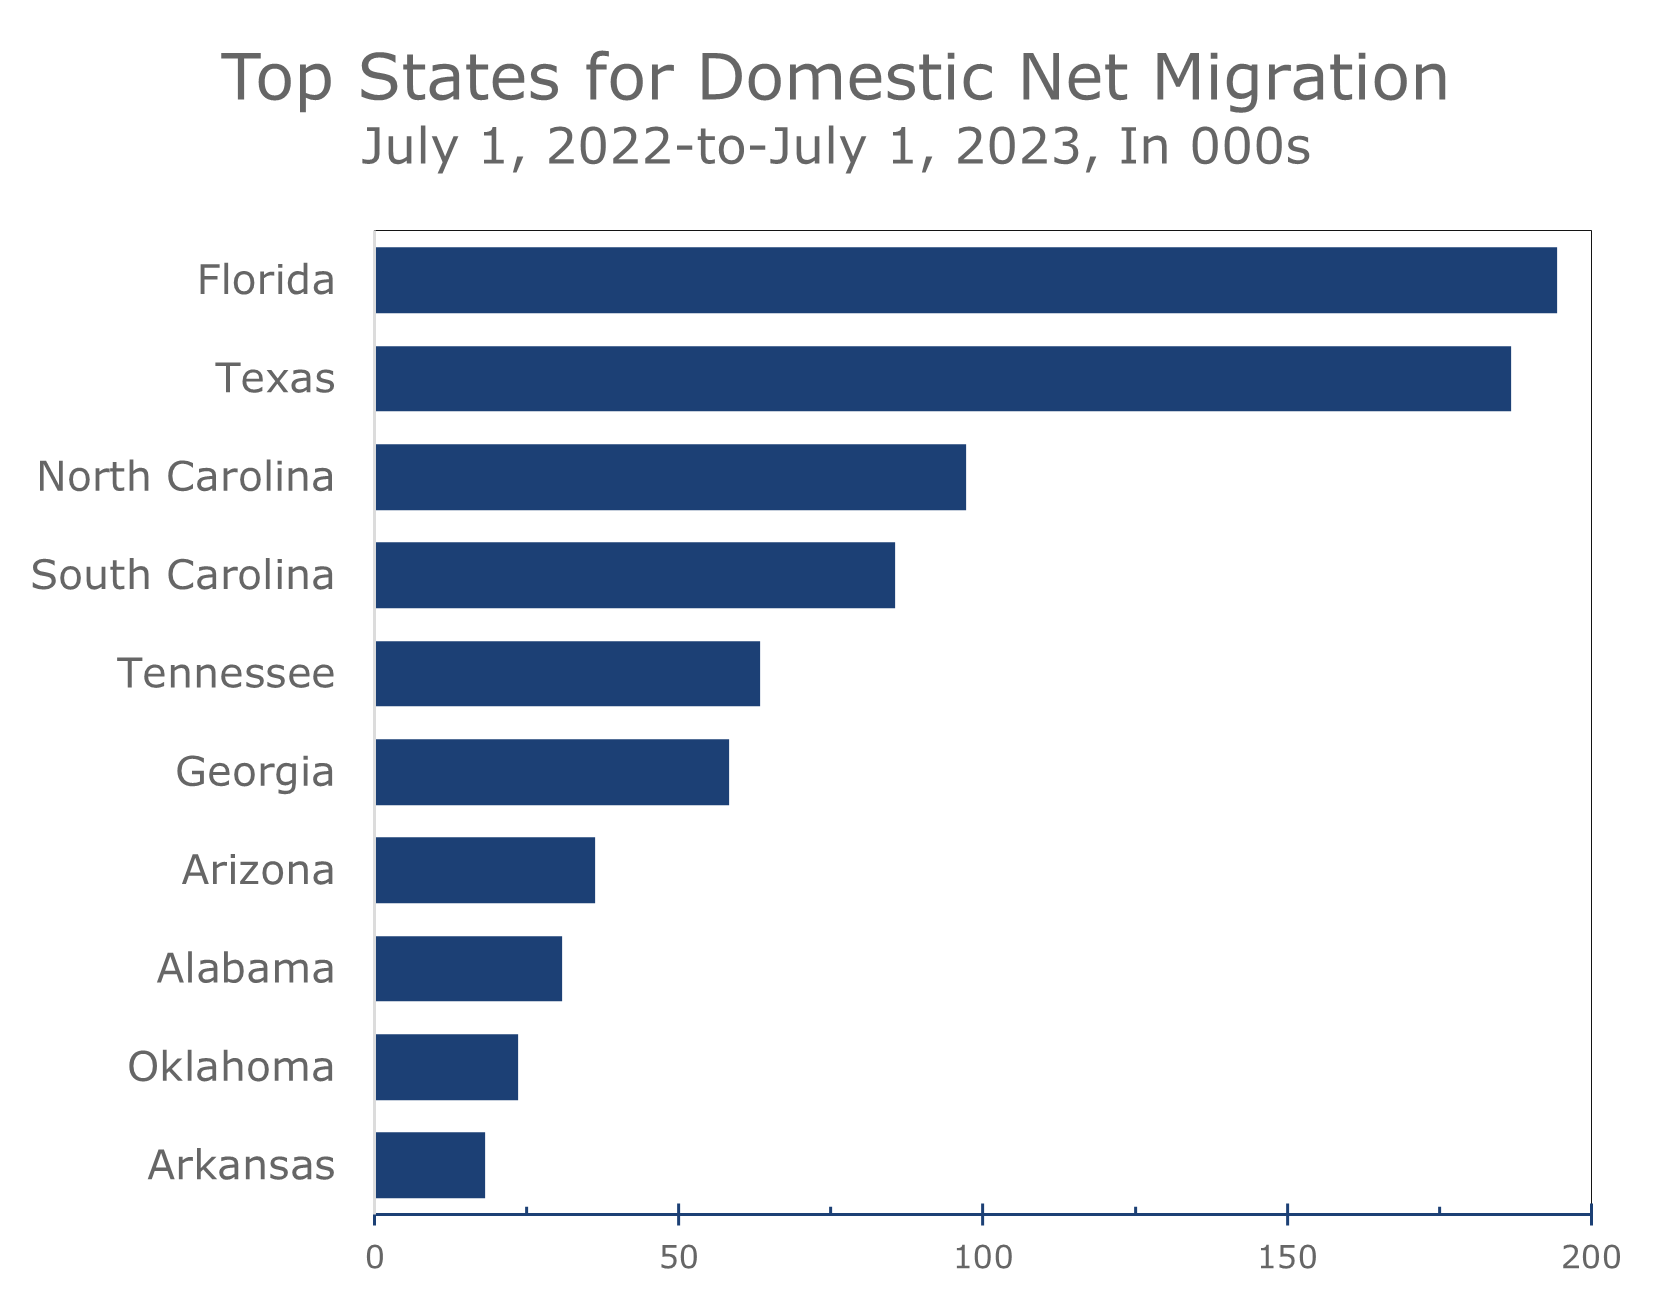
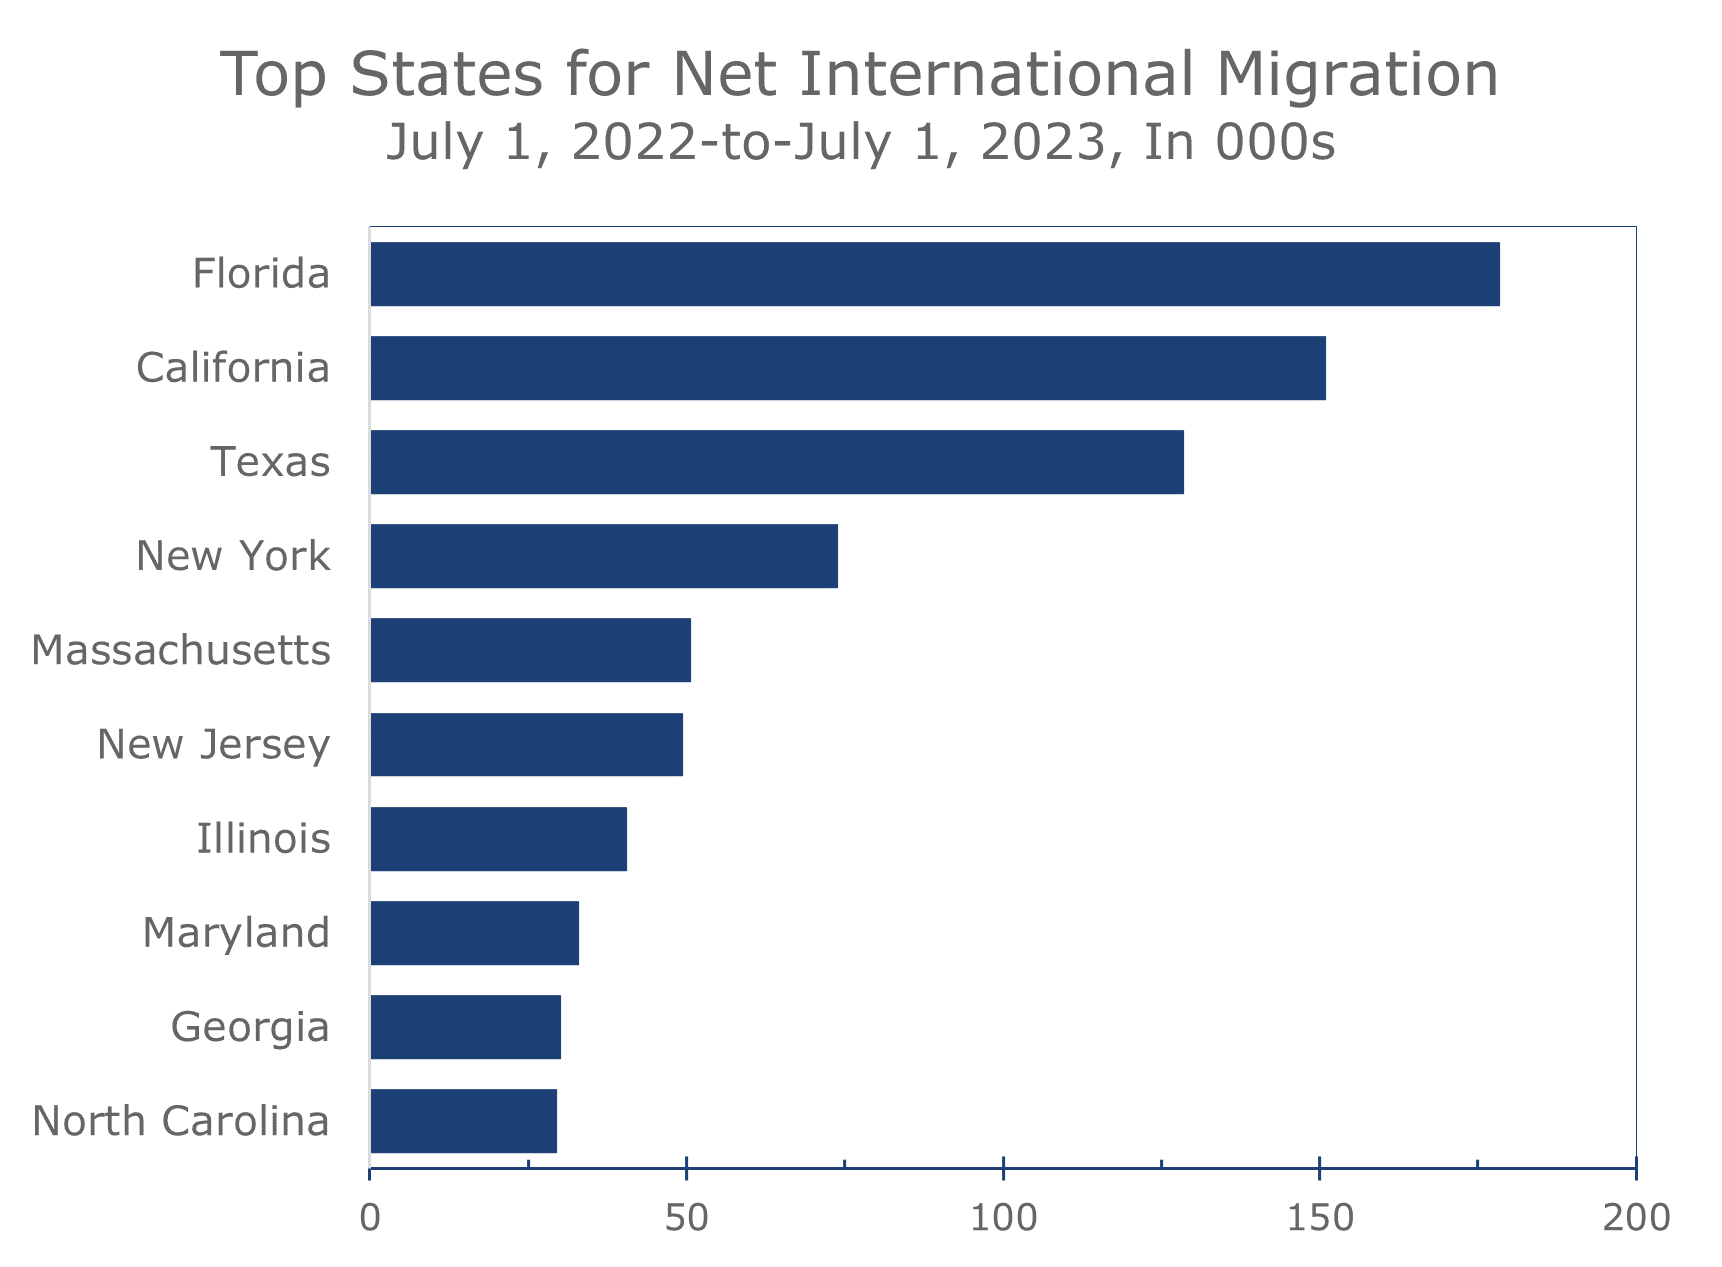
- Texas added the most new residents, while Florida led the nation in both domestic and international net migration.
- North Carolina added the third-largest influx of new residents, and South Carolina saw the fastest percentage increase.
- Immigration has re-emerged as the primary driver of US population growth. Internal migration is influenced by ongoing affordability concerns and a growing numbers of retiring baby boomers.
The latest Census population estimates show population growth continues to recover towards its pre-pandemic norms. The nation added 1.6 million new residents from July 1, 2022, to July 1, 2023. The 0.5% increase brought the US population up to 334,914,895. Immigration accounts for more than two-thirds of last year’s gain. Net natural increase added 504,495 residents, as deaths fell sharply.
Immigration is likely to remain the dominant source of growth, as births remain below their pre-pandemic pace. Deaths exceeded births in 19 states this past year, with Pennsylvania posting the largest ‘natural decrease’ with 11,079 more deaths than births. Pennsylvania also saw 24,825 more residents move away to other states than move in. That loss was offset by a net 25,766 increase in immigration from abroad.
Puerto Rico actually posted the largest net natural decrease in population, with 35,099 deaths far eclipsing 18,805 births. Immigration into Puerto Rico was only slightly positive, with a net 1,872 more residents moving into Puerto Rico than moving away, leaving the territory with a net loss of 14,422 residents.
Texas young and dynamic economy make it a top destination for businesses and residents.
Texas led the nation with the largest net natural increase, 158,253 more births than deaths, and ranked second in domestic migration and third in international immigration. Population growth once again led the nation, with Texas adding 473,453 residents. Most of that growth has been in the state’s largest metro areas.
Dallas attracts more companies relocating out of California than any other metro area, while Austin consistently ranks as one of the nation’s fastest growing metro areas and is one of the nation’s leading technology hubs. Growth is extending to outlying areas due to rising housing costs closer to Austin. Similarly, in historically affordable Houston, home prices have increased, pushing residents to more distant suburbs like Fulshear, Conroe and Pearland.
Rapid population growth is extending into distant suburbs and undiscovered areas.
Florida’s ongoing development is pushing affordability to historic lengths. The state continues to lead in net domestic migration, attracting a growing number of Baby Boomer retirees, particularly in Central and Southwest Florida. In 2022, Florida was home to seven of the nation’s ten fastest-growing metro areas, including Lakeland, Cape Coral-Fort Myers, North Port-Sarasota, and Punta Gorda. The Villages, situated approximately 55 miles north of Orlando, retained its status as the fastest-growing metro area in the country, boasting a population growth of 7.5%.
Jacksonville, in Northeast Florida, has experienced a significant increase in new residents since the pandemic. The metro area, with a younger demographic, reflects the dynamic economies of other rapidly growing Southeast metro areas. Jacksonville gained approximately 35,000 residents in 2022, with the fastest growth in St. Johns County to the South and Nassau County to the North.
Georgia ranked fourth in the nation for population growth, adding 116,077 residents. Fueled by robust net natural growth and gains in domestic and international migration, most newcomers favored the Atlanta metro area, especially in the northern fringes of the 29-county MSA. Georgia’s coastal areas are also experiencing rapid growth, led by the Port of Savannah and a continuous influx of new industry.
North Carolina gained the third-largest number of new residents (+133,088), and South Carolina added the fifth-largest number (+89,368). This influx includes prime-working age residents in larger metro areas, mainly along the Piedmont, and a significant number of retirees along the coast. Charlotte, Raleigh, Greenville, and Charleston consistently rank among the fastest-growing large metro areas, with Myrtle Beach is the nation’s second-fastest-growing MSA.
The affordability migration is fueling growth in the Carolinas and Eastern Tennessee.
South Carolina was the fastest-growing state in 2023 (+1.7%), driven primarily by retirees seeking more affordable alternatives to relocating to Florida. This trend is also benefiting Tennessee, especially Nashville, Knoxville, and eastern Tennessee.
Disclaimer: This publication has been prepared for informational purposes only and is not intended as a recommendation offer or solicitation with respect to the purchase or sale of any security or other financial product nor does it constitute investment advice.
Five Key Questions About the 2024 Economy
What’s Ahead for the U.S. Economy in 2024?
- This past year has seen the economy move away from the brink of recession, even with many of the most hallowed business cycle indicators flashing warning signals. While the risks of recession have subsided, there remains considerable uncertainty about the economic outlook. Our final report for 2023 looks at five critical questions for the New Year.
- The first question is just how soft the soft landing will be. We expect real GDP to contract slightly during the first half of 2023 but do not believe the National Bureau of Economic Research (NBER) will label this decline a recession, as long as nonfarm employment continues to increase.
- Question 2: Will inflation decelerate enough for the Federal Reserve to cut the federal funds rate? We suspect that it will and look for the Fed to cut the federal funds rate by one-quarter point three times this year beginning in late June, with another cut in September and a third cut following the November election.
- Question 3: Have long-term interest rates peaked for this cycle? We believe they have but look for the 10-Year Treasury retrace about half the drop seen since the October CPI report.
- Question 4: Will the drop in long-term interest rates provide a significant boost to home sales. Partially Yes. New home construction will certainly get a boost, but with job growth slowing even fewer existing homeowners will put their homes on the market, limiting sales in the much larger resale market.
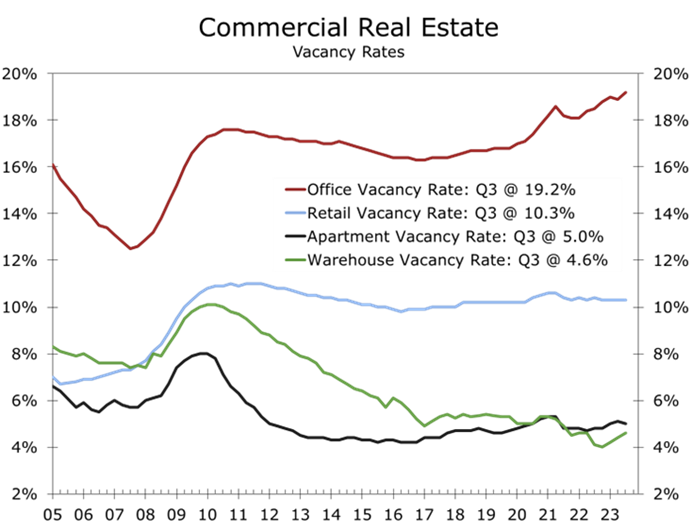
- Question 5: Will Commercial Real Estate deteriorate to the point that it leads to a significant credit crunch? The credit crunch already underway will linger and intensify but credit conditions will not tighten so much that they stifle overall economic growth.
The case for a soft landing was bolstered this past month, which saw the majority of economic data continue to come in on the soft side, while inflation continued to moderate. Fears of recession have subsided, and a majority of economists now see a soft landing in 2024, with real GDP growth slowing below its long-term potential and inflation continuing to moderate towards the Fed’s 2% inflation target. We continue to expect the economy to slow to a pace just a touch softer than a traditional soft landing and expect to see real GDP decline slightly during the first half of 2024. Nonfarm employment is expected to continue to edge higher, however, which we believe will prevent the NBER from labeling this slowdown as an outright recession.
Interpreting the ups and downs of economic activity is unusually difficult today because of the enormous swings in economic activity brought about by the pandemic and the policy response to it. Direct and indirect stimulus to households, businesses, and state and local governments helped fuel a massive economic recovery when the economy reopened following the pandemic. The resurgence led to widespread shortages, which helped drive inflation sharply higher and eventually caused the Fed to aggressively hike interest rates. This past year has seen conditions begin to normalize, as higher interest rates and tightening credit conditions have slowed capital spending, home sales, and consumer spending for big-ticket items. Spending remained strong enough for real GDP to grow 3.0% this past year, a point driven home by the third quarter’s blistering 5.2% annual rate growth.
The abrupt swings in economic activity and inflation led to unusually large moves in some of the most hallowed economic indicators. The yield curve, which captures the difference between short-term and long-term interest rates, inverted 17 months ago and has remained inverted. Inverted yield curves have preceded every recession in the modern era, with a typical lag of between 12 and 18 months. In addition, the Leading Economic Indicators index has declined for nineteen consecutive months and is currently 7.6% below its year ago level. The LEI has never fallen this far or for this long without the economy falling into recession.
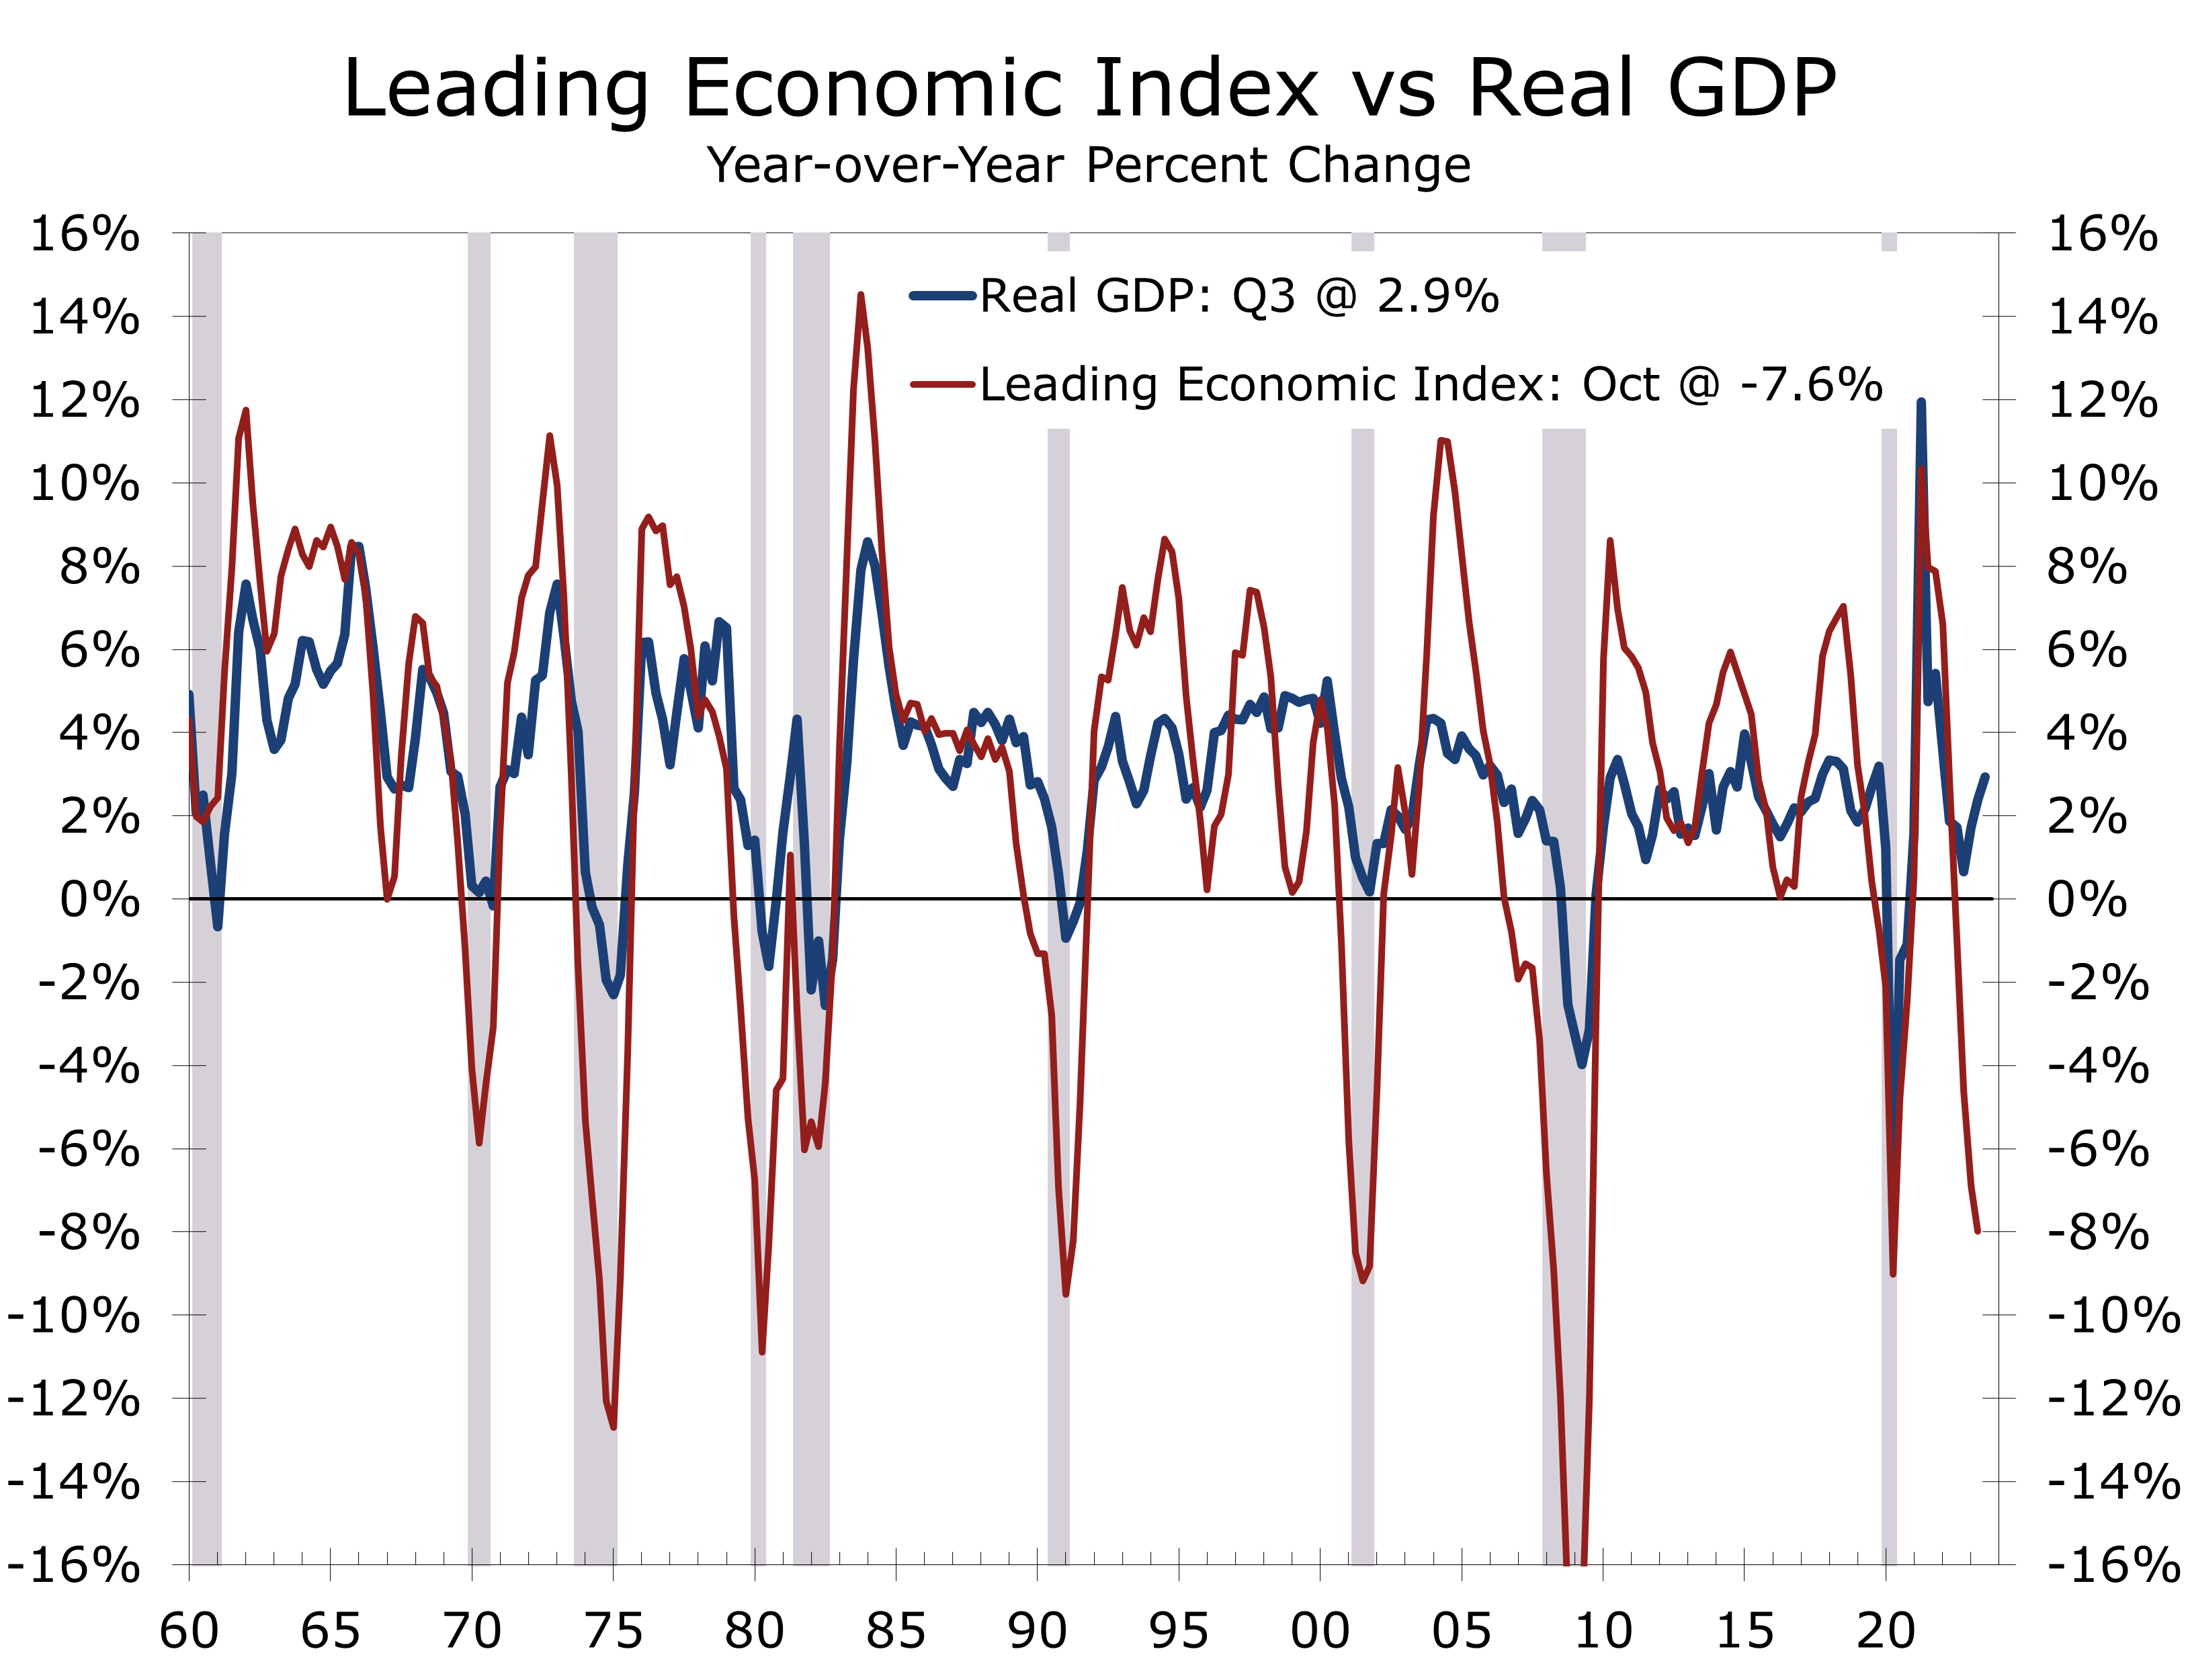
Given the plunge in the LEI, it is surprising that talk of recession has subsided as much as it has. One reason the slide in the LEI may not be as telling as it has been the past is that several components of the LEI have been distorted by the huge swings in economic activity surrounding the pandemic and its aftermath. The surge in consumer purchases of big-ticket items including furniture, appliances and home electronics led to a surge in factory orders for consumer goods and output, which lifted the LEI as the economy emerged from the pandemic. Goods purchases weakened this past year, however, as spending shifted toward services and experiences. Services and experiences spending does not directly feed into the LEI, so this summer’s strength did not stem the slide in this key indicator.
History suggests it would be a mistake to dismiss the risks of recession associated with the slide in the LEI and the inverted yield curve. Afterall, banks borrow short-term and lend long-term, which means an inverted yield curve, with short-term rates higher than long-term rates, means bank lending is less profitable. This means banks will lend more selectively and take fewer risks, which slows credit growth and economic growth more broadly.
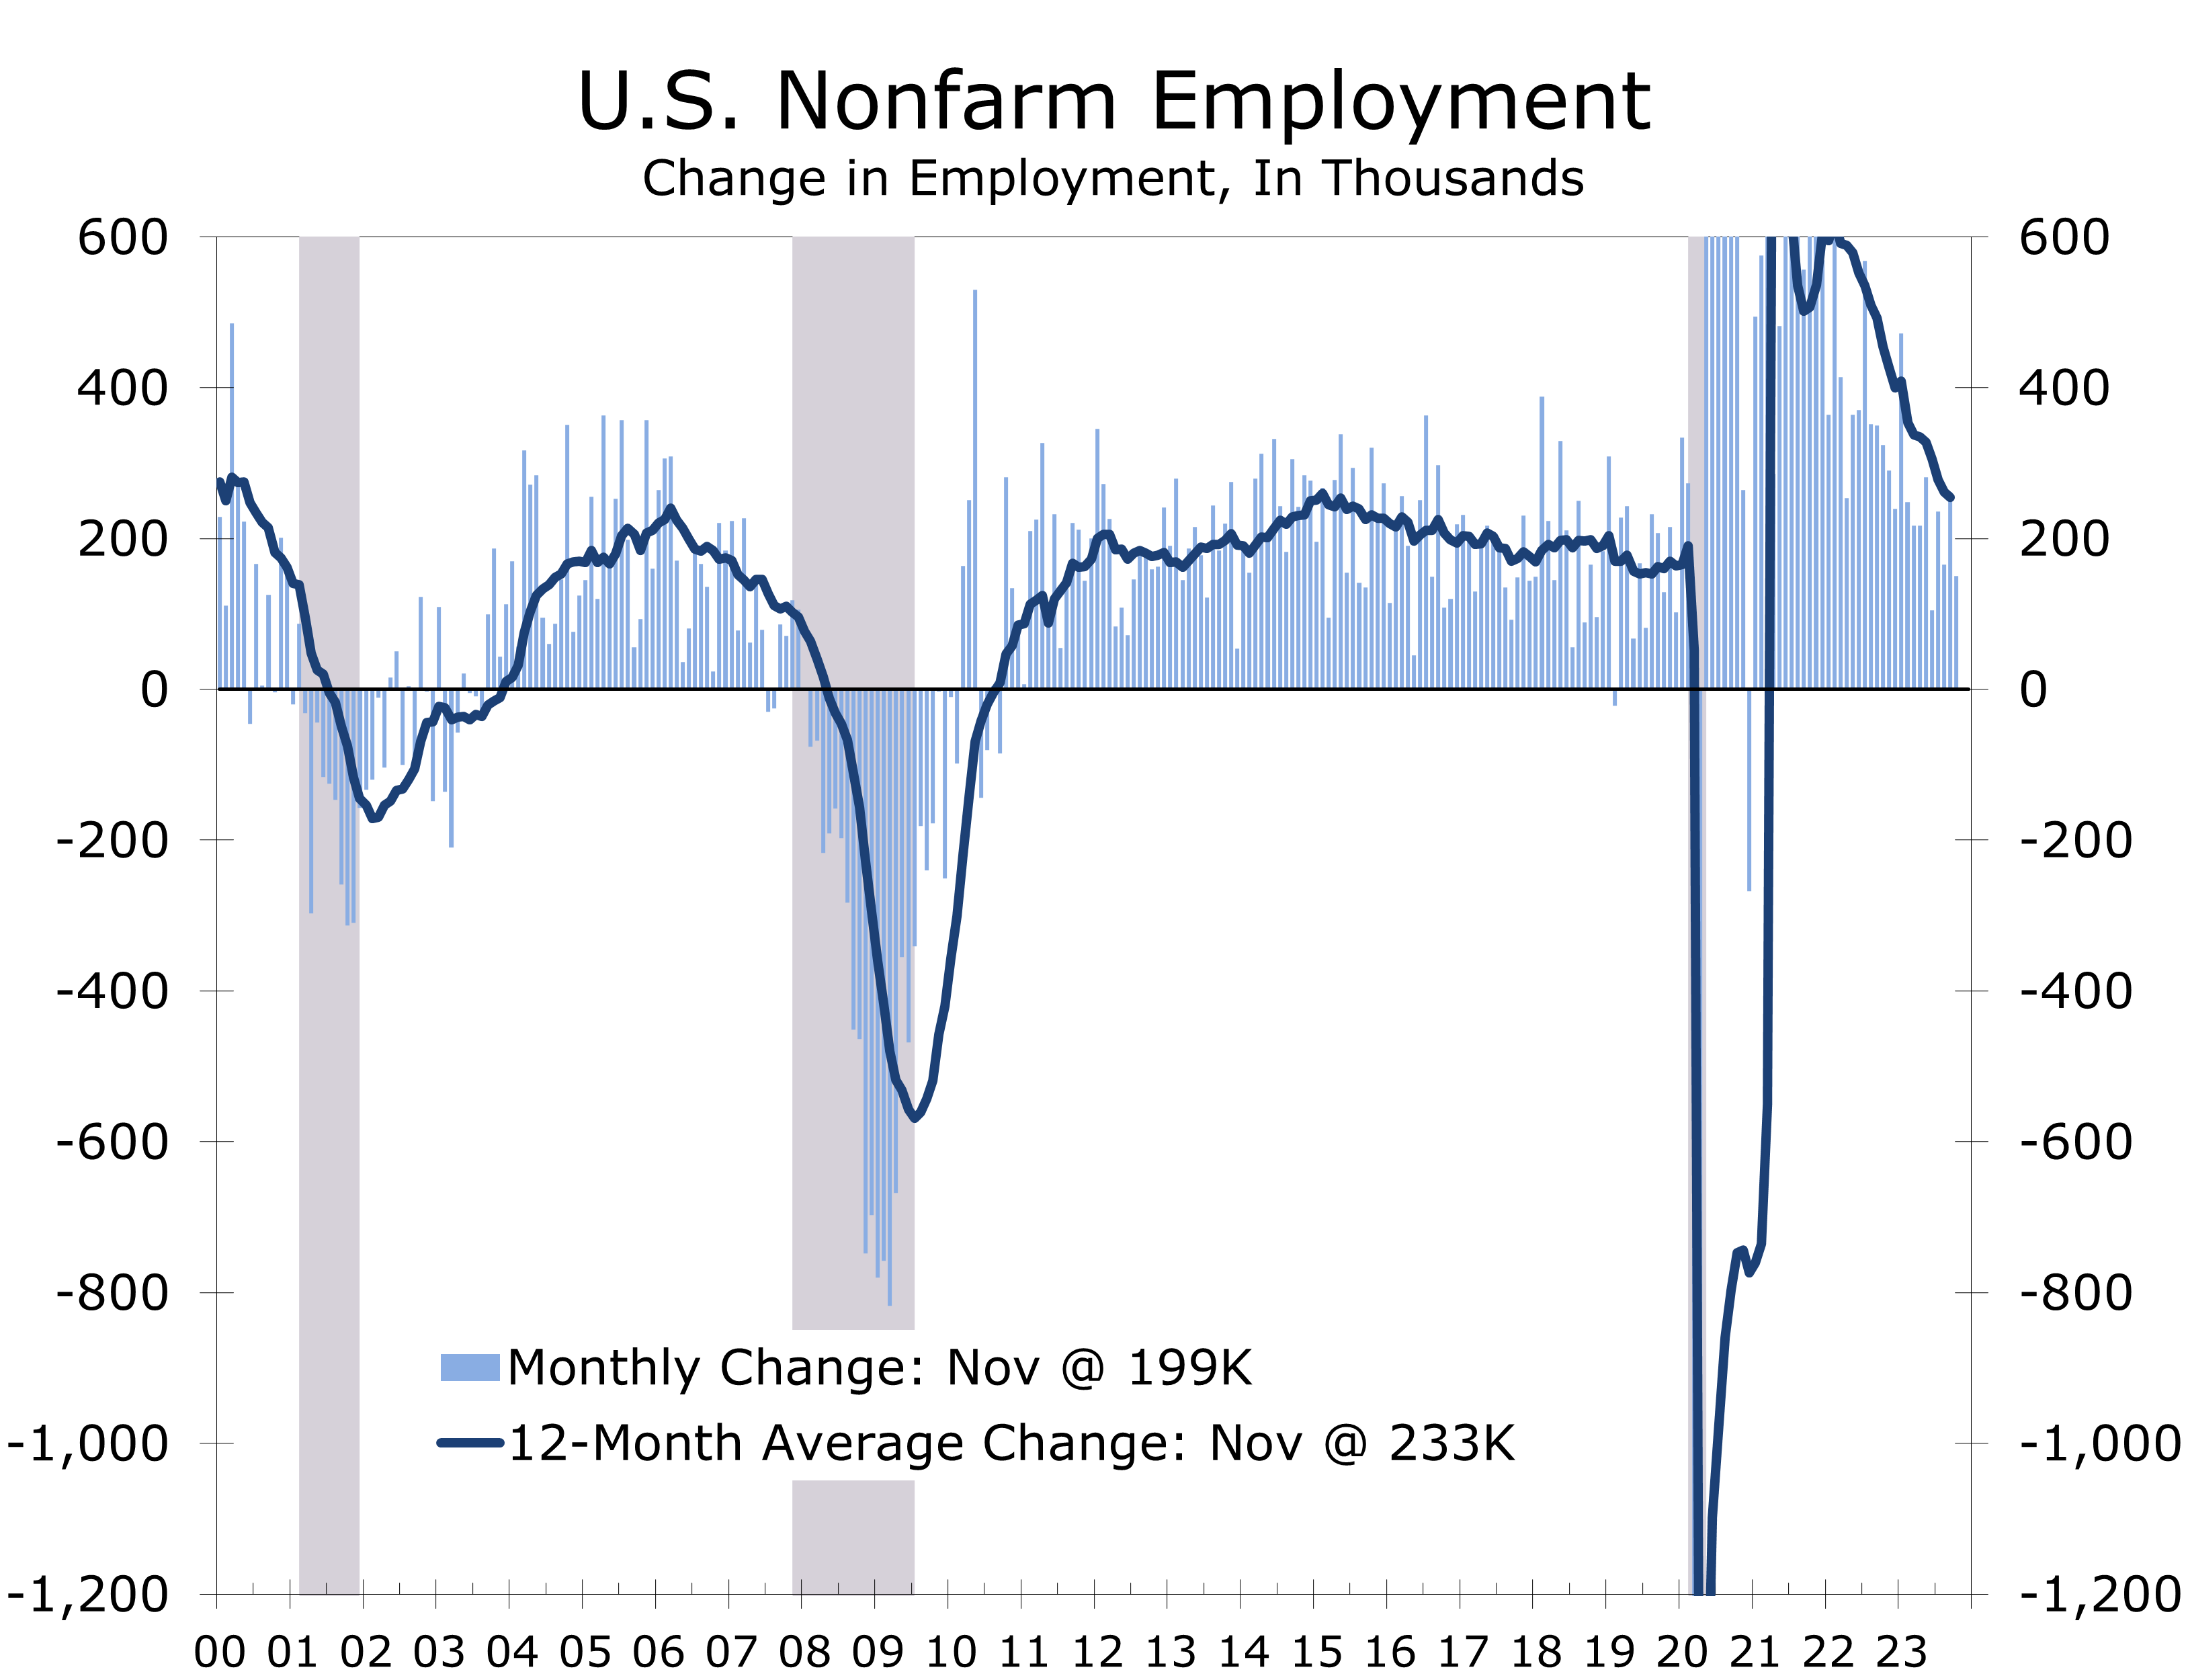
The primary reason so many economists have backed off their calls for a recession is job growth remains remarkably resilient. Employers added 199,000 jobs in November, continuing a string of solid, albeit gradually decelerating job gains. November’s job growth was bolstered by the return of 38,000 workers on strike in the auto sector and motion picture business. As in recent months, Health care (+76,800), government (+49,000), and Leisure and Hospitality (+40,000) accounted for the bulk of job gains. Employment declined in a few notable sectors including Retailing (-38,400), Employment Services (-24,600), Nondurable Goods Manufacturing (-8,000) and Transportation & Warehousing (-5,000). Even with these losses, however, the share of industries adding jobs in November edged higher to 54.6%. Job gains were more widespread a year ago, however, when the private payroll diffusion index was a robust 63.4%.
While nonfarm employment growth is clearly decelerating, job growth remains strong enough to keep the unemployment rate at the lower end of the range considered to be ‘full employment.’ The number of employed in the household survey surged by 747,000 in November, significantly outstripping a 532,000-person rise in the labor force. The unemployment fell 0.2 percentage points to 3.7%.
We expect hiring to decelerated further in coming months and suspect nonfarm employment is currently overstated. The BLS annual revision to nonfarm payrolls that will be released in early February will reduce payroll growth from April 2022 to April 2023 by 306,000 jobs, or about 0.2%. Job growth has likely decelerated further since then, however. Private sector payroll growth has been revised lower from its initially reported gain every month this year, including a -14,000 job revision to the October data. Even with the downward revision, private employers have added an average of 145,000 jobs a month over the past 3 months. That should provide enough cushion to keep payroll growth in positive territory, even if GDP growth dips slightly into negative territory early next year.
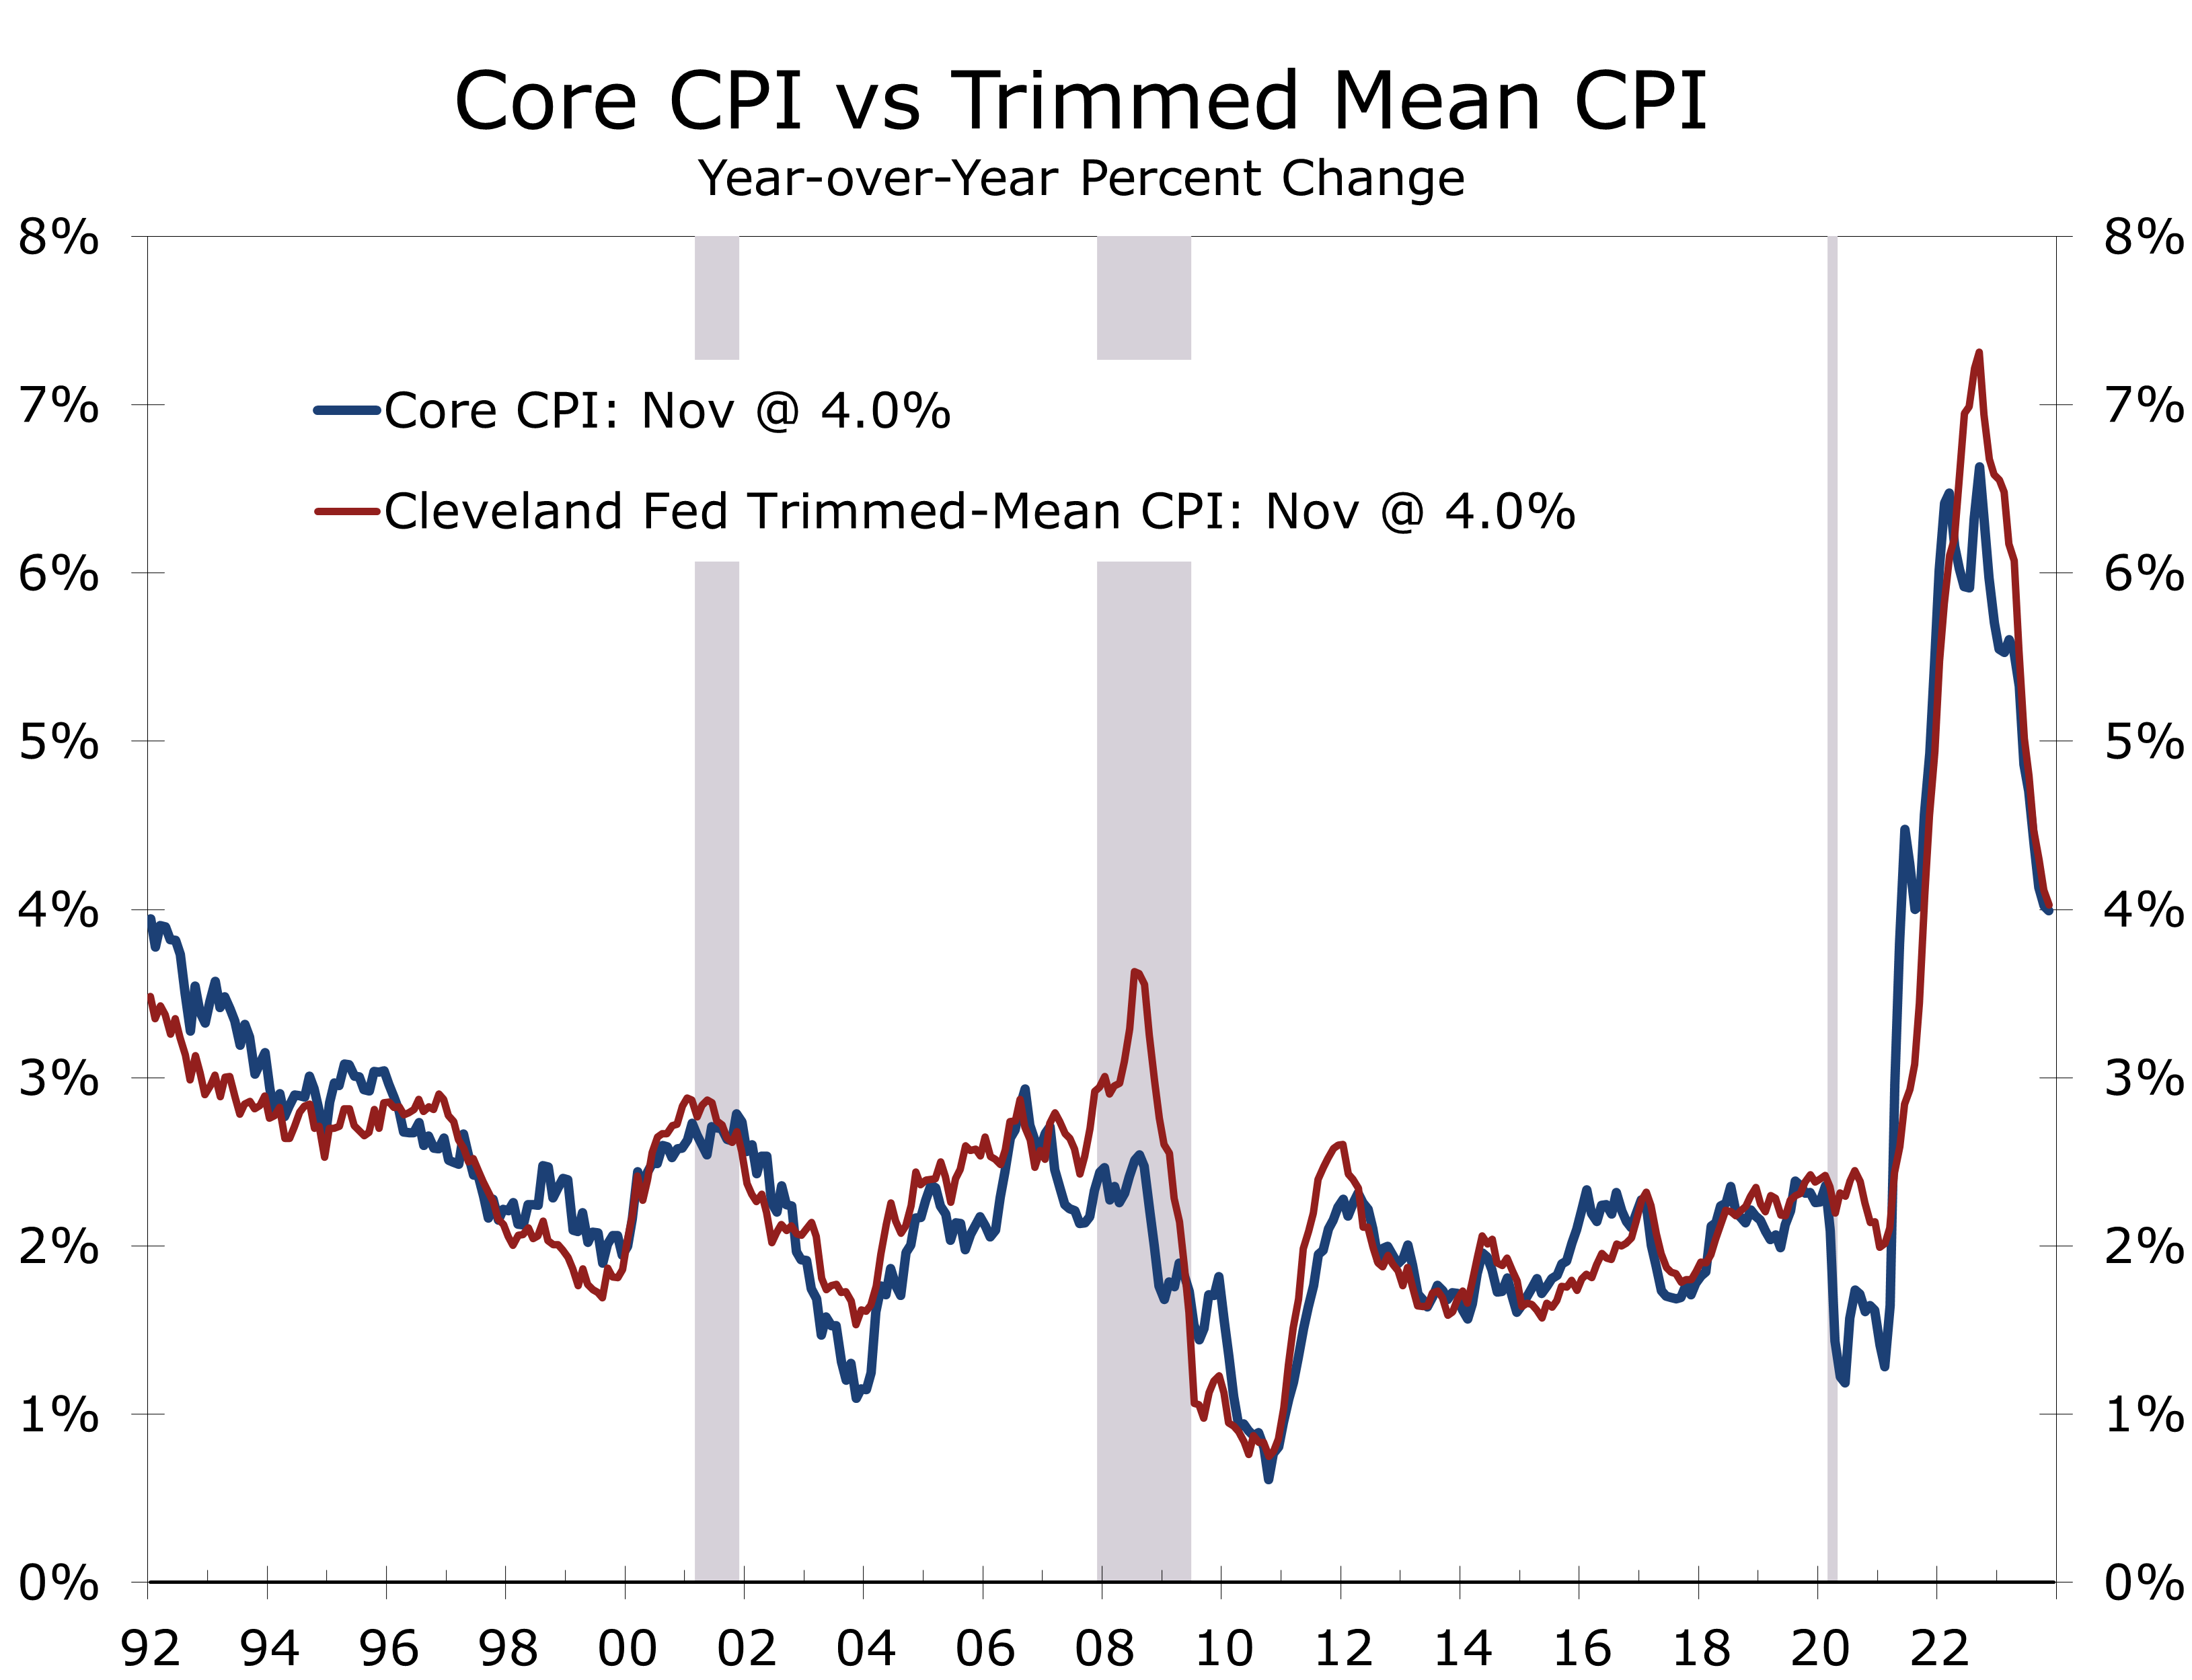
Question 2: Will inflation decelerate enough for the Federal Reserve to cut the federal funds rate? We believe it will. The overall CPI topped out at 9.1% in June 2022 and has fallen back to just 3.1% in November. The bulk of the improvement in the CPI has come from two areas: falling energy prices and a reversal in the spike in used car prices. Price pressures are moderating more broadly. We follow the Trimmed-Mean CPI, produced by the Federal Reserve Bank of Cleveland, and provides a broader picture of inflation than the widely followed core CPI but still excludes outliers. The Trimmed-Mean CPI has moderated along with the core CPI, falling from a recent peak of 7.3% in September 2022 to 4.0% in November of this year.
We expect inflation to continue to decelerate in 2024 but do not look for the core CPI to fall back to the Fed’s 2% target until the latter part of 2025 or later. Even so, the Fed should still be able to reduce the federal funds rate this coming year, however. The real federal funds rate, as measured as the difference between the mid-point of the federal funds rate target (5.50%) and trailing 12-month change in the core CPI (4.0%), is currently 150 basis points. We expect the year-to-year change in the core CPI to decelerate to 3.2% by the end of this year, which should allow the Fed to cut the federal funds rate by a quarter point three times in 2024. We feel the earliest the Fed would cut would be at the June FOMC meeting, followed by another cut in September and then another following the November election.
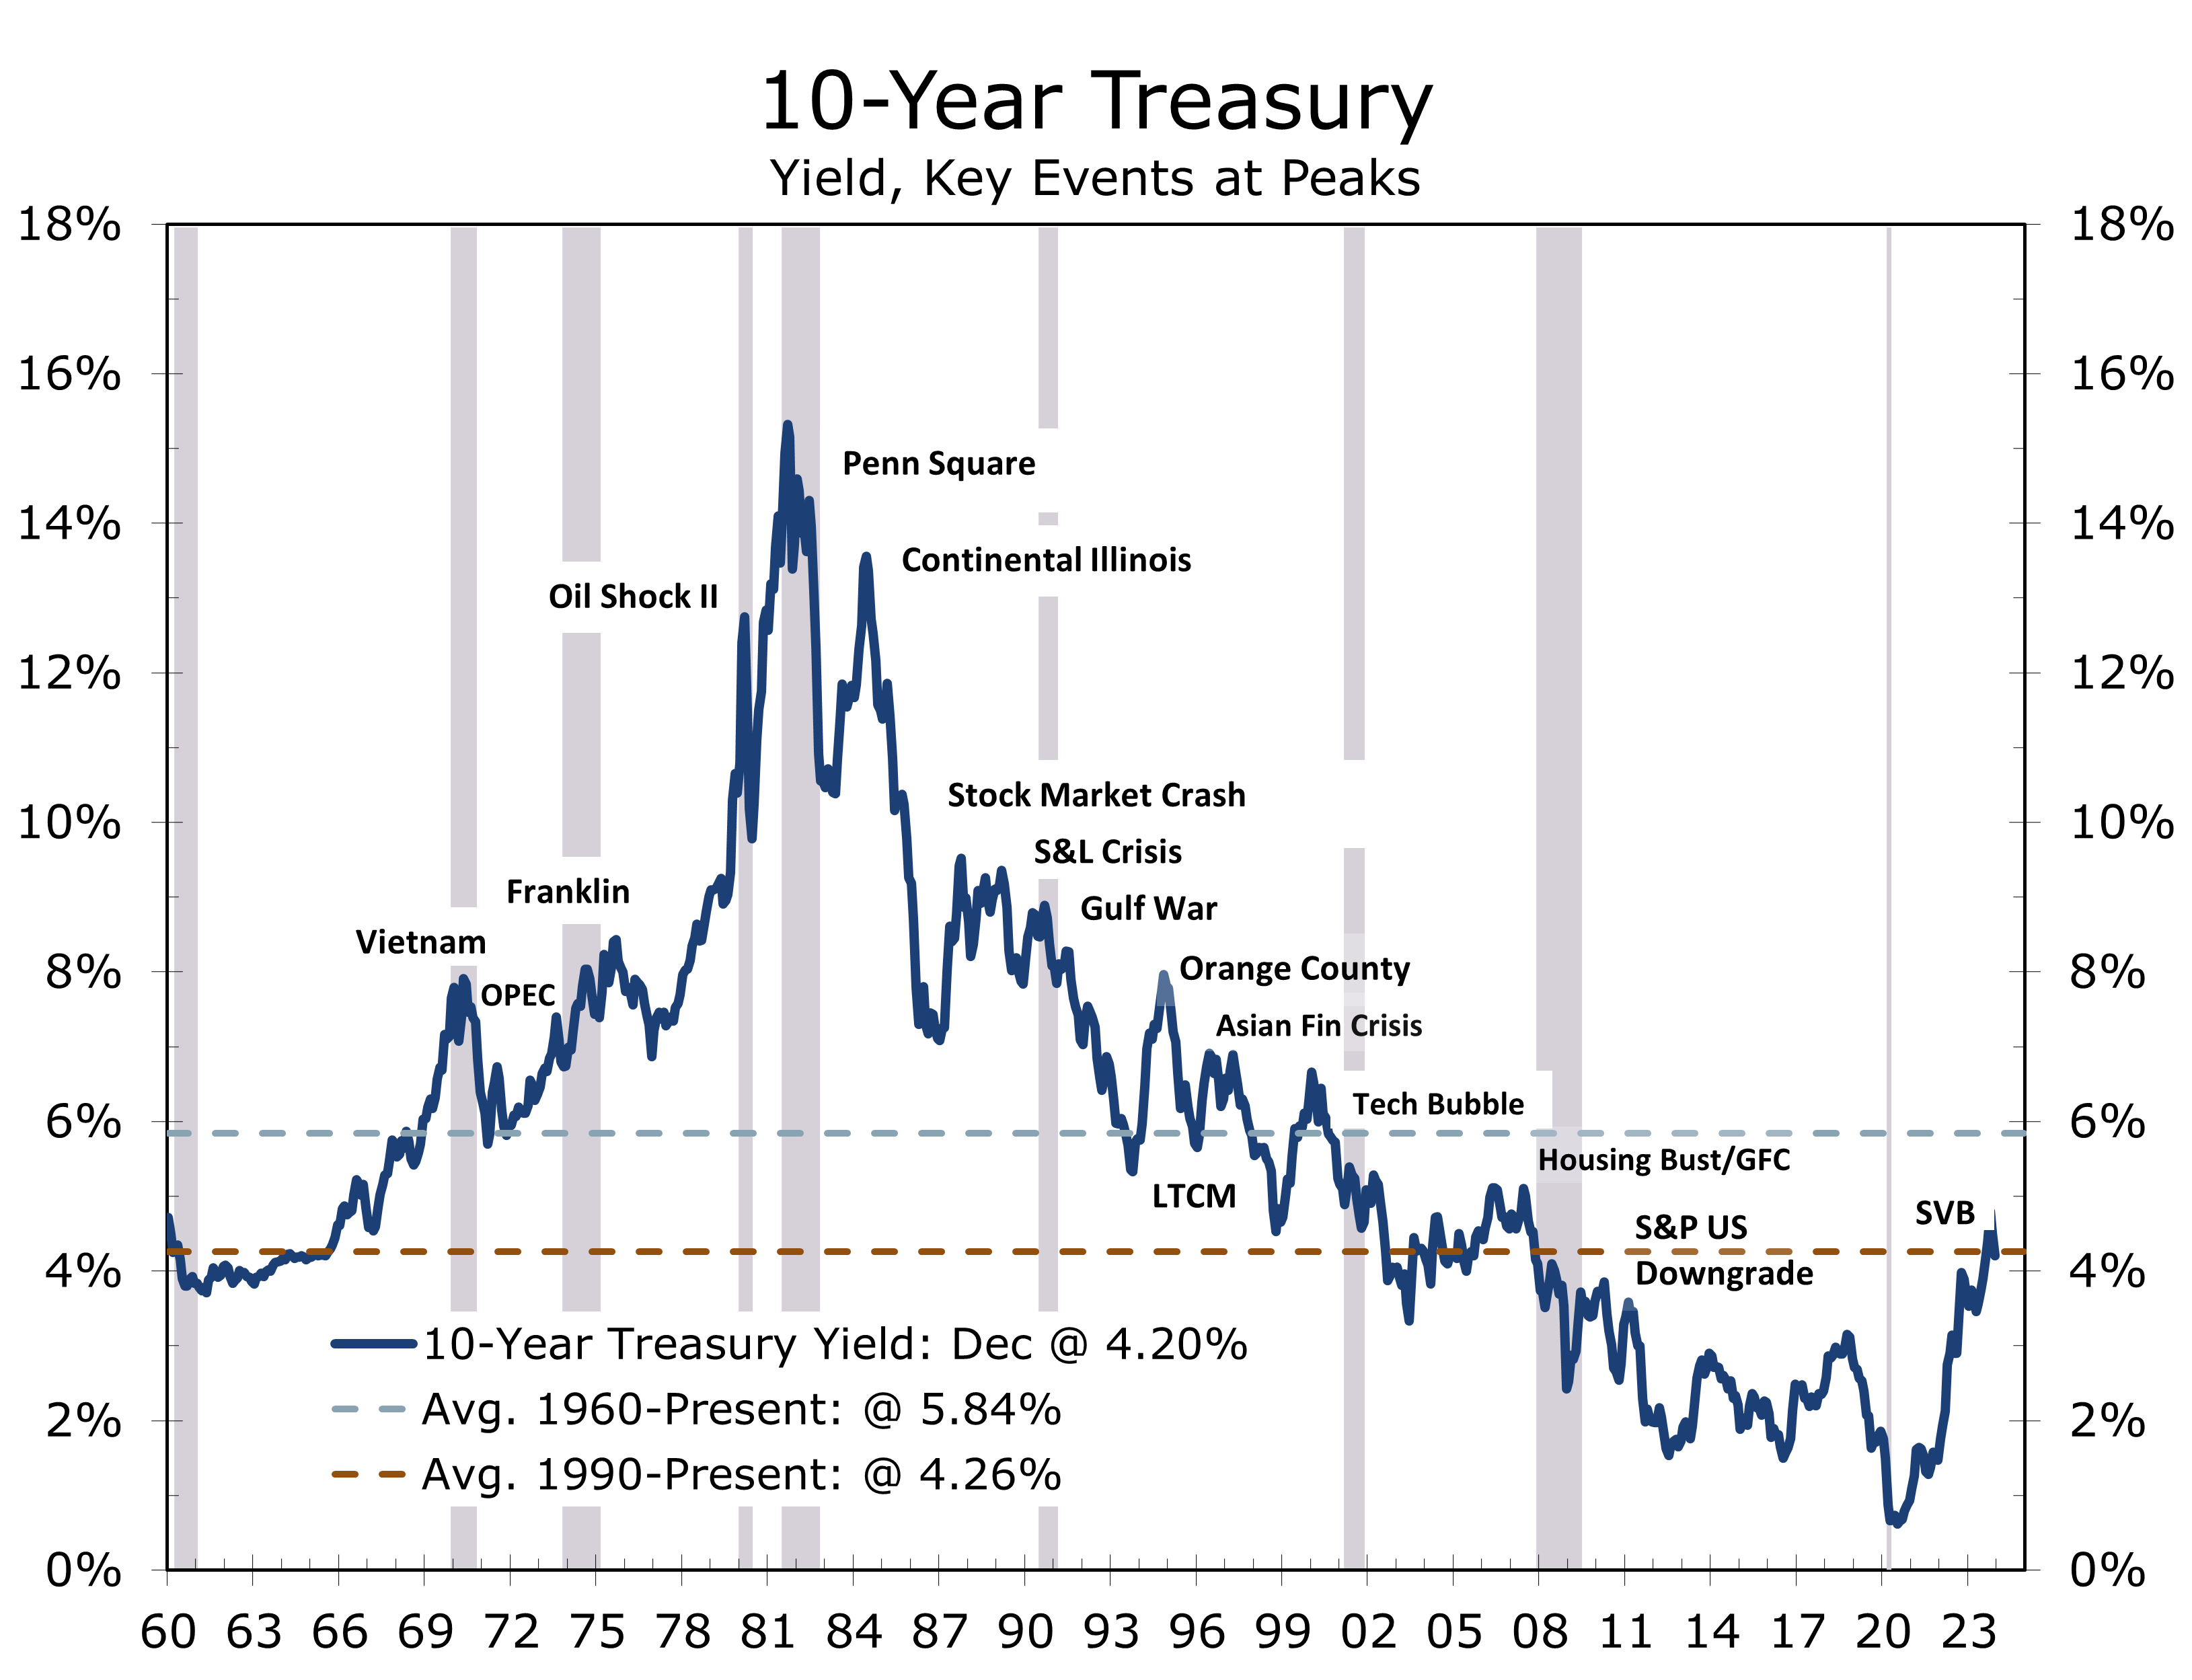
Question 3: Have long-term interest rates peaked for this cycle? Long-term interest rates have peaked for the cycle but may overshot to the downside in the rally that followed the better than expected inflation data for October and more recent acknowledgement by the Fed that they would likely cut interest rates in 2024. While we expect inflation to continue to decelerate, the improvement this coming year will be less dramatic than this past year. Prices for core services, which are primarily driven by wages, remain more problematic and are likely to improve only modestly this year. Inflation will still improve enough for the Fed to cut interest rates, just as not as early as the financial markets are now pricing in and not as aggressively. We look for a maximum of three quarter point cuts in 2024 and four quarter point cuts in 2025. Bond yields will retrace part of their recent declines, rising back to 4.50% and remain slightly above the 4.26% the 10-Year Treasury has averaged for the past 33 years.
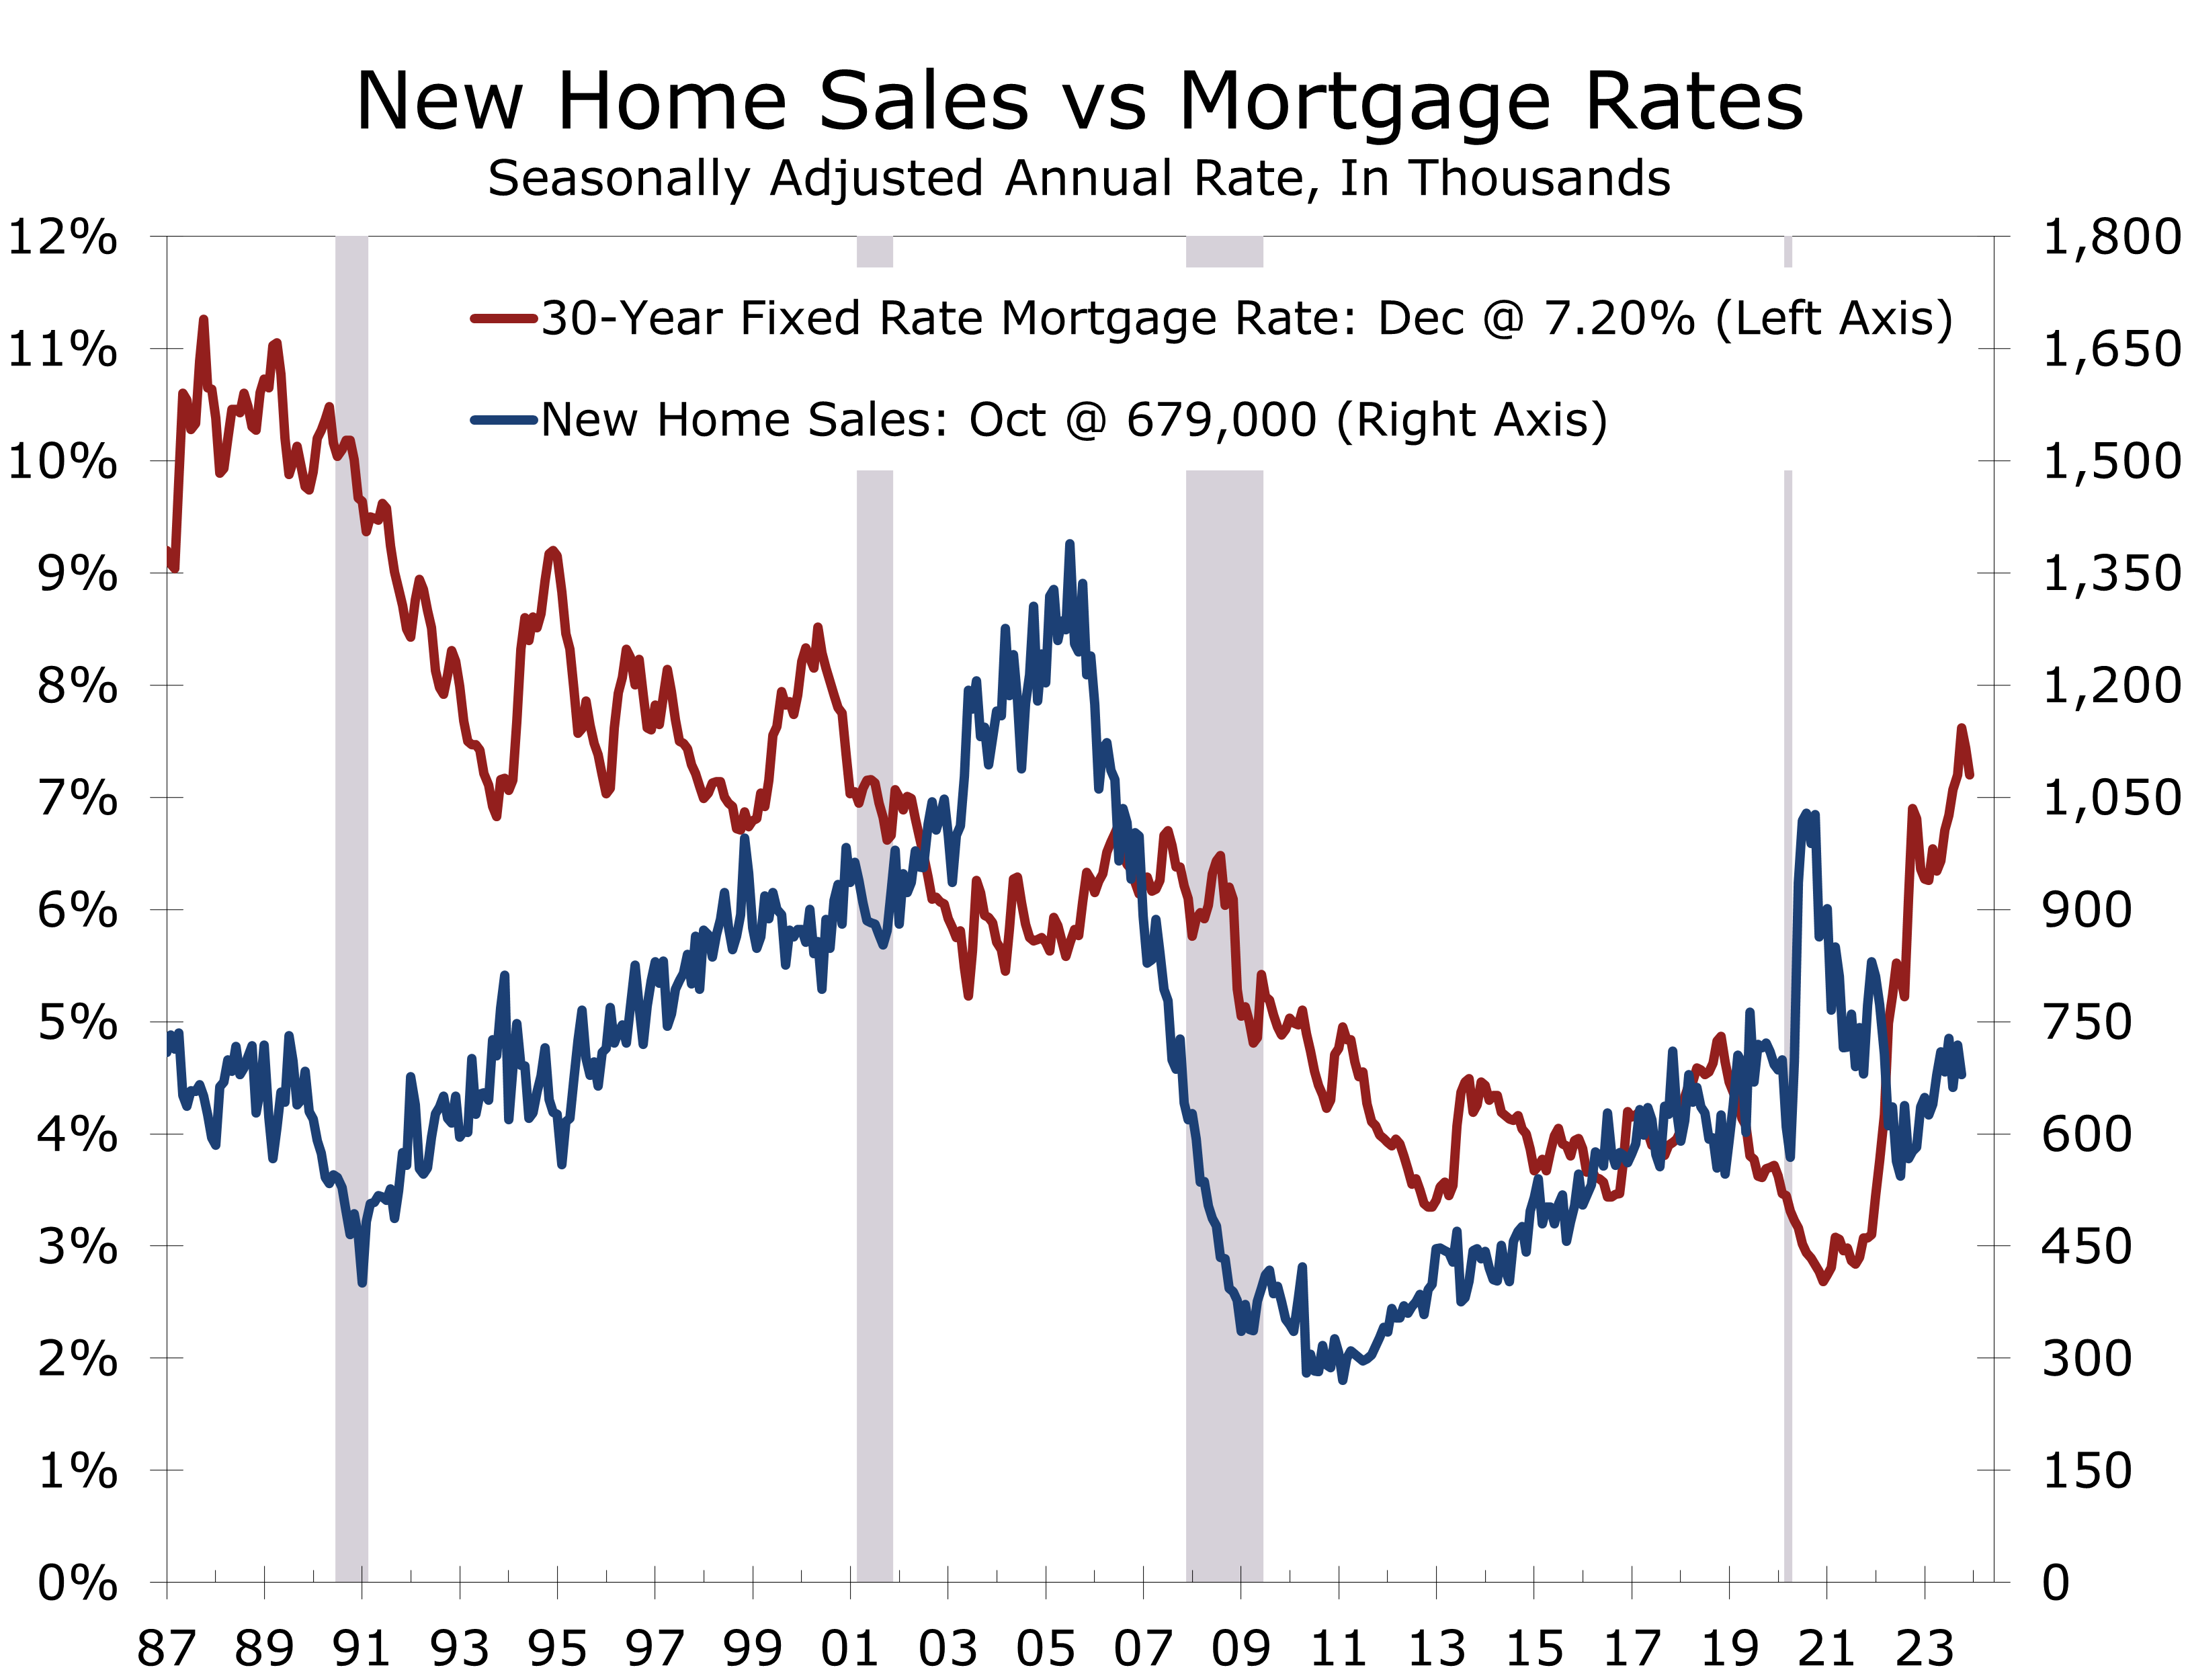
Question 4: Will the drop in long-term interest rates provide a significant boost to home sales. Partially Yes. Home sales nearly ground to a halt when mortgage rates briefly spiked up to 8% and there was also a slew of cancelations to previously signed purchase contracts. Now that mortgage rates have fallen back to 7.20%, buyers will return to the market. New home sales and new home construction will certainly get a boost, but with job growth slowing even fewer existing homeowners are likely to put their homes on the market, which will further limit resales.
We have a cautious housing forecast for the coming year. Slower job and income growth will weigh on consumer confidence and slow overall home sales. We look for existing home sales to fall 6% from their current level by the middle of 2024. New home construction will continue to take market share from the existing home market, with the large national home builders faring the best. Home builders are routinely using their incentive budgets to buy down mortgage rates, which is particularly appealing to first-time buyers. That said we, are still looking for new home sales to decline modestly (-4.3%) during the first half of 2024, reflecting slower overall job growth.
Question 5: Will Commercial Real Estate deteriorate to the point that it leads to a significant credit crunch? The credit crunch already underway will linger and intensify but credit conditions will not tighten so much that they stifle overall economic growth. The office market presents the greatest challenge, as office workers have been reluctant to return to the office full-time. Office vacancy rates has climbed steadily this past year as businesses have consolidated their space needs. True vacancy, which would account for leased but vacant space, may be as much as ten percentage points higher than the current 19.2%. We see that as the upper bound, however, as some of this space will be repurposed to other uses.
Attention is now swinging to the apartment and industrial markets, both of which have seen a tremendous amount of new construction in recent years and have a significant pipeline of projects under construction. Lending for new apartment projects tightened this past year and we expect multi-family starts to decline 50% from their 2023 levels. Demand for apartments remains fairly strong and vacancy rates appear manageable at around 5%. Unfortunately, there are close to one million apartments under construction and demand for apartments will slow as job growth decelerates further in 2024.
The warehouse and industrial market has been one of the top-performing real estate sectors, benefiting from a surge in ecommerce and the recent push for near-shoring. Demand cooled this past year as goods purchases slowed, but vacancy rates remain low at just 4.6%. We expect new construction to moderate next year amidst tighter credit and generally slower economic growth.
Economic growth has slowed from its torrid third quarter pace, which saw real GDP grow at a 5.2% annual rate. The widely followed Atlanta Fed GDPNow nowcast, which was one of the first to call for a spike in growth during the third quarter, pegs current growth at just 1.2%. Our forecast is a little higher than that at 1.6%, but much of the growth occurred at the start of quarter and we expect activity to slow toward the end of the quarter. Holiday retail sales got off to a soft start and we expect spending to rise at the lower end of the 3% to 4% range projected by the National Retail Federation. Sluggish real income growth is back holding spending, although falling gasoline prices are providing a short-term boost to consumer sentiment and buying power.
Our forecast for the first half of 2024 is likely toward the lower end of consensus. We expect to see a preponderance of disappointing economic reports early next year and look for real GDP to decline at a 1.7% annual rate in the first quarter, followed by a 0.6% drop in Q2. Such a decline would be similar to the drop seen at the start of 2022, which the NBER did not label as a recession. This downturn is likely to be more broad based, but as we noted earlier, we do not expect nonfarm payrolls to post an outright decline. If payrolls do decline, the odds a recession increase exponentially.
As for interest rates, we feel the bond market has gotten ahead of the Fed. Policymakers will take their time moving from a tightening bias to a neutral bias and finally to an easing bias, which will push the first rate cut out into June. Bond yields will need to rise from current levels to incorporate a slower pace of rate cuts and higher end point, which we currently see as somewhere around 3.50%. An outright recession would speed this process up and result in a lower end point for the federal funds rate, likely closer to 2%.
Disclaimer: This publication has been prepared for informational purposes only and is not intended as a recommendation offer or solicitation with respect to the purchase or sale of any security or other financial product nor does it constitute investment advice. Any forward-looking statements or forecasts are not guaranteed and are subject to change at any time. Information from external sources have not been verified but are generally considered reliable.
© 2023 CAVU Securities, LLC
Consumer Confidence Rises Solidly in December
A Santa Claus Rally for Consumer Confidence
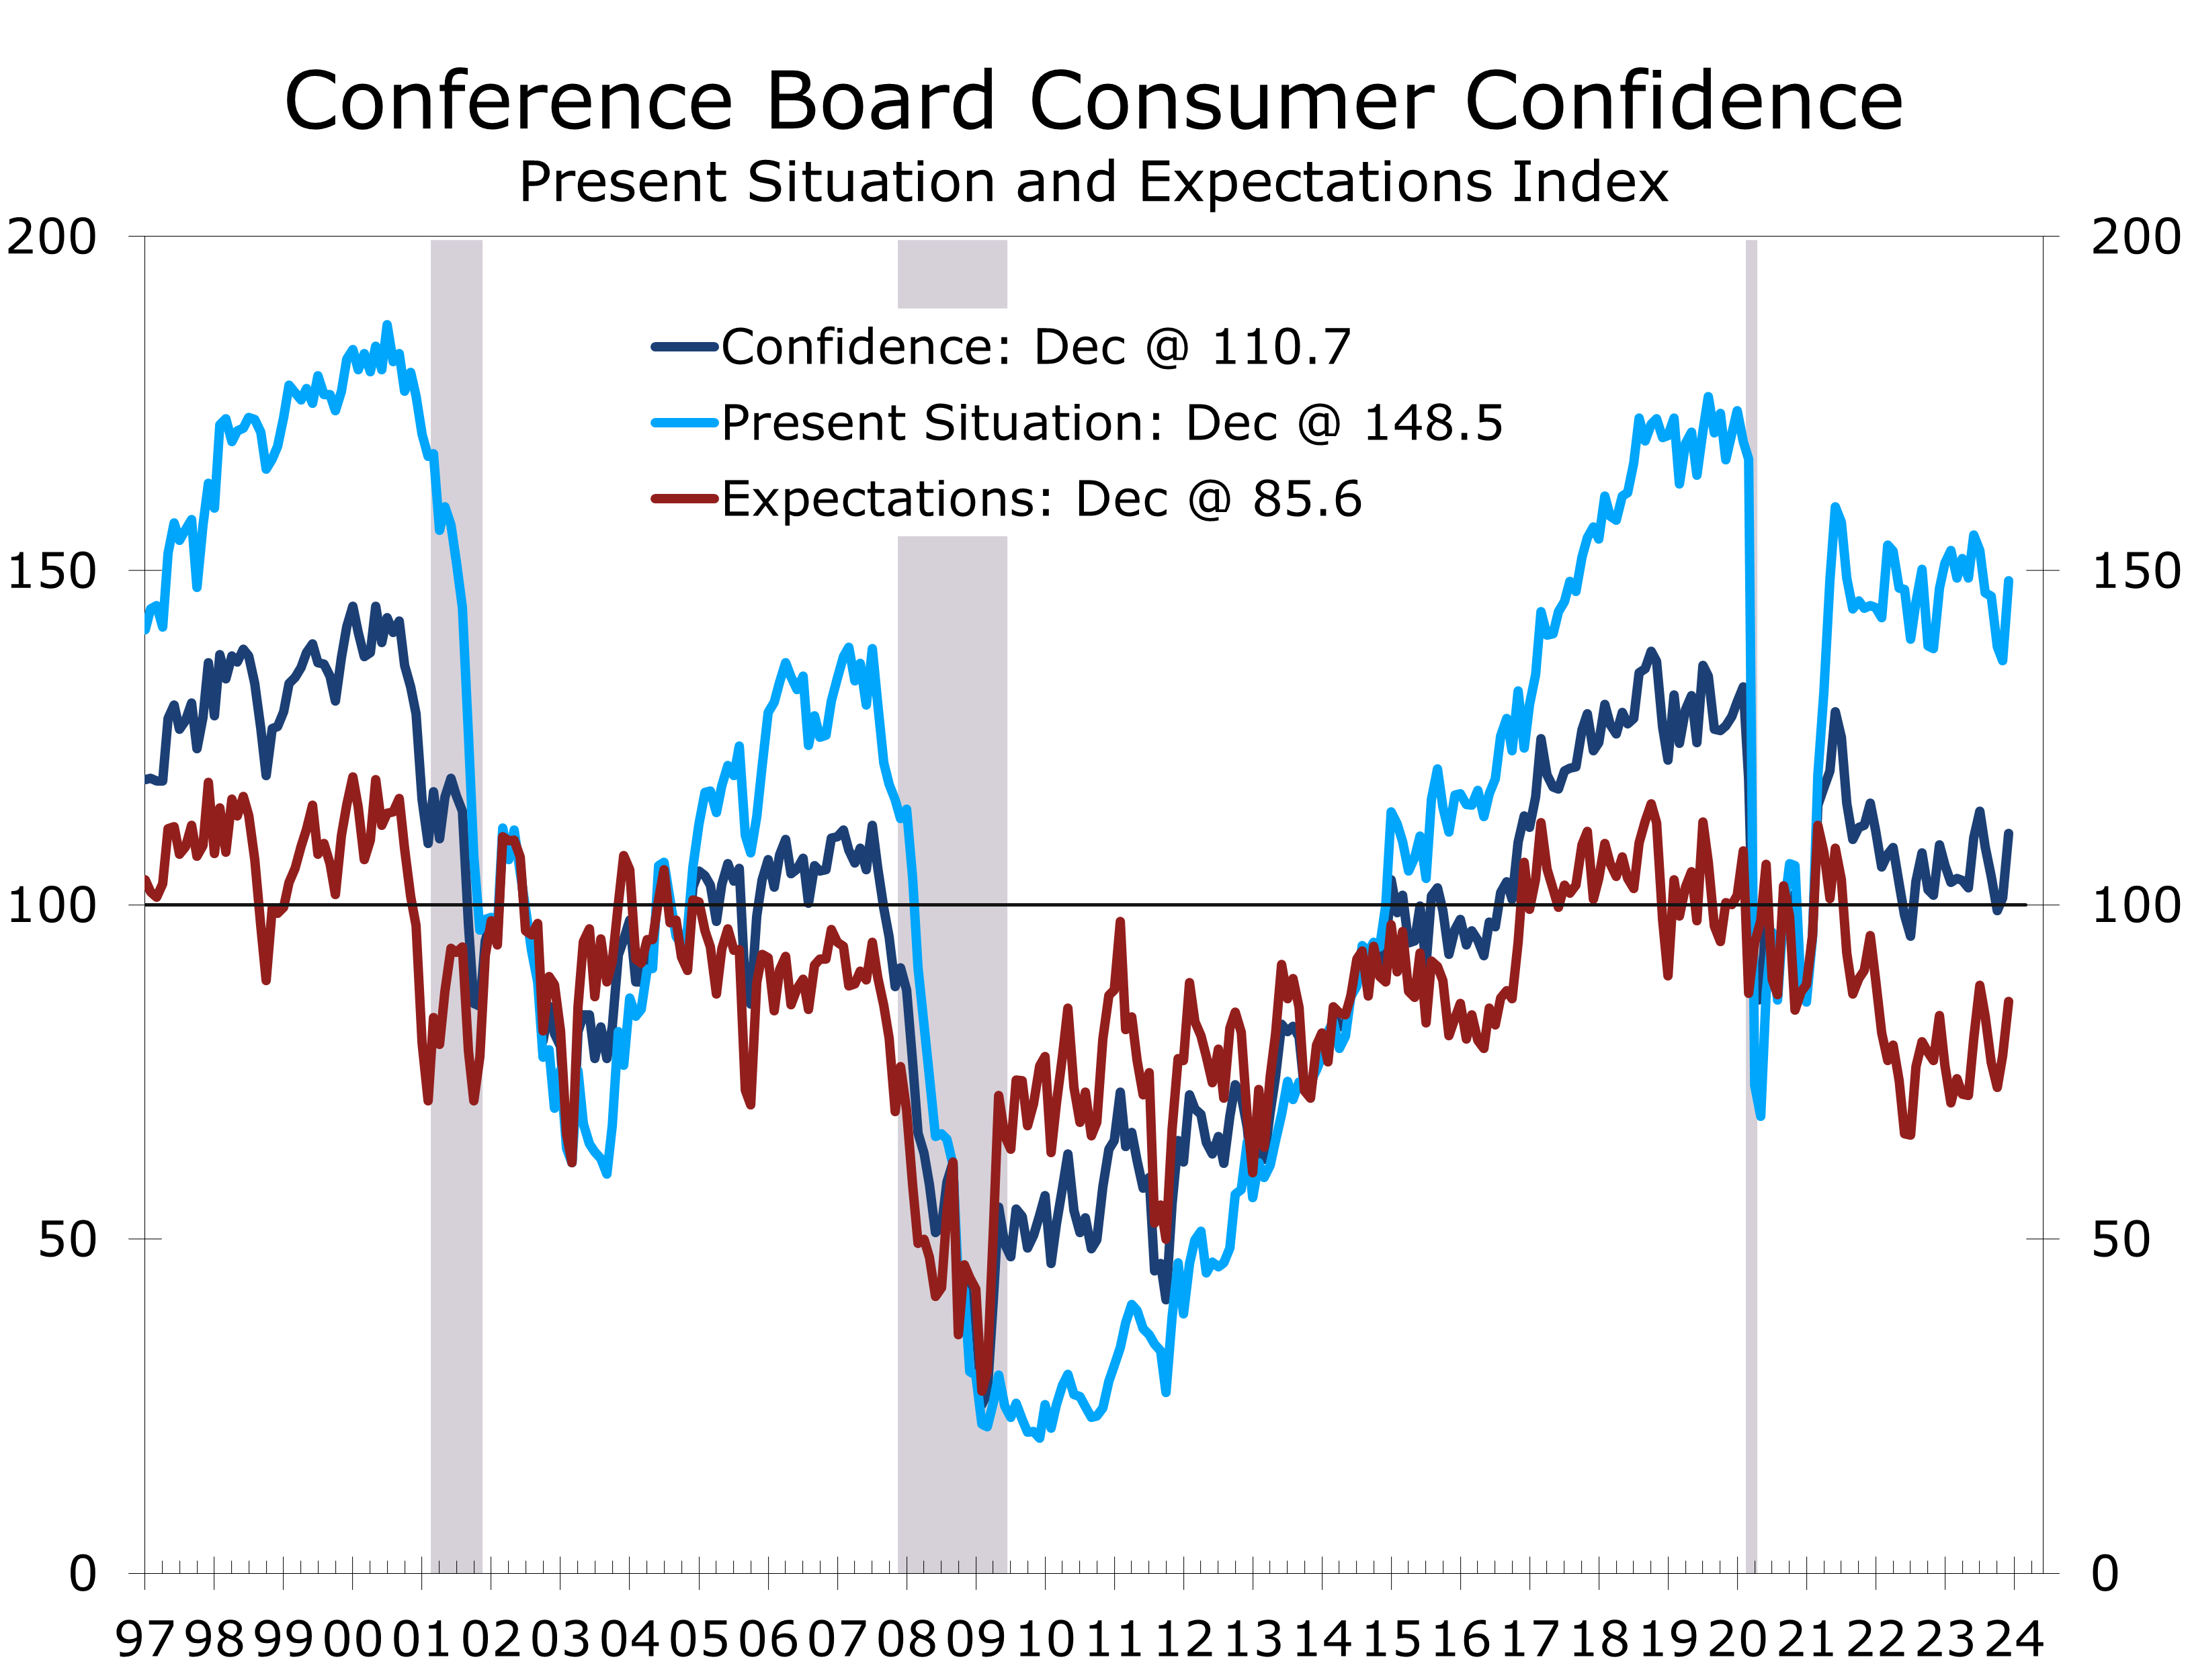
- Consumer Confidence surged ahead of the holiday season, with the overall index rising 9.7 points to 110.7. The data from the prior month was slightly revised downward.
- Present conditions rose 12 points to 148.5, while expectations rose by 8.2 points to 85.6. Both hit their highest levels since July.
- Consumers' assessment of current labor conditions improved significantly. The share stating jobs are 'plentiful' rose 2.1 percentage points to 40.7%, and the share stating jobs are 'hard to get' fell 2.4 points to 15.4%.
- Consumers appear to be buying into the soft landing narrative. The expectation for conditions to improve over the next 6 months rose 1.5 percentage points to 18.7%, while the share expecting conditions to weaken fell 2.9 percentage points to 20.1%.
- Consumer Confidence rose alongside the stock market in early December. Recession fears have subsided as lower gas prices and falling interest rates bolster hopes for a soft landing. Gains were particularly notable among lower-income households.
The Consumer Confidence Index surprised to the upside in December, leaping by 9.7 points to 110.7, its highest level since July. Both the present conditions and expectations indices saw robust gains, signaling a retreat from the brink of recession. Inflation expectations also eased, thanks to lower gasoline prices, which bolstered purchasing power for middle and lower-income households.
Consumers’ assessment of current economic conditions rose by 12 points to 148.5, and expectations for the next six months increased by 8.2 points to 85.6, hitting their highest level since July. Falling gasoline prices and the apparent conclusion of the Fed’s interest rate hikes drove this improvement.
The improvement in the expectations series is particularly notable, as it had been flirting with recession levels for most of this year. More consumers now anticipate business conditions improving over the next 6 months (+1.5 pp to 18.7%), while fewer foresee conditions worsening (-4.1 pp to 16.0%).
Consumers see the economy taking a step back from the edge of recession.
Consumers are also slightly more upbeat about their personal finances. The share expecting their income to increase over the next 6 months rose by 1 percentage point to 18.7% in December, while the share anticipating a decline in income fell by 0.1 percentage points to 12.6%.
Consumers’ perceptions of both current and future labor market conditions have improved, with the share stating jobs are ‘plentiful’ rising by 2.1 points to 40.7%, and the share characterizing jobs as ‘hard to get’ decreasing by 2.4 points to 13.2%. The labor market differential, representing the difference between these two measures, increased by 4.5 points to 27.5, marking the most substantial monthly improvement since February 2022.
Expectations for labor market improvement in the next six months also saw a notable uptick. The proportion of consumers anticipating more available jobs rose by 1.1 points to 17.8%, while those expecting fewer jobs declined by 2.9 points to 17.2%.
Lower gasoline prices have reduced inflation fears and bolstered purchasing power.
Consumer confidence improved across income brackets, with the most significant gains observed at both the higher and lower ends. Households earning $125,000 or more saw the largest surge, jumping by 18.3 points in December to 128.8. In the $15,000 to $30,000 income range, confidence rose by 17.1 points to 102.1. The increase among higher-income households is likely due to lower interest rates and rising stock prices, while lower gasoline prices likely fueled the gain among lower-income households.
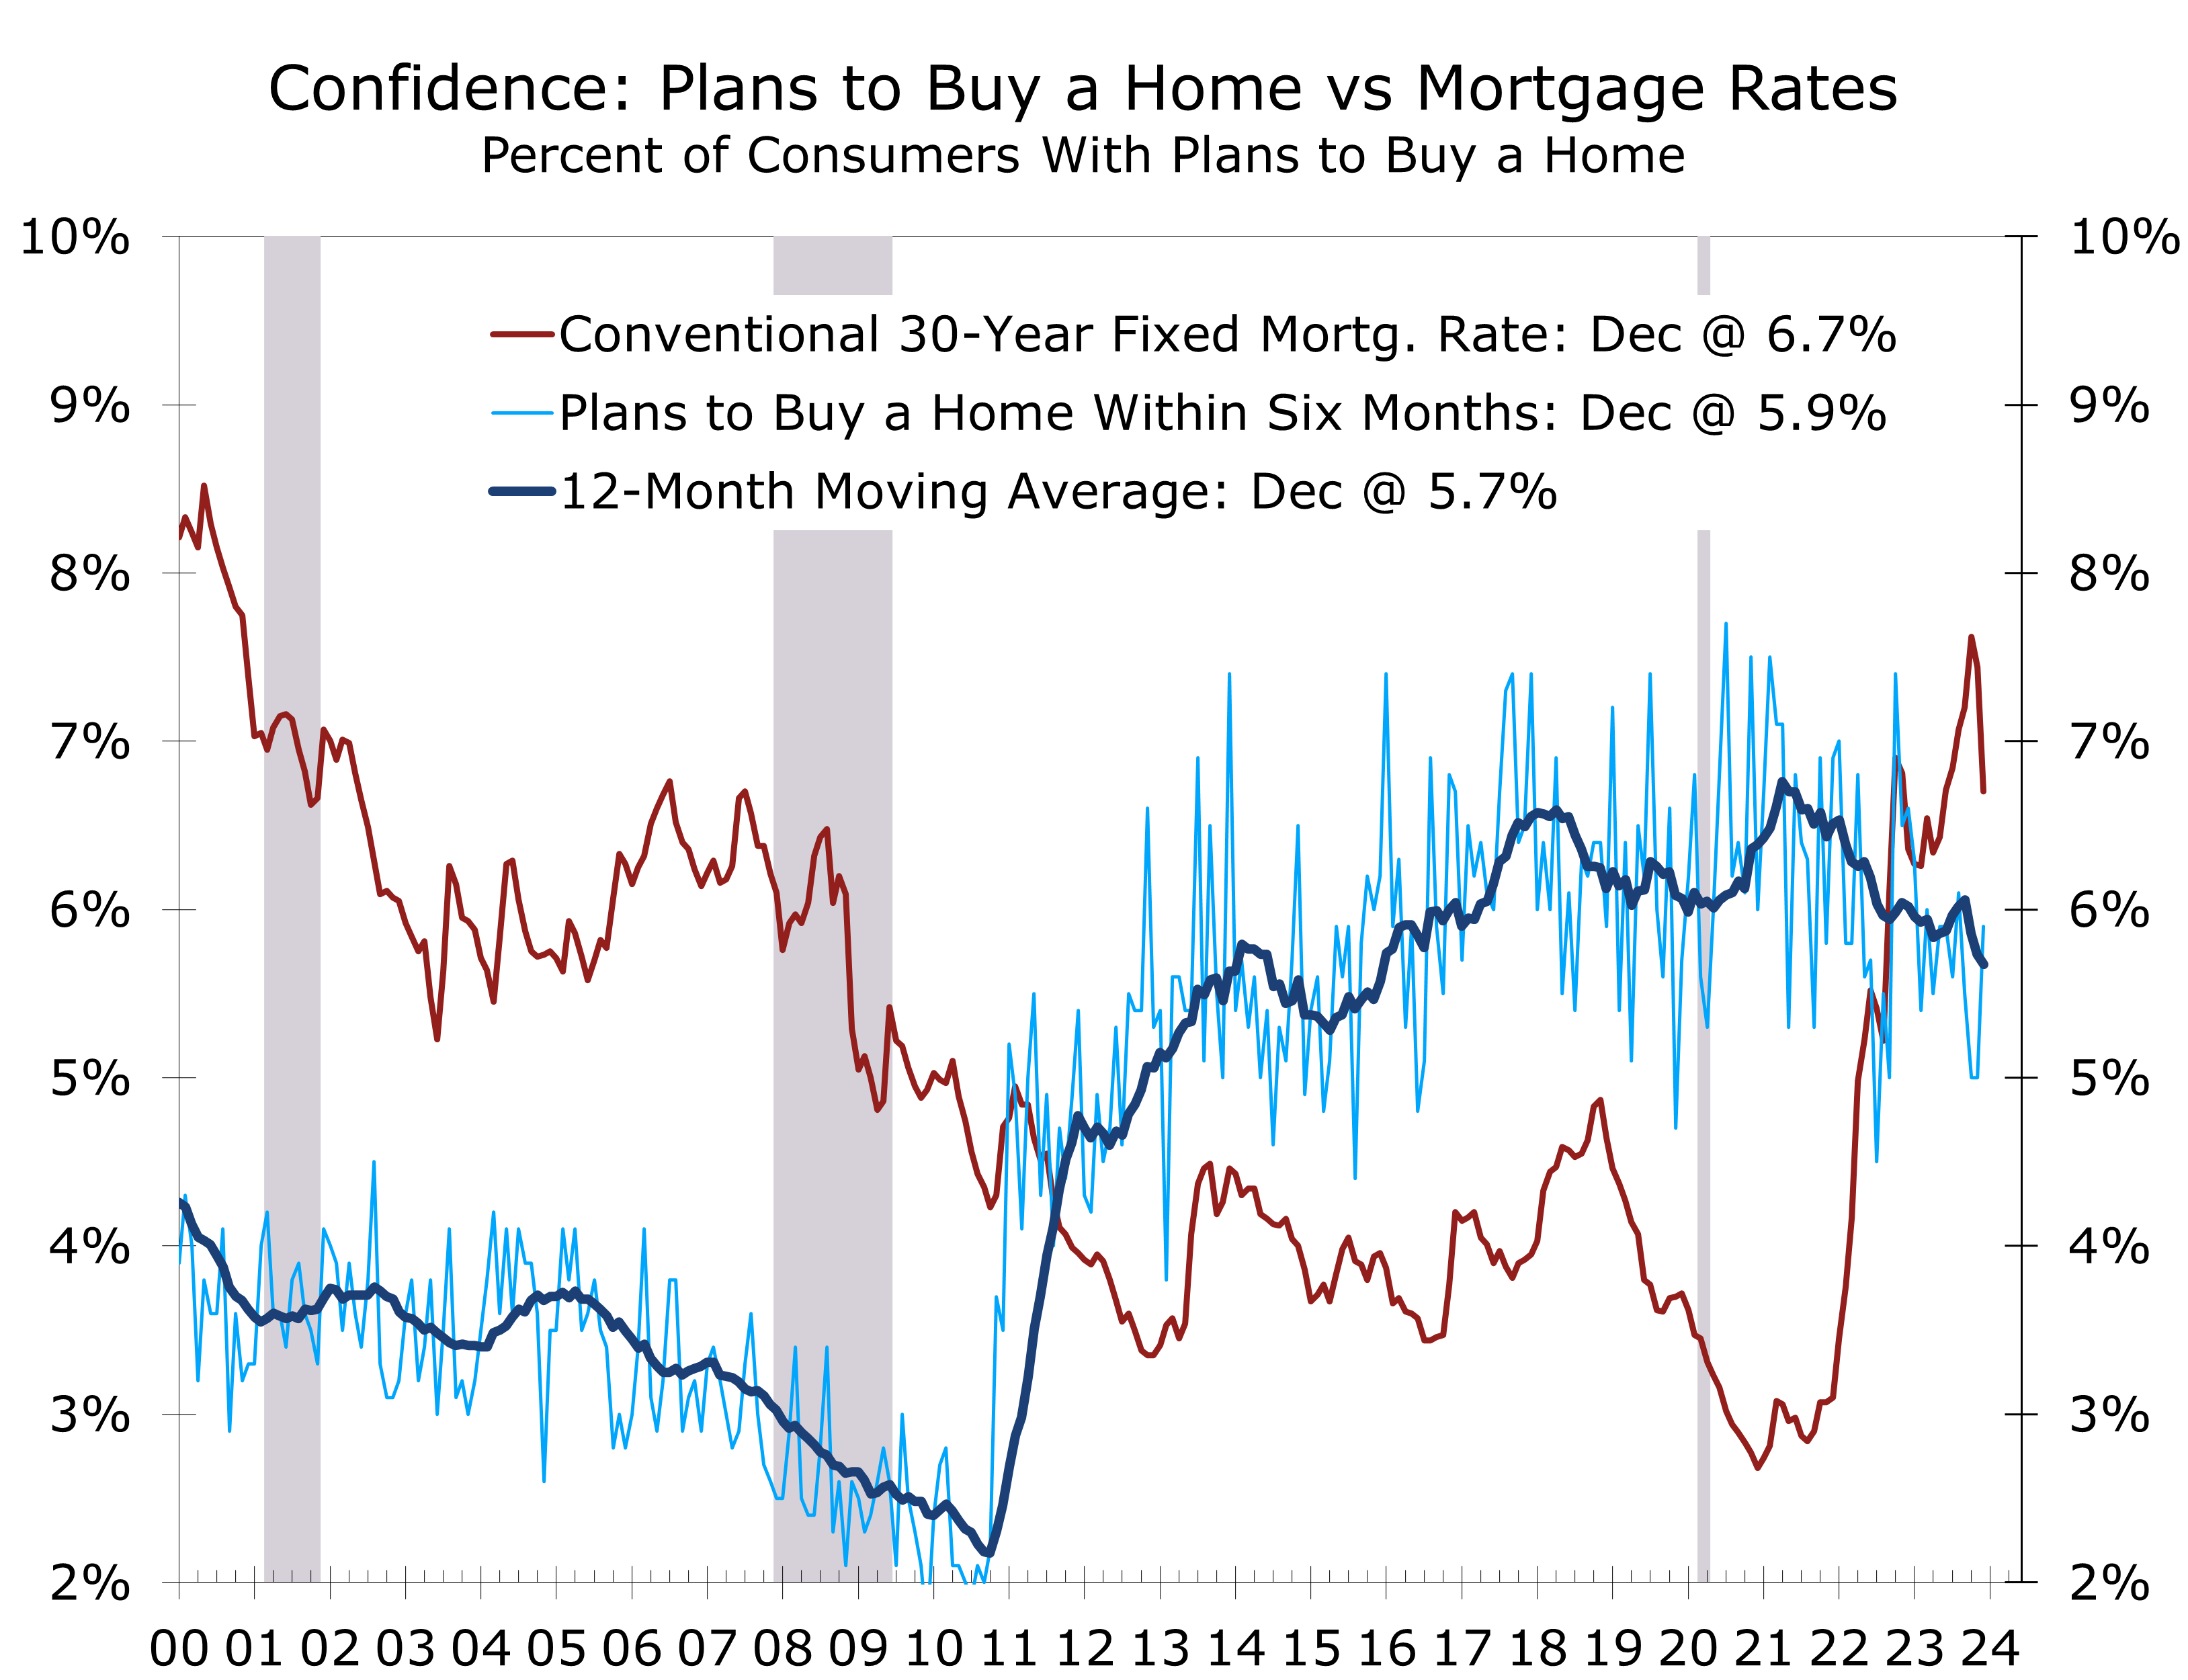
Interest rate expectations have undergone a significant shift recently, with the percentage of households anticipating a rise in interest rates over the next year dropping by 7 points in the last two months to 52.4%, the lowest since January 2021. Conversely, the share expecting rates to fall has increased 6.6 points over the same period to 18.5%, reaching the highest level since October 2020.
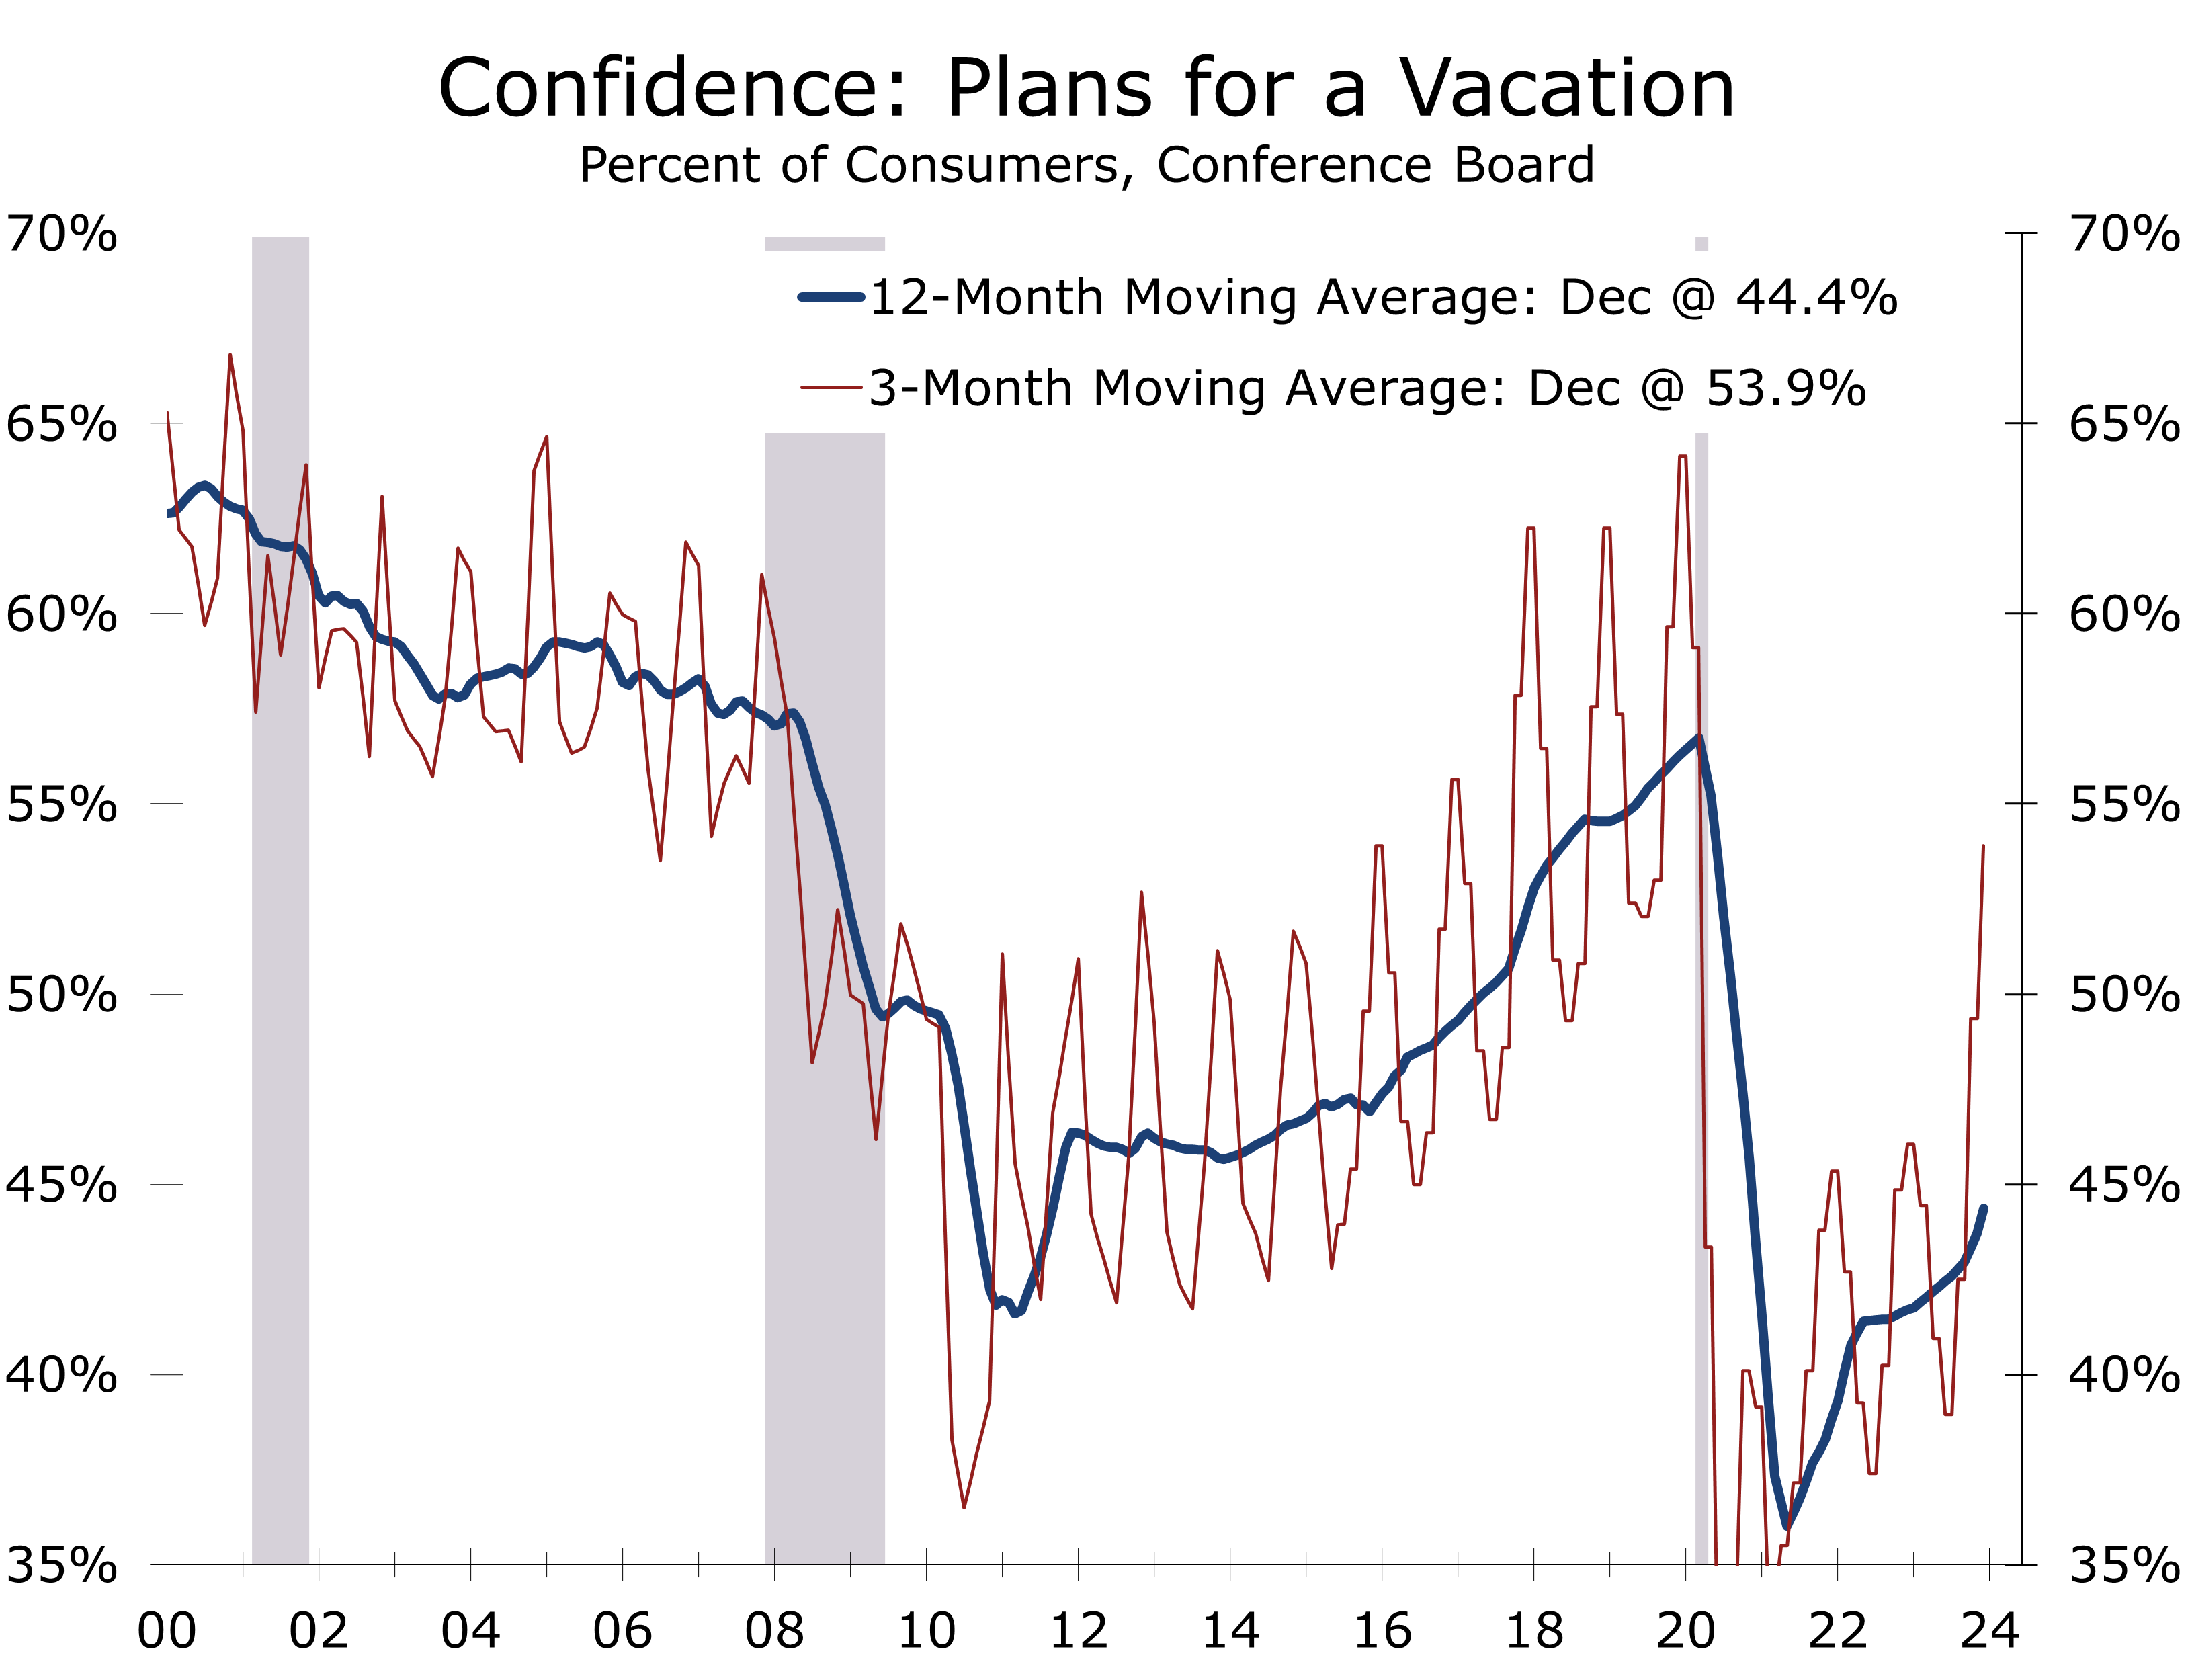
The pullback in mortgage rates should further bolter home buying plans in coming months.
With improved consumer confidence, more individuals are planning vacations. Intentions to travel within the next six months have risen 3.8 points over the past two months and a whopping 17.5 points over the past six months. This improvement is predominantly among consumers planning domestic travel, as intentions to travel overseas have slightly decreased.
December’s strong consumer confidence numbers are another key piece of data supporting the notion a soft landing is taking hold. Concerns about inflation are easing, thanks largely to falling energy prices. Interest rates also appear to have peaked, which should help bolster home sales and spending for big-ticket items.
Disclaimer: This publication has been prepared for informational purposes only and is not intended as a recommendation offer or solicitation with respect to the purchase or sale of any security or other financial product nor does it constitute investment advice.
Housing Starts Rise Solidly in November
Home Building Tops Expectations
- Housing starts spiked 14.8% to a 1.56 million-unit pace in October. Starts for the prior month were revised slightly lower.
- Single-family starts leaped 18.0% to a 1.143 million-unit pace, rising to their highest level since April 2022. Multi-family starts rose 6.9% to a 417,000-unit pace.
- Permits fell 2.5% to a 1.468-million-unit pace. Single-family permits rose 0.7% to a 976,000-unit pace, while multi-family permits fell 8.5% to 484,000-unit pace.
- Housing starts rose across the country, doubling in the Northeast and rising 16.3% in the South. Starts rose more modestly in the West (2.1%) and Midwest (1.4%).
- Home builder confidence rose 3 points to a still very low 37 in December. Buyer traffic remained low at just 24 but expected sales jumped 6 points to 45.
- Home builders are making an aggressive bet that inventories of existing homes will remain tight and mortgage rates will remain below the highs hit last fall. November’s starts were also helped by unseasonably mild weather.
Housing starts surpassed expectations in November, surging 14.8% to a robust 1.56-million-unit pace. We suspect that unseasonably mild weather contributed to this increase, with warmer and drier weather allowing more construction to commence. Seasonally adjusted housing starts doubled in the Northeast, rising from a 72,000-unit pace in October to a 144,000 unit pace in November.
Even after factoring in warmer-than-usual weather, home building remains surprisingly strong, with single-family starts surging 18% to a 1.143 million unit pace in November. Starts averaged a 1.026 million unit pace over the past three months, which may not be sustainable given slowing job and income growth.
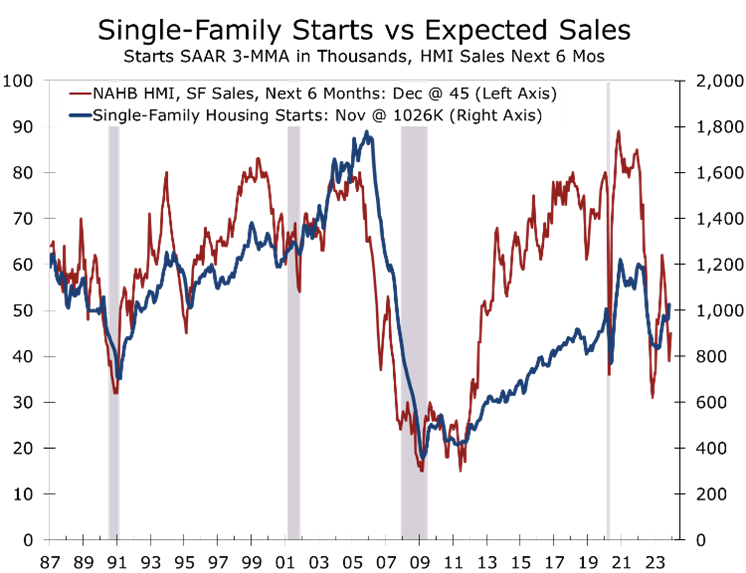
Home Builders expect demand for new homes to remain strong as existing home sales founder.
Building permits, which are less impacted by weather, fell 2.5% to a 1.468-million unit pace. Permits for single family homes rose 0.7% to a 976,000-unit pace, marking the 10th consecutive increase and highest level for single-family permits in 18 months.
Home builder confidence rose 3 points in December to 37 but expected sales over the next six months leapt 6 points to much more healthier 45. Builders are clearly more upbeat about the sales outlook and expect sales to benefit from the recent slide in mortgage rates. New home sales will also continue to benefit from less competition from existing homes.
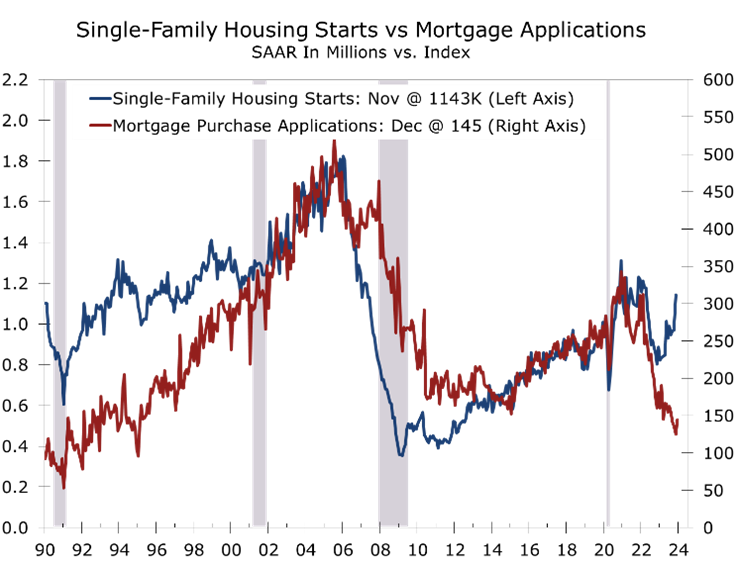
Home builders appear to be betting interest rates will remain lower and existing homeowners will continue to be reluctant to put their homes on the market. Single-family housing starts have typically closely followed mortgage purchase applications. The two have diverged more recently, however. This discrepancy may be due to sampling issues, as many home builders now provide financing through affiliates and then sell those mortgages into the secondary market. These mortgages might not be fully reflected in the weekly MBA survey.
Builders are banking on interest rates remaining low and existing homeowners remain in place.
Builders may also simply be striving to have inventory in place ahead of the spring selling season. New home sales have been steadily gaining market share from existing sales, inventories of which remain near historic lows. Mortgage rates are currently 140 basis points below their fall highs and will likely remain around 6.5% this spring. That should be low enough to bring out buyers but not so low to entice a torrent of existing homes back on the market.
The strength in single-family starts is good news for Q4 GDP growth, and housing will also be less of a drag on economic growth in 2024. The stronger numbers present some upside risk to our forecast for 1.6% real GDP growth in Q4 and 1.1% growth in 2024.
Multi-family starts rose a stronger than expected 6.9% to a 417,000-unit pace, the highest level since July. The rise, however, does not signal a reversal in the correction in apartment building currently underway. Multi-family permits fell 8.5% to a 484,000-unit pace. After a 15% decline in 2023 to 417,000 units, we expect multi-family starts to fall 25% in 2024 to 340,000 units.
A record 1.04 million multi-family units are currently under construction. The pipeline is improving as shortages and bottlenecks have eased. On a 12-month moving average basis, multi-family starts peaked last November at 555,000 units and have since declined 14.4%. The decline is more pronounced on a 3-month moving average basis, with starts down 32.5% to 399,000 unit. Permits have decreased even more significantly, while completions continue to rise.
Apartment construction has peaked but starts are showing a surprising degree of resilience.
With historically low housing affordability, strong demand for apartments is bolstering developer confidence in proceeding with planned projects. Banks remain cautious about lending for new apartment developments, which will continue to weigh on starts.

Disclaimer: This publication has been prepared for informational purposes only and is not intended as a recommendation offer or solicitation with respect to the purchase or sale of any security or other financial product nor does it constitute investment advice.
Consumer Confidence Edges Higher in November
A Mixed Bag Ahead of the Holidays
- Consumer Confidence rose a stronger-than-expected 2.9 points to 102.0 in November, following three consecutive declines.
- The expectations component rose 5.1 points to 77.8, accounting for all of November’s increase. By contrast, current conditions slipped 0.4 points to 138.2.
- Consumers’ assessment of current labor conditions was mixed, with the share stating jobs are ‘plentiful’ (+1.4 pp to 39.3%) and the share stating that jobs were ‘hard to get’ (1.3 pp to 15.4%) both rising in November.
- Consumers are more optimistic about their income prospects, however, with 17.2% expecting their incomes to increase over the next six months (+1.6 pp), and just 12.1% expecting their incomes to decline (-1.3 pp).
- Consumers remain generally upbeat about employment and income prospects, which is a bit of good news ahead of the holiday season. We still look for holiday retail sales to rise at the lower end of the National Retail Federation’s 3% to 4% forecast.
November’s 2.9-percentage point increase in the Consumer Confidence Index exaggerates the extent of the improvement seen this past month. While Consumer Confidence posted its first increase since July, the gain was only possible because of a 3.5 percentage point downward revision to the prior month’s data, from 102.6 to 99.1. In other words, Consumer Confidence is actually lower today it was initially reported to be a month ago and currently sits at the second lowest level for this year.
All of November’s increase in Consumer Confidence came from an improvement in the expectations series, which rose 5.1 points to 77.8. That still leaves expectations at a fairly low level, however. Any reading below 80 is generally consistent with a recession.
Expectations for business conditions over the next six months remain guarded at best, with 17.3% of consumers expecting conditions to improve over the next six months (+1.8 pp) against 19.5% expecting conditions to worsen (- 1.4 pp). Consumers are also looking for continued moderation in employment conditions, with 19.6% expecting fewer jobs to be created (-0.1 pp) and just 16.1% expecting more jobs to be created (+0.8 pp).
Consumers are slightly more optimistic about the outlook for their personal finances.
Consumers remain more upbeat about their personal finances. The share expecting their income to increase rose 1.6 pp to 17.2% in November, while the share expecting their incomes to decline fell 1.3 pp to 12.1%.
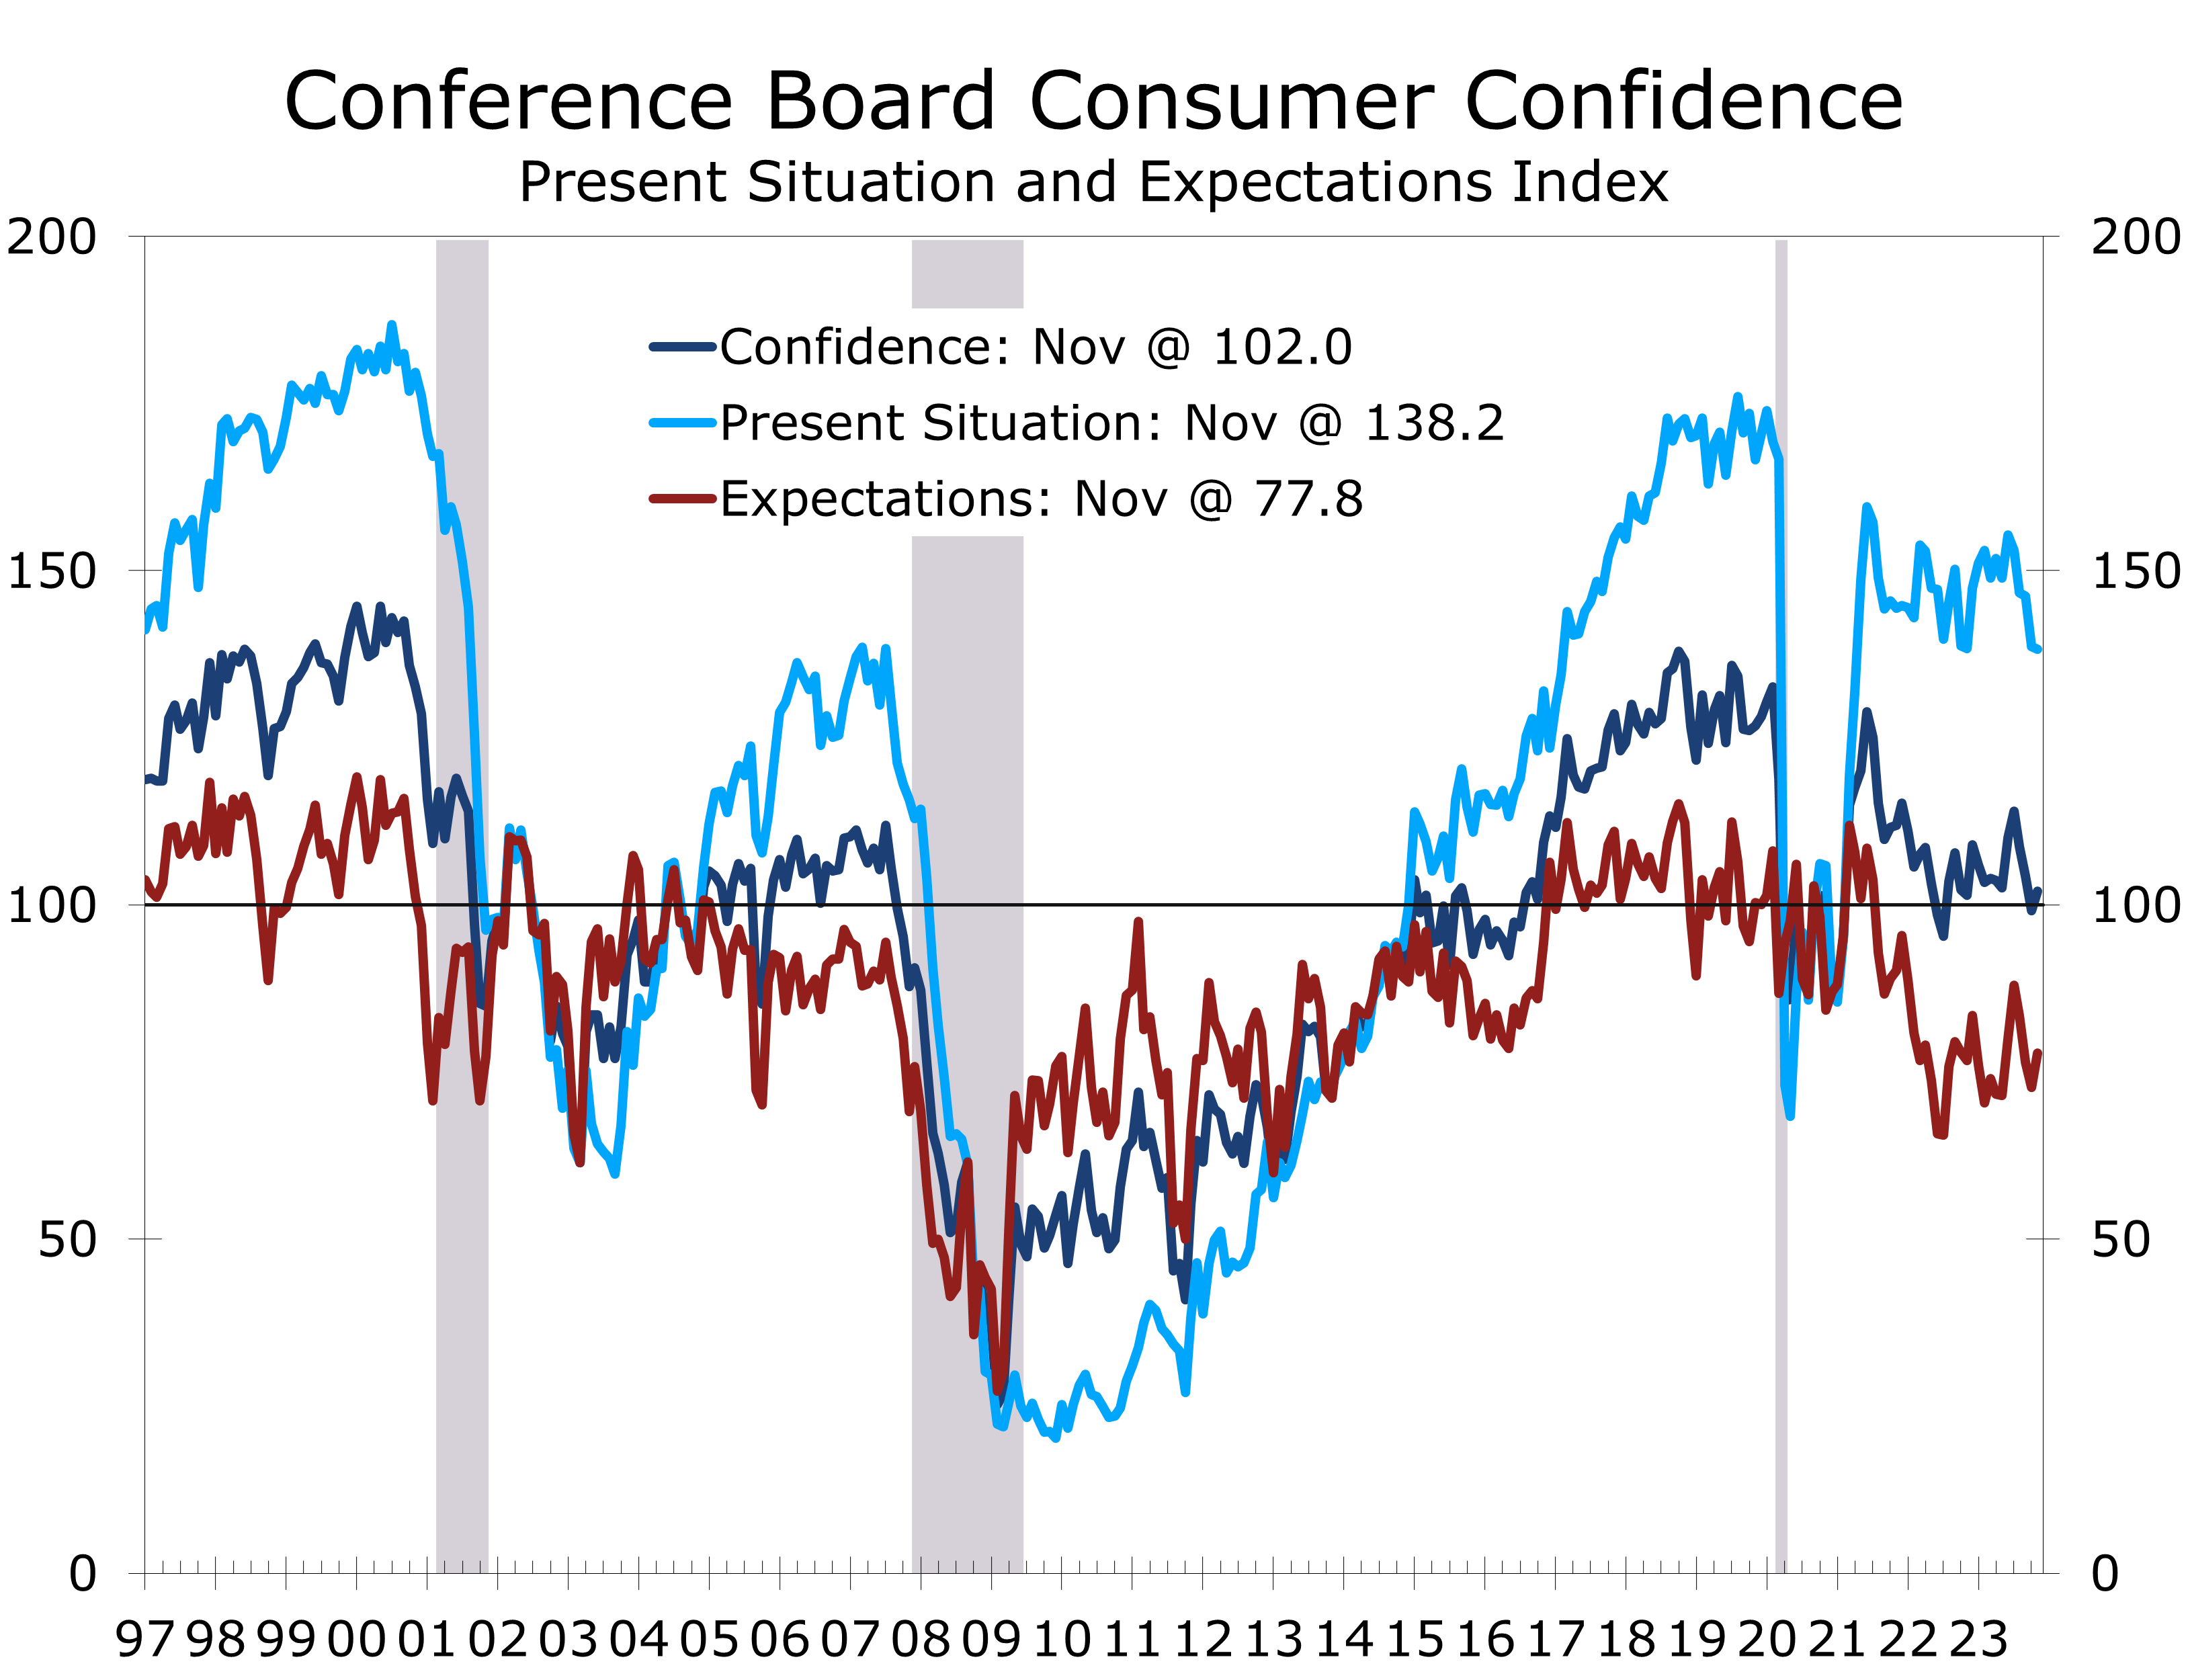
Consumer expectations are generally a better predictor of consumer behavior than either current conditions or consumer confidence. Despite the low level, the improvement is a positive for the holiday season and aligns with our forecast of a 3.2% rise in holiday retail sales. Several other measures of consumer expectations also improved, including the share expecting interest rates to drop over the next year as well as year-ahead inflation expectations, which fell from 5.9% to 5.7%.
Consumers’ outlook for stock prices continued to weaken, despite the early start to the Santa Claus rally that began following October’s better than expected CPI report. That improvement came only a couple days before the preliminary November Consumer Confidence Survey concluded on November 15.
Consumers are looking for a continued moderation in employment conditions.
Consumers’ assessment of current employment conditions remains unambiguously positive, yet hiring is clearly moderating and expected to continue to do so. The share of consumers perceiving jobs were plentiful in November rose 1.4 pp to 39.3%, while the share seeing jobs as hard to get rose 1.3 pp to 15.4%. Nonfarm employment growth has closely followed the jobs plentiful series and should continue to moderate.

The recent uptick in the jobs ‘hard to get’ series is consistent with the recent rise in the unemployment rate, from 3.4% in April to 3.9% currently. That said, consumer confidence remains more consistent with a soft landing rather than a recession, a point that is amplified by the 0.2 pp drop in year-ahead inflation expectations to 5.7%. The improvement comes at a time when gasoline prices have been sliding and prices for other goods and services have generally been rising less rapidly.
Consumer Confidence remains confounding, yet it aligns more with a soft landing than recession.
Consumers’ perceived likelihood of recession over the next 12 months, as tracked by the Conference Board, fell more than 3 pp in November to its lowest level this year. Hold the champagne, however, as even after this drop nearly two-third of consumers expect a downturn over the next 12 months. The Conference Board also noted November’s increase in consumer confidence was concentrated on householders aged 55 and up, while confidence among those aged 35 to 54 declined slightly. This split reinforces our cautious view on spending this holiday season.
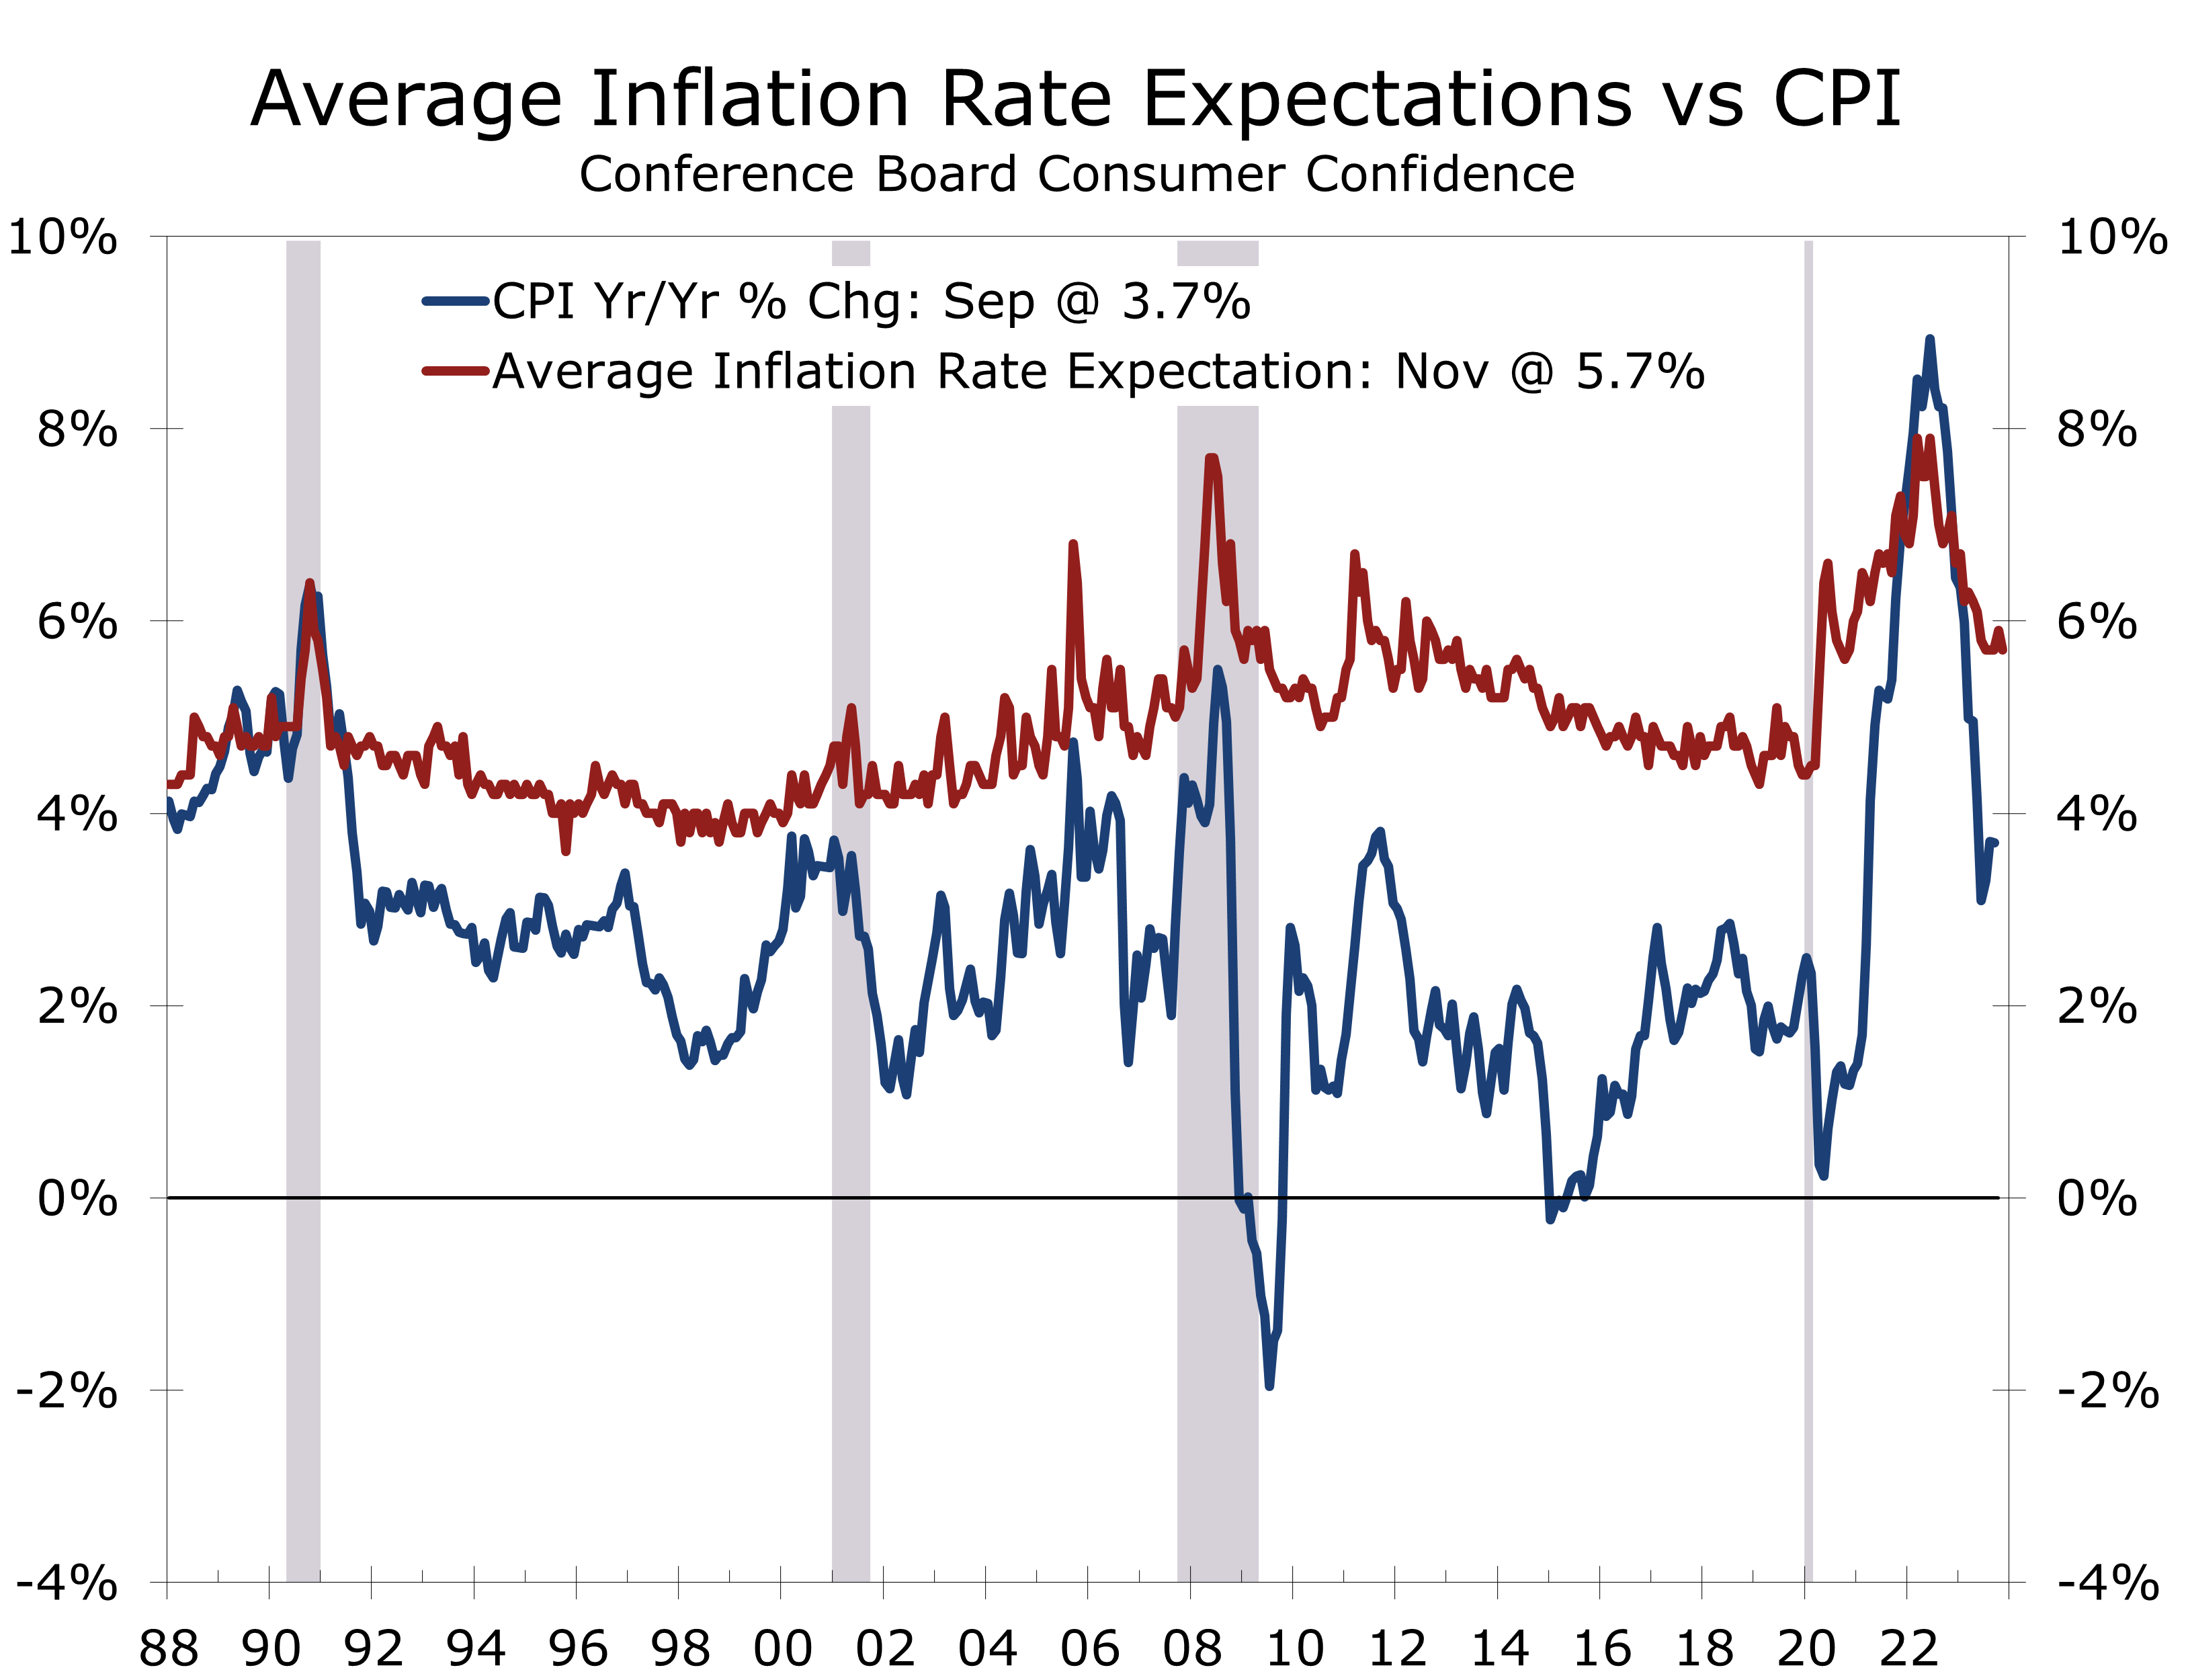
Disclaimer: This publication has been prepared for informational purposes only and is not intended as a recommendation offer or solicitation with respect to the purchase or sale of any security or other financial product nor does it constitute investment advice.