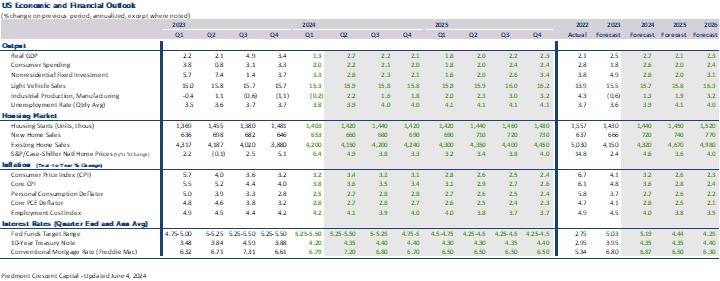
Real GDP Rebounds Solidly in the Second Quarter
Economic Growth Looks Solid on the Surface
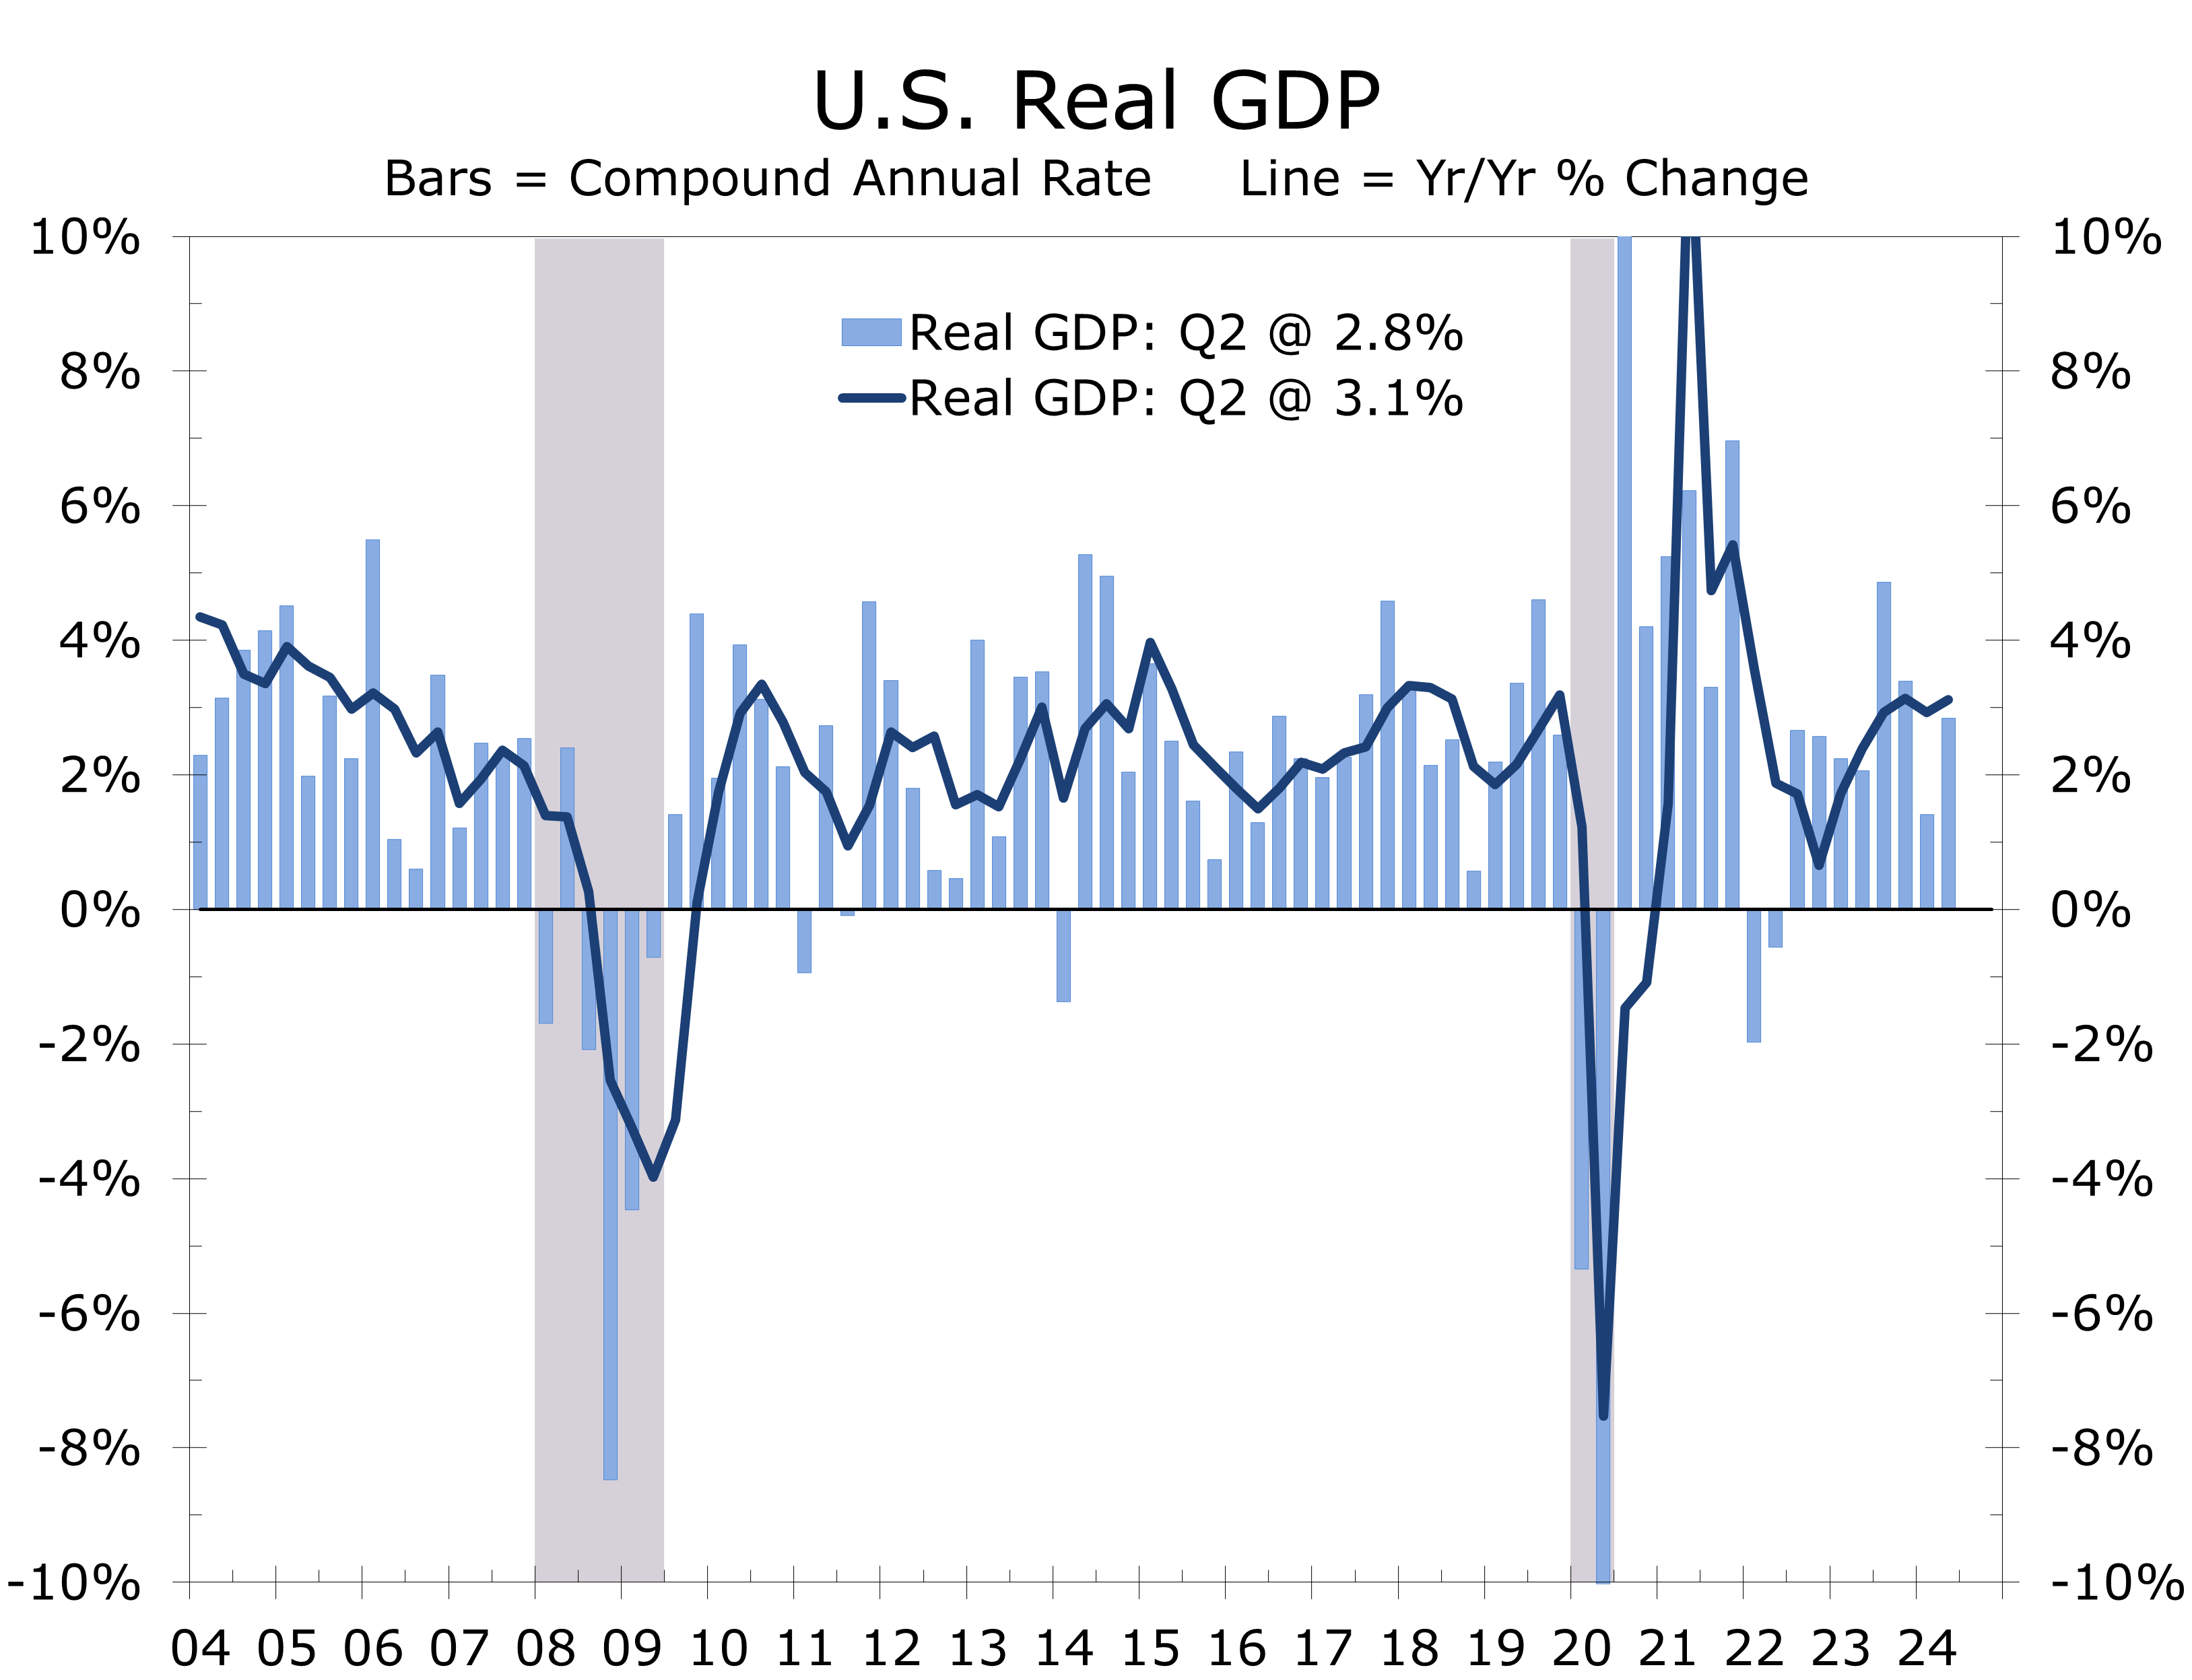
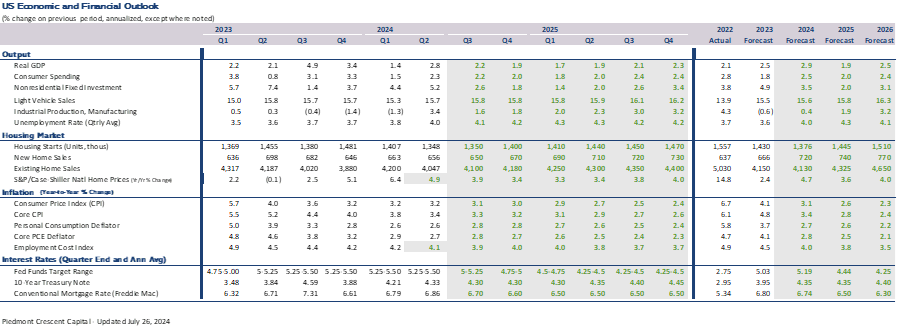
- Real GDP grew at a 2.8% annual rate in Q2, up from 1.4% the previous quarter and easily topping expectations centered around a 2% pace. Real GDP is up 3.1% year-to-year.
- Private domestic demand held strong, with consumer spending (+2.3%) and business fixed investment (+5.4%) both rising solidly.
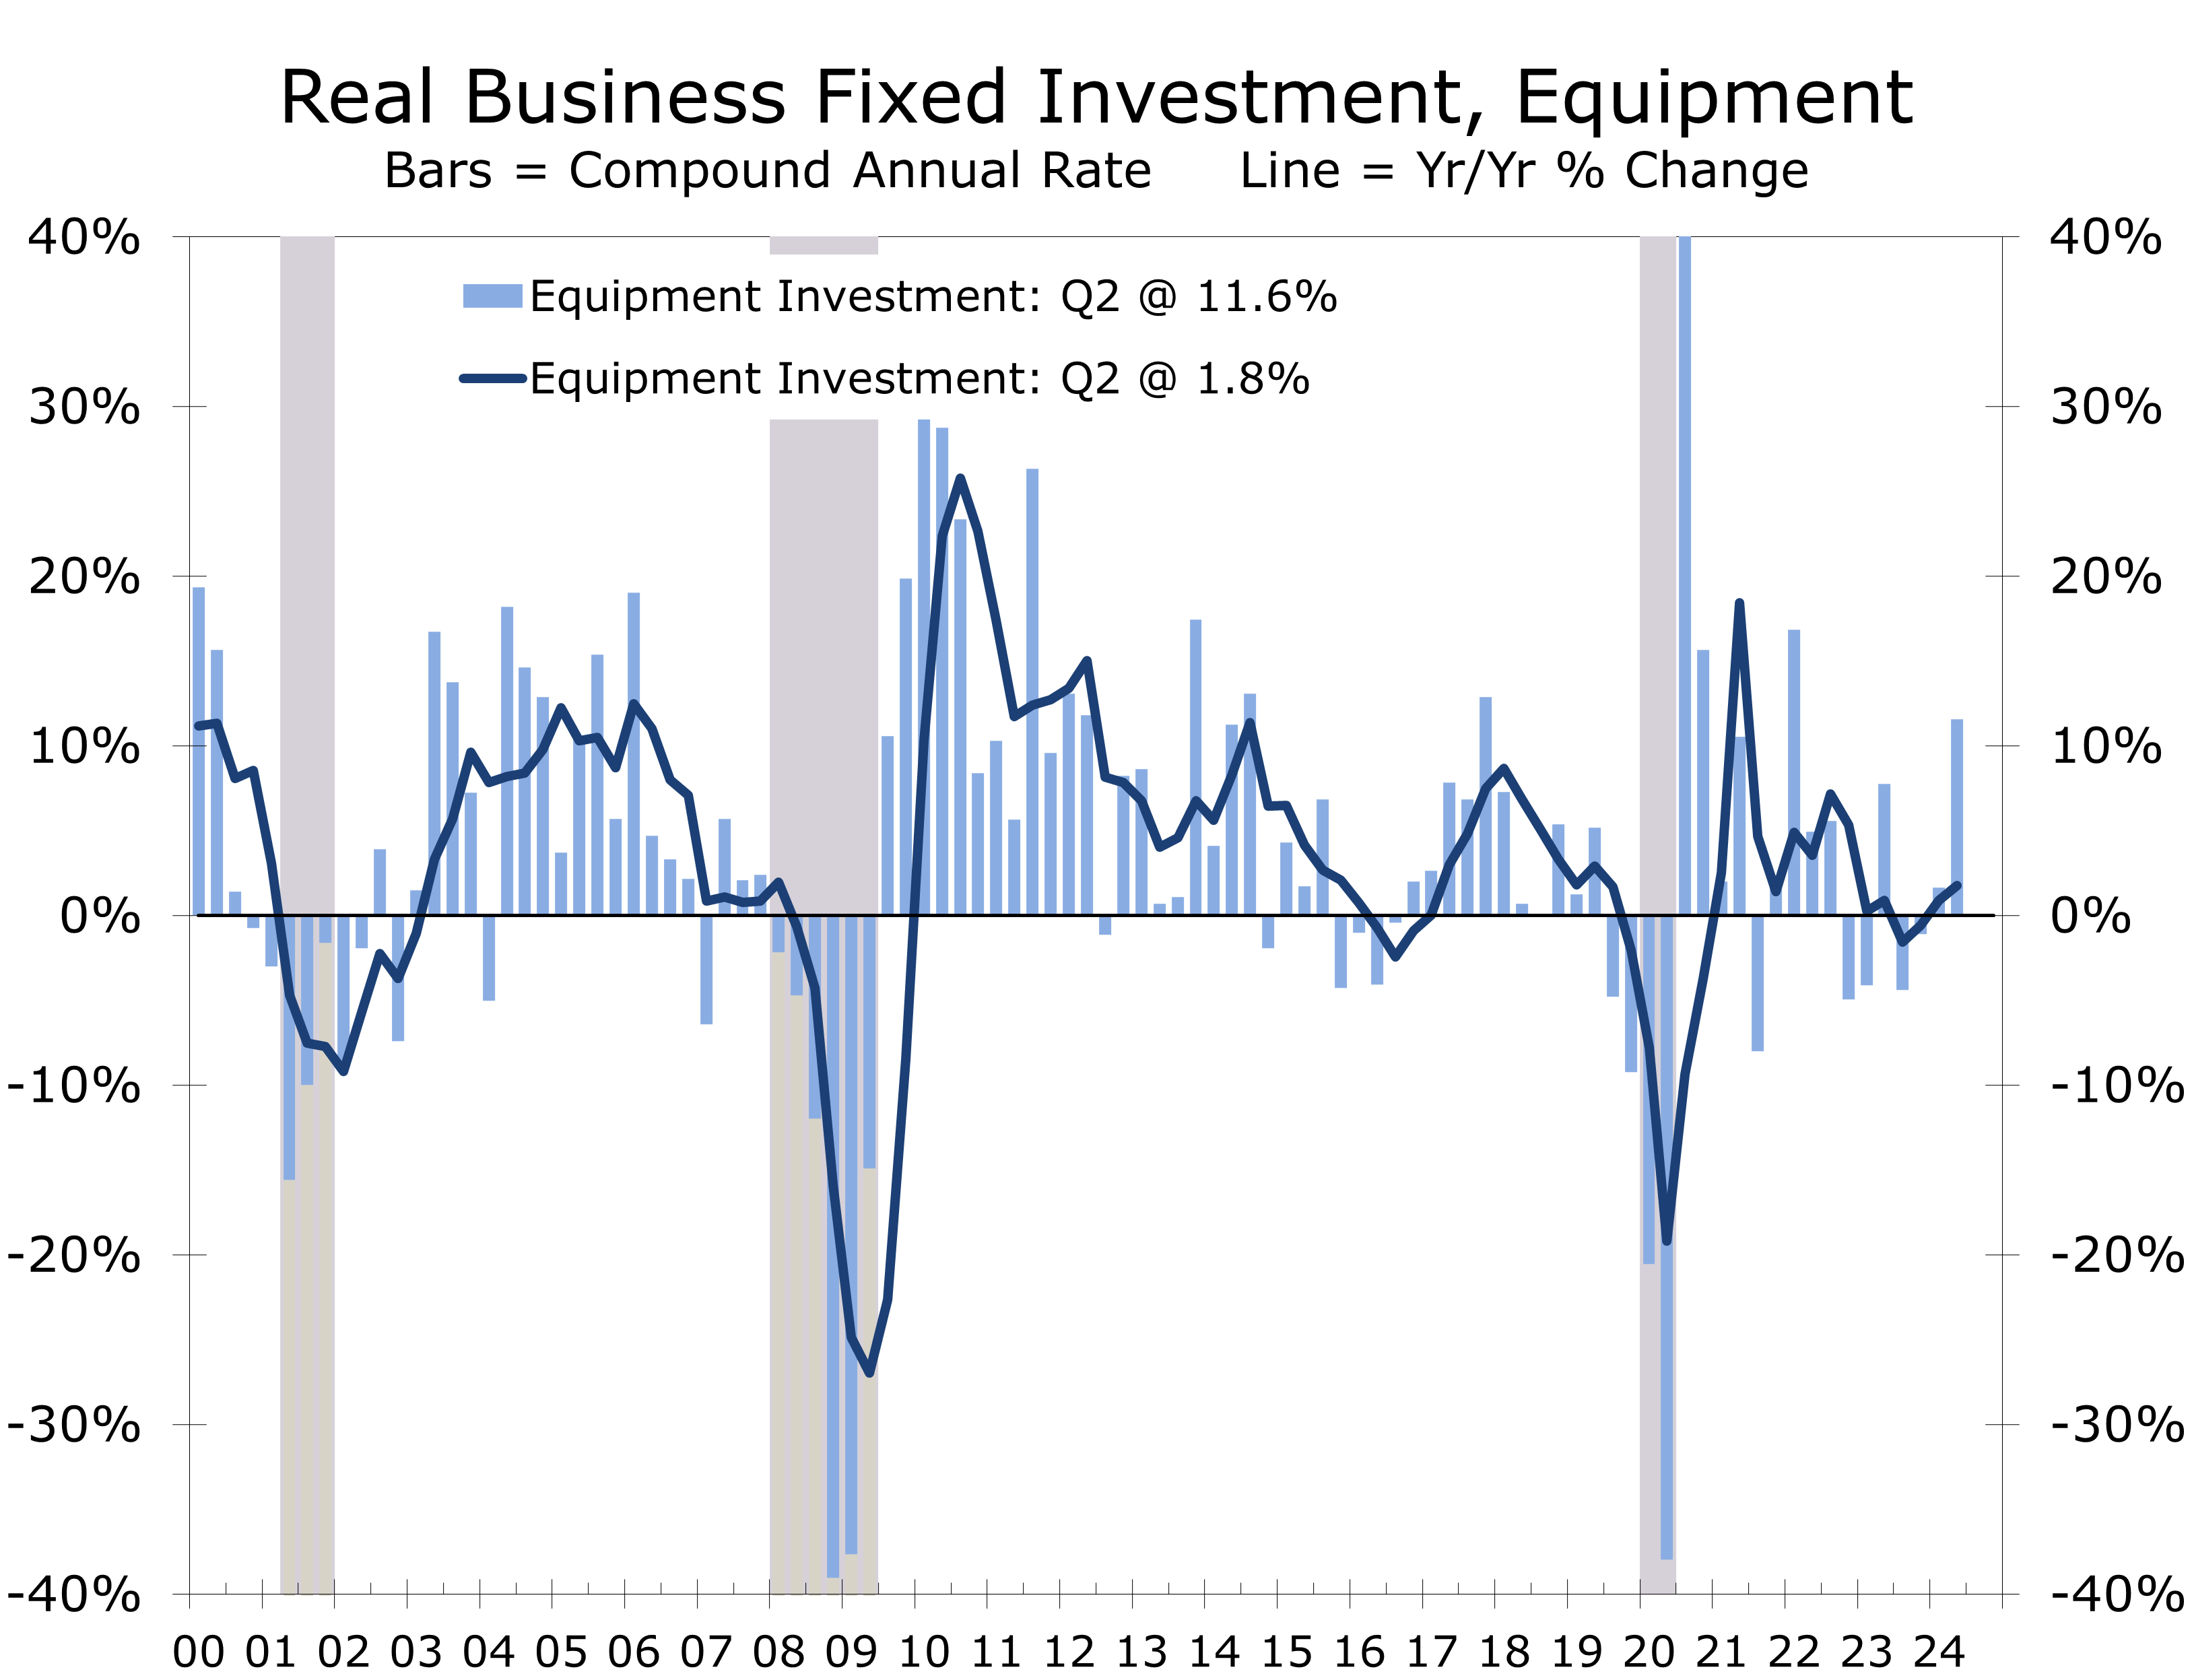
- Equipment outlays were particularly strong climbing at 11.6% annual rate.
- Residential and nonresidential construction both declined during the quarter, falling at a 1.4% and 3.3% pace, respectively.
- The strength in private domestic demand was offset by a 6.9% surge in imports, led by capital goods. The wider trade gap sliced 0.7 percentage points of Q2 growth.
- Inventory building added 0.8 percentage points to Q2. Final sales rose at a 2% pace.
- Government spending climbed at a 3.1% pace, led by a surge in defense outlays.
- The uptick in Q2 real GDP eliminates any urgency for the Fed to cut rates in July. Despite the uptick, growth is losing momentum and continues to be driven by spending for health care, travel and entertainment, and government.
Real GDP grew at a 2.8% annual rate in Q2, up from 1.4% in Q1 and exceeding the 2.0% consensus expectation. Growth was driven by a 2.3% increase in consumer spending and an 11.6% rise in business investment in capital equipment. Inventory building contributed 0.8 percentage points to GDP, reflecting efforts to mitigate potential supply chain disruptions and stay ahead of a possible Longshoreman’s strike. Additionally, government spending rose, primarily due to a rebound in defense outlays.
Consumer spending rose at a 2.3% pace in Q2. Goods purchases rebounded by 2.5%, reversing the previous quarter’s decline, while services outlays increased by 2.2%. The rise in durable goods spending was primarily driven by motor vehicles and parts, as well as spending for other big-ticket items. For nondurables, increased spending on gasoline, groceries, and pharmaceuticals led the gain.
Consumer spending rose solidly across most major categories this spring.
Services outlays were paced by another large gain in health care spending. Doctors and dentists are still doing a brisk business as people make up for appointments put off during the pandemic. Exceptionally strong demand for prescription weight-loss drugs is also likely providing a boost. Spending for housing and utilities, and recreation services also increased. The broad-based strength in consumer spending should assuage any fears that consumers are tapped out.
Business fixed investment grew at a robust 5.4% annual rate in Q2, driven by an 11.4% surge in equipment spending and a 4.5% rise in intellectual property products. These gains were partially offset by a 3.5% decline in structures investment.
Equipment spending benefited from catch-up demand due to previous shortages of key parts and materials, leading to a significant buildup in backorders. Transportation equipment surged nearly 50% annually, and IT equipment spending rose at a 10.5% rate. Future investment should be bolstered by outlays for new data centers and chipmaking equipment.
The AI boom and CHIPS act are expected to support capital spending in coming quarters.
The AI boom and the CHIPS Act are fueling a significant rise in spending on intellectual property products, with software purchases up 6.5% and R&D outlays increasing by 3.4% in Q2. This growth appears durable, even in the face of potential political changes. However, the second quarter’s rebound in equipment outlays is likely unsustainable. The surge in transportation equipment spending mainly reflects a catch-up in deliveries of commercial and military aircraft. Core capital goods orders have been trailing equipment purchases, hinting at a potential slowdown in the latter half of the year.
Investment in nonresidential structures declined at a 3.3% annual rate in Q2, following six quarters of gains. The drop reflects declines in office and warehouse projects, along with a slowdown in oil and gas exploration. The Baker Hughes RIG count declined steadily in Q2. Residential investment also fell, sliding at a 1.4% annual rate and ending three consecutive quarters of increases. Reduced new home construction and a continued drop in existing home sales, which impacted brokerage commissions, drove this decline. Spending on renovations and improvements rose, however, supported by the continued rise in home prices.
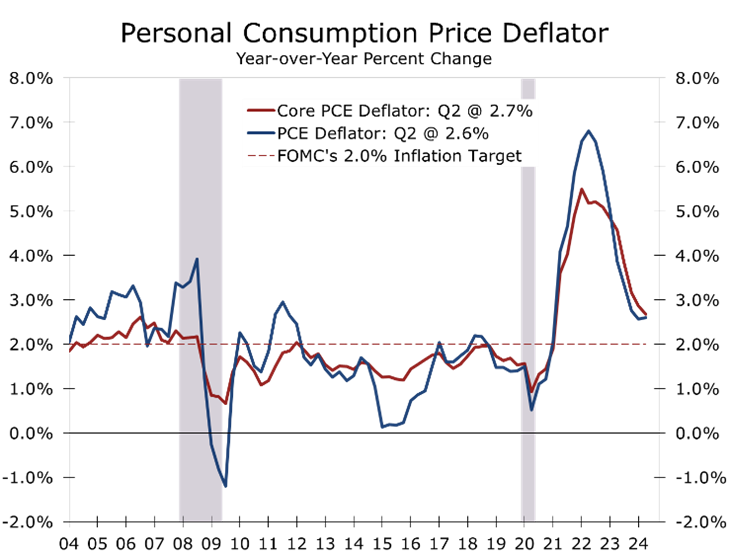
Inflation remained subdued, with the GDP price index rising at a 2.3% annual rate in Q2, down from a 3.1% pace in the first quarter. The core PCE deflator, the Fed’s preferred inflation measure, rose at a 2.9% pace, down from 3.7% in Q1. The reversal should further ease concerns that inflation might flare back up ahead of the Fed’s key decision on when to begin to cut the federal funds rate.
One caveat in the otherwise solid Q2 GDP report is that government, health care, and leisure and hospitality outlays accounted for a disproportionate share of the economy’s growth, mirroring trends in the jobs data. While there were bright spots in the more cyclical parts of the economy, these may prove fleeting as factory orders and mortgage applications continue to weaken.
Disclaimer: This publication has been prepared for informational purposes only and is not intended as a recommendation offer or solicitation with respect to the purchase or sale of any security or other financial product nor does it constitute investment advice.
Higher Mortgage Rates Continue to Weigh on Existing Home Sales
Affordability Hurdles Limit Existing Home Sales
- Existing home sales fell 5.4% in June to a 3.89-million-unit pace and are also down 5.4% on a year-to-year basis.
- Sales are well below their pandemic lows and essentially running even with levels hit at the bottom of the Global Financial Crisis.
- Sales of existing single-family homes fell 5.1 in June and are down 4.3% over the past year. Sales of condominiums and co-ops fell 7.5% in June and are off 14% year-to-year.
- The inventory of unsold homes rose 3.1% to 1.32 million units at the end of June and translates to a 4.1-month supply.
- The median price of an existing home rose 4.1% year-to-year to $426,900. Prices are up 9.7% in the Northeast, 5.5% in the Midwest, 3.5% in the West and 1.7% in the South.
- Sales fell in every region, led by an 8.0% drop in the Midwest and 5.9% drop in the South. Sales fell in every region year-to-year except the West, which was unchanged.
- Affordability challenges persist, but rising inventories are gradually balancing the housing market and offering buyers more options. With mortgage rates falling, sales should improve this fall.
Sales of existing homes fell by 5.4% in June to a 3.89-million-unit annual rate. Persistently high mortgage rates and record-high home prices have sidelined many potential buyers. However, sales of higher-priced homes are holding up relatively well, helping pull the median price 4.1% higher year-over-year to a record $426,900 in June.
The rise in median home prices highlights the ongoing economic disparity in the U.S. Upper-income households are benefiting from a booming stock market, while middle-income families struggle with increasing costs for food, transportation, and housing. Over the past year, sales of single-family homes priced at $1 million or more have risen by 15%, while sales of all other homes have fallen by 5.9%. Many middle-income buyers have been priced out of the market and continue to rent.
Higher home prices and persistently high mortgage continue to weigh on home buying.
Regional variations in sales contributed to higher home prices. In the West, the highest-priced housing market with a median price of $629,800, sales remained unchanged year-over-year. By contrast, sales fell by 6.9% in the South, where the median is $373,000, and by 6.1% in the Midwest, with a median price of $327,100—both regions being larger and more affordable than the West. In the Northeast, another high-priced but smaller market with a median price of $521,500, sales declined by 6% year-over-year.

June’s decline in home sales, although slightly larger than expected, is not surprising. Existing home sales reflect closings, which typically lag pending home sales (signed purchase contracts) by one to two months. Pending home sales have dropped sharply over the past year, as many potential buyers are choosing to wait for mortgage rates to decrease further.
According to Freddie Mac, mortgage rates averaged 6.77% during the week of July 18, an improvement from recent months when rates hovered around 7%. We anticipate that more buyers will return to the market once rates drop below 6.50%, which we expect to happen this fall. However, a return to sub-4% mortgage rates is unlikely, and buyers will need to adjust to rates in the 6% to 7% range.
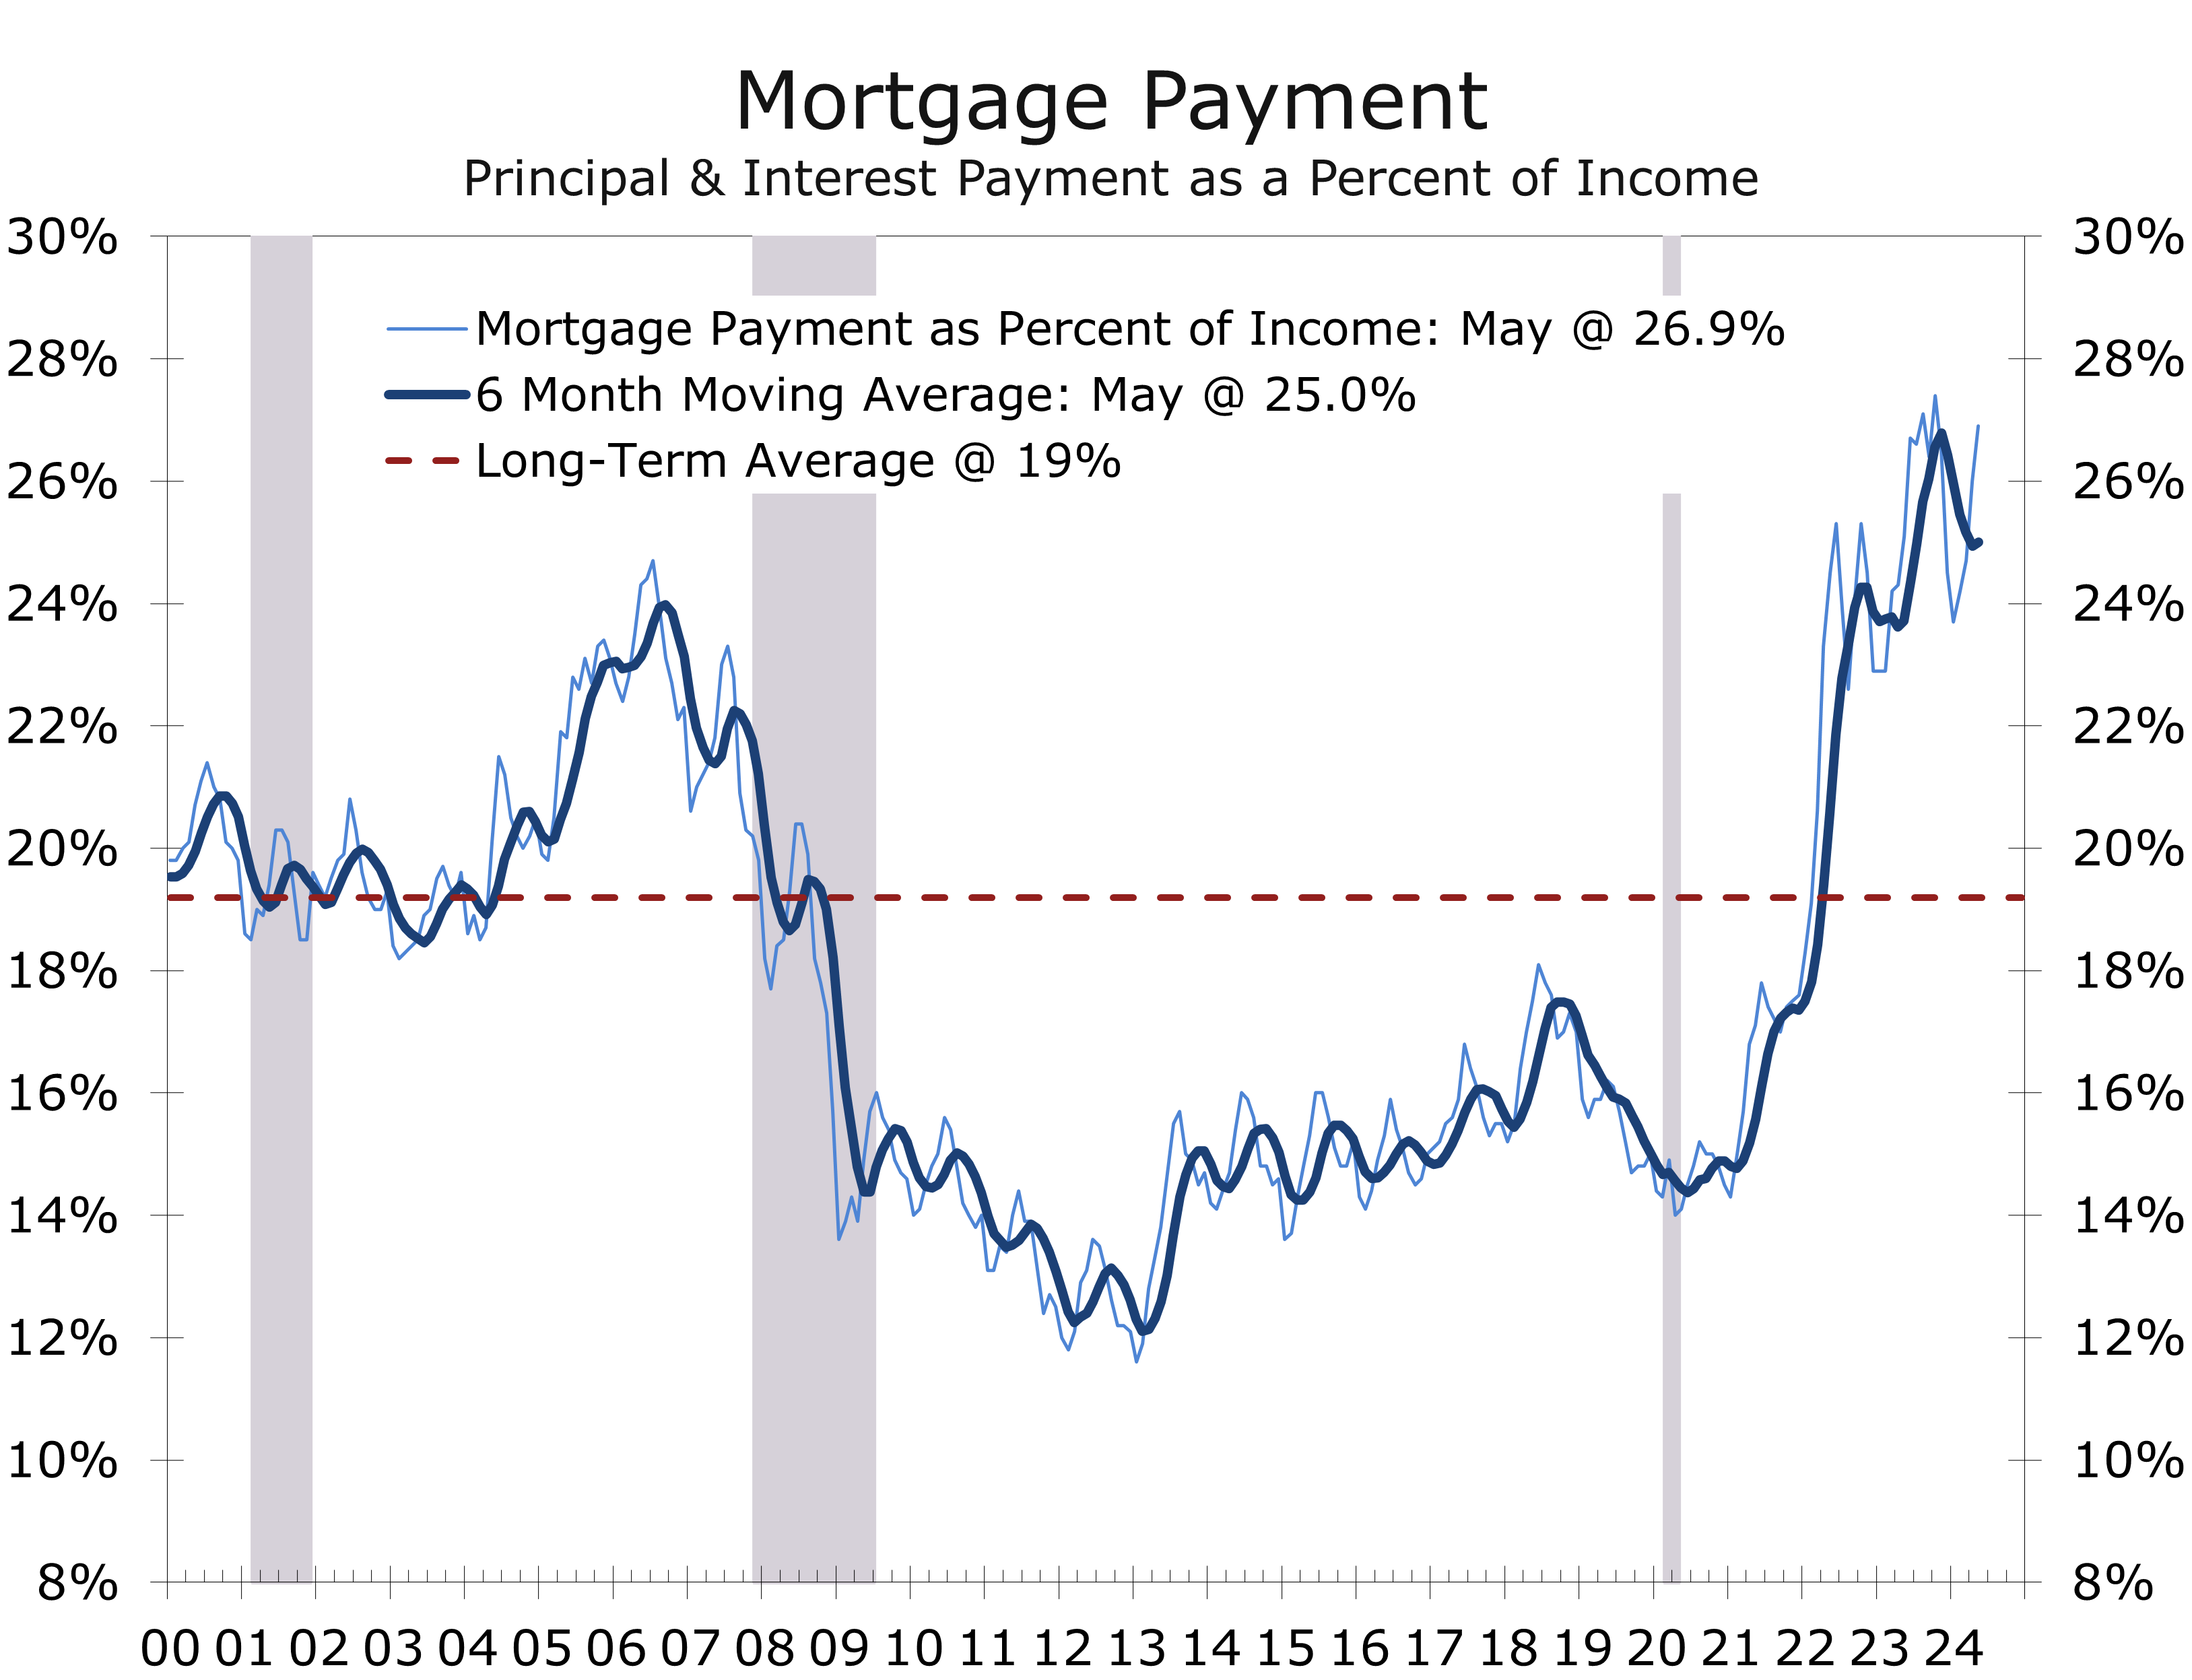
Higher home prices and persistently high mortgage rates have significantly impacted affordability. For a family purchasing a median-priced home with a 20% down payment, monthly principal and interest payments have soared from $984 in February 2020 to $2,291 in May 2023, a 132% increase. These payments now consume 26.9% of the median household income, up from 14% before the pandemic and well above the long-term norm of 19%. Consequently, we anticipate only a modest rebound in sales, even as mortgage rates decline this fall.

The high cost of homeownership is prompting many current homeowners to stay put, especially those with homes owned outright or financed with 30-year fixed mortgages at 4% or less. This “lock-in effect” is significantly impacting the economy by reducing housing turnover and limiting options for prospective buyers, which is further discouraging trade-ups, downsizings, and relocations.
The slowdown in new home sales has also affected related sectors. Furniture and home furnishings sales have dropped 6.8% over the past year, and sales at home improvement stores have also struggled. Typically, there is substantial spending to prepare homes for sale and again after purchase, but this has decreased. Spending on home improvements has grown more slowly, mirroring trends in home sales, with stronger performance at the high end of the market compared to the middle and lower ends.
This weakness in existing home sales is expected to produce a slight drag on second-quarter GDP growth. Besides the direct effects on housing-related spending, existing home sales impact real GDP through Realtors’ commissions and fees earned by lenders, insurers, appraisers, home decorators, and others.
Disclaimer: This publication has been prepared for informational purposes only and is not intended as a recommendation offer or solicitation with respect to the purchase or sale of any security or other financial product nor does it constitute investment advice.
Mark Vitner, Chief Economist
mark.vitner@piedmontcrescentcapital.com
(704) 458-4000
The Outlook & Newton’s Law of Motion
What Newton’s Law of Motion Means for Fed Policy
In light of recent political news, new inflation data, and next week’s FOMC meeting, we are releasing some supplemental thoughts to our most recent monthly forecast. We have also updated the forecast with the latest GDP and personal income data.
As we noted in the CAVU Compass, second quarter real GDP surprised to the high side, as increased inventory building added 0.8 percentage points to growth. Inventories are one of the most volatile components of GDP and hardest to forecast ahead of the advance report. Businesses appear to have stocked up as a precaution against lengthening delivery times due to the disruptions to shipping around the Red Sea, as well as to rising fears of a Longshoremen’s strike.
The advance report will be revised next month, and the BEA will release comprehensive revisions going back the past five years in September.
We look for the Fed to set the table for lower interest rates at the July FOMC meeting and then further outline the mechanics of how monetary policy impacts the economy at the annual Jackson Hole symposium. The first quarter-point cut should come in September, followed by another cut in December. We expect a total of four or five quarter point cuts, pulling the federal funds rate down to around 4.25%.
The yield curve should flatten as cuts become more evident and possibly normalize. This is usually a warning sign of a recession. The economy will be at risk during this transition and uncertainty surrounding the election may cause businesses to hold off on major projects.
The economy still has a great deal of stimulus left over from the pandemic, which is driving investment in new plant and equipment and important infrastructure. Consumer spending is being driven by higher asset prices and slower but still solid wage and salary growth.
As for politics, the most likely outcome remains a republican sweep in November, although the odds have diminished somewhat due to Biden handing off the democratic nomination to Kamala Harris. Either way, we expect major stimulus programs such as the Inflation Reduction Act and Infrastructure Act to remain in place in 2025. The “Trump tax cut” will likely be extended.
The political environment remains unusually volatile, and we will get a better read after the democratic convention and likely first Trump-Harris debate in September. – Mark Vitner, July 26, 2024
- There is increasing evidence the Fed has successfully countered the nation’s most serious bout with inflation in forty years. After a Q1 scare, nearly all measures show inflation cooled over the past three months, most patently expressed by June’s 0.1% drop in the headline Consumer Price Index – the first such drop since the pandemic. Various measures of core inflation are also easing, and wages continue to moderate as the labor market gradually returns to balance.
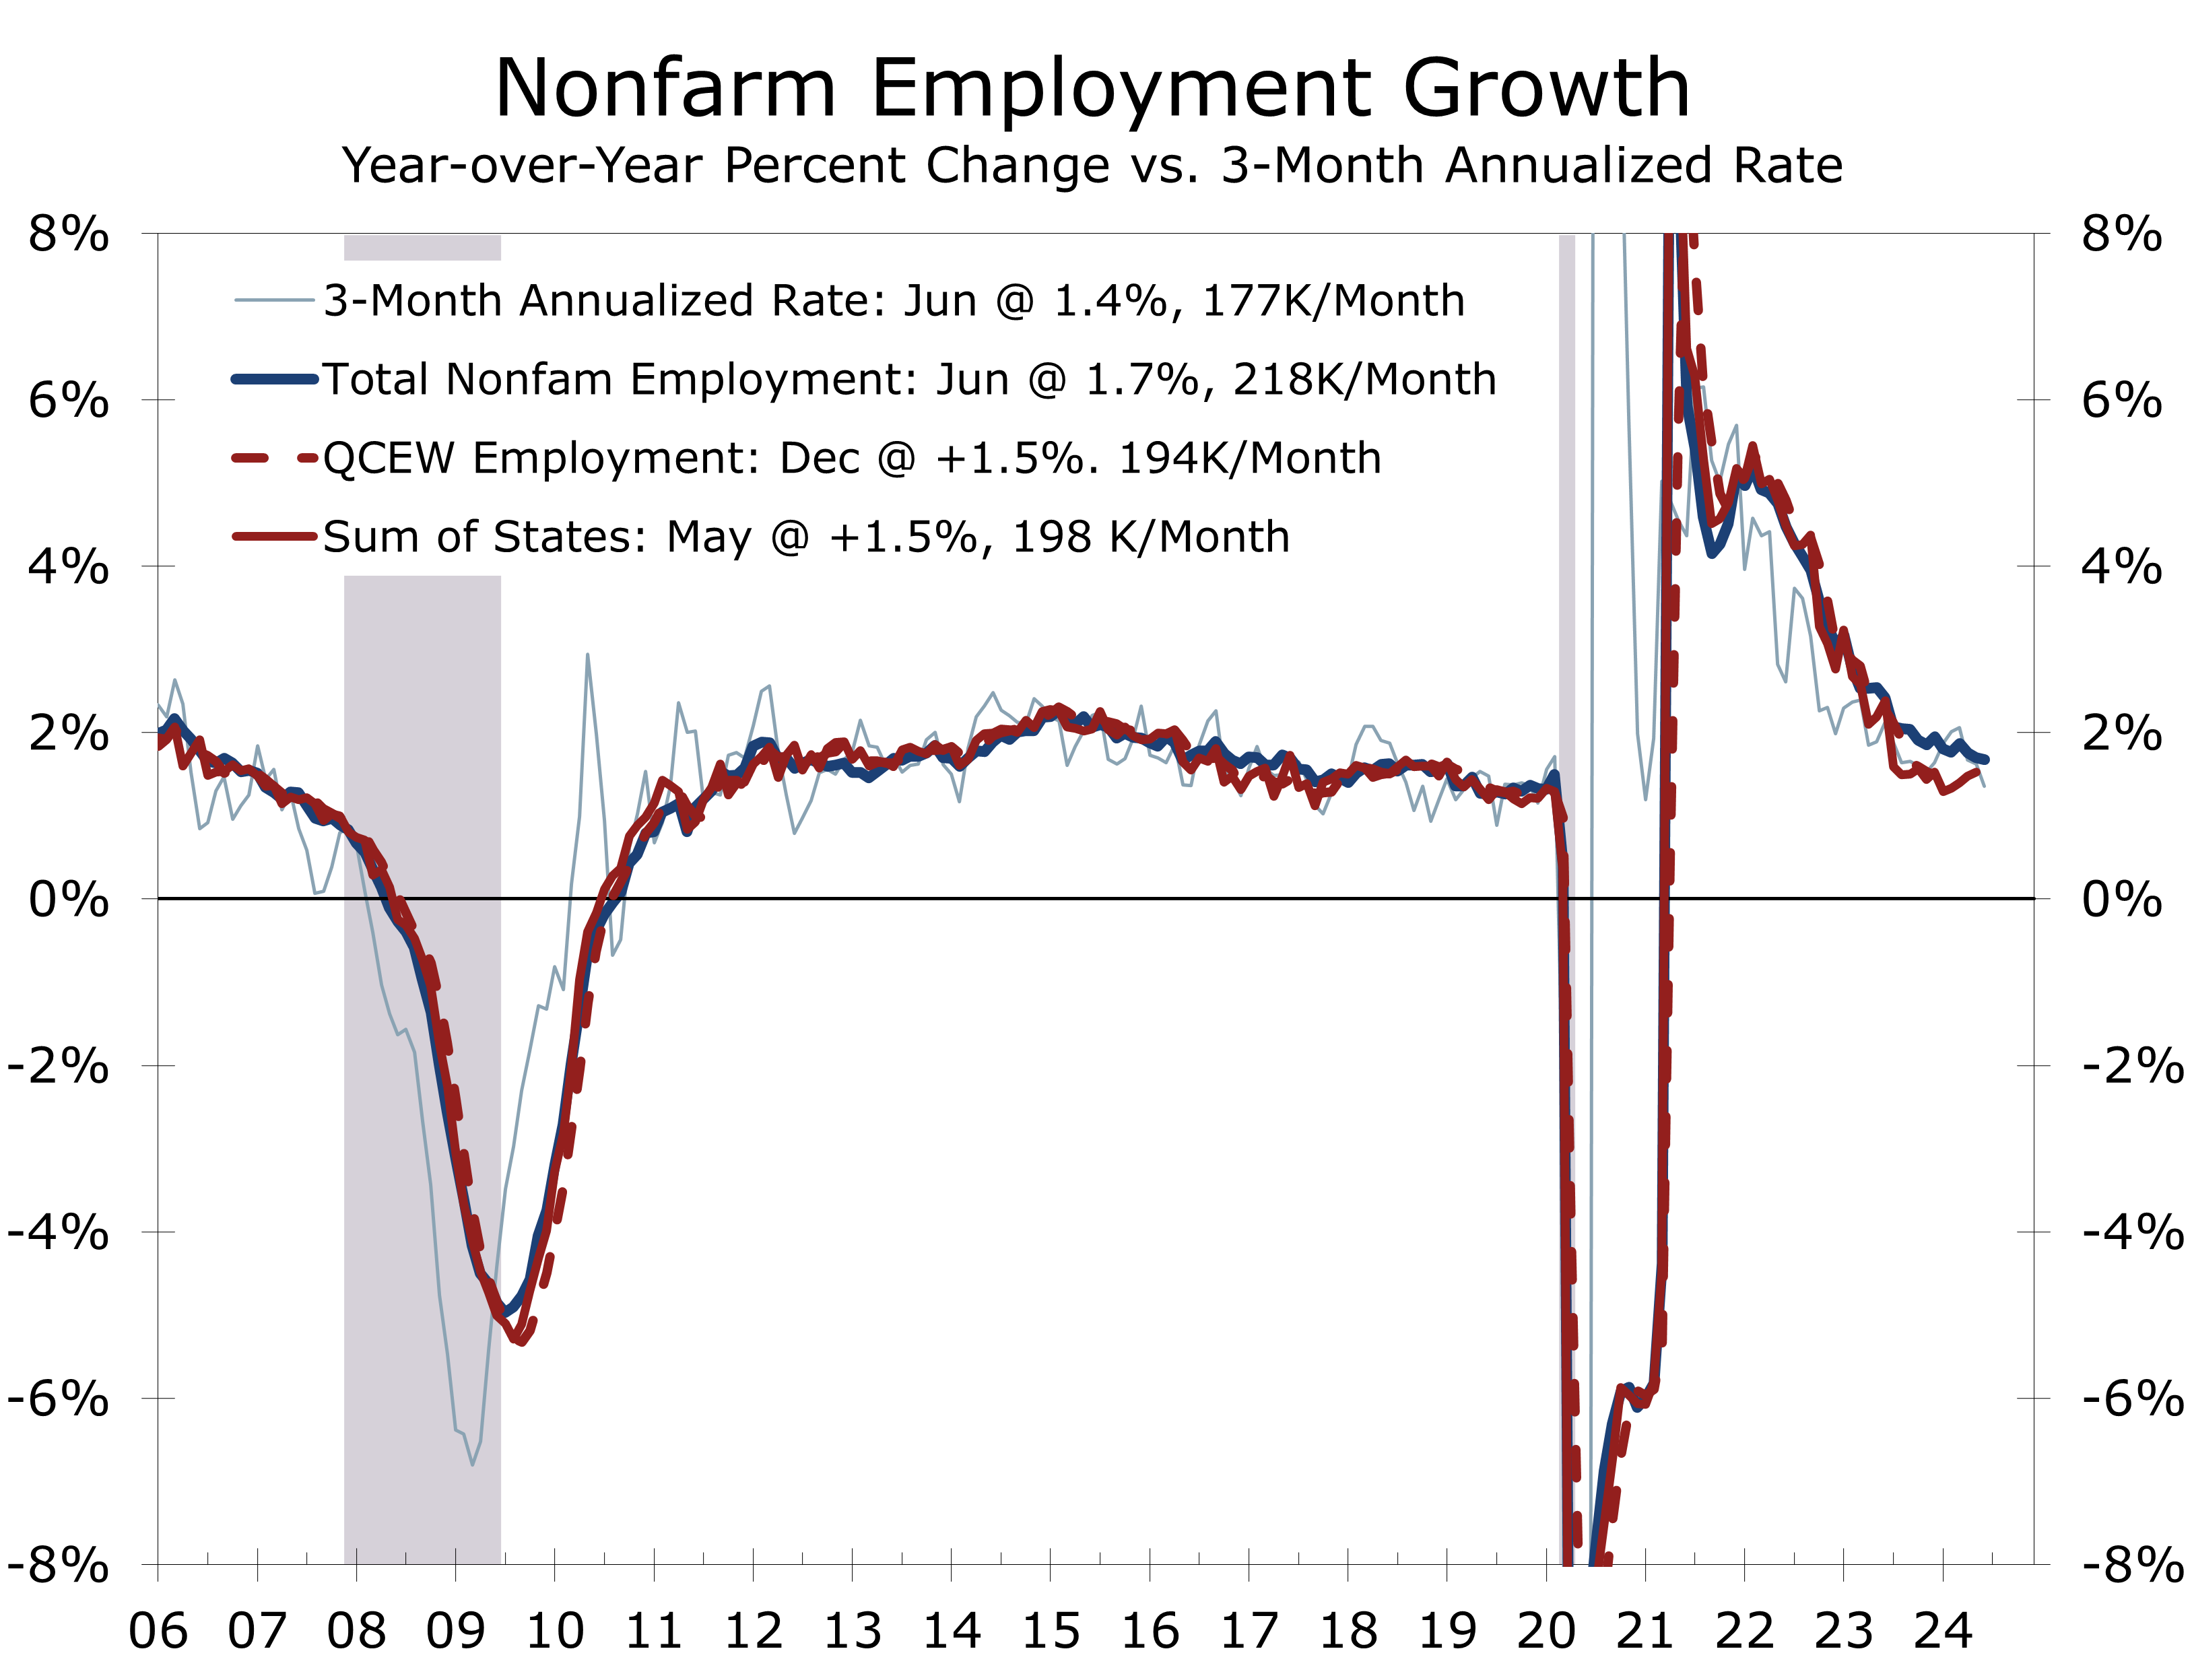
- Employment growth has slowed largely in line with our long-running forecast, with employers adding an average of 177,000 jobs a month for the past three months, down from 274,000 per month a year ago. The latest data are now more consistent with the Quarterly Census of Employment and Wages data, which are the source of the annual revisions. Hiring is also less broadly based than it was previously, with the bulk of job growth coming from just a handful of industries, including health care, social services, restaurants, and state and local government.
- Consumer spending remains solid. June retail sales came in stronger than expected, and sales for April and May were revised significantly higher. The widely followed Atlanta Fed GDPNow estimate, which began the quarter near 4%, rose from 2% to 2.5% following June’s stronger retail sales. Our own forecast remains at 2.2%, which is on the high side of the most recent consensus.
- The political environment has changed considerably, with the far-left winning elections in the UK and France. In the U.S., former President Trump has jumped ahead in most polls and leads in most swing states following the first presidential debate. The assassination attempt on the former president will likely change the tone of the campaign and make it more difficult for the Democrats to remove Joe Biden from the ticket. The most likely outcome currently is a Republican sweep in November. We will get a clearer view once we get past the mid-August Democratic convention.
- We have reduced our 2024 forecast slightly further, reflecting slower growth in the first half of the year. Inflation should continue to moderate, although we could see some periodic rebounds driven by seasonal adjustment issues. We look for the Fed to begin to cut interest rates in September, or possibly sooner, and expect four or five quarter-point cuts over the next year.
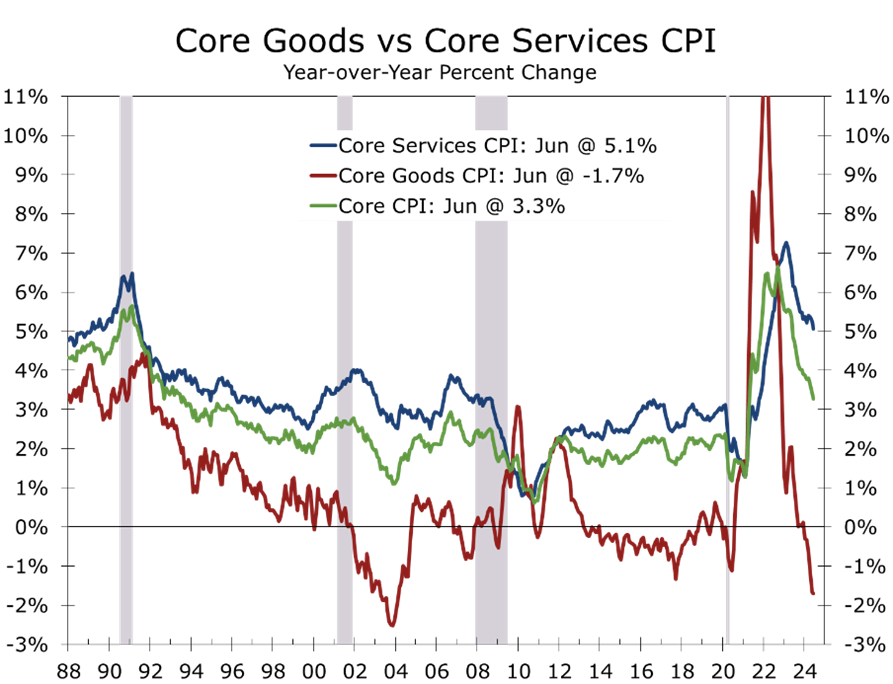
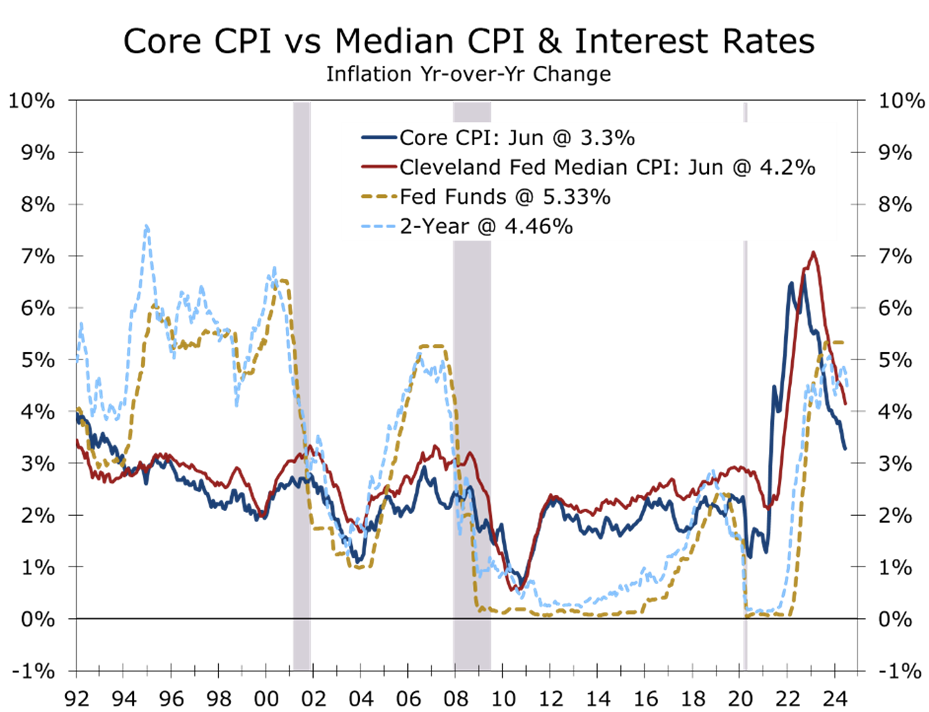
The inflation fever has finally broken, paving the way for lower interest rates. Nearly every major price index moderated meaningfully during the second quarter. The headline Consumer Price Index even posted a modest decline at the end of the quarter, as lower gasoline prices pulled the headline number down. Core inflationary pressures are also easing, with the core CPI slowing to 3.3% year-over-year in June and core services prices moderating to a 5.1% gain. Price pressures are also easing further back in the production pipeline. The Producer Price Index slowed to just 2.6% year-over-year in June, while average hourly earnings slowed to just a 3.9% rise over the past 12 months.
Suddenly, inflation looks far less menacing. The headline Consumer Price Index fell 0.1%, marking its first monthly decline since July 2022 and the largest drop since the throes of the pandemic back in 2021. A 2% seasonally adjusted drop in energy prices was responsible for much of June’s drop. Gasoline prices tumbled 3.8% in June, following a 3.6% drop the prior month. Food prices are also moderating. Overall food costs rose 0.2% in June and are up just 1.1% over the past year. Prices at the grocery store have risen 1.1%, while prices at restaurants are up 4.1%. With June’s decline, the CPI is now up 3.0% year-to-year, compared to its peak of 9.1% in June 2022 and just 2.3% prior to the onset of the pandemic.
The core CPI has also moderated, rising just 0.1% in June and just 3.3% year-to-year. The core CPI peaked back in September 2022 at 6.1% and was just 2.4% before the pandemic. The moderation in price increases is broad-based. Airfares (-5.0%) and lodging (-2.0%) were two of the more notable price drops in June and are consistent with recent comments about the competitive price environment from Delta Airlines CEO Ed Bastian. Core goods prices were mixed. Prices for new vehicles fell 0.2%, while prices for used vehicles fell 1.5%. Prices for recreation goods rose 0.4%, with pet products rising 0.8%. Overall, core goods prices have fallen 1.7% over the past year, largely reflecting a 10.1% drop in used vehicle prices.
Services prices, excluding energy services, rose just 0.1% in June. Shelter costs are also cooling, with both rent and owners’ equivalent rent rising 0.3% in June, which is close to the pace averaged prior to the pandemic. Several areas that have been problematic in recent months moderated in June, including motor vehicle repair costs and medical care services, which both rose 0.2%. Motor vehicle insurance remains a problem area, with costs rising 0.9% in June and 19.5% over the past year.
On an overall basis, the CPI rose at a 2.8% annual rate, and the core CPI slowed to a 3.4% pace. Price pressures are also moderating further back in the production pipeline. The Producer Price Index rose just 0.2% in June and has slowed to just 2.7% over the past year. Average hourly earnings rose just 0.3% in June and have risen just 3.9% over the past year, down from a recent peak of 5.9% in March 2022. The inflation data should remain relatively benign over the next few months, although higher freight rates may raise the price of imported goods impacted by shipping disruptions around the Red Sea.
While inflation is still running well above the Fed’s 2% target, it has moderated enough for the Fed to begin lowering interest rates. We expect the Fed to make the case for a quarter-point cut in the federal funds rate at its July 30 meeting and look for three or four more quarter-point cuts over the next year. The financial markets will likely get ahead of themselves once again, as they did late last year when the Fed indicated they had likely finished hiking interest rates for this cycle. Shortly after the December FOMC meeting, the financial markets were pricing in 6 or 7 rate cuts for 2024. That view progressively gave way during the first four months of this year, following a string of stronger-than-expected economic reports.
Monetary policy works with a long and variable lag, with the bulk of the impact of a shift in policy typically taking at least a year to 18 months to take hold. This view has been challenged in recent years because of the growing role financial markets play in allocating credit. The financial markets tend to rally in anticipation of the Fed’s first move, which pulls some of the impact of monetary policy shifts forward. Reductions in mortgage rates and interest rates on auto loans, credit lines, and credit cards will not occur until well after the Fed begins to cut short-term interest rates. The effectiveness of the monetary policy transmission mechanisms will be the focus of this year’s Jackson Hole Economic Symposium held in late August.
The timing of the Fed’s next move is only one of the concerns. There is also a great deal of uncertainty about how much the Fed will ultimately cut interest rates. The magnitude of the Fed’s cuts is governed by Newton’s First Law of Motion, namely that an object in motion will remain in motion at the same speed and trajectory until it is met with an unbalanced force. The Fed demonstrated this when it aggressively raised interest rates (unbalanced force) in 2022 and 2023 to combat rising inflation. The larger-than-expected rate hike was needed to upend what was then the worst bout of inflation in more than forty years.
Today, however, the economy remains near full employment and inflation, while above the Fed’s target, is moderating in a way that the Fed should need to lower rates less aggressively. In terms of physics, the Fed needs to lower rates just enough to break the economy’s downward momentum without reversing the moderating trend in inflation. That is why we believe the Fed will ultimately make four or five quarter-point cuts and then hold the federal funds rate around 4% until economic growth either reaccelerates or decelerates further.
Recent comments by Fed officials suggest there is an emerging consensus that the labor market has already moved back into balance. Attitudes changed considerably following the June employment report, which showed employers adding 206,000 jobs that month but also sharply reduced estimates for job growth in April and May. Employers added an average of just 177,000 jobs a month during the second quarter, which is close to what we had expected based on our analysis of the Quarterly Census of Employment and Wages data.
Fed Governor Christopher Waller noted in a recent speech to the Federal Reserve Bank of Kansas City that he felt “current economic data are consistent with a soft landing” and that he would be looking for “data over the next couple of months” to confirm that view. Waller went on to say that he felt the labor markets were now back in balance and that inflation was moving toward price stability. Waller’s remarks, along with statements by Fed Chair Powell and other Fed officials, suggest they would like to look at another couple of months of data before cutting interest rates, making a move before September unlikely.
The Fed will get to see quite a bit of data between now and their September 17-18 FOMC meeting, including two more rounds of ISM reports, two more employment reports, an early estimate of the annual revision to nonfarm employment, two more months of retail sales data, two more months of CPI reports, and the first two estimates of second quarter GDP growth. We expect the output and employment data to remain consistent with a soft landing. The jobs data may even slow a bit, as recent gains have been highly concentrated within a handful of industries. The unemployment rate has trended up to 4.1% and is now at the upper end of the Fed’s long-run view of full employment.
On August 21, the BLS will also release the Q1 Quarterly Census of Employment and Wages data, which are the primary source data for the annual revisions released in February of each year. Our latest estimate puts the size of that revision at around 0.4 percentage points to the downside, which means that employers added roughly 750,000 fewer jobs than has been reported through March of this year. The QCEW data are a big reason why we expected nonfarm payrolls to slow to around 180,000 per month by the middle of this year.
While employment growth has slowed, the latest retail sales data show that consumer spending remains robust. Industrial production also rose solidly in Q2. We now estimate real GDP grew at a 2.2% annual rate during the second quarter, and we could see an upside surprise from increased inventory building.

Elections in France and the United Kingdom saw the far-left win enormous majorities and brought a new prime minister to the UK. We see the growing frustration in both nations being driven by the persistence of large budget deficits, which has prevented both the right and the left from enacting policies favored by their constituencies. The one thing both nations’ elections have in common is that the huge electoral victory was not driven by widespread support for Labour or the New Popular Front (NFP) but rather apathy and frustration with the incumbent party – Conservatives in the UK and Macron’s Centrist Alliance in France.
If there is a message for the US, it is that voters are restless and looking for change. The critical question is whether there are the fiscal resources available to deliver that change. The financial markets are fearful that what fiscal discipline was left in France and the UK will be jettisoned in favor of more populist spending.
The election landscape has changed dramatically in the US as well, following Joe Biden’s disastrous debate performance on June 27. A series of gaffes during the debate and in the weeks afterward has called into question whether Joe Biden will be the Democratic candidate in November. That is still the base case, at least before the failed assassination attempt on President Trump and President Biden’s Covid-19 diagnosis. Current polling shows Trump leading slightly in the national polls but well ahead in most swing states. Republican House and Senate candidates are also doing well, and enthusiasm is stronger for the GOP than it is for the Democrats, raising the possibility of a Republican sweep in November.
If Trump wins and the GOP takes both houses of Congress, we expect to see a full extension of the 2017 tax cuts. We would also likely see a rollback in regulations and some easing in restrictions on oil and gas exploration and pipeline construction. Trump has also vowed to boost tariffs and use the revenue to cut taxes. We see this as less likely. Trump would also likely scale back incentives for EVs but would not completely reverse programs currently in place. The infrastructure law would remain as is, or possibly be tweaked slightly.
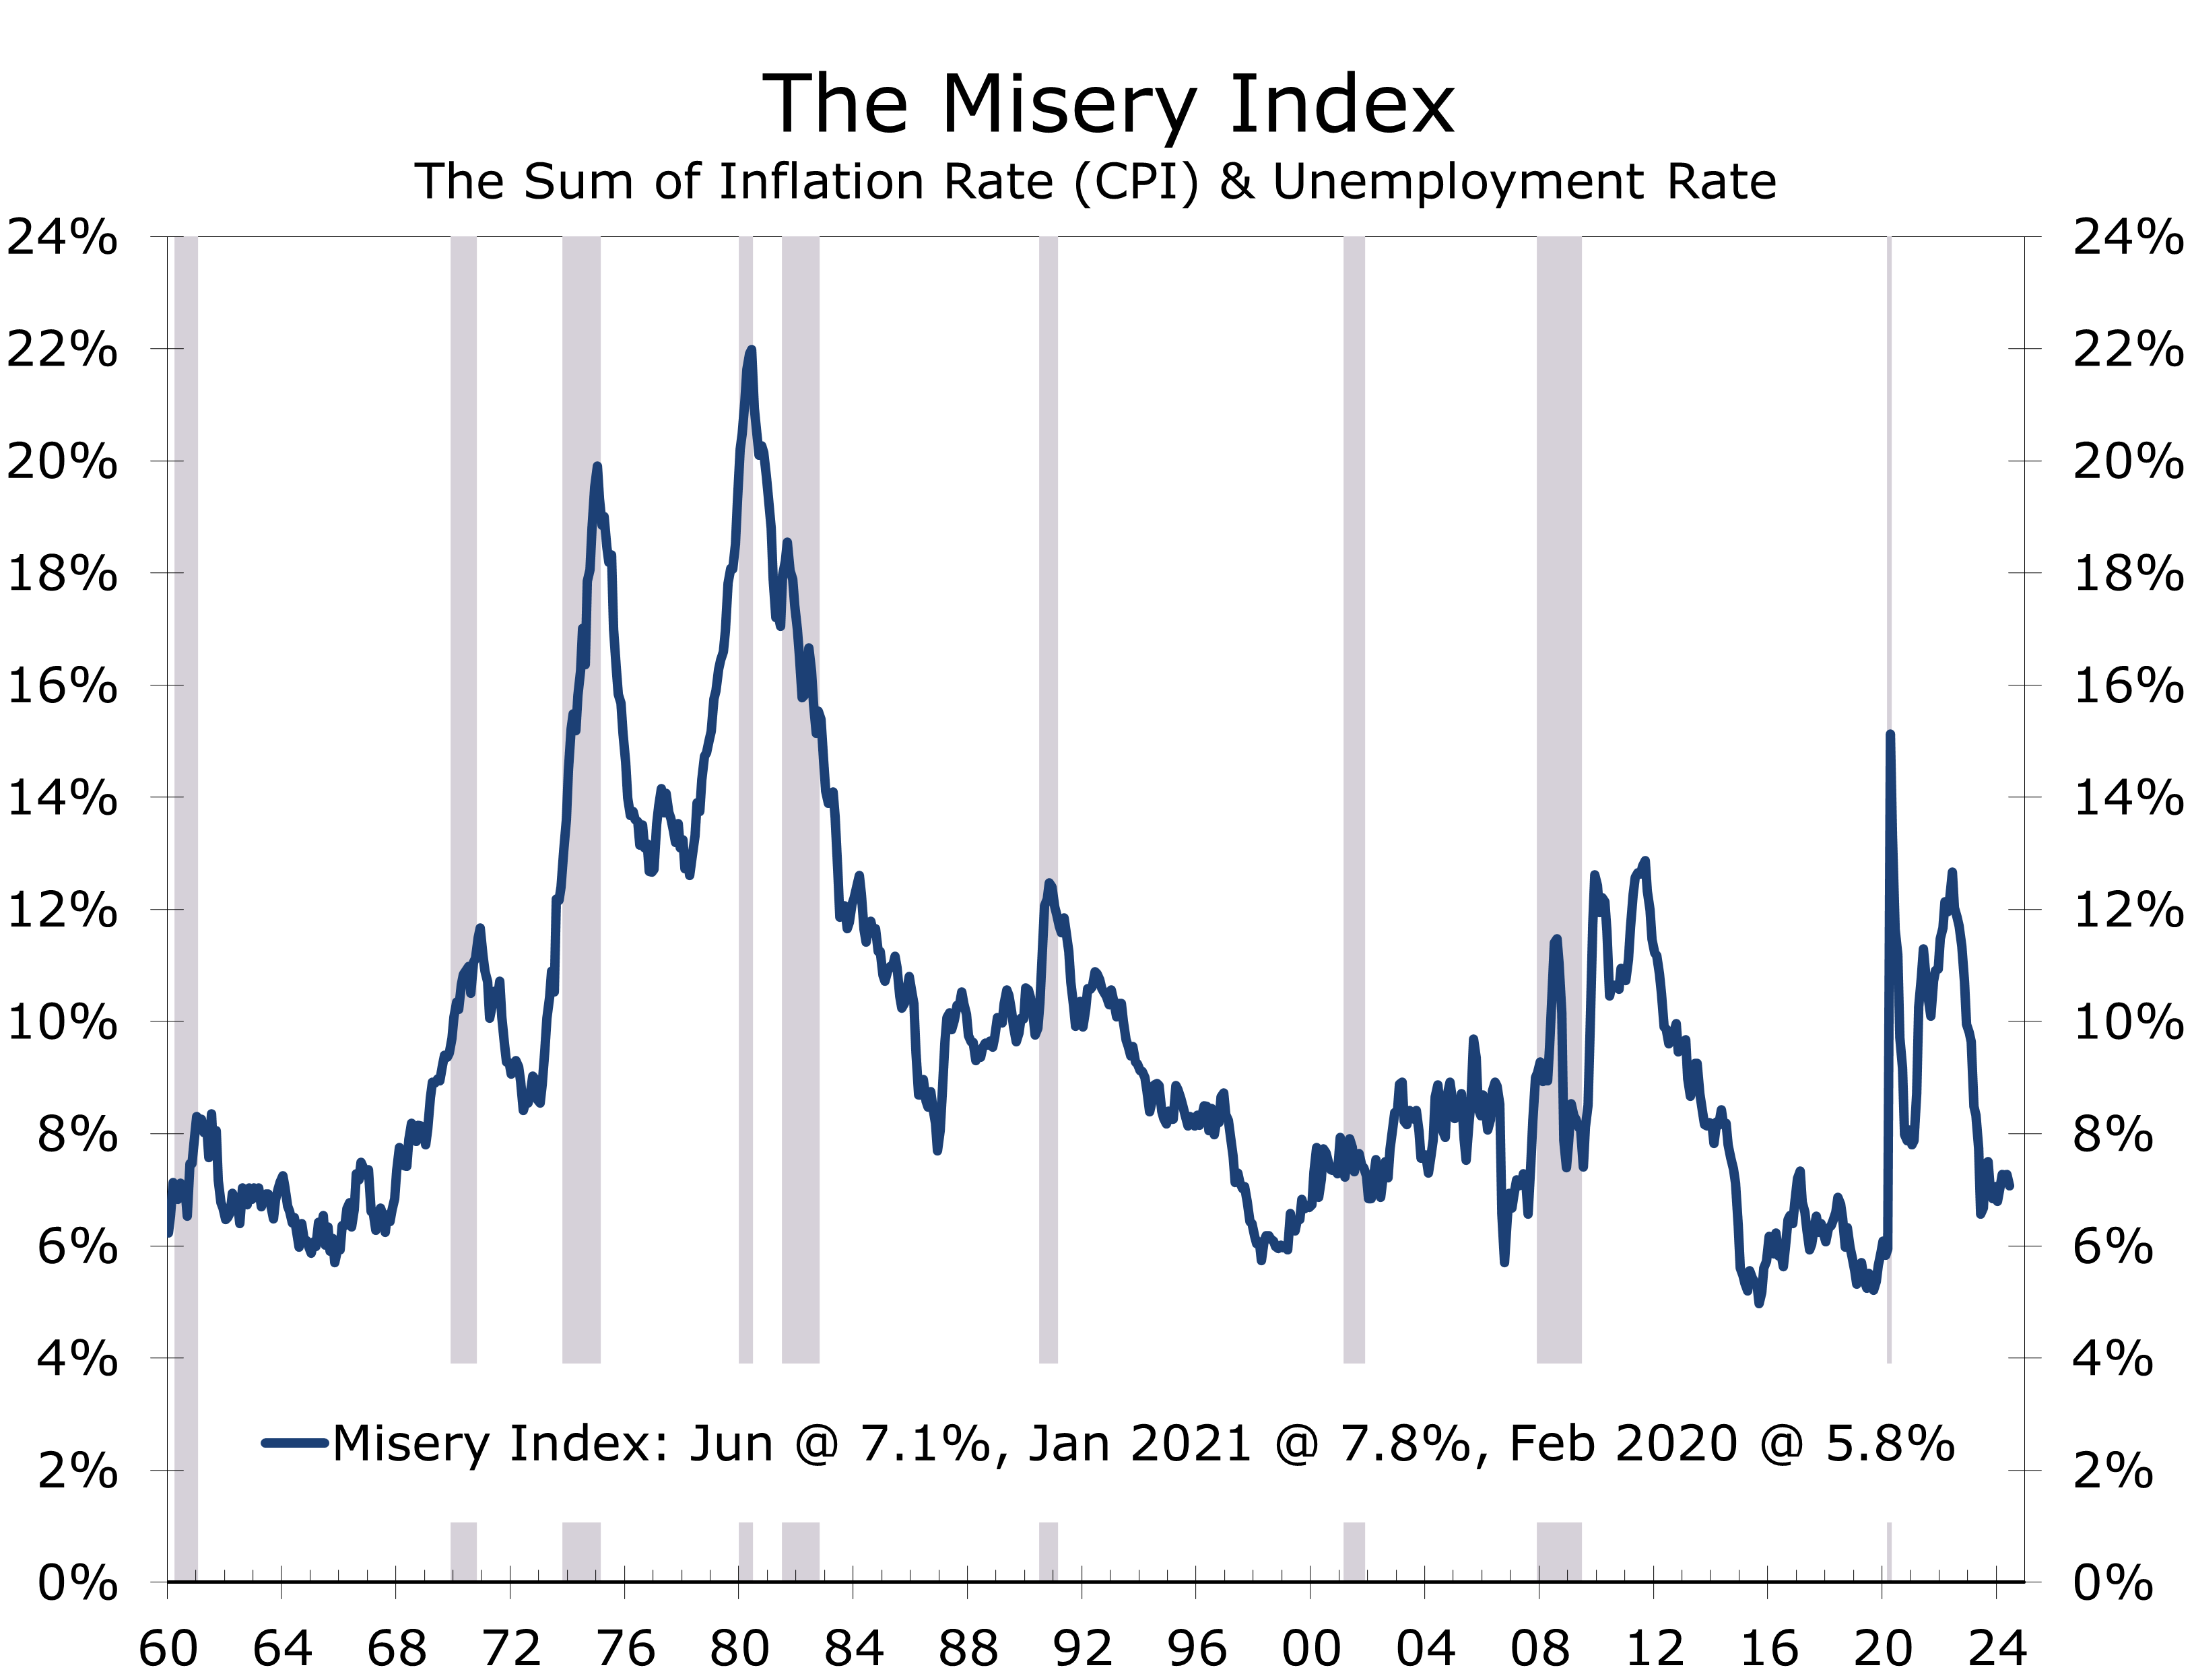
The Misery Index, which is the sum of the trailing inflation rate and unemployment rate, does a good job of capturing voter angst and closely tracks various consumer confidence measures. The Misery Index is lower today than it was when Joe Biden took office. Inflation is higher and unemployment is lower. Unfortunately for Biden, both are moving in the opposite direction and lower inflation does not mean lower prices; it simply means they are rising less rapidly.
June’s surprising strength in retail sales, which saw core retail sales climb 0.9% and included upward revisions to the April and May data, has boosted expectations for Q2 GDP growth. Moreover, the strength in retail sales at the end of the quarter means that spending in the current quarter starts off at a high level. We still see the economy losing momentum. We see real GDP climbing at a 2.2% pace in Q2, helped by a resilient consumer, continued strong gains in business fixed investment, and increased inventory building, part of which likely reflects some precautionary moves ahead of a feared longshoreman strike.
While real GDP growth looks to be on firmer ground, the economy still appears to be in a near textbook soft landing. Overall growth has slowed, allowing inflation to moderate. The soft landing has come about due to tighter monetary policy, which has slowed demand, and increased immigration, which has boosted labor force growth. The unemployment rate has risen 0.4 percentage points since the start of the year to 4.1% and is likely headed slightly higher.
The Federal Reserve is expected to make the case for a quarter-point cut in the federal funds rate at its July 30 FOMC meeting. We expect four or five quarter-point cuts in total and look for the funds rate to settle at around 4.25%. Long-term rates will decline only modestly from current levels and will rise slightly as economic growth strengthens again in 2025. We look for the spread between conventional 30-year fixed-rate mortgages and 10-Year Treasuries to gradually narrow, bolstering home sales and housing starts next year.
Disclaimer: This publication has been prepared for informational purposes only and is not intended as a recommendation offer or solicitation with respect to the purchase or sale of any security or other financial product nor does it constitute investment advice. Any forward-looking statements or forecasts are not guaranteed and are subject to change at any time. Information from external sources have not been verified but are generally considered reliable.
© 2024 CAVU Securities, LLC
Hiring Appears to Have Shifted Into Lower Gear
Unexpectedly Large Downward Revisions
- Employers added 206,000 jobs in June, but payrolls for the prior two months were revised lower by a combined 111,000 jobs. Private employers added just 136,000 jobs in June and an average of just 146,000 jobs per month over the past 3 months.
- While hiring has slowed, job gains remain broad based. The one-month diffusion index rose 3.2 points to 59.6 in June.
- The bulk of net new jobs continue to come from just a handful of industries, including government (+70K), health care (+49K), and social assistance (+34K).
- Construction firms added 27,000 jobs in June, while manufacturers cut 8,000 jobs.
- Average hourly earnings for production workers rose 10 cents, or 0.3%, to $35.05, and are just under 4.0% year-to-year.
- The unemployment rate inched another 0.1 percentage point higher, to 4.1%, up from 3.6% one year ago. The number of unemployed has risen by 814,000 persons since last June to 6.8 million.
- Nonfarm payrolls topped expectations in June but downward revisions to the prior two months show that hiring has clearly lost momentum. We look for job growth to moderate further in coming months.
Nonfarm employment once again topped expectations, which had been lowered on indications that seasonal factors and calendar effects had boosted job growth in May. The big surprise in the June data was the sharp downward revisions to the prior data.
The previously reported 272,000-job gain for May was revised lower by a whopping 57,000 jobs and April’s job growth was reduced by 54,000 jobs. Over the past three months, job growth has averaged just 177,000, the slowest 3-month pace since January 2021. Prior to the revisions, nonfarm payrolls had risen by an average of 249,000 jobs for the three months ended in May.
Hiring slowed markedly over the past 3 months and is more closely in line with the QCEW data.
The slowdown matches up well with our forecast, which had called for payroll growth to slow to around 180,000 jobs per month by June. We based this outlook on the Quarterly Census of Employment and Wages, which is the source data for annual revisions.
Job gains remain broad based. The 1- month diffusion index rose 3.2 points to 59.6. The bulk of job gains, however, are still coming from a handful of industries, including government (70K), health care (49K) and social assistance (34K). Many of the jobs added in these sectors are relatively low paying jobs that were hard to refill after being lost during the pandemic.
Government payrolls were the big outlier in June, with local governments adding 39,000 jobs and state governments adding 26,000 jobs. Most of these new jobs were added outside of public education. Competition from the private sector has made it tough for local governments to rehire line and administrative jobs lost during the pandemic. Maintenance jobs, public utility workers, bus drivers, public safety and sanitation jobs have been particularly tough to rehire.
The labor market is moving back into balance, with hiring rising in hard to fill positions.
The recent strength in government payrolls is another sign the labor market is moving back into balance. The mad rush for goods following the pandemic led to a surge in hiring in transportation and warehousing. Temporary staffing jobs also took off, as pay tended to move up more closely with the surge in demand. As the economy has cooled, employment at warehouses and temporary staffing firms has steadily receded. The slower pace has allowed employers to rehire hard-to-fill positions vacated during the pandemic.
The huge swings within the labor market are one big reason why the huge drop in temporary staffing jobs does not have the same implications that it did in past business cycles, when it proved to be a reliable predictor of recessions.
The cooling in the goods sector is helping further moderate wage gains. Average hourly earnings for productions workers rose 0.3% in June and are up just under 4.0% year-to-year, the smallest rise since March 2020. Some of the moderation reflects a slowing in high paying industries, particularly in manufacturing and distribution. The rapid increase in wages in lower paying sectors has also slowed hiring at restaurants.
The unemployment rate continues to edge higher, rising 0.1 percentage point in June to 4.1%. The jobless rate has risen 0.5 percentage points over the past year and is consistent with the recent uptick in continued unemployment claims and long-term unemployment, the latter of which has risen by 1.1 million over the past year. The unemployment rate was just 3.5% before the pandemic and averaged 3.7% in 2019.
The labor market appears to be moving back into balance, with hiring moderating.
With the labor market now more clearly moving back into balance, we are even more confident the Fed will move forward with the two quarter-point rate cuts we are expecting. Look for the Fed to make its intentions clear at the July FOMC meeting and make its first quarter point cut to the federal funds in September.

Disclaimer: This publication has been prepared for informational purposes only and is not intended as a recommendation offer or solicitation with respect to the purchase or sale of any security or other financial product nor does it constitute investment advice.
Mark Vitner, Chief Economist
mark.vitner@piedmontcrescentcapital.com
704-458-4000
July 5, 2024
Housing Starts Were Surprisingly Weak in May
Housing Starts Tumble in May
- Housing starts were surprisingly weak in May, tumbling 5.5% to a 1.277 million unit seasonally adjust rate (SAAR).
- The underlying details were nearly uniformly disappointing, with both single- and multi-family starts declining, and April’s previously reported gain revised lower.
- Single-family starts fell 5.2% to a 982,000 unit rate, the slowest pace in 7 months.
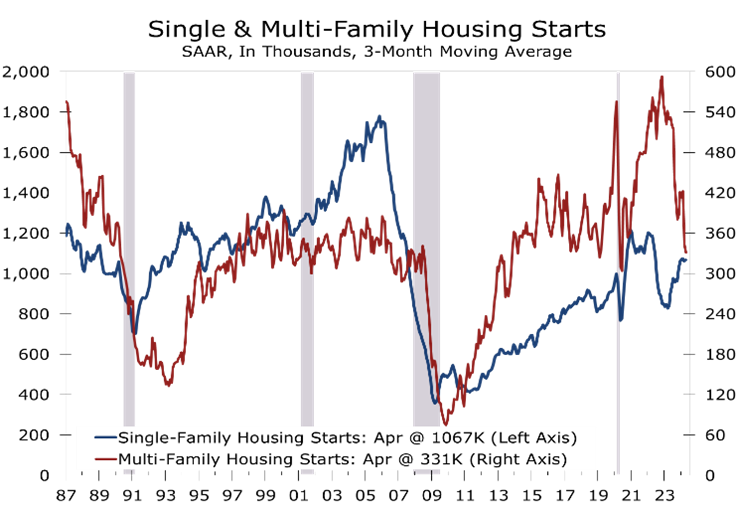
- Multi-family starts tumbled 6.6% in May and have averaged just a 290,000-unit pace over the past 3 months, the slowest pace since September 2013.
- Permits fell 3.8% overall, with single family declining 2.9% and multi-family permits falling 5.6%. Multi-family permits are now at their lowest level since April 2020.
- Housing completions fell 8.4% in May, with single-family falling 8.5% and apartment completions falling 7.5%.
- Higher mortgage rates are clearly impacting home building, resulting in reduced buyer traffic and decreased builder confidence. Builders are holding off starting new projects, as they finish existing ones and have some inventory to sell. Higher interest rates are also curbing spec building.
Housing starts were significantly weaker than market expectations in May, dropping 5.5% to a 1.277 million unit seasonally adjusted annual rate (SAAR). With the drop, housing starts are now at the lowest level since June 2020.
The underlying details in the report were nearly universally weak, with both single- and multi-family starts falling sharply. Starts for the prior month were also revised lower; April now shows a 4.1% increase compared to the initially reported 5.7% rise. Permits also came in weaker than expected, declining 3.8% to a 1.386 million unit SAAR.
May’s weaker numbers reflect declining builder sentiment, which fell 2 points to 43 in June and is now at its lowest level since December 2023. Buyer traffic has been surprisingly soft, and the recent trend in mortgage applications suggests many potential home buyers are either having trouble qualifying for a mortgage or are waiting for lower mortgage rates.
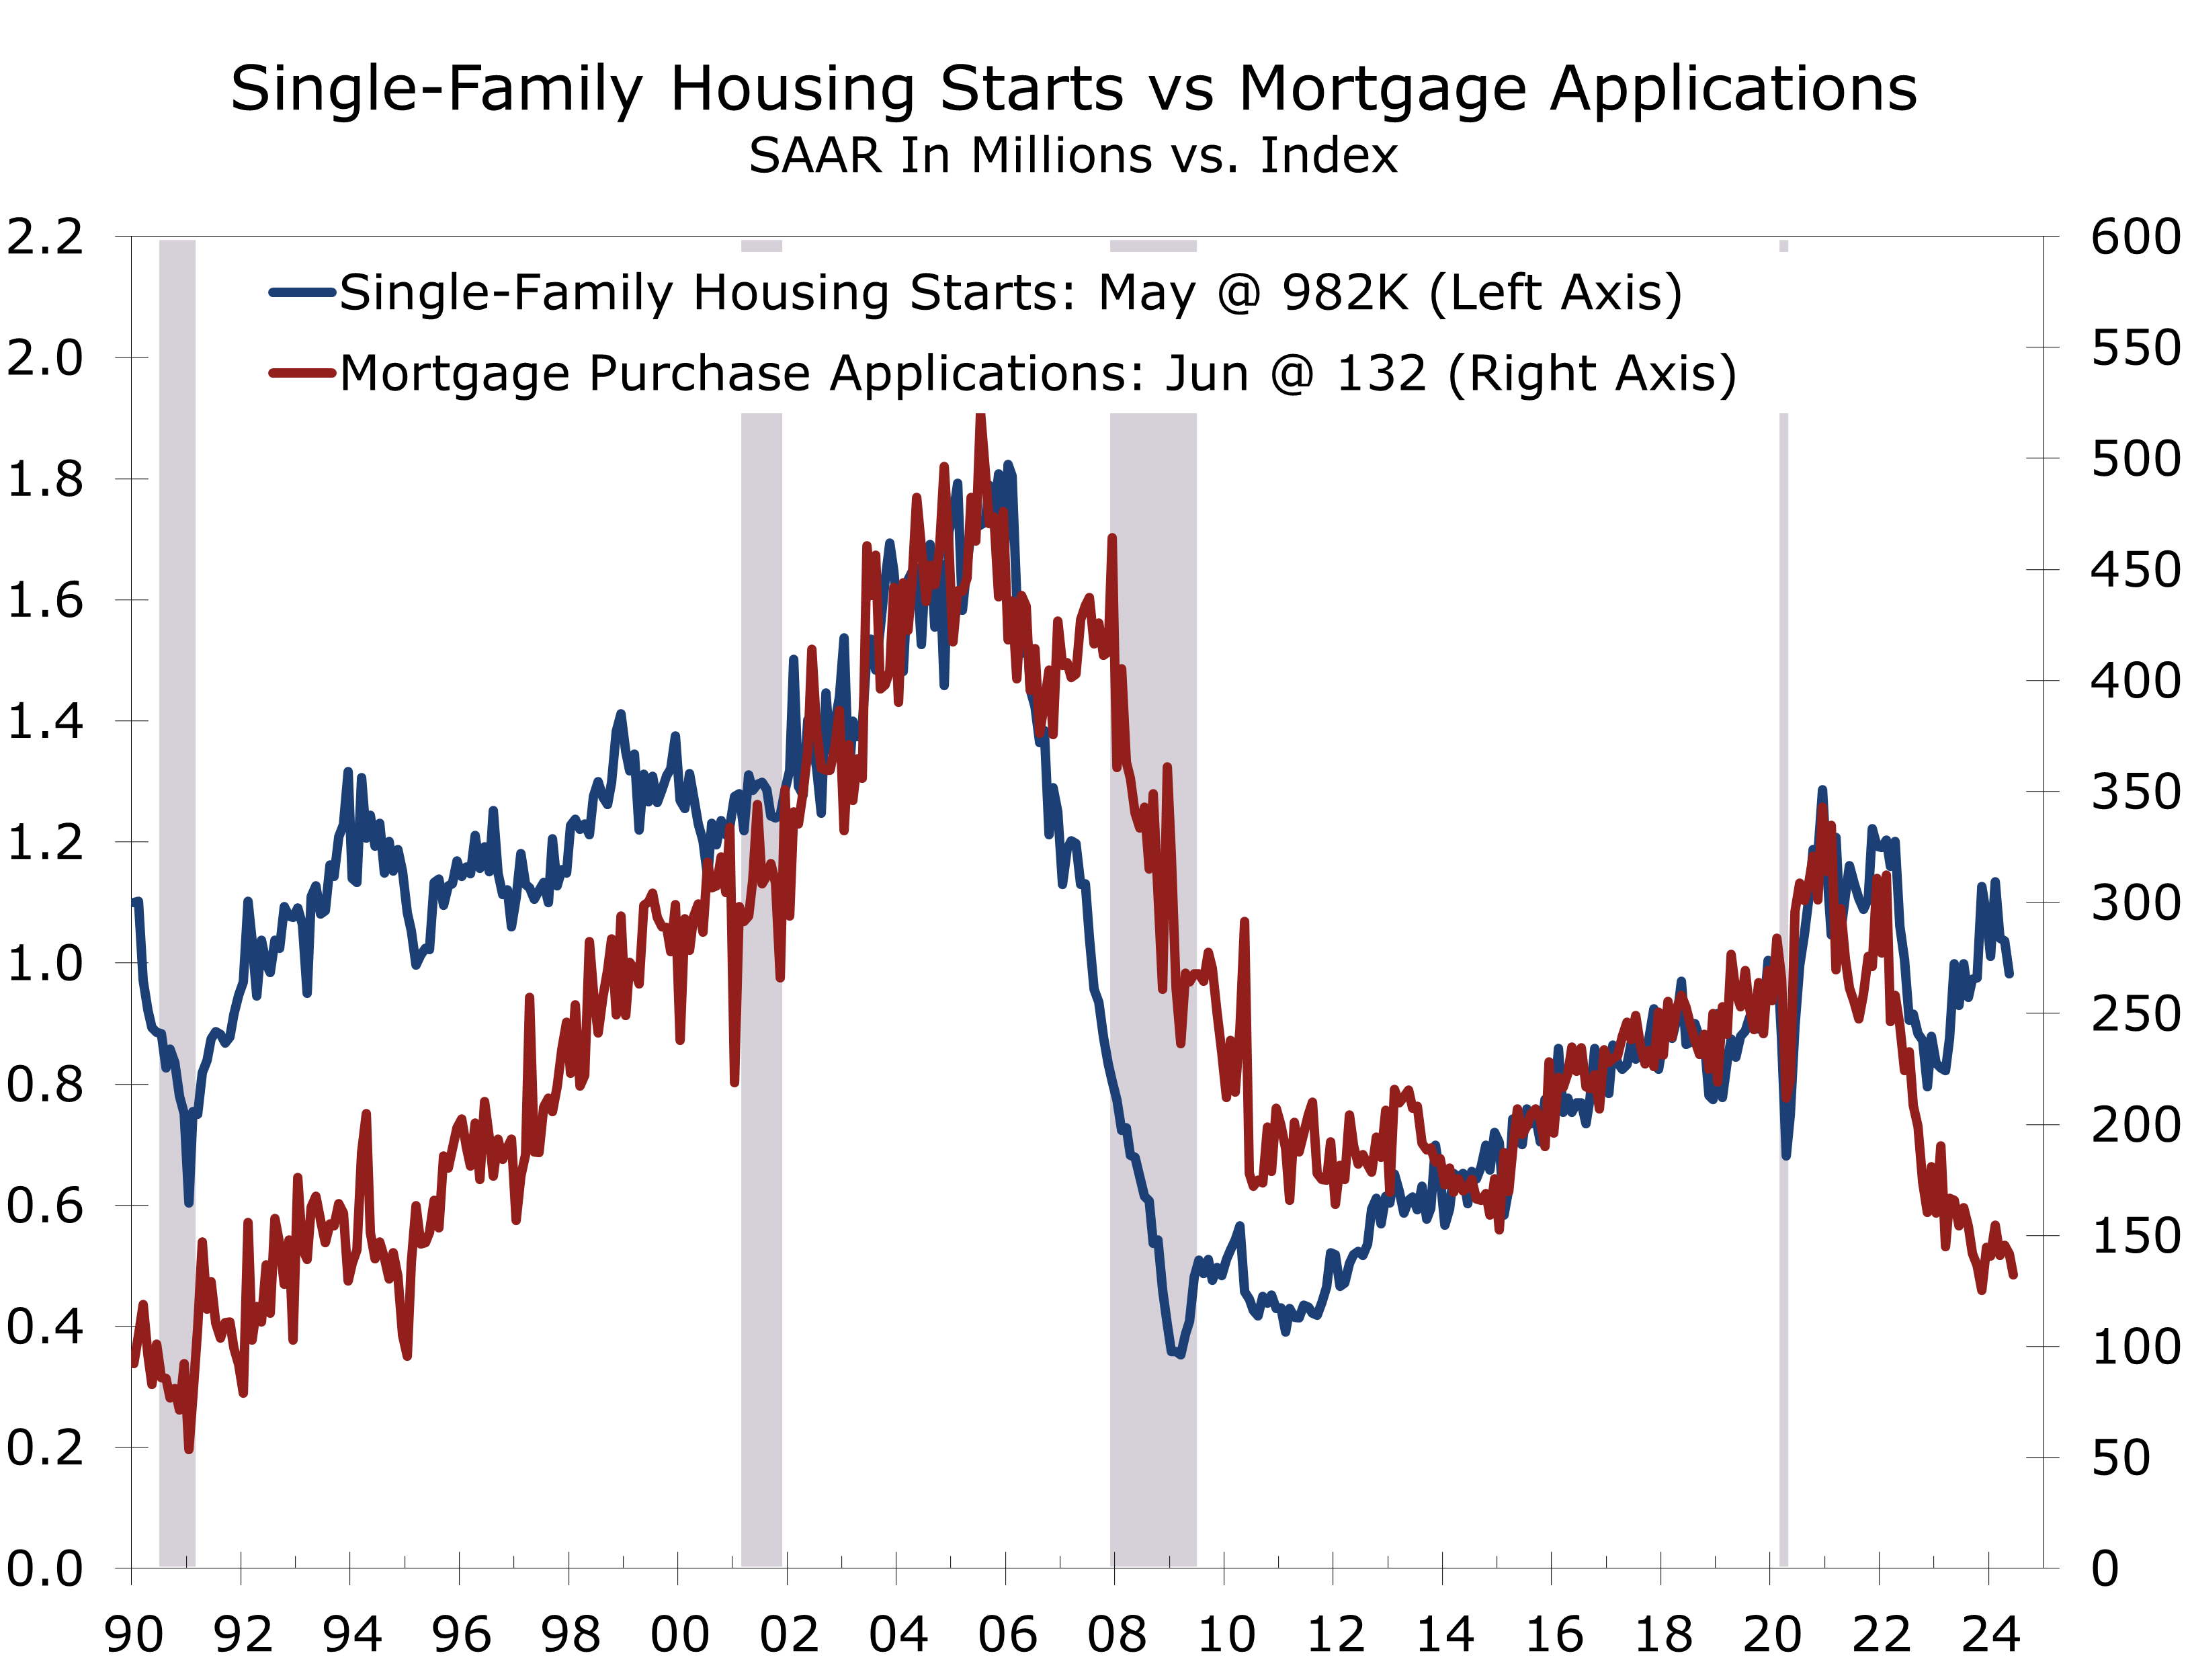
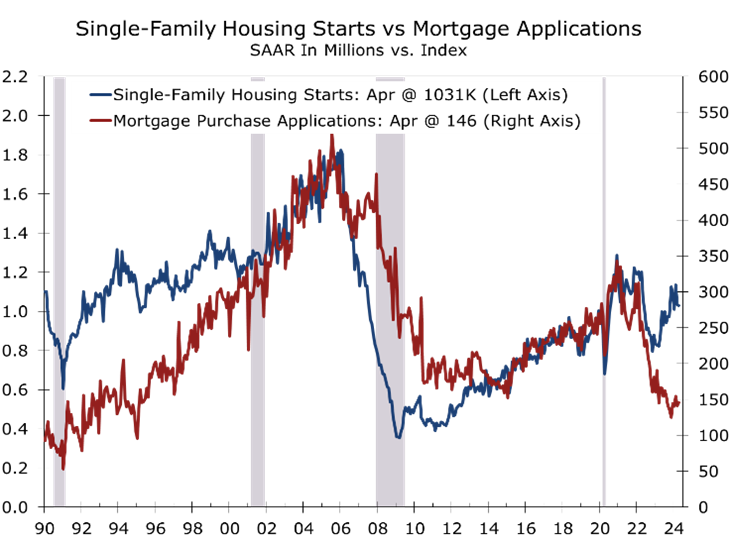
The gap between single-family starts and mortgage apps suggest starts could fall further.
Mortgage rates are currently around 7%, where they have more or less been for the past two months. Builders are also having to contend with higher rates for construction and development loans, which is curbing speculative development.
Housing starts fell in every region except the West, where they rebounded following weather-related weakness. The bulk of the slowdown was in the South, with overall starts declining 8.3% to a 733,000-unit pace. Single-family starts fell 4.4%, and multi-family starts dropped 21.6%. The South has been the most active region for apartment development, with substantial supply coming online this year.
The Midwest saw the largest percentage drop, with overall starts plummeting 19% to a 149,000-unit pace. Single-family starts fell 21.1%, and multi-family starts decreased 11.9%. In the Northeast, overall starts fell by 2.5%, with all of the drop coming in single-family starts.
In the West, housing starts rebounded 10.4% to a pace of 318,000 units. Single-family starts increased 2.7%, and multi-family starts surged 36.4%, returning both categories to their levels from two months earlier.
The apartment boom is winding down, although the development pipeline remains full
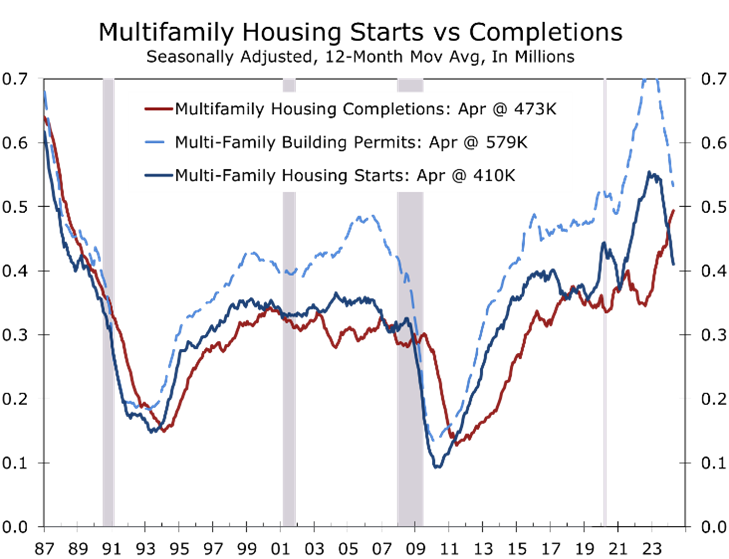
The multi-year boom in apartment development is rapidly winding down. Starts of projects with 5 units or more fell 10.8% in May and have averaged just a 280,000-unit pace over the past three months, the slowest pace in nearly 11 years. Starts peaked 18 months ago and have tumbled 52%, while permits peaked 22 months ago and have since slid 42%.

The sharp pullback in starts of new apartment projects has finally helped make some headway at clearing the huge backlog of projects under construction. Completions of projects with five units or more are running 20% ahead of their year-ago pace and are expected to total just over 500,000 units this year. Starts are likely to total around 270,000 units this year, which means the backlog should end 2024 at around 750,000 units.
Completions of single-family homes also edged lower in May, falling 8.5% to a 1.027-million unit pace. Through the first five months of this year, completions of single-family homes are running roughly 0.4% ahead of their year-ago pace. Completions of single-family homes should rise this summer, reflecting the earlier pickup in single-family starts that began late last year. Single-family starts averaged a 1.071-million unit pace from November through April.
Higher interest rates are making it tougher for home buyers and home builders. Many would-be buyers continue to be put off by mortgage rates that are hovering around 7%, while builders are facing higher costs for construction and development loans, limiting new speculative construction.
Disclaimer: This publication has been prepared for informational purposes only and is not intended as a recommendation offer or solicitation with respect to the purchase or sale of any security or other financial product nor does it constitute investment advice.
June 20, 2024
Mark Vitner, Chief Economist
704-458-4000
mark.vitner@piedmontcrescentcapital.com
A Divided Economy Distracts Policymakers
Driving While Distracted Can Prove Perilous
An Unusually Divided Economy
- The second revision to first quarter real GDP shows economic growth slowed more sharply than previously thought. Real GDP grew at just a 1.3% annual rate, down from a previously report 1.6% pace. Consumer spending on goods proved to be even weaker than first thought, declining at a 1.9% annual rate in Q1. Business fixed investment and residential construction were slightly stronger, however. Inventory building slowed slightly more than reported earlier, which should boost growth prospects for the second quarter.
- The softer GDP data are at odds with the strong job growth reported during the first quarter. Most survey data have been notably softer, however, and more closely align with recent announcements from major retailers, restaurant chains and grocers suggesting that middle and lower income households are tightening their belts. By contrast, upper end households continue to spend freely for services, experiences, and personal care.
- Slower economic growth should help tame inflation. We have been expecting inflation to cool off during the second half of this year. Several major retailers, including Walmart, Target and Walgreens have announced plans to reduce prices on many everyday items. Restaurants are also increasingly offering discounts to lure back more value-conscious consumers.
- There is also a growing geographic divide, with job growth notably slower in many of the nation’s largest metro areas. The latest Quarterly Census of Employment and Wage data show notably slower job growth in many of the nation’s largest urban areas, which may become a political issue this fall. Politics remains the widest divide and Donald Trump’s conviction in Manhattan state court will likely harden attitudes of both sides, while increasing global geopolitical risks.
- We continue to look for GDP growth to moderate in the second half of this year, as businesses and consumers pull back on capital spending and big-ticket purchases ahead of the November election. The labor market should move further into balance, with hiring moderating across most industries. We look for the Fed to cut the federal funds rate a quarter point in September but expect Treasury yields to decline only modestly reflecting persistent large budget deficits.
Economic activity has been confounding through the first half of 2024. Following a string of stronger employment gains and robust retail sales reports, economic growth turned out to be much weaker than expected, with the revised data now showing real GDP grew at just a 1.3% pace during the first quarter. Conditions were not nearly as weak as the headline data suggests, however, as private final domestic demand – the sum of consumer spending, business investment and residential construction – rose at a 3.1% pace, which is roughly in line with the prior two quarters.
One of the more confounding aspects of the current economic environment is the persistently low levels of consumer sentiment and business confidence amidst seemingly solid economic growth. Consumer sentiment and Small Business Confidence remain at levels more commonly associated with recessions, even though real GDP—the broadest measure of economic activity—has grown 3% over the past year and the unemployment rate has remained below 4% for the past two years. Various explanations for this discrepancy have been offered, ranging from consumer views being tainted by political bias to a hangover from the pandemic.
We do not see anything sinister behind the split in consumer confidence. Economics is simply common sense made difficult. The survey data largely reflect common sense views, while the hard data come from incomplete data sets that are often revised repeatedly. By contrast, common sense—and most measures of consumer and business confidence—tend to hold near their original readings. Some of the strongest short-term relationships between confidence measures and hard economic data come from comparisons of irrefutable measures, such as swings in gasoline prices. The idea that this relationship would hold constant while biases are present elsewhere in the same data set is simply not credible.
There are some real issues with the soft data. Survey responses have fallen considerably since the pandemic, and many surveys have switched from telephone to computer-based methods. The pandemic itself also led to wide swings in various confidence measures. Relief payments caused a huge spike in confidence measures, as did initial news about a vaccine. Business surveys, such as ISM and NFIB, were significantly impacted by supply shortages, leading to unprecedented swings in supplier deliveries and new orders, which are now settling.
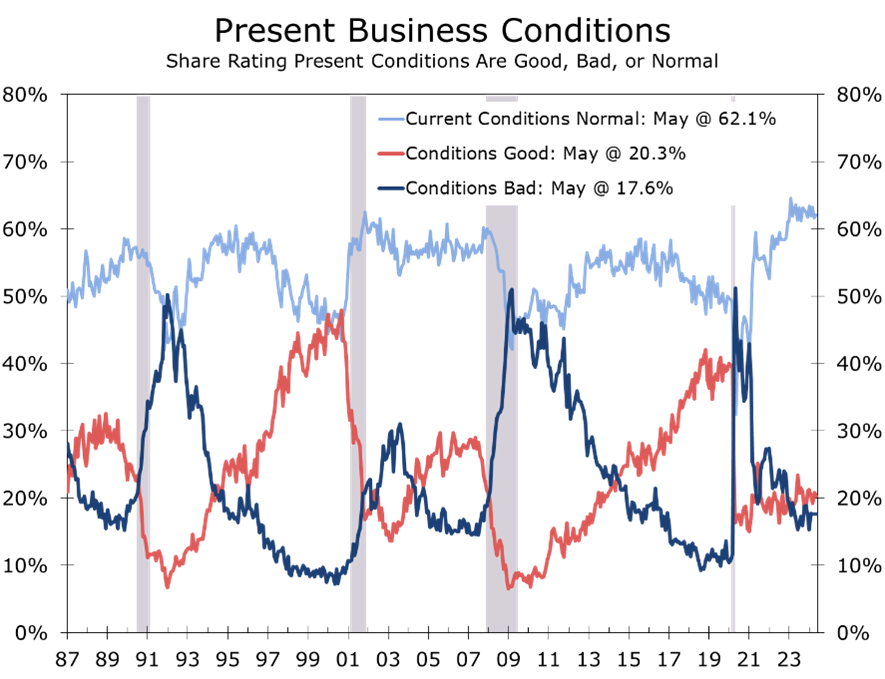
More recently, the survey data suggest the economy is stagnating. Much of this stagnation results from a decline in the proportion of consumers rating current economic conditions as ‘bad’ and a rise in those reporting conditions as ‘normal’. While overall, slightly more consumers rate current business conditions as ‘good’ rather than ‘bad’, the share rating current conditions as good is about half its pre-pandemic level, while the share rating conditions as bad is nearly one-and-a-half times higher. This assessment seems appropriate with the unemployment rate near its pre-pandemic level, but inflation considerably higher and the data closely resemble the Misery Index, which is the sum of the inflation rate and unemployment rate. The share rating conditions as normal is well above the highs seen in prior business cycles and is notably different from prior cycles.
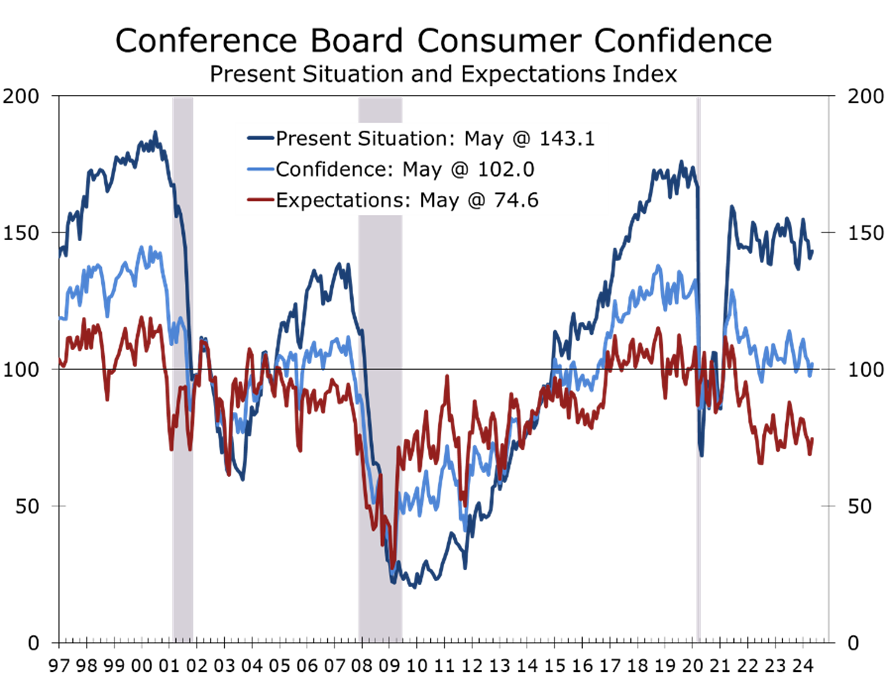
The Consumer Confidence Index is comprised of five questions—two on the current state of the economy and three on the economy’s ‘future prospects’, or six months ahead. In addition to consumers’ views on current business conditions, their view on the current state of the labor market remains unambiguously positive. The share of consumers who believe jobs are ‘plentiful’ (37.5%) vastly outnumbers those who believe ‘jobs are hard to get’ (3.5%). Despite this advantage, consumers’ assessment of the current economic environment, which rose 2.5 points in May to 143.1, remains 26.2 points below its pre-pandemic level.
While consumers remain relatively optimistic about the present economic situation, they are deeply concerned about the economy’s future prospects. The expectations series is derived from three questions about the economy’s future prospects: an assessment of future business conditions, labor market conditions, and income prospects for the next six months. The expectations series rose 5.8 points in May but remains a significant 33.5 points below its pre-pandemic level and is now at a level, 74.6, that is typically seen only in recession periods. When asked about the likelihood of a recession within the next 12 months, 69% of consumers, up 4 points from April, said a recession was either ‘somewhat or very likely’.
Consumers’ lingering caution is evident in other surveys, including the University of Michigan Consumer Sentiment Survey, Gallup’s long-running most important problem survey, and most notably in a recent Guardian/Harris poll, which found that 56% of consumers feel the economy is currently in recession. The preponderance of survey evidence suggests a significant gap between solid economic data and individual perceptions of the economy.
One variable every survey shows as the top concern for consumers is the persistent rise in prices, particularly for everyday items such as groceries, gasoline, and housing. While the rate of inflation has moderated, the cumulative price increases since the pandemic are taking a toll on consumer finances. Grocery store prices are 26% higher than they were prior to the pandemic, while gasoline prices are up 39%. Apartment rent is up a cumulative 21%, and mortgage rates and financing costs for new and used vehicles have more than doubled. As a result, families earning the median income or less, which is more than half the country, are being squeezed and are making difficult choices on what to cut from their budgets.
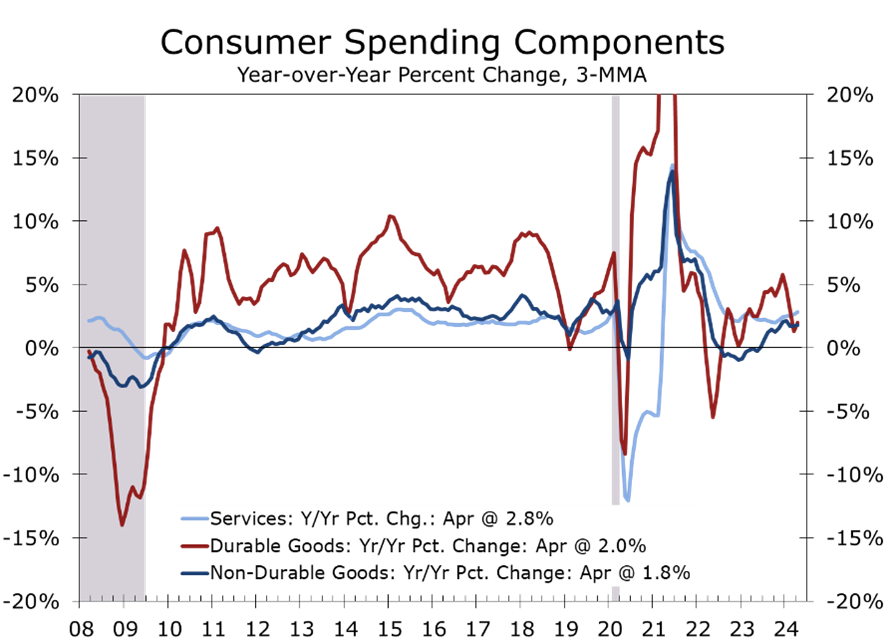
The squeeze on household budgets has become increasingly evident in consumer spending data. Estimates for first-quarter retail sales were revised down sharply, and overall consumer spending, adjusted for inflation, rose at just a 2.0% annual rate. Moreover, all of that increase came from services, which climbed at a 3.9% annual rate. Spending on goods fell at a 1.9% pace, with outlays for durable goods declining at 4.1% and spending on nondurables, the majority of which are everyday items, falling at a 0.6% pace.
The pullback in consumer spending continued into the second quarter, with real personal consumption declining 0.4% in April. Spending on goods retreated further, with spending on nondurable goods tumbling 0.5% and spending on big-ticket items declining 0.1% in inflation-adjusted terms. Services outlays inched up just 0.1% after inflation, marking the smallest increase in eight months.
The weakness in goods spending reflects some underlying deterioration in household finances. The saving rate has fallen to just 3.6%, well below its long-run average of 5.8%. Delinquency rates on credit cards and car loans have risen in recent months, particularly among younger households.
Overall, balance sheets remain healthy. Household wealth has soared to new heights due to rising home values and a buoyant stock market. The economic split is significant. Homeowners who financed during the ultralow interest rate era have locked in housing costs and benefited from the strong run-up in home prices since the pandemic. Higher interest rates have also boosted interest earnings for upper-income households. For those earning the median income or less, it is a different story. These households are more likely to rent and less likely to own significant financial assets. Becoming a homeowner has become more difficult due to soaring home prices and higher mortgage rates.
The economic divide is affecting consumer spending. Families earning the median income or less are cutting back on non-essential purchases, impacting sales of goods and restaurant dining. Such cuts are necessary as groceries, housing, and transportation account for a larger share of their budgets. Spending on goods has decreased in three of the past four months and is now lower than it was at the start of the year. Upper-income households are faring much better. While middle and upper-income households account for the bulk of overall consumer spending, a larger share of their spending is on services, including travel, leisure, entertainment, wellness, and health care. Services outlays have held up well, rising in three of the past four months.
The financial divide among households is evident at major retail and restaurant chains. Walmart, Target, and Walgreens are cutting prices on thousands of everyday items, while McDonald’s, Wendy’s, and Taco Bell are expanding their value meals. This trend is visible at nearly all retailers and restaurants targeting middle- and lower-income consumers, leading to sales declines and plans to close underperforming locations. Cutbacks are particularly notable in areas where the minimum wage has increased substantially.
Increased discounting by retailers and restaurants will likely have only a modest impact on overall inflation. Goods, including food and energy, make up only 35% of consumer spending, with core goods accounting for less than 19% of the Consumer Price Index. Inflation has not primarily been driven by goods prices. Post-pandemic car prices spiked due to supply shortages and a shift from urban centers to car-dependent suburbs, but these shortages have since been resolved, and new and used vehicle prices have moderated.
Food price inflation has also subsided, although most households are unlikely to notice. Food prices have risen just 1.1% over the past year but remain roughly 25% higher than they were prior to the pandemic. While Walmart, Target, and several major grocery chains have committed to slashing prices on many widely used grocery items, food prices remain vulnerable to various external shocks. Labor costs at grocery stores have also risen along with prices, or even more in many markets, which will limit the extent of price markdowns.
Energy prices also show some signs of moderation. Gasoline prices have risen just 1.2% over the past year, and oil prices have slipped back below $80 a barrel in recent weeks. While energy production has ramped up in the United States, prices still remain vulnerable to geopolitical events around the world, as well as weather conditions closer to home. There is less capacity to accommodate a supply shock today. Strategic oil and gasoline stockpiles were tapped to help alleviate prices ahead of the midterm election and have not been replenished.
Core services prices remain the most challenging aspect of the inflation outlook. Much attention has been focused on housing costs, where asking prices for new rental apartments have fallen amidst an onslaught of new apartment completions. However, higher home prices and higher mortgage rates are keeping renters in place, and rents for renewals are still rising solidly. Price increases for many other key services, including health care, motor vehicle insurance, and admissions to concerts and sporting events, also remain problematic.
Inflation is expected to continue moderating as slowing economic growth cools off demand. Our forecast now calls for real GDP growth to rebound to a 2.7% annual rate. Consumer spending is packing much less punch than previously thought, and the housing market is struggling with higher mortgage rates. With home sales on a slower track, spending on furniture, appliances, and home furnishings is lagging, adding to the challenges retailers face from inflation-weary consumers. Business fixed investment is also expected to moderate this summer, as uncertainty about the presidential election causes businesses to hold off on capital projects.
While growth is slowing, Fed Chair Jay Powell made it clear that he does not see stagflation as a threat, and neither do we. Inflation should gradually decelerate but remain above the Fed’s target well into 2026. This will not prevent the Federal Reserve from cutting interest rates but will limit the extent of cuts outside of an outright recession. We expect the Fed to cut rates twice this year, with cuts in September and December, and anticipate two more quarter-point cuts in 2025. After that, with the economy still at full employment, we expect the Fed to hold the federal funds rate steady at a level roughly equal to nominal GDP growth.
The combination of full employment, near-potential real GDP growth, large federal budget deficits, and gradually decreasing inflation will keep long-term interest rates above 4%. We see upside risk to the 10-Year Note, particularly if the economy reaccelerates after the election. The FOMC has been steadily increasing its estimate of the long-run federal funds rate and we expect it to eventually rise from its current 2.60% to 3.25%, which would push the 10-Year Note to 4.80% with a normal upward-sloping yield curve.
Disclaimer: This publication has been prepared for informational purposes only and is not intended as a recommendation offer or solicitation with respect to the purchase or sale of any security or other financial product nor does it constitute investment advice. Any forward-looking statements or forecasts are not guaranteed and are subject to change at any time. Information from external sources have not been verified but are generally considered reliable.
© 2024 CAVU Securities, LLC
June 4, 2024
mark.vitner@piedmontcrescentcapital.com
Chief Economist (704) 458-4000
The Unemployment Rate Ticks Higher Amidst Seemingly Solid Employment Growth
Nonfarm Payrolls Top Expectations
- Employers added 272,000 jobs in May. Payrolls for the prior two months were revised lower by a combined 15,000 jobs.
- Job growth was broad-based, although the bulk of gains continue to come from a handful of industries, including health care (+68K), government (+43K), and leisure and hospitality (+42K).
- Average hourly earnings for production workers rose 14 cents to $29.99, topping expectations, and are up 4.2% year-to-year.
- Weather and calendar effects likely boosted payrolls by about 45,000 jobs.
- The unemployment rate rose to 4.0%, up from 3.7% one year ago. The number of unemployed has risen by half a million persons since last May to 6.6 million.
- Aggregate hours worked rose 0.2% and have risen at a 2.1% pace over the past 3 months.
- Nonfarm payrolls blew past expectations, with employers adding 272,000 jobs. Gains were broad based but continue to be driven by lower paying jobs in health care, leisure & hospitality and government. The tech sector remains a standout, boosted by the AI boom. The rise in the unemployment rate should not be dismissed.
Nonfarm employment easily topped expectations, with employers adding 272,000 jobs in May. The gain beat consensus expectations by a whopping 92,000 and is well above the 230,000 jobs added per month on average over the past year. The unemployment rate edged higher to 4.0%.
Seasonal adjustments and weather effects likely boosted payrolls by around 45,000 jobs. There was an extra week between the April and May employment surveys, which we believe added around 15,000 jobs to total job growth. A return to more typical spring weather also allowed hiring to bounce back in construction and hospitality sectors, following an unusually rainy April.
Hiring rose broadly in May, but gains continue to be concentrated in a handful of industries
The diffusion index rose 6.8 points to 63.4% in May, hitting its highest level in 16 months. While job growth was broad-based, the bulk of employment gains continue to come from a handful of industries, much of which is occurring in lower-paying segments of those industry categories. Health care (+68K), government (+43K), leisure and hospitality (+42K), and professional, scientific, and technical services (+32K) combined accounted for more than two-thirds of May’s employment gain.
Manufacturing eked out a modest 8,000-job gain in May, with nondurable goods producers adding 10,000 jobs and producers of durable goods cutting 2,000 jobs. Within nondurables, chemical producers added 4,100 jobs, and food product producers added 3,400 jobs. Chemical producers are getting a boost from surging demand for pharmaceuticals, particularly GLP-1 diet drugs.
The massive backlog of construction projects is buoying construction payrolls.
Construction firms added 21,000 jobs in May, with three-quarters of the increase coming in nonresidential construction. Much of that growth reflects the ongoing buildout of industrial facilities and data centers. Residential construction also edged higher, with residential building contractors adding 3,500 jobs and employment at residential specialty contractors remaining unchanged.
Much has been made of the apparent resilience of construction payrolls in the face of higher interest rates. Rest assured; the Fed’s monetary policy transmission mechanism still runs through the housing market. The reason construction payrolls have held up so well is that there is still a historic backlog of single-family homes and apartments under construction. Payrolls will weaken as this backlog is worked off later this year.
The financial markets initially sold off after the jobs report was released. Stronger headline job growth combined with a larger-than-expected rise in average hourly earnings lessened the chances of a rate cut in July, which we saw as unlikely anyway.
Despite the larger-than-expected rise in hourly earnings, the May employment report still shows the labor market gradually moving back into balance. An earlier report from payroll processor ADP showed overall hiring slowing, particularly at smaller firms. Job openings in the JOLTS survey also ticked lower in April, falling to their lowest level since February 2021. The unemployment rate edged higher, climbing 0.1 points to 4.0%, its highest level since January 2022.
The labor market appears to be moving back into balance, with hiring moderating.
The rise in the unemployment rate was largely dismissed due to some large moves in the labor force among younger workers. The May/June period typically sees large numbers of workers enter the workforce as the school year ends, leading to large month-to-month swings. That said, the jobless rate has been trending higher for the past few months.
Disclaimer: This publication has been prepared for informational purposes only and is not intended as a recommendation offer or solicitation with respect to the purchase or sale of any security or other financial product nor does it constitute investment advice.
June 7, 2024
mark.vitner@piedmontcrescentcapital.com
Chief Economist (704) 458-4000
Higher Mortgage Rates Weigh on Housing Starts
Housing Starts Rise from a Lower Level
- Housing starts rose a smaller than expected 5.7% in April to a 1.36-million-unit annual pace. Data for prior months were also revised lower and permits declined.
- The underlying details in the report were weaker than expected, with all of the gain in housing starts coming from a partial rebound in volatile multi-family units.
- Multi-family starts rose 18.7% in April, following a 43.8% plunge the prior month. Apartment starts have been trending lower for more than a year.
- Single-family starts fell 0.4% to a 1.031-million unit pace. Starts fell in every region except the West.
- Housing permits fell 3.0% overall, with single family dipping 0.8% and multi-family permits declined 6.9% and are now at their lowest level since October 2020.
- Housing completions jumped 8.6% in April, with all of the gain coming in single-family.
- Higher mortgage rates are clearly impacting home building, resulting in reduced buyer traffic and decreased builder confidence. Builders are holding off starting construction on new homes as they finish existing ones and now have inventory to sell.
Housing starts rose less than expected in April and starts for the prior month were revised sharply lower. Overall starts rose 5.7% to a 1.36-million-unit annual rate. Starts for the prior month were revised down by 34,000 units, revealing a softer underlying trend.
The monthly housing data have been harder to read recently. Builder optimism surged late last year on renewed hopes for lower interest rates following the Fed’s December FOMC meeting. This optimism primarily impacted the single-family market, prompting a jump in starts during a typically slow seasonal period. A string of stronger economic reports earlier this year, however, led to renewed uncertainty about the timing and extent of any interest rate cuts, leading builders to adopt a more cautious approach.
Home builders have become more cautious about interest rates, leading to fewer starts.
Meanwhile, multi-family starts have been pulling back for more than a year. An earlier surge in starts combined with longer cycle times, due to long-running shortages of labor and key building components, led to a huge backlog of projects which are now being finished. This backlog of projects is now being completed, resulting in a surge of new supply, rising vacancy rates, and less new construction.
Single-family permits fell even more than starts, dropping 0.8% in April following a 4.2% drop in March.
Builders may have gotten a little bit ahead of demand. Buyer traffic has been bolstered by a persistent shortage of existing homes for sale, which has shifted more buyers to the new home market. Home builders have embraced the influx and shifted marketing dollars to rate buydowns and also shifted the mix of homes being built toward lower priced models in the outlying areas of rapidly growth parts of the South and West.
While those shifts have helped bolster sales, particularly among first-time home buyers, housing affordability remains challenging across much of the country and a growing proportion of renters are opting to renew their leases rather than purchase a home.
Reduced housing affordability will likely keep a low ceiling on single-family starts this year.
We are concerned about the wide gap that has opened up between and single-family housing starts and mortgage purchase applications. The two series have historically moved closely together. Part of the gap likely reflects the larger proportion of single family homes being built for rent, which is particularly popular in rapidly growing parts of the South. An influx of home buyers in the South and Midwest, flush with equity from selling their home in higher priced markets in the West and Northeast, might also being bolstering cash sales. A third explanation, however, is that builders just got a bit ahead of demand.
The correction in the multi-family market is more straightforward. The past decade saw a migration back into center cities and major employment centers, spurring a boom of mid-rise and high-rise apartments. The long cycle times for these projects led to a growing backlog of projects, which really took off after the pandemic as demand surged and lower interest rates set off a building boom.
A wave of 473,000 new multi-family units, mainly rental apartments, entered the market this year. The bulk of that new supply was delivered in the South., mirroring recent migration trends. Multi-family starts have totaled just 410,000 units this past year and are running 33% below their year ago pace through April. Multi-family permits are running 23% below their year ago level and remain well above starts. Tighter credit will likely keep many of those projects on hold.
April’s softer housing data suggests building activity will moderate this spring. Any hit to output from a drop in starts will at least partially be offset by the still hefty pipeline of single-family homes and apartments in the construction pipeline. Moreover, lower mortgage rates should boost single family starts in the second half of the year.
Disclaimer: This publication has been prepared for informational purposes only and is not intended as a recommendation offer or solicitation with respect to the purchase or sale of any security or other financial product nor does it constitute investment advice.
May 16, 2024
Mark Vitner, Chief Economist
mark.vitner@piedmontcrescentcapital.com
(704) 458-4000
CPI Inflation Rises in Line with Expectations
Inflation is Still Too High for the Fed to Ease
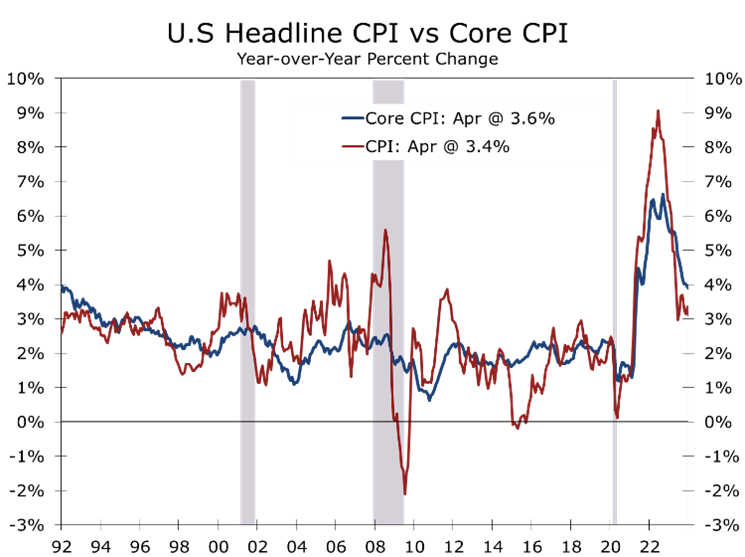
- Both the headline and core CPI rose 0.3% in April, which was in line with market expectations but less than market fears.
- Year-to-year headline CPI edged down to 3.4%, while the core CPI is now up 3.6%, both are the smallest rises since April 2021.
- The underlying details were encouraging, with price pressures easing in many problem areas, including residential rent.
- Energy prices rose 1.1%, led by higher gasoline prices. Food prices were unchanged, with prices falling at grocery stores and continuing to rise at restaurants.
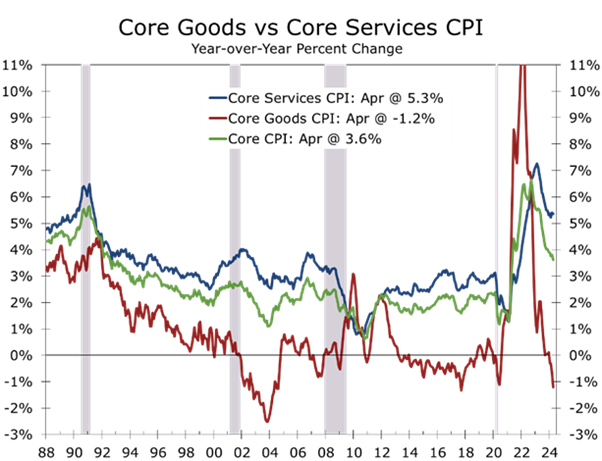
- Price increases remain problematic in services, with core services prices rising 0.4% in April and 5.3% over the past year.
- Inflation has slowed most notably in the goods sector, where earlier spikes in prices for used cars, household appliances, and a few other items are now reversing.
- The financial markets rallied following the CPI report, which rose largely in line with expectations but followed three CPI reports that came in hotter than expected. While price increases are still broad based, the underlying details suggest inflation should ease further in coming months.
The Consumer Price Index rose 0.3% in April, both on an overall basis and after excluding food and energy prices. The report was close to market expectations but comes on the heels of three consecutive hotter than expected CPI report.
The financial markets breathed a sigh of relief that inflation came in as expected. On a year-to-year basis the overall CPI edged back down to 3.4%, while the core fell back to a 3.6% rise. Price increases ebbed across a wide assortment of categories, including some of the more problematic areas over the past 3 months.
Price increases ebbed across a wide assortment of categories, including some problem areas.
Higher prices for shelter and gasoline accounted for the bulk of the CPI’s rise in April. Combined these two categories accounted for over 70% of the rise in the overall CPI. Gasoline prices rose 2.8% in April, reflecting a larger than usual springtime rise. Gasoline prices are up only 1.2% year-to-year.
Food prices were unchanged, with grocery store prices declining 0.2% in April. Much of that drop was due to a pullback in egg prices, which had surged earlier. Prices for fresh fruits and vegetables also eased. Prices continue to rise at restaurants, reflecting higher labor costs. Prices at limited-service restaurants rose 0.4%, while prices at full-service restaurants rose 0.3%.
While prices ebbed slightly at grocery stores in April, consumers are still suffering from sticker shock. Grocery store prices are roughly 25% higher than they were prior to the pandemic. That gain far outstrips income growth, which has left consumers scrambling on ways to stretch their household budgets.
Prices have risen even more rapidly at restaurants and the pace has moderated less. Prices for food purchased for consumption away from home (primarily restaurants) rose 4.1% over the past year and are currently about 26% higher than they were prior to the pandemic. Wages for restaurant workers have risen just over 37% over this period, which leaves restaurant operators with little room to offer discounts or cut prices.
Price increases are easing somewhat at grocery stores but continue to rise at restaurants.
Inflation has slowed most notably in the goods sector. Core goods prices declined by 0.1% in April and have fallen by 1.3% over the past year. This decline is largely due to lower used car prices, which surged during the pandemic but have since stabilized. Used car prices fell 1.4% in April and have dropped 6.9% over the past year. Additionally, home appliance prices have fallen by 5.6% in the past year, led by a huge 11.6% plunge in prices for washers and dryers, the prices of which had surged earlier.

The post-pandemic inflation resurgence sparked a debate on its causes. We view it as stemming from the Fed accommodating the massive expansion of fiscal policy following the pandemic. This massive relief allowed income and spending to rebound faster than output, exacerbating shortages and driving prices higher.
Despite attempts by some politicians to blame others (such as greedflation or shrinkflation), there is scant evidence to suggest businesses are responsible for the post-pandemic surge in prices. The Federal Reserve Bank of San Francisco analyzed price markups across industries. Their findings showed minimal changes in overall operating margins, with only a few industries experiencing increases, most notably motor vehicle dealers and petroleum refiners. This aligns with intuition, as it is improbable that businesses suddenly became more greedy.
The San Francisco Fed’s research aligns with recent data from small business owners, which shows small business confidence has weakened due to the inability to offset rising operating costs. While price increases may slow further, the increased pressure on margins is expected to weigh on hiring and capital spending in coming months, consequently slowing overall growth.

Disclaimer: This publication has been prepared for informational purposes only and is not intended as a recommendation offer or solicitation with respect to the purchase or sale of any security or other financial product nor does it constitute investment advice.
Mark Vitner, Chief Economist
mark.vitner@piedmontcrescentcapital.com
May 15, 2024
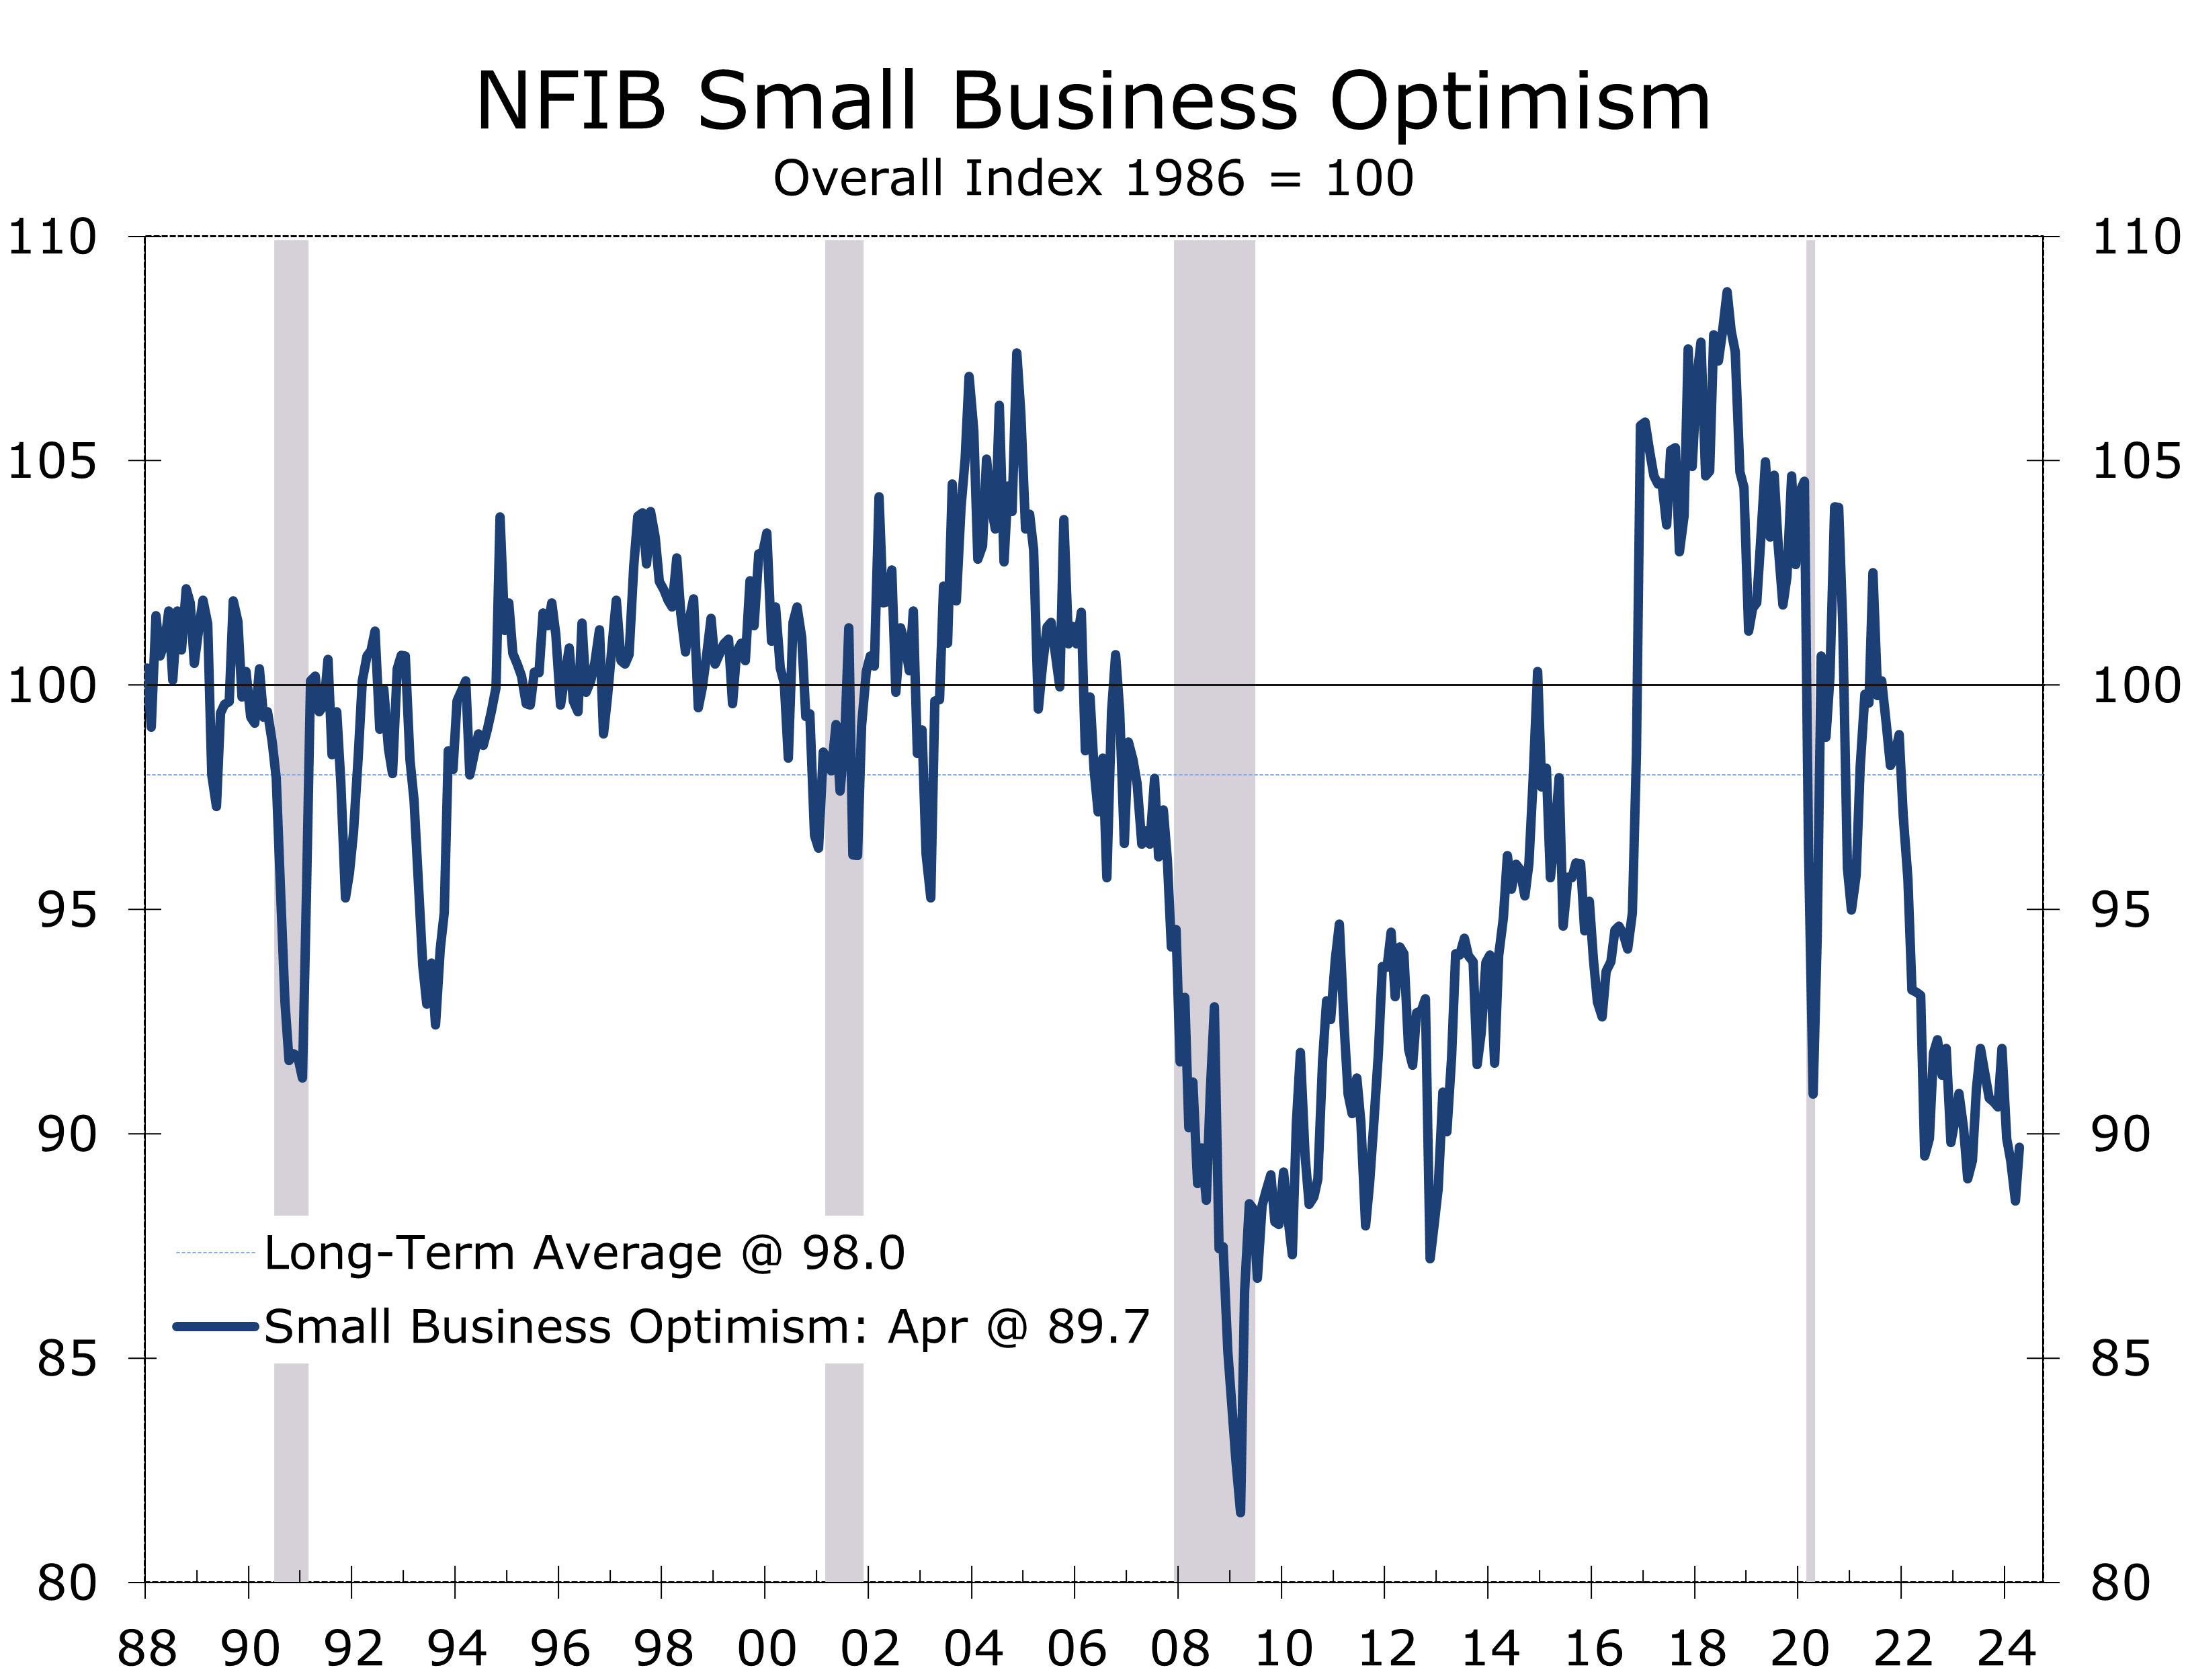
Small Business Confidence Edges Slightly Higher
Operating Margins Continue to Get Squeezed
- The NFIB Small Business Optimism Index rose 1.2 points to 89.9 in April, marking its first increase this year.
- Seven of the 10 components rose in April, led by a 6-point jump in sales expectations.
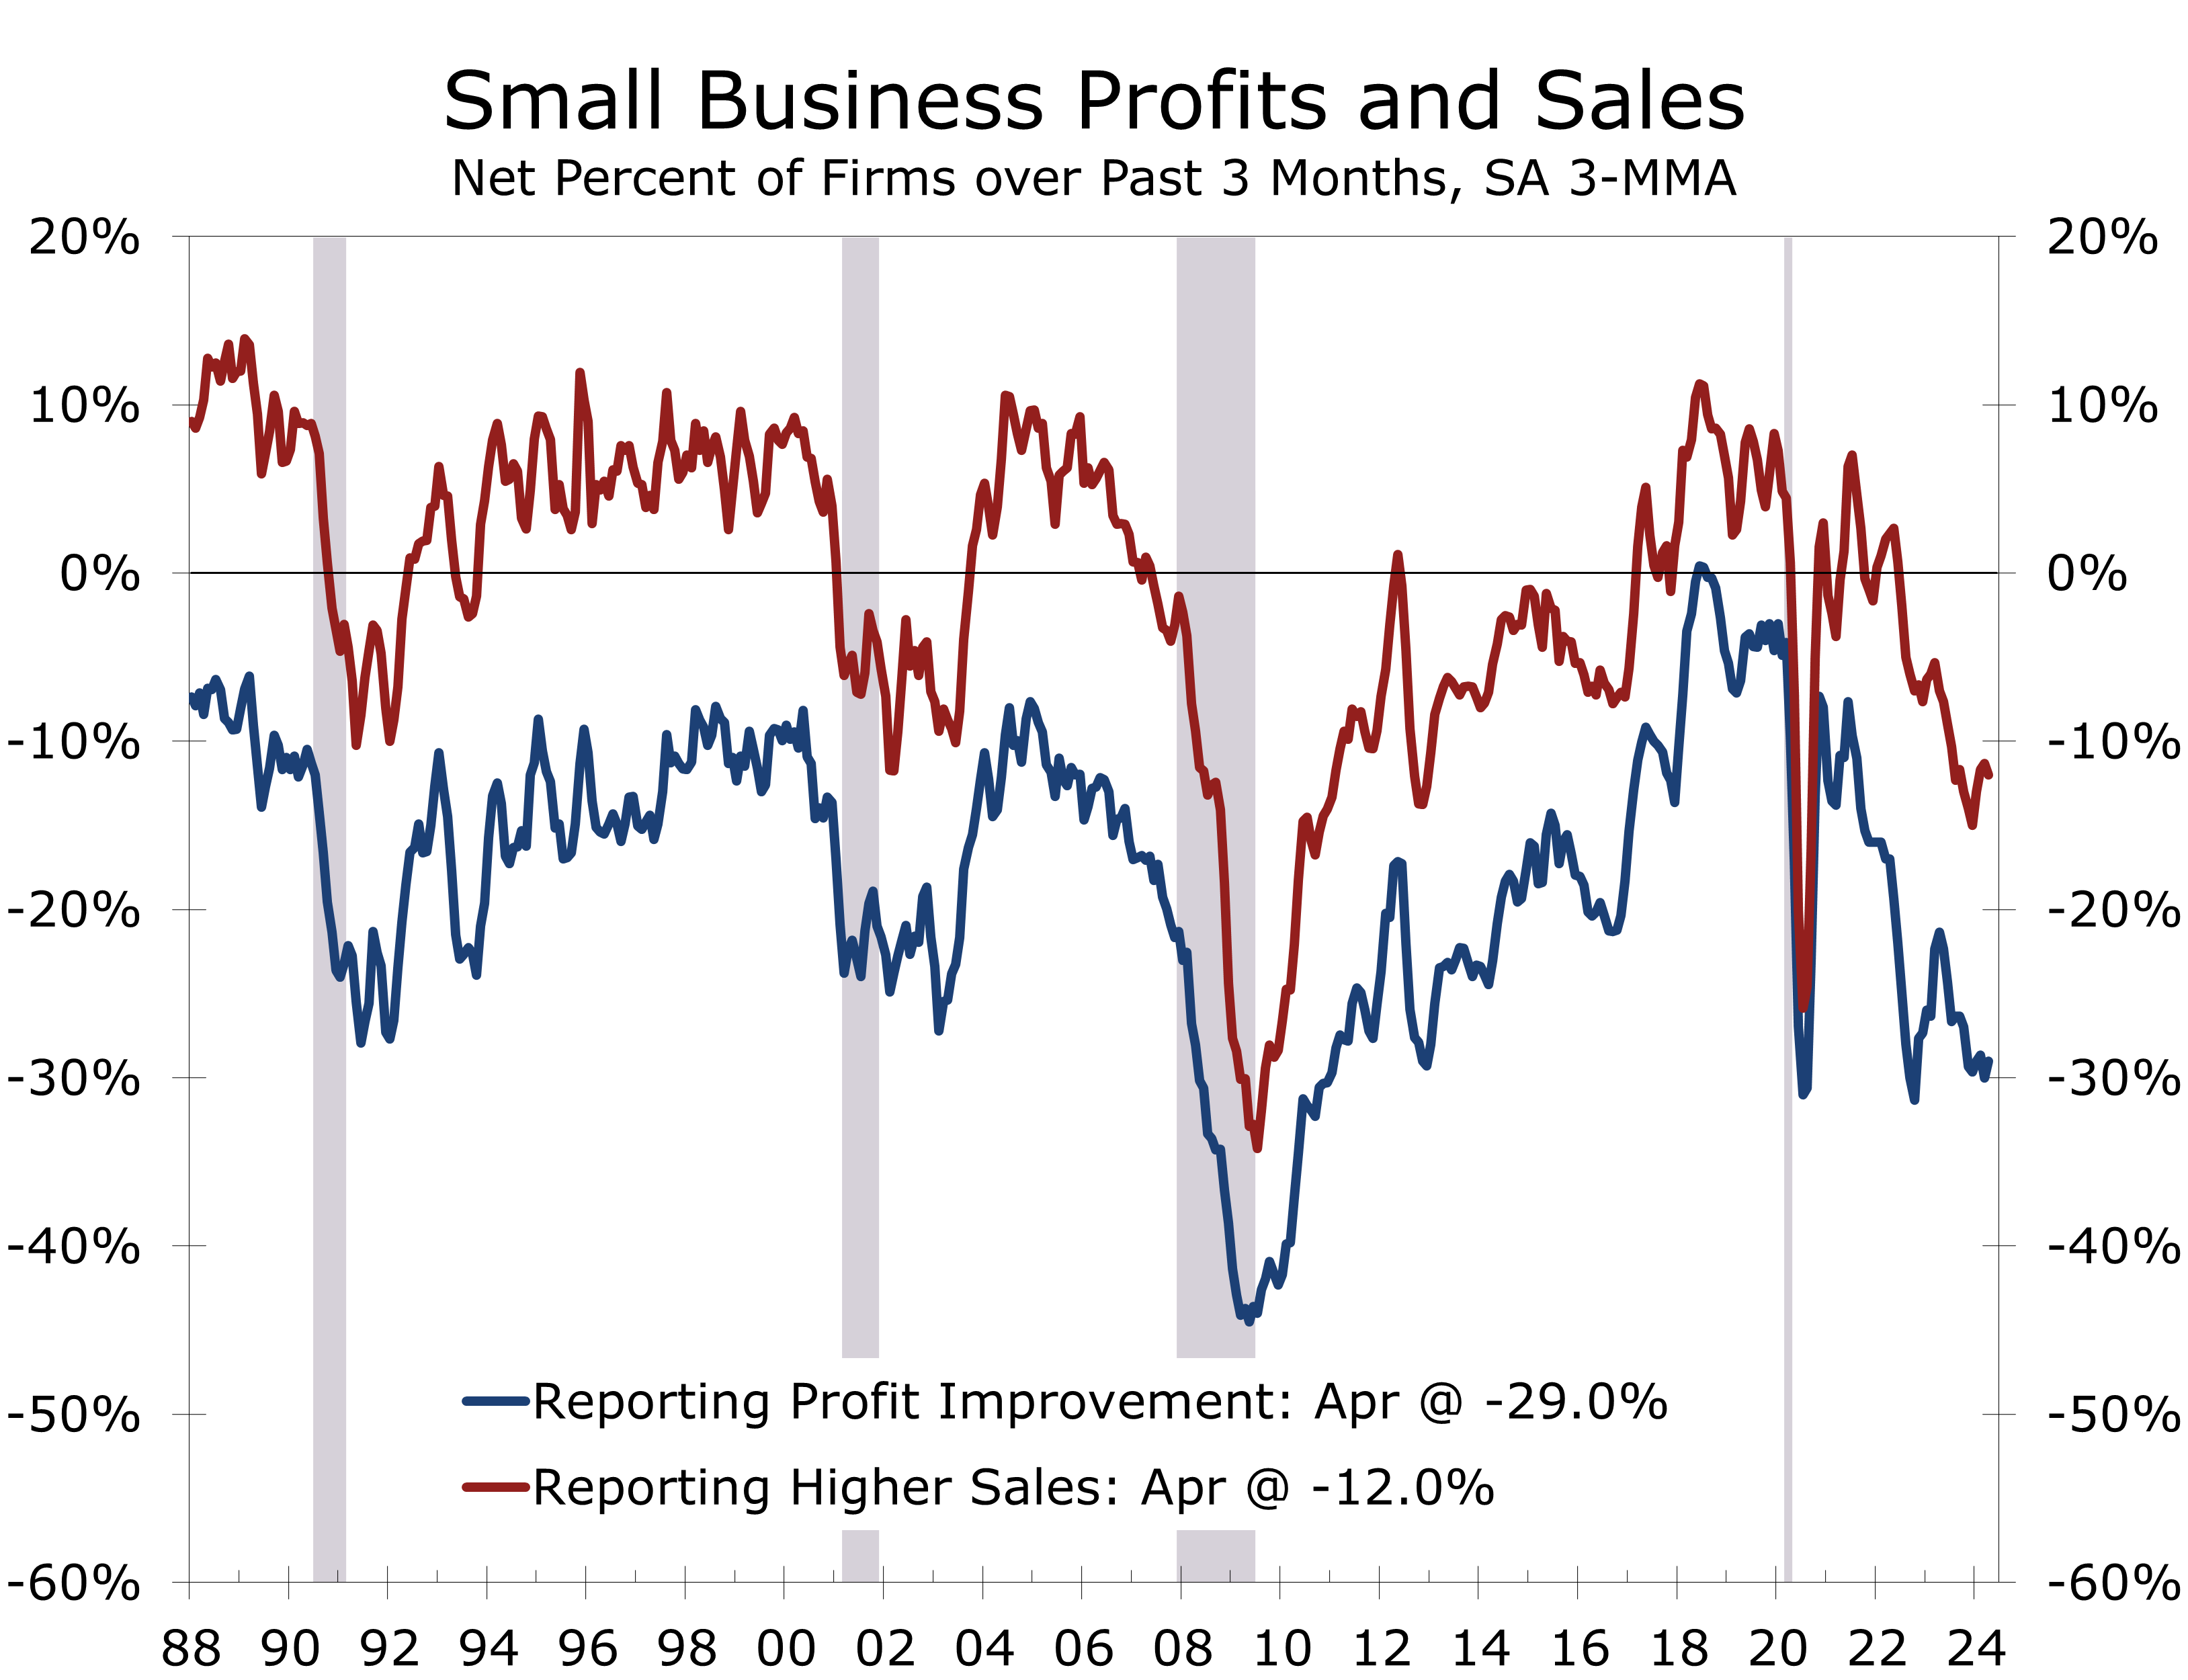
- Sales expectations remain negative, however, at -12, and the net share of owners reporting higher sales over the past 3 months fell 3 points to -13.
- Small businesses continued to get squeezed by rising operating costs that they are only partially able to pass onto their customers.
- Profits remain under pressure, with a net 27% of business owners reporting deteriorating profit trends.
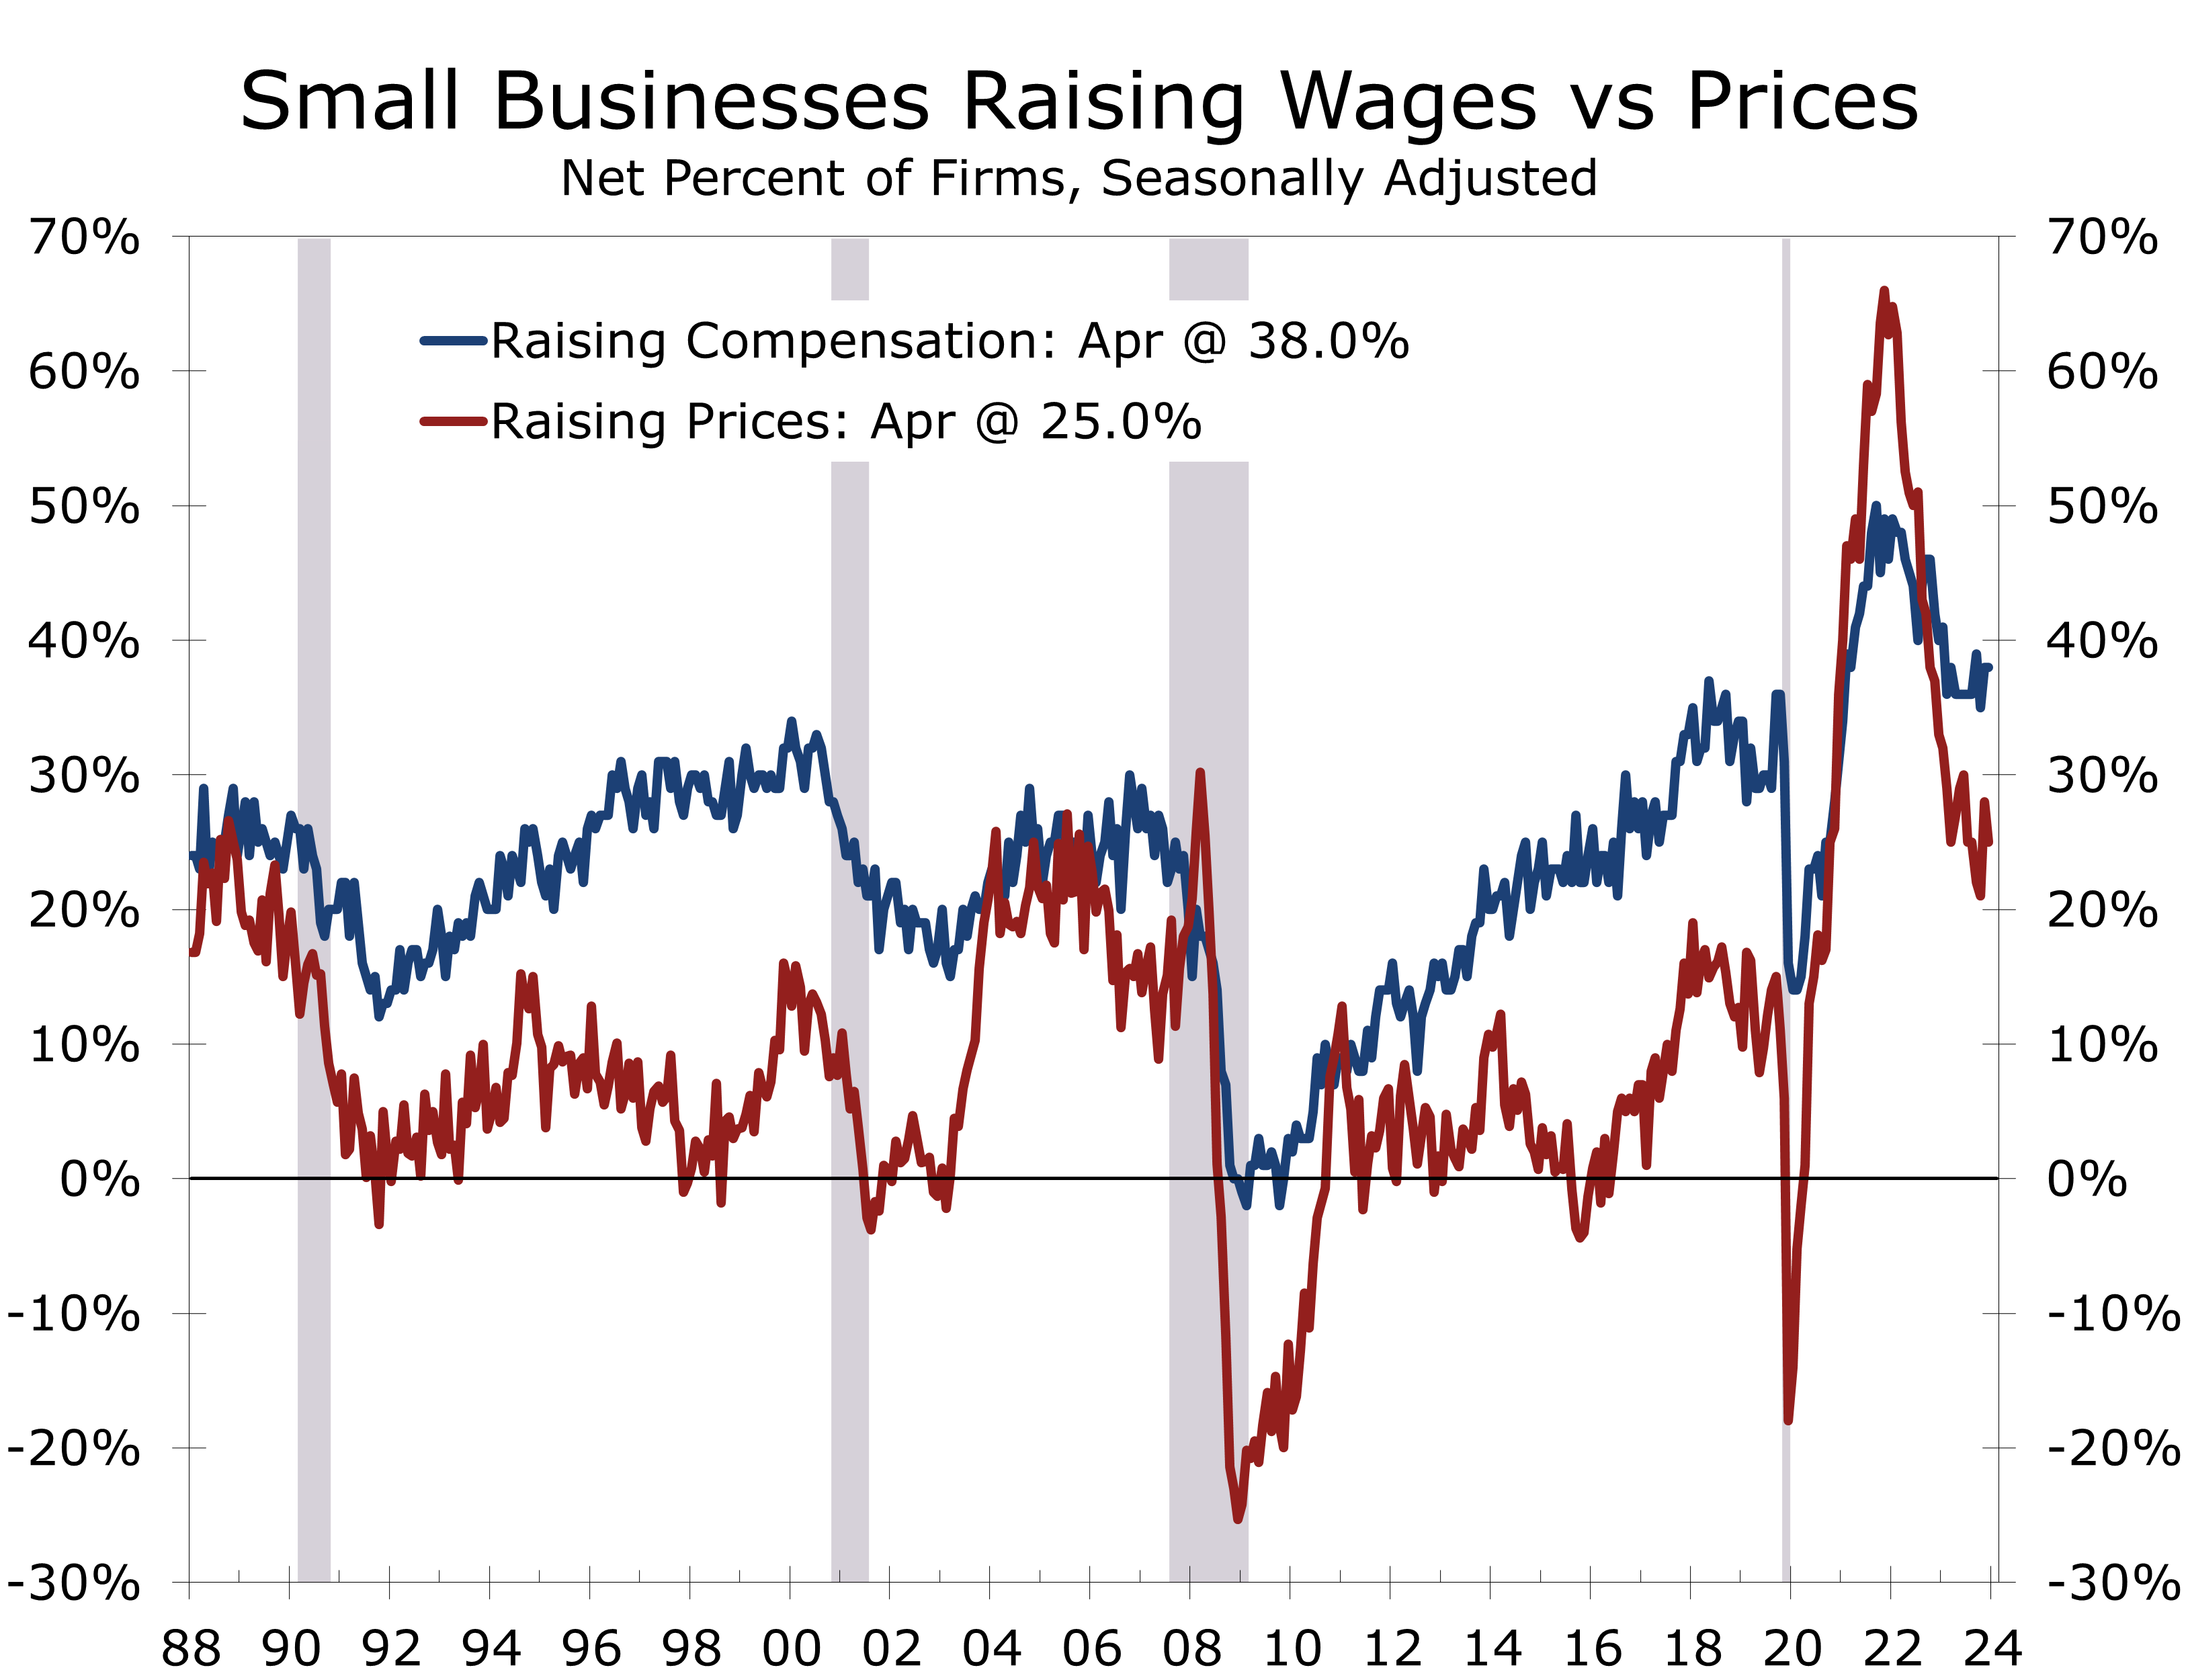
- Despite the squeeze on operating margins, the share of business owners planning to raise prices fell 7 points in April to 26%.
- The share of business owners that feel now is a good time to expand remains low at just 4%, versus 26% prior to the pandemic.
- Small business owners have dealt with a persistent squeeze on operating margins since the pandemic. Labor costs, insurance and raw materials are all rising faster than selling prices, squeezing operating margins and weighing on growth, hiring and capex.
Small business optimism improved slightly in April, rising 1.2 points to 89.9. This marked the first increase this year and left the index close to its post-pandemic lows. Small Business Optimism has averaged 90.6 for the past 2 years, well below its long-run average of 98.
Seven of the index’s 10 components rose in April, led by a 6-point jump in sales expectations. Hiring plans rose 3 points, while earnings trends and capital spending plans edged up 2 points. All rose off of very low levels, however, and remain exceptionally weak.
Small business owners have been facing difficulties since pandemic relief ended. The Payroll Protection Program offered significant support during the economic lockdown. However, over the past two years, operating margins have been squeezed as wages, material costs, and insurance expenses have risen much faster than business owners can pass these higher costs onto their customers.
Small Business operating margins have been squeezed persistently over the past two years.
The persistent squeeze on operating margins has led to a huge pullback in the share of owners that feel that now is a good time to expand. Only 4% feel now is a good time to expand, with the 32% of respondents citing poor economic conditions and 11% citing an unfavorable political environment as the key reasons.
A net negative 13% of all owners reported higher nominal sales in the past three months, down 3 points from March. The drop in sales is expected to reverse, as the net share of small business owners expecting higher real sales volumes over the coming month rose 6 percentage points to a net negative 12%. Both sales reading are relatively weak, however, which a big reason why small businesses are having such a hard time passing along their higher costs.
With operating margins under pressure, owners are being more selective about hiring and capex.
The share of small businesses reporting improving profit trends was a net negative 27% in April, which is 2 points better than March but still very weak. Among those reporting lower profits, 33% blamed weaker sales, 14% pointed to rising material costs, 13% cited usual seasonal changes, and 12% attributed it to labor costs. Conversely, among those reporting higher profits, 43% credited increased sales volumes, 26% cited usual seasonal changes, and 11% attributed it to higher selling prices.
With operating margins under pressure, small businesses are being more selective about hiring and capital spending. Plans to hire edged up 1 point to 12% but remain well below recent years. Hiring plans averaged 17% last year and 21% in 2022.
A net 38% of small businesses reported raising compensation over the past 3 months, the same as in March. Additionally, a net 21% plan to raise compensation over the next three months, also unchanged from March. Labor costs were cited as the top business problem by 11% of owners, an increase of 1 point from March and just 2 points below the peak of 13% recorded in December 2021. Meanwhile, 19% identified labor quality as their top business issue, up 1 point, and ranking just behind inflation (22%) as their most significant concern.
One reason higher compensation costs are so troubling is they are rising much faster than their ability to boost prices. This is particularly troubling for operators of retail shops and restaurants, where wages have spiked much more than they have for the overall economy.
The net percentage of business owners raising selling prices fell 3 points, reaching a seasonally adjusted net 25%. Moreover, a net 26% of owners plan to raise prices in April, down 7 points and marking the lowest level since last April. While the drop in pricing plans is good news for inflation, it also suggests businesses will pull back on hiring and capital spending, leading to slower economic growth ahead of the election.
Disclaimer: This publication has been prepared for informational purposes only and is not intended as a recommendation offer or solicitation with respect to the purchase or sale of any security or other financial product nor does it constitute investment advice.
April 14, 2024
Mark Vitner, Chief Economist
mark.vitner@piedmontcrescentcapital.com
(704) 458-4000