
A View from the Piedmont — Our Weekly Commentary on Money, Credit, Exchange Rates & Geopolitics
Oil Is Pricing a War, Bonds a Slowdown
Brent settled Friday at $116.72, its highest settle since late April, yet the 10-year breakeven sits at 2.34% and the Treasury rally came from real yields. The Fed is set to hold on Wednesday with a December hike still priced.
This report covers the major economic and geopolitical events of this past week and includes our updated forecast table, which we will revisit after the October 29 GDP release.
Market Dashboard
(as of Friday, October 23 close, unless noted)
| Rates & Credit | Rates & Credit | Equities & Commodities | Equities & Commodities |
|---|---|---|---|
| Fed funds target range | 3.75%-4.00% (unchanged since Sept 16 hike) | S&P 500 | 7,623.68 (-0.52% Fri, -0.5% wk) |
| 10-yr Treasury | 5.00% (-9 bp wk) | Dow Jones | 52,215.16 (-1.23% Fri, +0.4% wk) |
| 30-yr Treasury | 5.33% (-10 bp wk) | Nasdaq Composite | 25,955.34 (-0.21% Fri, -0.7% wk) |
| 2-yr Treasury | 4.69% (-5 bp wk) | Russell 2000 | 2,775.90 (-0.29% Fri, +2.0% wk) |
| 2s-10s spread | 31 bp (35 bp a week ago) | Philadelphia Semiconductor | 10,779.46 (+0.44% Fri, -3.2% wk) |
| 10-yr real yield | 2.66% (-8 bp wk) | VIX | 19.45 (-2.7% wk) |
| 10-yr breakeven | 2.34% (-1 bp wk) | Brent crude (Dec) | $116.72 (+3.1% Fri, +6.2% wk) |
| 5-yr breakeven | 2.48% (+11 bp wk) | WTI crude (Dec) | $103.27 (+3.8% Fri) |
| 30-yr mortgage | 7.32% (Freddie Mac, Oct 22) | Gold (futures) | About $4,008 (-1.3% Fri) |
| Initial jobless claims (wk ended 10/17) | 194,000 | U.S. Dollar Index (DXY) | 101.79 (little changed wk) |
Note: Treasury yields are the official daily par and real yield curves for Friday, October 23; weekly changes are against the October 16 close. Equity closes are Friday’s prints and weekly changes run from the October 16 close. Brent is the December contract, which expires October 30, and WTI is the December contract; last week’s WTI level was the November contract, which expired October 20. Gold is the front-month futures quote. The mortgage rate is the Freddie Mac survey for the week ended October 22. Jobless claims are for the week ended October 17. The dollar index level is approximate across sources.
Summary
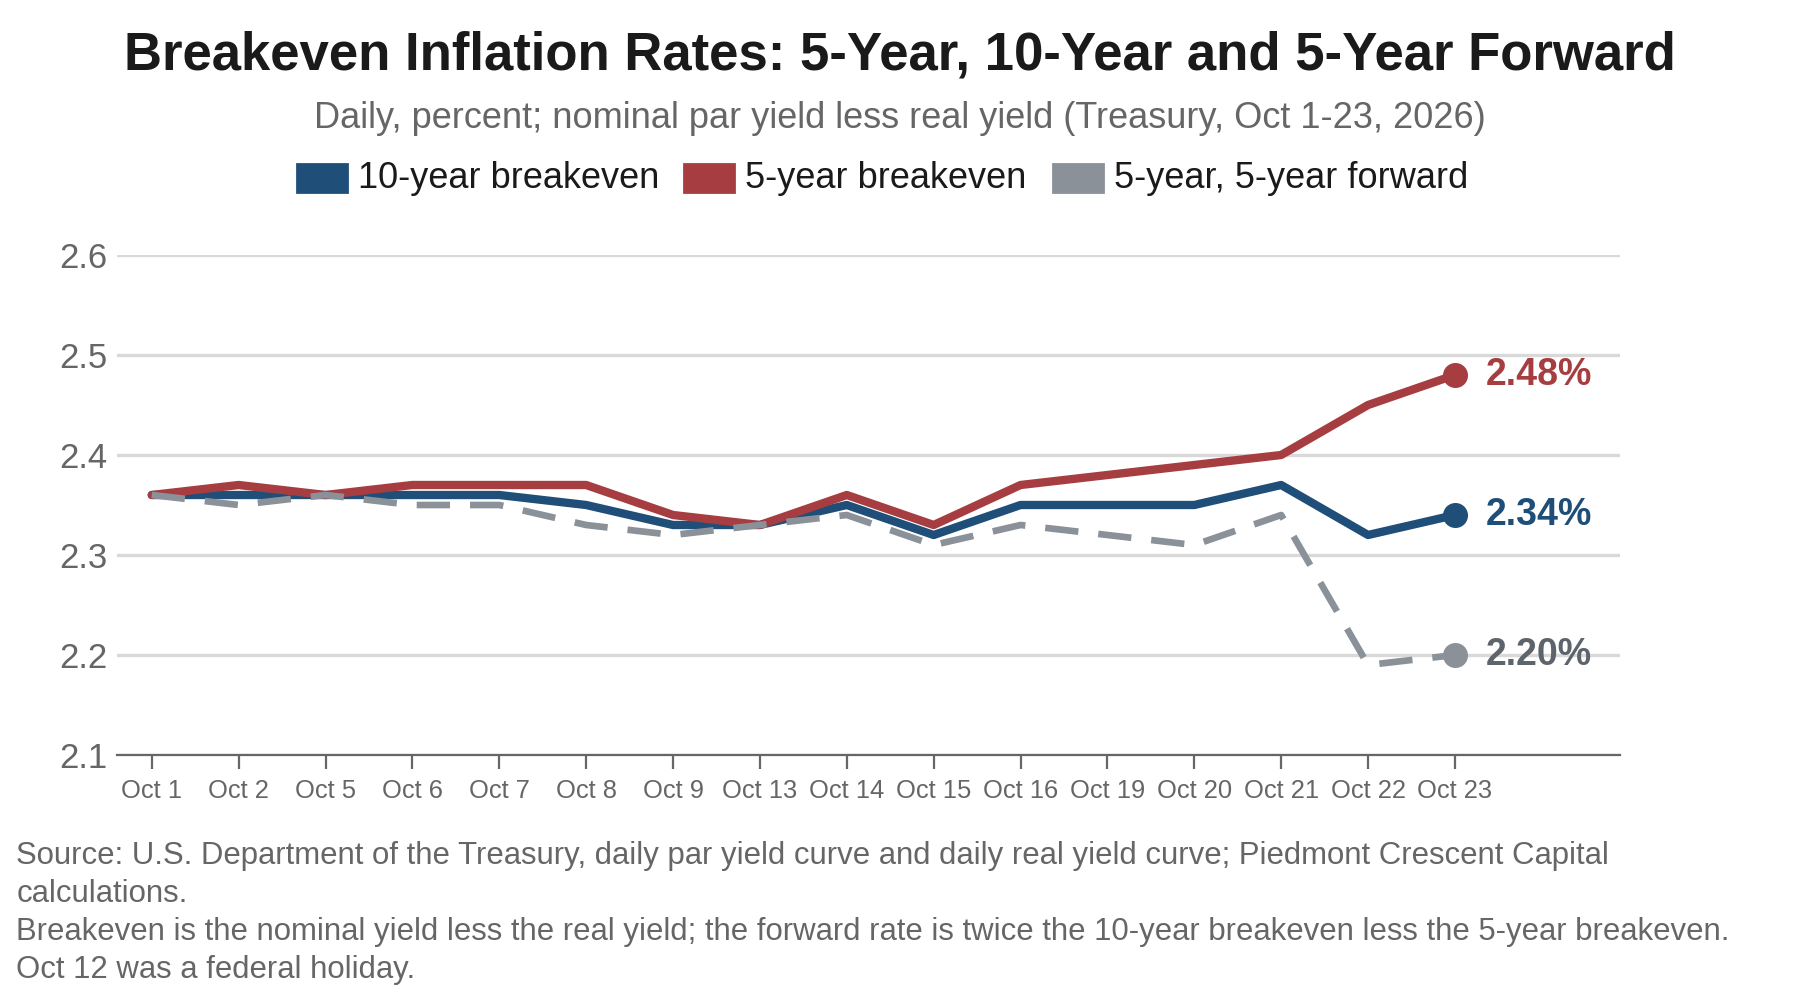
Oil is pricing a longer war, and the bond market is looking through it. Brent, the December contract, settled Friday at $116.72, up 3.1% on the day and about 6% on the week, its highest settle since late April. Houthi attacks on Saudi Arabia led the State Department to order non-emergency staff out of the kingdom, the Revolutionary Guard announced an offensive doctrine, and the New York Times reported that Washington and Jerusalem are weighing renewed strikes on Iran after the November 3 election. EIA retail diesel rose 9.7 cents to $6.28 a gallon, and S&P Global’s flash survey showed selling prices rising at the fastest pace since August 2022. The Treasury market did not follow. The 10-year breakeven closed at 2.34%, down 1 basis point on the week, and the 5-year forward breakeven, which we calculate at about 2.20%, fell 13 basis points. Only the front of the curve moved: the 5-year breakeven rose 11 basis points to 2.48%, the kind of rise we said last week would be the first sign that the bond market had started to price the pipeline.
The 10-year fell below 5% on a financing scare, and the Fed’s path barely changed. On Thursday the Nasdaq fell 2.6%, its worst day since June 5, after Meta reported $34.9 billion of quarterly capital spending against negative free cash flow of $2.1 billion and Lam Research flagged supply limits on chip demand into 2027. The 10-year yield dropped 17 basis points to 4.96%, its first close under 5% since September 22, and the 2-year dropped 16 basis points to 4.65%, its largest one-day decline since August 2025. Both gave back about 4 basis points on Friday as oil rose. On the week the 10-year fell 9 basis points to 5.00%, and 8 of those basis points were real yield. The 10-year real yield is 2.66%, and the 5-year forward real rate, which we calculate at about 3.0%, matches PIMCO’s estimate and is up roughly 50 basis points since Chair Warsh took over in June. Futures give the Committee about a 9% chance of a hike on Wednesday and roughly 70% to 80% for December, depending on the measure, and 94 of 100 economists in the Reuters poll expect a hold. We expect the same, followed by a hike on December 9.
The election calendar and the war calendar are now the same calendar. We think the next 10 days are among the most consequential in recent memory, and how they play out could shape the economic and financial outlook for the next couple of years. The White House has said it will not strike Iran before November 3, Israelis vote on Tuesday and Iran has offered a seven-day plan to reopen Hormuz in return for an end to the U.S. blockade of its ports. Russia and Ukraine have both backed three-way talks, possibly in Abu Dhabi in mid-November. Lula’s win in Brazil on Sunday, after Flávio Bolsonaro led the first round, was a surprise, and with the Israeli opposition ahead in the polls and Democrats up 8.1 points in the RealClearPolling average here, it suggests the left may be set for a strong autumn. Protests over living costs that began in Paris on September 17 now stretch from Spain to Albania. Real disposable income per person was $53,674 in August, 1.1% above a year ago, which is the backdrop for the referendum at home.
The Week’s Key Insight
Oil is pricing a longer war, and bonds are pricing a slower economy
Brent and the 10-year breakeven are telling different stories, and Figure 1 shows where the gap sits. Brent rose from $109.86 to $116.72 in a week, and the 10-year breakeven has stayed in a band of 2.32% to 2.37% all month. That is a market treating the energy shock as a cost that will pass through and then fade, and not as a change in the inflation regime. The 5-year breakeven has started to leave that band. It rose from 2.37% to 2.48% on the week, with 8 of those 11 basis points arriving in the last two sessions, and it now sits 14 basis points above the 10-year breakeven against 2 basis points a week ago. The 5-year forward rate, which is twice the 10-year breakeven less the 5-year breakeven, fell to 2.20% from 2.33%.
An inverted breakeven curve says inflation compensation is front-loaded, which fits our pipeline thesis. The producer price ladder we described last week has not yet reached the register, and the survey data suggest it is arriving. S&P Global’s flash composite output index was 57.6 in October, down from a five-year high of 58.4, but the selling-price index rose to its highest reading since August 2022 and supplier delivery times lengthened the most since 2022. A market that expects that to pass through over the next few years and then fade would price what Figure 1 shows, which is more compensation at five years and none beyond. We read the 2.20% forward rate as a judgment that the Committee can stop once the pipeline has run its course, and it is our judgment as well.
Real yields did the work this week, and the AI financing story supplied the reason. From the October 16 close to the October 23 close the 10-year real yield fell 8 basis points to 2.66% and the 5-year real yield fell 18 basis points to 2.34%, so the decline was largest at the front of the curve. Almost all of it came on Thursday, when the 5-year real yield fell 22 basis points in one session. Meta’s results turned a debt-funded capital spending story into a free cash flow story, with capital spending of $34.91 billion against negative free cash flow of $2.12 billion and a 7% drop in the shares. The high-yield spread widened 9 basis points from October 16 to 340 basis points on Thursday, well short of the 400 basis points we named last week as the level that would give the Committee a reason to wait. Thursday’s move was a flight to quality in a week when initial jobless claims fell 6,000 to 194,000, so the move reflected financial conditions and had little to do with the labor market.
The real economy is not telling the same story as the bond market. The S&P Global flash composite PMI eased to 57.6 from 58.4, but new orders reached a five-and-a-half-year high and the survey’s output readings are consistent with GDP growth near 5% at an annual rate, with 4.0% indicated for the third quarter against 3.4% in our table. Manufacturing edged up to 56.0 from 55.9 while services slipped to 57.9 from 58.8. Goods export orders rose for the first time since June of last year, employment grew at its fastest rate since June 2022 with factory hiring the strongest since March 2012, and backlogs of work rose the most since May 2022. S&P Global calls the rise in selling prices broad-based, with services at the steepest since August 2022, and respondents cite oil, energy and freight as the main cost drivers, which fits our pipeline thesis. Its composite of output, employment and cost readings sits in rate-hike territory, which supports our call. Abroad, the euro area slowed, with the composite at 51.9 from 53.1, manufacturing at 52.4 and services at 51.7, and France back in contraction as strikes and unrest weigh on activity, while the United Kingdom composite rose to 53.1, an eight-month high, and employment there rose for the first time since September 2024. The United States is outpacing Europe, which is more exposed to oil. We have fourth-quarter growth at 2.9%, with a solid holiday season, some slowing in consumer spending and residential construction a larger drag, and we expect industrial production to rise about 3% over the next year. Manufacturing supplies most of the cyclical swing in the economy, and it gives growth a firm underpinning. Third-quarter GDP, reported Thursday, has a consensus of 3.2% and an Atlanta Fed GDPNow estimate near 3.5%, which brackets the 3.4% in our table, though the PMI points higher. The 2-year yield of 4.69% is about 80 basis points above the midpoint of the funds rate range, so the bond market has priced the hikes and has not abandoned them.
The Committee meets Wednesday with a hold priced, a December hike expected and a statement that will avoid locking in the next move. Futures put the chance of a hold at about 90%, and 94 of 100 economists in the Reuters poll expect no change. We expect the statement to say little about the path and to describe expected economic conditions and inflation, which leaves the markets to decide what that means for the next decision. That fits our view from October 7 that the Committee needs less guidance and not none. Participants have settled on a pace of one hike every other meeting, which makes December 9 the next move and March the one after. We expect Logan, and possibly Hammack, to dissent in favor of a hike on Wednesday, and dissents would read as a December signal. Futures have the funds rate peaking near 4.55% in the fall of 2027, only a little above the top of the 4.25%-4.50% range in our table, so the market and we are close on the destination. There are no new projections this month, so the statement, the dissent count and the press conference are the guide.
Thursday’s PCE report will test the wedge we described in September. The consensus calls for the September PCE price index to rise 0.5% on the month and 3.6% from a year ago, with the core index up 0.3% and 3.1%. Core PCE would then run 50 basis points above the 2.6% core CPI rate, the same gap that Goldman attributes in part to the way AI-related prices enter the PCE index. A core reading of 0.4% or higher would raise the odds of both December and March.
The election calendar has become the geopolitical calendar
The polls have moved against the party in the White House, and the markets have followed. The Reuters/Ipsos poll that closed October 19 put President Trump’s approval at 31%, the lowest of either term, with 68% disapproving of his handling of the economy, including 37% of Republicans. Democrats lead the generic ballot 47% to 35% among registered voters, a 12-point lead that was 7 points two weeks ago, and the RealClearPolling average has them ahead 50.5% to 42.4%. Kalshi and Polymarket, averaged, gave Democrats 92% odds of winning the House and 67% for the Senate on Friday. Our framework treats the election as a referendum on real after-tax income per person, and that measure has stalled. Real disposable personal income per capita was $53,674 in August, 1.1% above a year ago, slightly below July’s $53,703 and just 0.9% above April. A gain that modest argues for larger House losses for the party in the White House. The September figure arrives with the PCE report on Thursday.
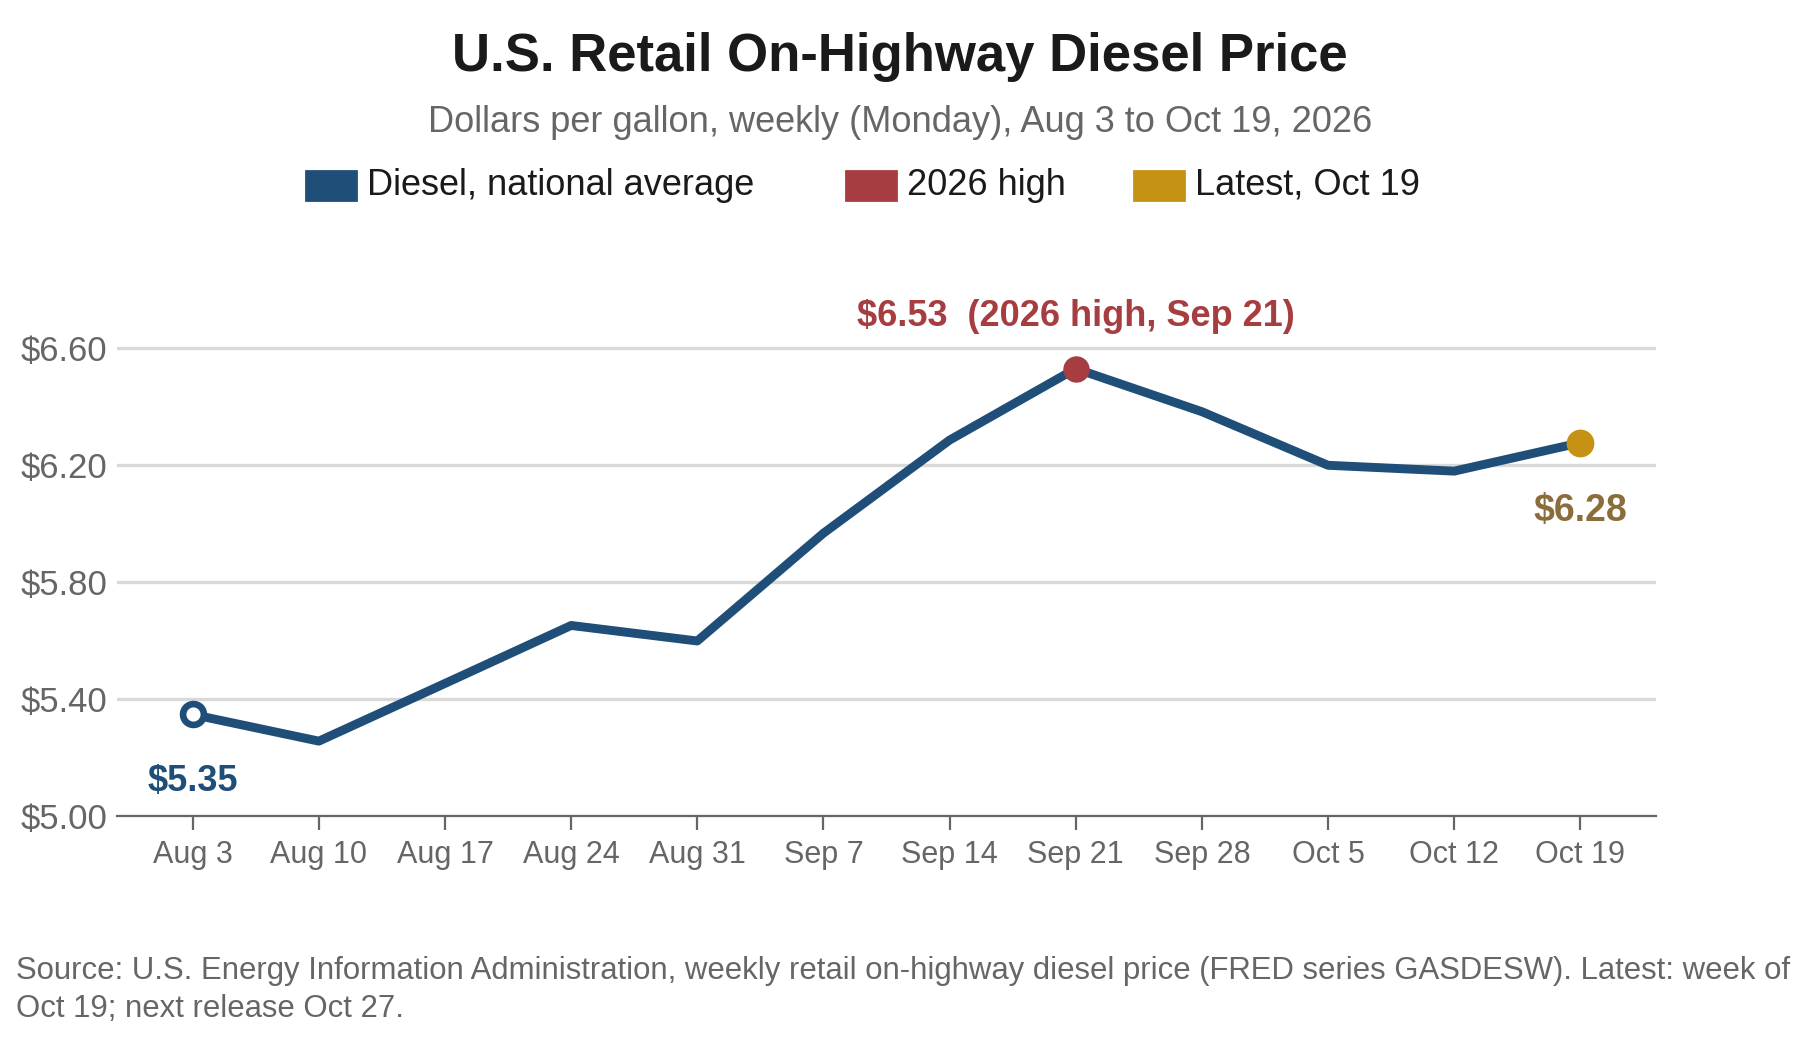
Diesel is the price that connects the war to the ballot box. The EIA’s weekly survey put on-highway diesel at $6.276 a gallon on October 19, up 9.7 cents on the week and $2.66 above a year ago, and 25 cents below the 2026 high of $6.529 set the week of September 21. The price has held between $6.18 and $6.53 for six weeks. The administration has leaned on supply announcements. On October 9 the President said Russia would ship more than 300,000 tons of diesel immediately, 500,000 more in November and 1 million after that, and the Treasury issued a general license for Russian-origin diesel. Energy analyst Ed Hirs called the volumes small against a U.S. market that exports about 1.5 million barrels a day, and Gulf Oil’s Tom Kloza noted that Ukrainian strikes have reportedly cut Russian refining by about half. Diesel dipped 7 to 8 cents a gallon on the announcement, and traders doubted it marked a change in trend. Ukraine’s campaign against Russian refineries works against the White House’s own price goal.
The Iran risk window opens after the vote. The White House has said publicly that it will not strike Iran before the election, and the Financial Times reported that an Israeli campaign planned for the weekend of October 10 was postponed mainly for that reason. Prime Minister Netanyahu has pledged to topple Iran’s government. The Revolutionary Guard announced on October 21 that its doctrine is now offensive, and the State Department ordered non-emergency personnel out of Saudi Arabia after the Houthi attacks. Iran has offered to restore Hormuz shipping within seven days if the United States ends its blockade of its ports and eases sanctions, but Secretary of State Rubio has called a deal extremely difficult. Iran wants to restore some sense of deterrence against the United States and its Arab neighbors, and Russia feels emboldened, so the longer-term risk is that pressure for a quick solution produces a bad deal for the West. The market treats the risk as postponed. Brent rose 3.1% on Friday, the day the New York Times reported that Washington and Israel are weighing renewed strikes after the midterms, and crude flows through Hormuz were still about 9.4 million barrels a day on October 16, roughly 70% of the pre-war average.
Brazil’s surprise points the same way as the polls in Israel and here, and Europe’s streets show what the cost of living is doing to incumbents. Lula won a fourth term on Sunday with 51.8% of the vote against Flávio Bolsonaro’s 48.2%, a margin of about 4.4 million votes, after Bolsonaro led the first round 47.0% to 45.2% and defied the polls. Lula carried the entire Northeast and flipped Minas Gerais, while Bolsonaro took São Paulo and Rio de Janeiro. The count is not yet certified, Brazilian assets had rallied on the first-round result, and our read is preliminary. It suggests the left may be positioned for a strong autumn, with Israel on Tuesday and our own midterms on November 3 the next tests. Europe shows the other side of the cost-of-living ledger. Protests that began September 17 with Paris teachers have spread to Spain, Belgium, Italy, Portugal and Albania, turned violent in France and brought curfews to Paris and Lille. Spain’s Prime Minister Sánchez has called an election for November 29. France spends more on debt service this year than on defense or education, and the 170 basis point gap of its 10-year yield over Germany’s is the bond market’s reading of the same strain.
Behind the Numbers
Oil is the front of the pipeline, and the front got hotter. Brent, the December contract, settled at $116.72 on Friday, up $3.55 on the day, and WTI, also now the December contract, settled at $103.27. The Brent-WTI spread widened to $13.45 from $8.45, though part of that reflects the roll from the November WTI contract, which expired Tuesday. Brent’s December contract expires October 30. Houthi attacks on Saudi Arabia, a UAE report of an oil spill off Umm Al Quwain and the Revolutionary Guard’s claim that four vessels were struck near Hormuz drove the move, and the S&P 500 energy sector closed at a record on a day the index fell 0.5%. The Department of Energy authorized an emergency release of up to 400,000 barrels from the Strategic Petroleum Reserve for Phillips 66’s Lake Charles refinery, and the IEA’s release of more than 20 million barrels of diesel is still working through the system.
Diplomacy is moving in Russia and Ukraine, and so are the drones. Steve Witkoff, the President’s envoy, met Ukrainian and European officials in Oslo on October 20 and President Putin in St. Petersburg on October 21 for about three hours. Putin and President Zelenskyy both backed a U.S. proposal for three-way talks, which Kyiv wants by early November and the Kremlin has suggested for mid-November, possibly in Abu Dhabi. The two sides remain far apart on terms. On October 19 Ukraine launched more than 1,000 drones at Russia, with fires at an oil terminal and depots near St. Petersburg, and Zelenskyy said Russia struck Ukrainian energy facilities 76 times in the week after the October 11 energy ceasefire announcement. U.S. intelligence sharing, which had lapsed, has been restored. Both sides are hitting energy, and the effect shows up in diesel.
The labor market is close to balance, and hiring should pick up. Initial jobless claims fell 6,000 to 194,000 for the week ended October 17. Payrolls have averaged 51,000 a month over the past three months, and an unemployment rate of 4.2% sits at the upper end of what is widely considered full employment. We expect job growth to rise gradually to about 80,000 a month toward the end of next year on more hiring in factories, modest growth in nonresidential construction and the return to the workforce of immigrant workers with legal status who were scared away by this year’s heightened enforcement. In the flash PMI, overall employment dipped after a surge in September, while factory hiring rose to its highest level since March 2012.
Stocks lost 0.5% on the week, and the selling spread from AI to almost everything else. The S&P 500 closed at 7,623.68, up 11.4% for the year. The Dow rose 0.4% and the Russell 2000 rose 2.0% on the week, while the Nasdaq fell 0.7% in its second straight weekly loss. Friday’s session was broad, with almost three of every four S&P 500 stocks lower and energy the only clear sector gainer, and the VIX closed at 19.45, below last week’s 19.99. About a third of S&P 500 companies report this week, including Microsoft, Alphabet and Amazon, and the question for each is the one Meta answered badly, which is how much capital spending the cash flow can cover.
Housing is where a 10-year near 5% shows up first. Freddie Mac’s 30-year mortgage rate fell to 7.32% in the week ended October 22 from 7.40%, the first decline in nine weeks, against 6.19% a year ago, and it is still above our 7.20% fourth-quarter forecast. September housing starts fell 5.2% to a 1.221 million annual rate, well short of the 1.305 million consensus, with single-family starts at 859,000 and permits at 1.400 million. The National Association of Realtors’ pending home sales index fell 7.3% in September to 66.0, the lowest on record. Starts came in below the 1.25 million level we said would extend the case for a housing downgrade, and the 1.293 million in our third-quarter cell now looks too high. September new home sales arrive Tuesday.
The rest of the world is tightening, and France is the stress point. The French 10-year yield is near 5%, about 170 basis points over Germany’s, the widest gap since 2011, with Paris and Lille under curfew. The Bank of Canada is priced at about an 80% chance of a quarter-point hike from 2.25% on Wednesday, the Reserve Bank of New Zealand at 75% to 80% for a hike to 3.00%, the European Central Bank is expected to hold its deposit rate at 2.50% on Thursday, and the Bank of Japan to hold at 1.25% on Friday. China’s Fifth Plenum begins Monday, with no major stimulus expected. The dollar index closed at 101.79, little changed on the week.
Bottom Line
We continue to expect the Committee to hold at the October 27-28 meeting and to raise the funds rate a quarter point on December 9, to 4.00%-4.25%, and again in March, to 4.25%-4.50%, with June on the fence. Two more hikes appear assured to us, and a third may prove necessary if inflation does not ease. We think the Committee’s center sits in about the same place. The week’s evidence strengthened the call without changing it. Selling prices in the flash PMI rose at the fastest pace since August 2022, the 5-year breakeven began to climb and factories are hiring, while the Treasury rally reflected a financing scare that has not shown up in claims or the surveys. Behind the overshoot are tariffs, pass-through of the energy shock, AI-driven price increases and a strengthening manufacturing sector that is working off historically low inventories, which has given goods producers more pricing power. We expect manufacturing to strengthen further through 2027, which is why we see hike risk and long-term rates near 5% even as inflation moderates, and much of the moderation in the second half of 2027 will come from easy base effects. The next 10 days could change that picture, and we will revisit the call as the Fed statement, the GDP and PCE reports, the election and the refunding announcement arrive.
The risks to that call run in both directions, and geopolitics is the largest unknown. Three pieces matter most. First, energy and geopolitics: Brent settled Friday at $116.72, above the $110 level we named last week, and a deal on Iran or Ukraine will be difficult to reach. The memorandum of understanding signed last summer produced a much quicker and more substantial decline in oil prices, and the Committee is likely to remember it, which will keep the Fed cautious. The midterm outcome may shape how Washington approaches both. Second, credit: the AI financing scare is a true sign that credit is tightening. Changes always show first at the margin, in the riskiest borrowers, which here are the highly leveraged neo-cloud providers. If the pressure spreads beyond them, the tightening becomes significant. We think another 50 to 75 basis points of tightening is all the markets need, and beyond that the Committee risks a credit crunch, so a high-yield spread that moves from 340 toward 400 basis points would give it a reason to wait. Third, the pipeline: if selling prices in the surveys keep rising and producer readings keep feeding core goods, the third hike becomes likely. Our signal for the other direction is core services outside housing falling to 0.2% or less for two months with shelter back at its spring pace.
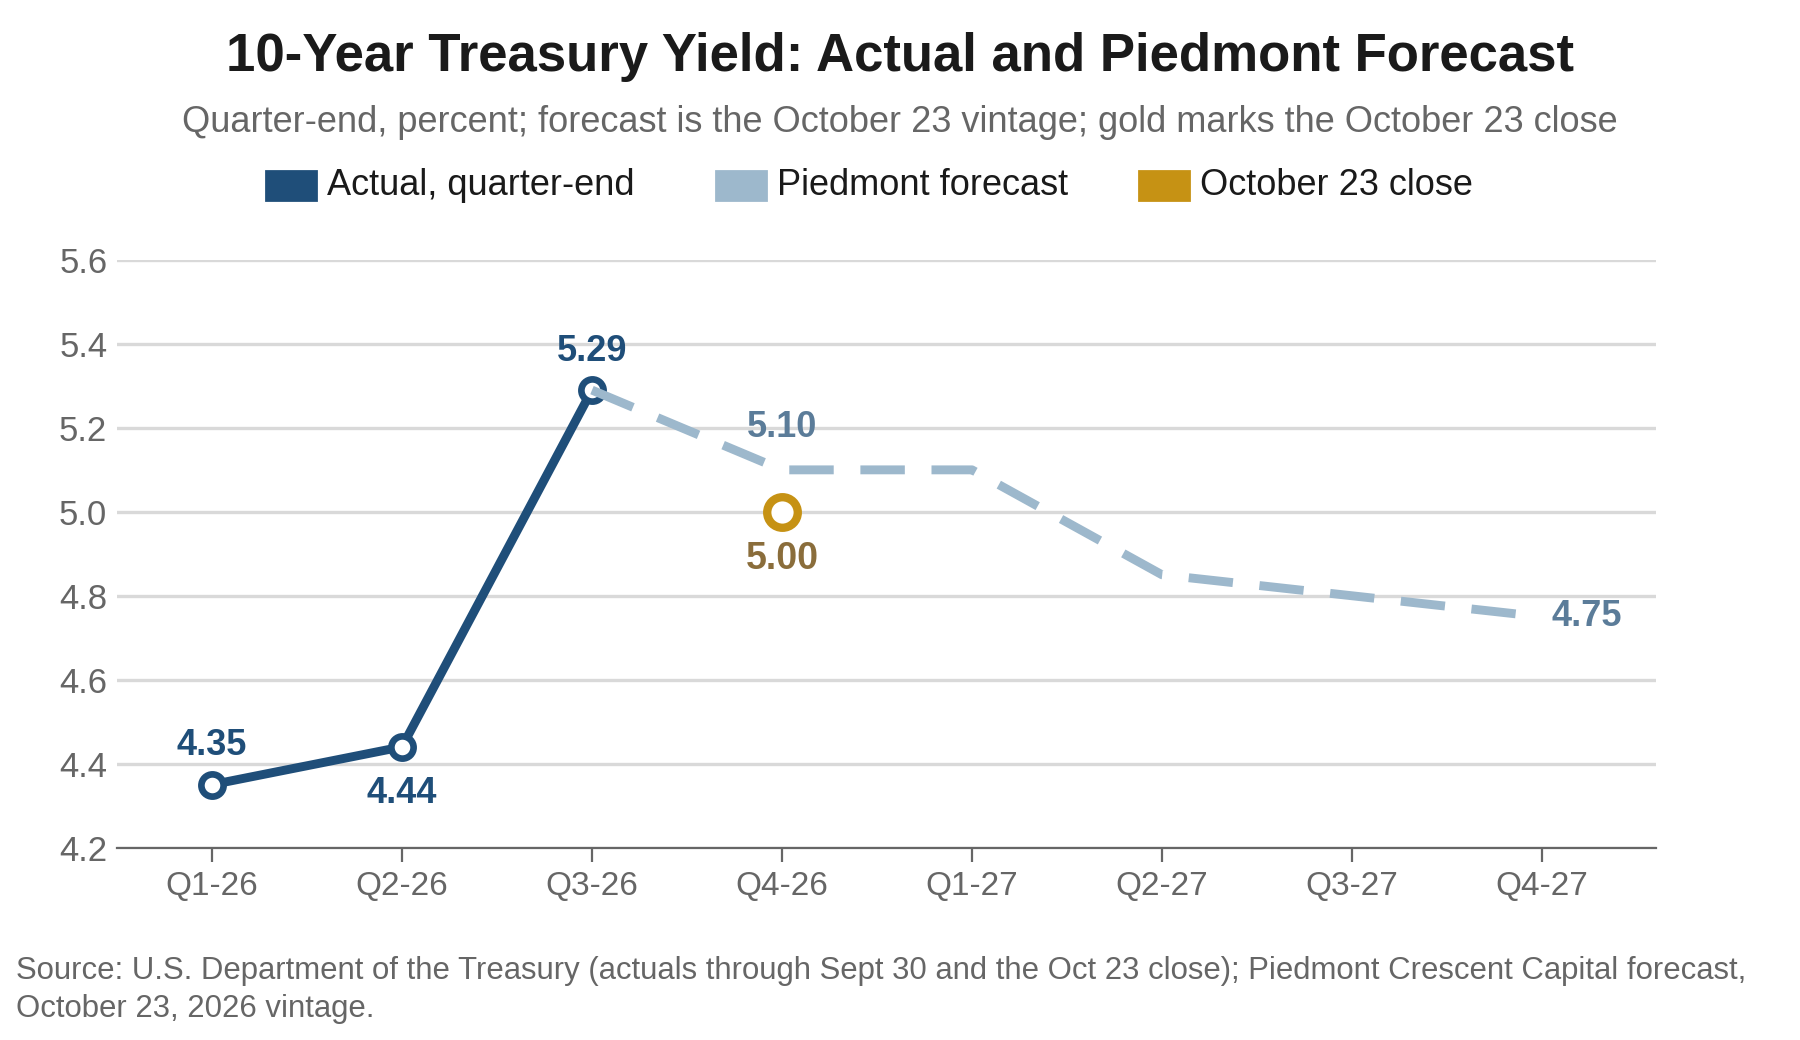
The 10-year yield is 10 basis points below our fourth-quarter forecast, and Figure 3 shows the gap. At 5.00% the 10-year sits under the 5.10% in our table, which we trimmed from 5.15% in this week’s update. We are not changing the forecast on a growth scare that has not shown up in the data. With manufacturing strengthening into 2027, we expect long-term rates to stay near 5% even as inflation moderates. One major outside house expects December to be the last hike, and we think a stronger factory sector argues against that. The comparison with nominal GDP growth near 6.6% that we have used since September 28 shows a gap of about 160 basis points, up from 150 a week ago, so the cost of capital is still not choking the expansion, and Thursday’s GDP report will update the nominal figure.
CFO and Treasurers Corner
- Budget fuel off today’s price, and add a surcharge cushion. EIA retail diesel was $6.28 a gallon on October 19, up 9.7 cents on the week and $2.66 above a year ago, and Brent at $116.72 is above the $105 fourth-quarter average in our table. Union Pacific’s third-quarter volume rose 6% and domestic intermodal 13%, a fifth straight record, as diesel and tight trucking capacity pushed freight onto rail, so shippers should price intermodal into first-quarter contracts and budget fuel at current levels.
- Use days near 5% on the 10-year to term out funding. The 10-year ranged from 4.96% to 5.31% in October, and our fourth-quarter forecast is 5.10%. Treasury’s refunding announcement comes November 4 and the 20-year auction this week tailed by 0.9 basis point, so supply is still a risk. A sub-5% print is a better entry than the October CPI on November 10.
- Keep cash short and let reinvestment float. Three-month bills yield 4.22% and one-year Treasuries 4.44%, against 4.69% on the 2-year. Our call for a December hike and one more in 2027 lifts bill yields from here, and the 2-year already prices most of that, so extending cash gains little and risks locking in a rate that the next hike makes look low. Match term deposits only to known outflows.
- Review exposure to debt-funded AI infrastructure, and read the credit price before the equity price. The high-yield spread widened 9 basis points to 340 on Thursday, and Meta’s $34.9 billion of capital spending against negative free cash flow shows how quickly a financing question becomes an equity question. Check customer and supplier concentration in operators and equipment makers, and watch capital spending guidance from Microsoft, Alphabet and Amazon next week.
- Underwrite housing exposure at a mortgage rate above 7%, and give little weight to one week’s decline. The 30-year rate fell to 7.32%, the first decline in nine weeks, but September starts of 1.221 million, a record-low pending home sales index and builder sentiment at its lowest since 2012 describe the demand side. Stress plans against a rate above 7% into the spring selling season.
- Read earnings season for who can pass costs through and who cannot. Procter & Gamble grew organic sales 4% on 2% volume, yet core gross margin fell 150 basis points, 140 of them from commodity costs, and it now expects a $1.4 billion after-tax commodity headwind in fiscal 2027 while holding its earnings guidance. Southwest raised average fares nearly 27% and posted record third-quarter revenue of $8.4 billion, but its fuel bill rose $821 million and it cut its 2026 earnings forecast to $2.60 to $2.85 a share from $3.25 to $4.25. Valero earned $23.90 a share against $3.66 a year ago, with its refining margin at $39.24 a barrel against $13.14, because Gulf Coast diesel sold $72 a barrel over Brent, against $21. The energy shock is moving profit from fuel users to refiners, and pricing power is deciding who keeps the rest. Test supplier surcharges and customer price increases against those three examples.
- Plan for slower civil-government awards and a cooler industrial leasing market. Booz Allen’s revenue fell 4% to $2.8 billion and its headcount dropped 4% to 31,000, with defense and national security work holding up but civil work weaker as agencies extend contracts and push out recompetes. Contractors and suppliers with federal exposure should plan for slower awards and payments in civil programs. First Industrial raised its 2026 guidance and its new and renewal leases rolled at rents 52% higher, but occupancy slipped to 94.1% from 94.9% in June, and analysts expect the rent gains on rollovers to narrow. Tenants renewing warehouse space have more leverage than a year ago, and owners should underwrite smaller spreads.
- Schedule pricing and hedge executions around five dates. They are October 28 (the FOMC decision), October 29 (GDP and PCE), November 3 (the election), November 4 (Treasury refunding) and November 10 (October CPI). Issuers who can price before the Fed statement or after the refunding avoid the thickest event risk, and fuel hedges referenced to the December Brent contract need to be rolled before it expires on October 30.
Piedmont Perspective
The Great Divergence is a long thought piece on the underlying structure of today's economy. It starts from two facts that do not change from week to week. Slower labor force growth has lowered the speed limit on output, and a 10-year Treasury yield near 5% has raised the price of capital well above what firms and governments paid for most of the last 15 years. Together they explain why the same data can look strong in one part of the economy and weak in the next.
The divides fall into three groups, and seven themes keep growth above its slower trend. The first group is who owns, with capital against labor and the K-shaped split between higher-income and other households. The second is where the money goes, with artificial intelligence against everything else and technology stocks against the rest of the S&P 500. The third is who has to borrow, with rate-sensitive sectors against the rest and younger households against older households, because older households are more likely to own a home with a low-rate mortgage or none. The implications concern dispersion across sectors and households more than the direction of the index, and the policy call matches this letter: a hold on October 27-28, a hike on December 9 to 4.00-4.25%, at least one more in early 2027 and a 10-year Treasury between 4.75% and 5.50% through the first quarter.
You can access our full report at: The Piedmont Perspective Archives – Piedmont Crescent Capital
The Week Ahead
It is the heaviest week of the autumn, with the Fed on Wednesday, GDP and PCE on Thursday, the Employment Cost Index on Friday and an Israeli election on Tuesday. The 10 days that end with the Treasury’s refunding announcement on November 4 could set the course for rates, oil and growth for the next couple of years. Consensus figures below come from the Goldman Sachs calendar, the Reuters poll of economists and market calendars, and they vary by a tenth or two across sources. About a third of S&P 500 companies also report.
Monday: The Treasury buys back 20-year to 30-year bonds for liquidity support, China’s Fifth Plenum begins and runs through Thursday with no major stimulus expected, and Germany’s Ifo index for October is due. Verizon reports before the open and Cadence Design, Nucor, Rambus and Amkor after the close. What would move us: a French-German spread that stays beyond 170 basis points would add a euro-area credit story to the AI financing story.
Tuesday: Israelis vote for the 120-seat Knesset (see below). In the United States, September durable goods orders (consensus +1.9%, after -0.1%; ex-transportation +0.6% and core capital goods +0.8%), the August Case-Shiller home price index (+0.3%, after +0.3%), the Conference Board’s October consumer confidence index (consensus 80.9, after 81.9) and September new home sales (consensus -4.8%, or about 650,000, after 684,000) arrive, with the EIA’s weekly fuel survey and Boeing and UPS earnings. The FOMC meeting begins. What would move us: new home sales near the consensus would fall short of the 662,000 in our third-quarter cell and add to the housing downgrade case, and diesel above the September 21 high of $6.529 would put the pipeline back in the headlines before the election.
Wednesday: The Committee announces its decision at 2:00 p.m. Eastern, with a hold at 3.75%-4.00% expected (futures put the chance of a hold near 90%), and Chair Warsh holds his press conference at 2:30 p.m. There is no Summary of Economic Projections this month, so the statement, the dissent count and the press conference are the guide to December. The Bank of Canada and the Reserve Bank of New Zealand are priced for hikes, and the United Kingdom presents its Autumn Budget. The September advance goods trade balance (consensus -$130.2 billion, after -$132.1 billion) and wholesale inventories (+0.5%) post at 8:30 a.m. Alphabet and Microsoft report after the close, and the market wants to hear what they say about capital spending after Meta. What would move us: two or more dissents in favor of a hike would raise the odds that December is not the last move, and a statement that signals patience would lower them.
Thursday: Third-quarter GDP, advance estimate, arrives at 8:30 a.m. with a consensus of 3.2% at an annual rate (2.2% in the second quarter), an Atlanta Fed GDPNow estimate near 3.5% and 3.4% in our table. Consensus for consumer spending is 3.4% (after 3.8%) and for third-quarter core PCE prices 2.4% at an annual rate. September personal income and outlays follow in the same release, with consensus for personal income of +0.3% and spending of +0.6%, headline PCE prices of +0.5% on the month and 3.6% on the year, and core PCE of +0.3% and 3.1% (after +0.2% and 3.0%). Initial jobless claims (consensus 198,000, after 194,000) and continuing claims (1.723 million) post at the same hour. The European Central Bank is expected to hold. Caterpillar and Mastercard report before the open and Amazon and Intel after the close. What would move us: a GDP print near 3.0% would put the risk to our 3.4% cell on the downside, and core PCE of 0.4% or higher would pull December and 2027 forward.
Friday: The third-quarter Employment Cost Index is due at 8:30 a.m. (consensus +0.8%, after +0.9%), and our table carries 3.4% for the year. The Bank of Japan is expected to hold at 1.25%, with December the likelier month for a hike, and euro-area third-quarter GDP arrives. San Francisco Fed President Daly speaks at noon and St. Louis Fed President Musalem at 12:30 p.m., among the first Fed speakers after the meeting; Daly has said more adjustments are more likely than not but that timing is still under discussion, and Musalem has said rates ought to rise further over the next six to nine months. ExxonMobil and Chevron report before the open. Brent’s December contract expires, and U.S. tariff changes on Canadian products announced October 23 take effect. What would move us: an Employment Cost Index above 3.5% on the year would argue that the squeeze is reaching wages as well as margins.
The Israeli election: Voters fill the 120-seat Knesset on Tuesday, where 61 seats form a majority and a party needs 3.25% of the vote to enter. The four final polls have Gadi Eisenkot’s Yashar slightly ahead of Prime Minister Netanyahu’s Likud, at about 22 seats to 20, with Naftali Bennett’s B’Yachad near 14 or 15. The anti-Netanyahu bloc averages about 54 seats and the governing coalition about 50, with Arab parties holding 14 to 16 seats outside both. Neither bloc reaches 61, and the opposition cannot get there without Ra’am, which several of its own parties have ruled out. Two small lists sit at or below the threshold, and where their votes fall could decide the margin. A stalemate would mean weeks of coalition talks, and failure would send Israelis back to the polls in early 2027 with Netanyahu as caretaker. For markets the link is Iran: the White House says it will not strike before November 3, and a government led by Eisenkot might be slower to restart the war. What would move us: a quick Eisenkot-led coalition would likely take some of the war premium out of Brent, and a Netanyahu win or a long deadlock would leave it in place.
Watch the 5-year breakeven against the 10-year, the credit spreads after the Fed statement and the Hormuz and Saudi headlines for the next move in Brent. The following week brings the November 3 election, the Treasury’s refunding announcement on November 4 and the October CPI on November 10, with the next FOMC meeting on December 9. Our call is a hold in October, a hike on December 9 and another in March.
U.S. Economic & Financial Outlook
The table below is our October 23 forecast vintage, updated this week. We will revisit it after the October 29 GDP release and add 2028 data. Three items are running away from it. Brent at $116.72 is above our fourth-quarter average of $105, the 30-year mortgage rate of 7.32% is above our 7.20% fourth-quarter figure, and the 10-year at 5.00% is below our 5.10%. September housing starts of 1.221 million also fell short of the 1.293 million we carry for the third quarter.
U.S. Economic & Financial Outlook, as of October 23, 2026
| Indicator | Units | 2024 Actual | 2025 Actual | 2026 Forecast | 2027 Forecast | Q1-26 Actual | Q2-26 Actual | Q3-26 Fcst | Q4-26 Fcst | Q1-27 Fcst | Q2-27 Fcst | Q3-27 Fcst | Q4-27 Fcst |
|---|---|---|---|---|---|---|---|---|---|---|---|---|---|
| Output | |||||||||||||
| Real GDP | % q/q SAAR | 3.0 | 2.3 | 2.3 | 2.6 | 2.5 | 2.2 | 3.4 | 2.9 | 2.1 | 2.5 | 2.8 | 2.7 |
| 4th Qtr-to-4th Qtr Change, Yr/Yr Chg for Qtly Data | % YoY | 2.6 | 2.0 | 2.8 | 2.5 | 2.6 | 2.2 | 2.1 | 2.8 | 2.7 | 2.7 | 2.6 | 2.5 |
| Final Sales to Private Domestic Purchasers | % q/q SAAR | 3.1 | 2.8 | 2.9 | 2.9 | 1.8 | 4.6 | 4.3 | 3.5 | 2.6 | 2.9 | 2.8 | 2.6 |
| Consumer Spending | % q/q SAAR | 2.9 | 2.6 | 2.5 | 2.0 | 0.7 | 3.8 | 3.6 | 2.8 | 1.8 | 2.2 | 2.1 | 2.0 |
| Nonresidential Fixed Investment | % q/q SAAR | 3.9 | 5.4 | 6.2 | 4.6 | 9.9 | 9.0 | 10.9 | 8.6 | 7.2 | 6.5 | 6.2 | 5.4 |
| Residential Investment | % q/q SAAR | 3.2 | -2.7 | -1.8 | -1.1 | -7.6 | 0.0 | -1.7 | -2.0 | -3.5 | -1.0 | -0.5 | 0.5 |
| Industrial Production, Manufacturing | % YoY | -0.9 | 1.0 | 1.7 | 2.9 | 1.0 | 1.7 | 1.3 | 3.0 | 3.2 | 2.5 | 2.9 | 3.1 |
| Light Vehicle Sales | Mil. units, SAAR | 15.9 | 16.3 | 16.1 | 16.4 | 15.5 | 16.5 | 16.2 | 16.4 | 16.4 | 16.3 | 16.5 | 16.5 |
| Labor Market | |||||||||||||
| Unemployment Rate | % | 4.0 | 4.3 | 4.2 | 4.0 | 4.3 | 4.3 | 4.1 | 4.1 | 4.1 | 4.0 | 4.0 | 3.9 |
| Nonfarm Payrolls | Avg. mo. chg., thous. | 150 | 62 | 67 | 75.8 | 73 | 81 | 51 | 62 | 68 | 75 | 80 | 80 |
| Employment Cost Index | % YoY | 3.9 | 3.5 | 3.4 | 3.5 | 3.4 | 3.4 | 3.4 | 3.4 | 3.5 | 3.4 | 3.5 | 3.5 |
| Housing Market | |||||||||||||
| Housing Starts | Thous. units, SAAR | 1,370 | 1,356 | 1,345 | 1,370 | 1,418 | 1,345 | 1,293 | 1,340 | 1,330 | 1,350 | 1,360 | 1,360 |
| New Home Sales | Thous. units, SAAR | 684 | 679 | 641 | 608 | 622 | 650 | 662 | 630 | 600 | 590 | 610 | 630 |
| Existing Home Sales | Thous. units, SAAR | 4,060 | 4,060 | 4,014 | 4,010 | 4,043 | 4,120 | 3,993 | 3,900 | 3,950 | 4,000 | 4,030 | 4,060 |
| Case-Shiller National Home Prices | % YoY | 5.1 | 2.2 | 1.4 | 2.4 | 0.9 | 1.2 | 1.5 | 1.8 | 2.1 | 2.3 | 2.5 | 2.6 |
| Inflation | |||||||||||||
| Consumer Price Index (CPI) | % YoY | 3.0 | 2.6 | 3.5 | 2.6 | 2.7 | 3.8 | 3.5 | 4.0 | 3.5 | 2.4 | 2.6 | 2.6 |
| Core CPI | % YoY | 3.4 | 2.8 | 2.7 | 2.4 | 2.5 | 2.7 | 2.5 | 2.9 | 2.7 | 2.3 | 2.8 | 2.8 |
| PCE Deflator | % YoY | 2.6 | 2.6 | 3.4 | 2.9 | 3.0 | 3.6 | 3.4 | 3.6 | 3.2 | 2.9 | 2.7 | 2.7 |
| Core PCE Deflator | % YoY | 2.9 | 2.8 | 3.1 | 2.7 | 3.0 | 3.1 | 3.0 | 3.2 | 2.9 | 2.6 | 2.6 | 2.6 |
| Interest Rates & Markets | |||||||||||||
| Fed Funds Target Range | Avg. / range, % EOP | 5.14 | 4.21 | 3.63 | 4.06 | 3.50-3.75 | 3.50-3.75 | 3.75-4.00 | 4.00-4.25 | 4.25-4.50 | 4.25-4.50 | 4.25-4.50 | 4.25-4.50 |
| 2-Year Treasury | %, period end | 4.37 | 3.81 | 3.92 | 4.06 | 3.78 | 4.14 | 4.88 | 4.75 | 4.60 | 4.50 | 4.40 | 4.38 |
| 10-Year Treasury | %, period end | 4.21 | 4.29 | 4.80 | 4.88 | 4.35 | 4.44 | 5.29 | 5.10 | 5.10 | 4.85 | 4.80 | 4.75 |
| 30-Year Mortgage Rate | %, period end | 6.72 | 6.60 | 6.71 | 6.95 | 6.10 | 6.49 | 7.03 | 7.20 | 7.10 | 7.00 | 6.90 | 6.80 |
| Brent Crude | $/bbl, period avg. | 79.91 | 68.32 | 93.62 | 88.56 | 78.00 | 100.20 | 91.27 | 105.00 | 91.67 | 88.00 | 86.00 | 88.57 |
| Trade-Weighted Dollar Index | Period average | 122.9 | 122.7 | 119.3 | 120.6 | 119.0 | 119.5 | 119.3 | 119.5 | 119.8 | 120.3 | 121.0 | 121.3 |
| Trade-Weighted Dollar Index | % chg., period | 1.7 | -0.1 | -2.8 | 1.1 | -1.4 | 0.4 | -0.2 | 0.2 | 0.2 | 0.4 | 0.5 | 0.2 |
| Government, Trade & Inventories | |||||||||||||
| Government | % q/q SAAR | 4.5 | 1.6 | 0.1 | 1.1 | 4.7 | -0.1 | 0.6 | 2.4 | 0.8 | 1.1 | 1.2 | 1.2 |
| Net Exports | $ bil., chained 2017, SAAR | -1,024.3 | -1,100.6 | -1,029.1 | -1,531.3 | -1,019.5 | -1,099.3 | -1,261.3 | -1,371.3 | -1,461.3 | -1,521.3 | -1,561.3 | -1,581.3 |
| Net Exports, Contribution to GDP | Percentage points | -0.54 | 0.30 | -0.10 | -0.76 | -0.04 | -1.10 | -2.63 | -1.77 | -1.44 | -0.96 | -0.63 | 0.00 |
| Business Inventories, Change | $ bil., chained 2017, SAAR | 28.2 | 6.7 | -47.5 | 53.8 | -34.7 | -63.4 | 98.0 | 75.5 | 60.0 | 55.0 | 50.0 | 50.0 |
| Inventories, Contribution to GDP | Percentage points | -0.20 | -0.20 | -0.13 | 0.36 | 0.18 | -0.53 | 2.62 | 0.63 | 0.31 | 0.35 | 0.39 | 0.39 |
Annual figures are full-year averages or year-over-year percent changes except where the units say otherwise. 2024 and 2025 are actual; 2026 and 2027 are forecast. Source: Piedmont Crescent Capital, BLS, BEA, Census, Federal Reserve, EIA.
Quarterly figures are seasonally adjusted annual rates, year-over-year changes where the units say so, or period averages and period-end levels for rates. The second-quarter 2026 column is the latest actual. Source: Piedmont Crescent Capital, BLS, BEA, Census, Federal Reserve, EIA.
Sources and Notes
Sources. U.S. Department of the Treasury (daily par and real yield curves, October 1-23); Federal Reserve Bank of St. Louis (FRED: high-yield option-adjusted spread, real disposable personal income per capita, retail diesel); U.S. Energy Information Administration (retail gasoline and diesel prices, October 19 survey); Freddie Mac (Primary Mortgage Market Survey, October 22); U.S. Census Bureau (new residential construction, September); National Association of Realtors (pending home sales); S&P Global Market Intelligence (flash U.S. PMIs, October 24 release); U.S. Department of Labor (initial claims, as reported by Reuters); Reuters/Ipsos (poll closed October 19); RealClearPolling (generic ballot average through October 20); Kalshi and Polymarket (via DeFi Rate snapshot, October 23); Piedmont Crescent Capital Economic Indicator Report on housing starts (October 20) and the October 7 special report on monetary policy.
Geopolitical and policy: Al Jazeera (Witkoff meetings, Oslo talks, Ukraine’s drone attack on St. Petersburg, Iran’s offensive doctrine, the State Department’s Saudi departure order); Financial Times via Israel Hayom (the postponed Israeli strike campaign); Newsweek (the Russian diesel deal); PIMCO, October 23 (Fed outlook and real rates); Forbes, October 19 (FOMC preview); Reuters poll of economists via Newsquawk (FOMC, GDP and PCE consensus forecasts); Newsquawk, Stock Titan and Yelza (week-ahead calendars and earnings); fattail.ai (October 22 Treasury session and hike odds); Cappnotes, The Market Breakdown and Wall Street Republic (Friday’s market close, oil settlements and drivers, including the New York Times report on renewed strike planning); Thrive in Markets (October 16 Hormuz flows and the IEA release); Goldman Sachs, US Week Ahead, October 25 (release calendar, consensus figures and Fed speakers); Rio Times (Brazil runoff count and first-round results); ABC News Australia (the spread of the European protests); S&P Global flash PMIs for the euro area and United Kingdom; company releases and filings for Procter & Gamble, Valero and First Industrial (October 22-23), Union Pacific results via FreightWaves, Southwest results via Reuters and Booz Allen results via Washington Technology and StockStory.
Market data as of Friday, October 23, 2026 close: U.S. Treasury (par and real yield curves); FRED; Cappnotes and The Market Breakdown (equity closes, VIX, gold futures, dollar index); Wall Street Republic and Cappnotes (Brent and WTI settlements); CME FedWatch via Reuters (hike odds). Breakeven rates are the nominal par yield less the real par yield, and the 5-year forward breakeven and forward real rate are our calculations from those curves. October 12 was a federal holiday.
A View from the Piedmont is published weekly by Piedmont Crescent Capital for informational purposes only and does not constitute investment, legal, or tax advice. Views expressed are those of the author as of the date of publication and are subject to change. © 2026 Piedmont Crescent Capital, LLC. All rights reserved.