
A View from the Piedmont — Our Weekly Commentary on Money, Credit, Exchange Rates & Geopolitics
Hot Pipeline, Thin Credit
Producer prices are running 6.3% above a year ago while core consumer prices are up 2.6%, so the energy shock still has distance to travel. Real yields near 2.7% are rationing credit from the bottom of the stack, and this week’s Treasury rally came entirely from real yields.
This report covers the major economic and geopolitical events of this past week and includes our updated forecast, which now calls for 3.4% real GDP growth in the third quarter.
Market Dashboard
(as of Friday, October 16 close, unless noted)
| Rates & Credit | Rates & Credit | Equities & Commodities | Equities & Commodities |
|---|---|---|---|
| Fed funds target range | 3.75%-4.00% (unchanged since Sept 16 hike) | S&P 500 | 7,659.44 (-1.09% Fri, -1.95% wk) |
| 10-yr Treasury | 5.09% (-15 bp wk) | Dow Jones | 52,002.41 (-0.34% Fri, +0.67% wk) |
| 30-yr Treasury | 5.43% (-17 bp wk) | Nasdaq Composite | 26,140.03 (-2.14% Fri, -4.48% wk) |
| 2-yr Treasury | 4.74% (-6 bp wk) | Russell 2000 | -3.05% wk |
| 2s-10s spread | 35 bp (44 bp a week ago) | Philadelphia Semiconductor | 11,137.29 (-3.83% Fri, -11.4% wk) |
| 10-yr real yield | 2.74% (-17 bp wk) | VIX | 19.99 (+34.7% wk) |
| 10-yr breakeven | 2.35% (+2 bp wk) | Brent crude (Dec) | $109.86 (+3.7% Fri, +4.9% wk) |
| 30-yr mortgage | 7.40% (Freddie Mac, Oct 15) | WTI crude (Nov) | $101.41 (+3.5% Fri, +10.4% wk) |
| Core CPI (Sept, y/y) | 2.6% (core goods +0.3% m/m) | Gold (Dec) | $4,181.10 (-1.0% wk) |
| Initial jobless claims (wk ended 10/10) | 199,000 | U.S. Dollar Index (DXY) | 101.84 (-0.4% wk) |
Note: Treasury yields are the official daily par and real yield curves for Friday, October 16; weekly changes are against the October 9 close. Equity closes are Friday’s prints and weekly changes run from the October 9 close. Brent is the December contract and WTI the November contract. The mortgage rate is the Freddie Mac PMMS survey for the week ended October 15. Jobless claims are for the week ended October 10. The dollar index level is approximate across sources.
Summary
The energy shock is moving through the supply chain, and September’s price data indicate it has further to travel. Final demand producer prices rose 1.3% in September, the largest monthly gain since March 2022, and are up 6.3% from a year ago, well above consensus. Processed intermediate goods are up 14.1% and unprocessed intermediate goods 21.5%. At the consumer end, core CPI is up just 2.6% and core goods 0.7%. That gap is the pipeline, and it suggests profit margins could come under pressure unless consumer prices catch up. With Brent, the December contract, settling Friday at $109.86, its highest settle since May, nothing at the front of the pipeline is easing. Core CPI rose 0.3%, a tenth above consensus. That was a little hotter than expected, but not hot enough to meaningfully shift the odds of an October rate hike. Core services outside housing have now run 0.3% to 0.4% for three straight months, and shelter picked up to 0.4% as market rents stopped falling.
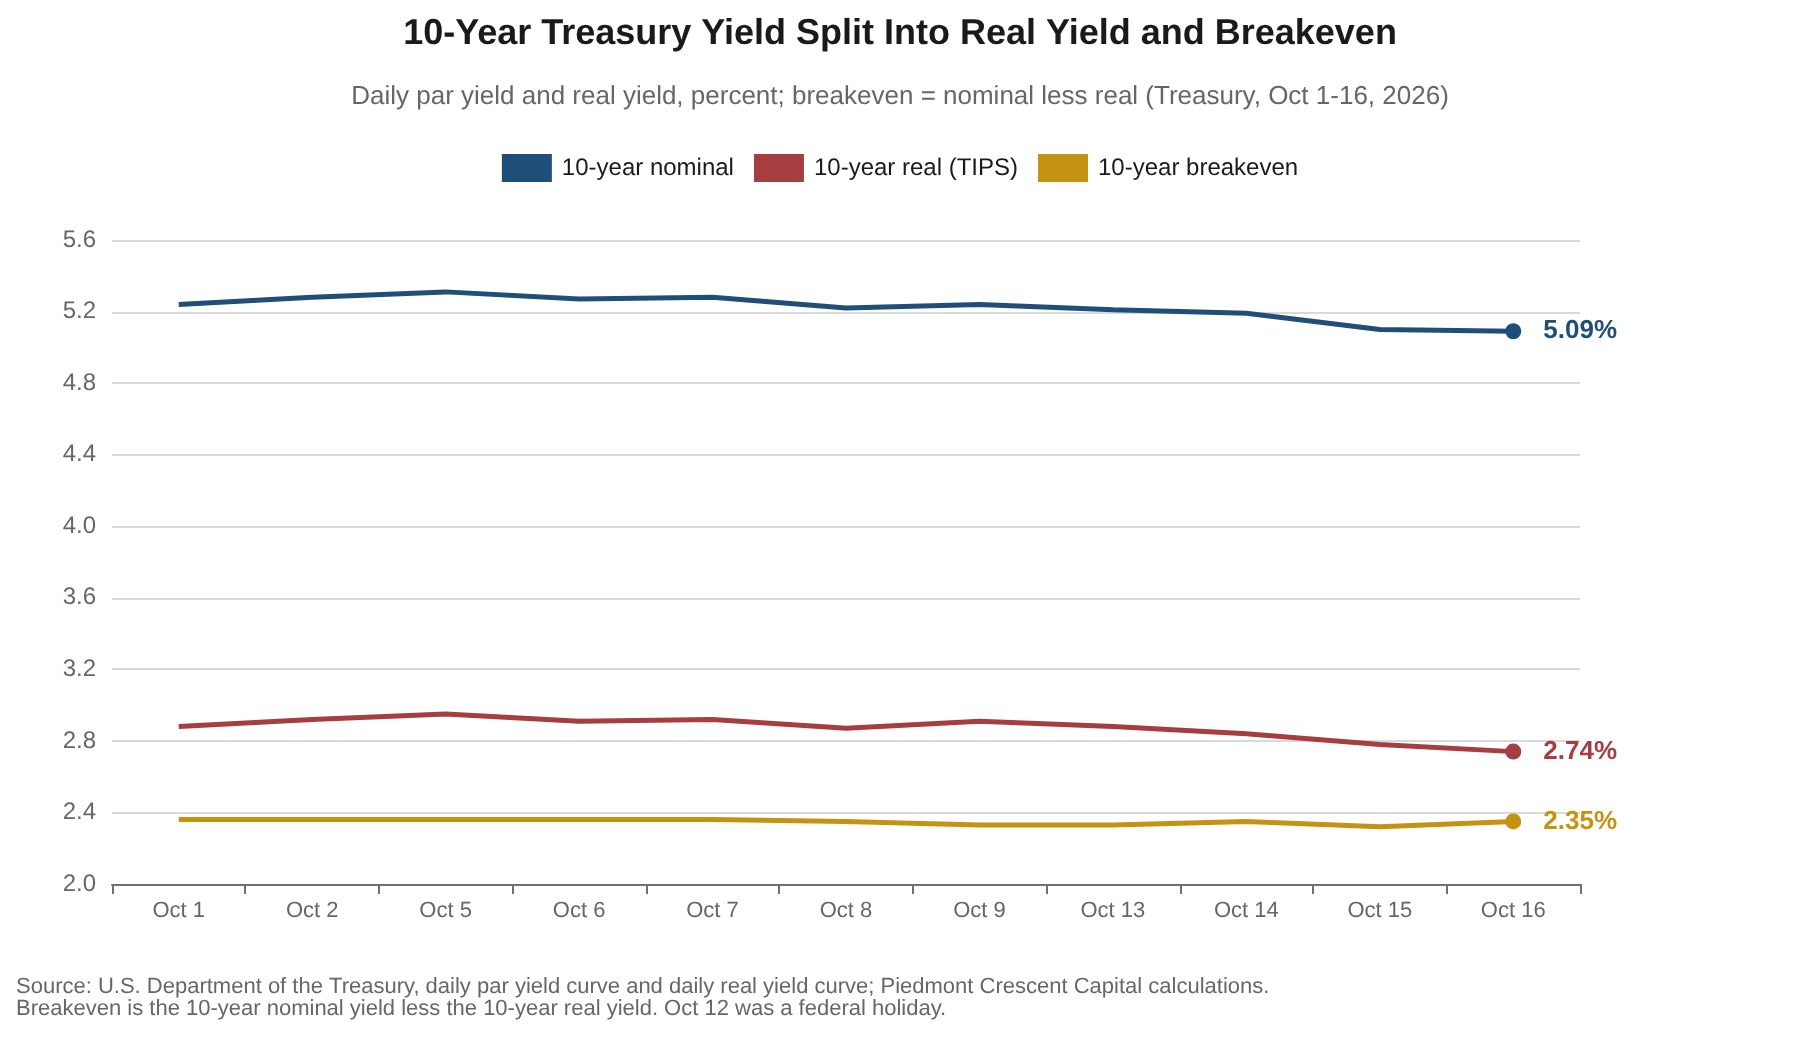
Real yields are now rationing credit, and they ration from the bottom of the credit stack first. The 10-year Treasury fell 15 basis points on the week to 5.09%, and the entire decline was real: the 10-year real yield dropped 17 basis points to 2.74% while the breakeven rate edged up 2 basis points to 2.35%. That is a bid for safety and says little about inflation worries easing. It arrived as the Philadelphia semiconductor index fell 11.4%, its eighth straight daily decline, CoreWeave lost 25% on the week and its five-year credit default swap spread passed 1,100 basis points. The AI buildout is increasingly debt-funded, and debt has to clear a hurdle that is still rising. Technology shares were rebounding ahead of Monday’s open, with Nasdaq 100 futures up about 1%, the iShares Semiconductor ETF up about 3.6% in premarket trading and the 10-year yield easing to about 5.08%. That recovers only part of last week’s drop and leaves the financing question where it was.
The household is absorbing the energy tax, and the Fed is watching inflation broaden. Retail sales rose 0.8% in September, but gasoline stations supplied about 0.55 percentage point of it and the control group rose just 0.1%, below expectations. Real average hourly earnings are down 0.7% from a year ago, and the Beige Book found higher oil costs in every District. Chair Warsh said Friday, “I don’t prejudge meetings.” October hike odds fell below 15%, and BofA economists still call an October increase possible. We continue to expect a hold on October 27-28 and a hike on December 9. Overseas, a Saudi-led coalition intercepted a missile aimed at the Red Sea port of Yanbu, Iranian attacks have cut flows through Hormuz, and Ukraine knocked a primary crude unit offline at Russia’s Ryazan refinery.
The Week’s Key Insight
The pipeline is hot, and the consumer end has not caught up
Last month’s Piedmont Perspective laid out a test, and September answered it in an unwelcome direction. We described inflation as a cascade through the production network and said that if oil stayed off its spring highs and tariff pass-through kept fading, core goods should decelerate, while core goods that refused to cool as upstream prices kept climbing would mean the network was still transmitting. Oil is not off its highs; Brent is back above $109. Core goods CPI rose 0.3% in September after 0.1% in August. The annual rate for core goods is still just 0.7%, which is our point. The upstream readings are far higher, and they have not yet finished their trip.
The producer price report is the clearest picture of how much is still in transit. Final demand goods rose 2.6% in September on a 10.8% jump in energy, and services rose 0.8%, with trade margins up 1.4%. The core measure that strips out food, energy and trade rose 0.5% on the month and is up 5.0% from a year ago. Further back in the chain, processed intermediate goods are up 14.1% and unprocessed goods 21.5% over twelve months. Figure 1 lays the stages side by side. The ladder steps down from 21.5% at the raw end to 0.7% for core goods at the register, and it is the distance between those rungs that indicates how much pricing is still to come.
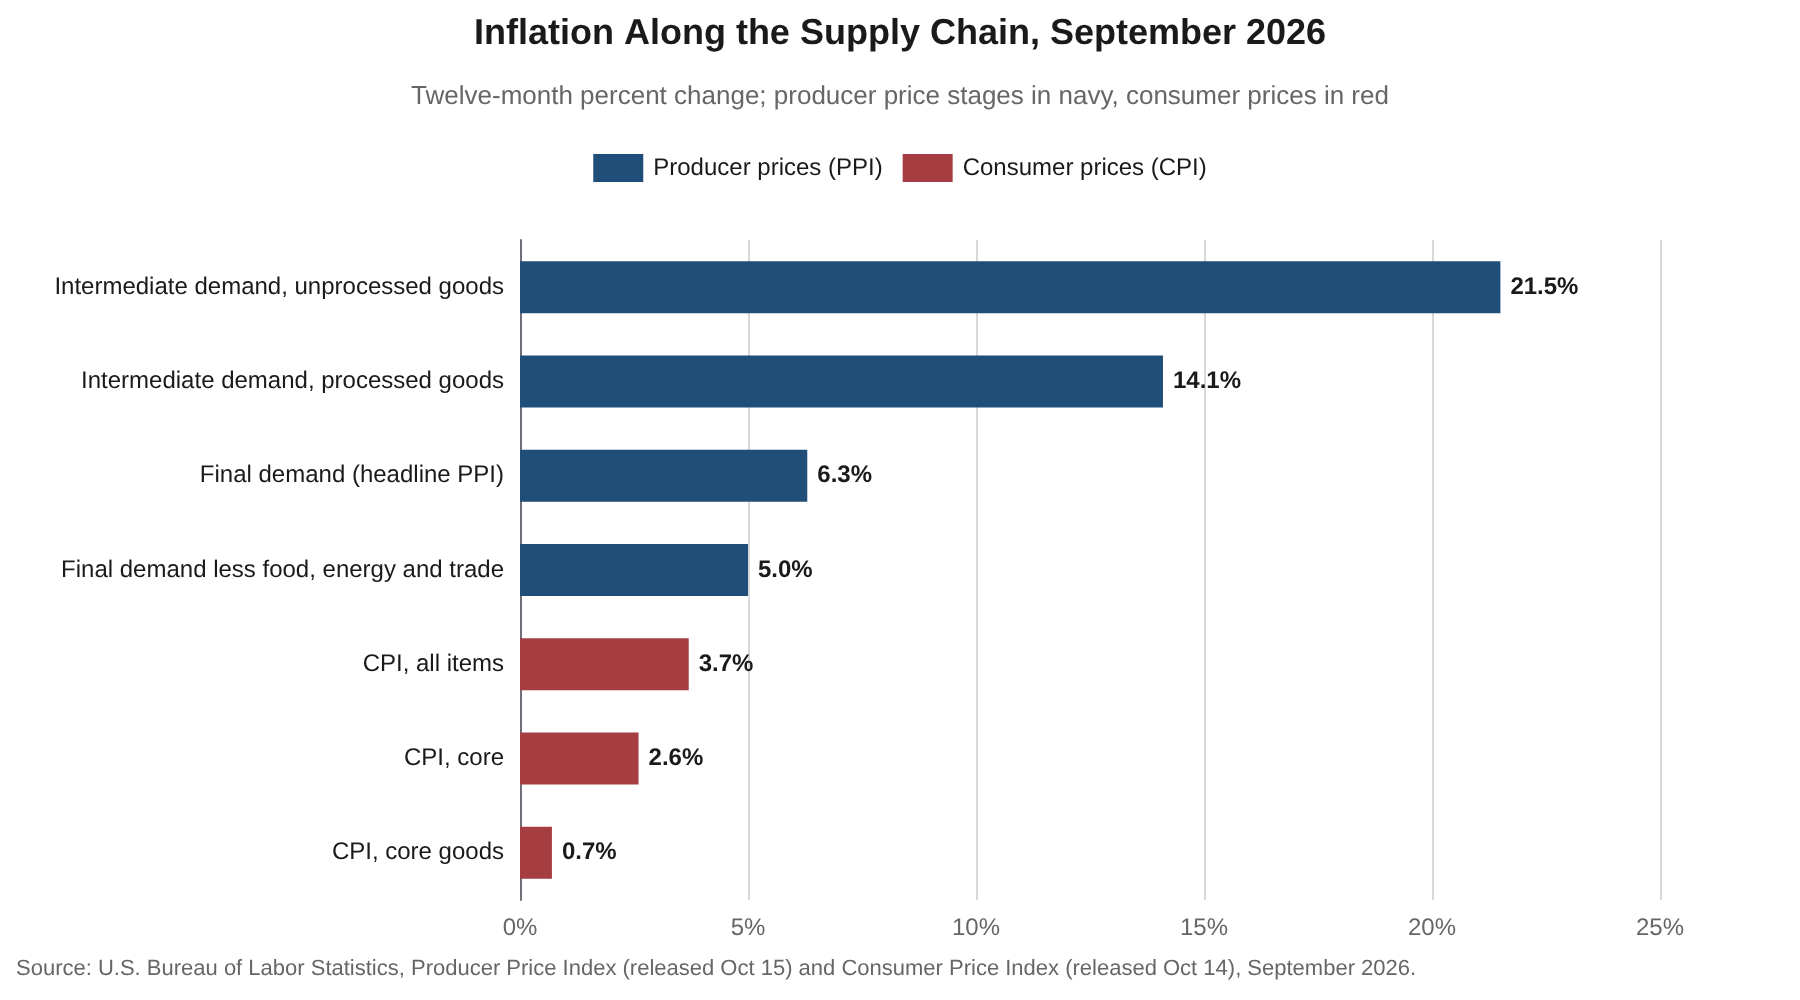
The sharp rise in producer prices alongside a still modest rise in consumer prices suggests profit margins could come under pressure. Someone has to absorb the difference between a 14.1% annual rise in processed intermediate goods and a 0.7% rise in core goods at the register. Either manufacturers and retailers take it in their margins, or consumer prices catch up, and with real wages falling and lower-income shoppers more cautious, the room to pass it along is limited. The NFIB survey points the same way. September’s 1.4% jump in producer price trade margins is a counterpoint for one month, but it is a volatile series and we would not read it as a turn.
The mechanism is contractual. The Beige Book, which reflects information collected through October 5, reported higher oil prices in every District, diesel costs rising and fuel surcharges moving them along supply chains. Three Districts described price growth as strong, eight as moderate, and four said the pace had picked up. Firms told the Fed they expect further increases as contracts expire and energy and delivery hedges are renegotiated. Small business owners are already acting on that arithmetic. In the NFIB survey a net 31% of owners raised selling prices in September and a net 31% plan to, against a long-run average of 14% for actual increases, even though a net negative 8% reported higher sales and a net negative 20% reported better earnings. These owners are passing costs through to protect margins, with demand playing little part.
Services have already started to confirm it. Services outside housing rose 0.35% in July, 0.41% in August and 0.34% in September, a three-month average of 0.37%, and shelter has accelerated from 0.14% to 0.26% to 0.39% over the same three months. Core CPI has compounded at a 3.4% annual rate over three months, up from 2.0% in August, and our one-sided trend estimate for core inflation rose to 2.61% from 2.54%, a second straight increase. Market rents point the same way, as we describe below. The trend is still well below the 3.31% of a year ago, so this is firming and has not become a spiral. But it is firming in the part of the index that policy reaches last, and the producer data suggest the goods side has not yet contributed.
Part of what the Committee calls AI inflation is a measurement problem. Governor Waller said on October 8 that one reason he is less confident inflation will return to 2% is that “evidence mounted that the artificial intelligence buildout was significantly driving up high-tech consumer prices.” Goldman Sachs estimates that AI-related price pressures add about 45 basis points to core PCE inflation, and that roughly half of that comes from how the index is built. The PCE category for software and accessories is up 15.6% from a year ago because it borrows a CPI price index that blends software with memory-heavy accessories and does not adjust software prices for the quality of new AI features, while the quality-adjusted software deflator in business investment is running slightly negative. That is the kind of index construction issue behind the wedge between core PCE and core CPI that we described in September. It also fades on a schedule: Goldman expects the total to peak near 50 basis points at year-end and drop to about 10 by the end of 2027 as memory price growth slows. We read that as a reason the Committee can stop once the pipeline has run its course, and we do not read it as a reason to skip December, because the energy pass-through in Figure 1 is not an artifact of how the index is built.
Real yields are rationing capital, and the bottom of the stack feels it first
The week’s rally in long-term Treasuries was a real yield story and nothing else. From the October 9 close to the October 16 close, the 10-year yield fell 15 basis points to 5.09%. The real yield on the 10-year fell 17 basis points, from 2.91% to 2.74%, and the breakeven inflation rate rose 2 basis points, from 2.33% to 2.35%. Figure 2 shows the split. A decline of this kind does not imply the market has repriced the inflation path; the breakeven did not budge and the producer price report arrived in the middle of the week. It suggests the market repriced the value of safety as the AI trade came unwound. The 2s-10s spread narrowed to 35 basis points from 44 a week earlier, with the two-year yield down 6 basis points to 4.74%.
Capital is getting rationed from the bottom of the credit stack. The Philadelphia semiconductor index fell 11.4% on the week and 3.8% on Friday alone, with all thirty constituents lower. CoreWeave closed Friday at $61.39, down 25% on the week, and its bonds were yielding above 15%. Oracle’s credit default swap spread widened about 31 basis points to near 300. The ICE BofA high-yield option-adjusted spread widened 20 basis points on the week to 331 basis points by Friday. As Deutsche Bank’s Jim Reid put it, “because the capex cycle is increasingly debt-funded, we have to increasingly respect the credit price action.” The damage on Friday was also narrow: six AI-heavy mega caps accounted for more than half of the S&P 500’s decline, and the equal-weight index fell only 0.4%. The highest-rated borrowers are not being rationed: Goldman Sachs’s tally of Dealogic data shows AAA and AA issuers taking their largest share of investment-grade issuance since 2016, and the ICE BofA investment-grade spread of 84 basis points on Thursday was only 14% of the index’s 5.86% yield. Narrow damage is not the same as contained damage, however, when the narrow part is the marginal borrower funding the buildout.
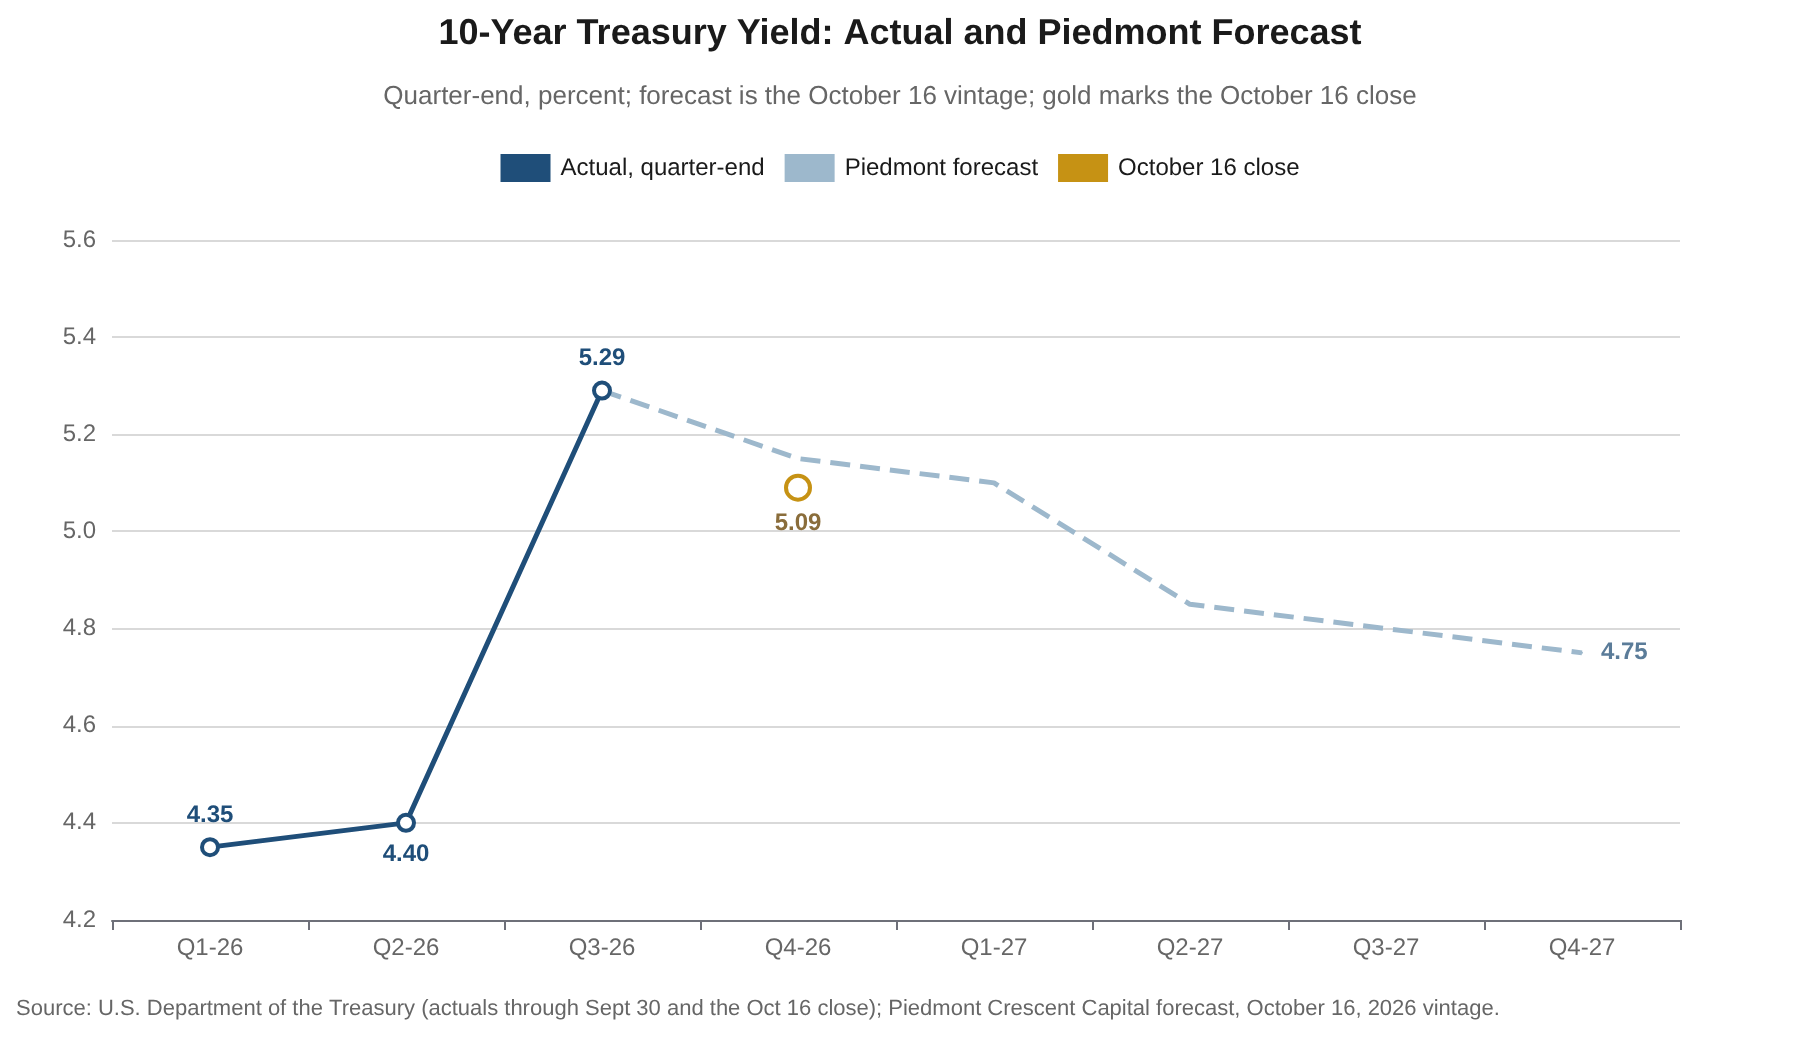
The outside houses are not saying the same thing, and we think that is useful. Goldman Sachs has moved its next hike from October to December, as we have, but it expects that to be the last one, followed by three cuts beginning in the second half of 2027 and a 10-year yield of 4.75% at year-end and 4.4% a year later. BCA Research reads the neocloud selloff as not yet a canary for the broader economy, still expects the next hike in December and treats dips in bonds as buyable. We are at 5.09% on the 10-year against our fourth-quarter forecast of 5.15%, so we are close to our own number. The disagreement with Goldman comes down to how long the energy shock lasts. It attributes 0.9 percentage point of the roughly 1 point overshoot in core PCE inflation to tariffs and the Iran energy shock and expects both to fade. The producer ladder in Figure 1 indicates the energy shock is still in transit. We also have economic growth about a half a percentage point higher, which is why we carry more hikes than they do. The test we laid out September 28 still holds: the 10-year yield against nominal GDP growth near 6.6%. The yield has closed roughly 30% of the gap since the second quarter, and the distance still open, about 150 basis points, is why we do not yet see the cost of capital choking the expansion. What the gap does not tell us is who pays the most. The Treasury pays 5.09% while CoreWeave pays above 15%, and that spread is the sorting mechanism. The marginal AI dollar is now being priced by credit markets in place of equity multiples.
Behind the Numbers
Oil is the front of the pipeline, and the front is getting hotter. Brent, the December contract, settled at $109.86 on Friday, up 3.7% on the day and 4.9% on the week, its highest settle since May 19. WTI, the November contract, settled at $101.41, up 10.4% on the week, and the Brent-WTI spread narrowed to $8.45 from $12.87 a week earlier. Three supply threats stacked up at once. A Saudi-led coalition intercepted a missile aimed at Yanbu, the Red Sea export port that has become the workaround for Hormuz; three container ships and a tanker were struck on October 13, and the GFS Pride sank; and Ukrainian strikes shut a primary crude unit at Russia’s Ryazan refinery, adding doubt about Russian diesel exports. The EIA reported a crude draw of 8.6 million barrels and a distillate draw of 2.5 million. The IEA said it would release more than 20 million barrels of additional emergency fuel, and Washington offered up to 17 million barrels of crude through a Strategic Petroleum Reserve exchange. At the pump, regular gasoline averaged $4.33 a gallon on October 12, down from a $4.48 peak on September 21, while EIA retail diesel was $6.18 for the week of October 12. Brent eased to about $108 early Monday after President Trump decided to waive some Russia sanctions, a step Secretary of State Rubio said the president could take up to 60 days to assess, while Iran reported another tanker hit a mine in the Strait of Hormuz.
The consumer is spending, but the pump is doing more of the work than the paycheck. Retail sales rose 0.8% in September against a 0.3% consensus, but gasoline stations rose 6.4% and contributed about 0.55 percentage point; excluding gasoline, sales rose 0.2%. The control group, which feeds GDP most directly, rose just 0.1%, below the 0.3% consensus, after a revised 1.2% in August. Real average hourly earnings fell 0.5% in September and are down 0.7% from a year ago, a third straight monthly decline, so the income supporting this spending is thinner than the sales data suggest. The Beige Book describes the mix: more than half of the Districts said spending was driven by high-income households, and Dallas reported some lower-income customers being more cautious. Strength in restaurant and bar sales, up 1.1% on the month and 7.0% on the year, is encouraging because that is a highly discretionary category. If household budgets were stretched as far as is widely feared, restaurants are one of the first places it should show up, and it has not. Tourism grew too, though Boston, Minneapolis and San Francisco reported lower sales from Canadian visitors. The University of Michigan’s preliminary October sentiment index slipped to 46.3, with year-ahead inflation expectations at 4.7% and long-run expectations at 3.5%. Third-quarter consumer spending is tracking near 3%, below the 3.5% in our table, so the risk to that cell is on the downside.
One detail that has not been widely reported: the weakest category in retail sales was probably a price story with little volume in it. Health and personal care stores are the one major category down from a year ago, by 1.2%, even after a 0.7% gain in September. But prescription drug prices in the CPI fell 1.2% in September and are down 4.5% from a year ago, and medical care commodities as a whole are down 3.3%. Prescriptions are a large part of what drug stores sell, so falling drug prices can pull nominal sales lower even while the number of prescriptions filled holds up. We have not seen volume data to confirm that, but it is a better explanation than a consumer cutting back on health and beauty.
The factory floor and the power grid are running hot while light vehicle assembly lines cool. Industrial production rose 0.7% in September against a 0.4% consensus, with manufacturing up 0.3%, mining up 0.2% and utilities up 3.5%. Utility output is up 8.7% from a year ago, and semiconductor output grew at a 28.4% annual rate in the third quarter. Motor vehicle and parts output fell 3.0%, and light-vehicle sales dropped to a 16.0 million annual rate from 16.8 million in August. The regional surveys, which are diffusion indexes measuring breadth rather than magnitude, remain positive: the Empire State survey rose 18 points to 25.5 and the Philadelphia Fed index eased to 20.9 from 37.8, meaning more firms still report expansion than contraction. Across our seven themes, AI Buildout and Electric Grid Upgrade are visible in the semiconductor and utility numbers. Defense Replenishment and Aerospace and Next Generation Defense had a good Friday, with defense among the leading S&P 500 sectors and RTX, Northrop Grumman and Lockheed Martin reporting this week. Reshoring of Critical Industries and Materials shows up in manufacturing payrolls, up 72,000 since the December low. Pharmaceutical and Medtech Buildout is softer this month, with prescription drug prices down 4.5% from a year ago in the CPI, and Peak 65 demand keeps health care the steadiest source of jobs even as its monthly gain of 17,000 ran below the 33,000 average of the past year.
Hiring is slow and layoffs are rare, and the survey evidence suggests the squeeze is landing on margins and leaving headcount alone. Initial jobless claims were 199,000 last week. The September employment report, released October 2, showed payroll growth of 29,000, downward revisions of 60,000 to July and August, and an unemployment rate of 4.2%. NFIB hiring plans held at a net 17%, but the share of owners actually hiring or trying to hire fell 5 points to 51%, and 87% of those trying to hire found few or no qualified applicants. The Beige Book adds that in five Districts some firms are cutting staff through attrition or expect less hiring after AI-driven productivity investments. NFIB optimism slipped to 97.9, just under its 52-year average of 98.0, as the outlook components fell. Equipment purchases were reported by 32% of owners, against 42% a year ago, a sharp contrast with the roughly $725 billion the hyperscalers plan to spend in 2026. A net 8% of owners paid a higher rate on their latest loan, the most since June 2025, and the average short-term rate rose to 8.2%.
Housing is where 7% plus mortgages show up most evidently. The 30-year mortgage rate was 7.40% in Freddie Mac’s survey for the week ended October 15, unchanged from the prior week but up from 7.03% on September 24. Existing-home sales rose 1.5% in September to a 3.99 million annual rate but are down 2.2% from a year ago. The median price was $417,500, up 1.3%, the 39th straight year-over-year gain, and inventory reached 1.60 million units, 4.6% above a year ago, or 4.8 months of supply. Mortgage purchase applications are running about 16% below a year ago. The NAHB builder index fell 3 points to 29 on Monday, below the consensus of 31 and its lowest reading since June 2012, with 43% of builders cutting prices. September housing starts arrive Tuesday, and a consensus near 1.30 million is below the 1.32 million in our third-quarter forecast, so the risk to that cell is on the downside.
Rents are no longer falling the way they were and are rising in progressively more markets each month. RealPage’s same-store effective rents were up 0.9% from a year ago in the third quarter and rose 0.8% on the quarter, and Apartments.com has September asking rents up 1.5% from a year ago, against 1.0% a year earlier. Apartment List’s measure, which tracks new leases, is still down 0.4% on the year, but its national vacancy rate has eased to 7.0% from a 7.3% peak in February. Even in the markets that added the most supply, the direction has changed. Austin and Phoenix, where RealPage shows annual declines narrowing to less than 2%, both posted rent gains in the third quarter. Concessions are thinning out as well: RealPage has 15.4% of stabilized units offering them in August, down from 17% in March and May and a third straight monthly decline. We would not overstate that. The concessions that remain are deep, about 11% of asking rent or nearly six weeks free, so landlords are offering them on fewer units, with each concession still large, and the South and Class C buildings still show annual rent cuts. Supply explains the turn. Completions are running about 46% below the late-2024 peak, and RealPage puts the gap between demand and supply at its narrowest since late 2015. This matters for inflation because rent is the largest piece of core. Shelter rose 0.4% in the CPI in September, and new-lease rents lead that measure, so a rental market that has stopped softening suggests shelter is no longer a source of disinflation.
The rest of the world is tightening, which keeps the dollar from running away. The European Central Bank delivered its second 25 basis point hike of the year on September 10, and Barclays and UBS now back Bank of England increases. The dollar index slipped about 0.4% on the week to roughly 101.8, and the yen finished near 158. Synchronized tightening is not a comfort for borrowers, but it does mean the Fed is not alone in leaning against energy-driven inflation, and it limits how far the dollar can rise on rate differentials alone.
The political calendar now sits inside the policy calendar. Our midterm framework treats the election as a referendum on real after-tax income growth. Real hourly earnings are falling, gasoline is well above its level of a year ago, and the RealClearPolitics generic ballot shows Democrats ahead by about 8 points. The Committee meets on October 27-28, six days before the November 3 election. The calendar argues for patience without forbidding action: the Committee has stated that it does not factor the electoral calendar into its decisions, and its 75 basis point hike on November 2, 2022 came six days before that year’s midterms. We still expect a hold in October, and the economic case for December rests on data that will be in hand by then, including the October CPI due November 10.
Bottom Line
We continue to expect the Committee to hold at the October 27-28 meeting and to raise the funds rate a quarter point on December 9, to 4.00%-4.25%, with at least one further increase in 2027 that would take the range to 4.25%-4.50% or higher. Two more hikes appear assured to us, and one or two additional increases may prove necessary, depending on how resilient the economy and financial markets prove to be and how quickly the recent acceleration in inflation can be arrested. The Committee is sending a consistent message on direction and a deliberately open one on timing. Sixteen of the 18 participants who submitted projections in September anticipated at least one more increase this year, and Governor Waller said on October 8 that he anticipates additional hikes while allowing “some flexibility about when those hikes will occur.” This week Vice Chair Bowman said “we have some time to wait and see how financial conditions evolve before we take more action,” and San Francisco Fed President Daly said additional adjustments are “more likely than not” but that she does not feel urgent about deciding “with a limited set of information.” Chair Warsh’s Friday remarks in Bangkok, “I don’t prejudge meetings,” give nothing away on timing, and he said the Fed had “removed a dose of accommodation about a month ago” without guiding on what comes next. Markets read that as a hold in October, with the probability of a move falling below 15% from more than 40% after Wednesday’s CPI. Barclays expects hikes in December and January.
That call assumes no major changes in the outlook, which is a heroic assumption in this geopolitical environment. Three pieces matter most. First, the pipeline: if the producer readings in Figure 1 keep feeding into core goods, the December hike is the floor and the second increase moves closer. Our test for the other direction is core services outside housing falling back to 0.2% or less for two months with shelter returning to its spring pace. Second, credit: a high-yield spread that widens toward 400 basis points, or a financing failure at a major AI infrastructure borrower, would give the Committee a reason to wait, though it would be waiting on financial conditions, with inflation playing no part. Third, energy: a Hormuz or Yanbu disruption that pushes Brent decisively above $110 raises the headline and the pipeline together. The labor market is the piece we are least worried about. Payroll growth of 29,000 is soft, but claims of 199,000 and an unemployment rate of 4.2% do not describe a break, and we would need to see both move before we took the additional hikes off the table.
The 10-year yield is at our forecast, which is where the discipline starts. At 5.09% the 10-year sits just below our 5.15% fourth-quarter forecast, and Figure 3 shows the path from the quarter-end print of 5.29% on September 30 to 4.75% at the end of 2027. We are not calling for a further decline while the pipeline is full. If real yields keep falling because investors want safety, the breakeven rate becomes the number to watch, since a rising breakeven alongside falling real yields would be the first sign the bond market had started to price the pipeline. A 10-year that climbs back toward nominal GDP growth near 6.6%, or nominal growth that decelerates toward the yield, is the signal to take both our housing and our business investment calls down. The fiscal arithmetic puts a longer horizon on that test. Goldman’s projection, which assumes nominal growth near 4.5% over the decade, has federal debt rising from 100% of GDP to 124% by 2035 if yields fall as it expects, and to 132% if they stay where they are, because the average rate on the debt would then stop running below nominal growth. Our 6.6% is a cyclical number. If nominal growth drifts toward 4.5% while the 10-year holds above 5%, the cost of capital becomes the constraint we have so far said it is not.
CFO and Treasurers Corner
- Schedule contract and hedge expirations against the producer price ladder. The Beige Book reports that firms expect increases as energy and delivery hedges are renegotiated, and the 14.1% annual rise in processed intermediate goods indicates where those renewals will land. Identify every supplier contract that rolls in the next two quarters and budget the step-up now, before renewal.
- Term out funding while spreads are still open, and do not count on the bottom of the credit stack. A high-yield spread of 331 basis points is not distress, but CoreWeave bonds yielding above 15% indicate where the marginal borrower now stands. For investment-grade borrowers the spread is a small part of the bill: at 84 basis points it is 14% of the 5.86% index yield, so the base rate is most of the cost of funding. Companies with 2027 maturities or floating-rate bank debt should address them with the Fed’s December increase in mind.
- Budget for diesel, because Brent understates the bill. EIA retail diesel was $6.18 a gallon for the week of October 12, and fuel surcharges are carrying that cost through supply chains. Doubts about Russian diesel exports keep the distillate market tighter than crude alone suggests.
- Plan pricing for a K-shaped consumer. Real hourly earnings are down 0.7% on the year, the Beige Book reports some lower-income customers being more cautious, and retailers are leaning on high-income spending. Consumer-facing businesses should protect good-better-best price tiers and avoid cutting across the board.
- Check counterparty exposure to debt-funded AI infrastructure. Review customer and vendor concentration in neocloud operators and equipment suppliers. Credit default swap spreads and bond yields give a faster signal than the equity price, and the reported figures this week moved sharply in a single session.
- Underwrite housing exposure at a 7% mortgage rate, well above the 6.49% of the second quarter. Mortgage purchase applications are about 16% below a year ago, existing-home sales are down 2.2%, inventory is 4.6% higher and the NAHB builder index of 29 is the lowest since 2012. Builders and lenders should stress their plans against a rate that stays above 7% into the spring selling season.
Piedmont Perspective
The Great Divergence is a long thought piece on the underlying structure of today's economy. It starts from two facts that do not change from week to week. Slower labor force growth has lowered the speed limit on output, and a 10-year Treasury yield near 5.1% has raised the price of capital well above what firms and governments paid for most of the last 15 years. Together they explain why the same data can look strong in one part of the economy and weak in the next.
The divides fall into three groups, and seven themes keep growth above its slower trend. The first group is who owns, with capital against labor and the K-shaped split between higher-income and other households. The second is where the money goes, with artificial intelligence against everything else and technology stocks against the rest of the S&P 500. The third is who has to borrow, with rate-sensitive sectors against the rest and the young against the old, because older households are more likely to own a home with a low-rate mortgage or none. The implications concern dispersion across sectors and households more than the direction of the index, and the policy call matches this letter: a hold on October 27-28, a hike on December 9 to 4.00-4.25%, at least one more in early 2027 and a 10-year Treasury between 4.75% and 5.50% through the first quarter.
You can access our full report at: The Piedmont Perspective Archives – Piedmont Crescent Capital
The Week Ahead
It is a light week for data, with housing out front. The forecasts below are the consensus, and the earnings calendar is busier than the data calendar.
Monday: The NAHB housing market index fell to 29 from 32, below the consensus of 31 and the lowest since June 2012. The Fed’s pre-meeting blackout is in effect through the day after the October 28 decision. Technology shares are rebounding ahead of the open after the Nasdaq’s worst week since June. What would move us: a rebound that fades by the close would suggest the financing worries have not eased.
Tuesday: September housing starts and building permits from the Census Bureau, with consensus forecasts near 1.30 million for starts (1.275 million in August) and 1.39 million for permits, and pending home sales from the National Association of Realtors, with a consensus of -0.4%. GE Aerospace, GM, RTX and Northrop Grumman report before the open and Netflix after the close. What would move us: starts below 1.25 million would extend the case for a housing downgrade in our table.
Wednesday: MBA mortgage applications and the Treasury’s 20-year bond auction. Treasury has at least doubled its long-end buyback operations to $4 billion through its November 4 refunding, but it is a price-sensitive buyer: on September 24 it accepted $4.1 billion of the $10.5 billion offered against a $6 billion maximum. Meta, Tesla, IBM, Texas Instruments and Lam Research report after the close. What would move us: a weak auction tail would push long yields toward the top of the recent range.
Thursday: Initial jobless claims, which were 199,000 last week, and the Conference Board’s leading index, with a consensus of -0.2%. Lockheed Martin, Honeywell and Procter & Gamble report before the open and Western Digital after the close. Claims above 230,000 would be the first sign the labor market is cracking.
Friday: October flash PMIs from S&P Global, with consensus forecasts of 55.5 for manufacturing (55.9 in September) and 58.0 for services (58.8), and the final University of Michigan survey, with a consensus of 46.3, unchanged from the preliminary reading. What would move us: input price indexes above September’s readings would argue that the pipeline in Figure 1 is still filling.
Watch the credit markets for any financing news at the neocloud borrowers, the Yanbu and Hormuz headlines for the next move in Brent, and what the sanctions waivers for Russian oil and diesel do to supply. The following week brings the October 27-28 FOMC meeting and, on October 29, the advance estimate of third-quarter GDP and the September personal income and outlays report. Our call remains a hold in October and a hike on December 9.
U.S. Economic & Financial Outlook
The table below is our October 16 forecast vintage, and it changes three things from the prior published forecast. Payroll growth is lower, at an average of 67,000 a month in 2026 against 82,000 and 75,750 in 2027 against 95,250, with the third quarter marked to the 51,000 reported. Energy and long-term yields are higher: Brent averages $105 in the fourth quarter against $92, and the 10-year Treasury is 5.15% in the fourth quarter against 5.10%, with the third quarter marked to the 5.29% actual. Core CPI and core PCE inflation are each 2.6% in 2027, down from 2.8% and 2.7%. The funds rate path is unchanged: a pause on October 28, 4.00-4.25% after December 9 and 4.25-4.50% in the first quarter of 2027. Brent near $110 and the 30-year mortgage rate of 7.40% are running above our fourth-quarter figures. We will revisit the forecast after the October 29 GDP release and add 2028 data.
U.S. Economic & Financial Outlook, as of October 16, 2026
| Indicator | Units | 2024 Actual | 2025 Actual | 2026 Forecast | 2027 Forecast | Q1-26 Actual | Q2-26 Actual | Q3-26 Fcst | Q4-26 Fcst | Q1-27 Fcst | Q2-27 Fcst | Q3-27 Fcst | Q4-27 Fcst |
|---|---|---|---|---|---|---|---|---|---|---|---|---|---|
| Output | |||||||||||||
| Real GDP | % q/q SAAR | 3.0 | 2.3 | 2.3 | 2.6 | 2.5 | 2.2 | 3.4 | 2.9 | 2.1 | 2.5 | 2.8 | 2.7 |
| 4th Qtr-to-4th Qtr Change, Yr/Yr Chg for Qtly Data | % YoY | 2.6 | 2.0 | 2.8 | 2.5 | 2.6 | 2.2 | 2.1 | 2.8 | 2.7 | 2.7 | 2.6 | 2.5 |
| Final Sales to Private Domestic Purchasers | % q/q SAAR | 3.1 | 2.8 | 2.9 | 2.9 | 1.8 | 4.6 | 4.2 | 3.5 | 2.6 | 2.9 | 2.8 | 2.6 |
| Consumer Spending | % q/q SAAR | 2.9 | 2.6 | 2.5 | 2.0 | 0.7 | 3.8 | 3.5 | 2.8 | 1.8 | 2.2 | 2.1 | 2.0 |
| Nonresidential Fixed Investment | % q/q SAAR | 3.9 | 5.4 | 6.2 | 4.6 | 9.9 | 9.0 | 11.0 | 8.6 | 7.2 | 6.5 | 6.2 | 5.4 |
| Residential Investment | % q/q SAAR | 3.2 | -2.7 | -1.8 | -0.9 | -7.6 | 0.0 | -1.4 | -2.0 | -1.5 | -1.0 | -0.5 | -0.5 |
| Industrial Production, Manufacturing | % YoY | -0.9 | 1.0 | 2.0 | 3.9 | 1.0 | 1.7 | 1.6 | 3.6 | 4.0 | 3.6 | 3.7 | 3.7 |
| Light Vehicle Sales | Mil. units, SAAR | 15.9 | 16.3 | 16.2 | 16.4 | 15.5 | 16.5 | 16.4 | 16.4 | 16.4 | 16.3 | 16.5 | 16.5 |
| Labor Market | |||||||||||||
| Unemployment Rate | % | 4.0 | 4.3 | 4.2 | 4.0 | 4.3 | 4.3 | 4.1 | 4.1 | 4.1 | 4.0 | 4.0 | 3.9 |
| Nonfarm Payrolls | Avg. mo. chg., thous. | 150 | 62 | 67 | 75.8 | 73 | 81 | 51 | 62 | 68 | 75 | 80 | 80 |
| Employment Cost Index | % YoY | 3.9 | 3.5 | 3.4 | 3.5 | 3.4 | 3.4 | 3.4 | 3.4 | 3.5 | 3.4 | 3.5 | 3.5 |
| Housing Market | |||||||||||||
| Housing Starts | Thous. units, SAAR | 1,370 | 1,356 | 1,351 | 1,360 | 1,418 | 1,345 | 1,320 | 1,320 | 1,330 | 1,350 | 1,360 | 1,360 |
| New Home Sales | Thous. units, SAAR | 684 | 679 | 636 | 665 | 622 | 650 | 630 | 640 | 650 | 660 | 670 | 680 |
| Existing Home Sales | Thous. units, SAAR | 4,060 | 4,060 | 4,059 | 4,175 | 4,043 | 4,120 | 3,993 | 4,080 | 4,140 | 4,170 | 4,190 | 4,200 |
| Case-Shiller National Home Prices | % YoY | 5.1 | 2.2 | 1.4 | 2.5 | 0.9 | 1.2 | 1.5 | 1.8 | 2.1 | 2.3 | 2.5 | 2.6 |
| Inflation | |||||||||||||
| Consumer Price Index (CPI) | % YoY | 3.0 | 2.6 | 3.3 | 2.7 | 2.7 | 3.8 | 3.4 | 3.2 | 3.0 | 2.4 | 2.6 | 2.6 |
| Core CPI | % YoY | 3.4 | 2.8 | 2.6 | 2.6 | 2.5 | 2.7 | 2.7 | 2.6 | 2.7 | 2.6 | 2.8 | 2.8 |
| PCE Deflator | % YoY | 2.6 | 2.6 | 3.3 | 2.6 | 3.0 | 3.6 | 3.4 | 3.0 | 2.9 | 2.4 | 2.7 | 2.7 |
| Core PCE Deflator | % YoY | 2.9 | 2.8 | 3.0 | 2.6 | 3.0 | 3.1 | 3.0 | 2.8 | 2.7 | 2.5 | 2.6 | 2.6 |
| Interest Rates & Markets | |||||||||||||
| Fed Funds Target Range | Avg. / range, % EOP | 5.14 | 4.21 | 3.63 | 4.06 | 3.50-3.75 | 3.50-3.75 | 3.75-4.00 | 4.00-4.25 | 4.25-4.50 | 4.25-4.50 | 4.25-4.50 | 4.25-4.50 |
| 2-Year Treasury | %, period end | 4.37 | 3.81 | 3.92 | 4.06 | 3.78 | 4.14 | 4.88 | 4.75 | 4.60 | 4.50 | 4.40 | 4.38 |
| 10-Year Treasury | %, period end | 4.21 | 4.29 | 4.81 | 4.88 | 4.35 | 4.44 | 5.29 | 5.15 | 5.10 | 4.85 | 4.80 | 4.75 |
| 30-Year Mortgage Rate | %, period end | 6.72 | 6.60 | 6.72 | 6.95 | 6.10 | 6.49 | 7.03 | 7.25 | 7.10 | 7.00 | 6.90 | 6.80 |
| Brent Crude | $/bbl, period avg. | 79.91 | 68.32 | 94.87 | 87.67 | 78.00 | 100.20 | 96.27 | 105.00 | 91.67 | 88.00 | 86.00 | 85.00 |
| Trade-Weighted Dollar Index | Period average | 122.9 | 122.7 | 119.1 | 119.9 | 119.0 | 119.5 | 119.3 | 118.8 | 119.1 | 119.6 | 120.3 | 120.6 |
| Trade-Weighted Dollar Index | % chg., period | 1.7 | -0.1 | -2.9 | 0.6 | -1.4 | 0.4 | -0.2 | -0.4 | 0.2 | 0.4 | 0.5 | 0.2 |
| Government, Trade & Inventories | |||||||||||||
| Government | % q/q SAAR | 4.5 | 1.6 | 0.1 | 1.1 | 4.7 | -0.1 | 2.6 | 2.4 | 0.8 | 1.1 | 1.2 | 1.2 |
| Net Exports | $ bil., chained 2017, SAAR | -1,024.3 | -1,100.6 | -1,029.1 | -1,531.3 | -1,019.5 | -1,099.3 | -1,261.3 | -1,371.3 | -1,461.3 | -1,521.3 | -1,561.3 | -1,581.3 |
| Net Exports, Contribution to GDP | Percentage points | -0.54 | 0.30 | -0.10 | -0.76 | -0.04 | -1.10 | -2.63 | -1.77 | -1.44 | -0.96 | -0.63 | 0.00 |
| Business Inventories, Change | $ bil., chained 2017, SAAR | 28.2 | 6.7 | -47.5 | 41.2 | -34.7 | -63.4 | 98.0 | 75.5 | 55.0 | 45.0 | 35.0 | 30.0 |
| Inventories, Contribution to GDP | Percentage points | -0.20 | -0.20 | -0.13 | 0.36 | 0.18 | -0.53 | 2.62 | 0.63 | 0.31 | 0.35 | 0.39 | 0.39 |
Annual figures are full-year averages or year-over-year percent changes except where the units say so; 2024 and 2025 are actual, 2026 and 2027 are forecast. Quarterly figures are seasonally adjusted annual rates, year-over-year changes where the units say so, or period averages and period-end levels for rates; Q1-26 and Q2-26 are the latest actuals. Source: Piedmont Crescent Capital, BLS, BEA, Census, Federal Reserve, EIA.
Sources and Notes
Sources. Bureau of Labor Statistics (Consumer Price Index, Producer Price Index, Real Earnings, Employment Situation); U.S. Census Bureau (advance monthly retail sales; new residential construction); Federal Reserve Board (G.17 industrial production; Beige Book, October 14; Governor Waller, October 8); Federal Reserve Banks of New York and Philadelphia (regional surveys); National Association of Realtors (existing-home sales); Freddie Mac (Primary Mortgage Market Survey); RealPage, Apartment List and Apartments.com (apartment rents, concessions and vacancy); Mortgage Bankers Association; NFIB (Small Business Economic Trends); University of Michigan (Surveys of Consumers); U.S. Energy Information Administration (retail gasoline and diesel prices; weekly petroleum status); Piedmont Crescent Capital Economic Indicator Reports on small business optimism (October 13), the Consumer Price Index (October 14) and retail sales (October 15).
Geopolitical and policy: Reuters, Associated Press and FXStreet (Chair Warsh’s October 16 remarks); Reuters (Vice Chair Bowman, October 14; President Daly, October 14; Friday’s market close; the CoreWeave and chip selloff); Reuters via EnergyNow and TokenPost (oil settlements, Yanbu, Ryazan, inventories and emergency stock releases); United Against Nuclear Iran and the Joint Maritime Information Center (Hormuz incidents, October 13-14); U.S. Department of the Treasury (buyback announcement of August 19); Goldman Sachs Research, October 12-16, and BCA Research, October 15-16 (outside views on yields and the neocloud selloff); Centralbanking.com and Devdiscourse (ECB and Bank of England); RealClearPolitics (generic ballot); FXEmpire and Economic Weekly (consensus forecasts for housing starts, permits, pending home sales, the leading index and the flash PMIs, and the earnings calendar, October 16-19); NAHB and the Reuters poll of economists (October 19, NAHB consensus); Lockheed Martin and General Dynamics release notices.
Market data as of Friday, October 16, 2026 close: U.S. Treasury (par and real yield curves); FRED (equity closes through October 15, the October 9 base); TradingKey and investingLive (October 16 closes, weekly changes, VIX, gold, dollar index, FedWatch odds, credit spreads); Freddie Mac; ICE BofA. October 19 pre-open: Reuters, Yahoo Finance, Invezz.
A View from the Piedmont is published weekly by Piedmont Crescent Capital for informational purposes only and does not constitute investment, legal, or tax advice. Views expressed are those of the author as of the date of publication and are subject to change. © 2026 Piedmont Crescent Capital, LLC. All rights reserved.