
Retail Sales Report: The Pump Did the Work
Retail sales rose 0.8% in September, well above the 0.3% consensus, but gasoline supplied about seven-tenths of the gain. The control group rose just 0.1% after August’s 1.2% jump; real core spending slipped, but the third quarter still averaged a solid 3.4% annualized real pace.
Early Signals
- The headline, and what it hides. Retail and food services sales rose 0.8% in September, to $745.0 billion, after rising a revised 1.3% in August. Sales are up 6.3% over the past twelve months, and twelve of the thirteen major categories Census tracks are higher than a year ago; health and personal care stores (drug stores), down 1.2%, are the exception. The consensus forecast was a 0.3% increase.
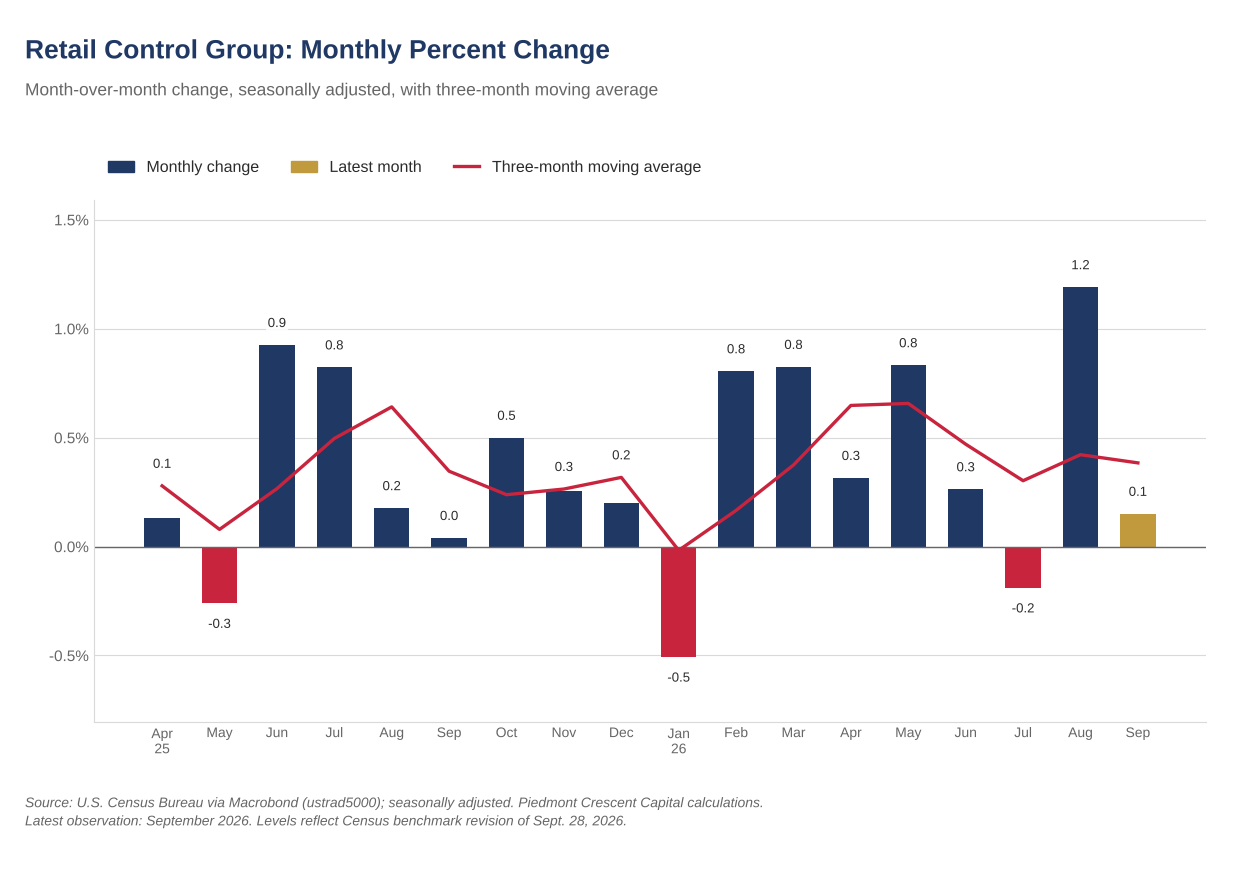
- The control group is the number that matters. Core retail sales, which exclude motor vehicles, gasoline, building materials and food services, rose 0.1% in September and are running a 4.5% annualized pace over the past three months. The consensus forecast was 0.3%; August was revised to 1.2%, so the control group paused after its jump instead of building on it.
- Nothing moved on the calendar this month. September carries no promotional event that changed months. Back-to-school buying has largely run its course, Census adjusts for Labor Day, and the second Amazon event, Prime Big Deal Days, has fallen in October since 2022. In 2026 it ran October 6 and 7, inside the month as in each of the last four years, so October’s report is not exposed to a calendar shift, although some online purchases may have been put on hold until the Prime Big Deal Days.
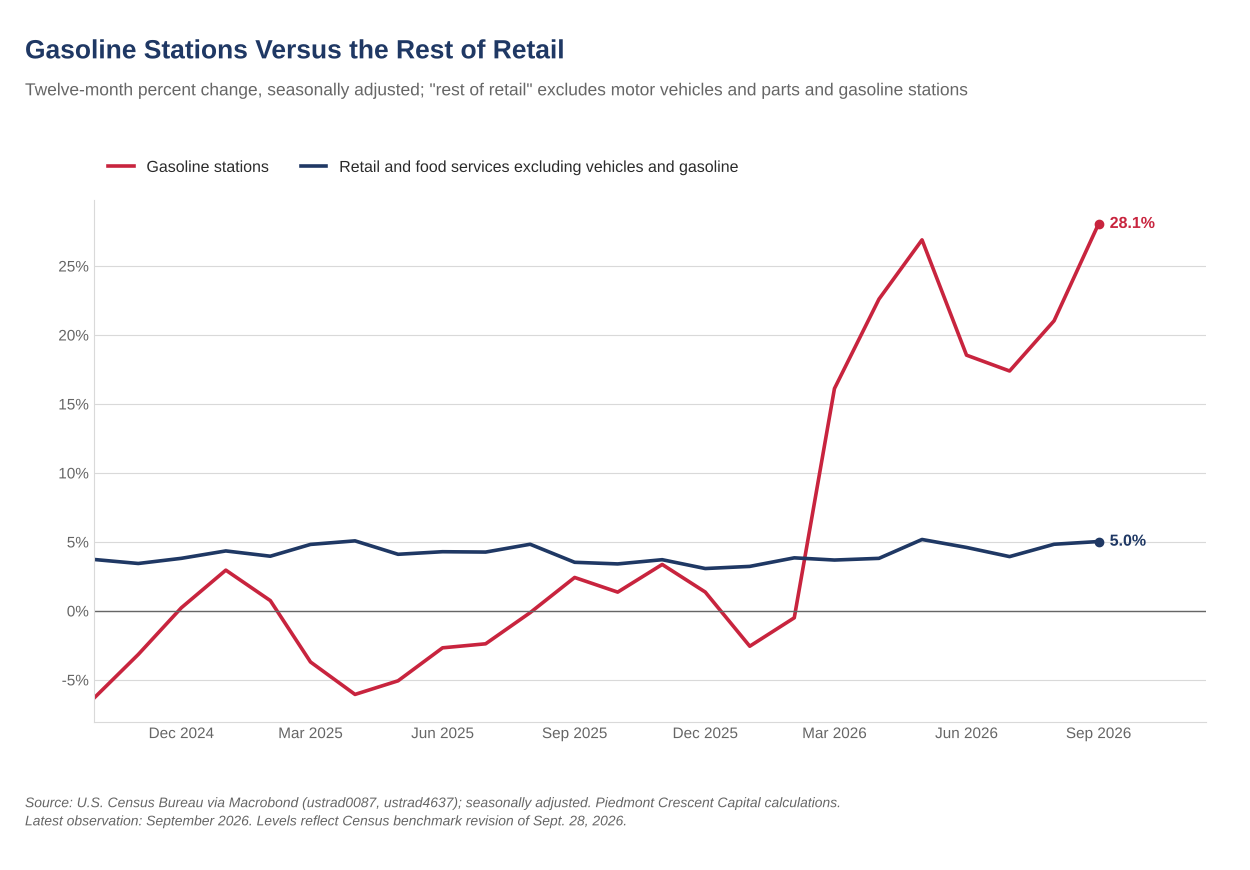
- Vehicles and gasoline, the two swing categories. Motor vehicle and parts dealers rose 0.2%, contradicted by light-vehicle unit sales, which fell to a 16.0 million annual rate from 16.8 million in August. Gasoline stations rose 6.4%. The September CPI for gasoline rose 9.1% seasonally adjusted and 6.5% before adjustment, so gas station sales should rise sharply on price alone, and they did: the EIA average pump price rose 7.3%, from $4.06 a gallon in August to $4.35 in September.
- Goods versus services, read through the restaurant line. Food services and drinking places rose 1.1% and restaurants held a 12.5% share of total sales. Restaurant sales are up 7.0% over the past year, so households are not trading down in the line they can trim first; the larger pump bill has not yet reached it.
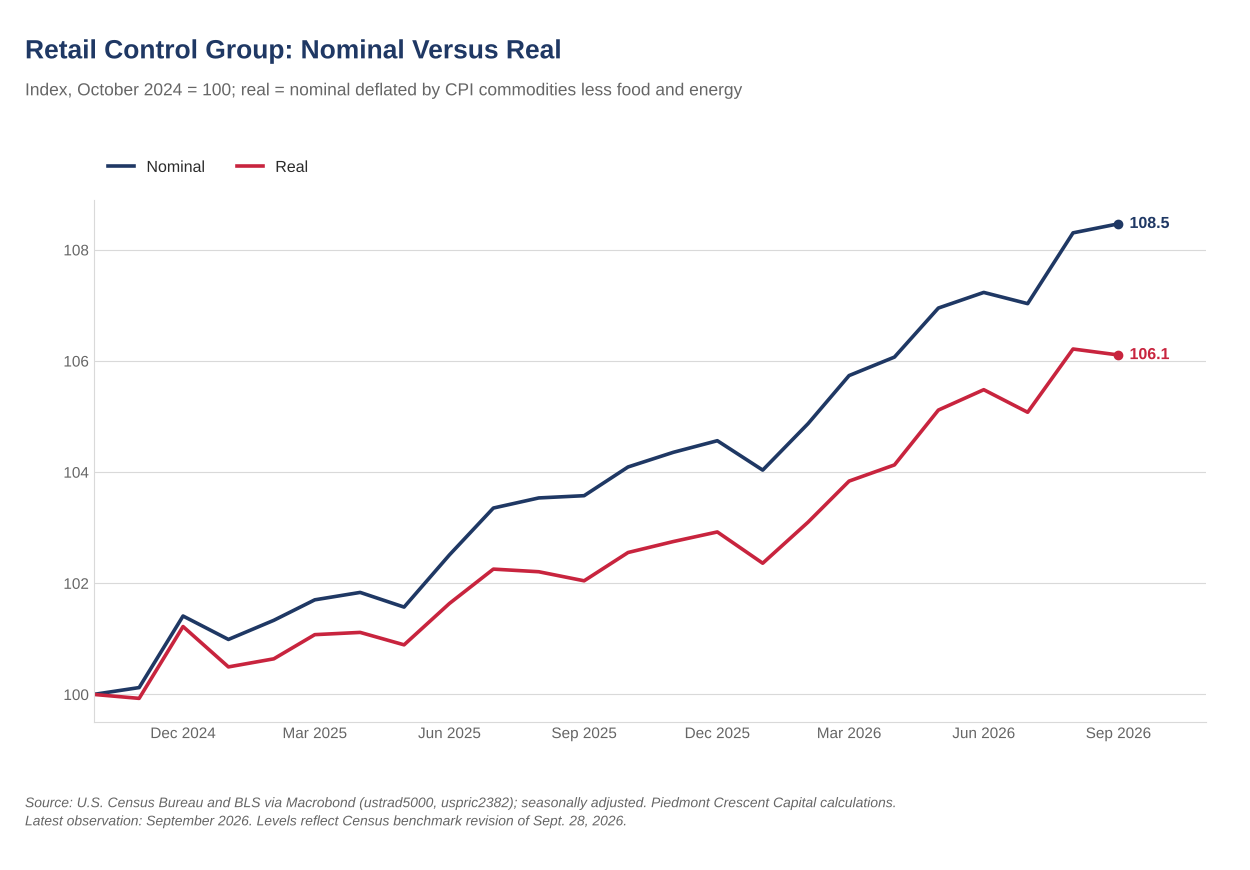
- Nominal is not real. Deflating the control group by the CPI for commodities less food and energy commodities, which rose 0.3% in September, puts real core spending down 0.1% on the month and up 4.0% over the past year. Real average hourly earnings for all employees fell 0.5% in September and are down 0.7% from a year ago, so the income backing for this spending is thinner than the sales data suggest.
Key Takeaways
| Key Concept | Findings |
|---|---|
| Headline retail sales | Up 0.8% in September to $745.0 billion; up 6.3% over the year. Gasoline stations supplied 0.55 percentage points of the gain, and eight of the thirteen major categories rose. |
| Retail control group | Up 0.1%, against a 0.3% consensus. The GDP-relevant read. Running a 4.5% annualized pace over the past three months. |
| Motor vehicles | Up 0.2%, contradicted by light-vehicle unit sales falling to a 16.0 million annual rate from 16.8 million in August. |
| Gasoline stations | Up 6.4%. The average retail price rose from $4.06 to $4.35 a gallon, a 7.3% gain; the dollar gain is price, not volume. |
| Nonstore retailers | Up 0.3%. No promotional-calendar shift this month; unadjusted sales fell 0.4%, a milder September than the 3.1% average decline of 2014-2025, excluding 2020. |
| Restaurants and bars | Up 1.1%. The discretionary services read; restaurants’ share of total sales edged up to 12.5% from 12.4% in August. |
| Revisions | August revised from 1.1% to 1.3%; July revised from -0.5% to -0.4%. Census reports a median absolute revision of one-tenth of a percentage point to the advance estimate of total sales. |
| Real spending | Control group deflated by core-commodity CPI: down 0.1% on the month, up 4.0% over the year. Third-quarter real control group up 3.4% at an annual rate. |
The Overview
September’s report was a strong headline resting on the pump. Sales rose 0.8%, twelve of the thirteen major categories Census tracks are higher than a year ago, and the control group, the part of retail sales that feeds GDP most directly, rose 0.1%.
The pump supplied seven-tenths of September’s gain; away from it, the consumer paused after a very strong August.
Gasoline stations added 0.55 percentage points to the 0.8% total, and the gain is almost entirely the average pump price, which rose 7.3% in September. Contributions use the prior month’s weight. Strip gasoline out and sales rose just 0.2%.
Where the Month's Noise Came From
Motor vehicles and gasoline together run about 28% of total sales and, as usual, account for most of its month-to-month swing. Motor vehicle and parts dealers, 18.8% of total sales, rose 0.2% and added 0.04 percentage points. Gasoline stations, 9.1% of total sales, rose 6.4% and added 0.55 points. Excluding both, sales rose 0.2%.
The average retail price of regular gasoline rose from $4.06 a gallon in August to $4.35 in September, a change of 7.3%, a little above gasoline stations’ 6.4% sales change, which implies volume was flat to slightly lower. When the price moves and the volume holds, gasoline stations’ sales measure the pump price. Sales outside vehicles and gasoline rose only 0.2%, so the larger pump bill did not come with stronger spending elsewhere.
The Control Group: What Actually Feeds GDP
The control group, total retail and food services less motor vehicles and parts, gasoline stations, building materials and garden equipment, and food services, rose 0.1% in September to $412.2 billion; the level is lower than in last month’s report because Census’s September 28 benchmark revision lowered the series. It is running a 4.5% annualized pace over the past three months and is up 4.7% from a year ago. The three-month pace is down from 4.9% in August on the revised data because September’s small gain added little to the three-month average. Control group is the number BEA uses as the primary monthly input to goods consumption.
The Promotional Calendar
Retail sales are shaped every summer and fall by a handful of manufactured shopping events whose dates move. September is normally the quietest of them: back-to-school buying is largely over, Labor Day is adjusted for by Census, and the next promotional peak arrives in October. One event did cross a month boundary this year: Amazon’s summer Prime Day moved from July to June 23-26, which scrambled June and July, but nothing crossed into or out of September.
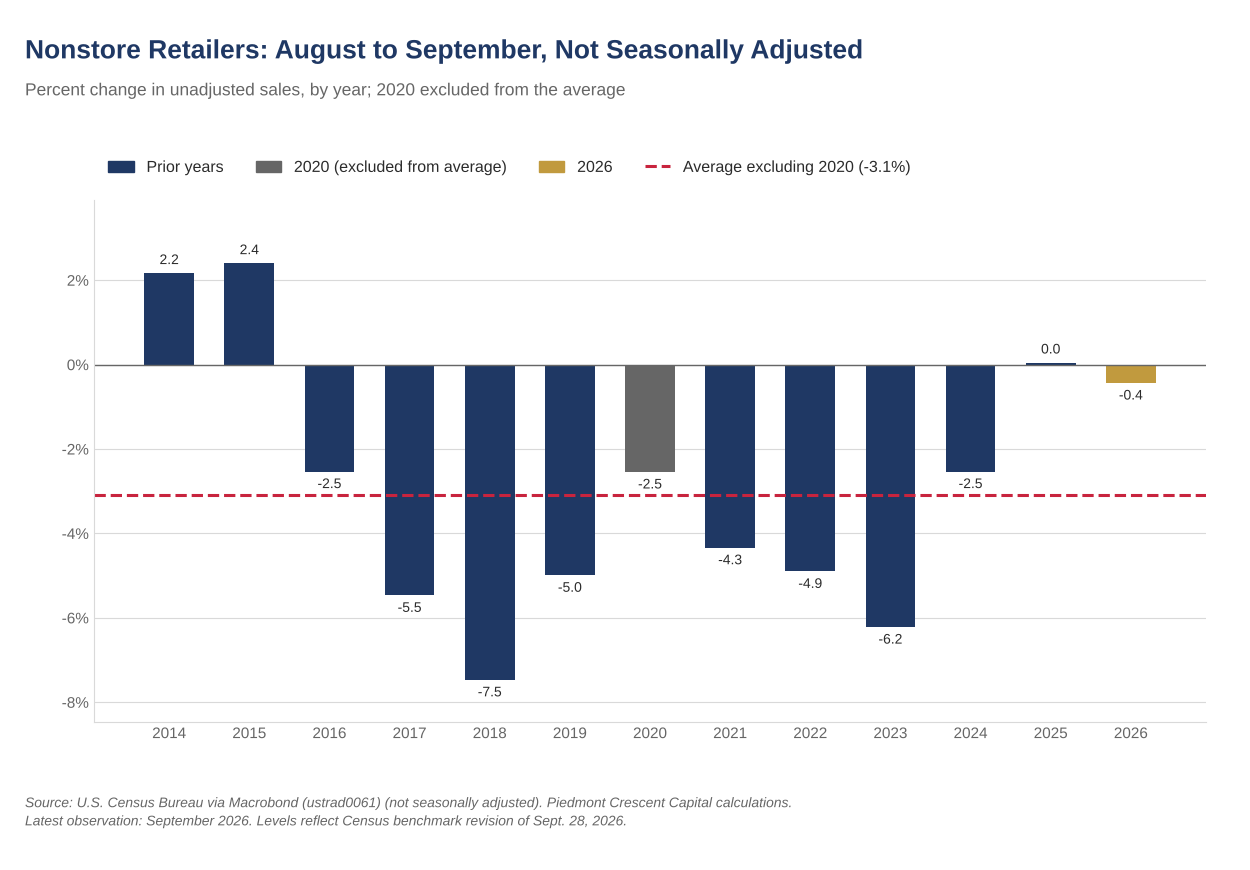
The evidence is in the not-seasonally-adjusted data. Nonstore retailers fell 0.4% in September before seasonal adjustment, against an average decline of 3.1% in the same month from 2014 through 2025, excluding 2020. Census’s seasonal factors, as implied by its Table 1, expected a decline of about 0.7%; after adjustment the category rose 0.3%. September’s raw decline was a little better than the factors expected, and the adjustment turned it into a small gain, which is the adjustment doing its job.
The recurring calendar. July: back-to-school promotions begin in the last week; Amazon Prime Day fell in July every year from 2015 through 2025 except 2020 (October) and 2021 (June), and moved to late June in 2026. August: back-to-school peak, most state sales tax holidays. September: the back-to-school tail and Labor Day. October: the second Prime event, "Prime Big Deal Days," since 2022. November: Black Friday and Cyber Monday, whose split between November and December turns on the Thanksgiving date. December: the number of shopping days between Thanksgiving and Christmas, which has ranged from 26 to 32. Easter moves between March and April. Census adjusts for trading-day and holiday effects, but we know of no adjustment for retailers’ promotional events.
A Seasonal Read on September
September is normally a month when nonstore sales ebb as summer buying ends: unadjusted sales fell in eight of the eleven years from 2014 through 2025, excluding 2020, by an average of 3.1%. This September fit the pattern in direction and not in size, the mildest decline of the period apart from 2025’s flat reading. Nonstore retailers fell 0.4% in the raw August-to-September data and rose 0.3% after seasonal adjustment. Exhibit 3 shows the unadjusted August-to-September change in nonstore sales for every year since 2014.
September, specifically. September is the quiet month between the August back-to-school peak and the start of the holiday ramp in October, and it closes the quarter. A control group that pauses at 0.1% after a 1.2% August is a quiet month following a loud one, and one quiet month does not make a turn in the consumer. The three-month pace of 4.5% and the 3.4% real third-quarter pace are the better guides to the underlying consumer, and both are solid.
Goods, Services and the Restaurant Line
Food services and drinking places, the only services line in this report and worth about an eighth of the total, rose 1.1% in September and are up 7.0% over the past year. Restaurants and bars are the discretionary category households trim first. They have not trimmed: the 7.0% gain is well above the control group’s 4.7%, so the restaurant line shows no sign of trading down.
Where this report and the broader spending data could still diverge: the income side. The September personal income and outlays report, due from BEA on October 29, the same morning as the advance estimate of third-quarter GDP, will show whether income growth is keeping pace with spending. Real average hourly earnings fell 0.5% in September.
From Nominal to Real
This report is nominal, and September’s price backdrop makes the distinction matter a little more than it did in August. The CPI for commodities less food and energy commodities rose 0.3% in September and 0.7% over the past year, so deflating the control group changes the picture by 0.7 points over the year, from 4.7% to 4.0%, and turns September’s 0.1% nominal gain into a 0.1% real decline. Real core spending is still up 4.0% over the past year.
What the Income and Electricity Data Say About Services
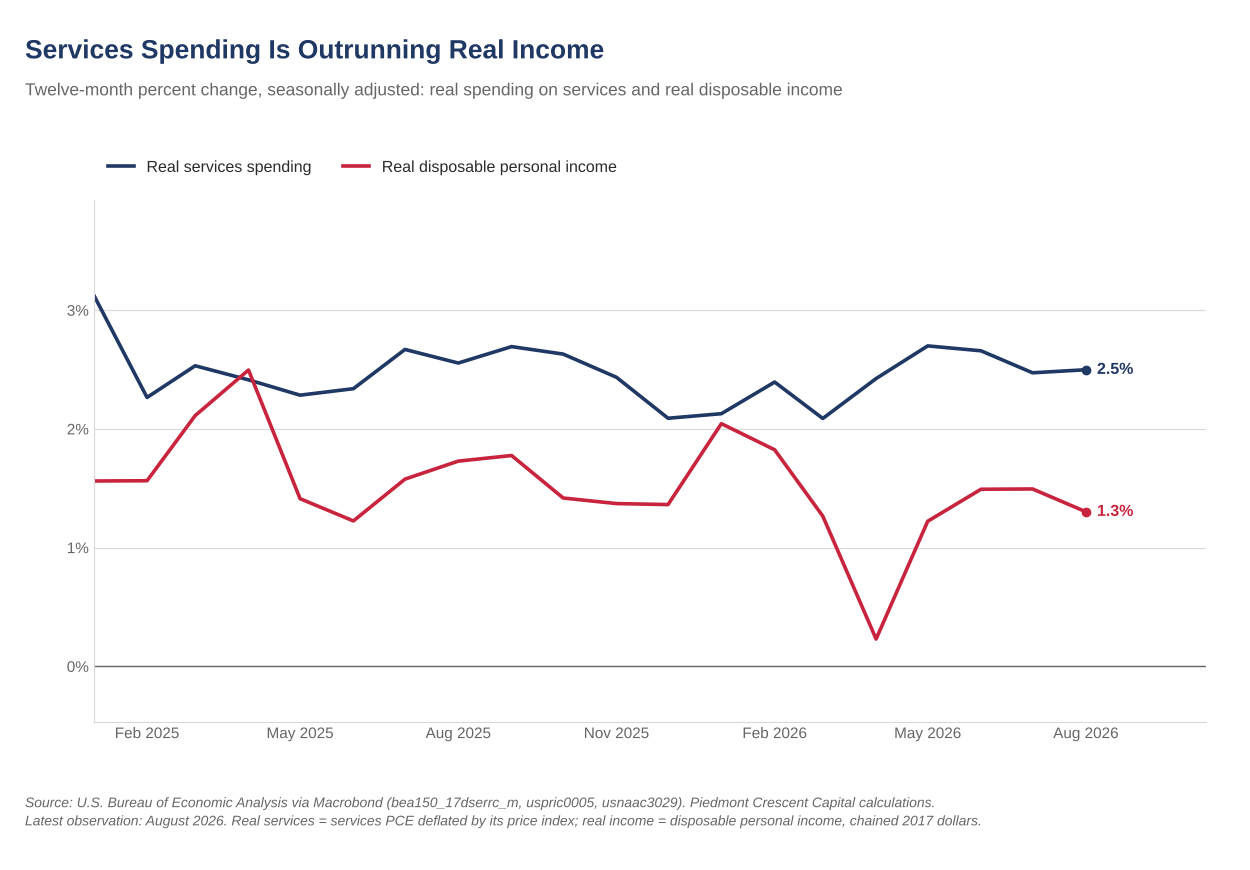
Retail sales leave out services, which are most of consumer spending, so the latest personal income and outlays report, for August, is the best current check. Personal income rose 0.2% in August and disposable income 0.3%, but real disposable income was little changed on the month and is up 1.3% over the past year. Real spending on services, which we compute by deflating nominal services spending by the PCE services price index, rose 0.2% in August and is up 2.5% from a year ago, nearly twice the pace of real income. The saving rate fell to 4.1% in August from 4.6% in July and 5.2% a year earlier, which is how the gap is being financed. BEA releases the September figures on October 29.
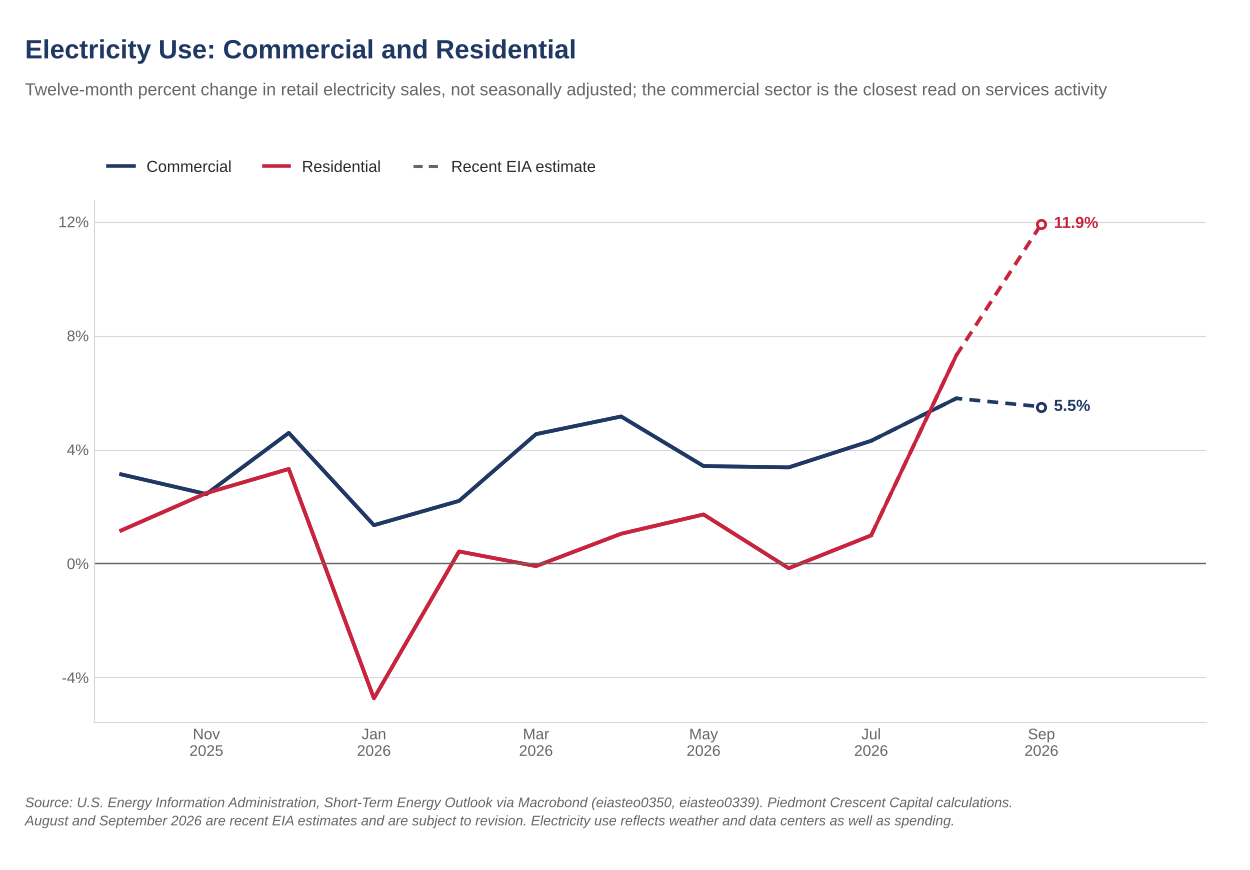
Electricity use gives a physical cross-check, with caveats. Commercial electricity sales, the sector that houses offices, stores, restaurants and other service businesses, were up 4.3% from a year earlier in July and are estimated up 5.8% in August and 5.5% in September; residential sales are estimated up 7.3% and 11.9%, which looks like heat and not spending. Third-quarter commercial sales are running 5.2% above a year ago, against 3.9% in the second quarter. The series is not seasonally adjusted, EIA's August and September figures are preliminary, and commercial sales now include data center load, so we read electricity as confirmation that service activity has not slowed and make no claim about how fast it is growing.
Taken together, the income and electricity data point to services spending growing near 3% in real terms in the third quarter, supported more by a lower saving rate than by income. The September report would confirm that read if real services spending rises at least 0.2% with the saving rate holding near 4%; a saving rate back above 4.6% alongside soft services spending would overturn it.
What This Means for Third-Quarter Consumer Spending
September completes the third quarter, so the retail data now give a full-quarter read on goods spending. To translate it, we compute real control group sales for the quarter: the average of the three monthly real levels (nominal sales deflated by the CPI for commodities less food and energy commodities), compared with the second quarter’s average and expressed at an annual rate. Real core spending fell 0.1% in September, and the third-quarter average is up 3.4% at an annual rate from the second quarter, after a 7.2% pace in the second quarter and 1.4% in the first. Census’s revisions raised July and August, so on the revised data a September held at the July-August average would have given 2.8%, a September at August’s level 3.6% and a September at July’s level 2.1%. The actual 3.4% sits near the top of that range. The control group is the number BEA uses to build goods consumption, so this is our read on goods spending in the quarter; motor vehicles and gasoline are added from unit sales and EIA data and are not in it.
On the services side, real services spending is tracking near a 3.0% annual rate for the quarter (Exhibit 5), with September held at the July-August average. Goods and services together point to third-quarter real consumer spending growth near 3%, helped by services and held back by motor vehicles, where unit sales fell in September. BEA’s advance estimate of third-quarter GDP on October 29 will give the official number.
The condition that would break this call: a decline in October’s real control group. Because the third-quarter average sits below September’s level, a fourth quarter that merely holds September’s level already grows 1.2% at an annual rate; it takes a real gain of about 0.3% in October, held through December, to keep the pace above 2%, and a real decline of 0.3% would turn the quarter negative.
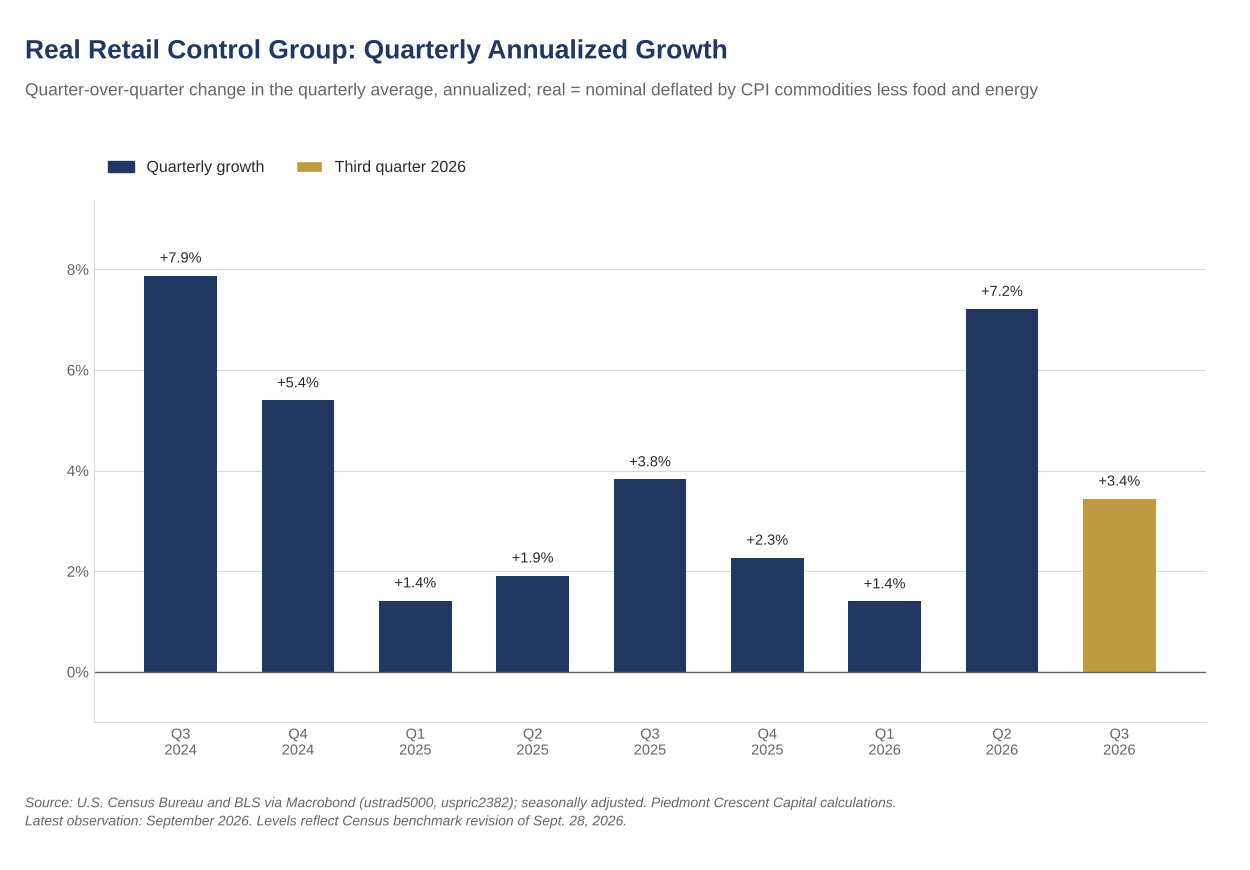
The September retail sales report supports the house view that the consumer is not cracking, but only at the margin. Twelve of thirteen categories are above year-ago levels and real core spending is up 4.0% over the year, with a 3.4% real pace in the third quarter. The control group’s 0.1% gain was soft, though, and without gasoline the report would have looked ordinary.
The K-shaped, capital-led expansion described in prior issues still fits. Real average hourly earnings fell 0.5% in September, so the wage base is not what is supporting this spending, and the pump bill is a transfer from it. Restaurants, up 7.0% over the year, suggest the upper end of the income distribution is still spending freely.
We expect the Federal Reserve to hold at its October 27-28 meeting and to raise rates on December 9, with at least one more increase in 2027. The acceleration in core inflation tells us the Fed has more work to do. Two more hikes appear assured, and one or two more could prove necessary, depending on how resilient the economy and financial markets prove to be. Spending strength supports the December call: real consumer spending is growing near 3% in the third quarter, which does not argue for relief from the acceleration in core inflation.
Bottom Line
September was a strong headline resting on the pump. Sales rose 0.8%, but gasoline stations supplied about seven-tenths of it, and the control group rose only 0.1% after a 1.2% August, leaving real core spending down 0.1% on the month. The third quarter still averaged a 3.4% real pace in goods and near 3% in services, so consumer spending is not the weak link in this expansion. For the Federal Reserve, we expect a hold at the October 27-28 meeting and an increase on December 9.
What We Are Watching
October retail sales, Census Bureau, November 17.. The control group should rise at least 0.4%, with Prime Big Deal Days inside the month as in each year since 2022; a reading below 0.2% would suggest September’s pause was the start of a slowdown rather than a breather.
September personal income and outlays and the advance third-quarter GDP estimate, BEA, October 29.. Real services spending should rise at least 0.2% with the saving rate near 4%; a saving rate back above 4.6% with soft services spending would suggest households are pulling back.
The weekly EIA retail gasoline price.. At $4.33 a gallon on October 12, down from the $4.48 peak of September 21, a fall below $4.15 would flatten gasoline stations’ sales and ease the squeeze on the categories households trim, while a move back above $4.50 would extend it.
Mark P. Vitner – Chief Economist, Piedmont Crescent Capital
mark.vitner@piedmontcrescentcapital.com · (704) 458-4000
Appendix: Retail Sales Detail
| Category | Sep. m/m | 3-mo ann. | 12-mo |
|---|---|---|---|
| Retail and food services, total | 0.8% | 4.9% | 6.3% |
| Retail trade | 0.7% | 4.1% | 6.2% |
| Control group | 0.1% | 4.5% | 4.7% |
| Motor vehicle and parts dealers | 0.2% | 2.8% | 2.5% |
| Furniture and home furnishings | 1.3% | 1.6% | 4.9% |
| Electronics and appliances | 0.6% | 7.8% | 9.4% |
| Building materials and garden | -0.6% | 1.6% | 4.5% |
| Food and beverage stores | 0.4% | 0.0% | 0.9% |
| Health and personal care | 0.7% | 9.1% | -1.2% |
| Gasoline stations | 6.4% | 6.6% | 28.1% |
| Clothing and accessories | 0.0% | 7.0% | 5.0% |
| Sporting goods, hobby, book and music | -0.5% | 2.0% | 9.6% |
| General merchandise | -0.1% | 4.5% | 4.2% |
| Miscellaneous store retailers | -3.0% | 16.1% | 10.9% |
| Nonstore retailers | 0.3% | 3.6% | 8.2% |
| Food services and drinking places | 1.1% | 10.8% | 7.0% |
Computation notes. Three-month annualized rates are computed on seasonally adjusted levels as the compound annual rate of change of the latest three-month average over the prior three-month average. Real series deflate the control group by the CPI for commodities less food and energy commodities; real services spending deflates nominal services consumption by the PCE services price index. Quarterly tracking estimates use the average of monthly levels within the quarter, annualized against the prior quarter's average. The advance report is a subsample of about 4,800 firms, replaced about a month later by the full Monthly Retail Trade Survey sample of about 13,000; Census reports a median absolute revision of one-tenth of a percentage point to the advance estimate of total sales. Series history in the exhibits reflects Census's benchmark revision of September 28, 2026. Macrobond series used: ustrad0068, ustrad5000, ustrad4637, ustrad0061, ustrad0087 (Census retail and food services sales and its components, seasonally adjusted and not seasonally adjusted), uspric2382 (CPI commodities less food and energy), bea150_17dserrc_m and uspric0005 (nominal services consumption and the PCE services price index), usnaac3029 (real disposable personal income), eiasteo0350 and eiasteo0339 (EIA commercial and residential electricity sales).
Sources: U.S. Census Bureau, Advance Monthly Sales for Retail and Food Services, September 2026; Macrobond; NADA Market Beat; Bloomberg consensus survey; U.S. Bureau of Labor Statistics, Consumer Price Index and Employment Situation; U.S. Bureau of Economic Analysis, Personal Income and Outlays; U.S. Energy Information Administration, Short-Term Energy Outlook and Weekly Retail Gasoline Prices; Piedmont Crescent Capital.
Disclaimer: This report is provided for informational purposes only and does not constitute investment, legal, tax or accounting advice. Information is believed to be reliable but is not guaranteed. Opinions are those of the author as of the date of publication and are subject to change without notice.