
Gasoline Moves the Headline, Services Move the Trend
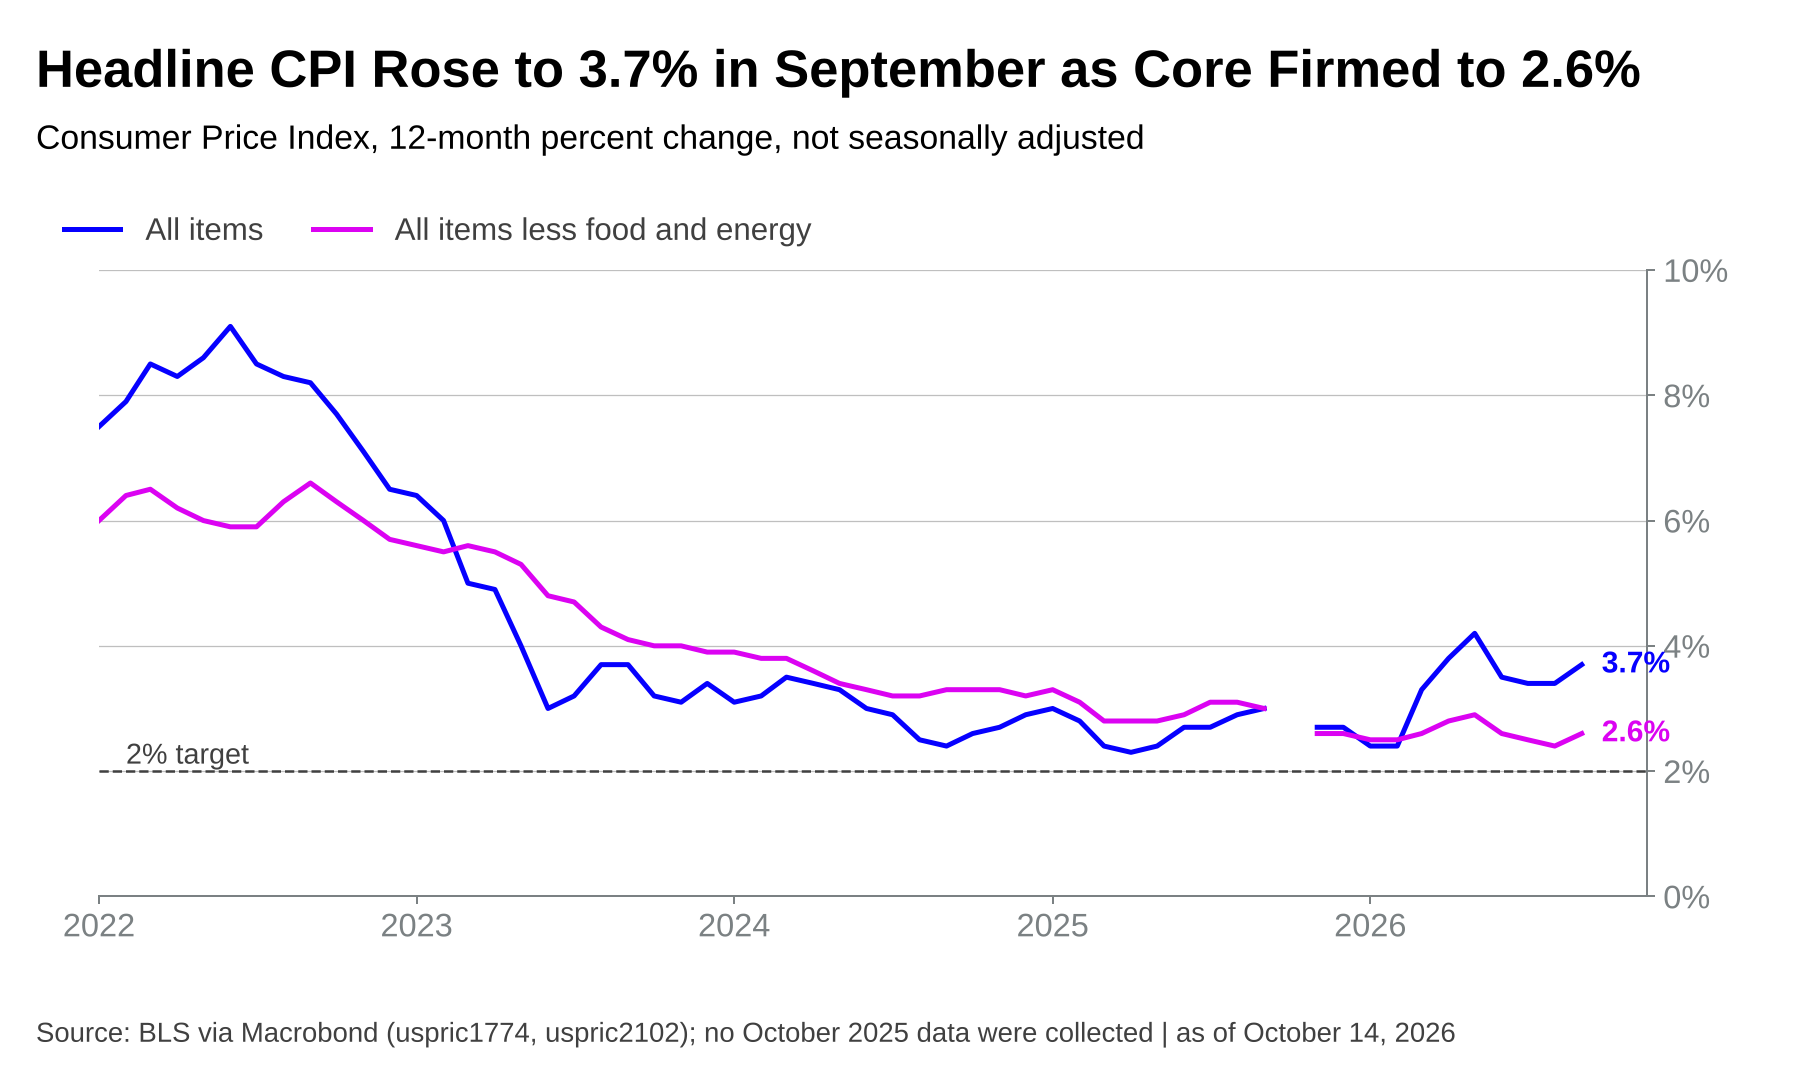
September's headline matched expectations at 0.6% and 3.7%, and gasoline did most of the work. Core prices rose 0.3%, a tenth above consensus, lifting the 12-month rate to 2.6%, and core services outside housing have now run 0.3% to 0.4% for three straight months while shelter picked up. The test we set in July has been met, and the acceleration in the core measures we follow most closely says the Fed has more work to do, as we expected.
Early Signals
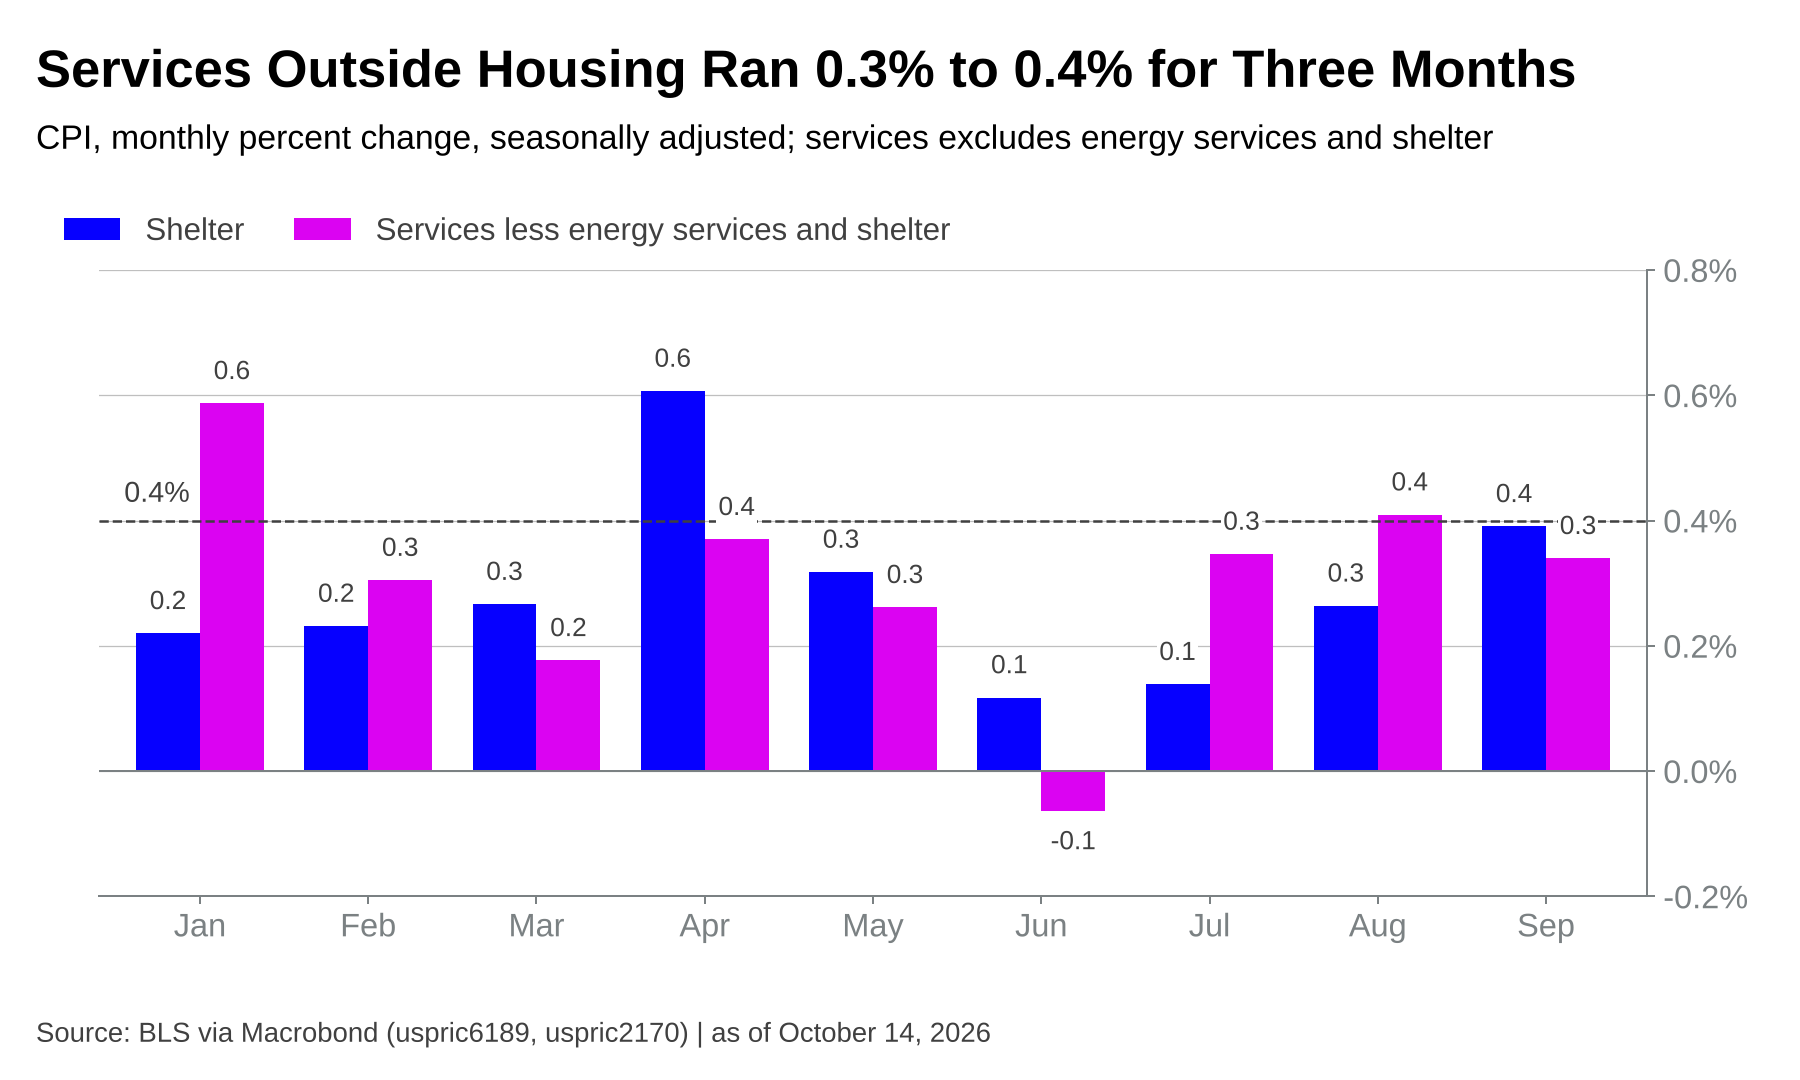
- The July test has been met. Core services outside housing (services less energy services and shelter, our Macrobond calculation) rose 0.35% in July, 0.41% in August and 0.34% in September, a three-month average of 0.37%. Shelter rose 0.4% in September after 0.3% in August and 0.1% in July, its fastest monthly pace since April.
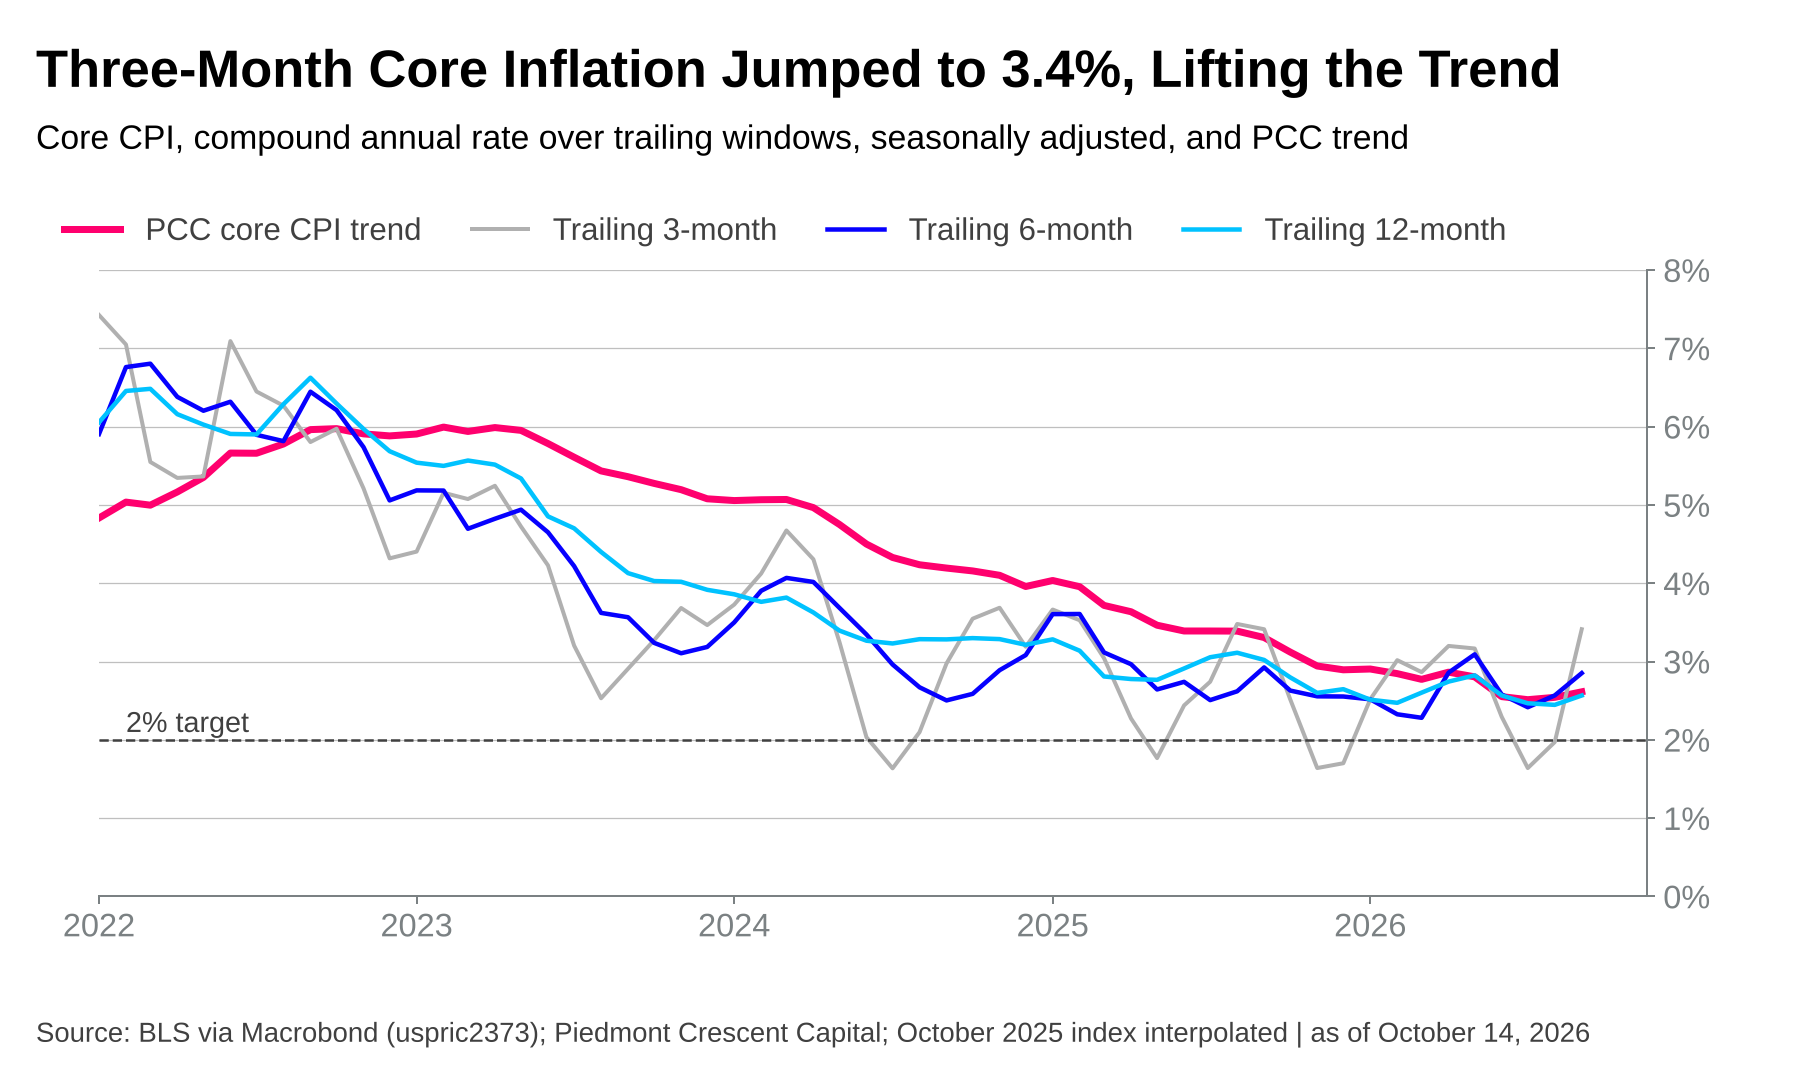
- The underlying trend rose for a second straight month. Our one-sided HP-filter estimate of trend core inflation rose to 2.61% in September from 2.54% in August. It is still well below the 3.31% reading from a year ago, but core CPI has compounded at a 3.4% annual rate over the past three months, up from 2.0% in August.
- Gasoline did more than half of the headline's work. The all items index rose 0.6%, in line with consensus, and the 12-month rate rose to 3.7% from 3.4%. Gasoline rose 9.1% seasonally adjusted and is up 34.2% over the year; the energy index as a whole rose 5.2%.
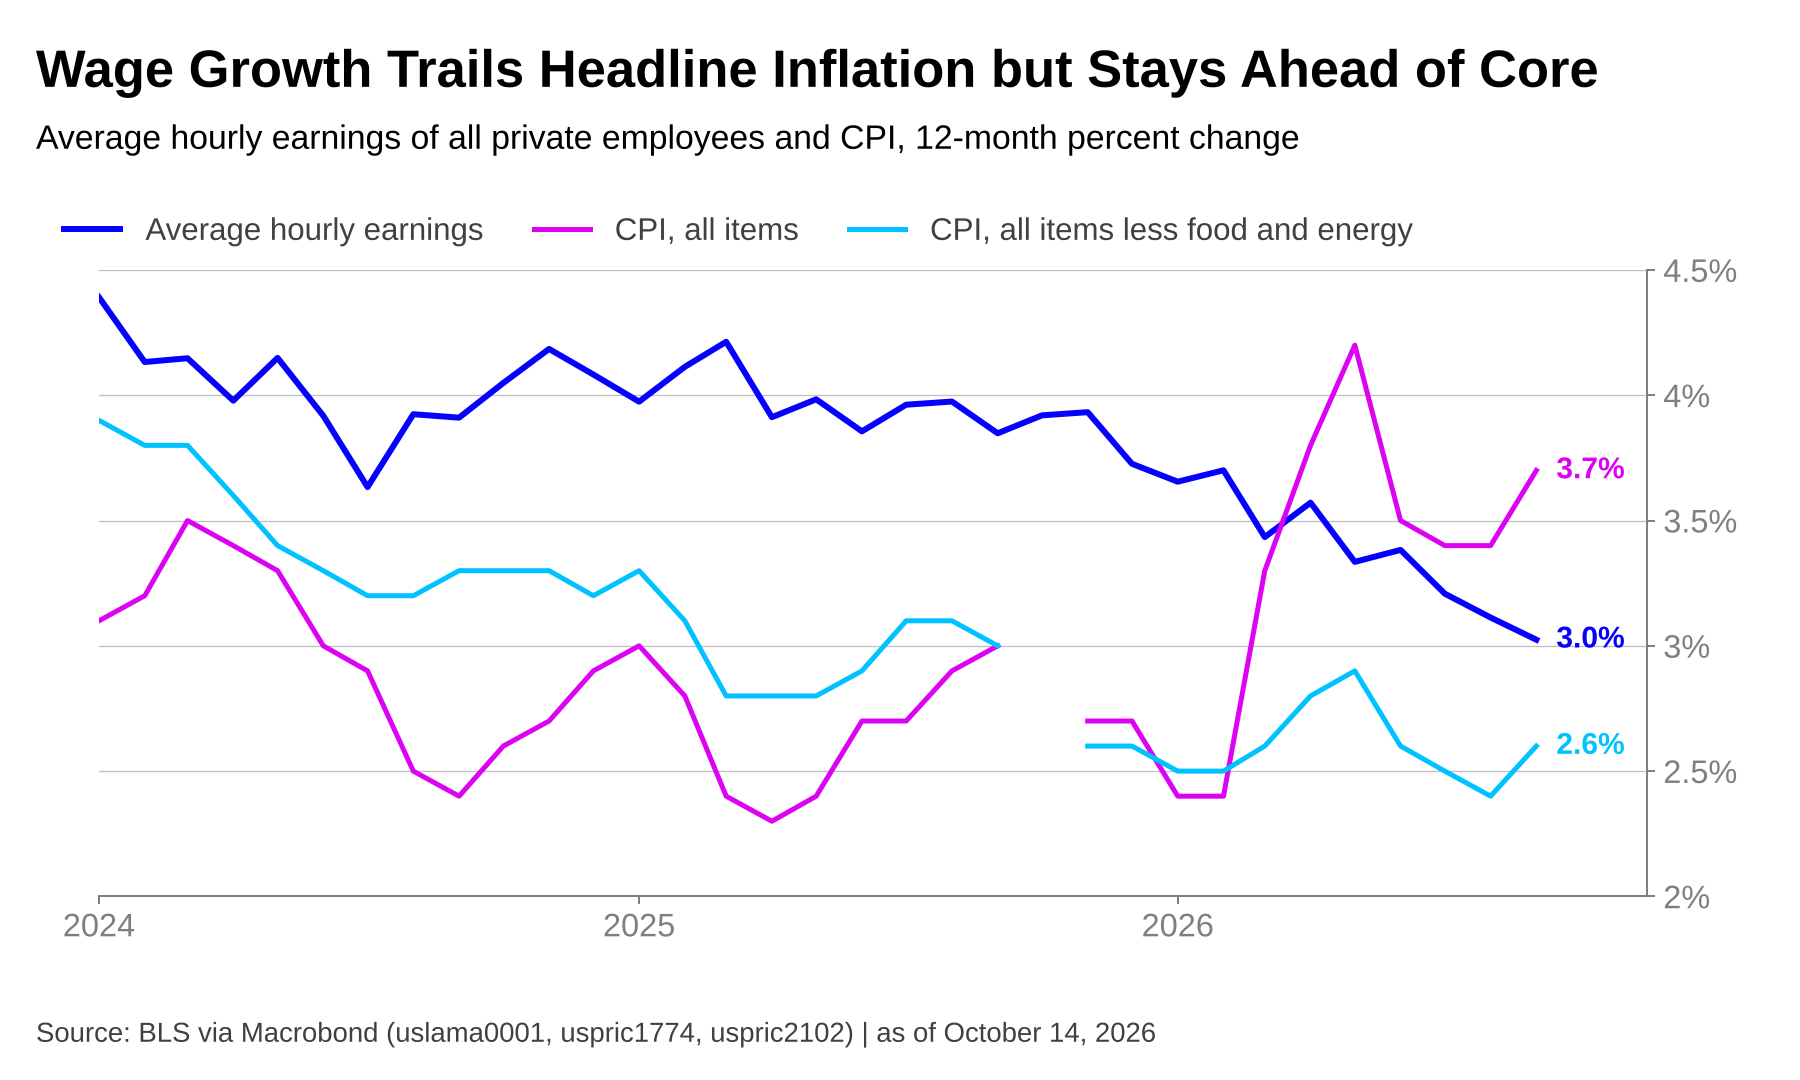
- Real wages fell for a third straight month. Average hourly earnings rose 0.1% in September against a 0.6% rise in the CPI-U, so real hourly earnings fell 0.5% on the month and are down 0.7% over the year. Nominal wage growth of 3.0% is still ahead of core inflation at 2.6%, but it trails the headline by 0.7 percentage point.
Key Takeaways
| Key Concept | Findings |
|---|---|
| Headline CPI | Rose 0.6% in September after rising 0.4% in August. The 12-month rate rose to 3.7% from 3.4%, in line with consensus. |
| Energy | Up 5.2% on the month as gasoline rose 9.1%. Up 20.4% over the year with gasoline up 34.2% and fuel oil up 74.2%. |
| Core CPI | Rose 0.3% against a consensus of 0.2%. The 12-month rate rose to 2.6% from 2.4%, above the 2.4% consensus. |
| Core services outside housing | Rose 0.34% in September after 0.41% in August and 0.35% in July, a three-month average of 0.37% (4.5% annualized). |
| Shelter | Rose 0.4%, the fastest monthly pace since April. Owners’ equivalent rent rose 0.3% and rent 0.2%; lodging away from home rose 2.0%. |
| Underlying trend | Our HP-filter trend for core CPI rose to 2.61% from 2.54%, a second straight increase. The headline trend rose to 3.23% from 2.89%. |
| Real earnings | Real average hourly earnings fell 0.5% on the month and 0.7% over the year, a third straight monthly decline. |
| Our call | Hold on October 27-28, hike on December 9, and at least one more in 2027. Two more hikes look assured, with one or two additional hikes possible depending on how resilient the economy and markets prove to be. |
The Overview
September's CPI delivered the headline the market expected and a core reading a tenth above it. The all items index rose 0.6% after rising 0.4% in August, and the 12-month rate climbed to 3.7% from 3.4%, both in line with consensus. Gasoline did most of the work, rising 9.1% on a seasonally adjusted basis, and BLS attributes more than half of the headline increase to it. Core prices rose 0.3% against a consensus of 0.2%, which lifted the 12-month core rate to 2.6% from 2.4% and left it above the 2.4% economists expected.
The core surprise is small on its face and easy to wave off as rounding. We read it differently because of where it came from. Services outside housing and shelter both ran hot at once, the first for a third straight month, and that is the combination we named in July as evidence that policy is less restrictive than we think. The report arrives two weeks before the Committee meets for the first time since its September 16 hike and three weeks before the midterm elections, and it adds to the evidence that the Committee has more work to do.
Energy: Gasoline Does the Heavy Lifting
The energy index rose 5.2% in September after rising 2.1% in August and is up 20.4% over the year. Gasoline rose 9.1% on a seasonally adjusted basis (6.5% before adjustment) and is up 34.2% over the year. Fuel oil, a thin and volatile series that gives the earliest read on winter heating costs, rose 15.3% and is up 74.2% over the year. Electricity rose 0.2% and natural gas fell 0.3%; both are up for the year, by 4.4% and 5.0%. Food was flat. Food at home fell 0.1%, food away from home rose 0.2%, and the food index is up 2.5% over the year.
Core Inflation: Firmer Again, With Services in the Lead
The core index rose 0.3% in September, matching August, and the 12-month rate rose to 2.6% from 2.4%. Core goods firmed as well, with commodities less food and energy up 0.3% after 0.1% in August. Used vehicles rose 0.7%, new vehicles 0.2% and apparel 0.3%. Services did the rest. Education rose 0.6%, recreation 0.5% and hospital services 0.7%, while medical care overall rose just 0.1% as prescription drugs fell 1.2%. Communication fell 0.2% after jumping 2.3% in August.
Services less energy services and shelter, our measure of core services outside housing and the one we said in July we would be watching, rose 0.34% in September after 0.41% in August and 0.35% in July. That is a three-month average of 0.37%, or 4.5% annualized, against 3.1% over the past twelve months. (This is a Macrobond calculation from the BLS indexes and a slightly different cut from the services less rent of shelter series we cited in August.) Transportation services rose 0.6%, a fourth straight monthly acceleration, and airline fares rose 1.2%. This is the pace we said in July would confirm the trip-wire, and shelter, covered below, is no longer slowing either.
The Underlying Trend: Our HP-Filter Read
Our HP-filtered estimate of trend core inflation rose to 2.61% in September from 2.54% in August, a second straight increase after declines in May, June and July. The August figure is trued up from the 2.55% we published last month now that the official index level is available. The trend is still well below the 3.31% reading from a year ago, but the direction has changed twice in a row. Core CPI has compounded at a 3.41% annual rate over the past three months, up from 1.97% in August and above both its six-month pace of 2.85% and its 12-month pace of 2.57%. The three-month rate sat below the 12-month rate in July and August; it now sits above it.
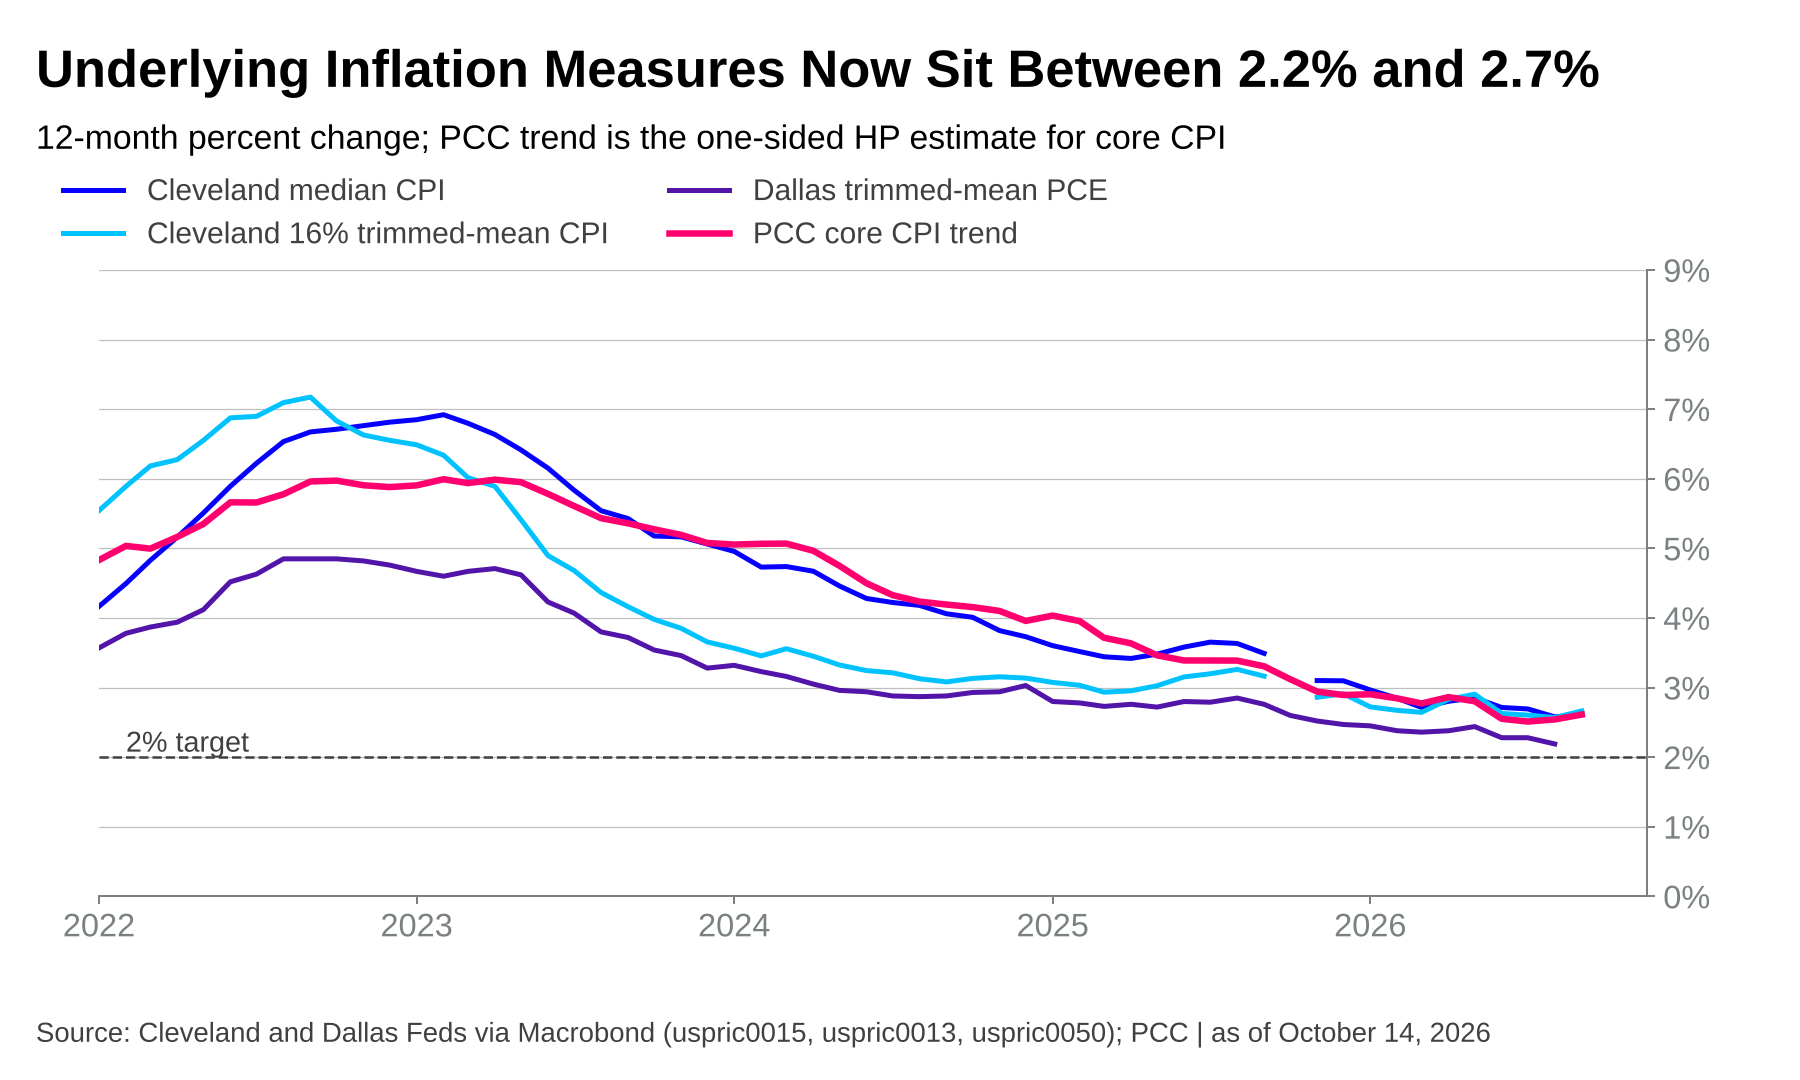
The alternative measures we track put the level in a band between 2.2% and 2.7%, and the Cleveland measures are leaning the same way as ours. The Cleveland Fed's median CPI rose to 2.61% in September from 2.58% in August, and its 16% trimmed mean rose to 2.67% from 2.57%. The Dallas Fed's trimmed mean PCE, which lags by a month, was 2.19% in August, down from 2.28% in July. Both Cleveland measures strip out the largest one-month moves and both ticked up, which says the firming was not confined to a few categories.
Methodology note. We apply a one-sided Hodrick-Prescott filter to monthly annualized inflation with the standard monthly smoothing parameter (λ = 129,600), computed on seasonally adjusted headline and core CPI index levels from a 2000 sample start. The one-sided implementation uses only data available through the current month, so the estimate is real-time and does not revise as future data arrive. October 2025 has no CPI observation because of the 2025 lapse in appropriations; we interpolate the index level geometrically between September and November, which moves the trend estimate by less than a basis point. With August's official core index level now published, we replaced last month's estimate with the published level, which moved the August trend to 2.54% from 2.55%.
Shelter and Light Vehicles: The Transmission Channels Diverge
Monetary policy reaches consumer prices mainly through two interest-sensitive channels, and this month housing stopped cooperating. Shelter rose 0.4% in September after 0.3% in August and 0.1% in July, its fastest monthly pace since April, and its 12-month rate rose to 3.2% from 3.0%. Owners' equivalent rent rose 0.3% and rent of primary residence rose 0.2%. Lodging away from home rose 2.0% after a 2.4% gain in August, a volatile line item that accounts for part of the acceleration. Shelter has now risen 0.14%, 0.26% and 0.39% in the past three months, so it is no longer decelerating, the second condition of our July test.
The vehicle channel is no longer pointing the other way either. New vehicle prices rose 0.2% but used vehicles rose 0.7%, and core goods as a group firmed to 0.3%. In July we described housing and vehicles as the evidence that policy was biting. In September one of the two was neutral and the other was adding to inflation, which weakens that evidence without erasing it.
Travel and Transportation: The Forward-Looking Signal
Two categories in this release say more about the months ahead than about September. Airline fares rose 1.2%, a slower pace than the 2.2% in July and 2.7% in August, and are up 22.4% over the year. Transportation services broadly rose 0.6%, a fourth straight acceleration from a 0.3% decline in June. Fares and transportation services tend to move with fuel-cost pass-through and discretionary travel demand before the effect shows up elsewhere, which makes gasoline's 34.2% annual gain a risk for core services in the coming months.
Fuel oil rose 15.3% in September after 10.1% in August, a two-month gain of about 27%. It is a thinly weighted line and it has reversed sharply before, so one quarter of data should not be treated as destiny. It is the earliest data point on heating costs heading into winter, though, and we will be watching the October and November prints closely.
Real Earnings: The Squeeze Deepens
The companion release showed a third straight month of real wage erosion. Average hourly earnings for all private employees rose 0.1% in September to $37.81, while the CPI-U rose 0.6%, so real hourly earnings fell 0.5% on the month and are down 0.7% over the year, versus a 0.3% annual decline in August. The CPI-W for production and nonsupervisory workers, which carries more weight on gasoline, rose 0.7% and is up 3.9% over the year, so those workers did slightly worse than the all-employee average. (Real earnings here are our calculation from Macrobond average hourly earnings and the CPI.)
Nominal average hourly earnings are up 3.0% over the past year against a 3.7% rise in headline consumer prices and a 2.6% rise in core prices. Wage growth now trails the headline by 0.7 percentage point and leads core by 0.4 point, a narrower cushion than the 0.7 point lead over core it held in August. September's employment report, with payroll growth of 29,000 and an unemployment rate of 4.2%, gave households little reason to expect faster wage gains.
What Households and Markets Expect
Households moved the wrong way. The New York Fed's September Survey of Consumer Expectations put median one-year inflation expectations at 3.9%, up from 3.6% in August, and three-year expectations at 3.3%, up from 3.2%; five-year expectations held at 3.0%. The average probability that unemployment will be higher in a year eased to 43.9% but is still near its highest reading since April 2020, so households are worried about jobs and prices at the same time.
The University of Michigan's preliminary October survey, released on October 9, was weaker. Its sentiment index was 46.3, and both inflation-expectations gauges rose: year-ahead expectations to 4.7% from 4.6%, and long-run expectations to 3.5% from 3.4%. Both household surveys now show higher expectations, and neither lets the Fed treat them as settled.
Markets are calmer than households. The five-year, five-year forward inflation compensation rate stood near 2.3% on October 9, the latest reading available to us, essentially where it has been for weeks. Investors do not appear to read a gasoline-led headline as the start of a new trend, which is where a firmer core services print could change the conversation.
Our Call · Hold in October, Hike in December, and More Work to Do
We expect the Committee to hold on October 27-28, six days before the midterms, and to hike on December 9. The Committee raised the funds rate to 3.75% to 4.00% on September 16. This report confirms that more tightening lies ahead, but it does not argue for a second move this month. A meeting six days before a general election is one the Fed has generally avoided moving at, and the October CPI, due November 10, along with the November labor data, will be in hand before the December 9 meeting. Waiting costs little if the data keep telling the same story.
The test we set in July has been met, and it supports the December hike with greater conviction. In July we said two or three more months of core services less shelter near 0.4%, with shelter no longer decelerating, would tell us policy was less restrictive than we thought. Services outside housing ran 0.35%, 0.41% and 0.34% in July, August and September, and shelter has moved from 0.14% to 0.26% to 0.39% over the same months. We still see the broader trend as far below where it stood a year ago, and a funds rate of 3.75% to 4.00% against core inflation of 2.6% is a positive real rate. But a trend that has risen two months running, in the part of the index that policy reaches last, is the acceleration in the core numbers we follow most closely, and it tells us the Fed has more work to do, which is what we expected.
Two more hikes appeared assured to us, and an additional hike or two might prove necessary. Our call is the December 9 increase and at least one more in 2027, which would take the funds rate to 4.25% to 4.50%. Whether it takes more depends on how resilient the economy and financial markets prove to be. Every reaction function says what the Committee would do if nothing else changed, and something else always changes. Gasoline is the largest moving piece, and a retreat in pump prices would remove most of the headline pressure. Our own test for the other direction is core services outside housing falling back to 0.2% or less for two months with shelter returning to its June and July pace. Employment is the other piece. Payroll growth of 29,000 in September is soft, but it came with a 4.2% unemployment rate, and we do not read it as the start of a labor-market break. A resilient economy and calm markets point toward the high end of that range, while a break in either would take the additional hikes off the table.
Mark P. Vitner – Chief Economist, Piedmont Crescent Capital
mark.vitner@piedmontcrescentcapital.com · (704) 458-4000
Appendix: Trend Inflation Estimates
| Measure | Latest | Prior month |
|---|---|---|
| PCC HP-filter trend, core CPI (one-sided, λ=129,600) | 2.61% (Sep) | 2.54% (Aug) |
| PCC HP-filter trend, headline CPI | 3.23% (Sep) | 2.89% (Aug) |
| Core CPI, compound annual rate over three months | 3.41% (Sep) | 1.97% (Aug) |
| Core CPI, compound annual rate over six months | 2.85% (Sep) | 2.57% (Aug) |
| Cleveland Fed median CPI (12-month percent change) | 2.61% (Sep) | 2.58% (Aug) |
| Cleveland Fed 16% trimmed-mean CPI (12-month percent change) | 2.67% (Sep) | 2.57% (Aug) |
| Dallas Fed trimmed mean PCE (12-month rate) | 2.19% (Aug) | 2.28% (Jul) |
| Core CPI, official 12-month | 2.6% (Sep) | 2.4% (Aug) |
Computation notes. HP-filter estimates were computed on seasonally adjusted headline and core CPI index levels (Macrobond series uspric2156 and uspric2373, from BLS) through September 2026, sample from 2000, one-sided recursive expanding-window implementation, λ = 129,600, applied to monthly annualized inflation. The August core and headline figures use the published index levels, so the August trend of 2.54% replaces the 2.55% estimate in last month's report and the August three-month and six-month core rates are restated to 1.97% and 2.57% from 2.01% and 2.59%. Core services outside housing is Macrobond series uspric6189 (services less energy services and shelter, seasonally adjusted index); shelter is uspric2170. Cleveland Fed median and trimmed-mean CPI are Macrobond series uspric0015 and uspric0013; Dallas Fed trimmed mean PCE is uspric0050. Average hourly earnings are uslama0001 and uslama0218, and real earnings are our calculation from those series and the CPI. The five-year, five-year forward breakeven is usbkeven5f5.
Sources: U.S. Bureau of Labor Statistics, Consumer Price Index and Real Earnings, September 2026, and Employment Situation, September 2026; Federal Reserve Bank of Cleveland, median and 16% trimmed-mean CPI; Federal Reserve Bank of Dallas, trimmed mean PCE; Federal Reserve Bank of New York, Survey of Consumer Expectations, September 2026; University of Michigan, Surveys of Consumers, preliminary October 2026; Macrobond; Piedmont Crescent Capital calculations. Macrobond series used are listed in the computation notes above.
Disclaimer: This report is provided for informational purposes only and does not constitute investment, legal, tax, or accounting advice, nor an offer or solicitation to buy or sell any security. Information is drawn from sources believed to be reliable, including the U.S. Bureau of Labor Statistics and the Federal Reserve Banks of Cleveland, Dallas, New York and St. Louis, but its accuracy and completeness are not guaranteed. Views expressed are those of the author as of the date of publication and are subject to change without notice. Past performance is not indicative of future results.