
Higher Borrowing Costs and Elevated Selling Prices Pull Small Business Optimism Back Below Its Average
Our latest Economic Indicator Report covers the September NFIB Small Business Optimism Index, hiring plans and openings, selling prices and price plans, borrowing costs, sales and profits, and what the survey means for the Fed, with a look ahead to Wednesday’s September CPI.
EARLY SIGNAL
Optimism slipped to 97.9, 0.8 point lower and just under the 52-year average of 98.0 after two months above it. Six of the ten components fell, three rose and one held flat.
Borrowing costs are rising. A net 8% of owners paid a higher rate on their latest loan, the most since June 2025, and the average short-term rate climbed 0.7 point to 8.2%.
Selling prices held at a net 31% and price plans rose to a net 31%. Both sit well above their long-run averages of 14% and 22%, and inflation moved up to the second-ranked problem at 20%.
The outlook weakened for a second month. Expected business conditions fell to a net 6%, and only 7% of owners called it a good time to expand, down 5 points.
Hiring plans held at a net 17%, but actual hiring cooled. The share hiring or trying to hire fell 5 points to 51%, and a net 7% of owners cut employment.
Sales and earnings remain the weak spot. A net negative 8% reported higher sales and a net negative 20% reported better earnings, so owners are absorbing higher costs without the sales to cover them.
A SMALL DECLINE WITH A WEAKER OUTLOOK UNDERNEATH
The Small Business Optimism Index slipped 0.8 point to 97.9 in September, dropping below its 52-year average of 98.0 for the first time since June. It is the second consecutive decline from July’s 99.8, the highest reading since August 2025, and it leaves the index 0.9 point below a year ago. Three of the ten components rose, six fell and one held flat.
The damage came from the forward-looking questions. Expected business conditions fell 4 points to a net 6% and the share saying it is a good time to expand fell 5 points to 7%, which together account for most of the decline. Capital outlay plans and job openings each slipped, while expected real sales volume and both inventory measures improved, so the survey is mixed rather than weak across the board. The Uncertainty Index rose 1 point to 90, well above its norm near 68, though 10 points below a year ago.
Timing matters for reading this survey. NFIB collects responses through the month, so September captures the Fed’s September 16 increase to 3.75–4.00% but none of the October Gulf headlines. Those will show up in the October survey, due November 10, a week after the midterm elections. With 411 usable responses and a response rate of 8.2%, a move of less than 1 point is within the noise, and the components carry more information than the headline.
PLANS ARE HOLDING UP, HIRING IS NOT
Hiring plans held at a net 17%, unchanged from August and 6 points above their long-run average of 11%. Actual hiring is not following. The share of owners hiring or trying to hire fell 5 points to 51%, a net 7% of owners cut employment over the past three months, and the Employment Index fell 1.2 points to 100.6, below its 2025 average of 101.2.
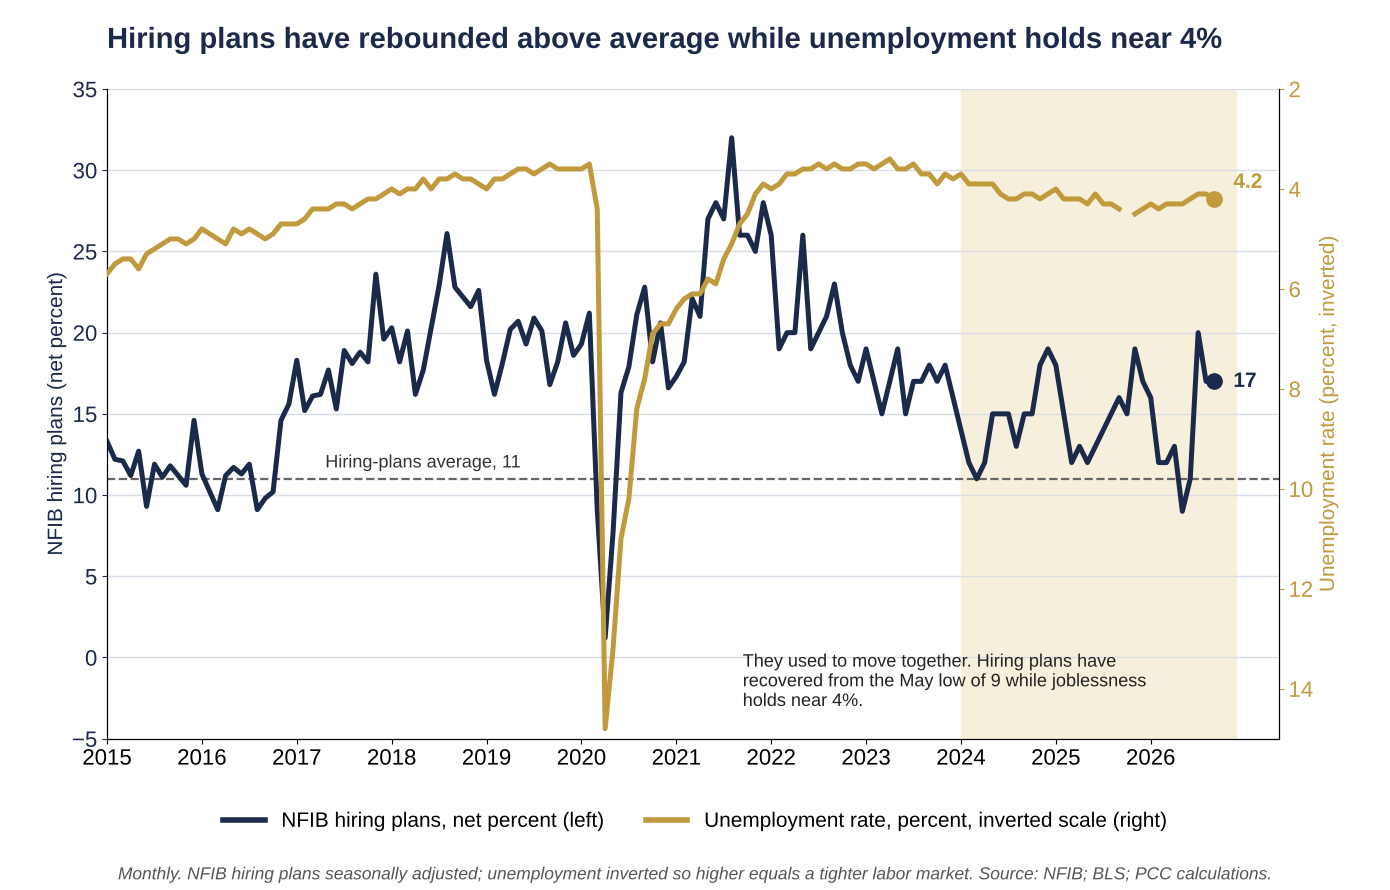
Chart 1. NFIB hiring plans and the unemployment rate, monthly, 2015 to September 2026.
This is the low-hire, low-fire pattern we have described all year. Plans have recovered from the May low of 9%, but payrolls have not followed. July plans of a net 20% were the strongest since October 2022, yet first-reported payrolls fell 23,000 that month, and September payrolls rose just 29,000 against an expected gain of about 90,000. Unemployment is 4.2%, close to where it was before hiring plans collapsed in the spring.
Part of the gap is supply. Of the owners trying to hire, 87% found few or no qualified applicants, and 32% had openings they could not fill, 8 points above the historical average. Labor quality or availability is the top problem for a third consecutive month at 26%, 14 points above its average of 12%. In the May report, labor cost had reached a record 14% and labor quality had fallen to 13%. Labor cost is now down to 6%, the lowest since December 2020, so the binding constraint has swung back from the cost of workers to finding them. Compensation is cooling slowly: a net 28% of owners raised pay, down 3 points, and a net 20% plan to, up 2 points, with both measures above their historical averages.
PRICING POWER REMAINS ELEVATED
A net 31% of owners raised average selling prices in September, unchanged from August and up from 24% a year ago, against a long-run average of 14%. Planned increases rose 3 points to a net 31%, well above the 22% average. The pressure looks cost driven. Among owners reporting lower profits, 24% cited rising material costs, up 8 points from August, and inflation is now the second-ranked problem at 20%, against 14% a year ago and an average of 7%. Higher prices are hitting small businesses in a variety of ways, increasing shipping costs and the cost of delivering goods or providing services.
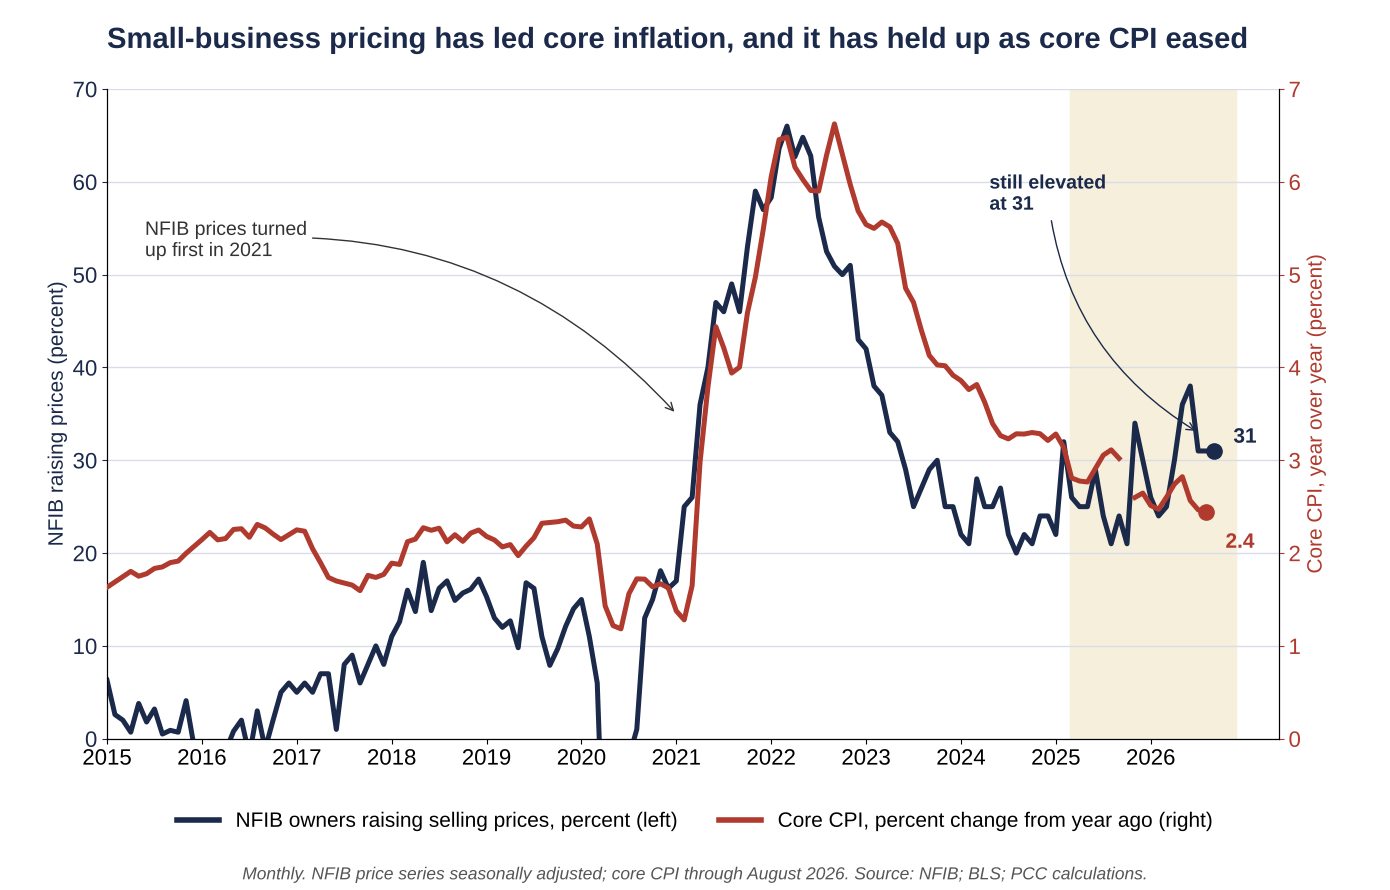
Chart 2. NFIB owners raising selling prices and core CPI, monthly, 2015 to September 2026.
NFIB selling prices turned up ahead of the 2021–22 core CPI surge and led the decline that followed. They have not followed core CPI lower this year. Core CPI has eased to 2.4% in August from 2.7% in April, while the NFIB series has held between 31% and 38% since May. With sales and earnings negative, owners appear to be raising prices to protect margins against material and borrowing costs rather than because demand is strong.
September CPI arrives Wednesday at 8:30 a.m., with the consensus near 3.6% for the headline and 2.5% for core, up from 3.4% and 2.4% in August. Monthly gains of about 0.6% and 0.2% are expected. A core gain above 0.2% would confirm what NFIB price plans are already indicating.
THE FED’S INCREASE REACHES MAIN STREET
The Fed raised its policy rate to 3.75–4.00% on September 16, and small borrowers noticed. A net 8% of owners paid a higher rate on their latest loan, up 4 points and the most since June 2025, and the average rate on short-term loans rose 0.7 point to 8.2%. That is still below the 8.8% of a year ago and close to the long-run average of 8.3%, so borrowing costs are near normal for this survey. Only 22% of owners borrow regularly, against a historical average of 34%, which limits how many are exposed. Expected credit conditions slipped 1 point to a net negative 3%, meaning owners on balance expect credit to tighten.
Investment plans are already responding. Capital outlay plans fell to 22%, down 2 points from August and 3 points from July’s 25%, and 51% of owners made outlays in the past six months, down 2 points. Equipment purchases were reported by 32% of owners against 42% a year ago. Plans on Main Street are modest beside the roughly $725 billion the hyperscalers plan to spend in 2026, which is the K-shaped side of the capital-led expansion we have described.
WEAK SALES LEAVE LITTLE ROOM TO ABSORB HIGHER COSTS
Owners ranked their problems in a familiar order. Labor quality leads at 26%, inflation is second at 20%, and taxes and poor sales are tied at 11%. Taxes fell 5 points to their lowest since December 2022, while poor sales has risen three months in a row.
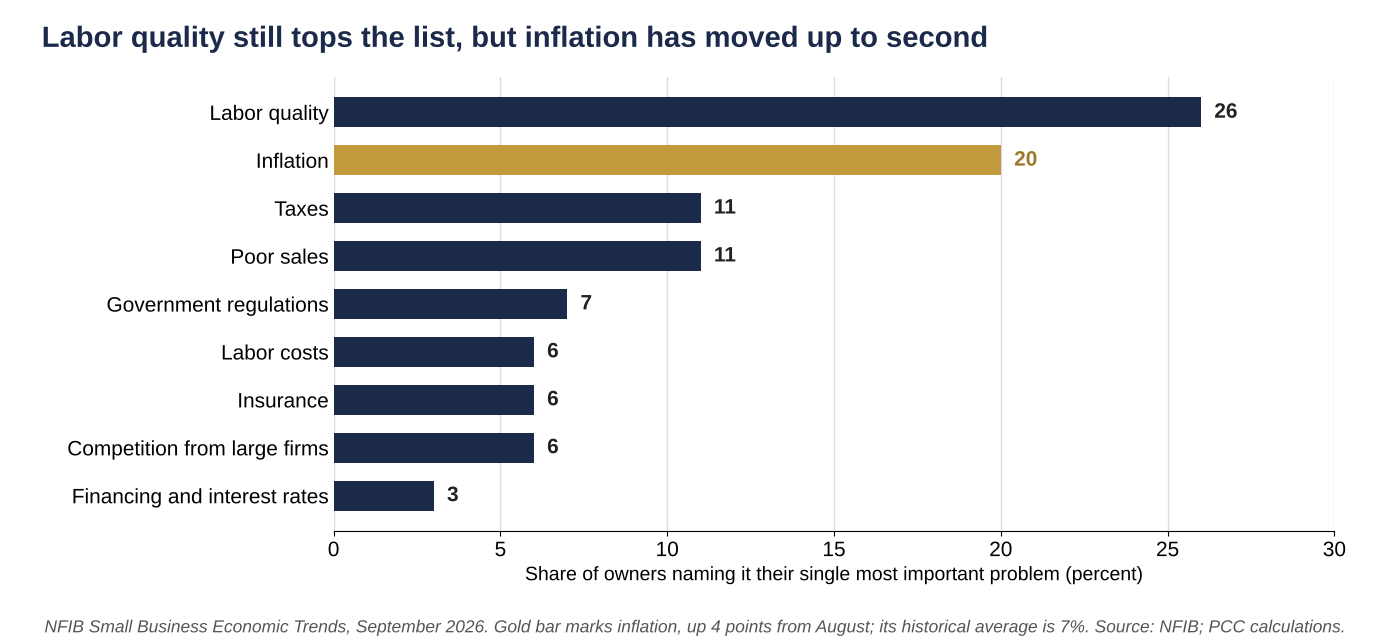
Chart 3. Single most important problem facing small business owners, September 2026.
A net negative 8% of owners reported higher nominal sales over the past three months, up 1 point from August, and a net 9% expect higher real sales volumes, up 3 points. Earnings trends were a net negative 20%. Among owners reporting lower profits, 34% blamed weaker sales, up 6 points. Owners’ view of their own health slipped as well. A total of 61% rated their business excellent or good, down from 68% in August, while 35% called it fair, up 7 points.
Households are sending a similar message. The University of Michigan sentiment index fell 1.8 points to 46.3 in October, with current conditions down 6.2 points to 44.7, as we noted last Friday. NFIB’s own commentary expects consumer spending and the AI boom to keep growth healthy, and names the midterm elections and the Iran war as the major uncertainties. Consumer spending has held up so far, which is why we describe this as a slowdown in confidence rather than a contraction.
WHAT IT MEANS FOR THE FED
The September survey gives the Fed little reason to hurry and none to ease. Price pressure on Main Street is steady, borrowing costs are rising, and hiring plans are holding up even as headcounts slip. Wednesday’s CPI and the October 28 decision both arrive before the next NFIB reading on November 10, so the price series is a check on the December call rather than an input to October.
OUR CALL
A hold in October and a second increase in December; small business gives the Fed no reason to ease.
We hold our forecast for real consumer spending growth of 2.3% in 2026 and 2.0% in 2027, and we leave the Fed call unchanged: a hold at the October 27–28 meeting, a second quarter-point increase on December 9 to 4.00–4.25%, and at least one more in 2027. Price plans at a net 31% and rising borrowing costs fit that path. Wednesday’s CPI is the first test. Core at or above 0.3% would support pricing in the December increase, and core at or below 0.2% would suggest NFIB price plans overstate the pressure on final prices.
BOTTOM LINE
The September NFIB survey is a modest step back, and the details are softer than the 0.8 point decline in the headline. Outlook measures fell, borrowing costs rose and selling prices remain far above their historical average, while hiring plans held. Together with the 46.3 Michigan reading and the 29,000 September payroll gain, the survey describes a slowdown in confidence that has not yet become a break in hiring. We would change our view if net hiring plans fell toward their 11% average while the Uncertainty Index stayed near 90.
WHAT WE ARE WATCHING
September CPI, Wednesday: Headline CPI is expected to climb 0.6% and the critical question is whether the core meets the consensus around 0.2% on the month after another reading of net 31% price plans. We feel there is upside risk to both the headline and core numbers.
NFIB price plans and selling prices: Whether the net 31% readings ease in October, the first sign that small business pricing power is fading.
Borrowing costs: Whether the net 8% paying higher rates and the 8.2% average short-term rate keep climbing after the September 16 increase.
Hiring plans and openings: Whether the net 17% hiring plans turn into actual hiring, or fall toward the 11% average as openings drift lower.
The outlook questions: Whether expected business conditions and the good-time-to-expand reading stabilize or keep falling in the October survey, due November 10.
SOURCES AND NOTES
Sources: NFIB Research Center, Small Business Economic Trends, September 2026 (released October 13, 2026) and prior issues; University of Michigan, Surveys of Consumers, preliminary October 2026; U.S. Bureau of Labor Statistics, Employment Situation, September 2026, and core CPI; investingLive, consensus forecasts; Piedmont Crescent Capital, Consumer Sentiment Report (October 9, 2026). Historical series and chart calculations by Piedmont Crescent Capital.
Disclaimer: This publication has been prepared for informational purposes only and is not intended as a recommendation, offer, or solicitation with respect to the purchase or sale of any security or other financial product, nor does it constitute investment advice. Views are those of the author as of the date of publication and are subject to change.
© 2026 Piedmont Crescent Capital, LLC. All rights reserved.