
Seven Engines, and Not One of Them Is the Consumer
A View from the Piedmont — Weekly Commentary on Money, Credit, and Exchange Rates
Households cracked, firms surged, and the long end rose on a week the Fed odds fell.
Key Points
- The household data weakened while the business data strengthened. Retail sales fell 0.6% against consensus of plus 0.1% and the control group 0.5% against plus 0.3%. Michigan sentiment printed 51.0 against 55.2 in July and a consensus near 55. On the other side, NFIB optimism rose 2.4 points to an eleven-month high and hiring plans jumped 9 points to net 20%, the highest since October 2022.
- The wedge between them is energy, and it works as a tax rather than as an inflation problem. Gasoline is up 24.6% on the year and energy 14.7%, while core CPI printed 2.5%, the slowest since March 2021. Only eight percent of consumers expect their income to outpace inflation over the year ahead, against 18% in December 2024.
- Every growth program we track is a capital program. The seven are the AI buildout, electrification, reshoring, defense replenishment, aerospace and space, Peak 65 as a drag on labor supply and a driver of longevity and travel spending, and the pharmaceutical buildout, which is being driven by demographics, technology breakthroughs and onshoring initiatives. Seven engines pressing on physical bottlenecks, and the consumer is not one of them. That is why the economy can carry a 4.3% nowcast for the current quarter with consumer sentiment at 51.
- Atlanta Fed GDPNow shows exactly that split. The third quarter early estimate fell from 5.8% to 4.3% in eight days. Consumption in the build went from 4.1% to 2.5%. Gross private domestic investment went from 17.9% to 15.2% and is still running at fifteen. Our forecast has consumption at 2.1% and calls for a more modest 2.7% rise in real GDP. The risk is to the upside, and it materializes when inventories snap back. Inventories subtracted 0.67 percentage points from second quarter growth.
- The front end priced the hike further out and the long end rose into it. September priced down from 44% to 31%, the two-year fell 2 basis points, and the thirty-year real yield rose 4 basis points to exactly 3.00%. Of the 6 basis point rise in the thirty-year nominal, four were real and two were breakeven. That is a required-return move, not an inflation-expectations move.
- The thirty-year cleared at 5.216%, the highest auction yield since 2001. Demand arrived in normal size once it did. Indirect takedown was 66.8% against a 66.52% twelve-month average, once the yield repriced sixteen basis points cheaper than July.
- Dallas Fed researchers published an alternative trimmed mean, recalibrated on a 1967 sample with more symmetric trim points, reading 2.6% against the published 2.2%. Our one-sided HP trend reads 2.9% and core PCE reads 3.3%. Underlying inflation is still decelerating, with core PCE at 3.3% against a 2% target.
- Our call is unchanged. The next Fed move will likely be a hike, but no earlier than December and probably in January or later. We would stay cautious on duration.
Market Dashboard
Levels are official closes for Friday, August 14. Treasury yields are the published constant-maturity series.
| Indicator | Level | This Week |
|---|---|---|
| Fed funds target | 3.50-3.75% | Fifth consecutive hold. Three dissents to hike on July 29 |
| September hike odds | 31% | Down from 44% on August 7, on three soft prints |
| October, December, January hike odds | 47%, 64%, 67% | Cumulative. No cut priced at any meeting through January 2027 |
| 3-month bill | 3.86% | Down 1 bp |
| 2-year Treasury | 4.17% | Down 2 bp |
| 10-year Treasury | 4.68% | Up 3 bp |
| 30-year Treasury | 5.25% | Up 6 bp. Four of the six were real |
| 30-year TIPS real yield | 3.00% | Up 4 bp. It has not left 2.96 to 3.00 all month |
| 30-year breakeven | 2.25% | Up 2 bp. Still at target |
| 2s-30s | 108 bp | Twist steepener. The two-year fell and the thirty-year rose. 2s-10s widened to 51 bp |
| 30-year auction | 5.216% | Highest thirty-year auction yield since 2001 |
| S&P 500 | 7,785.76 | Up 0.36%, a third straight weekly gain. Record close Thursday at 7,798.99 |
| Nasdaq Composite | 26,729.16 | Up 0.14%. Memory and storage led everything |
| Russell 2000 | 3,068.42 | Up 1.12% to a record close |
| VIX | 14.25 | Down 0.65. Touched its lowest intraday reading since December |
| WTI crude | $82.40 | Up 5.4% on the week |
| Brent crude | $88.49 | Up 5.9%. The strait has been shut since February 28 |
| Gold | $4,432 | Up 0.6% |
| US dollar (DXY) | 99.64 | Unchanged on the week |
| Retail gasoline | $4.006 / gal | EIA survey August 10, down 7.3 cents, taken before the crude rally |
| Retail diesel | $5.257 / gal | Down 9.1 cents on the survey and up $1.55 on the year |
| 30-year fixed mortgage | 6.67% | Freddie Mac, week ended August 13 |
| Investment grade OAS | 79 bp | Up 1 bp through Thursday. Nineteen issuers priced Monday alone |
| High yield OAS | 271 bp | Up 1 bp. No credit event in this week’s long-end move |
This Past Week’s Central Thesis
For two weeks we have argued that the economy is stronger than the headline data look and that the Fed is more likely to tighten than ease. This week complicates that assessment. The complication is not a weaker economy dragged down by a weaker consumer, but a different economy from the one most forecasts describe.
The household data broke. Retail sales fell 0.6% against consensus of plus 0.1%, the largest monthly drop in more than a year, and the control group that feeds GDP fell 0.5% against plus 0.3%, its worst month since January 2025. Preliminary Michigan sentiment came in at 51.0 against 55.2 in July and a consensus near 55. Tom Barkin noted in Greenville on Thursday that the survey has now printed its three lowest monthly readings in more than seventy years.
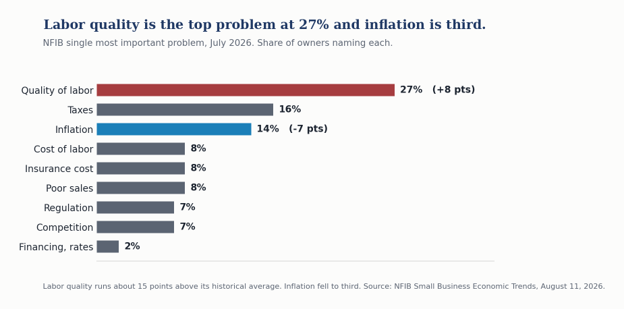
The business data did the opposite and did so emphatically. NFIB small business optimism rose 2.4 points to 99.8, an eleven-month high and above its fifty-two year average. Plans to increase employment rose 9 points to a net 20%, the highest reading since October 2022. Job openings hard to fill rose to 36%, the highest since June 2025. Quality of labor went back to the top of the single most important problem list at 27%, up 8 points, while inflation fell 7 points to third place. Nineteen investment grade issuers priced on Monday alone, the most in seven months.
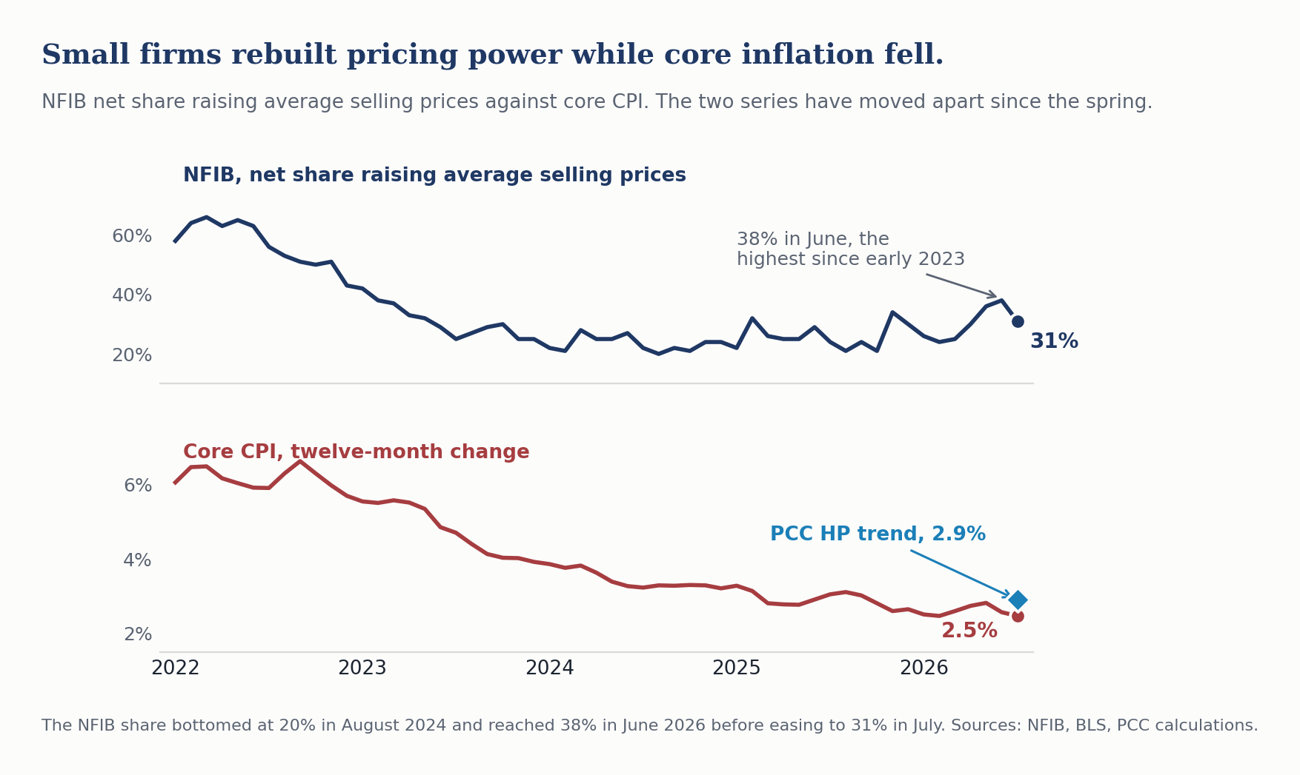
The price side of that survey has tracked this cycle better than the CPI has. The net share of small firms raising average selling prices bottomed at 20% in August 2024, climbed to 38% in June and eased to 31% in July. Core CPI over the same stretch fell from 3.3% to 2.5%. Those two series moved together on the way up in 2021 and on the way down through 2023, and they have been moving apart since the spring. Firms have been rebuilding pricing power for two years while the published index has been falling. Our HP trend at 2.9% sits between them, which is roughly where a measure that reflects what firms are actually doing ought to sit.
Both of those are true, and the wedge between them has a name. Gasoline is up 24.6% over the year, energy 14.7%, and retail diesel is a dollar and a half above where it was last August. Those are a tax on real income, and the tax lands on households rather than on firms. The Boston Fed published work in June finding that a 33% oil shock now raises PCE inflation about 1.5 percentage points against 2.2 historically, while the employment effect that ran negative 1.8 points in the 1970s is essentially nil today. Households absorb that shock through real income and tell the survey about it, while firms absorb it as an input cost and keep hiring.
Which brings us to the point we believe matters the most for anyone building a 2027 plan. Every growth program we have been tracking is a capital program. The seven are the artificial intelligence buildout, electrification, reshoring and the manufacturing reorientation, defense replenishment, the aerospace and space reboot, and Peak 65, which is simultaneously restraining labor force growth and driving a retiree economy in which free-spending retirees are buying longevity, from GLP-1s and joint replacements to functional and sports medicine, along with travel and leisure. This week we move pharmaceutical and biomanufacturing growth out of reshoring and into its own spot, driven by demographics, technology gains and onshoring. Seven engines, every one of them business or government capital spending pressing on a physical bottleneck. The consumer is not among them.
That is why the expansion carries a 4.3% nowcast against consumer sentiment at 51, and why we are less alarmed by one bad retail sales print than the coverage suggests we should be and less comfortable with the NFIB print than that number invites. An economy running on seven capital programs and a soft consumer is not fragile, however unfamiliar it looks against prior cycles.
Our positioning is unchanged. We continue to think the next Fed move is a hike rather than a cut, we look for it in January, December is certainly possible, and we stay cautious on duration.
This Week in Three Observations
1. The consumer supplied two thirds of the markdown in the nowcast.
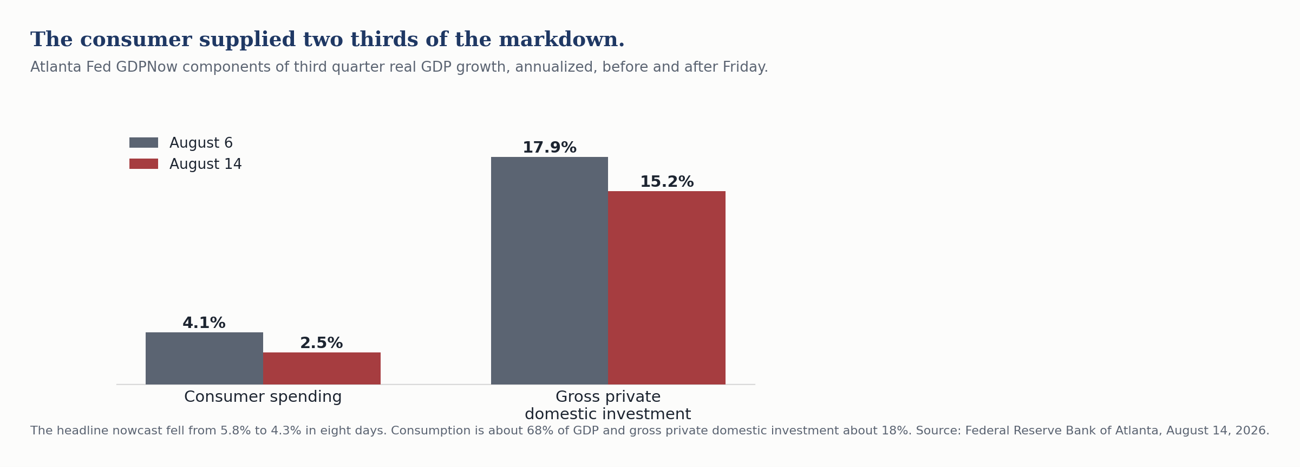
Atlanta Fed GDPNow cut its third quarter estimate from 5.8% on August 6 to 4.3% on Friday, a point and a half in eight days. The Atlanta Fed’s own commentary names the source. Consumption in the build fell from 4.1% to 2.5% and supplied about two thirds of the markdown. Gross private domestic investment fell from 17.9% to 15.2% and supplied most of the rest.
The Atlanta Fed’s estimate is still early. We are halfway through the third quarter and have partial data for only the first month of it. Last week we noted that trade-deficit arithmetic was inflating the Atlanta Fed’s 5.8% estimate, and this week’s markdown is not evidence for that argument. Net exports are not mentioned in the Atlanta Fed’s revision note at all. The distortion, if it is there, now sits inside a gross private domestic investment nowcast still running above fifteen percent, which we do not believe survives a full quarter.
Motor vehicles fell 1.8% after rising 1.9%, and nonstore retail fell 2.2%, which is the line that should get attention because online spending has been the reliable part of this cycle. Gasoline stations fell 0.9%, but that is a price effect from the early July dip rather than a volume effect, so the nominal drag overstates the weakness. Food services and drinking places rose 0.5%. Health and personal care rose 0.7%. Building materials rose 0.3%. Households stopped buying cars and stopped buying online, and the rest of the report held up.
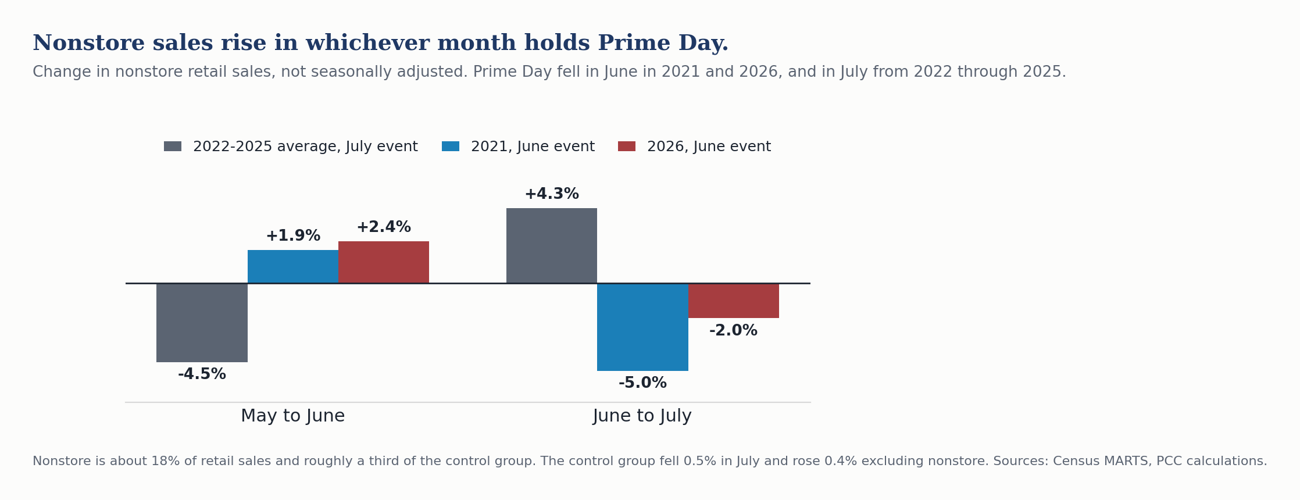
And the online line has a calendar explanation that the seasonal factors do not capture. Prime Day fell in July in every year from 2015 through 2025 except 2020 and 2021. In 2026 it moved to June 23 through 26. Census adjusts for trading days and for Easter, Labor Day and Thanksgiving. It publishes no promotional-event regressor, so an event that moves between months lands in the seasonally adjusted data as a swing rather than as a shift.
The evidence is at both ends of the move, and it is cleanest in the unadjusted data. In the four most recent years when the event fell in July, 2022 through 2025, unadjusted nonstore sales fell 4.5% from May to June and rose 4.3% from June to July. In 2021, when the event fell in June, they rose 1.9% and then fell 5.0%. In 2026 they rose 2.4% and then fell 2.0%. Nonstore is about 18% of retail sales and roughly a third of the control group, which is why a five-point swing there is worth close to a point on the headline.
Run the arithmetic and the July report reads differently. The control group fell 0.5%, and rose 0.4% excluding nonstore. Brick and mortar control spending went up. We would still call the quarter softer than the second, and we would not build a consumer break out of a month whose weakest line moved because the promotional calendar did.
2. Small firms went back to worrying about workers rather than prices.
The NFIB report runs directly against the weak July payroll headline. Hiring plans at net 20% is the highest since October 2022. Openings hard to fill at 36% is the highest since June 2025. Capital outlay plans rose 5 points to 25%. Good time to expand rose 4 points.
The price side moved the other way. The net share raising average selling prices fell 7 points to 31%, and the share planning increases fell 4 points to 28%. Inflation dropped 7 points to third place on the single most important problem list, behind labor quality and taxes.
Read together, the small business sector is describing an economy with more labor demand and less pricing power than it had in June. That configuration is better for margins than for the inflation outlook, and worse still for anyone forecasting the labor market off the establishment survey alone.
3. Hike odds fell all week and the long end rose anyway.
Last week we wrote that the long end declined to participate in a bond-bullish surprise. This week is the cleaner version of the same test, because this time the front end actually moved.
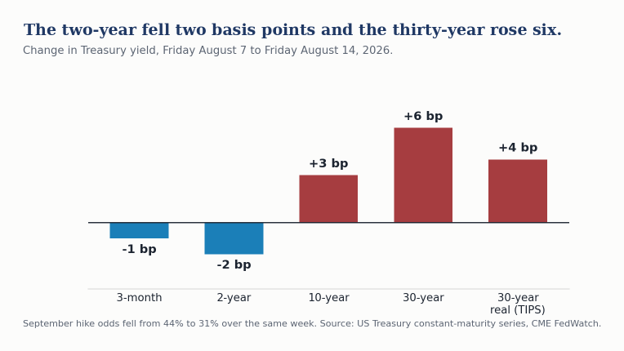
The Fed strip repriced meaningfully easier. September hike odds fell from 44% to 31% across three soft prints. The three-month bill fell a basis point and the two-year fell two, which is exactly what a cycle-driven front end should do. And the thirty-year real yield rose four basis points anyway, to exactly 3.00%.
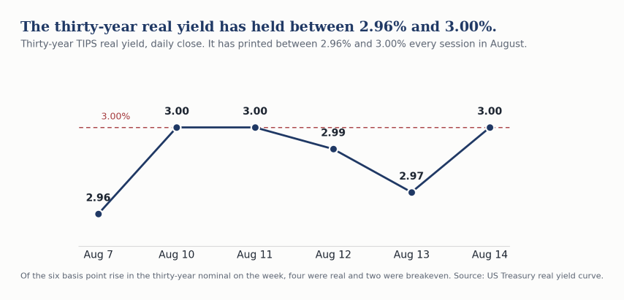
Of the six basis point rise in the nominal yield, four were real and two were breakeven. This was not the market marking up inflation expectations. It was the market raising the real return it requires to hold thirty-year money, in a week when the business cycle argued for the opposite. The thirty-year real yield has closed between 2.96% and 3.00% every session in August.
Thursday’s auction is where it happened. The Treasury sold $25 billion of new thirty-year bonds at 5.216%, the highest thirty-year auction yield since 2001. We would resist the version of this story now circulating, which is that indirect takedown collapsed. It did not. Indirects came in at 66.8% against a 66.52% twelve-month average and dealers took 11.5% against a 10.94% average. The 10.9 point drop now circulating is measured against a July 9 auction that was unusually strong. Demand showed up in normal size. It showed up only after the yield repriced sixteen basis points cheaper than July. That is a price story, not a failed auction.
Two supporting facts. The ten-year drew 76.7% indirect takedown against a 71.78% average, so foreign demand for intermediate duration is not the problem. And Wednesday’s Treasury statement put the July deficit at a record $432.2 billion, up 48% on the year, with the fiscal year to date at $1.799 trillion, already above all of fiscal 2025 with two months to run. Customs receipts were negative $8.55 billion after $33.38 billion of tariff refunds, the third consecutive month of outflows. The supply side of the term premium argument is not abstract.
Behind the Numbers
Core inflation printed its slowest since March 2021 while core PCE ran a full point higher. Headline CPI rose 0.1% in July and 3.4% on the year. Core rose 0.2% and 2.5%, both exactly in line.
Core PCE is running roughly eighty basis points above core CPI, a reversal of the usual gap. In June, the last month with both actuals, core PCE ran 3.3% against core CPI at 2.6%, a gap of about seventy basis points. The Cleveland Fed nowcasts July core PCE at 3.29% against a core CPI that printed 2.5%, which widens it to roughly eighty. PCE has historically run thirty to forty basis points below CPI, so this is a reversal rather than a widening of the usual relationship. Shelter carries about 35% of the CPI and roughly 16% of the PCE, PCE is chain weighted and allows substitution, and health care and financial services carry more weight in PCE. Whatever the cause, PCE is the target variable and it is the one running above three. Anyone leading with core CPI at a four-year low without reconciling the Fed’s own measure is writing something misleading.
The shelter line is being misread across the coverage. Shelter rose 0.1% on the month, which is being taken as rent disinflation. Owners’ equivalent rent rose 0.26% unrounded and rent of primary residence 0.26%, both essentially unchanged from their recent pace. The soft aggregate came from lodging away from home, which fell 2.8%. Owners’ equivalent rent and primary rent together carry about 96% of the shelter index and lodging carries under 4%, which leaves an unrounded shelter print of 0.14% and a published 0.1%. Lodging prices gave back the World Cup premium, and that giveback is what restrained the shelter aggregate.
Thursday’s PPI was soft on the headline and firm where it matters. Final demand was unchanged against consensus of plus 0.2%, and more than half the decline in final demand goods came from a 5.7% drop in gasoline. But final demand less food, energy and trade services rose 0.4%, and portfolio management rose 6.5%, the largest in more than a year. That component feeds directly into core PCE on August 26 and does not appear in the CPI at all. Trade services margins fell 0.14%, which says importers are still absorbing tariff costs rather than passing them through.
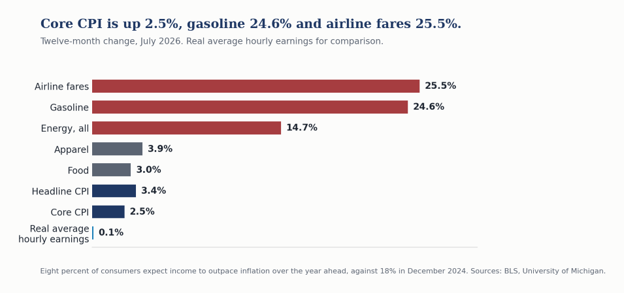
What a household actually faces looks nothing like a 2.5% core. Airline fares are up 25.5% over the year and gasoline 24.6%. Energy overall is up 14.7%. Real average hourly earnings are up one tenth of one percent. Michigan has one-year inflation expectations at 4.3% and, importantly, five-to-ten-year expectations at 3.3% for a third consecutive month. That last figure is the one the Committee will look at, and it did not break higher even with gasoline up a quarter on the year.
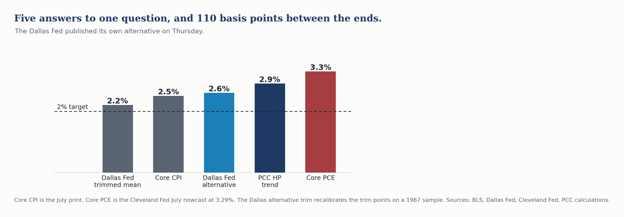
The Dallas Fed came partway to our position on Thursday. Its own researchers published an alternative trimmed mean PCE recalibrated on a 1967 to 2009 sample rather than 1977 to 2009, producing more symmetric trim points that capture surges better when the price change distribution is positively skewed. Their alternative reads 2.6% for the twelve months through June against their published measure at 2.2%. They also concede that the original measure was much slower to accelerate than core or headline in 2021, not reaching 3% until November while core and headline crossed in April, which is the asymmetry we described last week, conceded by the people who build the index.
Our one-sided HP trend reads 2.9%, above their alternative and well above their headline. Core PCE reads 3.3%. Five measures of the same thing span 110 basis points. We still feel it is best to view our HP filter alongside the Cleveland median and the Dallas trimmed mean rather than in place of them, and we will now add the Dallas alternative to that panel.
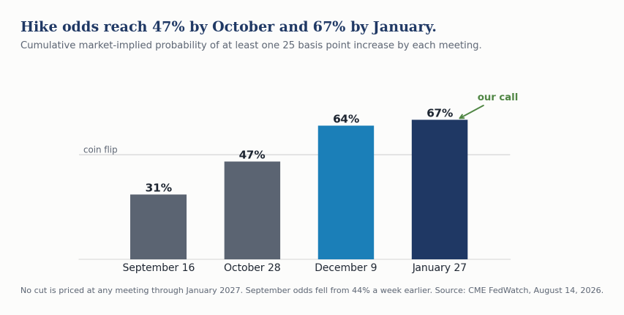
The Fed pricing moved the hike later without pricing it away. September fell to 31%. But cumulative odds of at least one increase reach 47% by October, 64% by December and 67% by January, and no cut is priced at any meeting through January 2027. The market has stopped arguing about direction and started arguing about date, and it has landed roughly where we have it.
Two Fed voices spoke and they were not saying the same thing. Beth Hammack told an interviewer on Monday that a single quarter point move probably does not do much and that it is likely some number of moves, and that at 3.50 to 3.75 policy is not meaningfully restricting activity. We would counter that the most interest rate sensitive parts of the economy, housing and light vehicle sales, are stuck in low gear and medium gear respectively. Barkin, in Greenville on Thursday, attributed the rise in inflation to tariffs, an oil price shock and a flood of AI spending, noted that unemployment at 4.1% is the fifty-eighth consecutive month at or below 4.5%, and declined to signal September at all. The Fed is failing on its inflation objective and has largely succeeded on its employment objective. Unfortunately the unemployment rate does not provide an adequate assessment of the strength of the labor market. Long-term unemployment is still elevated, which suggests a persistent skills mismatch.
The labor market did not deteriorate this week. Initial claims were 209,000 for the week ended August 8 and continuing claims fell to 1,777,000, with the insured unemployment rate at 1.2%. Nothing in the claims data corroborates the July payroll print.
And the benchmark revision is now two weeks out. The preliminary estimate publishes Friday, August 28, three weeks before the FOMC. Published work puts the QCEW data roughly 230,000 above the payroll survey through December 2025, the first nine months of the benchmark period. One estimate we have seen puts the revision at plus 340,000. The last two cycles conditioned everyone to expect a large negative, and the prior preliminary was negative 911,000. We would rather be early on this than consensus.
Bottom Line
The economy is running on seven capital programs and a soft but resilient consumer. That is not a fragile configuration, and it is not the configuration most forecasts are built on. One month of retail sales is not a break, and the Michigan survey has been a poor predictor of spending for four years. But this is the first week the hard data came in with the soft data, and the mechanism is an energy shock running through real income.
For the Fed, August 26 and August 28 matter more than September 16 does right now. Core PCE carries Thursday’s portfolio management jump, and the benchmark revision lands three weeks before the meeting. We look for no cut in 2026 and the first hike in January, with December certainly possible.
For portfolios, this was a cleaner week for duration caution than last week was. Hike odds fell thirteen points, the front end rallied, and the thirty-year real yield rose to exactly 3%. If a soft consumer and a dovish repricing cannot pull the long end down, we would not expect the September meeting to either. The thirty-year comes down when the interconnection queue shortens, not when the front end rallies.
CFO & Corporate Treasurers Corner
Six things that changed this week for anyone who funds a balance sheet or manages cash.
The long-end entry point got worse again, and the pattern is now three weeks old. The thirty-year rose 6 basis points and the thirty-year real yield 4, while the two-year fell 2 and September hike odds fell thirteen points. 2s-30s widened to 108 basis points. Anyone waiting for a soft patch to bring long money down has now watched the long end rise in each of the last two weeks, on exactly the soft patch that was supposed to bring it down. The curve is telling you the price of thirty-year money is set somewhere other than the business cycle.
But the issuance window is open, and it was busy. Nineteen investment grade issuers priced this past Monday, the most in seven months, against roughly $80 billion the prior week and $1.4 trillion year to date, running 9% ahead of 2020’s pace. Investment grade spreads finished at 79 basis points and high yield at 271, each a basis point wider on the week. The long-end repricing was a duration event that never touched credit or funding. If you have paper to bring, the constraint is the base rate and not the spread.
Your reinvestment assumption is fine this month and will not be next. The three-month bill closed at 3.86%, down a basis point. SOFR was unchanged at 3.62%, sitting on the target midpoint, and the ninety-ninth percentile compressed to 3.70%, its tightest of the month, straight through a $125 billion refunding. Money fund assets rose $18 billion to $7.93 trillion. Nothing here is under stress. But cumulative hike odds reach 47% by October, so a treasury forecast that assumes today’s front end through the fourth quarter is a one-sided bet.
Watch your fuel line, and do not be fooled by the survey date. Retail gasoline printed $4.006 and diesel $5.257 on the August 10 EIA survey, down 7.3 and 9.1 cents. Both surveys were taken before crude rallied more than five percent on the week. Diesel is a dollar and a half above last August. Data centers are also burning diesel, as energy demand has run up against a stressed grid this summer. The binding constraint is refining rather than crude, so a lower oil price will not by itself bring your fuel cost down. If you budget freight or fleet, assume the next survey reverses, with some relief later in the fall as temperatures cool.
Your consumer-facing revenue line and your labor line are pointing in opposite directions. Retail sales fell 0.6% and the control group 0.5%, though the control group rose 0.4% excluding nonstore, while small business hiring plans reached their highest since October 2022 and labor quality returned as the top problem. If you sell to households, plan for a softer second half than the GDP figures imply. If you hire, do not assume the July payroll print means the labor market loosened for you.
The tariff refunds are a balance sheet item, and someone is going to ask about them. July customs receipts were negative $8.55 billion after $33.38 billion in refunds, the third consecutive month of outflows, with roughly $100 billion of an initial $166 billion refunded through July. Companies are booking those refunds rather than passing them through, and the practice is drawing attention. Meanwhile the replacement authority took effect July 24, covering sixty economies and 99.4% of imports at 10 to 12.5%, and twenty-five states sued to block it on August 3. If your cost of goods assumes either the refund or the replacement is permanent, it needs a second scenario.
On the currency side, the dollar index closed at 99.64, unchanged on the week.
Piedmont Perspective
Seven Engines and No Driver
Something has changed in how this economy is put together, and July is the first month you can see it in the hard numbers instead of inferring it from the announcements.
For most of the postwar period, the American economy has been a consumption engine with an investment accelerator attached. Roughly seven dollars in ten went through the household, and the reliable way to forecast a recession was to forecast the consumer. Business investment amplified the cycle without setting it.
What we are looking at now is close to the inverse. Seven distinct capital programs are running at once, each of them pressing against a physical bottleneck rather than a financial one, and each of them largely indifferent to what a household does this quarter.
The artificial intelligence buildout is the largest and the most discussed. Electrification is the one that binds it, because a data center campus without an interconnection agreement is a land purchase. Reshoring and the manufacturing reorientation is running under a tariff structure that changed three times this year and is under litigation again. Defense replenishment has moved from supplemental appropriations to multiyear procurement, which changes the planning horizon for a supplier from months to a decade. The aerospace and space reboot is rebuilding a supply chain that was allowed to atrophy. Peak 65 removes people from the labor force on a schedule known years in advance. And this week we are adding the seventh, pharmaceutical and biomanufacturing onshoring, which now has a tariff schedule attached to it that runs to 2028.
Not one of those seven is a consumption program. They are all capital programs, and that is the whole difference. They respond to permitting, to interconnection queues, to skilled labor availability, to procurement calendars and to tariff schedules. They do not respond to consumer sentiment, and they respond to interest rates far less than a textbook would predict, because for most of them the binding constraint is not the cost of capital. It is transformers, turbines, electricians, environmental review and time.
That explains the week we just had better than any story about a weakening consumer does. Retail sales fell and sentiment collapsed while small business hiring plans reached their highest since October 2022 and gross private domestic investment in the GDP nowcast held above fifteen percent. Those are not contradictory readings of one economy but accurate readings of two.
It also explains why the long end will not come down. If the marginal dollar of demand for capital comes from programs that must be built regardless of the cycle, then a soft consumer does not free up capital. It does not even reduce the demand for it. The thirty-year real yield sat at 3.00% on Friday in a week when the front end rallied and hike odds fell thirteen points, and we would suggest the reason is sitting in the interconnection queue rather than in the business cycle.
Two risks to that argument.
A consumer weakening this fast eventually reaches the capital programs through demand. AI capacity is being built against expected revenue, and a household that stops buying online in July is a data point against that revenue. The Applied Materials margin guidance on Friday, which knocked five percent off the stock on an otherwise strong report, is the sort of thing that shows up first.
And politics can pause a capital program faster than economics can. County government across the South enacted more restrictions on data centers in the five days of this week than the states did all summer, and one Arkansas county imposed a moratorium running to 2031 with no project even proposed. None of it has stopped a project yet. It is a real constraint, however, and it does not appear in any forecast we have seen, including ours.
Neither risk changes the structure. For as long as these seven programs are running, the consumer is a passenger in this expansion rather than the driver, and reading the economy off the household data alone will produce the wrong answer in both directions.
The Week Ahead
Monday, Aug. 17. Empire State manufacturing for August, the first regional survey of the month and the first read on whether the ISM turn held.
Tuesday, Aug. 18. Housing starts and permits, industrial production and capacity utilization, and import and export prices, all for July. Manufacturing output is the one to watch against the ISM employment turn.
Wednesday, Aug. 19. Minutes of the July 28 and 29 FOMC meeting at 2:00 p.m. ET. The meeting produced three dissents in favor of an increase. The minutes will tell us how close September actually is, and whether the framework review came up.
Thursday, Aug. 20. Weekly jobless claims and the Philadelphia Fed manufacturing survey at 8:30 a.m. ET. Existing home sales for July and leading indicators at 10:00 a.m. ET.
Friday, Aug. 21. BLS State Employment and Unemployment for July at 10:00 a.m. ET, the first state-level look since the national print turned negative. Virginia is the one to watch, down 43,600 jobs on the year through June and the only state in our region losing jobs.
Wednesday, Aug. 26. July personal income and outlays, with the PCE deflator and core PCE. This carries Thursday’s 6.5% jump in portfolio management fees, which does not appear in the CPI at all. August 26 is the last major inflation print before the September meeting.
Friday, Aug. 28. The preliminary benchmark revision to the establishment survey, three weeks before the FOMC. Our call is that it comes in modest or positive against a market conditioned by two consecutive large negatives.
Sunday, Sept. 6. OPEC+ meets, having completed the rollback of the 1.65 million barrel a day voluntary cuts effective September.
US Economic and Financial Outlook
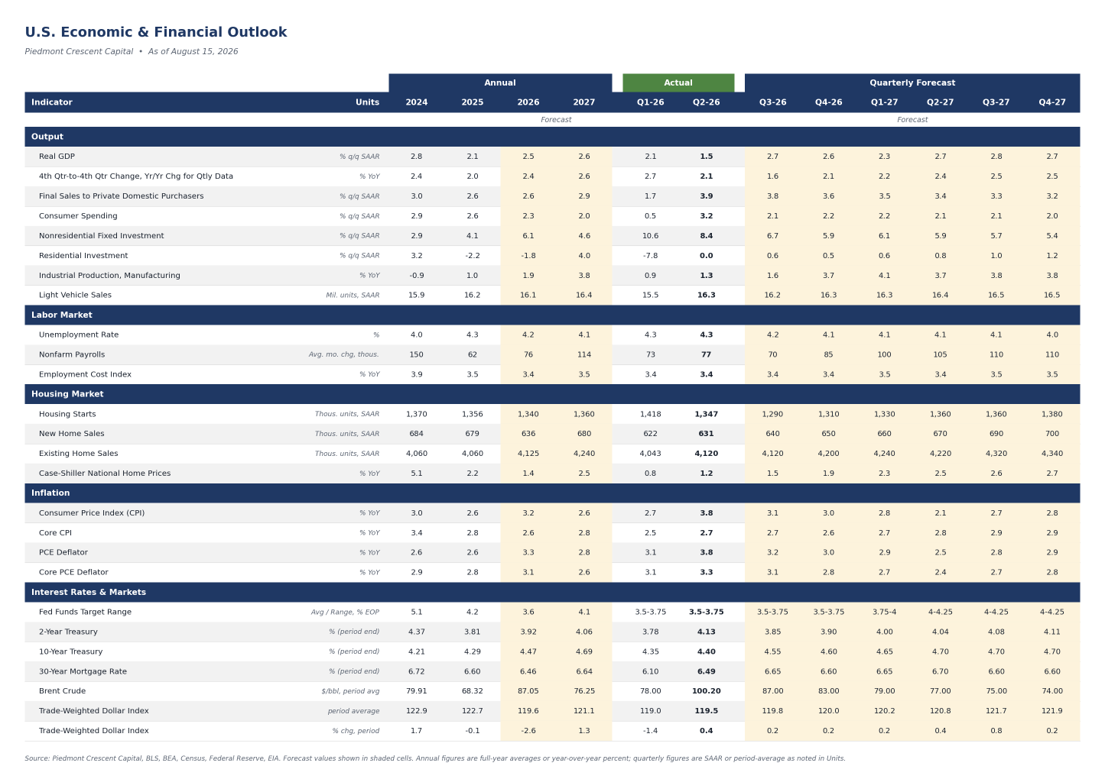
Our full forecast is below, updated this weekend. We look for real GDP growth of 2.5% this year and 2.6% next, with the current quarter at 2.7% and consumer spending at 2.1%. The year-end unemployment rate holds at 4.1% and payrolls average 70,000 a month in the third quarter and 85,000 in the fourth. The fed funds target holds its current 3.50 to 3.75% range through 2026 and steps to 3.75 to 4.00% in the first quarter of 2027, with a December move the principal risk to that call. We have marked housing starts down to 1.29 million in the third quarter.
Sources and Notes
Sources: Bureau of Labor Statistics; Bureau of Economic Analysis; Census Bureau; US Treasury; Department of Labor; Federal Reserve Board and CME FedWatch; NFIB; University of Michigan Surveys of Consumers; Institute for Supply Management; Freddie Mac; Energy Information Administration; ICE BofA indices; the Atlanta, Boston, Cleveland, Dallas and Richmond Federal Reserve Banks; Goldman Sachs; Oxford Economics; BlackRock Investment Institute; Bank of America; PGIM; PIMCO; Apollo; KKR; Capital Economics; TD Economics; Federal Reserve Bank of Philadelphia Survey of Professional Forecasters.
Notes and corrections: All market levels are official Friday, August 14 closes unless stated. Crude, Brent and gold are vendor quotes rather than exchange settlements, and credit spreads are through Thursday, August 13. Correcting last week’s issue: September hike odds on August 7 were 44%, not the 40% we published, and the QCEW to CES gap through December 2025 is about 230,000, not 200,000. Treasury yields are the published constant-maturity series and the thirty-year breakeven is derived from the nominal and real curves. Retail fuel prices are the Energy Information Administration Monday survey dated August 10 and were collected before the week’s crude rally. Payroll and retail figures are seasonally adjusted. Copyright 2026 Piedmont Crescent Capital.
Mark P. Vitner
President & Chief Economist, Piedmont Crescent Capital
mark.vitner@piedmontcrescentcapital.com · 704-458-4000
A View from the Piedmont is published weekly by Piedmont Crescent Capital for informational purposes only and does not constitute investment, legal, or tax advice. Views expressed are those of the author as of the date of publication and are subject to change.