
Retail Sales Report: June Borrowed From July, and July Paid It Back
Retail sales fell 0.6% in July as online receipts gave back the Prime Day surge that landed in June this year, but the control group excluding nonstore retailers rose 0.4% and nine of thirteen categories held their ground or advanced.
Early Signals
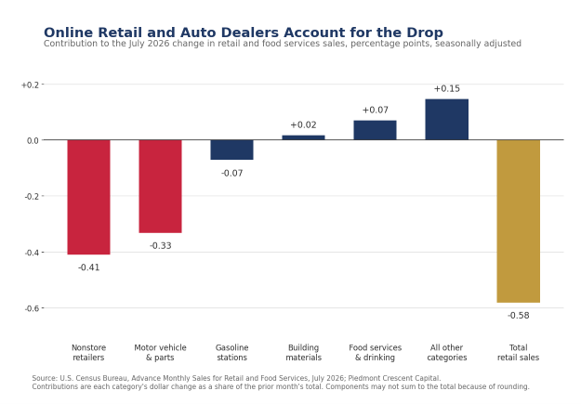
- Retail sales fell 0.6% in July, and just two categories account for more than all of the drop. Retail and food services sales slipped to $763.6 billion, seven-tenths below a consensus that looked for a 0.1% gain. Nonstore retailers fell 2.2% and subtracted 0.41 percentage points from the headline, while motor vehicle & parts dealers fell 1.8% and subtracted another 0.33 percentage points. Everything else, taken together, added 0.16 percentage points.
- Amazon moved its summer event out of July, and the seasonal factors did not move with it. Prime Day ran June 23-26 this year, after falling in July in every year since 2015 except 2020 and 2021. Census adjusts these data for trading days and for moving holidays such as Easter, Labor Day and Thanksgiving, but it publishes no promotional-event regressor, so a July without the promotion reads as weakness that is not there.
- The control group fell 0.5%, but excluding nonstore retailers it rose 0.4%. Nonstore retailers now make up 32.9% of the control group, which is the series that feeds the goods side of consumption in the national accounts. Strip out the one category the calendar moved and core spending advanced at a perfectly ordinary pace.
- The three-month pace still describes a consumer who is spending. Control-group sales rose at a 5.6% annual rate over the three months through July and are up 4.5% over the past year, or 3.7% after deflating by goods prices. A single advance estimate typically carries a large margin of error and gets revised; the three-month pace is the better number to act on.
- Restaurants and apparel both advanced, which is not what retrenchment looks like. Food services & drinking places rose 0.5% and are up 5.0% over the year. Clothing & accessories stores rose 1.9%, the strongest gain of any category, as back-to-school promotions began in the second half of the month, which is a little earlier than usual.
- Gasoline station sales fell by less than pump prices did. Sales at gasoline stations declined 0.9% while the average retail price of regular gasoline fell 2.9% over the month, which implies households bought more gallons rather than fewer. The gap is a transfer into the rest of the consumer budget.
Key Takeaways
| Key Concept | Findings |
|---|---|
| Headline retail sales | Down 0.6% in July to $763.6 billion, seven-tenths below a consensus of +0.1%. Up 5.0% over the past twelve months. |
| Retail control group | Down 0.5% on the month but up 5.6% at an annual rate over three months and 4.5% over the year. Excluding nonstore retailers, up 0.4%. |
| Nonstore retailers | Down 2.2%, the calendar effect of Prime Day moving from July to late June. Down 2.0% in unadjusted terms against a June-to-July norm of roughly +4% in recent years. |
| Motor vehicles | Down 1.8% as light vehicle unit sales eased to a 16.3 million annual rate from 16.6 million in June, a normal model-year changeover pattern. |
| Gasoline stations | Down 0.9% while pump prices fell 2.9%, implying higher volumes. Still up 16.2% over the year on price. |
| Restaurants and bars | Up 0.5% and up 5.0% over the year, matching the gain in total sales. |
| Revisions | The May to June change was unrevised at 0.2%, but nonstore retailers were revised down 1.8% in June, which matters for the comparison this report turns on. |
| Real spending | Control group down 0.7% on the month after deflating, but up 3.7% over the year and up 0.2% in July excluding nonstore. |
The Overview
July’s retail sales report will be read as evidence that the consumer is finally slowing, and it is not that. Sales fell 0.6% on the month, seven-tenths below the consensus, and the shortfall came almost entirely from two categories that had specific and identifiable reasons to fall. Nonstore retailers gave back the surge that arrived in June when Amazon moved Prime Day forward by just over two weeks, and motor vehicle dealers gave back part of a June gain that reflected model-year incentives rather than a step up in demand.
Strip those two out and the month looks entirely ordinary. Nine of the thirteen major categories were flat or higher, apparel posted its best month of the year, and restaurant sales kept climbing. The control group, which excludes vehicles, gasoline, building materials and restaurants and is the piece that feeds consumption in the national accounts, fell 0.5% on the month but rose 0.4% once nonstore retailers are set aside. Over the three months through July that measure is growing at a 5.6% annual rate, which remains consistent with solid growth in consumer spending.
The Promotional Calendar Did the Damage
Amazon held Prime Day on June 23 through 26 this year. In every year from 2015 through 2025, with the exceptions of 2020 and 2021, it fell in July. Adobe Analytics put total United States online spending across the four days at $26.4 billion, up 9.3% from the comparable 2025 event, so the promotion itself was not weak. It simply landed in a different month.
The seasonal factors Census applies to these data are estimated on a history in which July carries the promotion and June does not. When the event moves, the adjustment penalizes the month it left and flatters the month it entered. June nonstore sales rose 0.9% on a seasonally adjusted basis and July gave back 2.2%. The unadjusted data, which is where a seasonal argument has to be made, show the effect at both ends of the move. Nonstore sales rose 2.4% from May to June, against an average decline of 4.5% over the four preceding years, all of which had a July Prime Day. They then fell 2.0% from June to July, against an average gain of 4.3% across those same four years. In 2021, the one earlier year the event fell in June, the two changes were a 1.9% gain and a 5.0% decline.
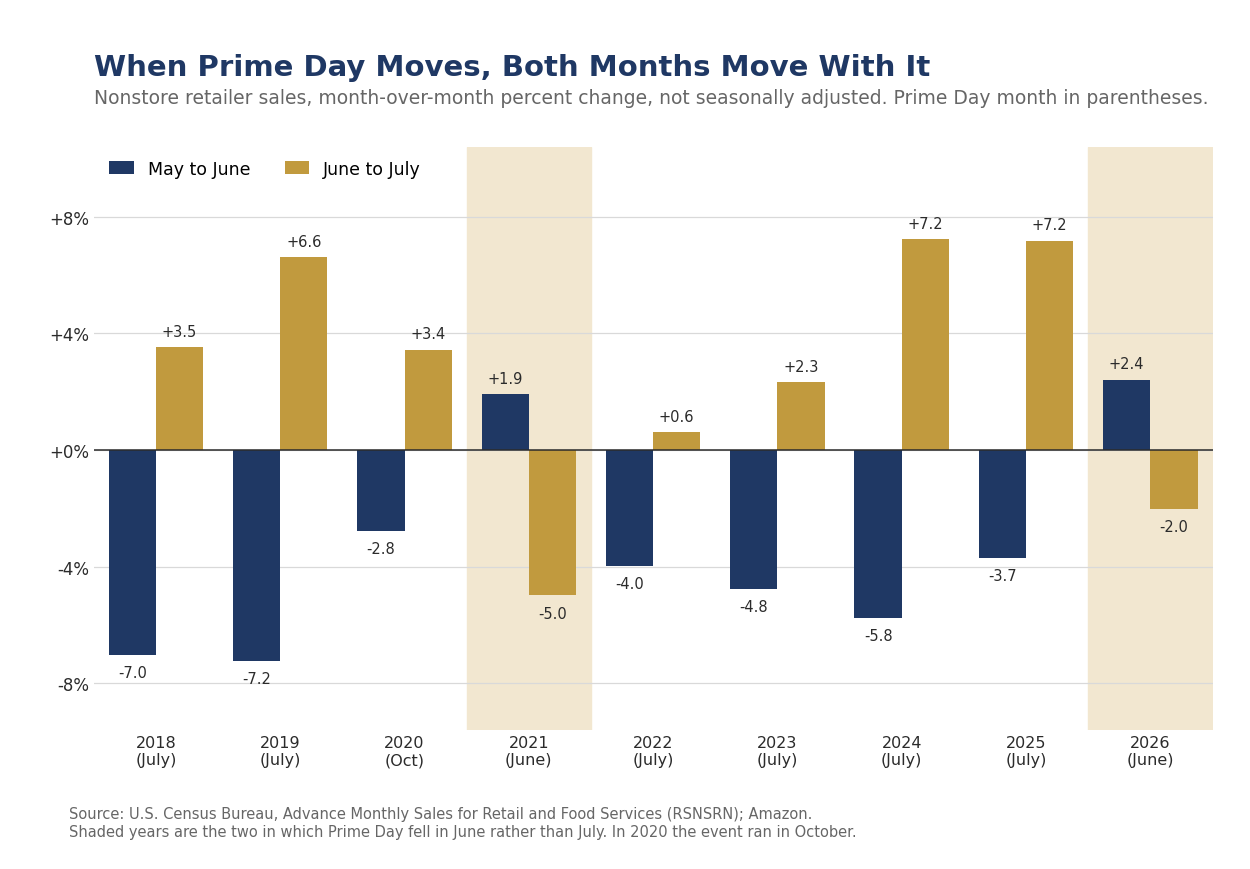
The promotion was not smaller this year. It was earlier, and the seasonal factors have not caught up with it.
The arithmetic is worth stating plainly, because it is the whole of the July surprise. Nonstore retailers are 17.9% of total retail and food services sales. A 2.2% decline in a category that size subtracts 0.41 percentage points from the headline by itself. Add the 0.33 percentage points that motor vehicles took out and the headline would have been up roughly 0.16% without them, which is about where the consensus had the month. Read that way, July landed close to expectations and the shortfall is the calendar.
Where the Rest of the Month’s Noise Came From
Motor vehicle & parts dealers fell 1.8% after a 2.4% gain in June. Light vehicle unit sales eased to a 16.3 million annual rate from 16.6 million, which is the ordinary pattern around model-year changeover, when incentives on outgoing models pull sales into one month and leave the next one thin. The twelve-month gain of 1.9% is among the weakest in the report, however, and the vehicle channel remains the clearest evidence that monetary policy remains tight for the most interest-sensitive parts of the economy.
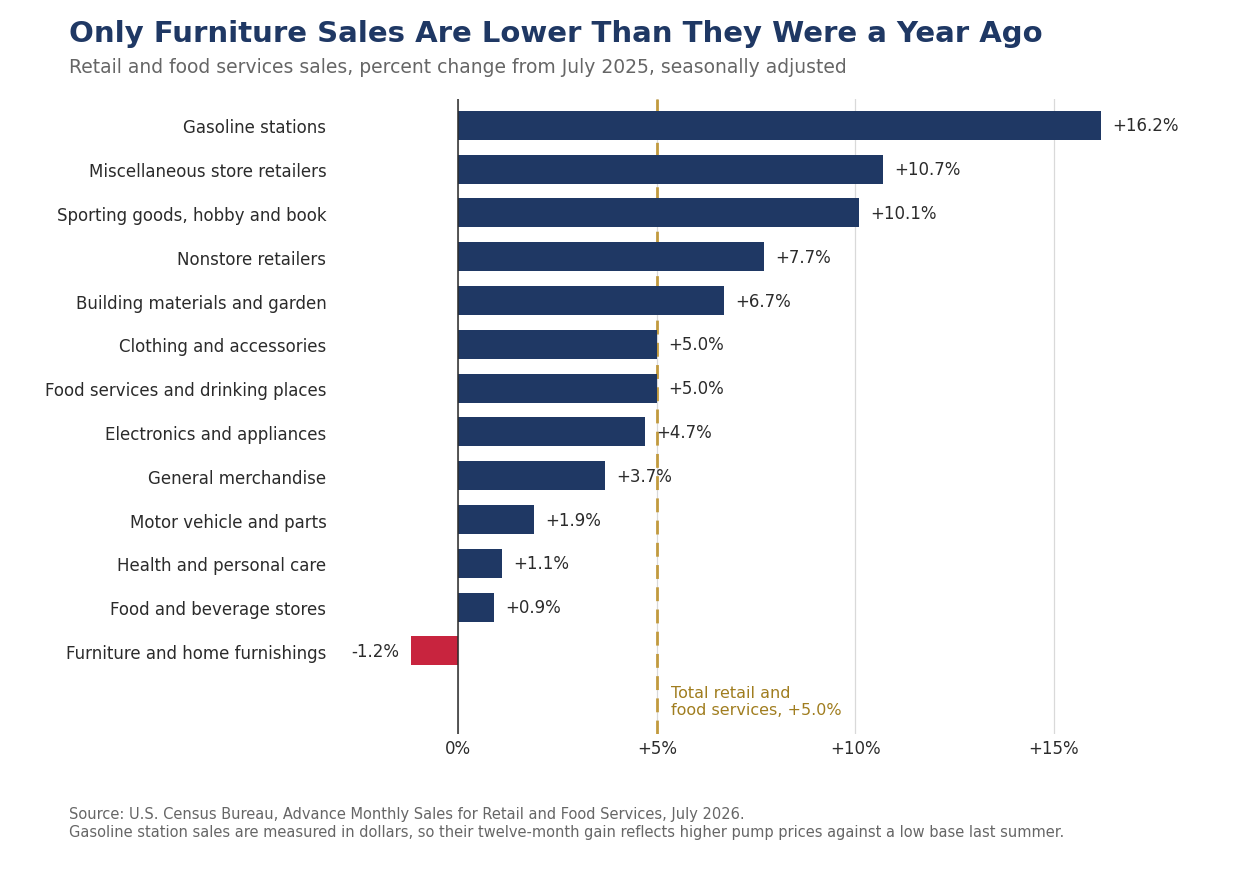
Gasoline station sales require taking price changes into account before making any judgments. Sales fell 0.9% on the month while the average retail price of regular gasoline fell to $3.93 a gallon in July from $4.05 in June, a decline of 2.9%. Station receipts falling by less than prices implies households bought more gallons, not fewer, and the two-point gap is money that moved into other categories. Gasoline sales are still up 16.2% over the year, which is almost entirely a price comparison against a much lower base last summer.
The Control Group and What It Says
The control group excludes motor vehicle and parts dealers, gasoline stations, building material and garden equipment dealers, and food services and drinking places. The Bureau of Economic Analysis uses it as the primary monthly input to goods consumption, which is why it is the number to lead on when the headline is distorted, and July is such a month. The excluded categories are not missing from GDP, they are measured better elsewhere. Motor vehicles and gasoline still belong to goods consumption, but the Bureau takes them from unit sales and from Energy Information Administration data rather than from this survey. Food services and drinking places show up in services consumption, and the improvement-related share of building materials shows up in residential investment.
Control-group sales fell 0.5% in July to $416.2 billion. Excluding nonstore retailers, which are now 32.9% of the group, they rose 0.4%. Over the three months through July the control group grew at a 5.6% annual rate, and over the past twelve months it is up 4.5%, or 3.7% after deflating by the consumer price index for commodities less food and energy. Real growth of 3.7% in core goods spending is a strong reading by the standards of the past two years, and it is the number that survives the calendar.
Real core goods spending is growing 3.7% over the past year. One distorted month does not overturn that.
Goods, Services and the Restaurant Line
Food services & drinking places rose 0.5% in July and are up 5.0% over the past twelve months, matching the gain in total sales. Restaurants are the only services line in this report and they are the first thing households cut when they turn cautious, which makes the category a useful monthly read on discretionary appetite. Nothing in it suggests caution.
Clothing & accessories stores rose 1.9%, the strongest gain of any category in July, and sporting goods, hobby, musical instrument & book stores were unchanged after a run of gains that leaves them up 10.1% over the year. Miscellaneous store retailers rose 0.5% and are up 10.7%. These are the discretionary categories, and they are not behaving like categories under pressure. Health & personal care stores rose 0.7%, and food & beverage stores were flat.
July Is a Transitional Month
It is worth saying every year that July carries less information about the consumer than the months on either side of it. The summer selling season is over by the Fourth, the back-to-school season has barely begun, and most of the back-to-school dollars land in August, concentrated in the weeks that carry state sales tax holidays. Apparel and general merchandise spend much of the month clearing spring and summer inventory at markdown, which lowers the dollar value of a given unit volume, so a soft July in those categories can be a margin story rather than a demand story. That apparel rose 1.9% in spite of that pattern is the more interesting fact in this report.
From this year, July has also lost the promotional anchor it carried for a decade. That is a permanent change to the shape of the month if Amazon keeps the June date, and the seasonal factors will take two or three years to absorb it. Until they do, the adjusted July and June figures should be read as a pair rather than separately.
What This Means for Third Quarter Consumer Spending
July is the first month of the quarter, so it sets the base and does little else. The control group in July sits a shade below the second quarter average, which on a mechanical carryover basis would put third quarter nominal core spending fractionally lower than the second quarter if August and September were both flat.
That carryover understates the quarter, however, and for a reason specific to this year. June sits inside the second quarter base and was inflated by the promotion, while July is the starting point for the third quarter and was deflated by its absence. The comparison is penalized at both ends. Reading the two months as a pair rather than separately is the better description of the underlying pace, and it is what we would do with any month whose seasonal factors are known to be misaligned.
We should be careful not to claim more than the calendar can carry, however. Taken together, June and July online sales came in about 2% below the trend that ran from January through May, so the promotional shift explains the shape of the two months but not the whole of the deceleration. Part of the remainder is a base effect rather than a change in behavior. The twelve-month gain in nonstore sales slowed to 7.7% in July from 12.4% in June, but July 2025 was itself a Prime Day month, and a four-day one, so this year’s comparison runs against an inflated base. We would put the underlying pace of online spending in the high single digits and would want the August figure before making any changes to our outlook, which calls for real consumer spending to rise at a 2.1% pace. Our forecasts tend to be conservative.
Our working assumption is that nonstore sales return to trend in August and that back-to-school spending lands where it usually does. Control-group growth of 0.5% to 0.6% in each of August and September would put third quarter core spending up between 1.75% and 2.2% at an annual rate over the second quarter in nominal terms, or roughly 1% to 1.5% in real terms. We are comfortable with real personal consumption growth in the low 2s for the quarter once services are added, and services have been the steadier half of consumption all year.
Our Call · A Calendar Artifact, Not a Turn
July’s decline belongs to the calendar rather than to the consumer. Online retail and auto dealers, each with an identifiable reason to fall, more than account for the drop, and nine of the eleven remaining categories were flat or higher. The measure that matters for the national accounts is growing at a 5.6% annual rate over three months and 3.7% in real terms over the past year. We would not extrapolate this month.
The consumer keeps spending because incomes keep growing and the balance sheet is in reasonable shape. Payroll growth has been modest, but the constraint there is the supply of workers rather than the demand for them, and aggregate wage income is still rising faster than prices. Goods prices are up less than 1% over the past year, which means nominal spending gains are translating into real volume in a way they did not in 2022 or 2023. Restaurant and apparel spending, the two lines households cut first, are among the strongest in this report.
We expect the August advance report, which lands in mid-September, to show nonstore retailers up 1.5% or more and the control group up at least 0.4%. That is the falsifiable form of this call. A softer August in both would mean the July weakness was real and we were wrong about the calendar. We also expect this report to be used as an argument for a September rate cut, and we do not think it supports one. Our view is unchanged: no cut in 2026, and the next move is more likely a hike in the first half of 2027.
Bottom Line
Retail sales fell in July because Amazon moved Prime Day into June and auto dealers gave back a model-year gain, not because households stopped spending. Core goods spending excluding online sales rose 0.4%, restaurants and apparel advanced, and the three-month pace of the control group is running at 5.6% annualized. The consumer entered the third quarter in the same shape in which the second quarter ended.
What We Are Watching
- Nonstore retailers in the August report. A gain of 1.5% or better confirms that July was a give-back. Anything under 0.5% and we would revisit this call. The report lands in mid-September.
- Back-to-school spending in August apparel and general merchandise. With the promotional calendar shifted, the back-to-school signal now sits almost entirely in August. A weak apparel print there would carry more information than a weak one in July.
- The preliminary revision to July. The full Monthly Retail Trade Survey replaces the advance subsample on September 16, alongside the August advance report. Census puts the average absolute revision at two-tenths of a percentage point.
Appendix: Retail Sales Detail
| Category | Jul m/m | 12-mo |
|---|---|---|
| Retail and food services, total | −0.6% | +5.0% |
| Retail trade | −0.8% | +5.0% |
| Total excluding motor vehicle & parts | −0.3% | +5.8% |
| Total excluding gasoline stations | −0.6% | +4.2% |
| Total excluding motor vehicle & parts and gasoline | −0.2% | +4.8% |
| Control group (PCC calculation) | −0.5% | +4.5% |
| Motor vehicle and parts dealers | −1.8% | +1.9% |
| Furniture and home furnishings stores | +0.3% | −1.2% |
| Electronics and appliance stores | −0.5% | +4.7% |
| Building material and garden equipment dealers | +0.3% | +6.7% |
| Food and beverage stores | 0.0% | +0.9% |
| Health and personal care stores | +0.7% | +1.1% |
| Gasoline stations | −0.9% | +16.2% |
| Clothing and accessories stores | +1.9% | +5.0% |
| Sporting goods, hobby, musical instrument and book stores | 0.0% | +10.1% |
| General merchandise stores | +0.3% | +3.7% |
| Miscellaneous store retailers | +0.5% | +10.7% |
| Nonstore retailers | −2.2% | +7.7% |
| Food services and drinking places | +0.5% | +5.0% |
Computation notes. The control group excludes motor vehicle and parts dealers, gasoline stations, building material and garden equipment and supplies dealers, and food services and drinking places, and is calculated by Piedmont Crescent Capital from the published category levels. Three-month annualized rates are the compound annual rate of change of the latest three-month average over the prior three-month average on seasonally adjusted levels. Real figures deflate by the consumer price index for commodities less food and energy commodities. Gasoline prices are the weekly average retail price of all grades of regular gasoline, averaged over the weeks in each month. The advance report is drawn from a subsample of about 4,800 firms and is replaced by the full Monthly Retail Trade Survey about a month later. Census puts the average absolute revision to the advance estimate at two-tenths of a percentage point, which is a meaningful share of a typical monthly change.
Mark P. Vitner – Chief Economist, Piedmont Crescent Capital
mark.vitner@piedmontcrescentcapital.com · (704) 458-4000
Sources: U.S. Census Bureau, Advance Monthly Sales for Retail and Food Services, July 2026; U.S. Bureau of Labor Statistics, Consumer Price Index, July 2026; U.S. Energy Information Administration, Weekly Retail Gasoline Prices; Adobe Analytics, 2026 Prime Day insights; Bureau of Economic Analysis; Federal Reserve Bank of St. Louis (FRED). Control-group and contribution calculations by Piedmont Crescent Capital.
Disclaimer: This report is provided for informational purposes only and does not constitute investment, legal, tax, or accounting advice, nor an offer or solicitation to buy or sell any security. Information is drawn from sources believed to be reliable, but its accuracy and completeness are not guaranteed. Views expressed are those of the author as of the date of publication and are subject to change without notice. Past performance is not indicative of future results.